Zip Codes with the Highest Percentage of Families with Income Above $200,000 in Fort Worth, TX

RELATED REPORTS & OPTIONS

Family Income | $200k+
Population
Families and Households
Female Fertility
Female Fertility (Unmarried)
Race (Community Size)
Race (Percentage)
Ancestry (Community Size)
AfghanAfricanAlbanianAlsatianAmericanApacheArabArgentineanArmenianAustralianAustrianBahamianBangladeshiBarbadianBasqueBelgianBhutaneseBlackfeetBolivianBrazilianBritishBritish West IndianBulgarianBurmeseCajunCambodianCanadianCelticCentral AmericanCentral American IndianCherokeeCheyenneChickasawChileanChippewaChoctawColombianComancheCosta RicanCreekCroatianCrowCubanCzechCzechoslovakianDanishDelawareDominicanDutchDutch West IndianEastern EuropeanEcuadorianEgyptianEnglishEstonianEthiopianEuropeanFilipinoFinnishFrenchFrench American IndianFrench CanadianGermanGerman RussianGhanaianGreekGuamanian / ChamorroGuatemalanGuyaneseHaitianHonduranHopiHungarianIcelanderIndian (Asian)IndonesianInupiatIranianIraqiIrishIroquoisIsraeliItalianJamaicanJapaneseJordanianKenyanKiowaKoreanLaotianLatvianLebaneseLiberianLithuanianLuxembourgerMalaysianMalteseMexicanMexican American IndianMongolianMoroccanNative HawaiianNavajoNicaraguanNigerianNorthern EuropeanNorwegianOsageOttawaPakistaniPalestinianPanamanianPennsylvania GermanPeruvianPolishPortuguesePotawatomiPuebloPuerto RicanRomanianRussianSalvadoranSamoanScandinavianScotch-IrishScottishSerbianSiouxSlavicSlovakSloveneSomaliSouth AfricanSouth AmericanSouth American IndianSpaniardSpanishSpanish AmericanSpanish American IndianSri LankanSubsaharan AfricanSudaneseSwedishSwissSyrianThaiTonganTrinidadian and TobagonianTurkishUgandanUkrainianVenezuelanVietnameseWelshWest IndianYaquiYugoslavianZimbabwean
Ancestry (Percentage)
AfghanAfricanAlbanianAlsatianAmericanApacheArabArgentineanArmenianAustralianAustrianBahamianBangladeshiBarbadianBasqueBelgianBhutaneseBlackfeetBolivianBrazilianBritishBritish West IndianBulgarianBurmeseCajunCambodianCanadianCelticCentral AmericanCentral American IndianCherokeeCheyenneChickasawChileanChippewaChoctawColombianComancheCosta RicanCreekCroatianCrowCubanCzechCzechoslovakianDanishDelawareDominicanDutchDutch West IndianEastern EuropeanEcuadorianEgyptianEnglishEstonianEthiopianEuropeanFilipinoFinnishFrenchFrench American IndianFrench CanadianGermanGerman RussianGhanaianGreekGuamanian / ChamorroGuatemalanGuyaneseHaitianHonduranHopiHungarianIcelanderIndian (Asian)IndonesianInupiatIranianIraqiIrishIroquoisIsraeliItalianJamaicanJapaneseJordanianKenyanKiowaKoreanLaotianLatvianLebaneseLiberianLithuanianLuxembourgerMalaysianMalteseMexicanMexican American IndianMongolianMoroccanNative HawaiianNavajoNicaraguanNigerianNorthern EuropeanNorwegianOsageOttawaPakistaniPalestinianPanamanianPennsylvania GermanPeruvianPolishPortuguesePotawatomiPuebloPuerto RicanRomanianRussianSalvadoranSamoanScandinavianScotch-IrishScottishSerbianSiouxSlavicSlovakSloveneSomaliSouth AfricanSouth AmericanSouth American IndianSpaniardSpanishSpanish AmericanSpanish American IndianSri LankanSubsaharan AfricanSudaneseSwedishSwissSyrianThaiTonganTrinidadian and TobagonianTurkishUgandanUkrainianVenezuelanVietnameseWelshWest IndianYaquiYugoslavianZimbabwean
Immigrant Origin (Total)
AfghanistanAfricaAlbaniaArgentinaAsiaAustraliaBahamasBangladeshBarbadosBelarusBelizeBoliviaBosnia and HerzegovinaBrazilBulgariaBurma / MyanmarCambodiaCameroonCanadaCaribbeanCentral AmericaChileChinaColombiaCongoCosta RicaCroatiaCubaCzechoslovakiaDominican RepublicEastern AfricaEastern AsiaEastern EuropeEcuadorEgyptEl SalvadorEnglandEritreaEthiopiaEuropeFranceGermanyGhanaGreeceGuatemalaHaitiHondurasHong KongHungaryIndiaIndonesiaIranIraqIrelandIsraelItalyJamaicaJapanJordanKenyaKoreaLaosLatin AmericaLebanonLiberiaMalaysiaMexicoMicronesiaMiddle AfricaMoroccoNepalNetherlandsNicaraguaNigeriaNorthern AfricaNorthern EuropeOceaniaPakistanPanamaPeruPhilippinesPolandPortugalRomaniaRussiaScotlandSenegalSerbiaSomaliaSouth AfricaSouth AmericaSouth Central AsiaSouth Eastern AsiaSouthern EuropeSpainSri LankaSudanSwedenSwitzerlandSyriaTaiwanThailandTrinidad and TobagoTurkeyUgandaUkraineVenezuelaVietnamWestern AfricaWestern AsiaWestern EuropeZaireZimbabwe
Immigrant Origin (Percentage)
AfghanistanAfricaAlbaniaArgentinaAsiaAustraliaBahamasBangladeshBarbadosBelarusBelizeBoliviaBosnia and HerzegovinaBrazilBulgariaBurma / MyanmarCambodiaCameroonCanadaCaribbeanCentral AmericaChileChinaColombiaCongoCosta RicaCroatiaCubaCzechoslovakiaDominican RepublicEastern AfricaEastern AsiaEastern EuropeEcuadorEgyptEl SalvadorEnglandEritreaEthiopiaEuropeFranceGermanyGhanaGreeceGuatemalaHaitiHondurasHong KongHungaryIndiaIndonesiaIranIraqIrelandIsraelItalyJamaicaJapanJordanKenyaKoreaLaosLatin AmericaLebanonLiberiaMalaysiaMexicoMicronesiaMiddle AfricaMoroccoNepalNetherlandsNicaraguaNigeriaNorthern AfricaNorthern EuropeOceaniaPakistanPanamaPeruPhilippinesPolandPortugalRomaniaRussiaScotlandSenegalSerbiaSomaliaSouth AfricaSouth AmericaSouth Central AsiaSouth Eastern AsiaSouthern EuropeSpainSri LankaSudanSwedenSwitzerlandSyriaTaiwanThailandTrinidad and TobagoTurkeyUgandaUkraineVenezuelaVietnamWestern AfricaWestern AsiaWestern EuropeZaireZimbabwe
Income
Income (Families)
Income (Households)
Poverty
Poverty (Families)
Unemployment
Employment Occupations
Employment Industries
Employer Class
Commute Time
Commute Means
School Enrollment
Education by Degree Field
Occupancy
Finances
Physical Characteristics
Fort Worth
Compare Zip Codes
Comparison Subject

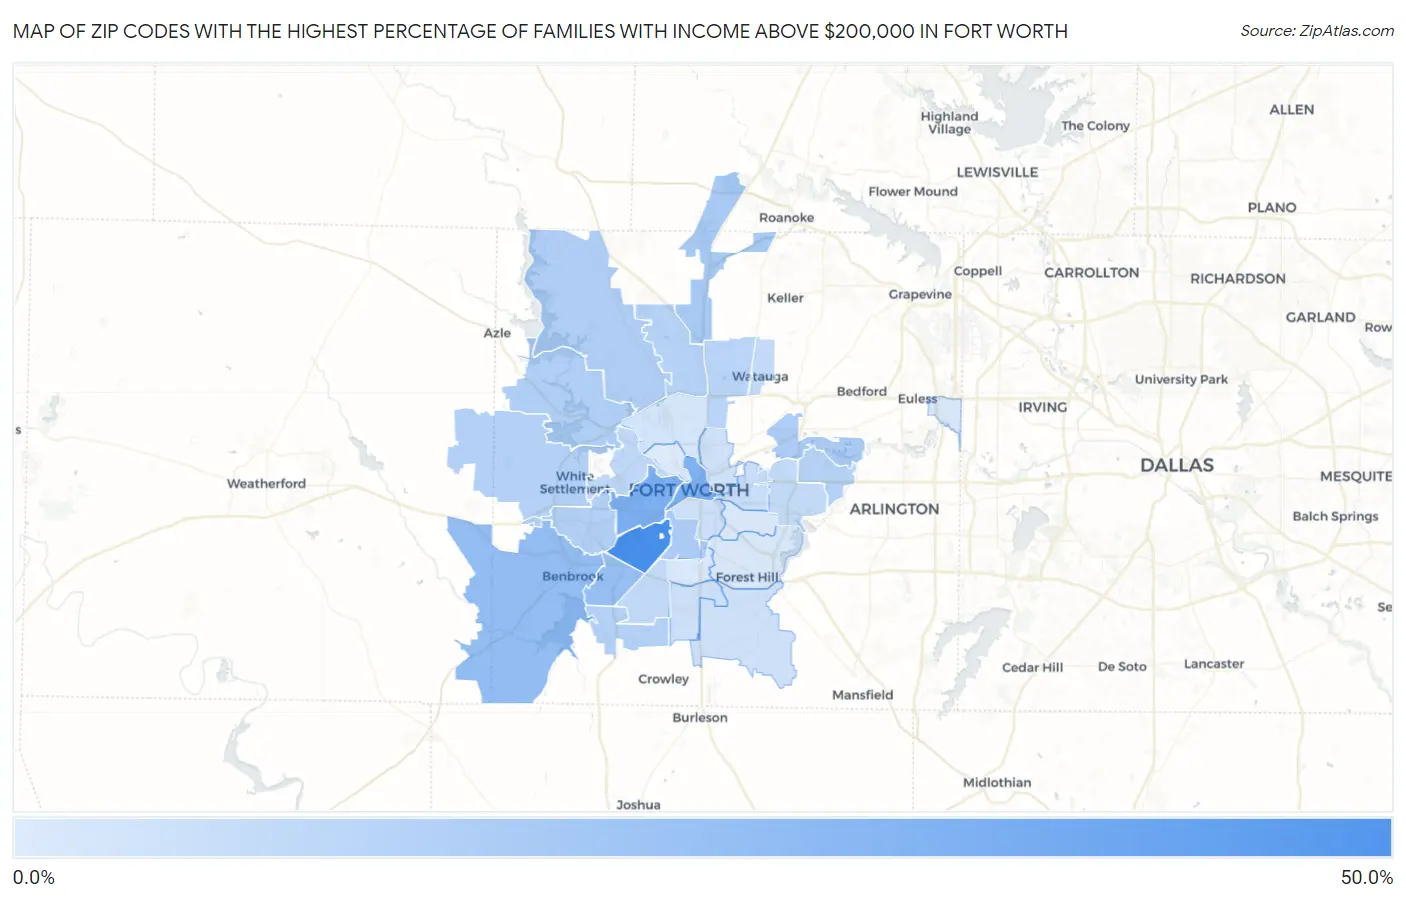
Map of Zip Codes with the Highest Percentage of Families with Income Above $200,000 in Fort Worth

0.0%
50.0%
Zip Codes with the Highest Percentage of Families with Income Above $200,000 in Fort Worth Map

Zip Codes with the Highest Percentage of Families with Income Above $200,000 in Fort Worth, TX

Zip Code Families with Income > $200k vs State vs National
1.7610945.6%13.5%(+32.1)#3614.8%(+30.8)#896
2.7610727.3%13.5%(+13.8)#15014.8%(+12.5)#2,995
3.7610226.7%13.5%(+13.2)#15414.8%(+11.9)#3,107
4.7612620.7%13.5%(+7.20)#23714.8%(+5.90)#4,603
5.7613218.8%13.5%(+5.30)#26714.8%(+4.00)#5,234
6.7617714.2%13.5%(+0.700)#39114.8%(-0.600)#7,431
7.7611014.0%13.5%(+0.500)#40014.8%(-0.800)#7,533
8.7611813.4%13.5%(-0.100)#42714.8%(-1.40)#7,929
9.7617912.6%13.5%(-0.900)#46214.8%(-2.20)#8,476
10.7613512.0%13.5%(-1.50)#49214.8%(-2.80)#8,979
11.7610811.2%13.5%(-2.30)#53614.8%(-3.60)#9,612
12.7611610.9%13.5%(-2.60)#55814.8%(-3.90)#9,886
13.7612310.9%13.5%(-2.60)#55914.8%(-3.90)#9,894
14.7613110.8%13.5%(-2.70)#57114.8%(-4.00)#9,990
15.7612010.7%13.5%(-2.80)#58514.8%(-4.10)#10,107
16.761379.0%13.5%(-4.50)#71214.8%(-5.80)#11,883
17.761148.0%13.5%(-5.50)#78514.8%(-6.80)#13,180
18.761337.7%13.5%(-5.80)#80914.8%(-7.10)#13,575
19.761487.1%13.5%(-6.40)#87614.8%(-7.70)#14,484
20.761126.7%13.5%(-6.80)#90914.8%(-8.10)#15,175
21.761035.6%13.5%(-7.90)#1,01614.8%(-9.20)#17,187
22.761044.6%13.5%(-8.90)#1,13014.8%(-10.2)#19,200
23.761344.5%13.5%(-9.00)#1,14214.8%(-10.3)#19,383
24.761114.1%13.5%(-9.40)#1,20414.8%(-10.7)#20,198
25.761403.6%13.5%(-9.90)#1,25814.8%(-11.2)#21,240
26.761062.7%13.5%(-10.8)#1,37514.8%(-12.1)#23,081
27.761051.5%13.5%(-12.0)#1,50714.8%(-13.3)#25,312
28.761191.3%13.5%(-12.2)#1,52014.8%(-13.5)#25,610
29.761551.0%13.5%(-12.5)#1,55414.8%(-13.8)#26,106
30.761150.70%13.5%(-12.8)#1,58014.8%(-14.1)#26,465
31.761640.30%13.5%(-13.2)#1,60414.8%(-14.5)#26,893

Common Questions

What are the Top 10 Zip Codes with the Highest Percentage of Families with Income Above $200,000 in Fort Worth, TX?
Top 10 Zip Codes with the Highest Percentage of Families with Income Above $200,000 in Fort Worth, TX are:
#1
45.6%
#2
27.3%
#3
26.7%
#4
20.7%
#5
18.8%
#6
14.2%
#7
14.0%
#8
13.4%
#9
12.6%
#10
12.0%
What zip code has the Highest Percentage of Families with Income Above $200,000 in Fort Worth, TX?
76109 has the Highest Percentage of Families with Income Above $200,000 in Fort Worth, TX with 45.6%.
What is the Percentage of Families with Income Above $200,000 in Fort Worth, TX?
Percentage of Families with Income Above $200,000 in Fort Worth is 11.9%.
What is the Percentage of Families with Income Above $200,000 in Texas?
Percentage of Families with Income Above $200,000 in Texas is 13.5%.
What is the Percentage of Families with Income Above $200,000 in the United States?
Percentage of Families with Income Above $200,000 in the United States is 14.8%.