Zip Codes with the Highest Percentage of Population Employed in Accommodation & Food Services in Fort Worth, TX
RELATED REPORTS & OPTIONS
Accommodation & Food Services
Fort Worth
Compare Zip Codes
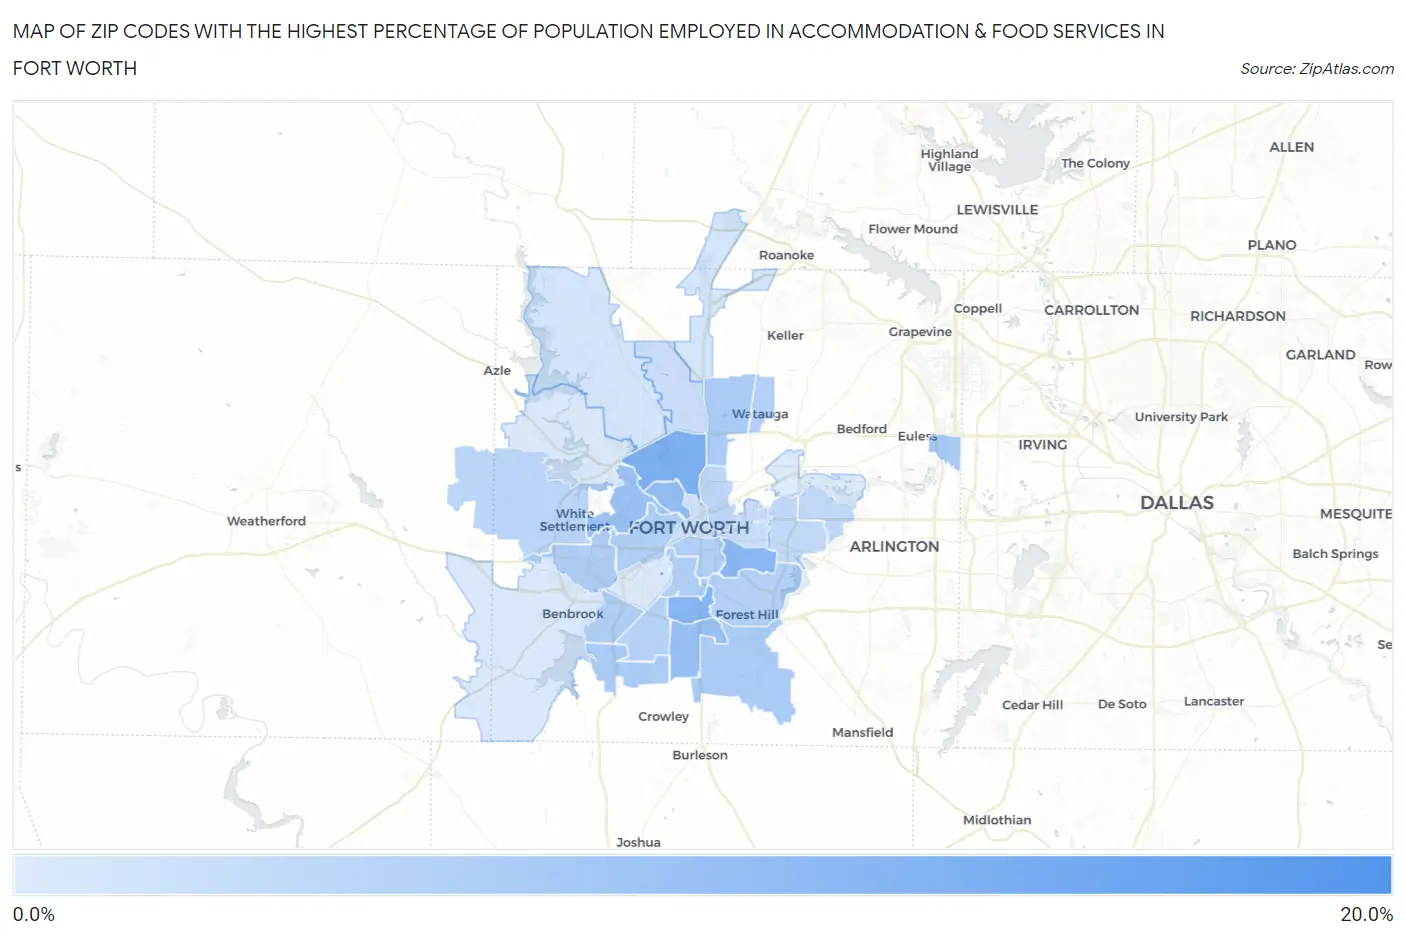
Map of Zip Codes with the Highest Percentage of Population Employed in Accommodation & Food Services in Fort Worth
4.1%
17.1%
Zip Codes with the Highest Percentage of Population Employed in Accommodation & Food Services in Fort Worth, TX
| Zip Code | % Employed | vs State | vs National | |
| 1. | 76129 | 17.1% | 7.2%(+9.86)#66 | 6.9%(+10.2)#1,252 |
| 2. | 76106 | 12.2% | 7.2%(+4.99)#154 | 6.9%(+5.32)#2,713 |
| 3. | 76115 | 11.4% | 7.2%(+4.23)#193 | 6.9%(+4.55)#3,204 |
| 4. | 76105 | 11.0% | 7.2%(+3.80)#216 | 6.9%(+4.12)#3,550 |
| 5. | 76164 | 10.3% | 7.2%(+3.07)#261 | 6.9%(+3.39)#4,223 |
| 6. | 76134 | 10.0% | 7.2%(+2.76)#292 | 6.9%(+3.08)#4,588 |
| 7. | 76114 | 9.6% | 7.2%(+2.43)#321 | 6.9%(+2.75)#5,012 |
| 8. | 76155 | 8.4% | 7.2%(+1.20)#486 | 6.9%(+1.53)#6,977 |
| 9. | 76140 | 8.3% | 7.2%(+1.12)#501 | 6.9%(+1.44)#7,163 |
| 10. | 76123 | 8.3% | 7.2%(+1.07)#510 | 6.9%(+1.39)#7,273 |
| 11. | 76137 | 8.2% | 7.2%(+1.01)#515 | 6.9%(+1.33)#7,391 |
| 12. | 76116 | 8.0% | 7.2%(+0.776)#559 | 6.9%(+1.10)#7,855 |
| 13. | 76132 | 7.7% | 7.2%(+0.537)#592 | 6.9%(+0.862)#8,390 |
| 14. | 76104 | 7.7% | 7.2%(+0.493)#600 | 6.9%(+0.817)#8,499 |
| 15. | 76107 | 7.7% | 7.2%(+0.472)#602 | 6.9%(+0.796)#8,558 |
| 16. | 76110 | 7.6% | 7.2%(+0.430)#612 | 6.9%(+0.755)#8,664 |
| 17. | 76148 | 7.6% | 7.2%(+0.393)#621 | 6.9%(+0.717)#8,753 |
| 18. | 76119 | 7.4% | 7.2%(+0.227)#640 | 6.9%(+0.552)#9,159 |
| 19. | 76133 | 7.3% | 7.2%(+0.066)#679 | 6.9%(+0.391)#9,614 |
| 20. | 76108 | 6.9% | 7.2%(-0.269)#730 | 6.9%(+0.056)#10,507 |
| 21. | 76111 | 6.8% | 7.2%(-0.373)#753 | 6.9%(-0.048)#10,781 |
| 22. | 76120 | 6.4% | 7.2%(-0.814)#846 | 6.9%(-0.490)#12,189 |
| 23. | 76112 | 6.3% | 7.2%(-0.919)#866 | 6.9%(-0.594)#12,527 |
| 24. | 76103 | 5.9% | 7.2%(-1.32)#934 | 6.9%(-1.00)#13,848 |
| 25. | 76131 | 5.6% | 7.2%(-1.65)#998 | 6.9%(-1.33)#14,884 |
| 26. | 76102 | 5.4% | 7.2%(-1.82)#1,020 | 6.9%(-1.49)#15,446 |
| 27. | 76177 | 4.8% | 7.2%(-2.42)#1,135 | 6.9%(-2.10)#17,545 |
| 28. | 76179 | 4.8% | 7.2%(-2.44)#1,140 | 6.9%(-2.12)#17,618 |
| 29. | 76135 | 4.4% | 7.2%(-2.79)#1,208 | 6.9%(-2.47)#18,776 |
| 30. | 76126 | 4.2% | 7.2%(-2.97)#1,236 | 6.9%(-2.64)#19,392 |
| 31. | 76118 | 4.1% | 7.2%(-3.08)#1,246 | 6.9%(-2.75)#19,718 |
| 32. | 76109 | 4.1% | 7.2%(-3.12)#1,252 | 6.9%(-2.80)#19,861 |
1
Common Questions
What are the Top 10 Zip Codes with the Highest Percentage of Population Employed in Accommodation & Food Services in Fort Worth, TX?
Top 10 Zip Codes with the Highest Percentage of Population Employed in Accommodation & Food Services in Fort Worth, TX are:
What zip code has the Highest Percentage of Population Employed in Accommodation & Food Services in Fort Worth, TX?
76129 has the Highest Percentage of Population Employed in Accommodation & Food Services in Fort Worth, TX with 17.1%.
What is the Percentage of Population Employed in Accommodation & Food Services in Fort Worth, TX?
Percentage of Population Employed in Accommodation & Food Services in Fort Worth is 7.3%.
What is the Percentage of Population Employed in Accommodation & Food Services in Texas?
Percentage of Population Employed in Accommodation & Food Services in Texas is 7.2%.
What is the Percentage of Population Employed in Accommodation & Food Services in the United States?
Percentage of Population Employed in Accommodation & Food Services in the United States is 6.9%.