Zip Codes with the Highest Percentage of Population Employed in Installation, Maintenance & Repair in Fort Worth, TX
RELATED REPORTS & OPTIONS
Installation, Maintenance & Repair
Fort Worth
Compare Zip Codes
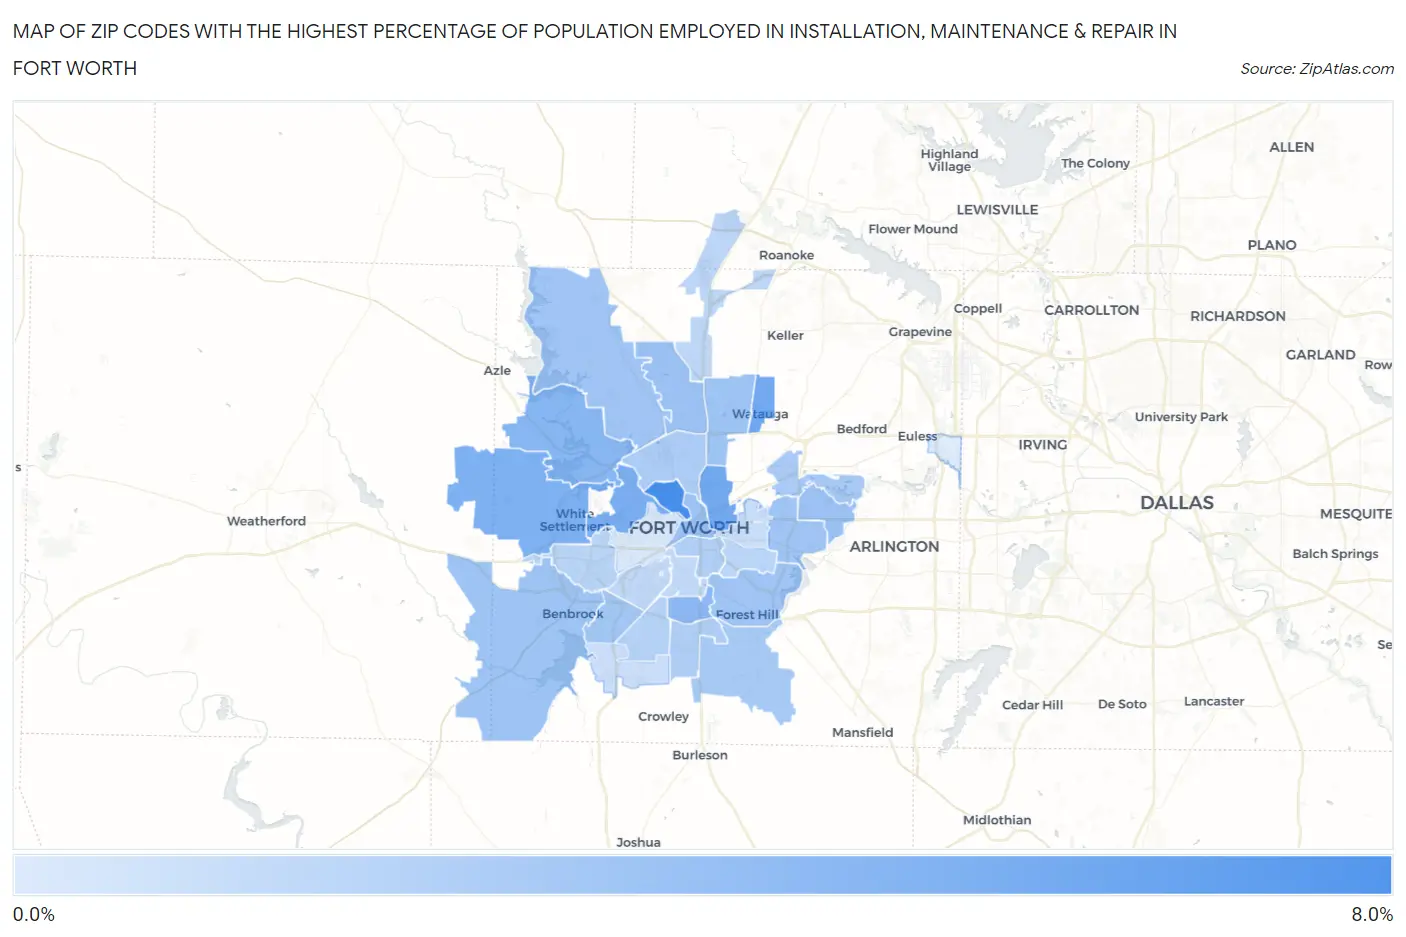
Map of Zip Codes with the Highest Percentage of Population Employed in Installation, Maintenance & Repair in Fort Worth
0.0%
8.0%
Zip Codes with the Highest Percentage of Population Employed in Installation, Maintenance & Repair in Fort Worth, TX
| Zip Code | % Employed | vs State | vs National | |
| 1. | 76164 | 7.6% | 3.4%(+4.22)#218 | 3.1%(+4.56)#3,703 |
| 2. | 76148 | 5.7% | 3.4%(+2.32)#392 | 3.1%(+2.65)#6,737 |
| 3. | 76111 | 5.5% | 3.4%(+2.13)#425 | 3.1%(+2.47)#7,177 |
| 4. | 76114 | 5.2% | 3.4%(+1.83)#474 | 3.1%(+2.17)#7,987 |
| 5. | 76108 | 5.1% | 3.4%(+1.67)#512 | 3.1%(+2.00)#8,491 |
| 6. | 76135 | 4.6% | 3.4%(+1.21)#621 | 3.1%(+1.55)#9,989 |
| 7. | 76115 | 4.4% | 3.4%(+1.00)#658 | 3.1%(+1.34)#10,741 |
| 8. | 76102 | 3.7% | 3.4%(+0.335)#835 | 3.1%(+0.671)#13,513 |
| 9. | 76120 | 3.7% | 3.4%(+0.302)#841 | 3.1%(+0.638)#13,638 |
| 10. | 76131 | 3.6% | 3.4%(+0.240)#866 | 3.1%(+0.576)#13,957 |
| 11. | 76126 | 3.6% | 3.4%(+0.184)#880 | 3.1%(+0.520)#14,207 |
| 12. | 76137 | 3.6% | 3.4%(+0.154)#884 | 3.1%(+0.490)#14,344 |
| 13. | 76119 | 3.5% | 3.4%(+0.112)#894 | 3.1%(+0.447)#14,560 |
| 14. | 76179 | 3.5% | 3.4%(+0.108)#895 | 3.1%(+0.443)#14,572 |
| 15. | 76112 | 3.4% | 3.4%(+0.045)#917 | 3.1%(+0.380)#14,876 |
| 16. | 76132 | 3.3% | 3.4%(-0.094)#967 | 3.1%(+0.242)#15,512 |
| 17. | 76140 | 3.2% | 3.4%(-0.229)#1,007 | 3.1%(+0.106)#16,158 |
| 18. | 76118 | 3.1% | 3.4%(-0.332)#1,033 | 3.1%(+0.003)#16,661 |
| 19. | 76106 | 2.9% | 3.4%(-0.468)#1,080 | 3.1%(-0.132)#17,321 |
| 20. | 76134 | 2.9% | 3.4%(-0.543)#1,097 | 3.1%(-0.208)#17,710 |
| 21. | 76104 | 2.8% | 3.4%(-0.647)#1,129 | 3.1%(-0.312)#18,234 |
| 22. | 76133 | 2.5% | 3.4%(-0.860)#1,183 | 3.1%(-0.525)#19,340 |
| 23. | 76105 | 2.3% | 3.4%(-1.11)#1,258 | 3.1%(-0.779)#20,628 |
| 24. | 76116 | 2.3% | 3.4%(-1.12)#1,260 | 3.1%(-0.783)#20,647 |
| 25. | 76177 | 2.2% | 3.4%(-1.21)#1,291 | 3.1%(-0.870)#21,095 |
| 26. | 76109 | 2.1% | 3.4%(-1.35)#1,332 | 3.1%(-1.01)#21,765 |
| 27. | 76110 | 2.0% | 3.4%(-1.40)#1,347 | 3.1%(-1.06)#21,981 |
| 28. | 76103 | 1.7% | 3.4%(-1.70)#1,410 | 3.1%(-1.37)#23,344 |
| 29. | 76123 | 1.6% | 3.4%(-1.77)#1,427 | 3.1%(-1.44)#23,637 |
| 30. | 76107 | 0.97% | 3.4%(-2.44)#1,539 | 3.1%(-2.10)#26,013 |
| 31. | 76155 | 0.78% | 3.4%(-2.62)#1,564 | 3.1%(-2.29)#26,570 |
1
Common Questions
What are the Top 10 Zip Codes with the Highest Percentage of Population Employed in Installation, Maintenance & Repair in Fort Worth, TX?
Top 10 Zip Codes with the Highest Percentage of Population Employed in Installation, Maintenance & Repair in Fort Worth, TX are:
What zip code has the Highest Percentage of Population Employed in Installation, Maintenance & Repair in Fort Worth, TX?
76164 has the Highest Percentage of Population Employed in Installation, Maintenance & Repair in Fort Worth, TX with 7.6%.
What is the Percentage of Population Employed in Installation, Maintenance & Repair in Fort Worth, TX?
Percentage of Population Employed in Installation, Maintenance & Repair in Fort Worth is 3.0%.
What is the Percentage of Population Employed in Installation, Maintenance & Repair in Texas?
Percentage of Population Employed in Installation, Maintenance & Repair in Texas is 3.4%.
What is the Percentage of Population Employed in Installation, Maintenance & Repair in the United States?
Percentage of Population Employed in Installation, Maintenance & Repair in the United States is 3.1%.