Zip Codes with the Highest Percentage of Population Employed in Security & Protection in Fort Worth, TX
RELATED REPORTS & OPTIONS
Security & Protection
Fort Worth
Compare Zip Codes
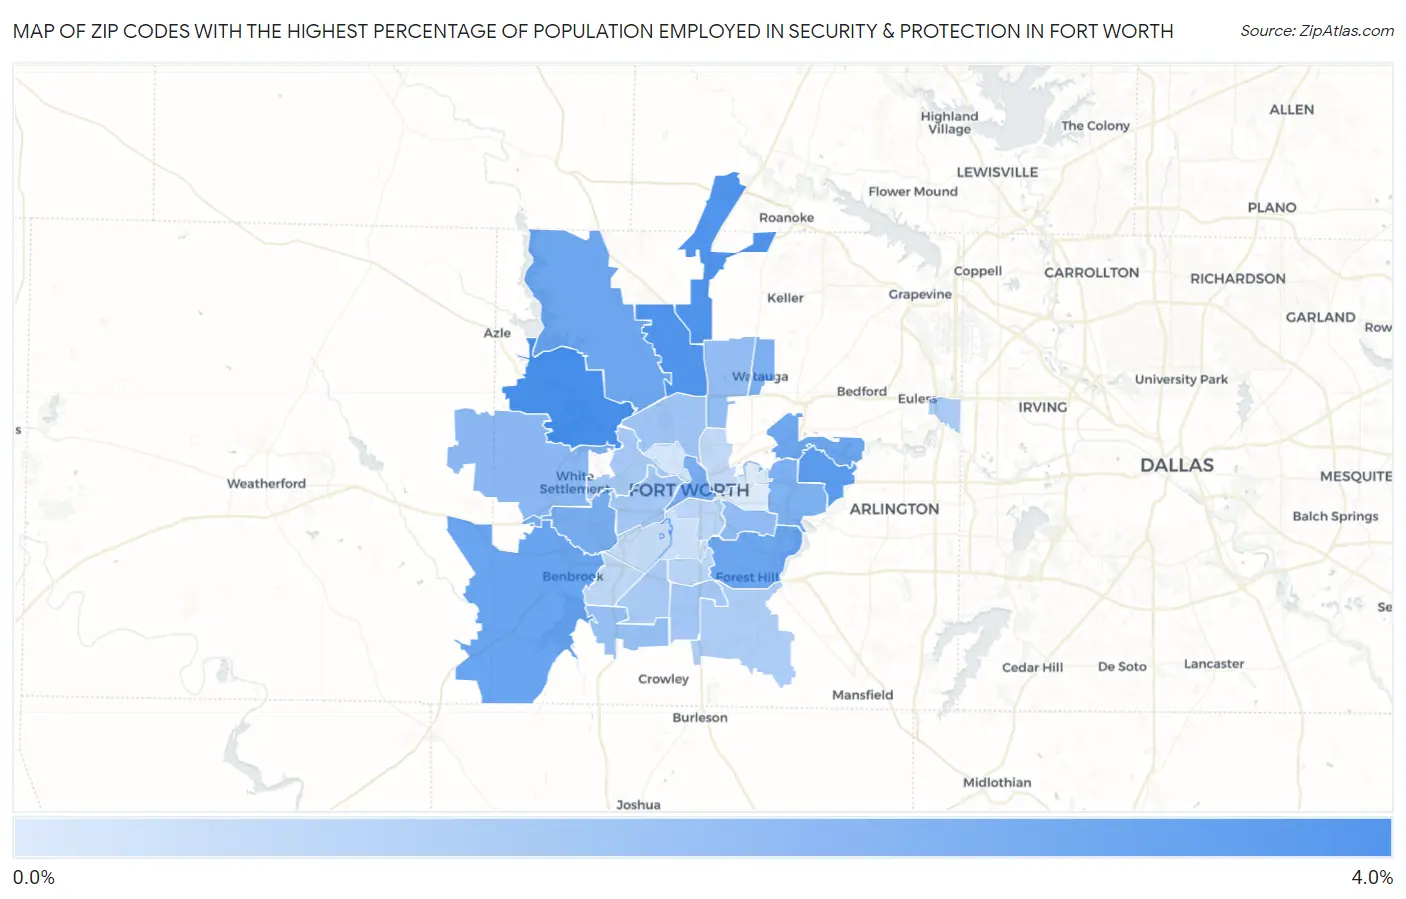
Map of Zip Codes with the Highest Percentage of Population Employed in Security & Protection in Fort Worth
0.39%
3.2%
Zip Codes with the Highest Percentage of Population Employed in Security & Protection in Fort Worth, TX
| Zip Code | % Employed | vs State | vs National | |
| 1. | 76135 | 3.2% | 2.2%(+0.929)#485 | 2.1%(+1.00)#6,686 |
| 2. | 76177 | 3.0% | 2.2%(+0.755)#524 | 2.1%(+0.831)#7,310 |
| 3. | 76131 | 3.0% | 2.2%(+0.743)#526 | 2.1%(+0.819)#7,355 |
| 4. | 76120 | 2.8% | 2.2%(+0.586)#575 | 2.1%(+0.662)#8,071 |
| 5. | 76126 | 2.5% | 2.2%(+0.273)#667 | 2.1%(+0.349)#9,524 |
| 6. | 76119 | 2.5% | 2.2%(+0.262)#669 | 2.1%(+0.338)#9,592 |
| 7. | 76118 | 2.4% | 2.2%(+0.220)#691 | 2.1%(+0.295)#9,827 |
| 8. | 76179 | 2.4% | 2.2%(+0.182)#707 | 2.1%(+0.258)#10,025 |
| 9. | 76116 | 2.3% | 2.2%(+0.048)#754 | 2.1%(+0.124)#10,826 |
| 10. | 76102 | 2.2% | 2.2%(-0.007)#775 | 2.1%(+0.068)#11,152 |
| 11. | 76148 | 2.2% | 2.2%(-0.067)#788 | 2.1%(+0.008)#11,530 |
| 12. | 76112 | 2.1% | 2.2%(-0.108)#809 | 2.1%(-0.032)#11,796 |
| 13. | 76108 | 1.9% | 2.2%(-0.306)#894 | 2.1%(-0.231)#13,101 |
| 14. | 76105 | 1.8% | 2.2%(-0.430)#951 | 2.1%(-0.354)#13,990 |
| 15. | 76137 | 1.7% | 2.2%(-0.493)#984 | 2.1%(-0.417)#14,446 |
| 16. | 76123 | 1.7% | 2.2%(-0.519)#993 | 2.1%(-0.444)#14,647 |
| 17. | 76106 | 1.5% | 2.2%(-0.680)#1,069 | 2.1%(-0.605)#15,849 |
| 18. | 76107 | 1.4% | 2.2%(-0.781)#1,101 | 2.1%(-0.706)#16,643 |
| 19. | 76134 | 1.4% | 2.2%(-0.797)#1,111 | 2.1%(-0.722)#16,760 |
| 20. | 76114 | 1.4% | 2.2%(-0.841)#1,136 | 2.1%(-0.765)#17,081 |
| 21. | 76133 | 1.4% | 2.2%(-0.871)#1,150 | 2.1%(-0.796)#17,311 |
| 22. | 76155 | 1.3% | 2.2%(-0.927)#1,165 | 2.1%(-0.851)#17,758 |
| 23. | 76140 | 1.3% | 2.2%(-0.932)#1,168 | 2.1%(-0.856)#17,802 |
| 24. | 76115 | 1.0% | 2.2%(-1.21)#1,289 | 2.1%(-1.13)#19,890 |
| 25. | 76104 | 1.0% | 2.2%(-1.21)#1,295 | 2.1%(-1.14)#19,968 |
| 26. | 76132 | 0.94% | 2.2%(-1.28)#1,331 | 2.1%(-1.21)#20,509 |
| 27. | 76111 | 0.88% | 2.2%(-1.34)#1,351 | 2.1%(-1.26)#20,898 |
| 28. | 76109 | 0.79% | 2.2%(-1.43)#1,380 | 2.1%(-1.36)#21,458 |
| 29. | 76110 | 0.69% | 2.2%(-1.54)#1,419 | 2.1%(-1.46)#22,182 |
| 30. | 76164 | 0.56% | 2.2%(-1.66)#1,450 | 2.1%(-1.58)#22,869 |
| 31. | 76103 | 0.39% | 2.2%(-1.83)#1,489 | 2.1%(-1.76)#23,769 |
1
Common Questions
What are the Top 10 Zip Codes with the Highest Percentage of Population Employed in Security & Protection in Fort Worth, TX?
Top 10 Zip Codes with the Highest Percentage of Population Employed in Security & Protection in Fort Worth, TX are:
What zip code has the Highest Percentage of Population Employed in Security & Protection in Fort Worth, TX?
76135 has the Highest Percentage of Population Employed in Security & Protection in Fort Worth, TX with 3.2%.
What is the Percentage of Population Employed in Security & Protection in Fort Worth, TX?
Percentage of Population Employed in Security & Protection in Fort Worth is 1.8%.
What is the Percentage of Population Employed in Security & Protection in Texas?
Percentage of Population Employed in Security & Protection in Texas is 2.2%.
What is the Percentage of Population Employed in Security & Protection in the United States?
Percentage of Population Employed in Security & Protection in the United States is 2.1%.