Zip Codes with the Highest Percentage of Households Without a Vehicle in Fort Worth, TX

RELATED REPORTS & OPTIONS

Households without a Cars
Population
Families and Households
Female Fertility
Female Fertility (Unmarried)
Race (Community Size)
Race (Percentage)
Ancestry (Community Size)
AfghanAfricanAlbanianAlsatianAmericanApacheArabArgentineanArmenianAustralianAustrianBahamianBangladeshiBarbadianBasqueBelgianBhutaneseBlackfeetBolivianBrazilianBritishBritish West IndianBulgarianBurmeseCajunCambodianCanadianCelticCentral AmericanCentral American IndianCherokeeCheyenneChickasawChileanChippewaChoctawColombianComancheCosta RicanCreekCroatianCrowCubanCzechCzechoslovakianDanishDelawareDominicanDutchDutch West IndianEastern EuropeanEcuadorianEgyptianEnglishEstonianEthiopianEuropeanFilipinoFinnishFrenchFrench American IndianFrench CanadianGermanGerman RussianGhanaianGreekGuamanian / ChamorroGuatemalanGuyaneseHaitianHonduranHopiHungarianIcelanderIndian (Asian)IndonesianInupiatIranianIraqiIrishIroquoisIsraeliItalianJamaicanJapaneseJordanianKenyanKiowaKoreanLaotianLatvianLebaneseLiberianLithuanianLuxembourgerMalaysianMalteseMexicanMexican American IndianMongolianMoroccanNative HawaiianNavajoNicaraguanNigerianNorthern EuropeanNorwegianOsageOttawaPakistaniPalestinianPanamanianPennsylvania GermanPeruvianPolishPortuguesePotawatomiPuebloPuerto RicanRomanianRussianSalvadoranSamoanScandinavianScotch-IrishScottishSerbianSiouxSlavicSlovakSloveneSomaliSouth AfricanSouth AmericanSouth American IndianSpaniardSpanishSpanish AmericanSpanish American IndianSri LankanSubsaharan AfricanSudaneseSwedishSwissSyrianThaiTonganTrinidadian and TobagonianTurkishUgandanUkrainianVenezuelanVietnameseWelshWest IndianYaquiYugoslavianZimbabwean
Ancestry (Percentage)
AfghanAfricanAlbanianAlsatianAmericanApacheArabArgentineanArmenianAustralianAustrianBahamianBangladeshiBarbadianBasqueBelgianBhutaneseBlackfeetBolivianBrazilianBritishBritish West IndianBulgarianBurmeseCajunCambodianCanadianCelticCentral AmericanCentral American IndianCherokeeCheyenneChickasawChileanChippewaChoctawColombianComancheCosta RicanCreekCroatianCrowCubanCzechCzechoslovakianDanishDelawareDominicanDutchDutch West IndianEastern EuropeanEcuadorianEgyptianEnglishEstonianEthiopianEuropeanFilipinoFinnishFrenchFrench American IndianFrench CanadianGermanGerman RussianGhanaianGreekGuamanian / ChamorroGuatemalanGuyaneseHaitianHonduranHopiHungarianIcelanderIndian (Asian)IndonesianInupiatIranianIraqiIrishIroquoisIsraeliItalianJamaicanJapaneseJordanianKenyanKiowaKoreanLaotianLatvianLebaneseLiberianLithuanianLuxembourgerMalaysianMalteseMexicanMexican American IndianMongolianMoroccanNative HawaiianNavajoNicaraguanNigerianNorthern EuropeanNorwegianOsageOttawaPakistaniPalestinianPanamanianPennsylvania GermanPeruvianPolishPortuguesePotawatomiPuebloPuerto RicanRomanianRussianSalvadoranSamoanScandinavianScotch-IrishScottishSerbianSiouxSlavicSlovakSloveneSomaliSouth AfricanSouth AmericanSouth American IndianSpaniardSpanishSpanish AmericanSpanish American IndianSri LankanSubsaharan AfricanSudaneseSwedishSwissSyrianThaiTonganTrinidadian and TobagonianTurkishUgandanUkrainianVenezuelanVietnameseWelshWest IndianYaquiYugoslavianZimbabwean
Immigrant Origin (Total)
AfghanistanAfricaAlbaniaArgentinaAsiaAustraliaBahamasBangladeshBarbadosBelarusBelizeBoliviaBosnia and HerzegovinaBrazilBulgariaBurma / MyanmarCambodiaCameroonCanadaCaribbeanCentral AmericaChileChinaColombiaCongoCosta RicaCroatiaCubaCzechoslovakiaDominican RepublicEastern AfricaEastern AsiaEastern EuropeEcuadorEgyptEl SalvadorEnglandEritreaEthiopiaEuropeFranceGermanyGhanaGreeceGuatemalaHaitiHondurasHong KongHungaryIndiaIndonesiaIranIraqIrelandIsraelItalyJamaicaJapanJordanKenyaKoreaLaosLatin AmericaLebanonLiberiaMalaysiaMexicoMicronesiaMiddle AfricaMoroccoNepalNetherlandsNicaraguaNigeriaNorthern AfricaNorthern EuropeOceaniaPakistanPanamaPeruPhilippinesPolandPortugalRomaniaRussiaScotlandSenegalSerbiaSomaliaSouth AfricaSouth AmericaSouth Central AsiaSouth Eastern AsiaSouthern EuropeSpainSri LankaSudanSwedenSwitzerlandSyriaTaiwanThailandTrinidad and TobagoTurkeyUgandaUkraineVenezuelaVietnamWestern AfricaWestern AsiaWestern EuropeZaireZimbabwe
Immigrant Origin (Percentage)
AfghanistanAfricaAlbaniaArgentinaAsiaAustraliaBahamasBangladeshBarbadosBelarusBelizeBoliviaBosnia and HerzegovinaBrazilBulgariaBurma / MyanmarCambodiaCameroonCanadaCaribbeanCentral AmericaChileChinaColombiaCongoCosta RicaCroatiaCubaCzechoslovakiaDominican RepublicEastern AfricaEastern AsiaEastern EuropeEcuadorEgyptEl SalvadorEnglandEritreaEthiopiaEuropeFranceGermanyGhanaGreeceGuatemalaHaitiHondurasHong KongHungaryIndiaIndonesiaIranIraqIrelandIsraelItalyJamaicaJapanJordanKenyaKoreaLaosLatin AmericaLebanonLiberiaMalaysiaMexicoMicronesiaMiddle AfricaMoroccoNepalNetherlandsNicaraguaNigeriaNorthern AfricaNorthern EuropeOceaniaPakistanPanamaPeruPhilippinesPolandPortugalRomaniaRussiaScotlandSenegalSerbiaSomaliaSouth AfricaSouth AmericaSouth Central AsiaSouth Eastern AsiaSouthern EuropeSpainSri LankaSudanSwedenSwitzerlandSyriaTaiwanThailandTrinidad and TobagoTurkeyUgandaUkraineVenezuelaVietnamWestern AfricaWestern AsiaWestern EuropeZaireZimbabwe
Income
Income (Families)
Income (Households)
Poverty
Poverty (Families)
Unemployment
Employment Occupations
Employment Industries
Employer Class
Commute Time
Commute Means
School Enrollment
Education by Degree Field
Occupancy
Finances
Physical Characteristics
Fort Worth
Compare Zip Codes
Comparison Subject

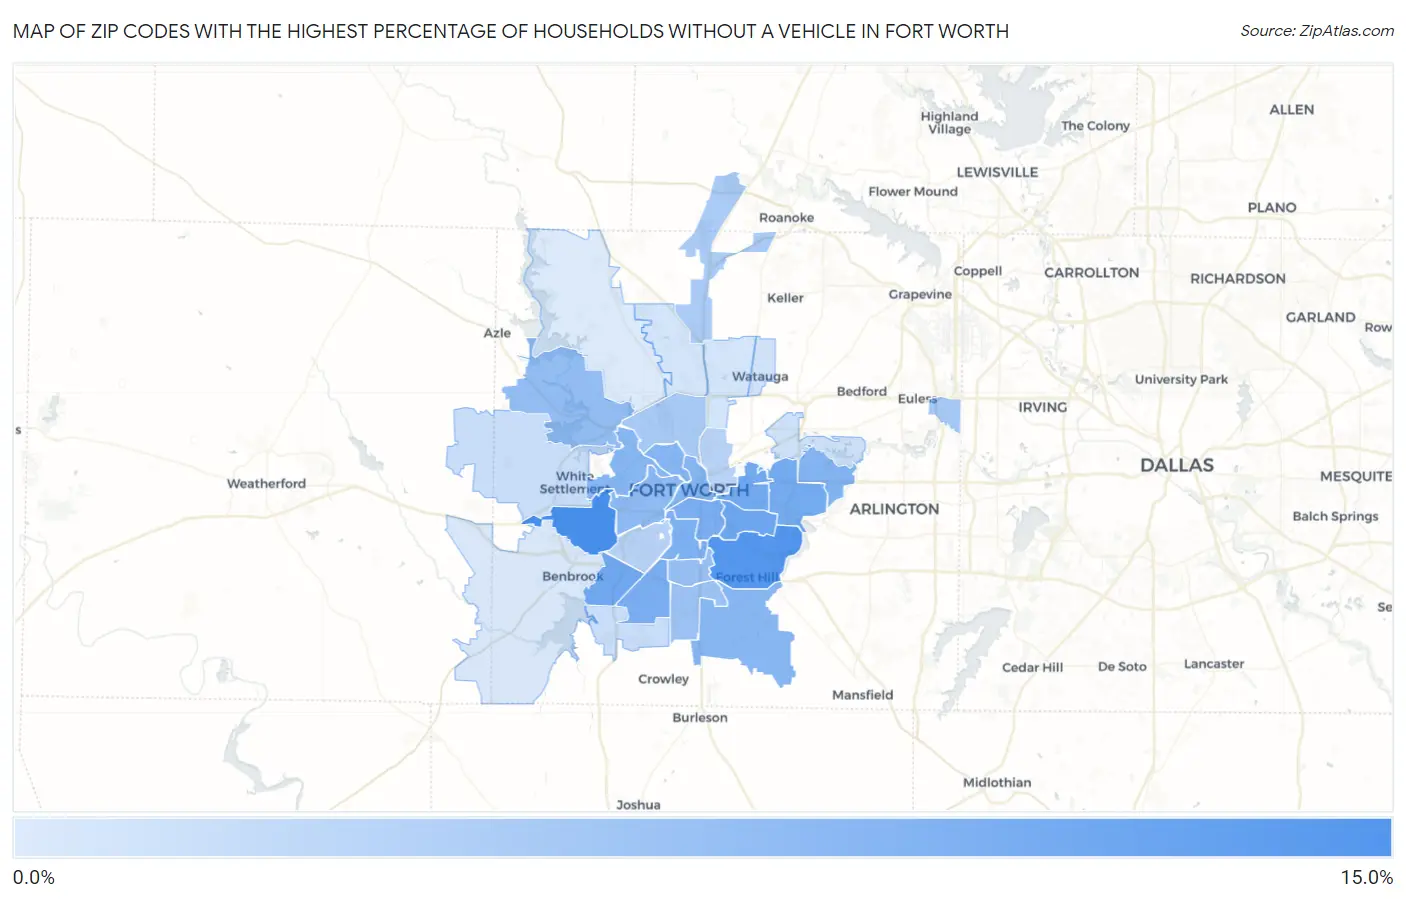
Map of Zip Codes with the Highest Percentage of Households Without a Vehicle in Fort Worth

0.0%
15.0%
Zip Codes with the Highest Percentage of Households Without a Vehicle in Fort Worth Map

Zip Codes with the Highest Percentage of Households Without a Vehicle in Fort Worth, TX

Zip Code Housholds Without a Car vs State vs National
1.7611612.1%5.3%(+6.80)#1498.3%(+3.80)#3,495
2.7611910.9%5.3%(+5.60)#1908.3%(+2.60)#4,178
3.761059.0%5.3%(+3.70)#2798.3%(+0.700)#5,745
4.761328.7%5.3%(+3.40)#2918.3%(+0.400)#6,073
5.761038.6%5.3%(+3.30)#2988.3%(+0.300)#6,202
6.761128.4%5.3%(+3.10)#3098.3%(+0.100)#6,414
7.761048.1%5.3%(+2.80)#3298.3%(-0.200)#6,810
8.761338.0%5.3%(+2.70)#3388.3%(-0.300)#6,899
9.761107.6%5.3%(+2.30)#3658.3%(-0.700)#7,545
10.761207.3%5.3%(+2.00)#3968.3%(-1.00)#8,058
11.761647.2%5.3%(+1.90)#4048.3%(-1.10)#8,242
12.761027.1%5.3%(+1.80)#4128.3%(-1.20)#8,425
13.761407.0%5.3%(+1.70)#4198.3%(-1.30)#8,547
14.761147.0%5.3%(+1.70)#4208.3%(-1.30)#8,554
15.761076.4%5.3%(+1.10)#4828.3%(-1.90)#9,575
16.761356.0%5.3%(+0.700)#5388.3%(-2.30)#10,463
17.761155.7%5.3%(+0.400)#5698.3%(-2.60)#11,151
18.761345.4%5.3%(+0.100)#6078.3%(-2.90)#11,854
19.761554.7%5.3%(-0.600)#7378.3%(-3.60)#13,749
20.761064.4%5.3%(-0.900)#7718.3%(-3.90)#14,476
21.761774.2%5.3%(-1.10)#8258.3%(-4.10)#15,146
22.761113.3%5.3%(-2.00)#9988.3%(-5.00)#18,025
23.761093.2%5.3%(-2.10)#1,0218.3%(-5.10)#18,367
24.761232.1%5.3%(-3.20)#1,2568.3%(-6.20)#22,047
25.761082.0%5.3%(-3.30)#1,2828.3%(-6.30)#22,425
26.761181.6%5.3%(-3.70)#1,3628.3%(-6.70)#23,802
27.761481.3%5.3%(-4.00)#1,4218.3%(-7.00)#24,742
28.761311.2%5.3%(-4.10)#1,4338.3%(-7.10)#25,050
29.761371.1%5.3%(-4.20)#1,4448.3%(-7.20)#25,328
30.761260.80%5.3%(-4.50)#1,5078.3%(-7.50)#26,090
31.761790.50%5.3%(-4.80)#1,5538.3%(-7.80)#26,788

Common Questions

What are the Top 10 Zip Codes with the Highest Percentage of Households Without a Vehicle in Fort Worth, TX?
Top 10 Zip Codes with the Highest Percentage of Households Without a Vehicle in Fort Worth, TX are:
#1
12.1%
#2
10.9%
#3
9.0%
#4
8.7%
#5
8.6%
#6
8.4%
#7
8.1%
#8
8.0%
#9
7.6%
#10
7.3%
What zip code has the Highest Percentage of Households Without a Vehicle in Fort Worth, TX?
76116 has the Highest Percentage of Households Without a Vehicle in Fort Worth, TX with 12.1%.
What is the Percentage of Households Without a Vehicle in Fort Worth, TX?
Percentage of Households Without a Vehicle in Fort Worth is 5.4%.
What is the Percentage of Households Without a Vehicle in Texas?
Percentage of Households Without a Vehicle in Texas is 5.3%.
What is the Percentage of Households Without a Vehicle in the United States?
Percentage of Households Without a Vehicle in the United States is 8.3%.