Wall, SD Map & Demographics
Wall Map
Wall Overview
$43,092
PER CAPITA INCOME
$76,563
AVG FAMILY INCOME
$71,364
AVG HOUSEHOLD INCOME
35.0%
WAGE / INCOME GAP [ % ]
65.0¢/ $1
WAGE / INCOME GAP [ $ ]
0.46
INEQUALITY / GINI INDEX
650
TOTAL POPULATION
297
MALE POPULATION
353
FEMALE POPULATION
84.14
MALES / 100 FEMALES
118.86
FEMALES / 100 MALES
46.6
MEDIAN AGE
2.9
AVG FAMILY SIZE
2.4
AVG HOUSEHOLD SIZE
301
LABOR FORCE [ PEOPLE ]
57.7%
PERCENT IN LABOR FORCE
0.7%
UNEMPLOYMENT RATE
Wall Zip Codes
Wall Area Codes
Income in Wall
Income Overview in Wall
Per Capita Income in Wall is $43,092, while median incomes of families and households are $76,563 and $71,364 respectively.
| Characteristic | Number | Measure |
| Per Capita Income | 650 | $43,092 |
| Median Family Income | 177 | $76,563 |
| Mean Family Income | 177 | $107,801 |
| Median Household Income | 272 | $71,364 |
| Mean Household Income | 272 | $103,511 |
| Income Deficit | 177 | $0 |
| Wage / Income Gap (%) | 650 | 35.04% |
| Wage / Income Gap ($) | 650 | 64.96¢ per $1 |
| Gini / Inequality Index | 650 | 0.46 |
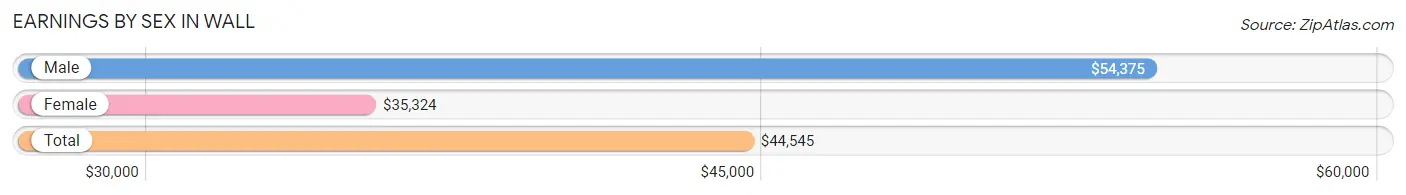
Earnings by Sex in Wall
Average Earnings in Wall are $44,545, $54,375 for men and $35,324 for women, a difference of 35.0%.
| Sex | Number | Average Earnings |
| Male | 151 (46.9%) | $54,375 |
| Female | 171 (53.1%) | $35,324 |
| Total | 322 (100.0%) | $44,545 |
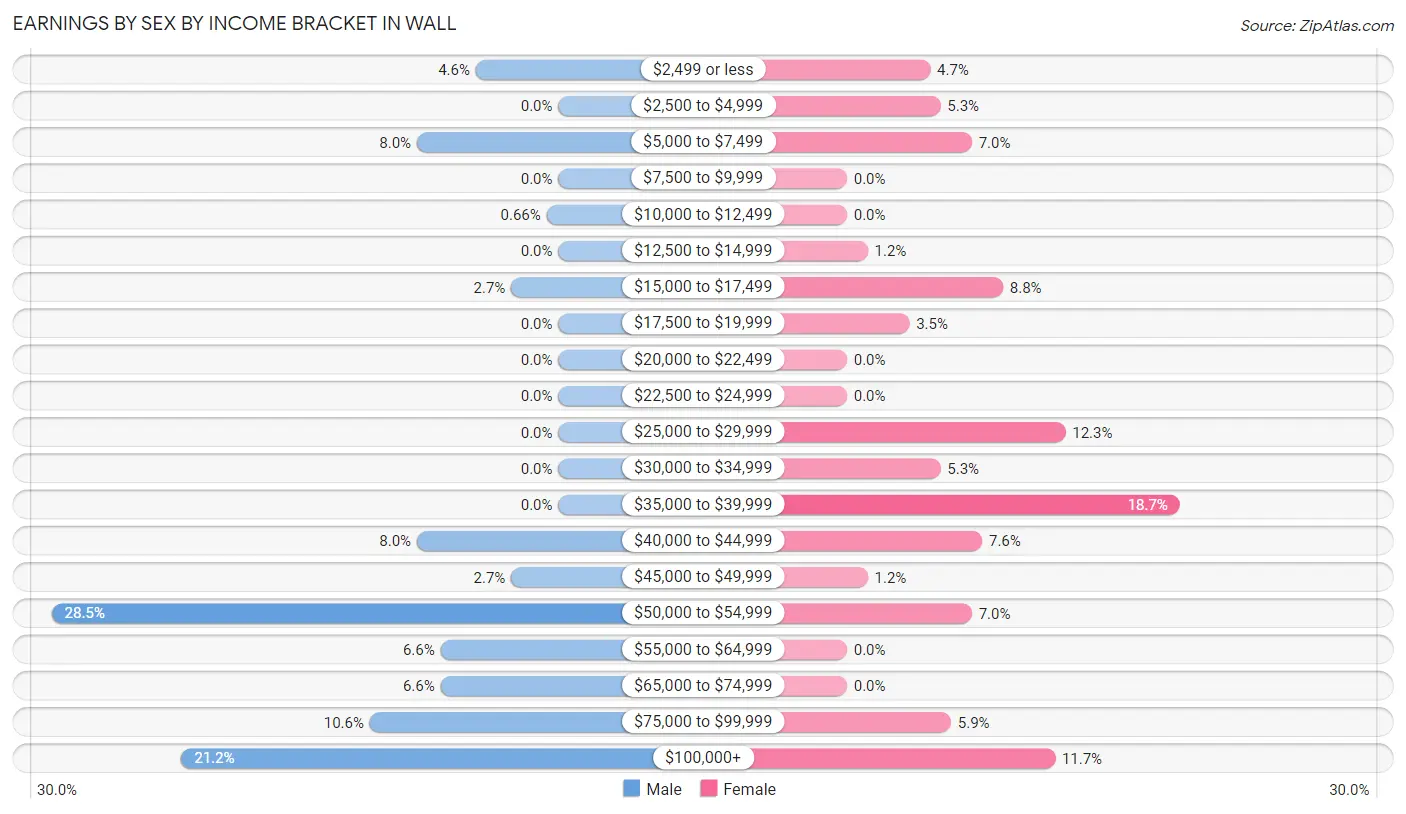
Earnings by Sex by Income Bracket in Wall
The most common earnings brackets in Wall are $50,000 to $54,999 for men (43 | 28.5%) and $35,000 to $39,999 for women (32 | 18.7%).
| Income | Male | Female |
| $2,499 or less | 7 (4.6%) | 8 (4.7%) |
| $2,500 to $4,999 | 0 (0.0%) | 9 (5.3%) |
| $5,000 to $7,499 | 12 (8.0%) | 12 (7.0%) |
| $7,500 to $9,999 | 0 (0.0%) | 0 (0.0%) |
| $10,000 to $12,499 | 1 (0.7%) | 0 (0.0%) |
| $12,500 to $14,999 | 0 (0.0%) | 2 (1.2%) |
| $15,000 to $17,499 | 4 (2.6%) | 15 (8.8%) |
| $17,500 to $19,999 | 0 (0.0%) | 6 (3.5%) |
| $20,000 to $22,499 | 0 (0.0%) | 0 (0.0%) |
| $22,500 to $24,999 | 0 (0.0%) | 0 (0.0%) |
| $25,000 to $29,999 | 0 (0.0%) | 21 (12.3%) |
| $30,000 to $34,999 | 0 (0.0%) | 9 (5.3%) |
| $35,000 to $39,999 | 0 (0.0%) | 32 (18.7%) |
| $40,000 to $44,999 | 12 (8.0%) | 13 (7.6%) |
| $45,000 to $49,999 | 4 (2.6%) | 2 (1.2%) |
| $50,000 to $54,999 | 43 (28.5%) | 12 (7.0%) |
| $55,000 to $64,999 | 10 (6.6%) | 0 (0.0%) |
| $65,000 to $74,999 | 10 (6.6%) | 0 (0.0%) |
| $75,000 to $99,999 | 16 (10.6%) | 10 (5.9%) |
| $100,000+ | 32 (21.2%) | 20 (11.7%) |
| Total | 151 (100.0%) | 171 (100.0%) |
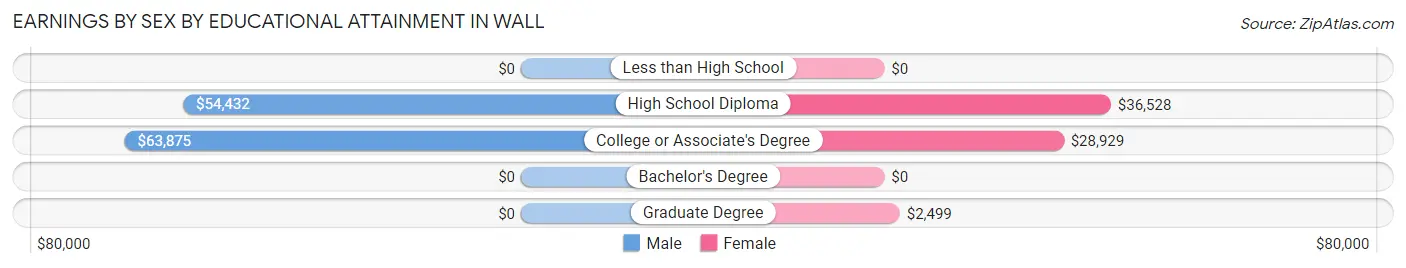
Earnings by Sex by Educational Attainment in Wall
Average earnings in Wall are $63,375 for men and $35,556 for women, a difference of 43.9%. Men with an educational attainment of college or associate's degree enjoy the highest average annual earnings of $63,875, while those with high school diploma education earn the least with $54,432. Women with an educational attainment of high school diploma earn the most with the average annual earnings of $36,528, while those with graduate degree education have the smallest earnings of $2,499.
| Educational Attainment | Male Income | Female Income |
| Less than High School | - | - |
| High School Diploma | $54,432 | $36,528 |
| College or Associate's Degree | $63,875 | $28,929 |
| Bachelor's Degree | - | - |
| Graduate Degree | - | - |
| Total | $63,375 | $35,556 |
Family Income in Wall
Family Income Brackets in Wall
According to the Wall family income data, there are 52 families falling into the $50,000 to $74,999 income range, which is the most common income bracket and makes up 29.4% of all families.
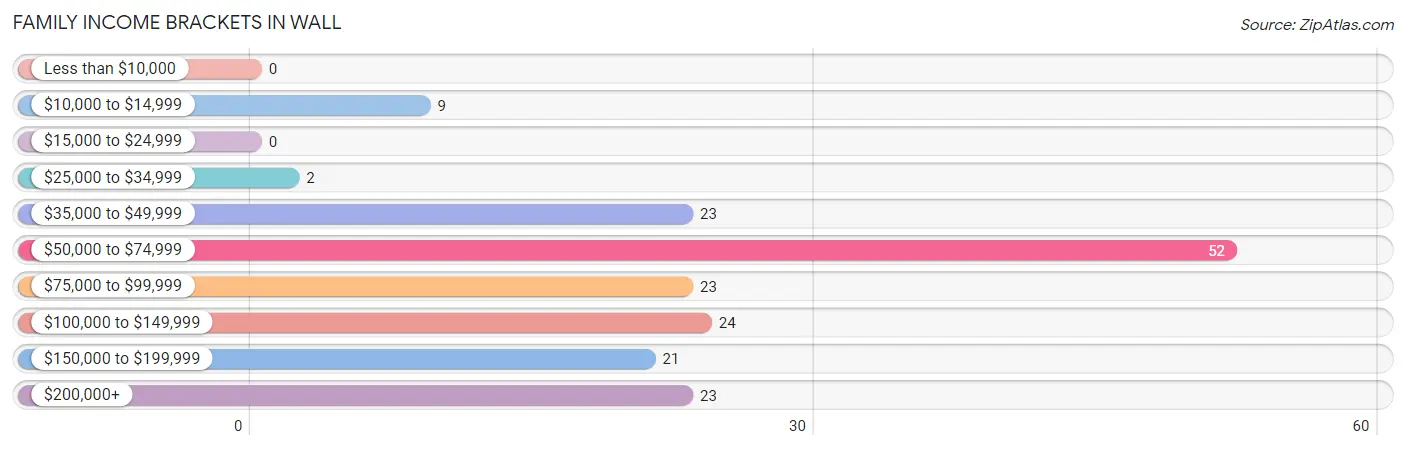
| Income Bracket | # Families | % Families |
| Less than $10,000 | 0 | 0.0% |
| $10,000 to $14,999 | 9 | 5.1% |
| $15,000 to $24,999 | 0 | 0.0% |
| $25,000 to $34,999 | 2 | 1.1% |
| $35,000 to $49,999 | 23 | 13.0% |
| $50,000 to $74,999 | 52 | 29.4% |
| $75,000 to $99,999 | 23 | 13.0% |
| $100,000 to $149,999 | 24 | 13.6% |
| $150,000 to $199,999 | 21 | 11.9% |
| $200,000+ | 23 | 13.0% |
Family Income by Famaliy Size in Wall
2-person families (102 | 57.6%) account for the highest median family income in Wall with $89,500 per family, while 2-person families (102 | 57.6%) have the highest median income of $44,750 per family member.
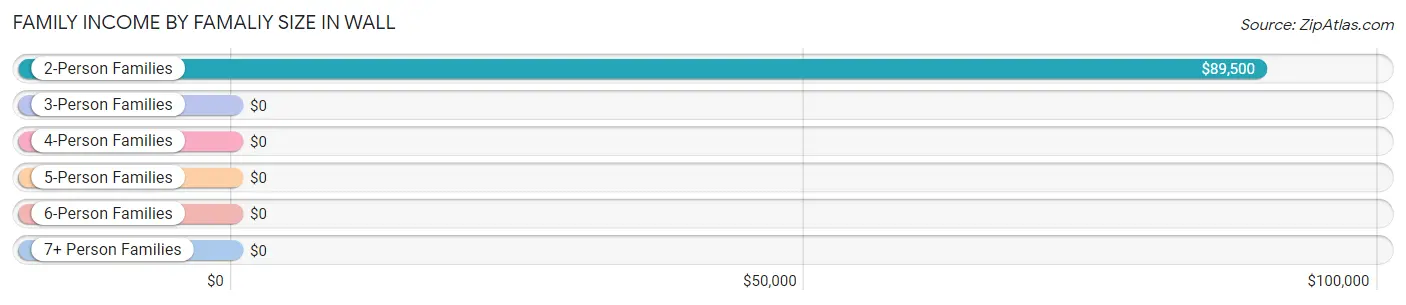
| Income Bracket | # Families | Median Income |
| 2-Person Families | 102 (57.6%) | $89,500 |
| 3-Person Families | 24 (13.6%) | $0 |
| 4-Person Families | 28 (15.8%) | $0 |
| 5-Person Families | 22 (12.4%) | $0 |
| 6-Person Families | 0 (0.0%) | $0 |
| 7+ Person Families | 1 (0.6%) | $0 |
| Total | 177 (100.0%) | $76,563 |
Family Income by Number of Earners in Wall
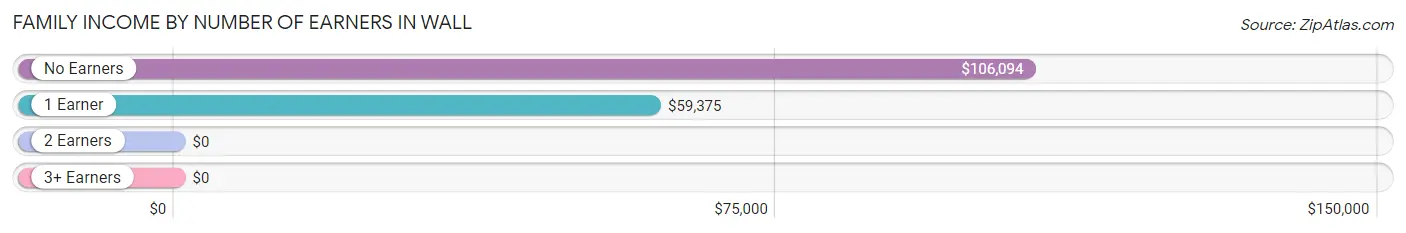
| Number of Earners | # Families | Median Income |
| No Earners | 33 (18.6%) | $106,094 |
| 1 Earner | 70 (39.6%) | $59,375 |
| 2 Earners | 66 (37.3%) | $0 |
| 3+ Earners | 8 (4.5%) | $0 |
| Total | 177 (100.0%) | $76,563 |
Household Income in Wall
Household Income Brackets in Wall
With 58 households falling in the category, the $50,000 to $74,999 income range is the most frequent in Wall, accounting for 21.3% of all households.
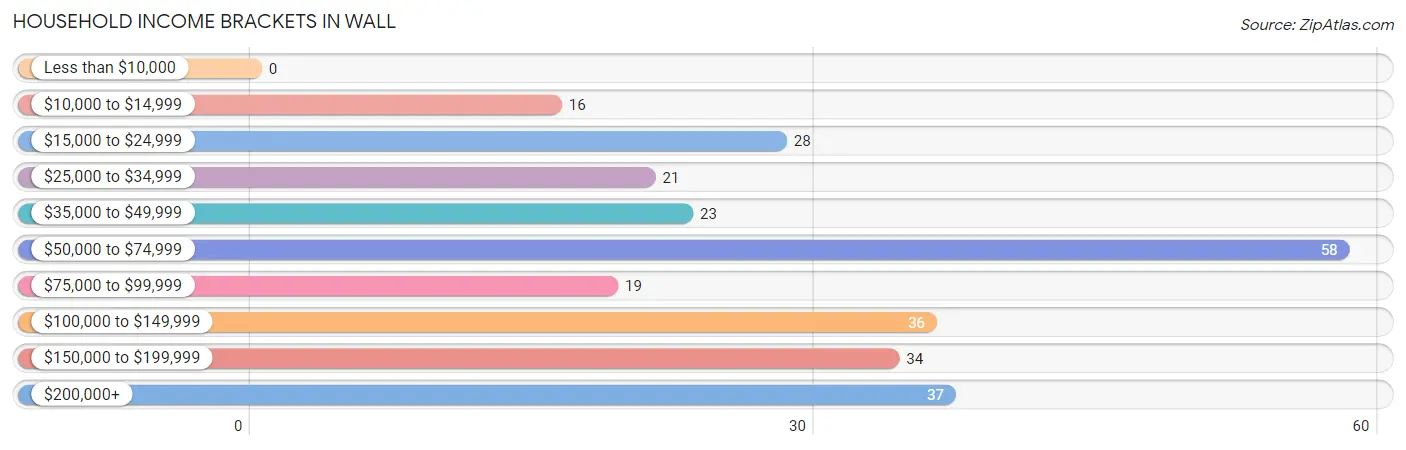
| Income Bracket | # Households | % Households |
| Less than $10,000 | 0 | 0.0% |
| $10,000 to $14,999 | 16 | 5.9% |
| $15,000 to $24,999 | 28 | 10.3% |
| $25,000 to $34,999 | 21 | 7.7% |
| $35,000 to $49,999 | 23 | 8.5% |
| $50,000 to $74,999 | 58 | 21.3% |
| $75,000 to $99,999 | 19 | 7.0% |
| $100,000 to $149,999 | 36 | 13.2% |
| $150,000 to $199,999 | 34 | 12.5% |
| $200,000+ | 37 | 13.6% |
Household Income by Householder Age in Wall
The median household income in Wall is $71,364, with the highest median household income of $77,500 found in the 25 to 44 years age bracket for the primary householder. A total of 60 households (22.1%) fall into this category. Meanwhile, the 15 to 24 years age bracket for the primary householder has the lowest median household income of $0, with 15 households (5.5%) in this group.
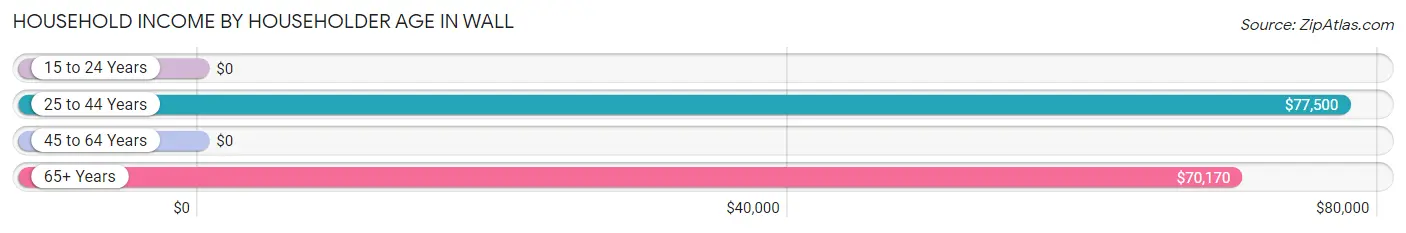
| Income Bracket | # Households | Median Income |
| 15 to 24 Years | 15 (5.5%) | $0 |
| 25 to 44 Years | 60 (22.1%) | $77,500 |
| 45 to 64 Years | 82 (30.1%) | $0 |
| 65+ Years | 115 (42.3%) | $70,170 |
| Total | 272 (100.0%) | $71,364 |
Poverty in Wall
Income Below Poverty by Sex and Age in Wall
With 3.1% poverty level for males and 7.4% for females among the residents of Wall, under 5 year old males and 25 to 34 year old females are the most vulnerable to poverty, with 4 males (33.3%) and 16 females (41.0%) in their respective age groups living below the poverty level.
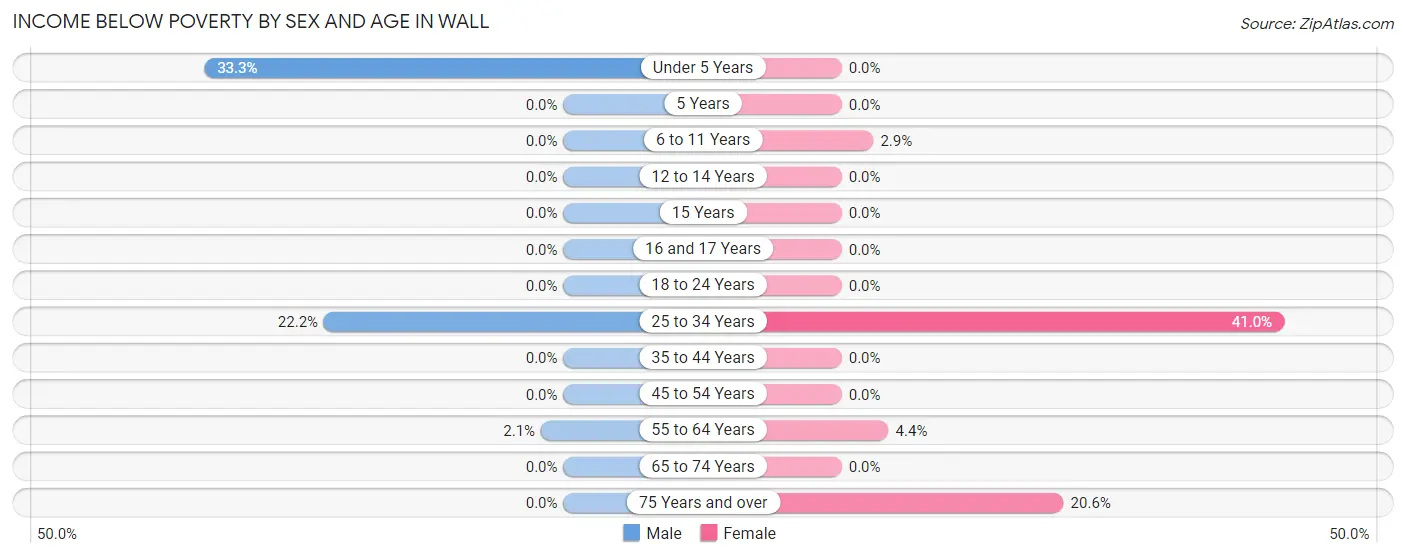
| Age Bracket | Male | Female |
| Under 5 Years | 4 (33.3%) | 0 (0.0%) |
| 5 Years | 0 (0.0%) | 0 (0.0%) |
| 6 to 11 Years | 0 (0.0%) | 1 (2.9%) |
| 12 to 14 Years | 0 (0.0%) | 0 (0.0%) |
| 15 Years | 0 (0.0%) | 0 (0.0%) |
| 16 and 17 Years | 0 (0.0%) | 0 (0.0%) |
| 18 to 24 Years | 0 (0.0%) | 0 (0.0%) |
| 25 to 34 Years | 4 (22.2%) | 16 (41.0%) |
| 35 to 44 Years | 0 (0.0%) | 0 (0.0%) |
| 45 to 54 Years | 0 (0.0%) | 0 (0.0%) |
| 55 to 64 Years | 1 (2.1%) | 2 (4.3%) |
| 65 to 74 Years | 0 (0.0%) | 0 (0.0%) |
| 75 Years and over | 0 (0.0%) | 7 (20.6%) |
| Total | 9 (3.1%) | 26 (7.4%) |
Income Above Poverty by Sex and Age in Wall
According to the poverty statistics in Wall, males aged 5 years and females aged under 5 years are the age groups that are most secure financially, with 100.0% of males and 100.0% of females in these age groups living above the poverty line.
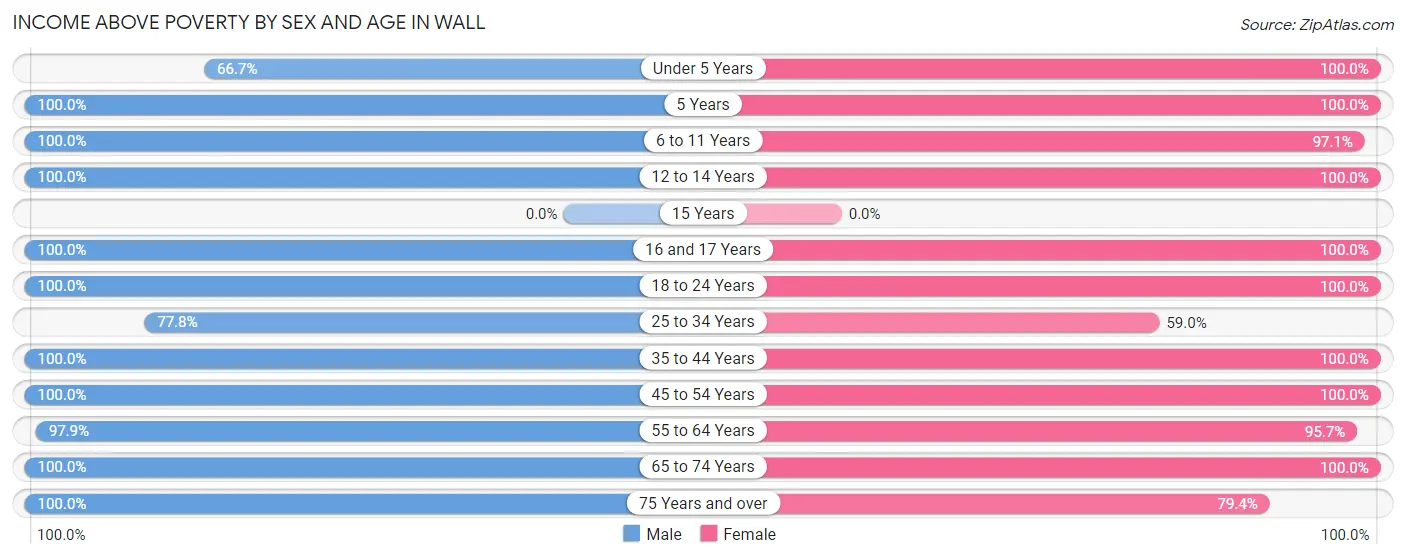
| Age Bracket | Male | Female |
| Under 5 Years | 8 (66.7%) | 13 (100.0%) |
| 5 Years | 5 (100.0%) | 3 (100.0%) |
| 6 to 11 Years | 20 (100.0%) | 33 (97.1%) |
| 12 to 14 Years | 11 (100.0%) | 26 (100.0%) |
| 15 Years | 0 (0.0%) | 0 (0.0%) |
| 16 and 17 Years | 13 (100.0%) | 2 (100.0%) |
| 18 to 24 Years | 31 (100.0%) | 15 (100.0%) |
| 25 to 34 Years | 14 (77.8%) | 23 (59.0%) |
| 35 to 44 Years | 29 (100.0%) | 35 (100.0%) |
| 45 to 54 Years | 21 (100.0%) | 66 (100.0%) |
| 55 to 64 Years | 47 (97.9%) | 44 (95.7%) |
| 65 to 74 Years | 64 (100.0%) | 40 (100.0%) |
| 75 Years and over | 21 (100.0%) | 27 (79.4%) |
| Total | 284 (96.9%) | 327 (92.6%) |
Income Below Poverty Among Married-Couple Families in Wall
The poverty statistics for married-couple families in Wall show that 5.8% or 9 of the total 156 families live below the poverty line. Families with 1 or 2 children have the highest poverty rate of 20.0%, comprising of 9 families. On the other hand, families with no children have the lowest poverty rate of 0.0%, which includes 0 families.
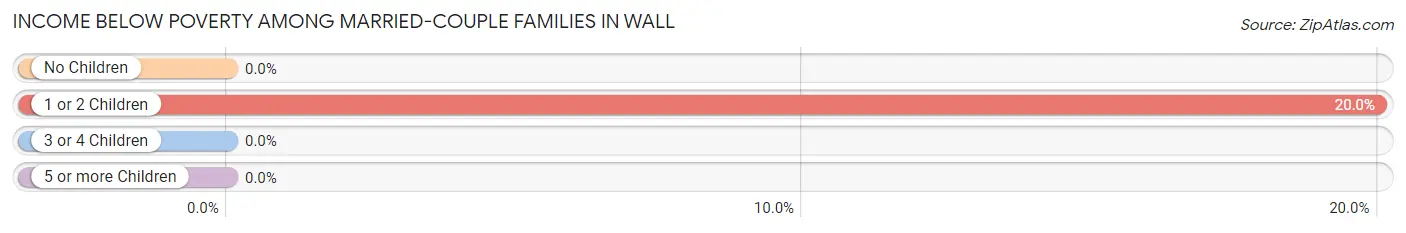
| Children | Above Poverty | Below Poverty |
| No Children | 88 (100.0%) | 0 (0.0%) |
| 1 or 2 Children | 36 (80.0%) | 9 (20.0%) |
| 3 or 4 Children | 22 (100.0%) | 0 (0.0%) |
| 5 or more Children | 1 (100.0%) | 0 (0.0%) |
| Total | 147 (94.2%) | 9 (5.8%) |
Income Below Poverty Among Single-Parent Households in Wall
| Children | Single Father | Single Mother |
| No Children | 0 (0.0%) | 0 (0.0%) |
| 1 or 2 Children | 0 (0.0%) | 0 (0.0%) |
| 3 or 4 Children | 0 (0.0%) | 0 (0.0%) |
| 5 or more Children | 0 (0.0%) | 0 (0.0%) |
| Total | 0 (0.0%) | 0 (0.0%) |
Income Below Poverty Among Married-Couple vs Single-Parent Households in Wall
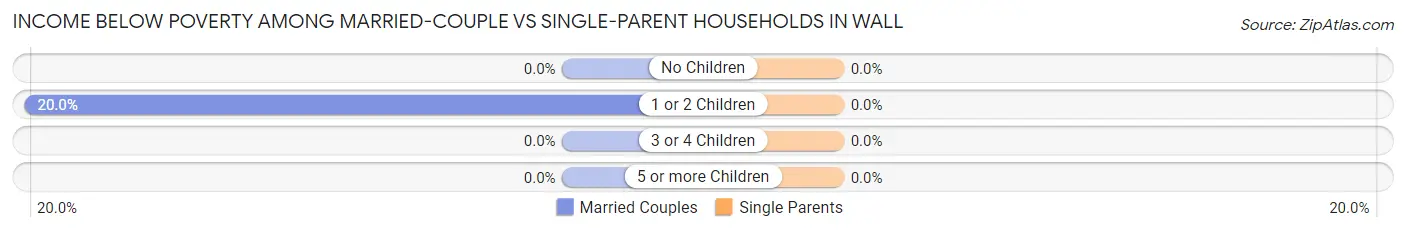
| Children | Married-Couple Families | Single-Parent Households |
| No Children | 0 (0.0%) | 0 (0.0%) |
| 1 or 2 Children | 9 (20.0%) | 0 (0.0%) |
| 3 or 4 Children | 0 (0.0%) | 0 (0.0%) |
| 5 or more Children | 0 (0.0%) | 0 (0.0%) |
| Total | 9 (5.8%) | 0 (0.0%) |
Race in Wall
The most populous races in Wall are White / Caucasian (505 | 77.7%), Two or more Races (65 | 10.0%), and Native / Alaskan (39 | 6.0%).
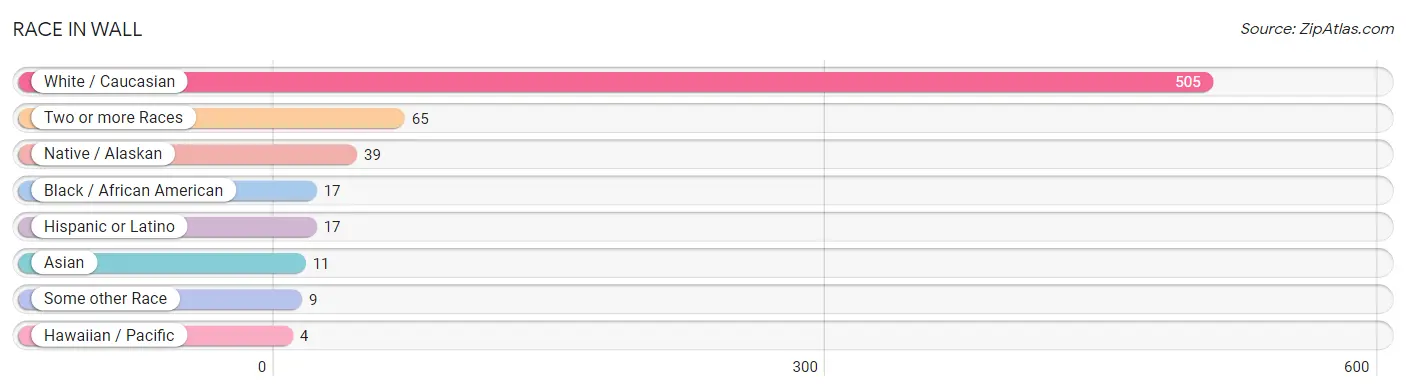
| Race | # Population | % Population |
| Asian | 11 | 1.7% |
| Black / African American | 17 | 2.6% |
| Hawaiian / Pacific | 4 | 0.6% |
| Hispanic or Latino | 17 | 2.6% |
| Native / Alaskan | 39 | 6.0% |
| White / Caucasian | 505 | 77.7% |
| Two or more Races | 65 | 10.0% |
| Some other Race | 9 | 1.4% |
| Total | 650 | 100.0% |
Ancestry in Wall
The most populous ancestries reported in Wall are German (273 | 42.0%), Norwegian (107 | 16.5%), Irish (103 | 15.9%), Sioux (40 | 6.1%), and English (39 | 6.0%), together accounting for 86.5% of all Wall residents.
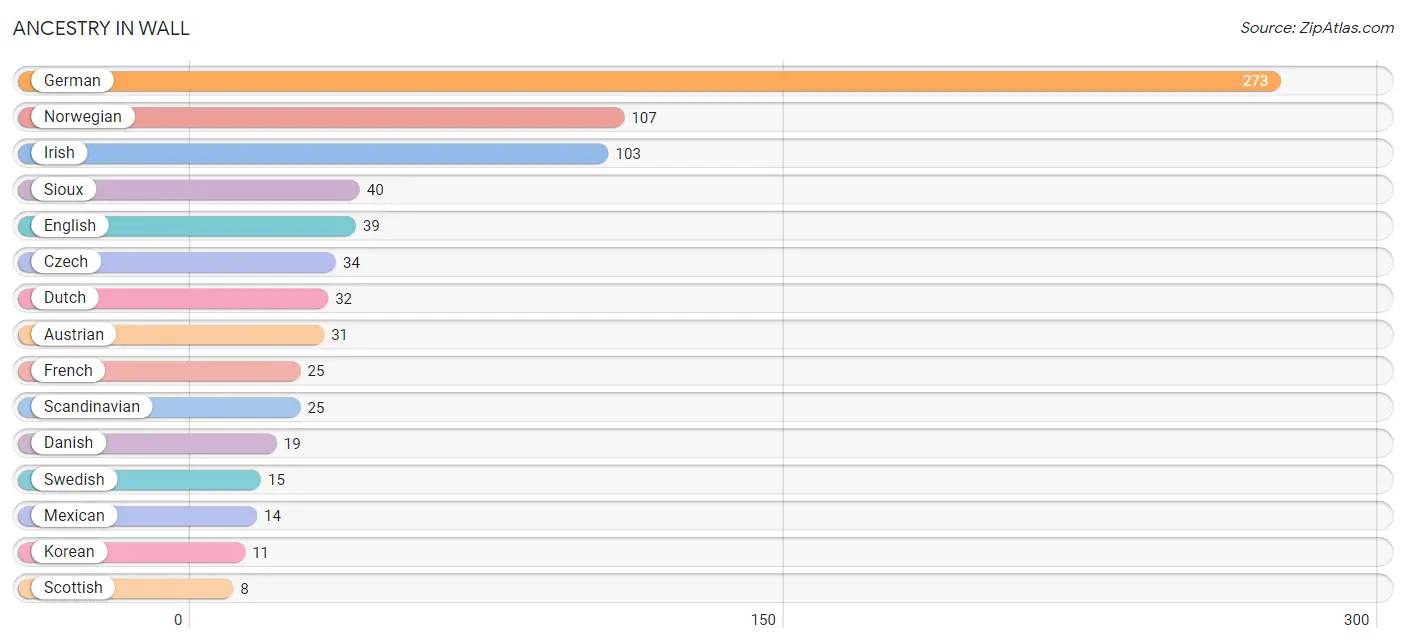
| Ancestry | # Population | % Population |
| Austrian | 31 | 4.8% |
| Czech | 34 | 5.2% |
| Danish | 19 | 2.9% |
| Dutch | 32 | 4.9% |
| English | 39 | 6.0% |
| European | 5 | 0.8% |
| French | 25 | 3.8% |
| French Canadian | 7 | 1.1% |
| German | 273 | 42.0% |
| Irish | 103 | 15.9% |
| Korean | 11 | 1.7% |
| Mexican | 14 | 2.1% |
| Native Hawaiian | 4 | 0.6% |
| Nigerian | 2 | 0.3% |
| Norwegian | 107 | 16.5% |
| Polish | 3 | 0.5% |
| Scandinavian | 25 | 3.8% |
| Scottish | 8 | 1.2% |
| Sioux | 40 | 6.1% |
| Subsaharan African | 2 | 0.3% |
| Swedish | 15 | 2.3% | View All 21 Rows |
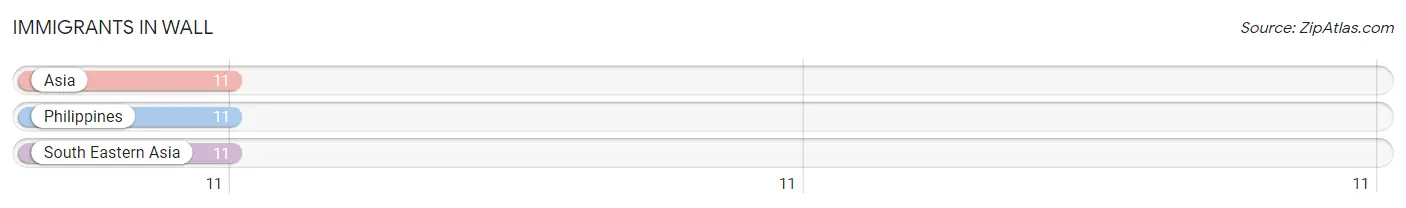
Immigrants in Wall
The most numerous immigrant groups reported in Wall came from Asia (11 | 1.7%), Philippines (11 | 1.7%), and South Eastern Asia (11 | 1.7%), together accounting for 5.1% of all Wall residents.
| Immigration Origin | # Population | % Population |
| Asia | 11 | 1.7% |
| Philippines | 11 | 1.7% |
| South Eastern Asia | 11 | 1.7% | View All 3 Rows |
Sex and Age in Wall
Sex and Age in Wall
The most populous age groups in Wall are 65 to 69 Years (38 | 12.8%) for men and 10 to 14 Years (39 | 11.1%) for women.
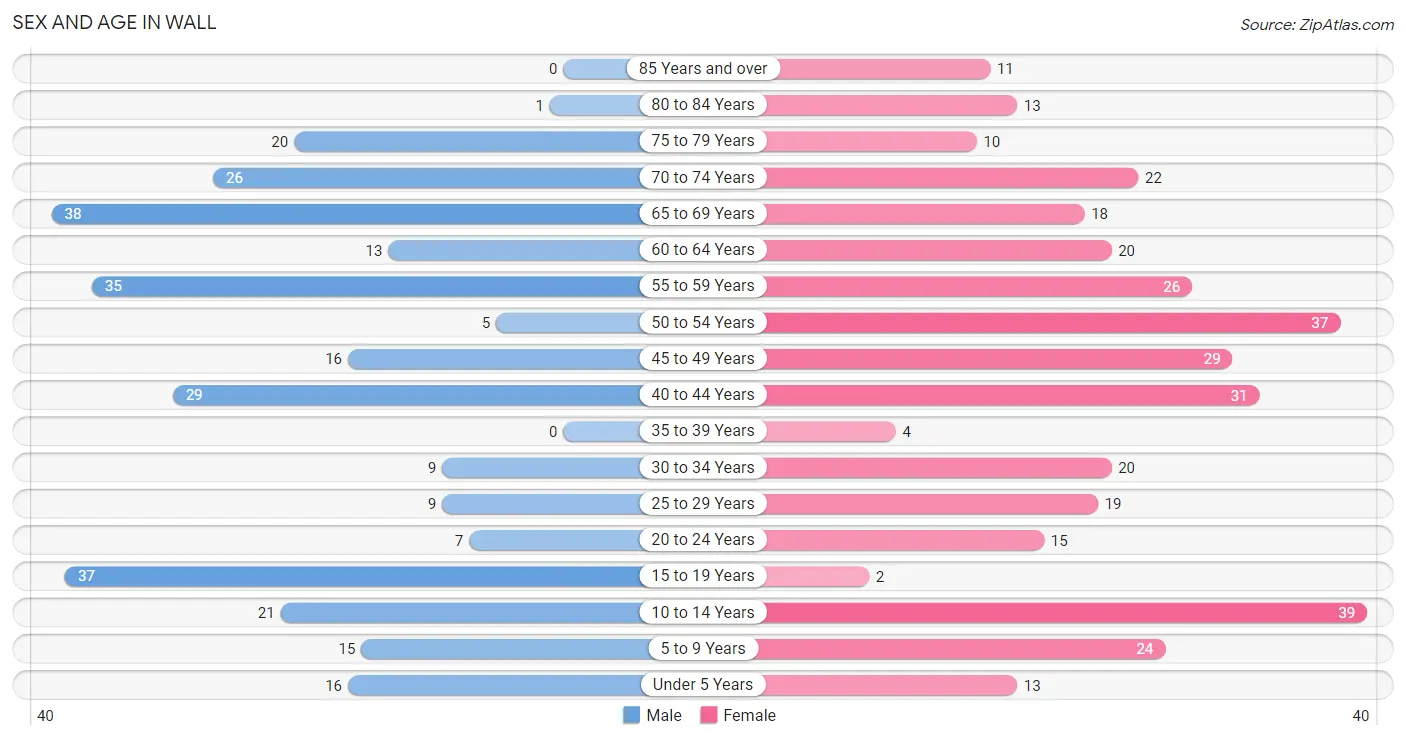
| Age Bracket | Male | Female |
| Under 5 Years | 16 (5.4%) | 13 (3.7%) |
| 5 to 9 Years | 15 (5.1%) | 24 (6.8%) |
| 10 to 14 Years | 21 (7.1%) | 39 (11.1%) |
| 15 to 19 Years | 37 (12.5%) | 2 (0.6%) |
| 20 to 24 Years | 7 (2.4%) | 15 (4.3%) |
| 25 to 29 Years | 9 (3.0%) | 19 (5.4%) |
| 30 to 34 Years | 9 (3.0%) | 20 (5.7%) |
| 35 to 39 Years | 0 (0.0%) | 4 (1.1%) |
| 40 to 44 Years | 29 (9.8%) | 31 (8.8%) |
| 45 to 49 Years | 16 (5.4%) | 29 (8.2%) |
| 50 to 54 Years | 5 (1.7%) | 37 (10.5%) |
| 55 to 59 Years | 35 (11.8%) | 26 (7.4%) |
| 60 to 64 Years | 13 (4.4%) | 20 (5.7%) |
| 65 to 69 Years | 38 (12.8%) | 18 (5.1%) |
| 70 to 74 Years | 26 (8.7%) | 22 (6.2%) |
| 75 to 79 Years | 20 (6.7%) | 10 (2.8%) |
| 80 to 84 Years | 1 (0.3%) | 13 (3.7%) |
| 85 Years and over | 0 (0.0%) | 11 (3.1%) |
| Total | 297 (100.0%) | 353 (100.0%) |
Families and Households in Wall
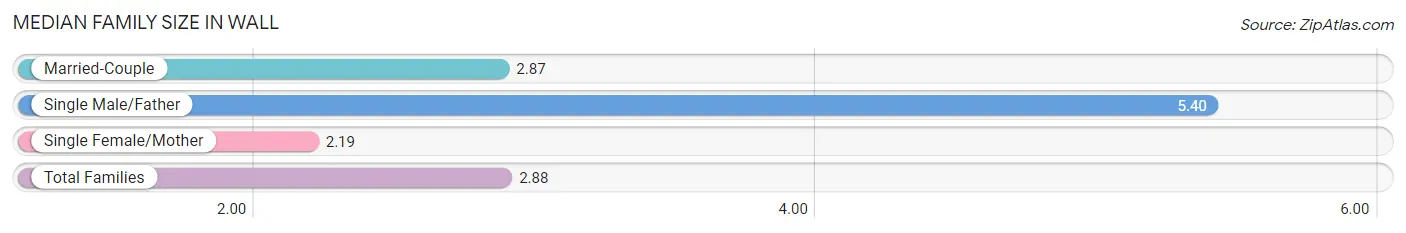
Median Family Size in Wall
The median family size in Wall is 2.88 persons per family, with single male/father families (5 | 2.8%) accounting for the largest median family size of 5.4 persons per family. On the other hand, single female/mother families (16 | 9.0%) represent the smallest median family size with 2.19 persons per family.
| Family Type | # Families | Family Size |
| Married-Couple | 156 (88.1%) | 2.87 |
| Single Male/Father | 5 (2.8%) | 5.40 |
| Single Female/Mother | 16 (9.0%) | 2.19 |
| Total Families | 177 (100.0%) | 2.88 |
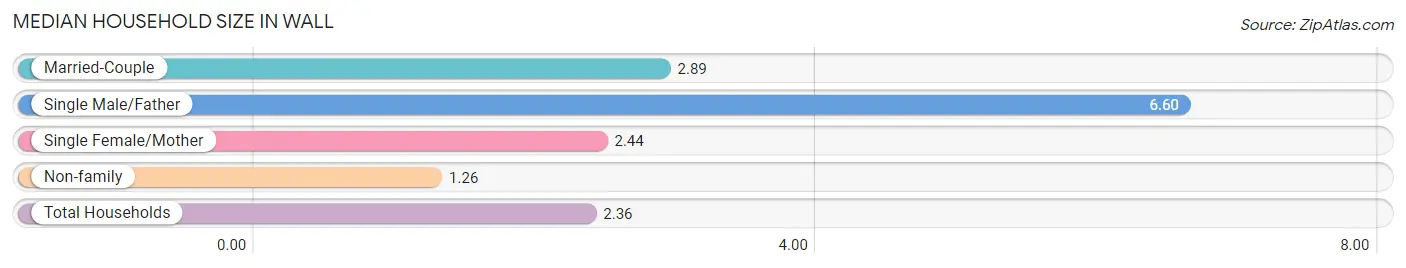
Median Household Size in Wall
The median household size in Wall is 2.36 persons per household, with single male/father households (5 | 1.8%) accounting for the largest median household size of 6.6 persons per household. non-family households (95 | 34.9%) represent the smallest median household size with 1.26 persons per household.
| Household Type | # Households | Household Size |
| Married-Couple | 156 (57.4%) | 2.89 |
| Single Male/Father | 5 (1.8%) | 6.60 |
| Single Female/Mother | 16 (5.9%) | 2.44 |
| Non-family | 95 (34.9%) | 1.26 |
| Total Households | 272 (100.0%) | 2.36 |
Household Size by Marriage Status in Wall
Out of a total of 272 households in Wall, 177 (65.1%) are family households, while 95 (34.9%) are nonfamily households. The most numerous type of family households are 2-person households, comprising 98, and the most common type of nonfamily households are 1-person households, comprising 65.
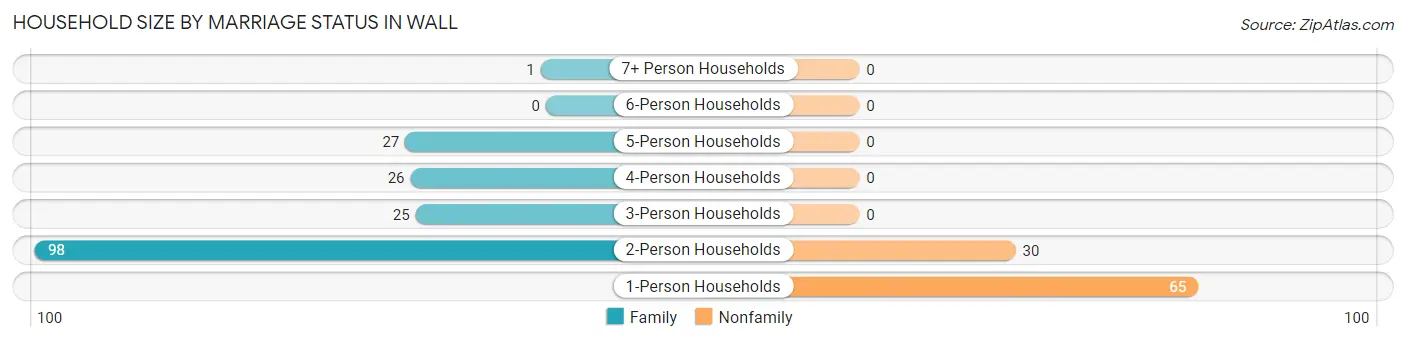
| Household Size | Family Households | Nonfamily Households |
| 1-Person Households | - | 65 (23.9%) |
| 2-Person Households | 98 (36.0%) | 30 (11.0%) |
| 3-Person Households | 25 (9.2%) | 0 (0.0%) |
| 4-Person Households | 26 (9.6%) | 0 (0.0%) |
| 5-Person Households | 27 (9.9%) | 0 (0.0%) |
| 6-Person Households | 0 (0.0%) | 0 (0.0%) |
| 7+ Person Households | 1 (0.4%) | 0 (0.0%) |
| Total | 177 (65.1%) | 95 (34.9%) |
Female Fertility in Wall
Fertility by Age in Wall
Average fertility rate in Wall is 25.0 births per 1,000 women. Women in the age bracket of 20 to 34 years have the highest fertility rate with 56.0 births per 1,000 women. Women in the age bracket of 20 to 34 years acount for 100.0% of all women with births.
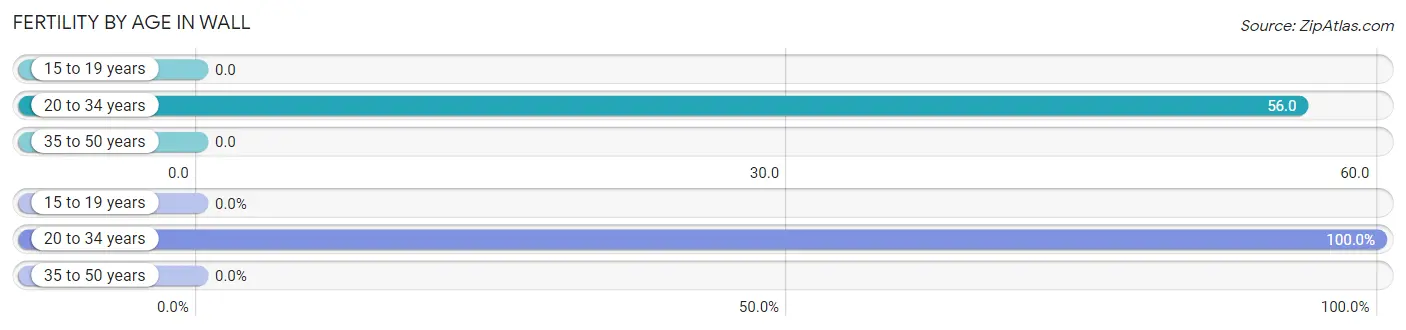
| Age Bracket | Women with Births | Births / 1,000 Women |
| 15 to 19 years | 0 (0.0%) | 0.0 |
| 20 to 34 years | 3 (100.0%) | 56.0 |
| 35 to 50 years | 0 (0.0%) | 0.0 |
| Total | 3 (100.0%) | 25.0 |
Fertility by Age by Marriage Status in Wall
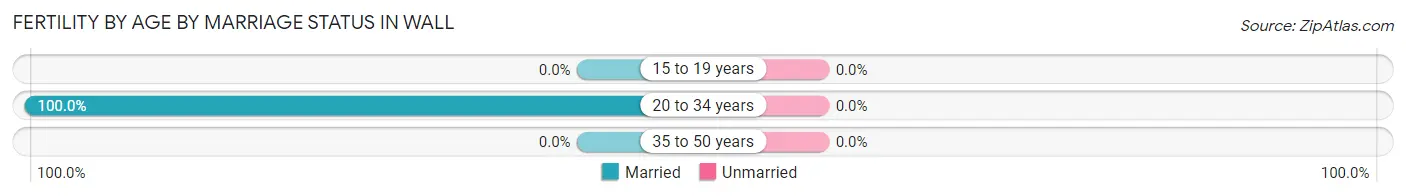
| Age Bracket | Married | Unmarried |
| 15 to 19 years | 0 (0.0%) | 0 (0.0%) |
| 20 to 34 years | 3 (100.0%) | 0 (0.0%) |
| 35 to 50 years | 0 (0.0%) | 0 (0.0%) |
| Total | 3 (100.0%) | 0 (0.0%) |
Fertility by Education in Wall
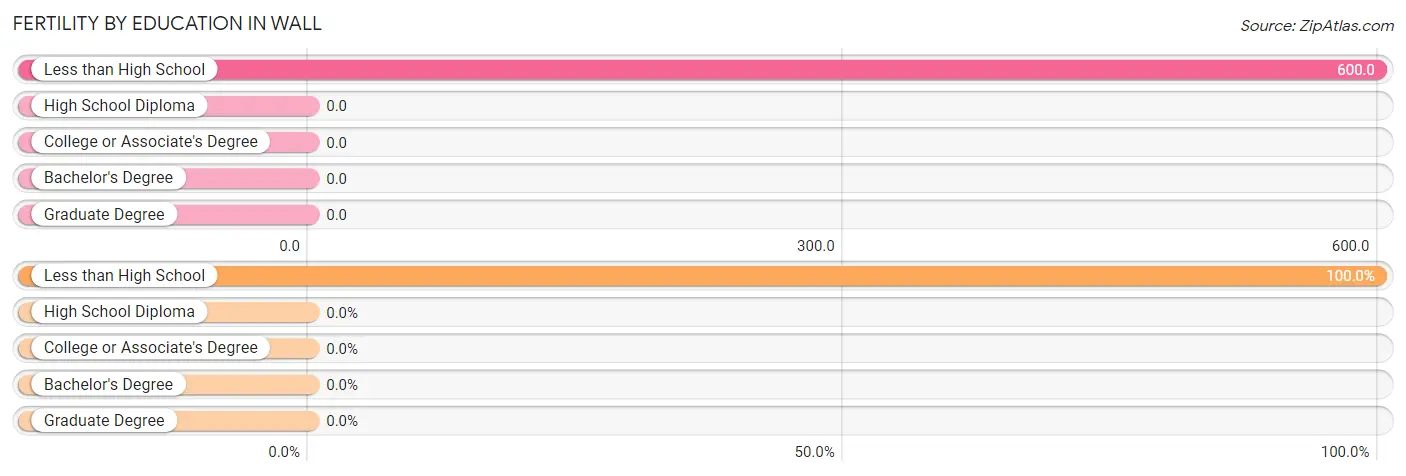
| Educational Attainment | Women with Births | Births / 1,000 Women |
| Less than High School | 3 (100.0%) | 600.0 |
| High School Diploma | 0 (0.0%) | 0.0 |
| College or Associate's Degree | 0 (0.0%) | 0.0 |
| Bachelor's Degree | 0 (0.0%) | 0.0 |
| Graduate Degree | 0 (0.0%) | 0.0 |
| Total | 3 (100.0%) | 25.0 |
Fertility by Education by Marriage Status in Wall
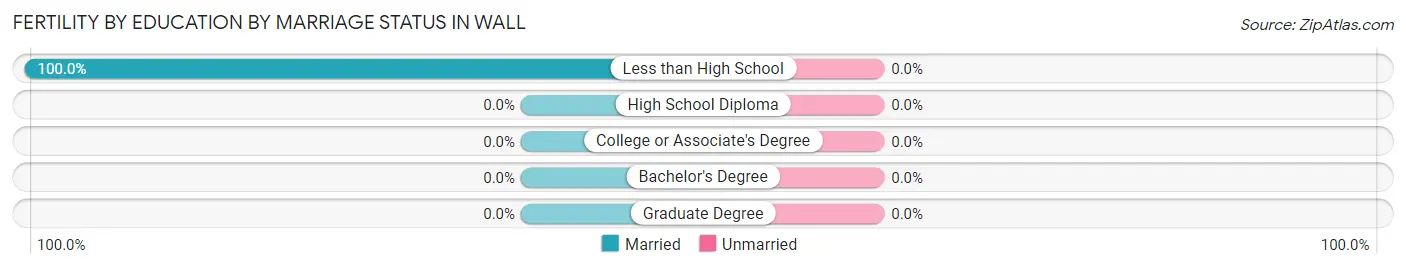
| Educational Attainment | Married | Unmarried |
| Less than High School | 3 (100.0%) | 0 (0.0%) |
| High School Diploma | 0 (0.0%) | 0 (0.0%) |
| College or Associate's Degree | 0 (0.0%) | 0 (0.0%) |
| Bachelor's Degree | 0 (0.0%) | 0 (0.0%) |
| Graduate Degree | 0 (0.0%) | 0 (0.0%) |
| Total | 3 (100.0%) | 0 (0.0%) |
Employment Characteristics in Wall
Employment by Class of Employer in Wall
Among the 299 employed individuals in Wall, private company employees (160 | 53.5%), not-for-profit organizations (63 | 21.1%), and local government employees (21 | 7.0%) make up the most common classes of employment.
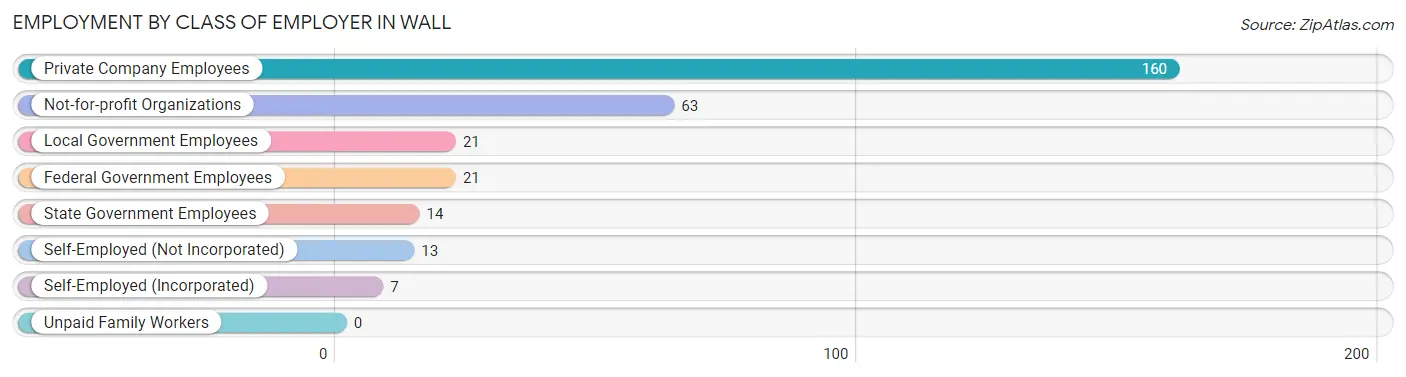
| Employer Class | # Employees | % Employees |
| Private Company Employees | 160 | 53.5% |
| Self-Employed (Incorporated) | 7 | 2.3% |
| Self-Employed (Not Incorporated) | 13 | 4.3% |
| Not-for-profit Organizations | 63 | 21.1% |
| Local Government Employees | 21 | 7.0% |
| State Government Employees | 14 | 4.7% |
| Federal Government Employees | 21 | 7.0% |
| Unpaid Family Workers | 0 | 0.0% |
| Total | 299 | 100.0% |
Employment Status by Age in Wall
According to the labor force statistics for Wall, out of the total population over 16 years of age (522), 57.7% or 301 individuals are in the labor force, with 0.7% or 2 of them unemployed. The age group with the highest labor force participation rate is 45 to 54 years, with 100.0% or 87 individuals in the labor force. Within the labor force, the 45 to 54 years age range has the highest percentage of unemployed individuals, with 2.3% or 2 of them being unemployed.
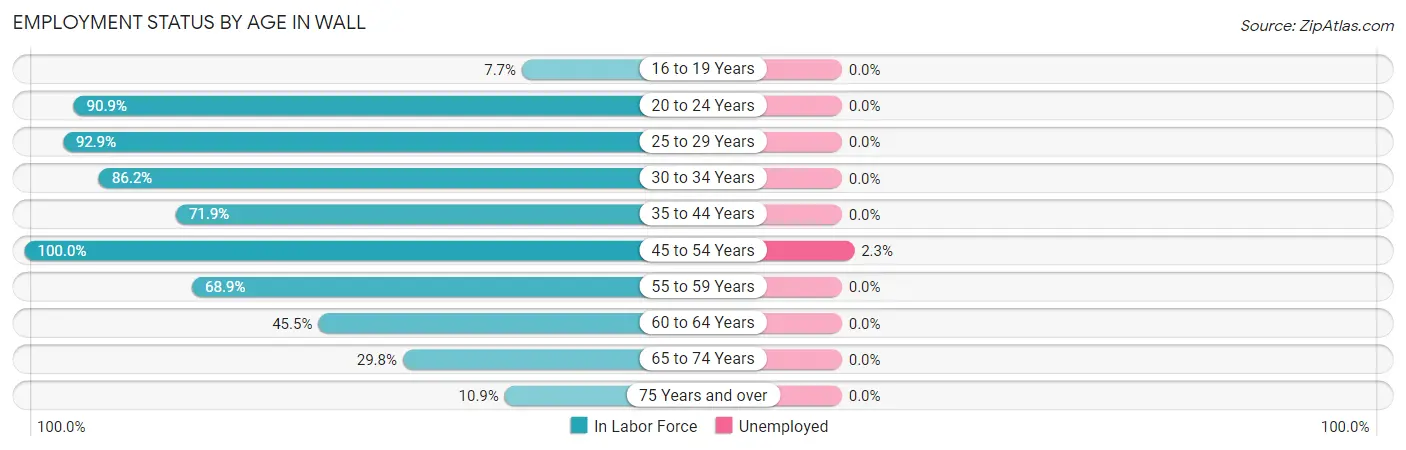
| Age Bracket | In Labor Force | Unemployed |
| 16 to 19 Years | 3 (7.7%) | 0 (0.0%) |
| 20 to 24 Years | 20 (90.9%) | 0 (0.0%) |
| 25 to 29 Years | 26 (92.9%) | 0 (0.0%) |
| 30 to 34 Years | 25 (86.2%) | 0 (0.0%) |
| 35 to 44 Years | 46 (71.9%) | 0 (0.0%) |
| 45 to 54 Years | 87 (100.0%) | 2 (2.3%) |
| 55 to 59 Years | 42 (68.9%) | 0 (0.0%) |
| 60 to 64 Years | 15 (45.5%) | 0 (0.0%) |
| 65 to 74 Years | 31 (29.8%) | 0 (0.0%) |
| 75 Years and over | 6 (10.9%) | 0 (0.0%) |
| Total | 301 (57.7%) | 2 (0.7%) |
Employment Status by Educational Attainment in Wall
According to labor force statistics for Wall, 79.8% of individuals (241) out of the total population between 25 and 64 years of age (302) are in the labor force, with 0.8% or 2 of them being unemployed. The group with the highest labor force participation rate are those with the educational attainment of bachelor's degree or higher, with 97.4% or 74 individuals in the labor force. Within the labor force, individuals with college / associate degree education have the highest percentage of unemployment, with 2.1% or 2 of them being unemployed.
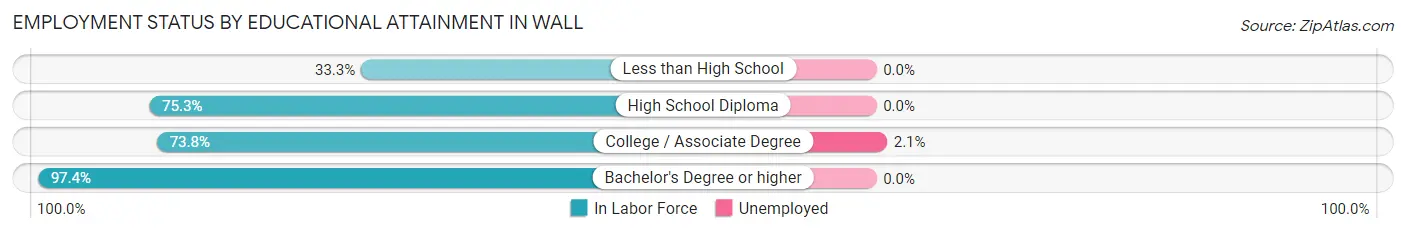
| Educational Attainment | In Labor Force | Unemployed |
| Less than High School | 1 (33.3%) | 0 (0.0%) |
| High School Diploma | 70 (75.3%) | 0 (0.0%) |
| College / Associate Degree | 96 (73.8%) | 3 (2.1%) |
| Bachelor's Degree or higher | 74 (97.4%) | 0 (0.0%) |
| Total | 241 (79.8%) | 2 (0.8%) |
Employment Occupations by Sex in Wall
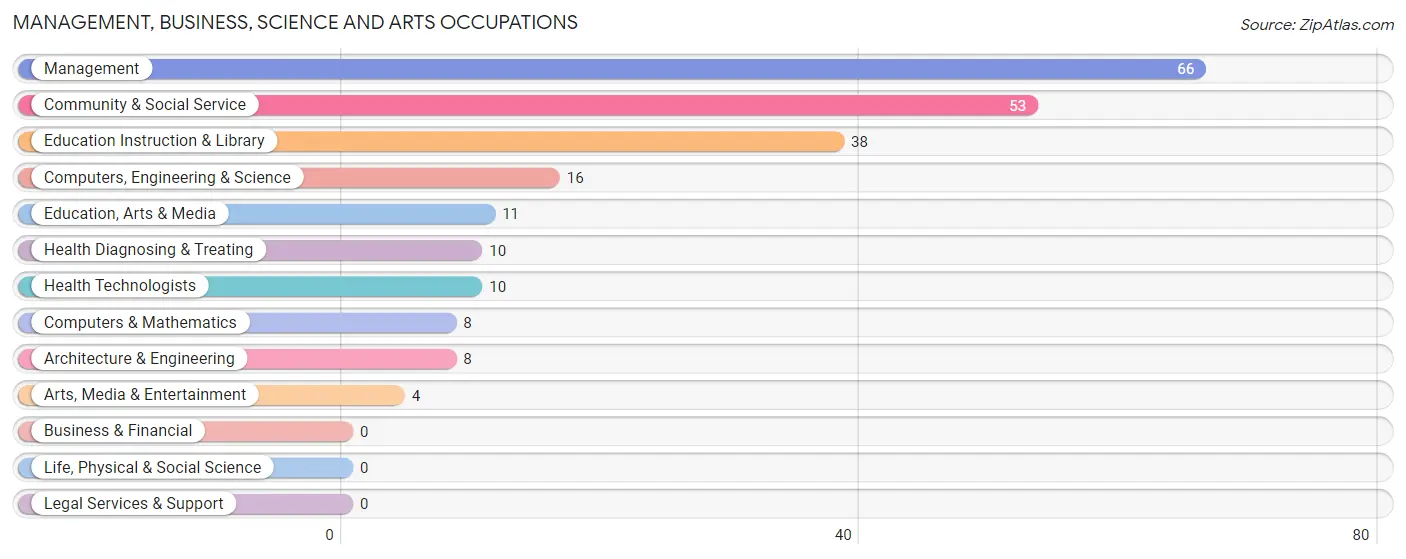
Management, Business, Science and Arts Occupations
The most common Management, Business, Science and Arts occupations in Wall are Management (66 | 22.1%), Community & Social Service (53 | 17.7%), Education Instruction & Library (38 | 12.7%), Computers, Engineering & Science (16 | 5.3%), and Education, Arts & Media (11 | 3.7%).
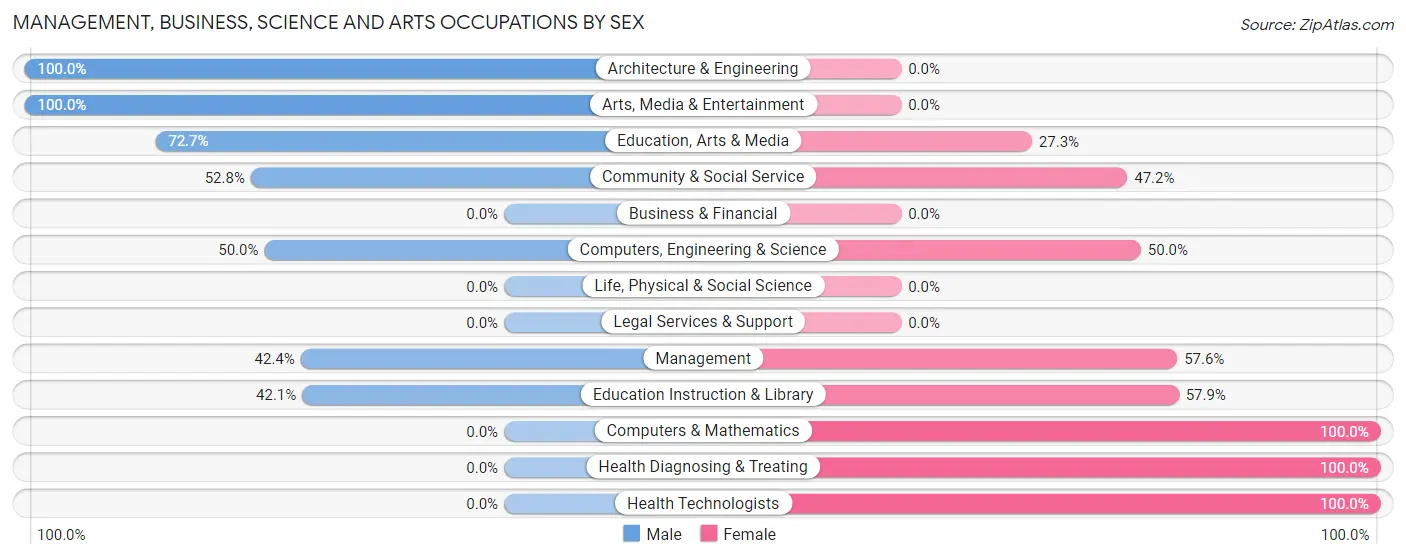
Management, Business, Science and Arts Occupations by Sex
Within the Management, Business, Science and Arts occupations in Wall, the most male-oriented occupations are Architecture & Engineering (100.0%), Arts, Media & Entertainment (100.0%), and Education, Arts & Media (72.7%), while the most female-oriented occupations are Computers & Mathematics (100.0%), Health Diagnosing & Treating (100.0%), and Health Technologists (100.0%).
| Occupation | Male | Female |
| Management | 28 (42.4%) | 38 (57.6%) |
| Business & Financial | 0 (0.0%) | 0 (0.0%) |
| Computers, Engineering & Science | 8 (50.0%) | 8 (50.0%) |
| Computers & Mathematics | 0 (0.0%) | 8 (100.0%) |
| Architecture & Engineering | 8 (100.0%) | 0 (0.0%) |
| Life, Physical & Social Science | 0 (0.0%) | 0 (0.0%) |
| Community & Social Service | 28 (52.8%) | 25 (47.2%) |
| Education, Arts & Media | 8 (72.7%) | 3 (27.3%) |
| Legal Services & Support | 0 (0.0%) | 0 (0.0%) |
| Education Instruction & Library | 16 (42.1%) | 22 (57.9%) |
| Arts, Media & Entertainment | 4 (100.0%) | 0 (0.0%) |
| Health Diagnosing & Treating | 0 (0.0%) | 10 (100.0%) |
| Health Technologists | 0 (0.0%) | 10 (100.0%) |
| Total (Category) | 64 (44.1%) | 81 (55.9%) |
| Total (Overall) | 135 (45.2%) | 164 (54.8%) |
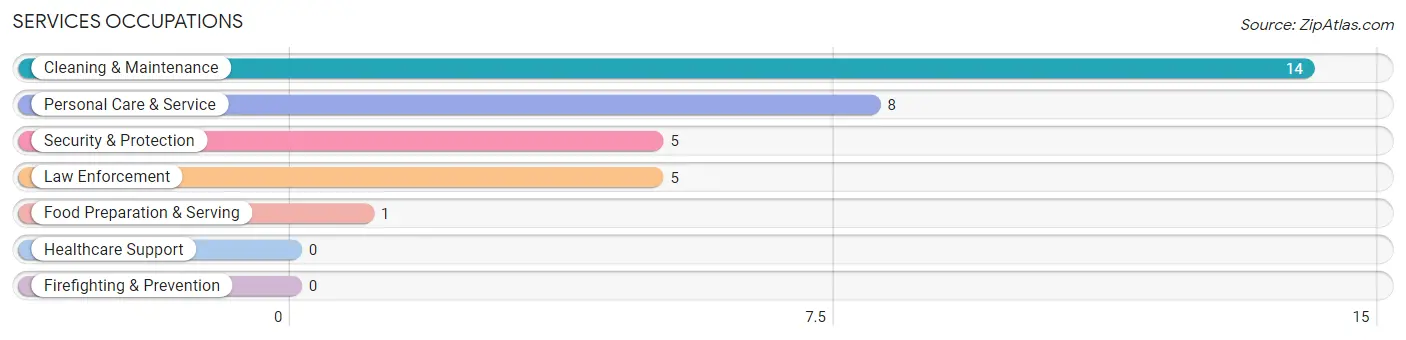
Services Occupations
The most common Services occupations in Wall are Cleaning & Maintenance (14 | 4.7%), Personal Care & Service (8 | 2.7%), Security & Protection (5 | 1.7%), Law Enforcement (5 | 1.7%), and Food Preparation & Serving (1 | 0.3%).
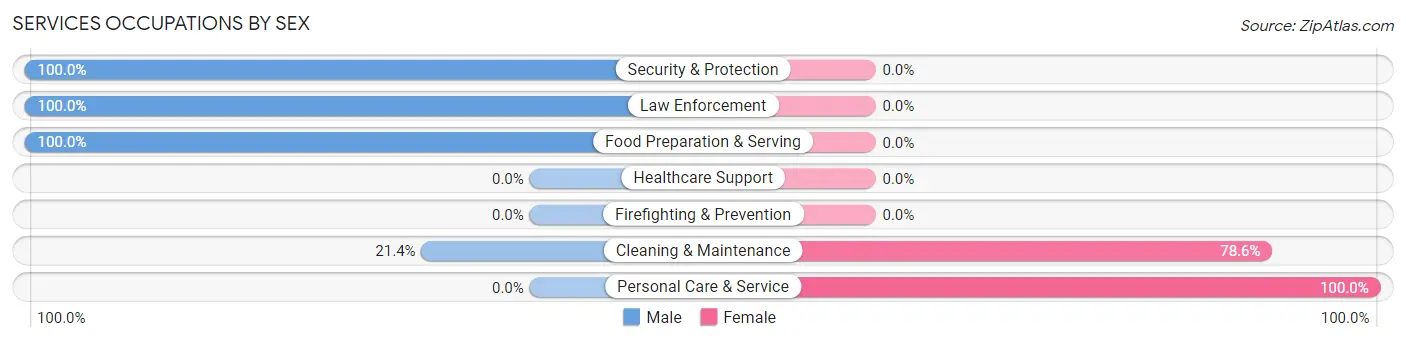
Services Occupations by Sex
Within the Services occupations in Wall, the most male-oriented occupations are Security & Protection (100.0%), Law Enforcement (100.0%), and Food Preparation & Serving (100.0%), while the most female-oriented occupations are Personal Care & Service (100.0%), and Cleaning & Maintenance (78.6%).
| Occupation | Male | Female |
| Healthcare Support | 0 (0.0%) | 0 (0.0%) |
| Security & Protection | 5 (100.0%) | 0 (0.0%) |
| Firefighting & Prevention | 0 (0.0%) | 0 (0.0%) |
| Law Enforcement | 5 (100.0%) | 0 (0.0%) |
| Food Preparation & Serving | 1 (100.0%) | 0 (0.0%) |
| Cleaning & Maintenance | 3 (21.4%) | 11 (78.6%) |
| Personal Care & Service | 0 (0.0%) | 8 (100.0%) |
| Total (Category) | 9 (32.1%) | 19 (67.9%) |
| Total (Overall) | 135 (45.2%) | 164 (54.8%) |
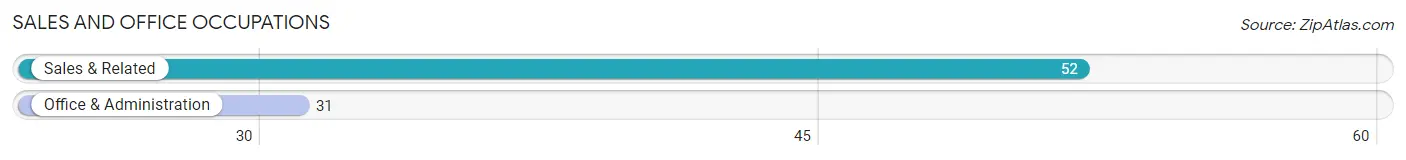
Sales and Office Occupations
The most common Sales and Office occupations in Wall are Sales & Related (52 | 17.4%), and Office & Administration (31 | 10.4%).
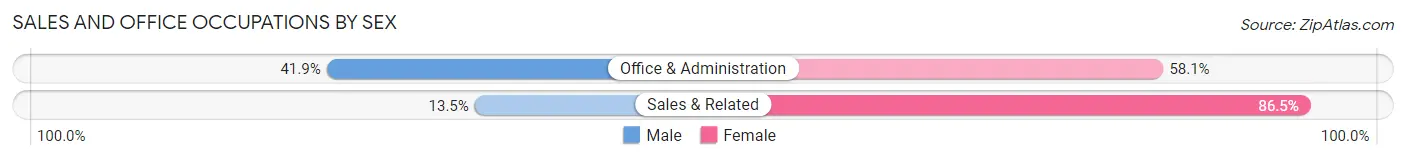
Sales and Office Occupations by Sex
| Occupation | Male | Female |
| Sales & Related | 7 (13.5%) | 45 (86.5%) |
| Office & Administration | 13 (41.9%) | 18 (58.1%) |
| Total (Category) | 20 (24.1%) | 63 (75.9%) |
| Total (Overall) | 135 (45.2%) | 164 (54.8%) |
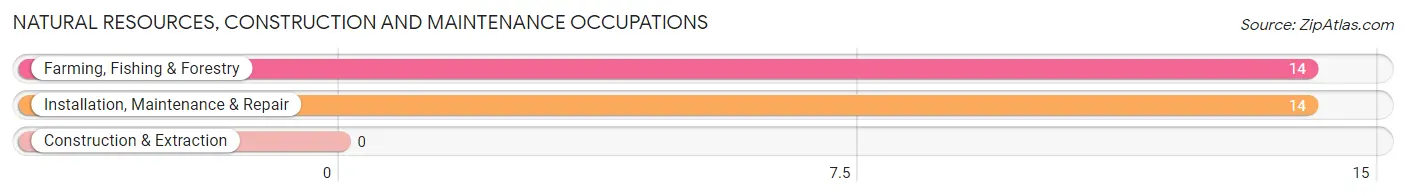
Natural Resources, Construction and Maintenance Occupations
The most common Natural Resources, Construction and Maintenance occupations in Wall are Farming, Fishing & Forestry (14 | 4.7%), and Installation, Maintenance & Repair (14 | 4.7%).
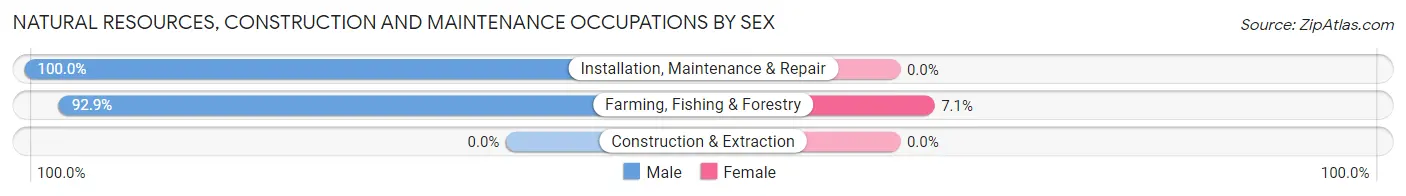
Natural Resources, Construction and Maintenance Occupations by Sex
| Occupation | Male | Female |
| Farming, Fishing & Forestry | 13 (92.9%) | 1 (7.1%) |
| Construction & Extraction | 0 (0.0%) | 0 (0.0%) |
| Installation, Maintenance & Repair | 14 (100.0%) | 0 (0.0%) |
| Total (Category) | 27 (96.4%) | 1 (3.6%) |
| Total (Overall) | 135 (45.2%) | 164 (54.8%) |
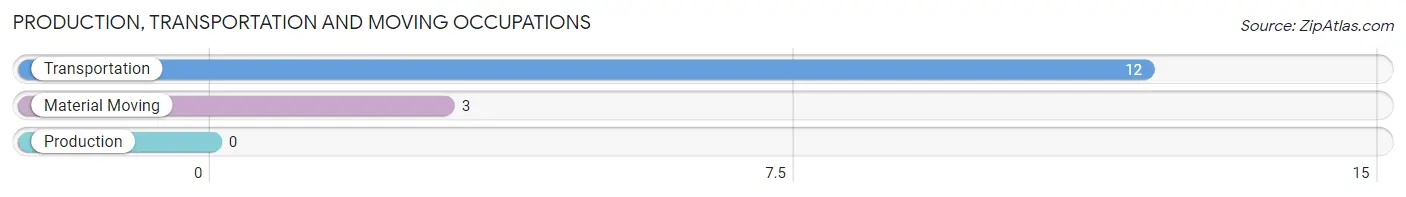
Production, Transportation and Moving Occupations
The most common Production, Transportation and Moving occupations in Wall are Transportation (12 | 4.0%), and Material Moving (3 | 1.0%).
Production, Transportation and Moving Occupations by Sex
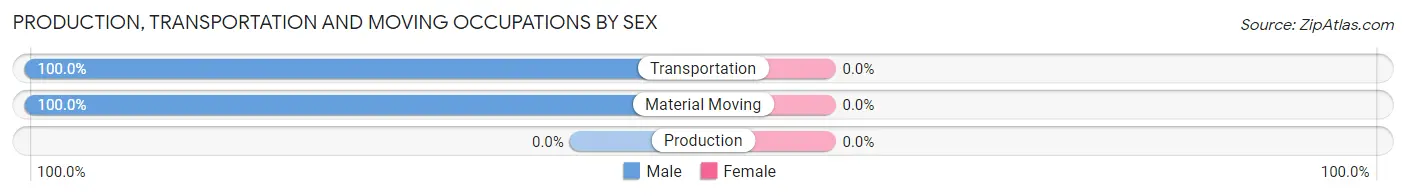
| Occupation | Male | Female |
| Production | 0 (0.0%) | 0 (0.0%) |
| Transportation | 12 (100.0%) | 0 (0.0%) |
| Material Moving | 3 (100.0%) | 0 (0.0%) |
| Total (Category) | 15 (100.0%) | 0 (0.0%) |
| Total (Overall) | 135 (45.2%) | 164 (54.8%) |
Employment Industries by Sex in Wall
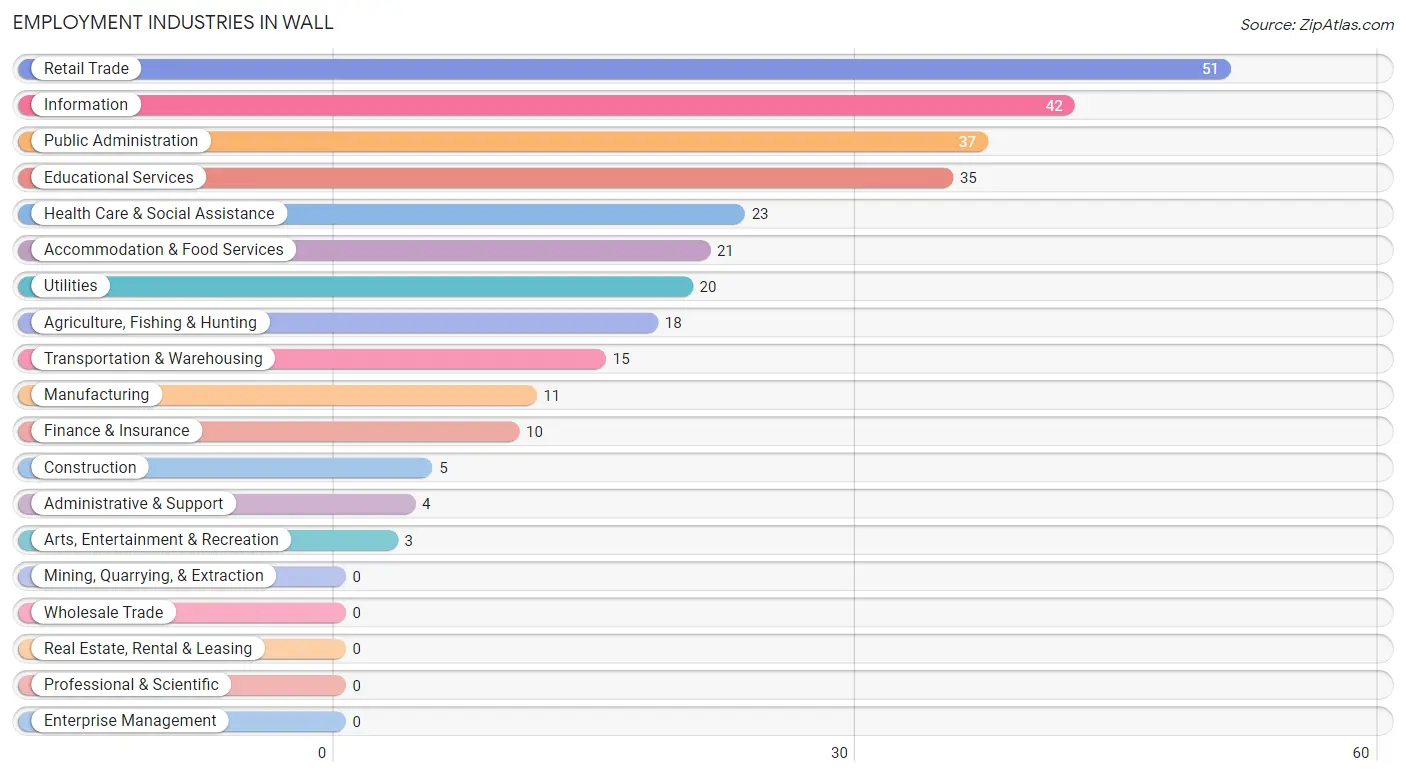
Employment Industries in Wall
The major employment industries in Wall include Retail Trade (51 | 17.1%), Information (42 | 14.1%), Public Administration (37 | 12.4%), Educational Services (35 | 11.7%), and Health Care & Social Assistance (23 | 7.7%).
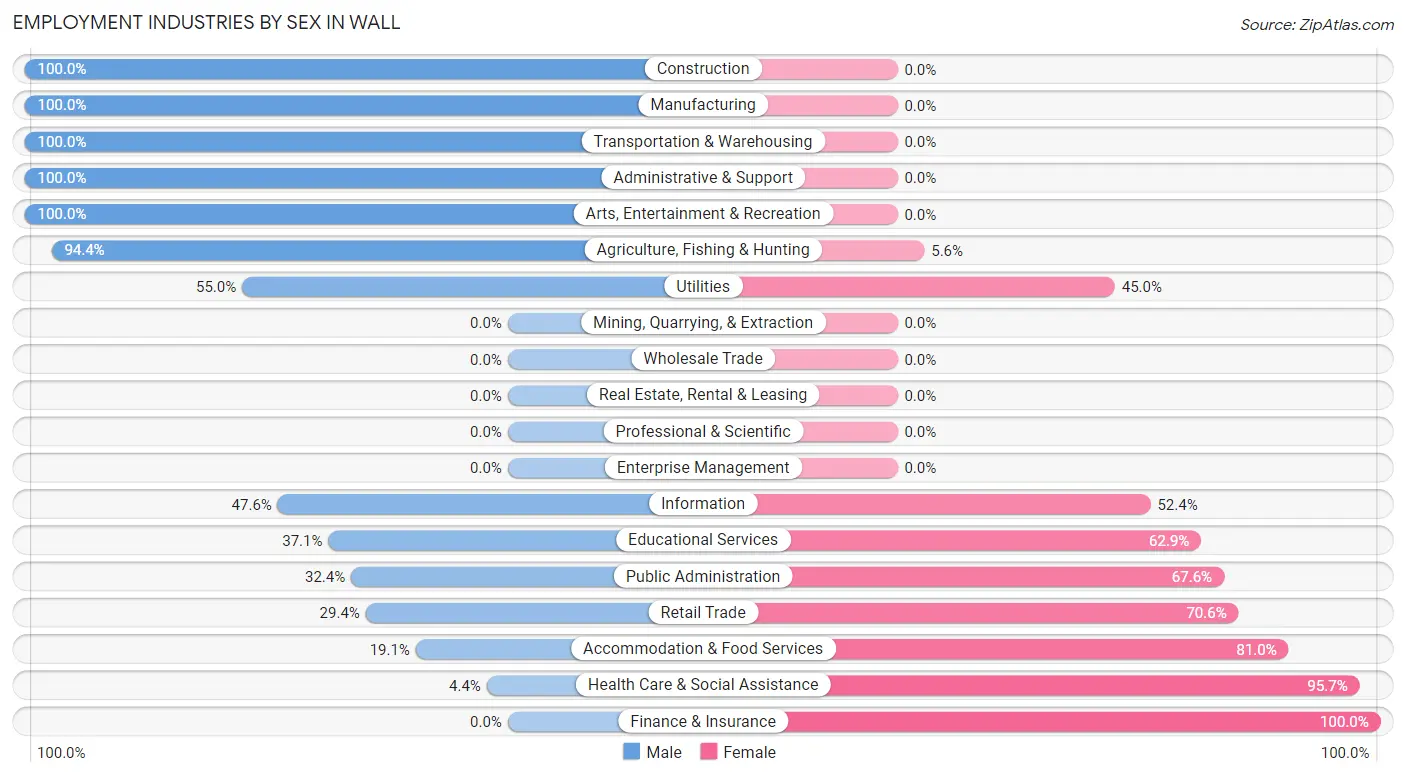
Employment Industries by Sex in Wall
The Wall industries that see more men than women are Construction (100.0%), Manufacturing (100.0%), and Transportation & Warehousing (100.0%), whereas the industries that tend to have a higher number of women are Finance & Insurance (100.0%), Health Care & Social Assistance (95.7%), and Accommodation & Food Services (80.9%).
| Industry | Male | Female |
| Agriculture, Fishing & Hunting | 17 (94.4%) | 1 (5.6%) |
| Mining, Quarrying, & Extraction | 0 (0.0%) | 0 (0.0%) |
| Construction | 5 (100.0%) | 0 (0.0%) |
| Manufacturing | 11 (100.0%) | 0 (0.0%) |
| Wholesale Trade | 0 (0.0%) | 0 (0.0%) |
| Retail Trade | 15 (29.4%) | 36 (70.6%) |
| Transportation & Warehousing | 15 (100.0%) | 0 (0.0%) |
| Utilities | 11 (55.0%) | 9 (45.0%) |
| Information | 20 (47.6%) | 22 (52.4%) |
| Finance & Insurance | 0 (0.0%) | 10 (100.0%) |
| Real Estate, Rental & Leasing | 0 (0.0%) | 0 (0.0%) |
| Professional & Scientific | 0 (0.0%) | 0 (0.0%) |
| Enterprise Management | 0 (0.0%) | 0 (0.0%) |
| Administrative & Support | 4 (100.0%) | 0 (0.0%) |
| Educational Services | 13 (37.1%) | 22 (62.9%) |
| Health Care & Social Assistance | 1 (4.3%) | 22 (95.7%) |
| Arts, Entertainment & Recreation | 3 (100.0%) | 0 (0.0%) |
| Accommodation & Food Services | 4 (19.1%) | 17 (80.9%) |
| Public Administration | 12 (32.4%) | 25 (67.6%) |
| Total | 135 (45.2%) | 164 (54.8%) |
Education in Wall
School Enrollment in Wall
The most common levels of schooling among the 129 students in Wall are elementary school (41 | 31.8%), middle school (35 | 27.1%), and high school (30 | 23.3%).
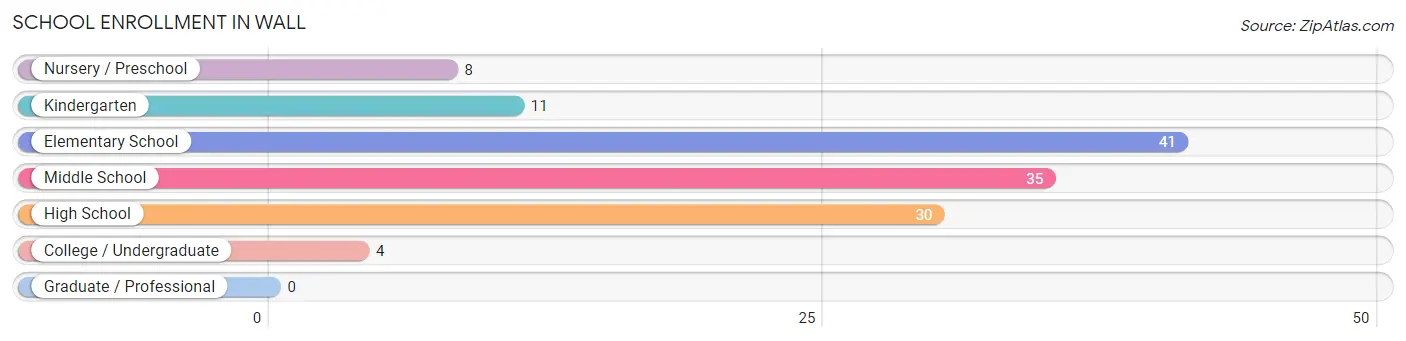
| School Level | # Students | % Students |
| Nursery / Preschool | 8 | 6.2% |
| Kindergarten | 11 | 8.5% |
| Elementary School | 41 | 31.8% |
| Middle School | 35 | 27.1% |
| High School | 30 | 23.3% |
| College / Undergraduate | 4 | 3.1% |
| Graduate / Professional | 0 | 0.0% |
| Total | 129 | 100.0% |
School Enrollment by Age by Funding Source in Wall
Out of a total of 129 students who are enrolled in schools in Wall, 6 (4.7%) attend a private institution, while the remaining 123 (95.3%) are enrolled in public schools. The age group of 10 to 14 year olds has the highest likelihood of being enrolled in private schools, with 6 (10.7% in the age bracket) enrolled. Conversely, the age group of 5 to 9 year old has the lowest likelihood of being enrolled in a private school, with 39 (100.0% in the age bracket) attending a public institution.
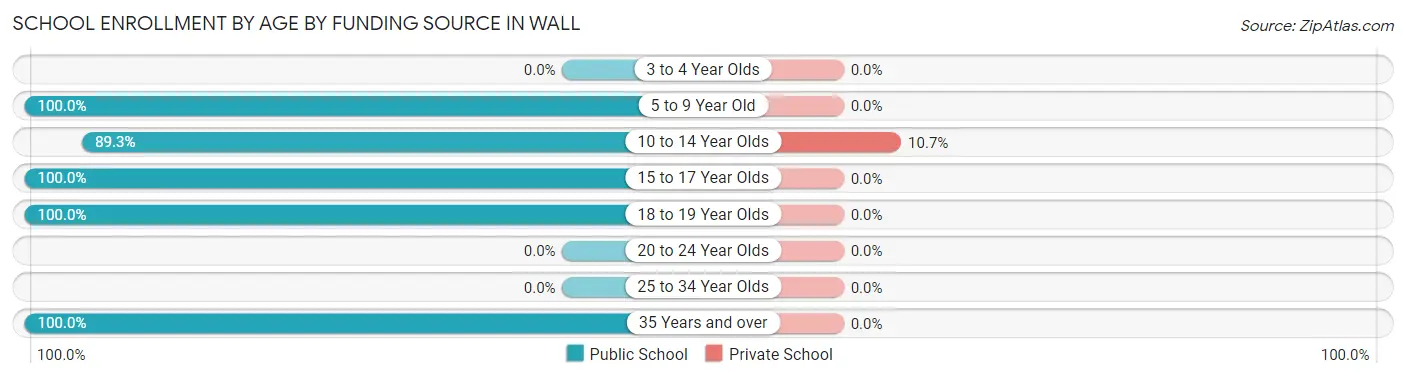
| Age Bracket | Public School | Private School |
| 3 to 4 Year Olds | 0 (0.0%) | 0 (0.0%) |
| 5 to 9 Year Old | 39 (100.0%) | 0 (0.0%) |
| 10 to 14 Year Olds | 50 (89.3%) | 6 (10.7%) |
| 15 to 17 Year Olds | 15 (100.0%) | 0 (0.0%) |
| 18 to 19 Year Olds | 15 (100.0%) | 0 (0.0%) |
| 20 to 24 Year Olds | 0 (0.0%) | 0 (0.0%) |
| 25 to 34 Year Olds | 0 (0.0%) | 0 (0.0%) |
| 35 Years and over | 4 (100.0%) | 0 (0.0%) |
| Total | 123 (95.3%) | 6 (4.7%) |
Educational Attainment by Field of Study in Wall
Arts & humanities (34 | 28.1%), education (32 | 26.5%), business (26 | 21.5%), science & technology (10 | 8.3%), and bio, nature & agricultural (6 | 5.0%) are the most common fields of study among 121 individuals in Wall who have obtained a bachelor's degree or higher.
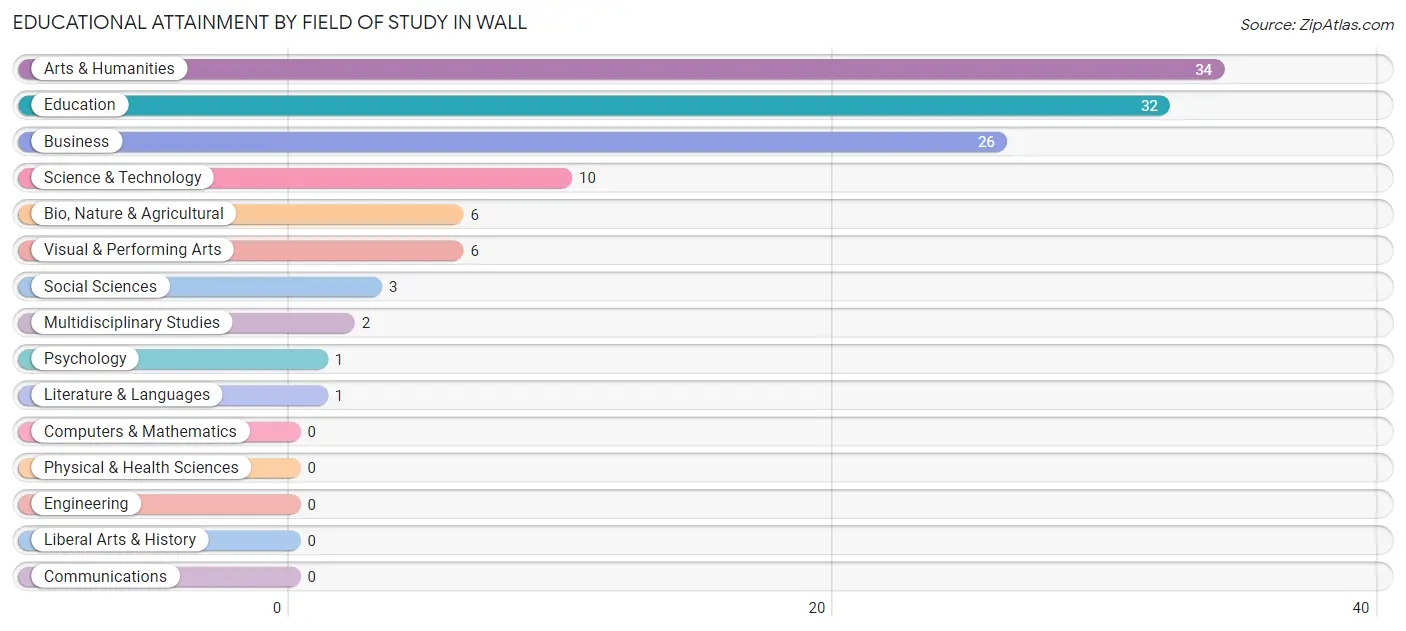
| Field of Study | # Graduates | % Graduates |
| Computers & Mathematics | 0 | 0.0% |
| Bio, Nature & Agricultural | 6 | 5.0% |
| Physical & Health Sciences | 0 | 0.0% |
| Psychology | 1 | 0.8% |
| Social Sciences | 3 | 2.5% |
| Engineering | 0 | 0.0% |
| Multidisciplinary Studies | 2 | 1.7% |
| Science & Technology | 10 | 8.3% |
| Business | 26 | 21.5% |
| Education | 32 | 26.5% |
| Literature & Languages | 1 | 0.8% |
| Liberal Arts & History | 0 | 0.0% |
| Visual & Performing Arts | 6 | 5.0% |
| Communications | 0 | 0.0% |
| Arts & Humanities | 34 | 28.1% |
| Total | 121 | 100.0% |
Transportation & Commute in Wall
Vehicle Availability by Sex in Wall
The most prevalent vehicle ownership categories in Wall are males with 2 vehicles (56, accounting for 43.1%) and females with 2 vehicles (53, making up 34.4%).
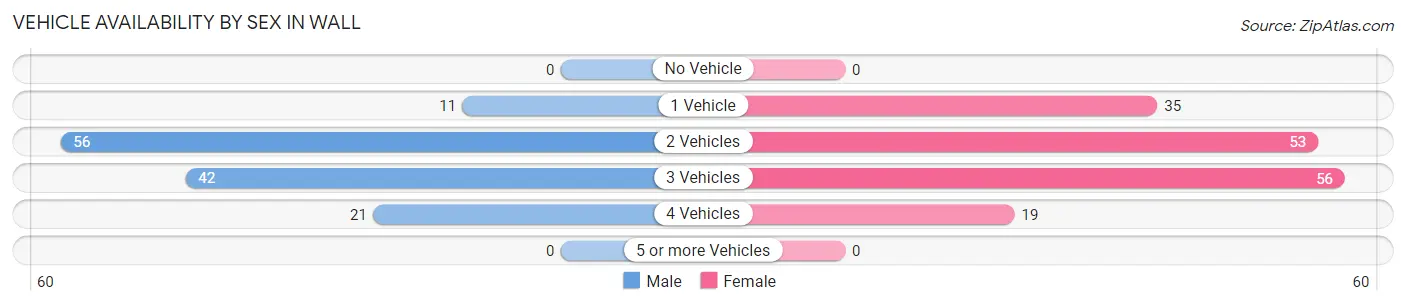
| Vehicles Available | Male | Female |
| No Vehicle | 0 (0.0%) | 0 (0.0%) |
| 1 Vehicle | 11 (8.5%) | 35 (21.5%) |
| 2 Vehicles | 56 (43.1%) | 53 (32.5%) |
| 3 Vehicles | 42 (32.3%) | 56 (34.4%) |
| 4 Vehicles | 21 (16.2%) | 19 (11.7%) |
| 5 or more Vehicles | 0 (0.0%) | 0 (0.0%) |
| Total | 130 (100.0%) | 163 (100.0%) |
Commute Time in Wall
The most frequently occuring commute durations in Wall are 5 to 9 minutes (104 commuters, 36.4%), less than 5 minutes (44 commuters, 15.4%), and 45 to 59 minutes (33 commuters, 11.5%).
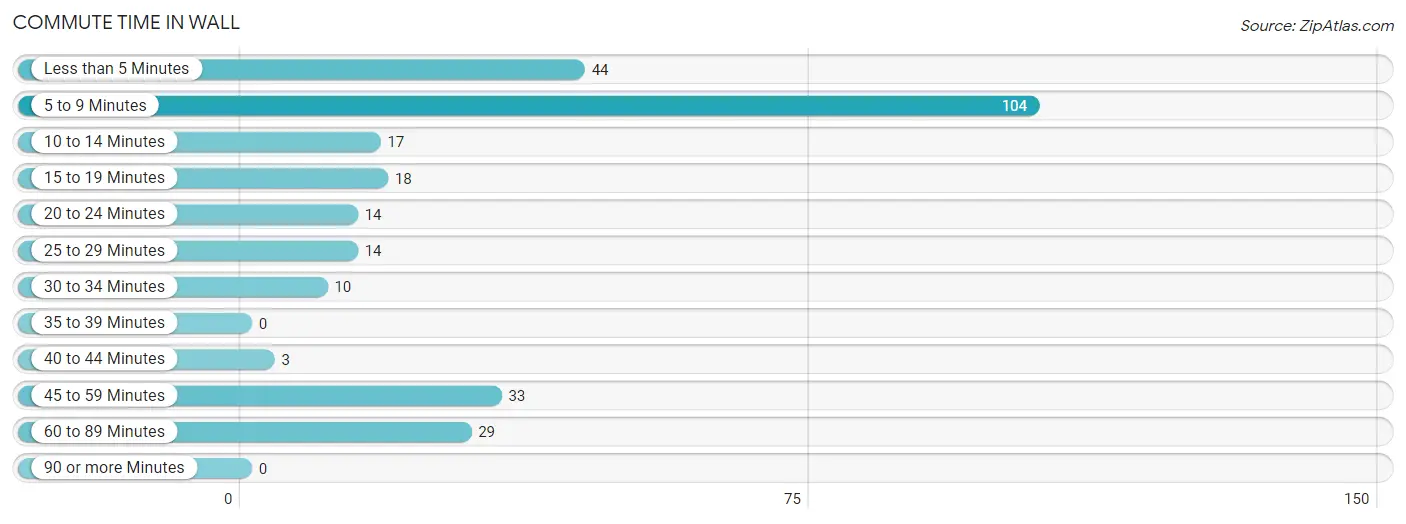
| Commute Time | # Commuters | % Commuters |
| Less than 5 Minutes | 44 | 15.4% |
| 5 to 9 Minutes | 104 | 36.4% |
| 10 to 14 Minutes | 17 | 5.9% |
| 15 to 19 Minutes | 18 | 6.3% |
| 20 to 24 Minutes | 14 | 4.9% |
| 25 to 29 Minutes | 14 | 4.9% |
| 30 to 34 Minutes | 10 | 3.5% |
| 35 to 39 Minutes | 0 | 0.0% |
| 40 to 44 Minutes | 3 | 1.1% |
| 45 to 59 Minutes | 33 | 11.5% |
| 60 to 89 Minutes | 29 | 10.1% |
| 90 or more Minutes | 0 | 0.0% |
Commute Time by Sex in Wall
The most common commute times in Wall are 5 to 9 minutes (45 commuters, 35.7%) for males and 5 to 9 minutes (59 commuters, 36.9%) for females.
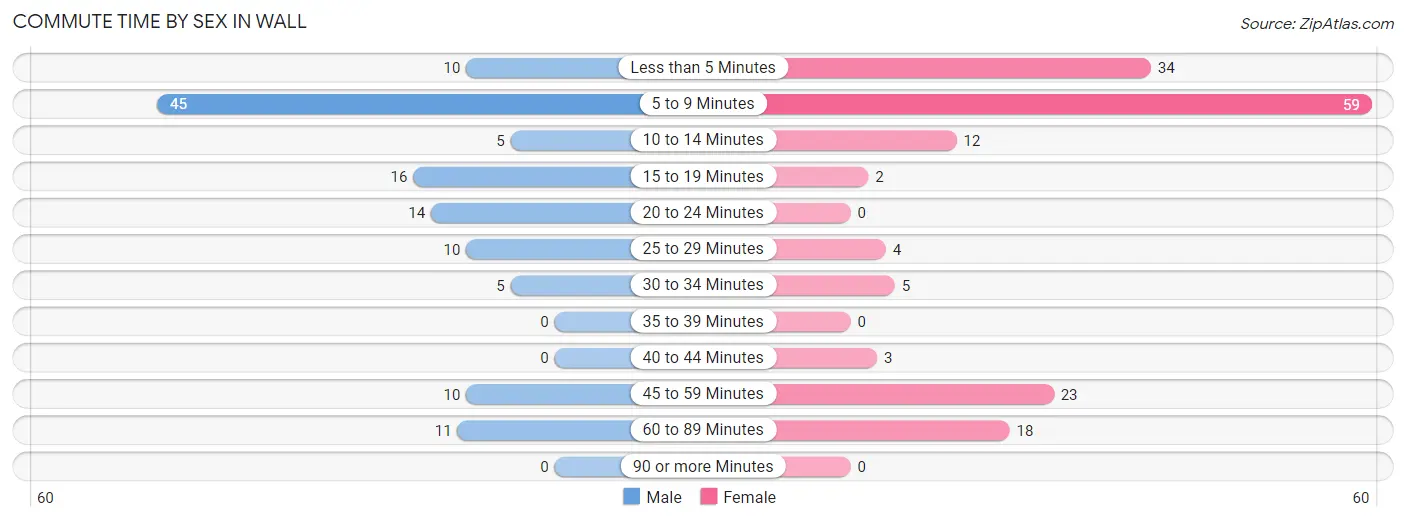
| Commute Time | Male | Female |
| Less than 5 Minutes | 10 (7.9%) | 34 (21.2%) |
| 5 to 9 Minutes | 45 (35.7%) | 59 (36.9%) |
| 10 to 14 Minutes | 5 (4.0%) | 12 (7.5%) |
| 15 to 19 Minutes | 16 (12.7%) | 2 (1.3%) |
| 20 to 24 Minutes | 14 (11.1%) | 0 (0.0%) |
| 25 to 29 Minutes | 10 (7.9%) | 4 (2.5%) |
| 30 to 34 Minutes | 5 (4.0%) | 5 (3.1%) |
| 35 to 39 Minutes | 0 (0.0%) | 0 (0.0%) |
| 40 to 44 Minutes | 0 (0.0%) | 3 (1.9%) |
| 45 to 59 Minutes | 10 (7.9%) | 23 (14.4%) |
| 60 to 89 Minutes | 11 (8.7%) | 18 (11.3%) |
| 90 or more Minutes | 0 (0.0%) | 0 (0.0%) |
Time of Departure to Work by Sex in Wall
The most frequent times of departure to work in Wall are 7:30 AM to 7:59 AM (49, 38.9%) for males and 7:30 AM to 7:59 AM (40, 25.0%) for females.
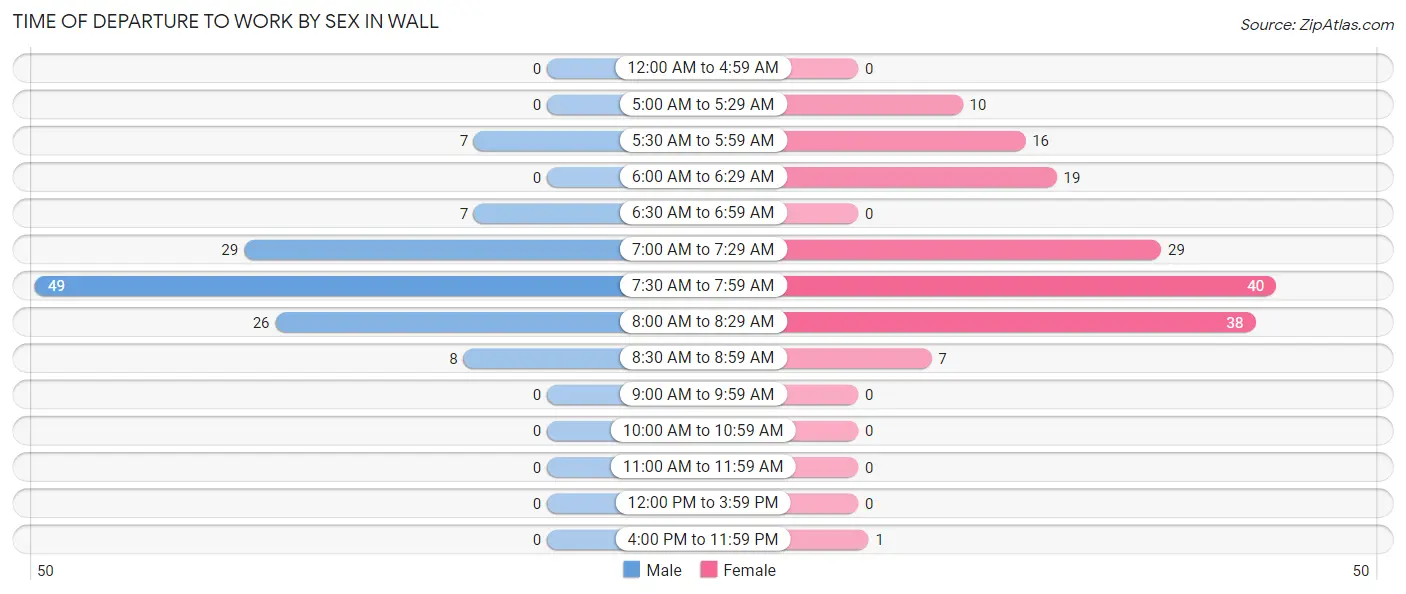
| Time of Departure | Male | Female |
| 12:00 AM to 4:59 AM | 0 (0.0%) | 0 (0.0%) |
| 5:00 AM to 5:29 AM | 0 (0.0%) | 10 (6.2%) |
| 5:30 AM to 5:59 AM | 7 (5.6%) | 16 (10.0%) |
| 6:00 AM to 6:29 AM | 0 (0.0%) | 19 (11.9%) |
| 6:30 AM to 6:59 AM | 7 (5.6%) | 0 (0.0%) |
| 7:00 AM to 7:29 AM | 29 (23.0%) | 29 (18.1%) |
| 7:30 AM to 7:59 AM | 49 (38.9%) | 40 (25.0%) |
| 8:00 AM to 8:29 AM | 26 (20.6%) | 38 (23.7%) |
| 8:30 AM to 8:59 AM | 8 (6.4%) | 7 (4.4%) |
| 9:00 AM to 9:59 AM | 0 (0.0%) | 0 (0.0%) |
| 10:00 AM to 10:59 AM | 0 (0.0%) | 0 (0.0%) |
| 11:00 AM to 11:59 AM | 0 (0.0%) | 0 (0.0%) |
| 12:00 PM to 3:59 PM | 0 (0.0%) | 0 (0.0%) |
| 4:00 PM to 11:59 PM | 0 (0.0%) | 1 (0.6%) |
| Total | 126 (100.0%) | 160 (100.0%) |
Housing Occupancy in Wall
Occupancy by Ownership in Wall
Of the total 272 dwellings in Wall, owner-occupied units account for 220 (80.9%), while renter-occupied units make up 52 (19.1%).
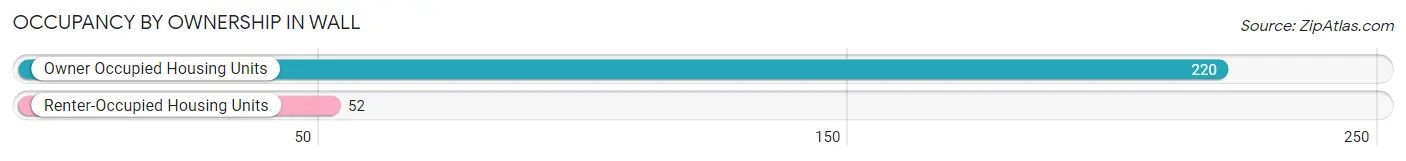
| Occupancy | # Housing Units | % Housing Units |
| Owner Occupied Housing Units | 220 | 80.9% |
| Renter-Occupied Housing Units | 52 | 19.1% |
| Total Occupied Housing Units | 272 | 100.0% |
Occupancy by Household Size in Wall
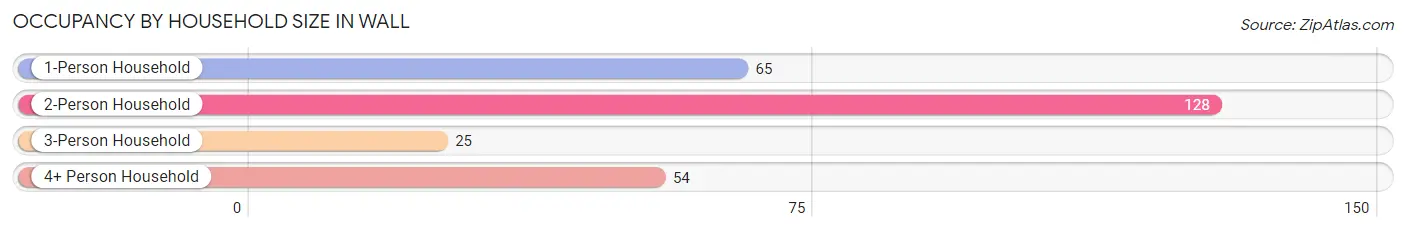
| Household Size | # Housing Units | % Housing Units |
| 1-Person Household | 65 | 23.9% |
| 2-Person Household | 128 | 47.1% |
| 3-Person Household | 25 | 9.2% |
| 4+ Person Household | 54 | 19.9% |
| Total Housing Units | 272 | 100.0% |
Occupancy by Ownership by Household Size in Wall
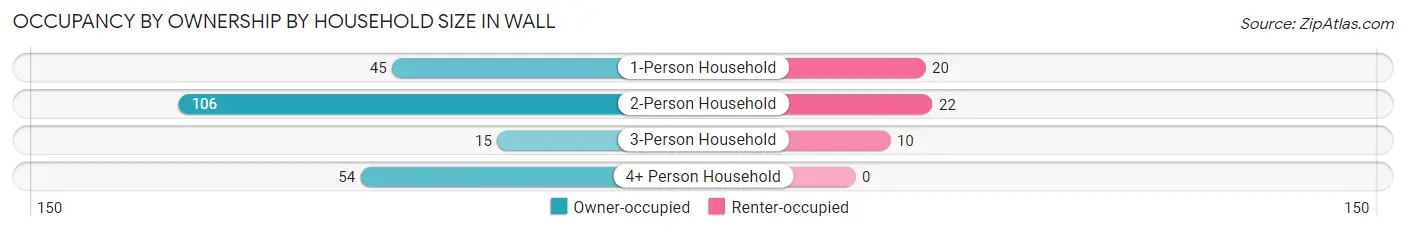
| Household Size | Owner-occupied | Renter-occupied |
| 1-Person Household | 45 (69.2%) | 20 (30.8%) |
| 2-Person Household | 106 (82.8%) | 22 (17.2%) |
| 3-Person Household | 15 (60.0%) | 10 (40.0%) |
| 4+ Person Household | 54 (100.0%) | 0 (0.0%) |
| Total Housing Units | 220 (80.9%) | 52 (19.1%) |
Occupancy by Educational Attainment in Wall
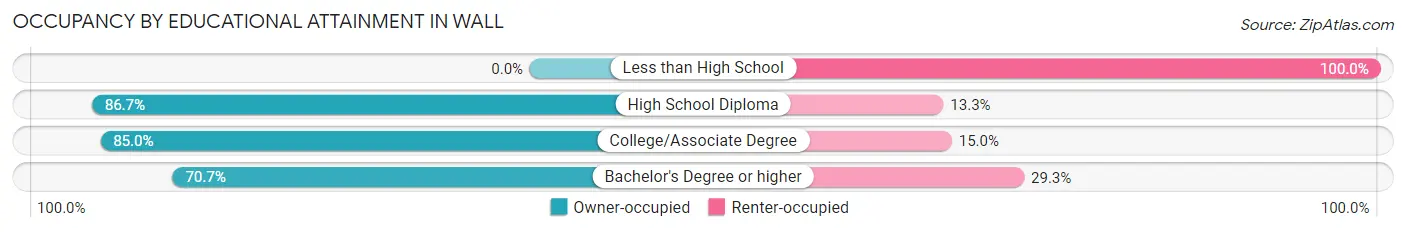
| Household Size | Owner-occupied | Renter-occupied |
| Less than High School | 0 (0.0%) | 2 (100.0%) |
| High School Diploma | 65 (86.7%) | 10 (13.3%) |
| College/Associate Degree | 102 (85.0%) | 18 (15.0%) |
| Bachelor's Degree or higher | 53 (70.7%) | 22 (29.3%) |
Occupancy by Age of Householder in Wall
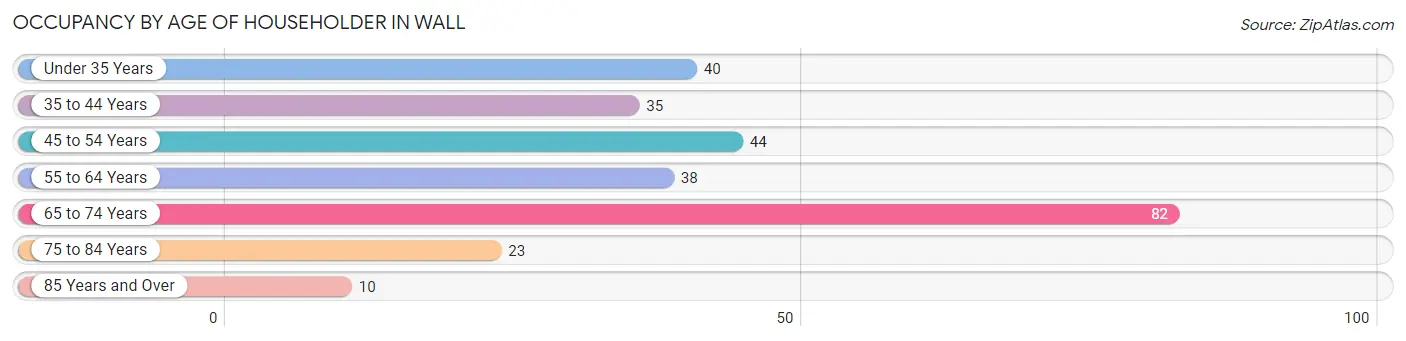
| Age Bracket | # Households | % Households |
| Under 35 Years | 40 | 14.7% |
| 35 to 44 Years | 35 | 12.9% |
| 45 to 54 Years | 44 | 16.2% |
| 55 to 64 Years | 38 | 14.0% |
| 65 to 74 Years | 82 | 30.1% |
| 75 to 84 Years | 23 | 8.5% |
| 85 Years and Over | 10 | 3.7% |
| Total | 272 | 100.0% |
Housing Finances in Wall
Median Income by Occupancy in Wall
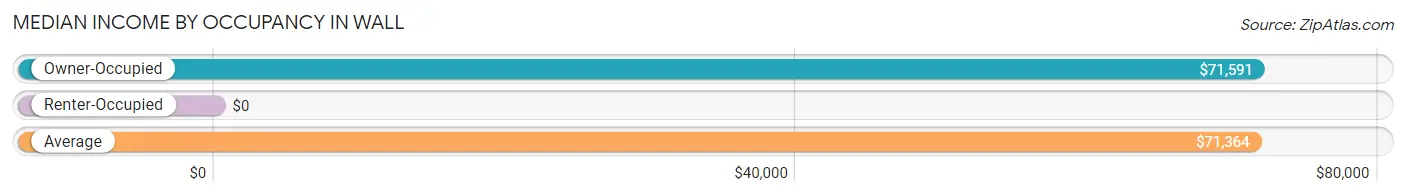
| Occupancy Type | # Households | Median Income |
| Owner-Occupied | 220 (80.9%) | $71,591 |
| Renter-Occupied | 52 (19.1%) | $0 |
| Average | 272 (100.0%) | $71,364 |
Occupancy by Householder Income Bracket in Wall
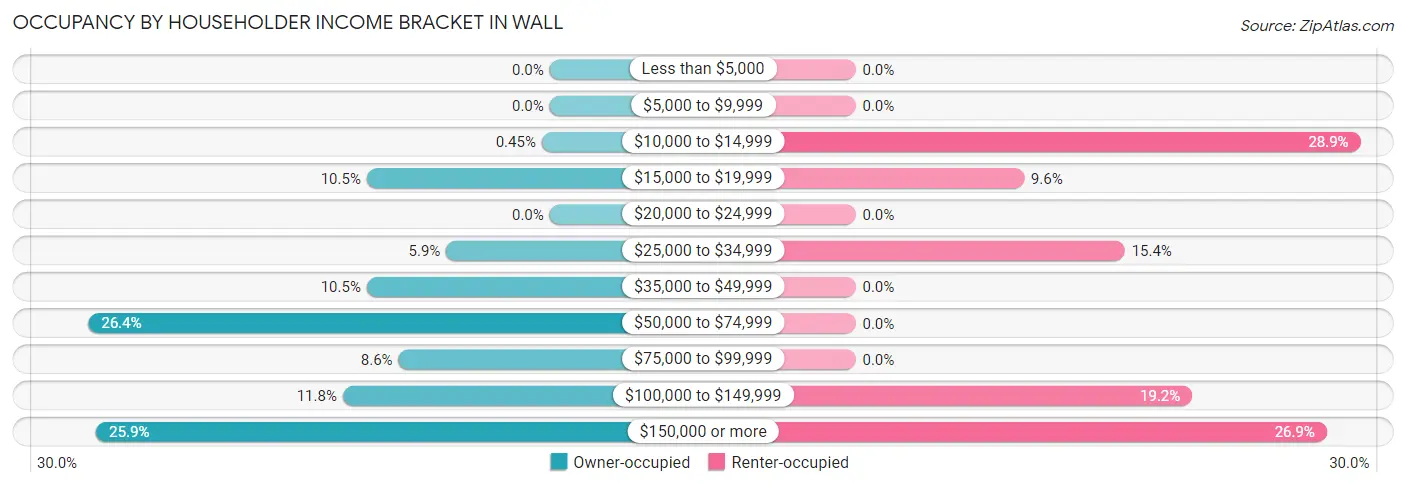
| Income Bracket | Owner-occupied | Renter-occupied |
| Less than $5,000 | 0 (0.0%) | 0 (0.0%) |
| $5,000 to $9,999 | 0 (0.0%) | 0 (0.0%) |
| $10,000 to $14,999 | 1 (0.4%) | 15 (28.8%) |
| $15,000 to $19,999 | 23 (10.4%) | 5 (9.6%) |
| $20,000 to $24,999 | 0 (0.0%) | 0 (0.0%) |
| $25,000 to $34,999 | 13 (5.9%) | 8 (15.4%) |
| $35,000 to $49,999 | 23 (10.4%) | 0 (0.0%) |
| $50,000 to $74,999 | 58 (26.4%) | 0 (0.0%) |
| $75,000 to $99,999 | 19 (8.6%) | 0 (0.0%) |
| $100,000 to $149,999 | 26 (11.8%) | 10 (19.2%) |
| $150,000 or more | 57 (25.9%) | 14 (26.9%) |
| Total | 220 (100.0%) | 52 (100.0%) |
Monthly Housing Cost Tiers in Wall
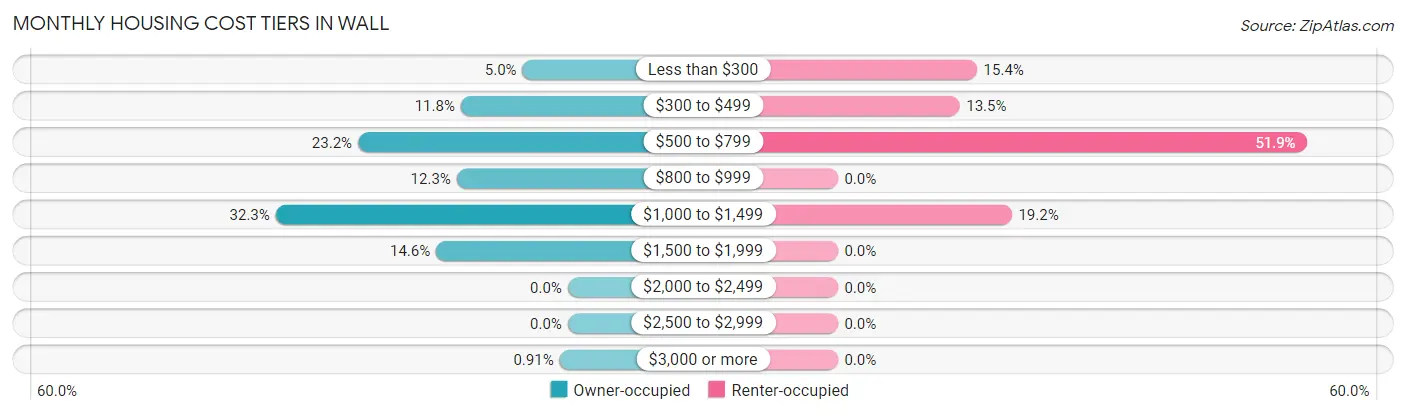
| Monthly Cost | Owner-occupied | Renter-occupied |
| Less than $300 | 11 (5.0%) | 8 (15.4%) |
| $300 to $499 | 26 (11.8%) | 7 (13.5%) |
| $500 to $799 | 51 (23.2%) | 27 (51.9%) |
| $800 to $999 | 27 (12.3%) | 0 (0.0%) |
| $1,000 to $1,499 | 71 (32.3%) | 10 (19.2%) |
| $1,500 to $1,999 | 32 (14.5%) | 0 (0.0%) |
| $2,000 to $2,499 | 0 (0.0%) | 0 (0.0%) |
| $2,500 to $2,999 | 0 (0.0%) | 0 (0.0%) |
| $3,000 or more | 2 (0.9%) | 0 (0.0%) |
| Total | 220 (100.0%) | 52 (100.0%) |
Physical Housing Characteristics in Wall
Housing Structures in Wall
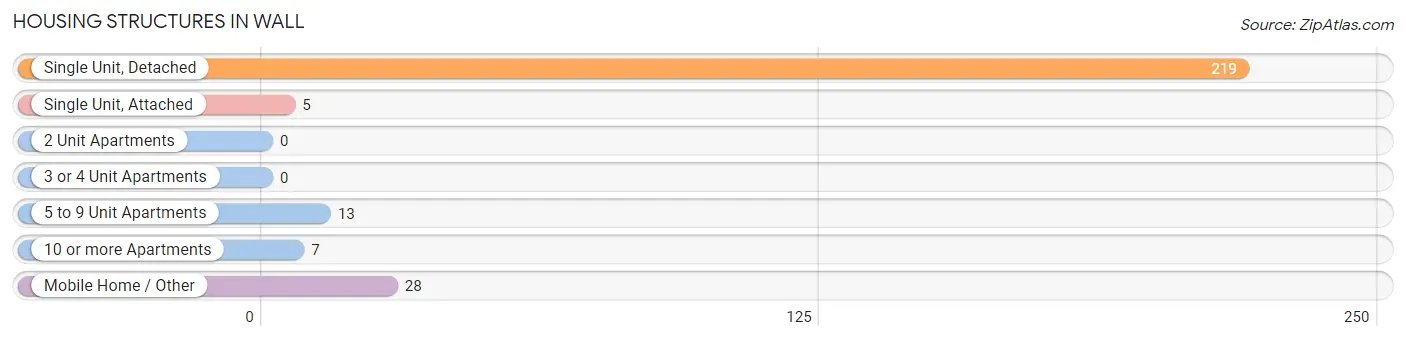
| Structure Type | # Housing Units | % Housing Units |
| Single Unit, Detached | 219 | 80.5% |
| Single Unit, Attached | 5 | 1.8% |
| 2 Unit Apartments | 0 | 0.0% |
| 3 or 4 Unit Apartments | 0 | 0.0% |
| 5 to 9 Unit Apartments | 13 | 4.8% |
| 10 or more Apartments | 7 | 2.6% |
| Mobile Home / Other | 28 | 10.3% |
| Total | 272 | 100.0% |
Housing Structures by Occupancy in Wall
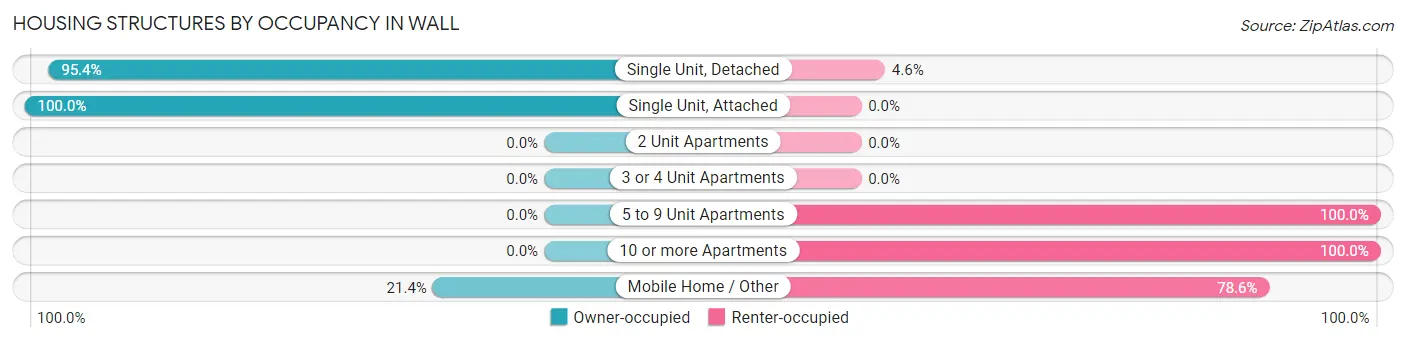
| Structure Type | Owner-occupied | Renter-occupied |
| Single Unit, Detached | 209 (95.4%) | 10 (4.6%) |
| Single Unit, Attached | 5 (100.0%) | 0 (0.0%) |
| 2 Unit Apartments | 0 (0.0%) | 0 (0.0%) |
| 3 or 4 Unit Apartments | 0 (0.0%) | 0 (0.0%) |
| 5 to 9 Unit Apartments | 0 (0.0%) | 13 (100.0%) |
| 10 or more Apartments | 0 (0.0%) | 7 (100.0%) |
| Mobile Home / Other | 6 (21.4%) | 22 (78.6%) |
| Total | 220 (80.9%) | 52 (19.1%) |
Housing Structures by Number of Rooms in Wall
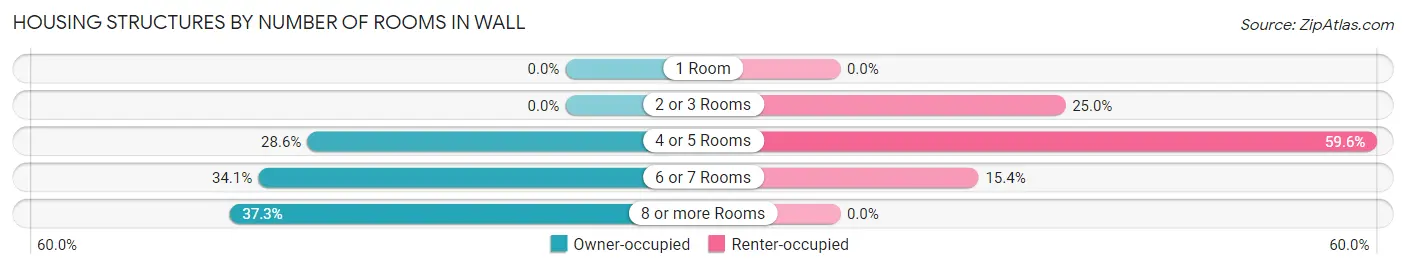
| Number of Rooms | Owner-occupied | Renter-occupied |
| 1 Room | 0 (0.0%) | 0 (0.0%) |
| 2 or 3 Rooms | 0 (0.0%) | 13 (25.0%) |
| 4 or 5 Rooms | 63 (28.6%) | 31 (59.6%) |
| 6 or 7 Rooms | 75 (34.1%) | 8 (15.4%) |
| 8 or more Rooms | 82 (37.3%) | 0 (0.0%) |
| Total | 220 (100.0%) | 52 (100.0%) |
Housing Structure by Heating Type in Wall
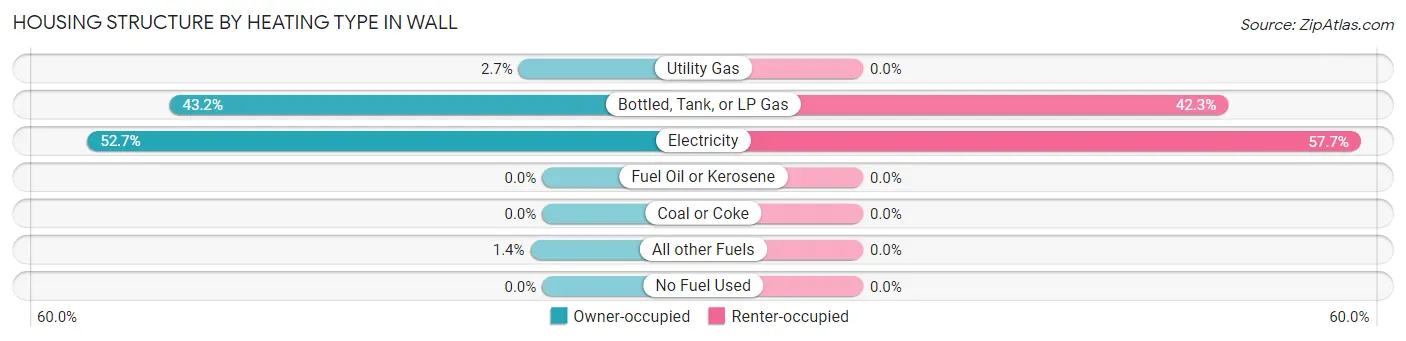
| Heating Type | Owner-occupied | Renter-occupied |
| Utility Gas | 6 (2.7%) | 0 (0.0%) |
| Bottled, Tank, or LP Gas | 95 (43.2%) | 22 (42.3%) |
| Electricity | 116 (52.7%) | 30 (57.7%) |
| Fuel Oil or Kerosene | 0 (0.0%) | 0 (0.0%) |
| Coal or Coke | 0 (0.0%) | 0 (0.0%) |
| All other Fuels | 3 (1.4%) | 0 (0.0%) |
| No Fuel Used | 0 (0.0%) | 0 (0.0%) |
| Total | 220 (100.0%) | 52 (100.0%) |
Household Vehicle Usage in Wall
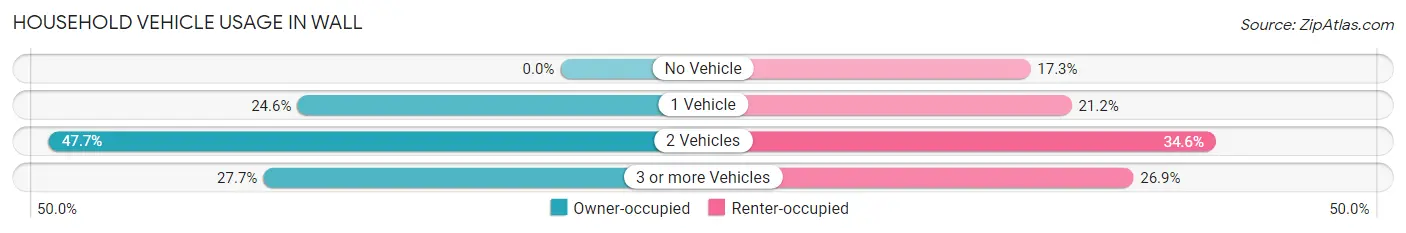
| Vehicles per Household | Owner-occupied | Renter-occupied |
| No Vehicle | 0 (0.0%) | 9 (17.3%) |
| 1 Vehicle | 54 (24.5%) | 11 (21.1%) |
| 2 Vehicles | 105 (47.7%) | 18 (34.6%) |
| 3 or more Vehicles | 61 (27.7%) | 14 (26.9%) |
| Total | 220 (100.0%) | 52 (100.0%) |
Real Estate & Mortgages in Wall
Real Estate and Mortgage Overview in Wall
| Characteristic | Without Mortgage | With Mortgage |
| Housing Units | 106 | 114 |
| Median Property Value | $150,000 | $200,000 |
| Median Household Income | $70,909 | $28 |
| Monthly Housing Costs | $631 | $2 |
| Real Estate Taxes | $2,375 | $0 |
Property Value by Mortgage Status in Wall
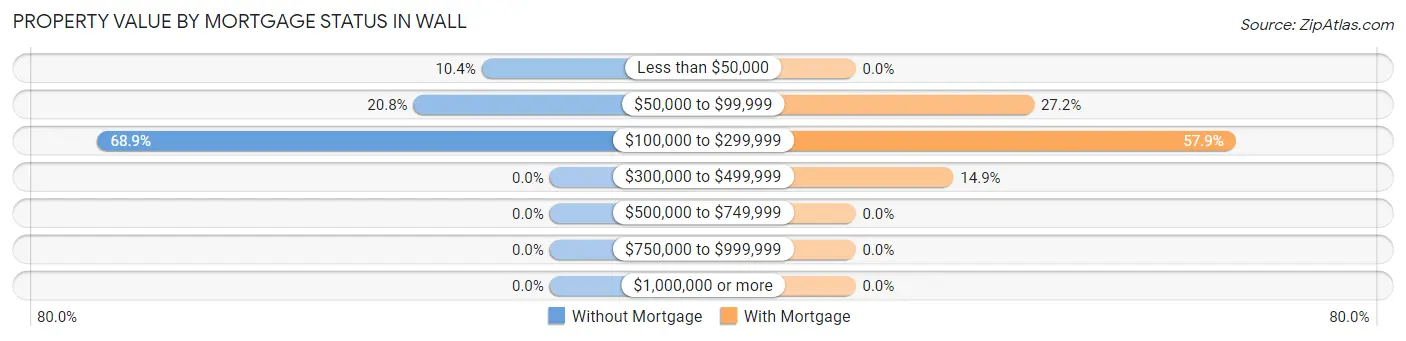
| Property Value | Without Mortgage | With Mortgage |
| Less than $50,000 | 11 (10.4%) | 0 (0.0%) |
| $50,000 to $99,999 | 22 (20.7%) | 31 (27.2%) |
| $100,000 to $299,999 | 73 (68.9%) | 66 (57.9%) |
| $300,000 to $499,999 | 0 (0.0%) | 17 (14.9%) |
| $500,000 to $749,999 | 0 (0.0%) | 0 (0.0%) |
| $750,000 to $999,999 | 0 (0.0%) | 0 (0.0%) |
| $1,000,000 or more | 0 (0.0%) | 0 (0.0%) |
| Total | 106 (100.0%) | 114 (100.0%) |
Household Income by Mortgage Status in Wall
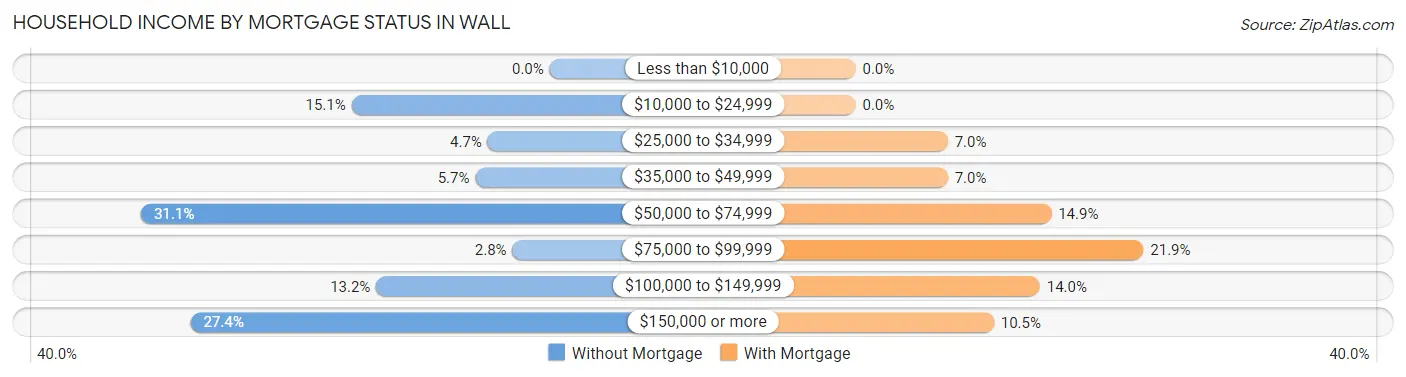
| Household Income | Without Mortgage | With Mortgage |
| Less than $10,000 | 0 (0.0%) | 0 (0.0%) |
| $10,000 to $24,999 | 16 (15.1%) | 0 (0.0%) |
| $25,000 to $34,999 | 5 (4.7%) | 8 (7.0%) |
| $35,000 to $49,999 | 6 (5.7%) | 8 (7.0%) |
| $50,000 to $74,999 | 33 (31.1%) | 17 (14.9%) |
| $75,000 to $99,999 | 3 (2.8%) | 25 (21.9%) |
| $100,000 to $149,999 | 14 (13.2%) | 16 (14.0%) |
| $150,000 or more | 29 (27.4%) | 12 (10.5%) |
| Total | 106 (100.0%) | 114 (100.0%) |
Property Value to Household Income Ratio in Wall
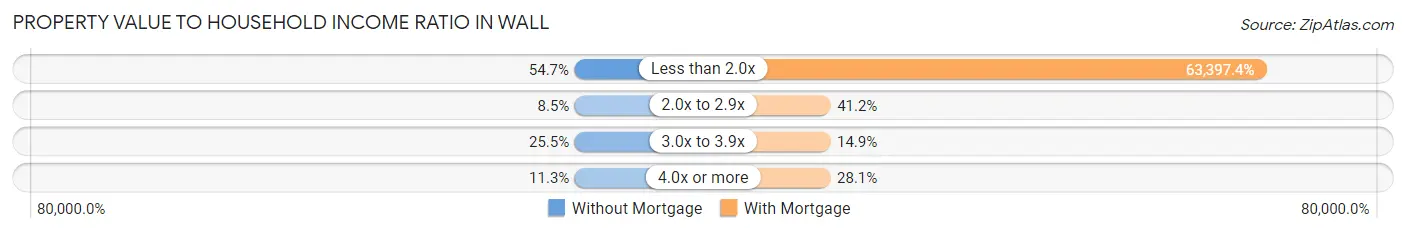
| Value-to-Income Ratio | Without Mortgage | With Mortgage |
| Less than 2.0x | 58 (54.7%) | 72,273 (63,397.4%) |
| 2.0x to 2.9x | 9 (8.5%) | 47 (41.2%) |
| 3.0x to 3.9x | 27 (25.5%) | 17 (14.9%) |
| 4.0x or more | 12 (11.3%) | 32 (28.1%) |
| Total | 106 (100.0%) | 114 (100.0%) |
Real Estate Taxes by Mortgage Status in Wall
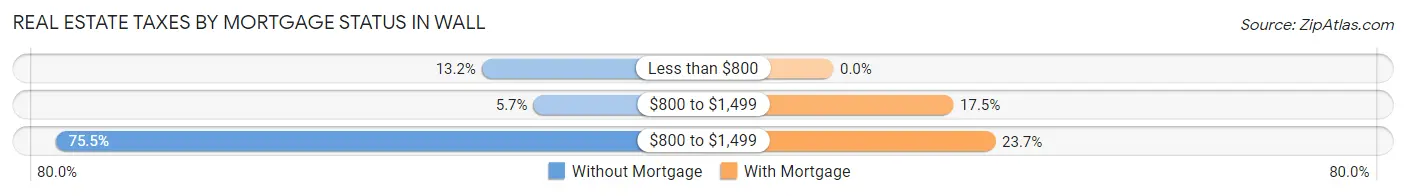
| Property Taxes | Without Mortgage | With Mortgage |
| Less than $800 | 14 (13.2%) | 0 (0.0%) |
| $800 to $1,499 | 6 (5.7%) | 20 (17.5%) |
| $800 to $1,499 | 80 (75.5%) | 27 (23.7%) |
| Total | 106 (100.0%) | 114 (100.0%) |
Health & Disability in Wall
Health Insurance Coverage by Age in Wall
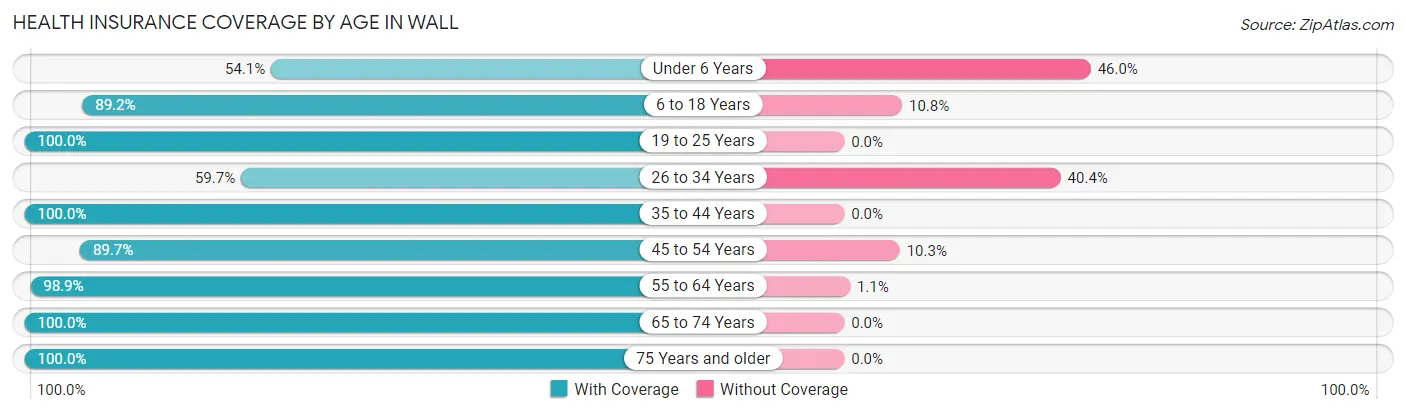
| Age Bracket | With Coverage | Without Coverage |
| Under 6 Years | 20 (54.0%) | 17 (46.0%) |
| 6 to 18 Years | 116 (89.2%) | 14 (10.8%) |
| 19 to 25 Years | 22 (100.0%) | 0 (0.0%) |
| 26 to 34 Years | 34 (59.7%) | 23 (40.4%) |
| 35 to 44 Years | 64 (100.0%) | 0 (0.0%) |
| 45 to 54 Years | 78 (89.7%) | 9 (10.3%) |
| 55 to 64 Years | 93 (98.9%) | 1 (1.1%) |
| 65 to 74 Years | 104 (100.0%) | 0 (0.0%) |
| 75 Years and older | 55 (100.0%) | 0 (0.0%) |
| Total | 586 (90.1%) | 64 (9.9%) |
Health Insurance Coverage by Citizenship Status in Wall
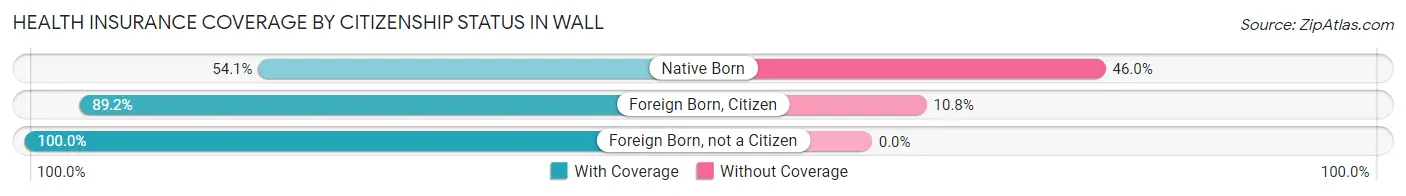
| Citizenship Status | With Coverage | Without Coverage |
| Native Born | 20 (54.0%) | 17 (46.0%) |
| Foreign Born, Citizen | 116 (89.2%) | 14 (10.8%) |
| Foreign Born, not a Citizen | 22 (100.0%) | 0 (0.0%) |
Health Insurance Coverage by Household Income in Wall
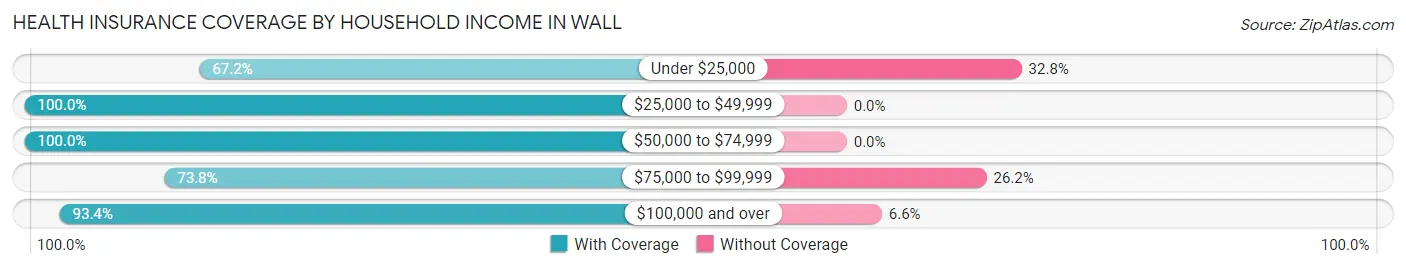
| Household Income | With Coverage | Without Coverage |
| Under $25,000 | 39 (67.2%) | 19 (32.8%) |
| $25,000 to $49,999 | 94 (100.0%) | 0 (0.0%) |
| $50,000 to $74,999 | 133 (100.0%) | 0 (0.0%) |
| $75,000 to $99,999 | 62 (73.8%) | 22 (26.2%) |
| $100,000 and over | 256 (93.4%) | 18 (6.6%) |
Public vs Private Health Insurance Coverage by Age in Wall
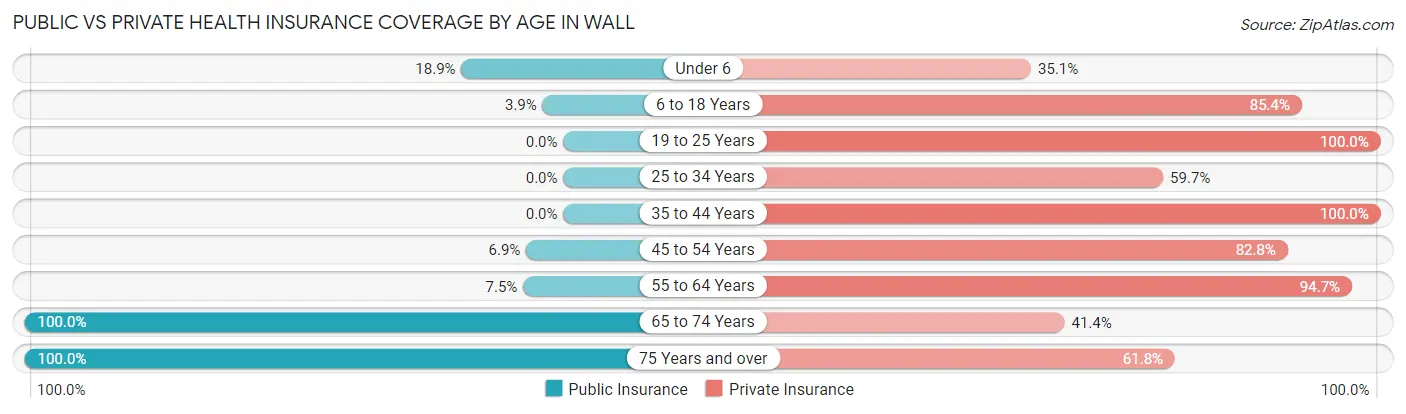
| Age Bracket | Public Insurance | Private Insurance |
| Under 6 | 7 (18.9%) | 13 (35.1%) |
| 6 to 18 Years | 5 (3.8%) | 111 (85.4%) |
| 19 to 25 Years | 0 (0.0%) | 22 (100.0%) |
| 25 to 34 Years | 0 (0.0%) | 34 (59.7%) |
| 35 to 44 Years | 0 (0.0%) | 64 (100.0%) |
| 45 to 54 Years | 6 (6.9%) | 72 (82.8%) |
| 55 to 64 Years | 7 (7.4%) | 89 (94.7%) |
| 65 to 74 Years | 104 (100.0%) | 43 (41.3%) |
| 75 Years and over | 55 (100.0%) | 34 (61.8%) |
| Total | 184 (28.3%) | 482 (74.2%) |
Disability Status by Sex by Age in Wall
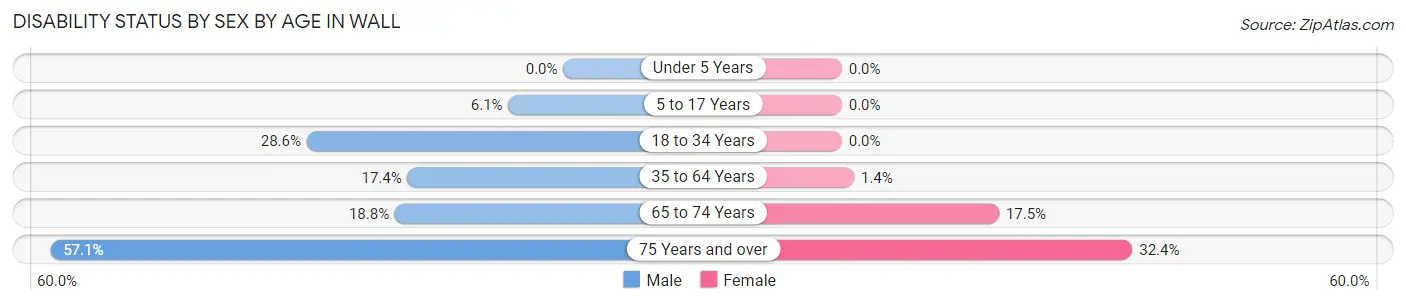
| Age Bracket | Male | Female |
| Under 5 Years | 0 (0.0%) | 0 (0.0%) |
| 5 to 17 Years | 3 (6.1%) | 0 (0.0%) |
| 18 to 34 Years | 14 (28.6%) | 0 (0.0%) |
| 35 to 64 Years | 17 (17.3%) | 2 (1.4%) |
| 65 to 74 Years | 12 (18.8%) | 7 (17.5%) |
| 75 Years and over | 12 (57.1%) | 11 (32.4%) |
Disability Class by Sex by Age in Wall
Disability Class: Hearing Difficulty
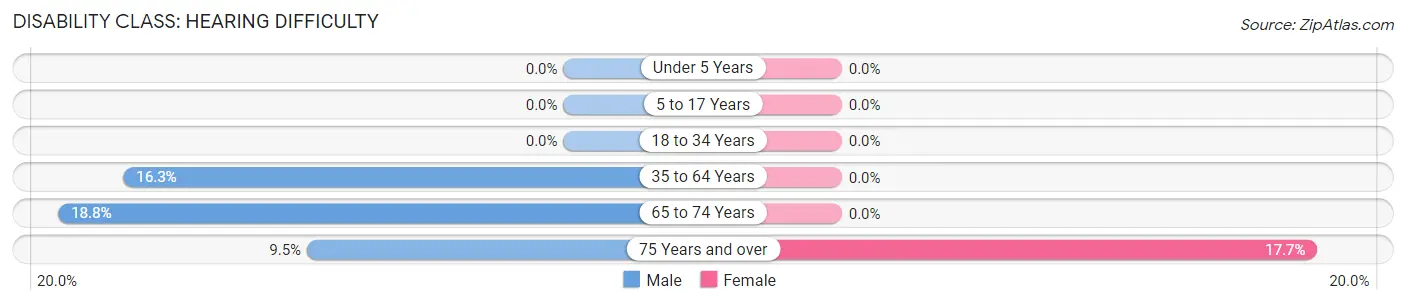
| Age Bracket | Male | Female |
| Under 5 Years | 0 (0.0%) | 0 (0.0%) |
| 5 to 17 Years | 0 (0.0%) | 0 (0.0%) |
| 18 to 34 Years | 0 (0.0%) | 0 (0.0%) |
| 35 to 64 Years | 16 (16.3%) | 0 (0.0%) |
| 65 to 74 Years | 12 (18.8%) | 0 (0.0%) |
| 75 Years and over | 2 (9.5%) | 6 (17.6%) |
Disability Class: Vision Difficulty
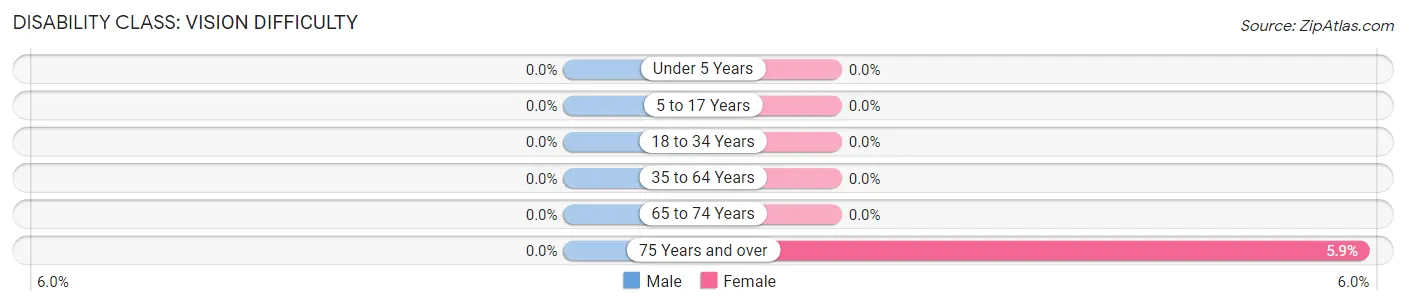
| Age Bracket | Male | Female |
| Under 5 Years | 0 (0.0%) | 0 (0.0%) |
| 5 to 17 Years | 0 (0.0%) | 0 (0.0%) |
| 18 to 34 Years | 0 (0.0%) | 0 (0.0%) |
| 35 to 64 Years | 0 (0.0%) | 0 (0.0%) |
| 65 to 74 Years | 0 (0.0%) | 0 (0.0%) |
| 75 Years and over | 0 (0.0%) | 2 (5.9%) |
Disability Class: Cognitive Difficulty
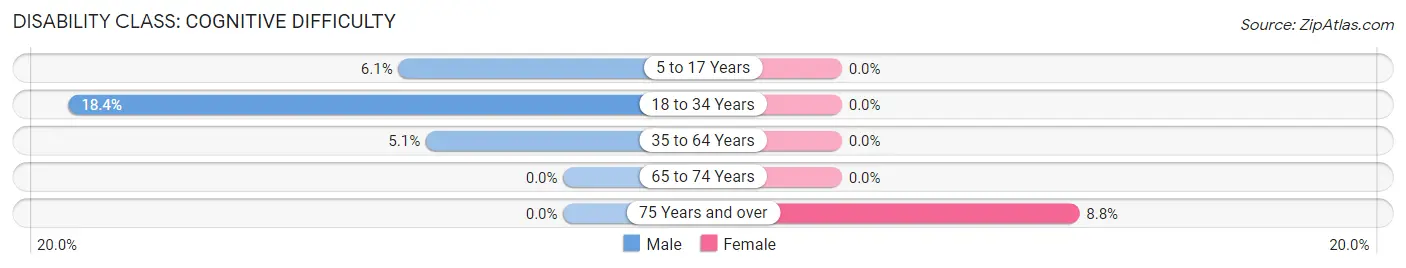
| Age Bracket | Male | Female |
| 5 to 17 Years | 3 (6.1%) | 0 (0.0%) |
| 18 to 34 Years | 9 (18.4%) | 0 (0.0%) |
| 35 to 64 Years | 5 (5.1%) | 0 (0.0%) |
| 65 to 74 Years | 0 (0.0%) | 0 (0.0%) |
| 75 Years and over | 0 (0.0%) | 3 (8.8%) |
Disability Class: Ambulatory Difficulty
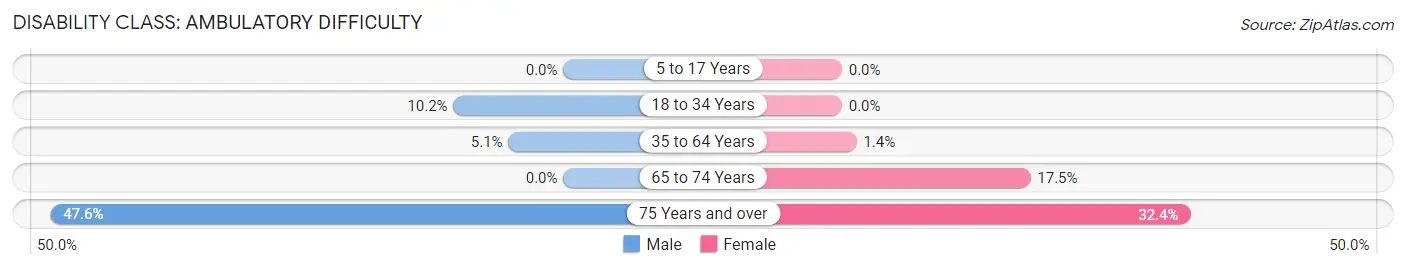
| Age Bracket | Male | Female |
| 5 to 17 Years | 0 (0.0%) | 0 (0.0%) |
| 18 to 34 Years | 5 (10.2%) | 0 (0.0%) |
| 35 to 64 Years | 5 (5.1%) | 2 (1.4%) |
| 65 to 74 Years | 0 (0.0%) | 7 (17.5%) |
| 75 Years and over | 10 (47.6%) | 11 (32.4%) |
Disability Class: Self-Care Difficulty
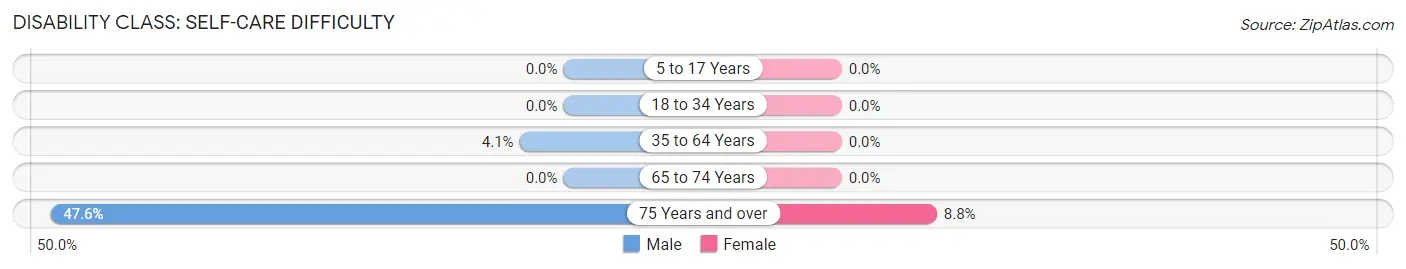
| Age Bracket | Male | Female |
| 5 to 17 Years | 0 (0.0%) | 0 (0.0%) |
| 18 to 34 Years | 0 (0.0%) | 0 (0.0%) |
| 35 to 64 Years | 4 (4.1%) | 0 (0.0%) |
| 65 to 74 Years | 0 (0.0%) | 0 (0.0%) |
| 75 Years and over | 10 (47.6%) | 3 (8.8%) |
Technology Access in Wall
Computing Device Access in Wall
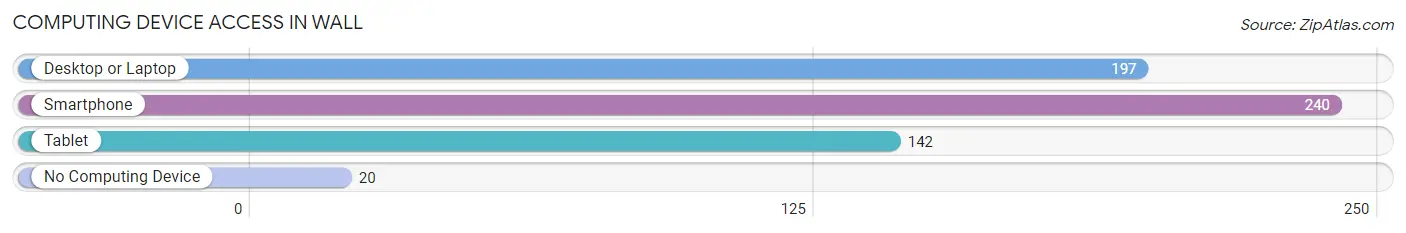
| Device Type | # Households | % Households |
| Desktop or Laptop | 197 | 72.4% |
| Smartphone | 240 | 88.2% |
| Tablet | 142 | 52.2% |
| No Computing Device | 20 | 7.3% |
| Total | 272 | 100.0% |
Internet Access in Wall
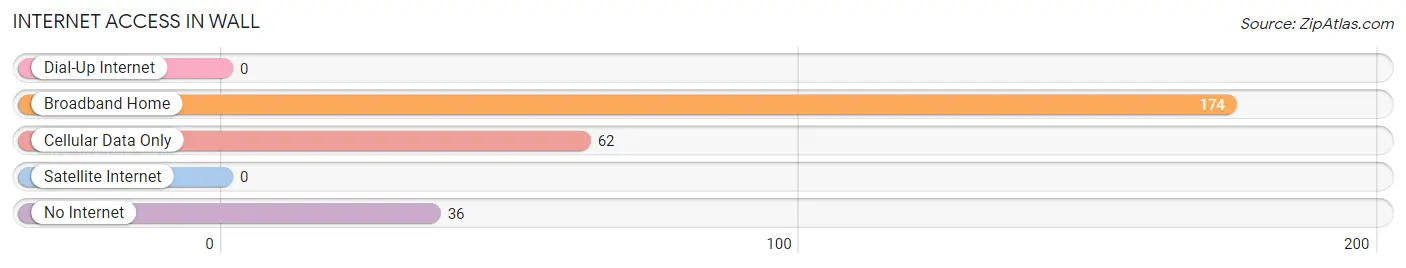
| Internet Type | # Households | % Households |
| Dial-Up Internet | 0 | 0.0% |
| Broadband Home | 174 | 64.0% |
| Cellular Data Only | 62 | 22.8% |
| Satellite Internet | 0 | 0.0% |
| No Internet | 36 | 13.2% |
| Total | 272 | 100.0% |
Wall Summary
Wall, South Dakota is a small town located in the western part of the state, in the Badlands region. It is situated in the Badlands National Park, and is the gateway to the park. The town has a population of 742, according to the 2010 census.
Geography
Wall is located in the Badlands region of South Dakota, in the western part of the state. It is situated in the Badlands National Park, and is the gateway to the park. The town is located at an elevation of 3,400 feet, and is surrounded by rolling hills and prairies. The town is located on the edge of the White River, which flows through the area. The town is located in the Central Time Zone.
Economy
The economy of Wall is largely based on tourism, as it is the gateway to the Badlands National Park. The town is home to a variety of businesses, including restaurants, hotels, and souvenir shops. The town also has a variety of outdoor activities, such as camping, hiking, and fishing. The town is also home to a variety of art galleries, museums, and other attractions.
Demographics
According to the 2010 census, the population of Wall was 742. The population is predominantly white, with a small percentage of African Americans, Native Americans, and other races. The median age of the population is 44.7 years, and the median household income is $41,250. The town has a high rate of poverty, with 24.3% of the population living below the poverty line.
History
Wall was founded in 1906, when the Chicago, Burlington, and Quincy Railroad built a line through the area. The town was named after the railroad engineer, William Wall. The town quickly grew, and by 1910, it had a population of over 500. The town was incorporated in 1911, and the first mayor was elected in 1912.
Wall was a popular stop for travelers, and the town was home to a variety of businesses, including hotels, restaurants, and saloons. The town was also home to a variety of churches, and a school was built in 1912. The town was also home to a variety of industries, including a flour mill, a creamery, and a brickyard.
In the 1930s, the town began to decline, as the railroad line was abandoned and the Great Depression hit the area. The town was revitalized in the 1950s, when the Badlands National Park was established. The town became the gateway to the park, and tourism became the main industry. The town has continued to grow, and today it is a popular tourist destination.
Common Questions
What is Per Capita Income in Wall?
Per Capita income in Wall is $43,092.
What is the Median Family Income in Wall?
Median Family Income in Wall is $76,563.
What is the Median Household income in Wall?
Median Household Income in Wall is $71,364.
What is Income or Wage Gap in Wall?
Income or Wage Gap in Wall is 35.0%.
Women in Wall earn 65.0 cents for every dollar earned by a man.
What is Inequality or Gini Index in Wall?
Inequality or Gini Index in Wall is 0.46.
What is the Total Population of Wall?
Total Population of Wall is 650.
What is the Total Male Population of Wall?
Total Male Population of Wall is 297.
What is the Total Female Population of Wall?
Total Female Population of Wall is 353.
What is the Ratio of Males per 100 Females in Wall?
There are 84.14 Males per 100 Females in Wall.
What is the Ratio of Females per 100 Males in Wall?
There are 118.86 Females per 100 Males in Wall.
What is the Median Population Age in Wall?
Median Population Age in Wall is 46.6 Years.
What is the Average Family Size in Wall
Average Family Size in Wall is 2.9 People.
What is the Average Household Size in Wall
Average Household Size in Wall is 2.4 People.
How Large is the Labor Force in Wall?
There are 301 People in the Labor Forcein in Wall.
What is the Percentage of People in the Labor Force in Wall?
57.7% of People are in the Labor Force in Wall.
What is the Unemployment Rate in Wall?
Unemployment Rate in Wall is 0.7%.