Hayti, SD Map & Demographics
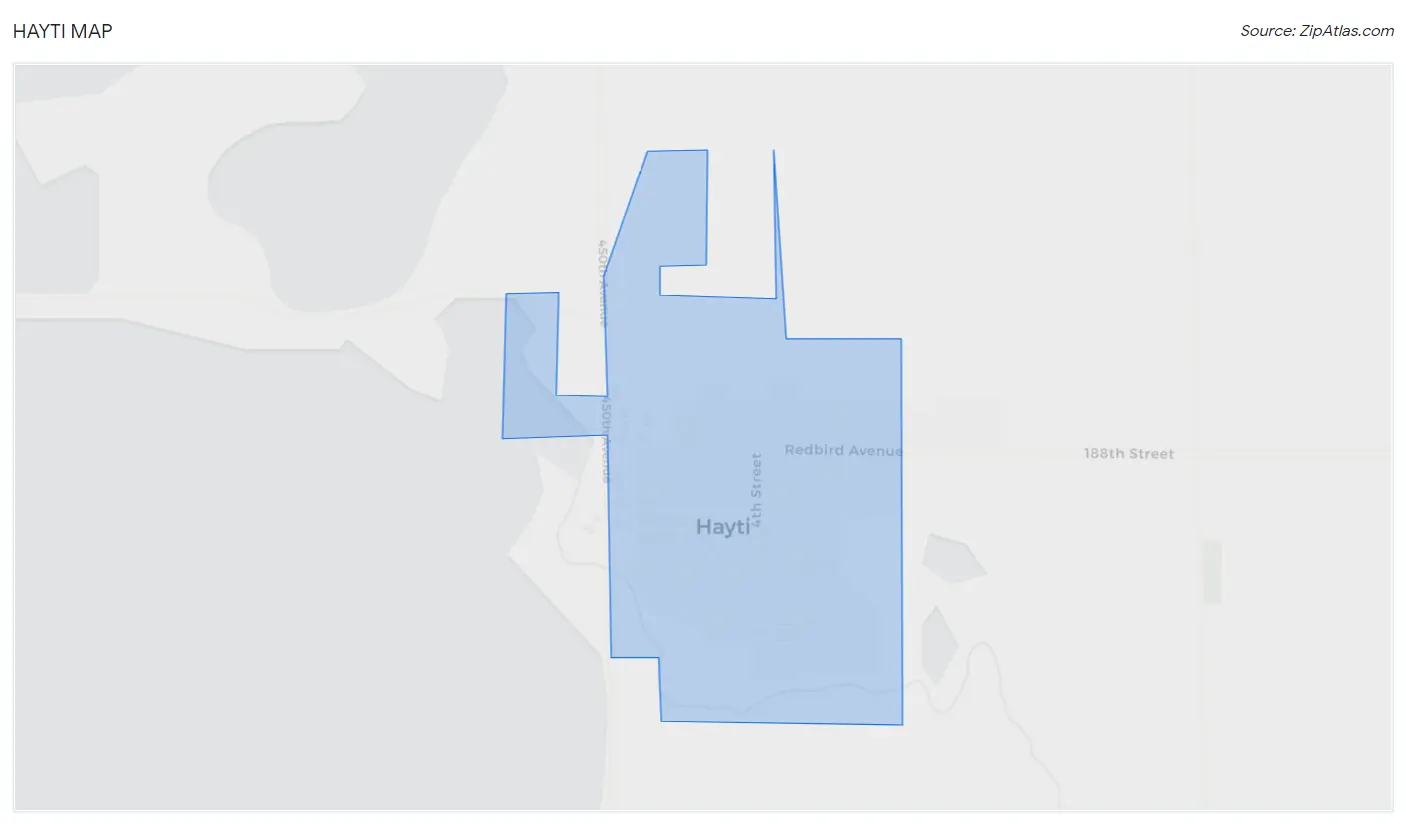
Hayti Map
Hayti Overview
$38,603
PER CAPITA INCOME
$107,500
AVG FAMILY INCOME
$67,250
AVG HOUSEHOLD INCOME
41.8%
WAGE / INCOME GAP [ % ]
58.2¢/ $1
WAGE / INCOME GAP [ $ ]
0.37
INEQUALITY / GINI INDEX
369
TOTAL POPULATION
176
MALE POPULATION
193
FEMALE POPULATION
91.19
MALES / 100 FEMALES
109.66
FEMALES / 100 MALES
35.8
MEDIAN AGE
2.9
AVG FAMILY SIZE
2.1
AVG HOUSEHOLD SIZE
235
LABOR FORCE [ PEOPLE ]
79.9%
PERCENT IN LABOR FORCE
1.7%
UNEMPLOYMENT RATE
Hayti Zip Codes
Hayti Area Codes
Income in Hayti
Income Overview in Hayti
Per Capita Income in Hayti is $38,603, while median incomes of families and households are $107,500 and $67,250 respectively.
| Characteristic | Number | Measure |
| Per Capita Income | 369 | $38,603 |
| Median Family Income | 96 | $107,500 |
| Mean Family Income | 96 | $110,943 |
| Median Household Income | 173 | $67,250 |
| Mean Household Income | 173 | $81,842 |
| Income Deficit | 96 | $0 |
| Wage / Income Gap (%) | 369 | 41.78% |
| Wage / Income Gap ($) | 369 | 58.22¢ per $1 |
| Gini / Inequality Index | 369 | 0.37 |
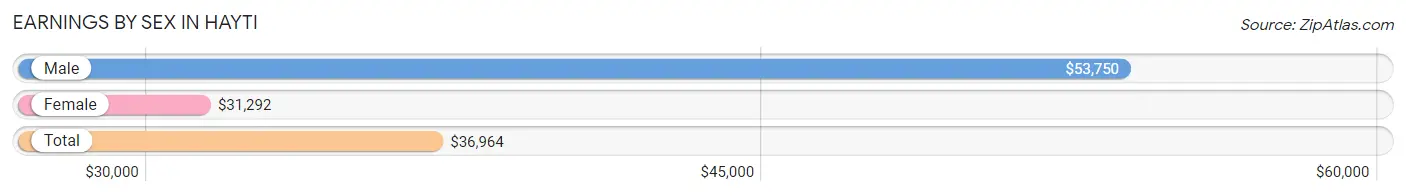
Earnings by Sex in Hayti
Average Earnings in Hayti are $36,964, $53,750 for men and $31,292 for women, a difference of 41.8%.
| Sex | Number | Average Earnings |
| Male | 122 (49.4%) | $53,750 |
| Female | 125 (50.6%) | $31,292 |
| Total | 247 (100.0%) | $36,964 |
Earnings by Sex by Income Bracket in Hayti
The most common earnings brackets in Hayti are $65,000 to $74,999 for men (21 | 17.2%) and $30,000 to $34,999 for women (30 | 24.0%).
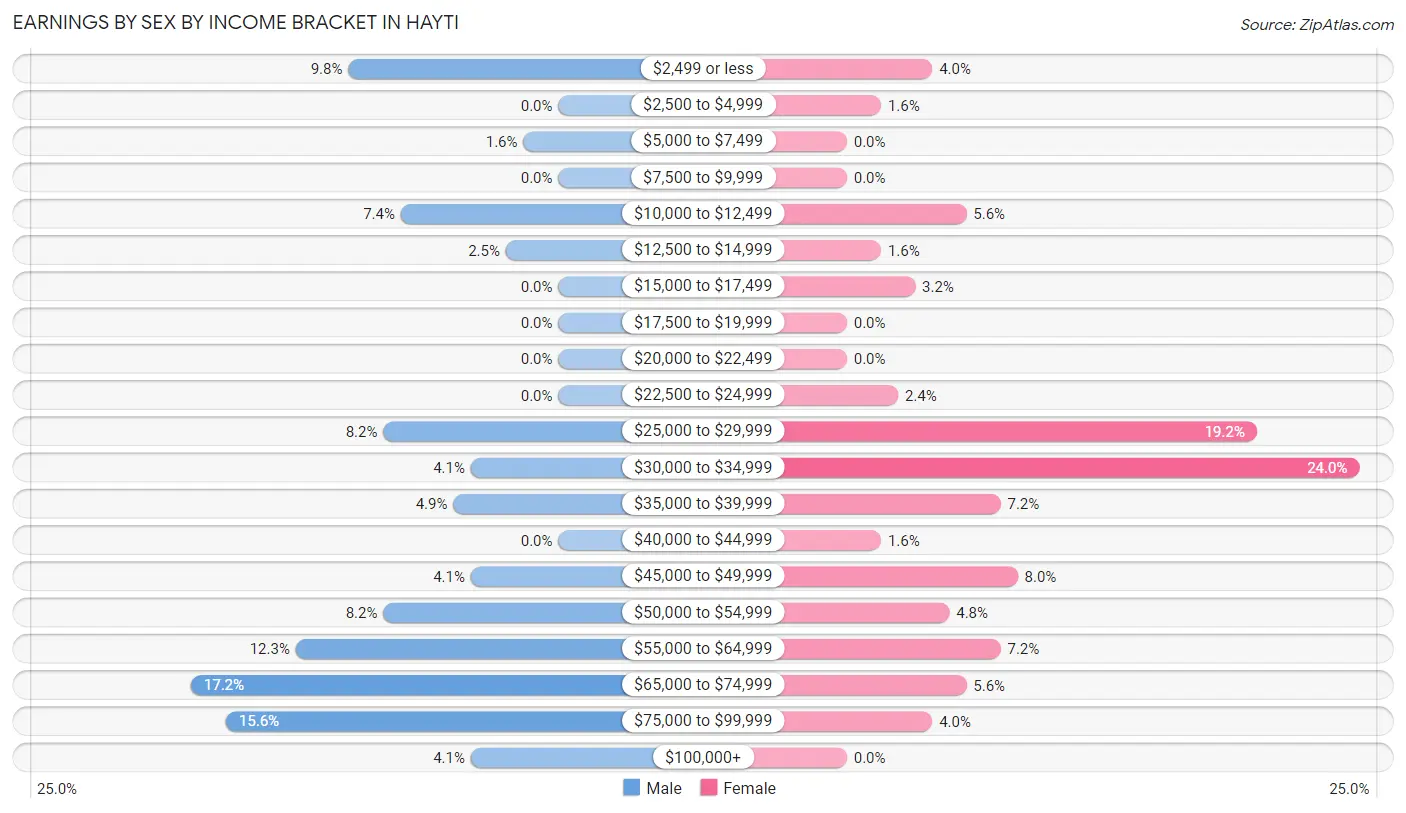
| Income | Male | Female |
| $2,499 or less | 12 (9.8%) | 5 (4.0%) |
| $2,500 to $4,999 | 0 (0.0%) | 2 (1.6%) |
| $5,000 to $7,499 | 2 (1.6%) | 0 (0.0%) |
| $7,500 to $9,999 | 0 (0.0%) | 0 (0.0%) |
| $10,000 to $12,499 | 9 (7.4%) | 7 (5.6%) |
| $12,500 to $14,999 | 3 (2.5%) | 2 (1.6%) |
| $15,000 to $17,499 | 0 (0.0%) | 4 (3.2%) |
| $17,500 to $19,999 | 0 (0.0%) | 0 (0.0%) |
| $20,000 to $22,499 | 0 (0.0%) | 0 (0.0%) |
| $22,500 to $24,999 | 0 (0.0%) | 3 (2.4%) |
| $25,000 to $29,999 | 10 (8.2%) | 24 (19.2%) |
| $30,000 to $34,999 | 5 (4.1%) | 30 (24.0%) |
| $35,000 to $39,999 | 6 (4.9%) | 9 (7.2%) |
| $40,000 to $44,999 | 0 (0.0%) | 2 (1.6%) |
| $45,000 to $49,999 | 5 (4.1%) | 10 (8.0%) |
| $50,000 to $54,999 | 10 (8.2%) | 6 (4.8%) |
| $55,000 to $64,999 | 15 (12.3%) | 9 (7.2%) |
| $65,000 to $74,999 | 21 (17.2%) | 7 (5.6%) |
| $75,000 to $99,999 | 19 (15.6%) | 5 (4.0%) |
| $100,000+ | 5 (4.1%) | 0 (0.0%) |
| Total | 122 (100.0%) | 125 (100.0%) |
Earnings by Sex by Educational Attainment in Hayti
Average earnings in Hayti are $56,375 for men and $31,875 for women, a difference of 43.5%. Men with an educational attainment of high school diploma enjoy the highest average annual earnings of $66,250, while those with college or associate's degree education earn the least with $52,000. Women with an educational attainment of bachelor's degree earn the most with the average annual earnings of $56,875, while those with high school diploma education have the smallest earnings of $26,500.
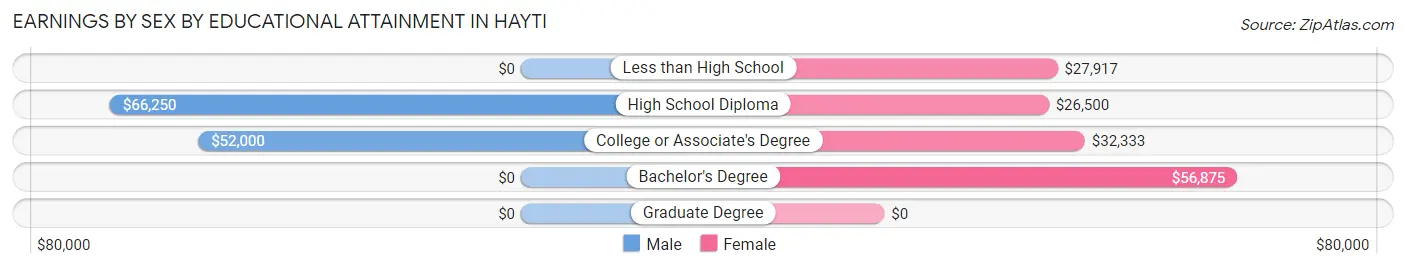
| Educational Attainment | Male Income | Female Income |
| Less than High School | - | - |
| High School Diploma | $66,250 | $26,500 |
| College or Associate's Degree | $52,000 | $32,333 |
| Bachelor's Degree | - | - |
| Graduate Degree | - | - |
| Total | $56,375 | $31,875 |
Family Income in Hayti
Family Income Brackets in Hayti
According to the Hayti family income data, there are 37 families falling into the $100,000 to $149,999 income range, which is the most common income bracket and makes up 38.5% of all families.
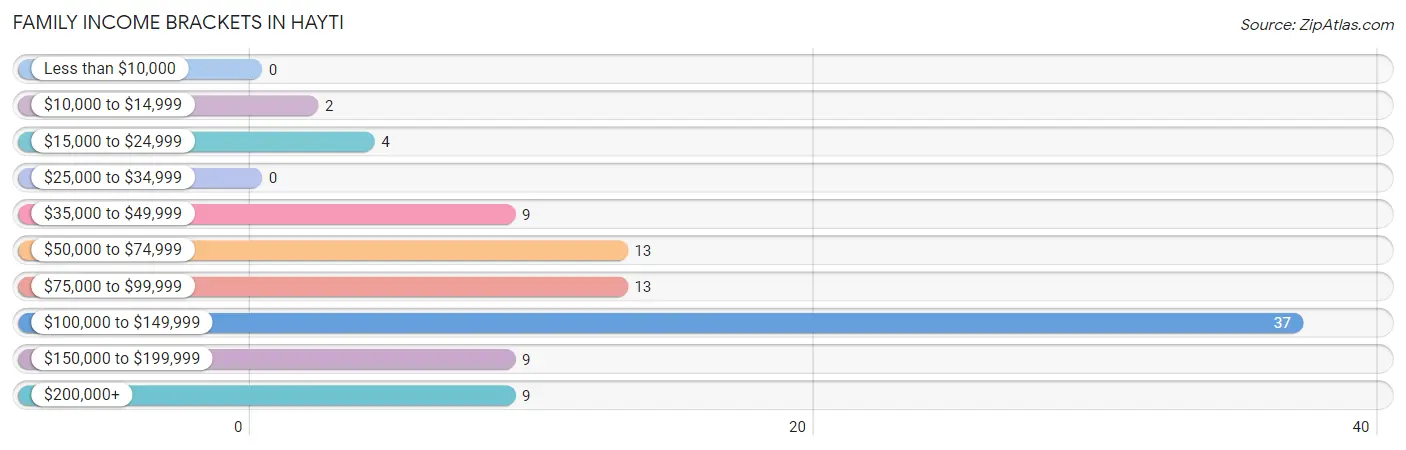
| Income Bracket | # Families | % Families |
| Less than $10,000 | 0 | 0.0% |
| $10,000 to $14,999 | 2 | 2.1% |
| $15,000 to $24,999 | 4 | 4.2% |
| $25,000 to $34,999 | 0 | 0.0% |
| $35,000 to $49,999 | 9 | 9.4% |
| $50,000 to $74,999 | 13 | 13.5% |
| $75,000 to $99,999 | 13 | 13.5% |
| $100,000 to $149,999 | 37 | 38.5% |
| $150,000 to $199,999 | 9 | 9.4% |
| $200,000+ | 9 | 9.4% |
Family Income by Famaliy Size in Hayti
3-person families (25 | 26.0%) account for the highest median family income in Hayti with $129,063 per family, while 2-person families (48 | 50.0%) have the highest median income of $50,750 per family member.
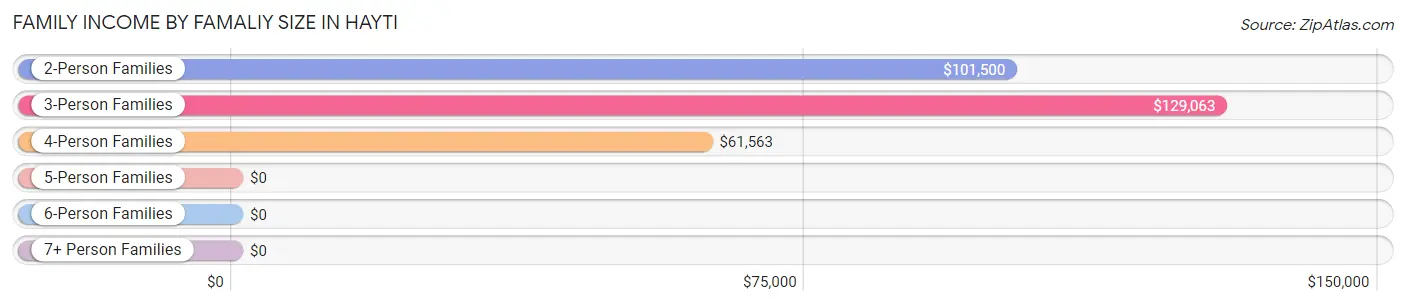
| Income Bracket | # Families | Median Income |
| 2-Person Families | 48 (50.0%) | $101,500 |
| 3-Person Families | 25 (26.0%) | $129,063 |
| 4-Person Families | 13 (13.5%) | $61,563 |
| 5-Person Families | 7 (7.3%) | $0 |
| 6-Person Families | 2 (2.1%) | $0 |
| 7+ Person Families | 1 (1.0%) | $0 |
| Total | 96 (100.0%) | $107,500 |
Family Income by Number of Earners in Hayti
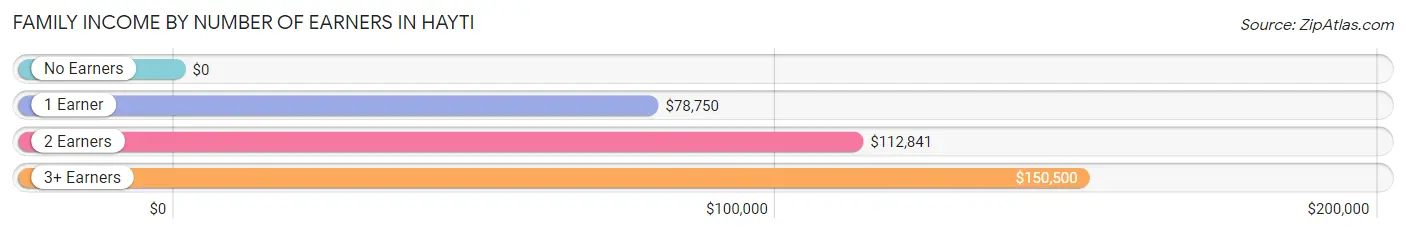
| Number of Earners | # Families | Median Income |
| No Earners | 5 (5.2%) | $0 |
| 1 Earner | 20 (20.8%) | $78,750 |
| 2 Earners | 53 (55.2%) | $112,841 |
| 3+ Earners | 18 (18.8%) | $150,500 |
| Total | 96 (100.0%) | $107,500 |
Household Income in Hayti
Household Income Brackets in Hayti
With 40 households falling in the category, the $100,000 to $149,999 income range is the most frequent in Hayti, accounting for 23.1% of all households.
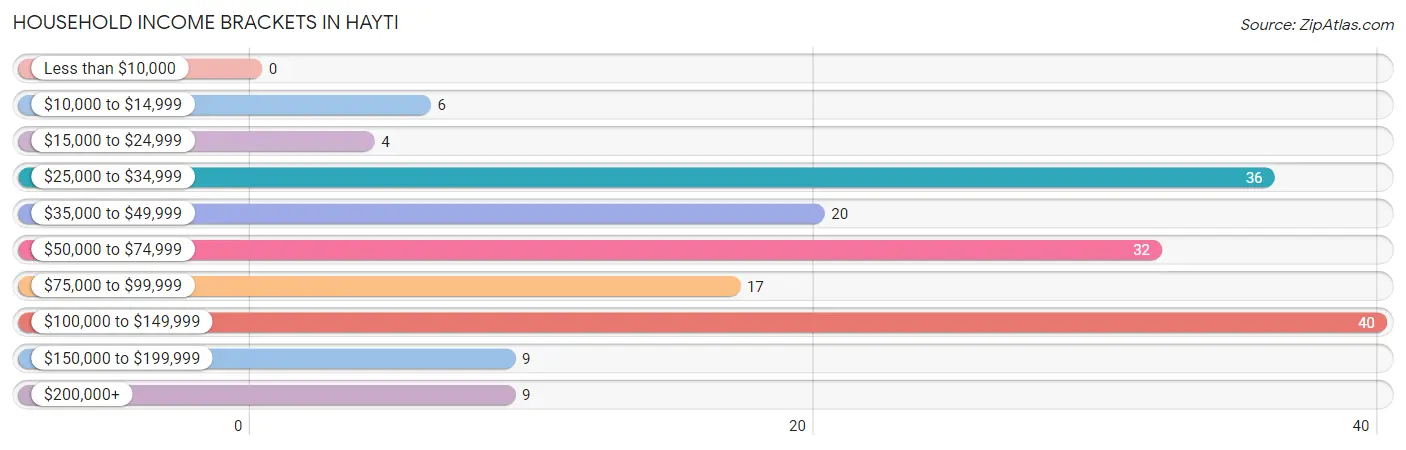
| Income Bracket | # Households | % Households |
| Less than $10,000 | 0 | 0.0% |
| $10,000 to $14,999 | 6 | 3.5% |
| $15,000 to $24,999 | 4 | 2.3% |
| $25,000 to $34,999 | 36 | 20.8% |
| $35,000 to $49,999 | 20 | 11.6% |
| $50,000 to $74,999 | 32 | 18.5% |
| $75,000 to $99,999 | 17 | 9.8% |
| $100,000 to $149,999 | 40 | 23.1% |
| $150,000 to $199,999 | 9 | 5.2% |
| $200,000+ | 9 | 5.2% |
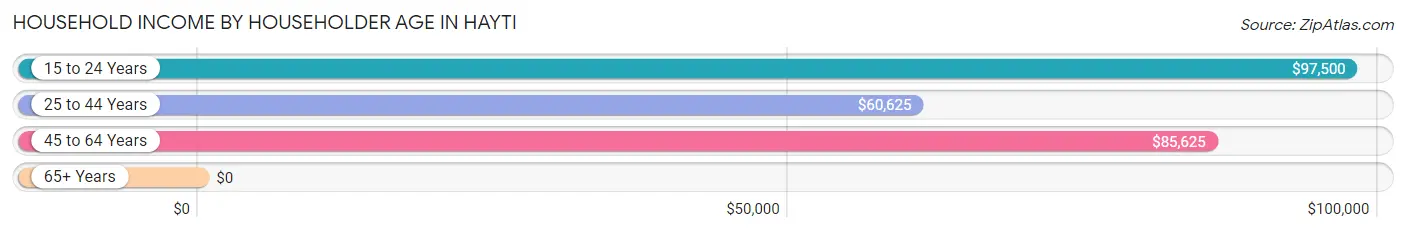
Household Income by Householder Age in Hayti
The median household income in Hayti is $67,250, with the highest median household income of $97,500 found in the 15 to 24 years age bracket for the primary householder. A total of 8 households (4.6%) fall into this category. Meanwhile, the 65+ years age bracket for the primary householder has the lowest median household income of $0, with 27 households (15.6%) in this group.
| Income Bracket | # Households | Median Income |
| 15 to 24 Years | 8 (4.6%) | $97,500 |
| 25 to 44 Years | 80 (46.2%) | $60,625 |
| 45 to 64 Years | 58 (33.5%) | $85,625 |
| 65+ Years | 27 (15.6%) | $0 |
| Total | 173 (100.0%) | $67,250 |
Poverty in Hayti
Income Below Poverty by Sex and Age in Hayti
With 6.8% poverty level for males and 4.2% for females among the residents of Hayti, 75 year old and over males and 18 to 24 year old females are the most vulnerable to poverty, with 4 males (33.3%) and 2 females (18.2%) in their respective age groups living below the poverty level.
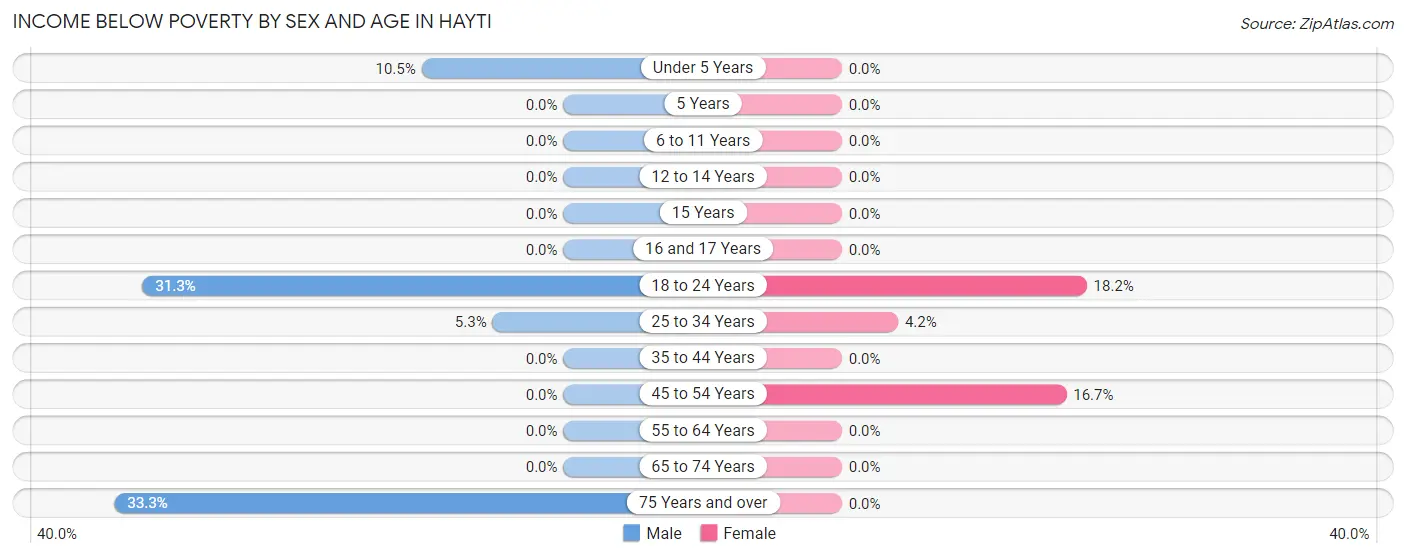
| Age Bracket | Male | Female |
| Under 5 Years | 2 (10.5%) | 0 (0.0%) |
| 5 Years | 0 (0.0%) | 0 (0.0%) |
| 6 to 11 Years | 0 (0.0%) | 0 (0.0%) |
| 12 to 14 Years | 0 (0.0%) | 0 (0.0%) |
| 15 Years | 0 (0.0%) | 0 (0.0%) |
| 16 and 17 Years | 0 (0.0%) | 0 (0.0%) |
| 18 to 24 Years | 5 (31.2%) | 2 (18.2%) |
| 25 to 34 Years | 1 (5.3%) | 2 (4.2%) |
| 35 to 44 Years | 0 (0.0%) | 0 (0.0%) |
| 45 to 54 Years | 0 (0.0%) | 4 (16.7%) |
| 55 to 64 Years | 0 (0.0%) | 0 (0.0%) |
| 65 to 74 Years | 0 (0.0%) | 0 (0.0%) |
| 75 Years and over | 4 (33.3%) | 0 (0.0%) |
| Total | 12 (6.8%) | 8 (4.2%) |
Income Above Poverty by Sex and Age in Hayti
According to the poverty statistics in Hayti, males aged 5 years and females aged under 5 years are the age groups that are most secure financially, with 100.0% of males and 100.0% of females in these age groups living above the poverty line.
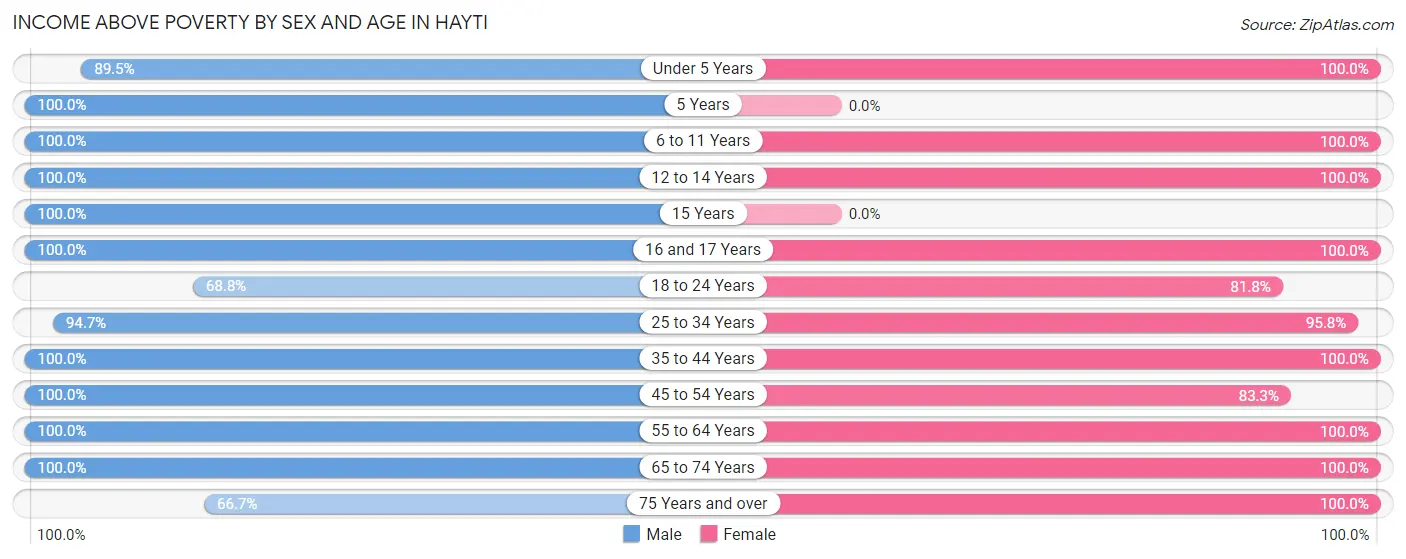
| Age Bracket | Male | Female |
| Under 5 Years | 17 (89.5%) | 5 (100.0%) |
| 5 Years | 6 (100.0%) | 0 (0.0%) |
| 6 to 11 Years | 4 (100.0%) | 16 (100.0%) |
| 12 to 14 Years | 3 (100.0%) | 18 (100.0%) |
| 15 Years | 4 (100.0%) | 0 (0.0%) |
| 16 and 17 Years | 3 (100.0%) | 7 (100.0%) |
| 18 to 24 Years | 11 (68.8%) | 9 (81.8%) |
| 25 to 34 Years | 18 (94.7%) | 46 (95.8%) |
| 35 to 44 Years | 31 (100.0%) | 24 (100.0%) |
| 45 to 54 Years | 18 (100.0%) | 20 (83.3%) |
| 55 to 64 Years | 27 (100.0%) | 27 (100.0%) |
| 65 to 74 Years | 14 (100.0%) | 10 (100.0%) |
| 75 Years and over | 8 (66.7%) | 3 (100.0%) |
| Total | 164 (93.2%) | 185 (95.9%) |
Income Below Poverty Among Married-Couple Families in Hayti
The poverty statistics for married-couple families in Hayti show that 2.4% or 2 of the total 82 families live below the poverty line. Families with 1 or 2 children have the highest poverty rate of 7.7%, comprising of 2 families. On the other hand, families with no children have the lowest poverty rate of 0.0%, which includes 0 families.
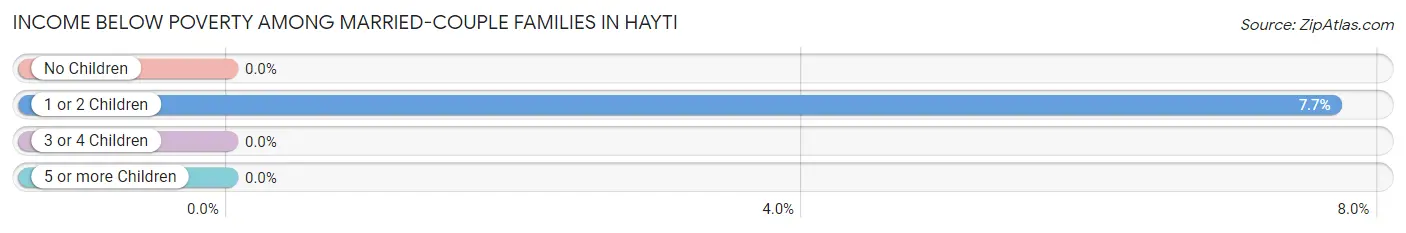
| Children | Above Poverty | Below Poverty |
| No Children | 47 (100.0%) | 0 (0.0%) |
| 1 or 2 Children | 24 (92.3%) | 2 (7.7%) |
| 3 or 4 Children | 9 (100.0%) | 0 (0.0%) |
| 5 or more Children | 0 (0.0%) | 0 (0.0%) |
| Total | 80 (97.6%) | 2 (2.4%) |
Income Below Poverty Among Single-Parent Households in Hayti
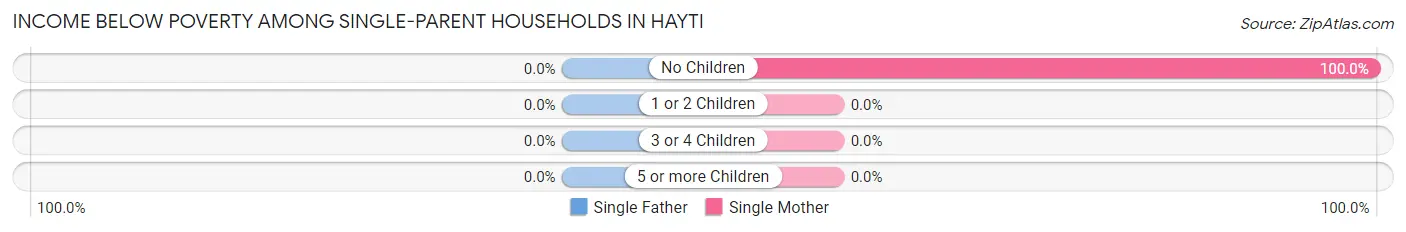
| Children | Single Father | Single Mother |
| No Children | 0 (0.0%) | 4 (100.0%) |
| 1 or 2 Children | 0 (0.0%) | 0 (0.0%) |
| 3 or 4 Children | 0 (0.0%) | 0 (0.0%) |
| 5 or more Children | 0 (0.0%) | 0 (0.0%) |
| Total | 0 (0.0%) | 4 (36.4%) |
Income Below Poverty Among Married-Couple vs Single-Parent Households in Hayti
The poverty data for Hayti shows that 2 of the married-couple family households (2.4%) and 4 of the single-parent households (28.6%) are living below the poverty level. Within the married-couple family households, those with 1 or 2 children have the highest poverty rate, with 2 households (7.7%) falling below the poverty line. Among the single-parent households, those with no children have the highest poverty rate, with 4 household (57.1%) living below poverty.
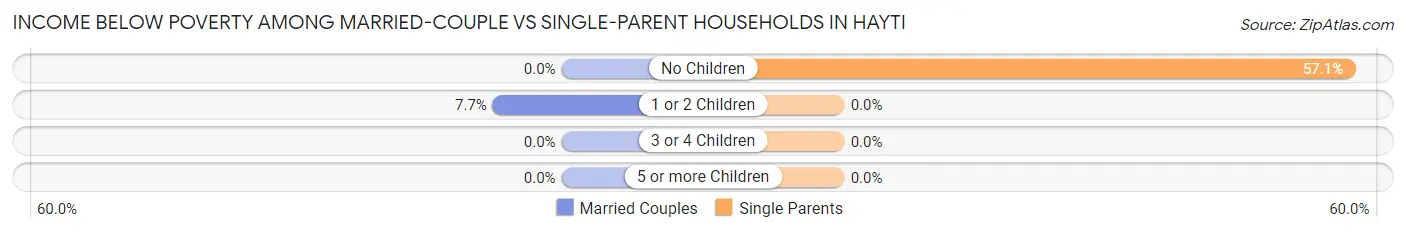
| Children | Married-Couple Families | Single-Parent Households |
| No Children | 0 (0.0%) | 4 (57.1%) |
| 1 or 2 Children | 2 (7.7%) | 0 (0.0%) |
| 3 or 4 Children | 0 (0.0%) | 0 (0.0%) |
| 5 or more Children | 0 (0.0%) | 0 (0.0%) |
| Total | 2 (2.4%) | 4 (28.6%) |
Race in Hayti
The most populous races in Hayti are White / Caucasian (345 | 93.5%), Hispanic or Latino (39 | 10.6%), and Some other Race (24 | 6.5%).
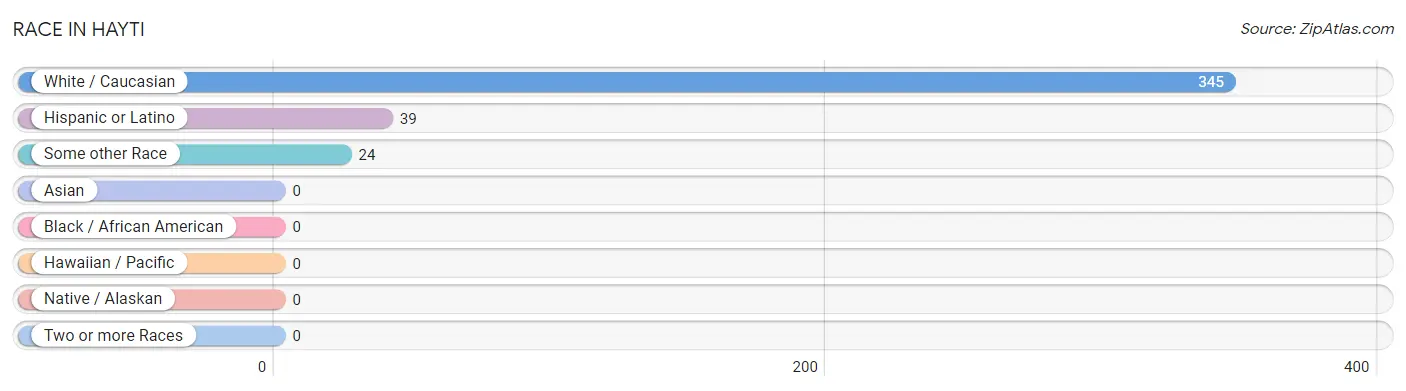
| Race | # Population | % Population |
| Asian | 0 | 0.0% |
| Black / African American | 0 | 0.0% |
| Hawaiian / Pacific | 0 | 0.0% |
| Hispanic or Latino | 39 | 10.6% |
| Native / Alaskan | 0 | 0.0% |
| White / Caucasian | 345 | 93.5% |
| Two or more Races | 0 | 0.0% |
| Some other Race | 24 | 6.5% |
| Total | 369 | 100.0% |
Ancestry in Hayti
The most populous ancestries reported in Hayti are Norwegian (76 | 20.6%), German (74 | 20.1%), Finnish (69 | 18.7%), European (30 | 8.1%), and Central American (20 | 5.4%), together accounting for 72.9% of all Hayti residents.
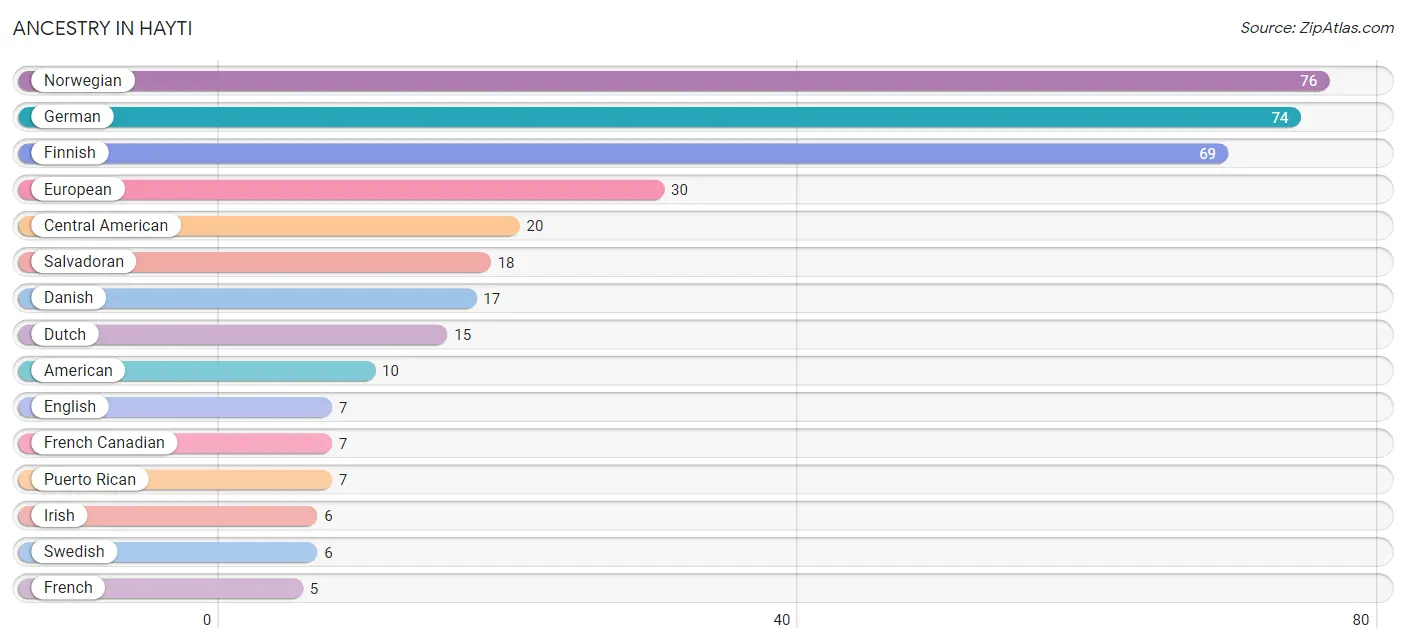
| Ancestry | # Population | % Population |
| American | 10 | 2.7% |
| Central American | 20 | 5.4% |
| Czech | 4 | 1.1% |
| Danish | 17 | 4.6% |
| Dutch | 15 | 4.1% |
| English | 7 | 1.9% |
| European | 30 | 8.1% |
| Finnish | 69 | 18.7% |
| French | 5 | 1.4% |
| French Canadian | 7 | 1.9% |
| German | 74 | 20.1% |
| Irish | 6 | 1.6% |
| Mexican | 4 | 1.1% |
| Nicaraguan | 2 | 0.5% |
| Norwegian | 76 | 20.6% |
| Polish | 1 | 0.3% |
| Puerto Rican | 7 | 1.9% |
| Russian | 2 | 0.5% |
| Salvadoran | 18 | 4.9% |
| Scandinavian | 1 | 0.3% |
| Swedish | 6 | 1.6% | View All 21 Rows |
Immigrants in Hayti
The most numerous immigrant groups reported in Hayti came from Central America (11 | 3.0%), Latin America (11 | 3.0%), El Salvador (5 | 1.4%), Mexico (5 | 1.4%), and Europe (1 | 0.3%), together accounting for 8.9% of all Hayti residents.
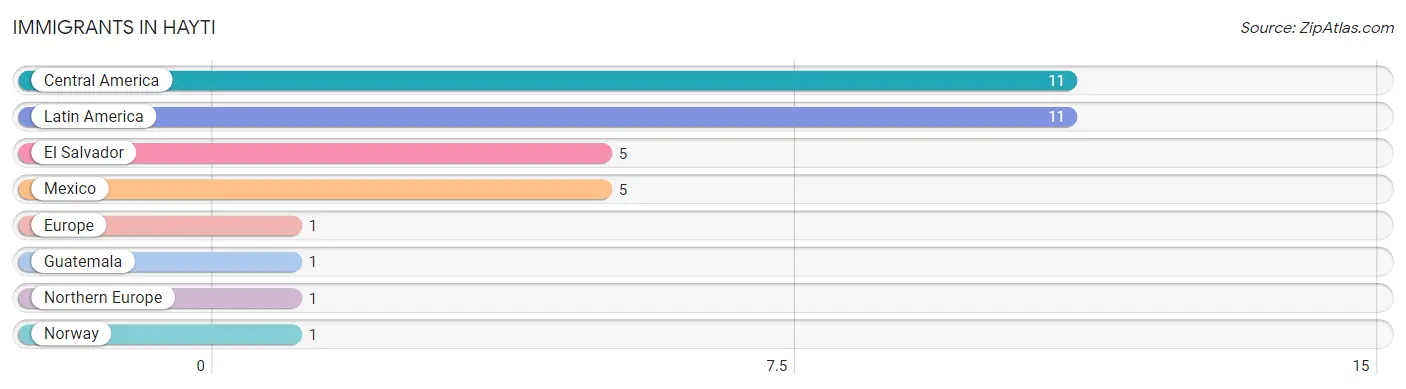
| Immigration Origin | # Population | % Population |
| Central America | 11 | 3.0% |
| El Salvador | 5 | 1.4% |
| Europe | 1 | 0.3% |
| Guatemala | 1 | 0.3% |
| Latin America | 11 | 3.0% |
| Mexico | 5 | 1.4% |
| Northern Europe | 1 | 0.3% |
| Norway | 1 | 0.3% | View All 8 Rows |
Sex and Age in Hayti
Sex and Age in Hayti
The most populous age groups in Hayti are Under 5 Years (19 | 10.8%) for men and 25 to 29 Years (43 | 22.3%) for women.
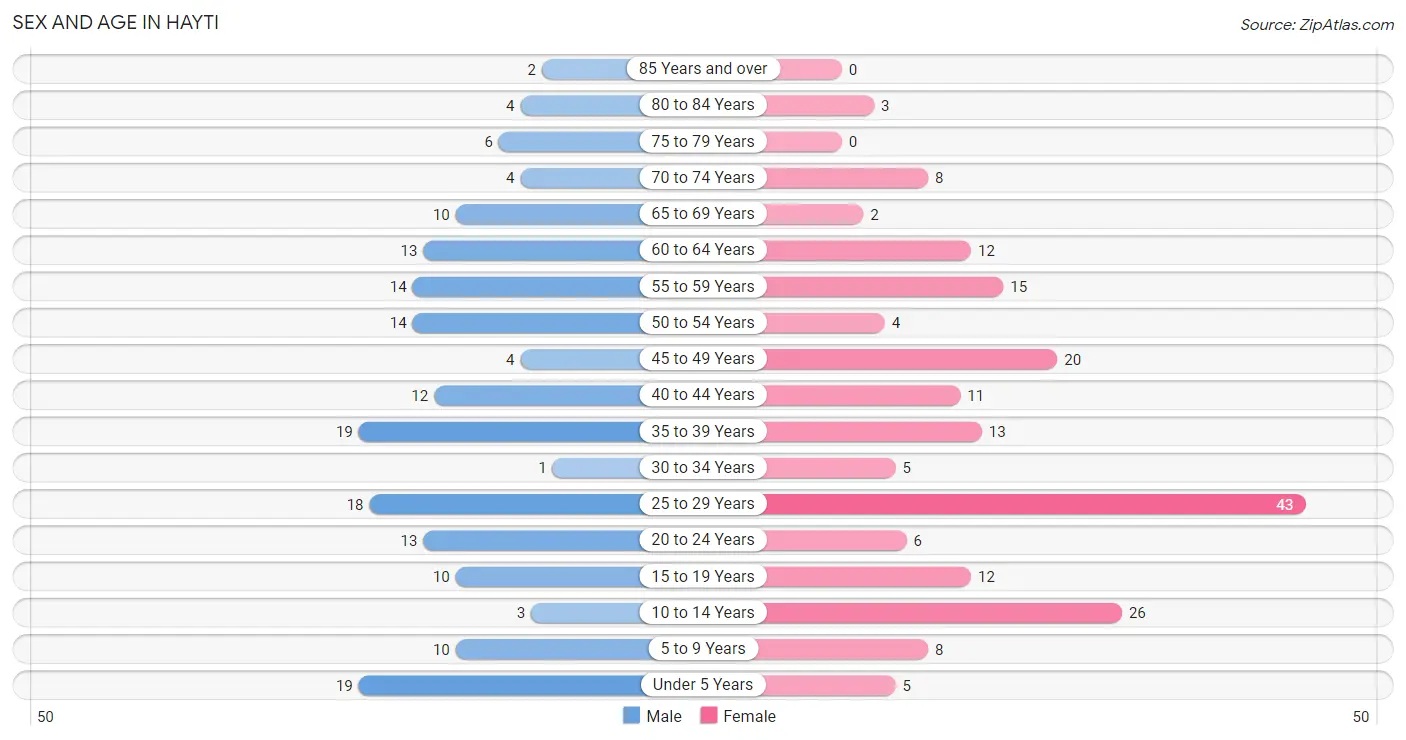
| Age Bracket | Male | Female |
| Under 5 Years | 19 (10.8%) | 5 (2.6%) |
| 5 to 9 Years | 10 (5.7%) | 8 (4.2%) |
| 10 to 14 Years | 3 (1.7%) | 26 (13.5%) |
| 15 to 19 Years | 10 (5.7%) | 12 (6.2%) |
| 20 to 24 Years | 13 (7.4%) | 6 (3.1%) |
| 25 to 29 Years | 18 (10.2%) | 43 (22.3%) |
| 30 to 34 Years | 1 (0.6%) | 5 (2.6%) |
| 35 to 39 Years | 19 (10.8%) | 13 (6.7%) |
| 40 to 44 Years | 12 (6.8%) | 11 (5.7%) |
| 45 to 49 Years | 4 (2.3%) | 20 (10.4%) |
| 50 to 54 Years | 14 (8.0%) | 4 (2.1%) |
| 55 to 59 Years | 14 (8.0%) | 15 (7.8%) |
| 60 to 64 Years | 13 (7.4%) | 12 (6.2%) |
| 65 to 69 Years | 10 (5.7%) | 2 (1.0%) |
| 70 to 74 Years | 4 (2.3%) | 8 (4.2%) |
| 75 to 79 Years | 6 (3.4%) | 0 (0.0%) |
| 80 to 84 Years | 4 (2.3%) | 3 (1.5%) |
| 85 Years and over | 2 (1.1%) | 0 (0.0%) |
| Total | 176 (100.0%) | 193 (100.0%) |
Families and Households in Hayti
Median Family Size in Hayti
The median family size in Hayti is 2.92 persons per family, with married-couple families (82 | 85.4%) accounting for the largest median family size of 3.04 persons per family. On the other hand, single female/mother families (11 | 11.5%) represent the smallest median family size with 2.18 persons per family.
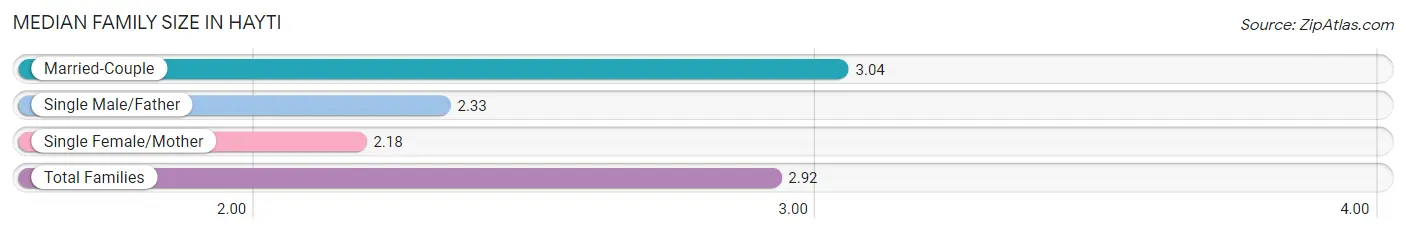
| Family Type | # Families | Family Size |
| Married-Couple | 82 (85.4%) | 3.04 |
| Single Male/Father | 3 (3.1%) | 2.33 |
| Single Female/Mother | 11 (11.5%) | 2.18 |
| Total Families | 96 (100.0%) | 2.92 |
Median Household Size in Hayti
The median household size in Hayti is 2.13 persons per household, with married-couple households (82 | 47.4%) accounting for the largest median household size of 3.04 persons per household. non-family households (77 | 44.5%) represent the smallest median household size with 1.12 persons per household.
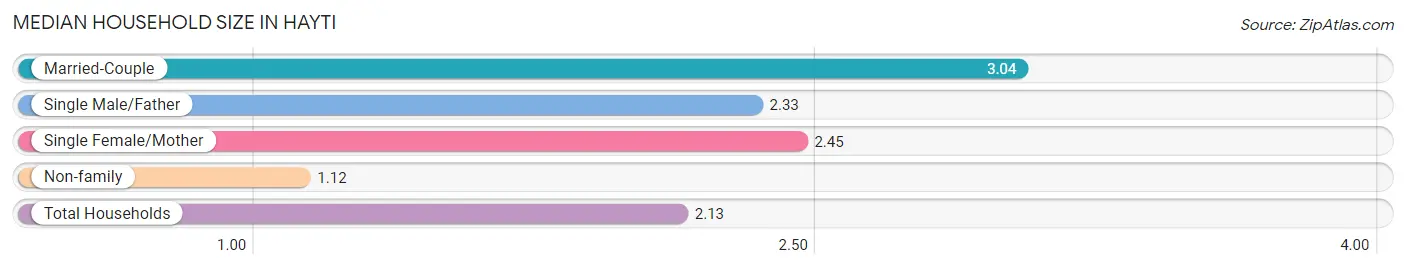
| Household Type | # Households | Household Size |
| Married-Couple | 82 (47.4%) | 3.04 |
| Single Male/Father | 3 (1.7%) | 2.33 |
| Single Female/Mother | 11 (6.4%) | 2.45 |
| Non-family | 77 (44.5%) | 1.12 |
| Total Households | 173 (100.0%) | 2.13 |
Household Size by Marriage Status in Hayti
Out of a total of 173 households in Hayti, 96 (55.5%) are family households, while 77 (44.5%) are nonfamily households. The most numerous type of family households are 2-person households, comprising 46, and the most common type of nonfamily households are 1-person households, comprising 71.
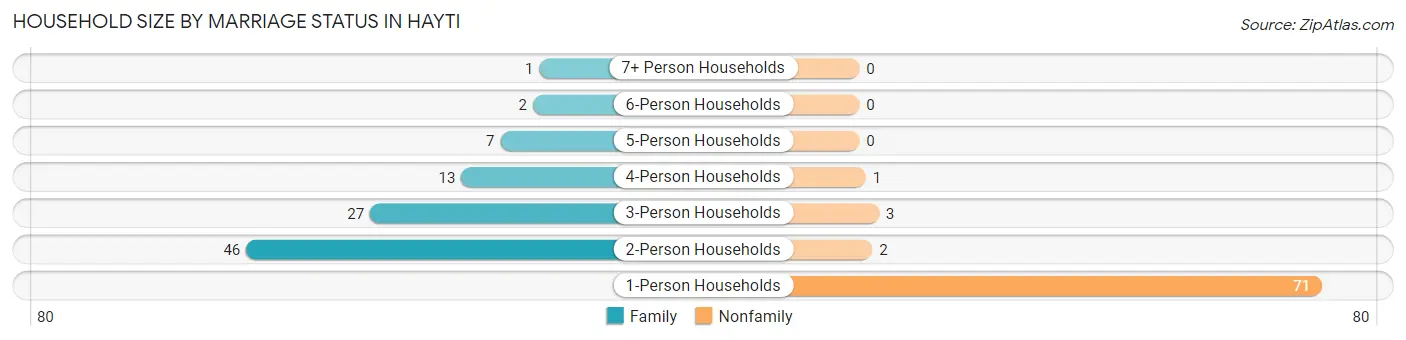
| Household Size | Family Households | Nonfamily Households |
| 1-Person Households | - | 71 (41.0%) |
| 2-Person Households | 46 (26.6%) | 2 (1.2%) |
| 3-Person Households | 27 (15.6%) | 3 (1.7%) |
| 4-Person Households | 13 (7.5%) | 1 (0.6%) |
| 5-Person Households | 7 (4.1%) | 0 (0.0%) |
| 6-Person Households | 2 (1.2%) | 0 (0.0%) |
| 7+ Person Households | 1 (0.6%) | 0 (0.0%) |
| Total | 96 (55.5%) | 77 (44.5%) |
Female Fertility in Hayti
Fertility by Age in Hayti
Average fertility rate in Hayti is 36.0 births per 1,000 women. Women in the age bracket of 20 to 34 years have the highest fertility rate with 56.0 births per 1,000 women. Women in the age bracket of 20 to 34 years acount for 75.0% of all women with births.
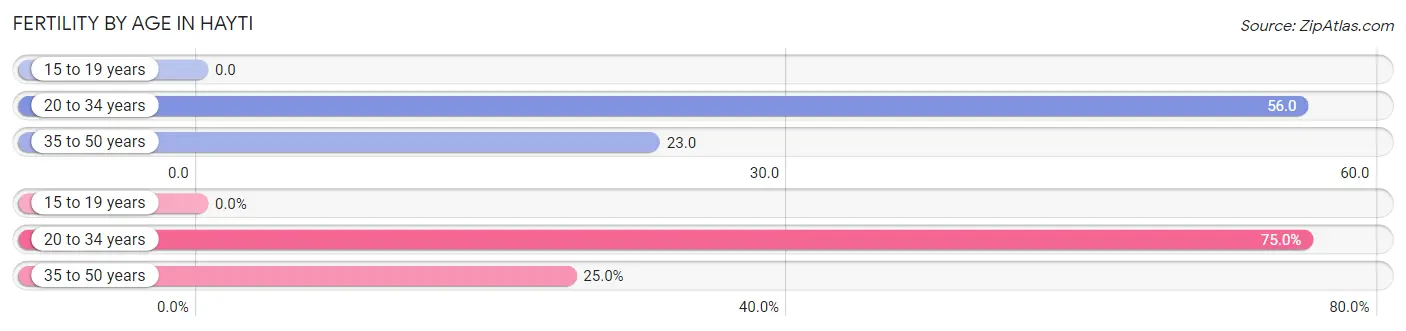
| Age Bracket | Women with Births | Births / 1,000 Women |
| 15 to 19 years | 0 (0.0%) | 0.0 |
| 20 to 34 years | 3 (75.0%) | 56.0 |
| 35 to 50 years | 1 (25.0%) | 23.0 |
| Total | 4 (100.0%) | 36.0 |
Fertility by Age by Marriage Status in Hayti
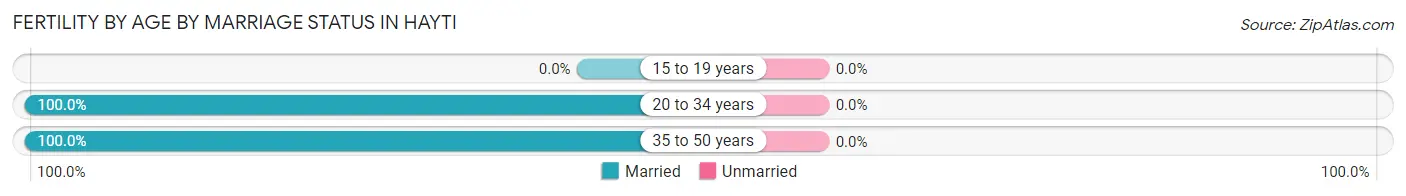
| Age Bracket | Married | Unmarried |
| 15 to 19 years | 0 (0.0%) | 0 (0.0%) |
| 20 to 34 years | 3 (100.0%) | 0 (0.0%) |
| 35 to 50 years | 1 (100.0%) | 0 (0.0%) |
| Total | 4 (100.0%) | 0 (0.0%) |
Fertility by Education in Hayti
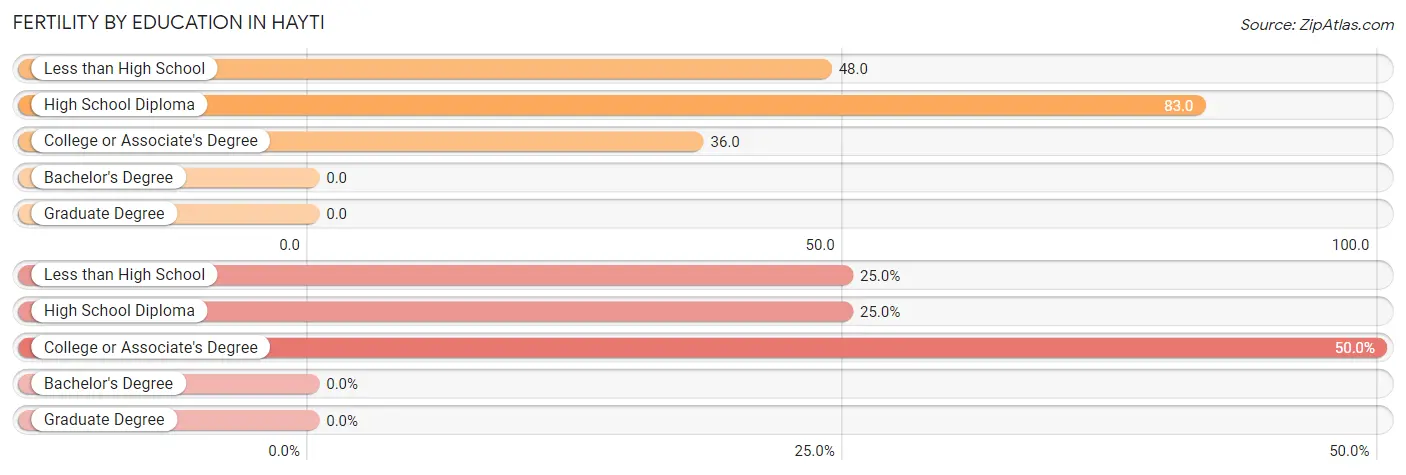
| Educational Attainment | Women with Births | Births / 1,000 Women |
| Less than High School | 1 (25.0%) | 48.0 |
| High School Diploma | 1 (25.0%) | 83.0 |
| College or Associate's Degree | 2 (50.0%) | 36.0 |
| Bachelor's Degree | 0 (0.0%) | 0.0 |
| Graduate Degree | 0 (0.0%) | 0.0 |
| Total | 4 (100.0%) | 36.0 |
Fertility by Education by Marriage Status in Hayti
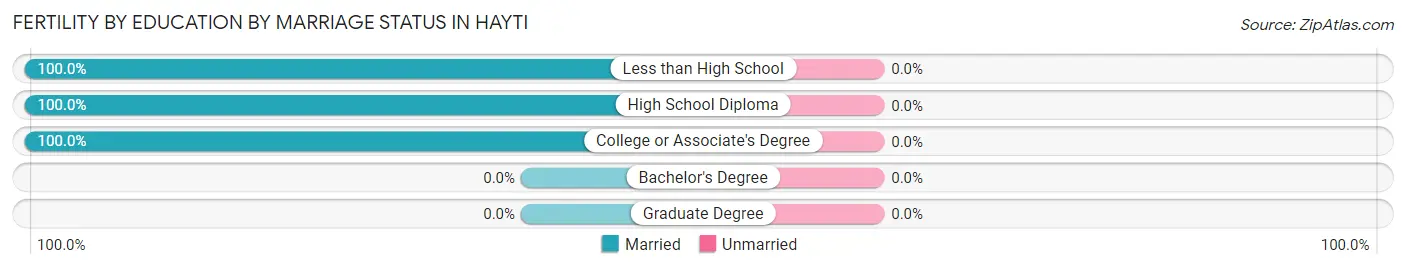
| Educational Attainment | Married | Unmarried |
| Less than High School | 1 (100.0%) | 0 (0.0%) |
| High School Diploma | 1 (100.0%) | 0 (0.0%) |
| College or Associate's Degree | 2 (100.0%) | 0 (0.0%) |
| Bachelor's Degree | 0 (0.0%) | 0 (0.0%) |
| Graduate Degree | 0 (0.0%) | 0 (0.0%) |
| Total | 4 (100.0%) | 0 (0.0%) |
Employment Characteristics in Hayti
Employment by Class of Employer in Hayti
Among the 231 employed individuals in Hayti, private company employees (179 | 77.5%), local government employees (21 | 9.1%), and self-employed (not incorporated) (13 | 5.6%) make up the most common classes of employment.
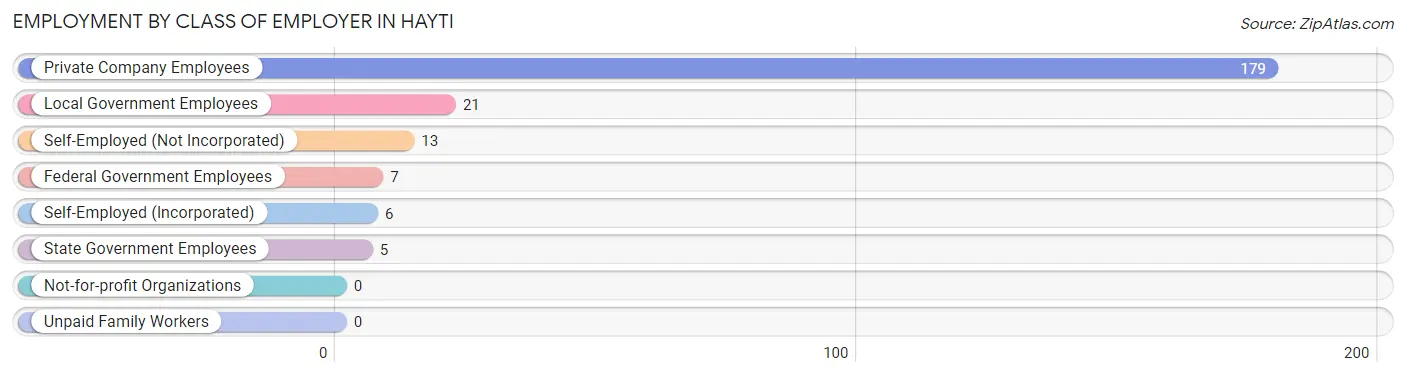
| Employer Class | # Employees | % Employees |
| Private Company Employees | 179 | 77.5% |
| Self-Employed (Incorporated) | 6 | 2.6% |
| Self-Employed (Not Incorporated) | 13 | 5.6% |
| Not-for-profit Organizations | 0 | 0.0% |
| Local Government Employees | 21 | 9.1% |
| State Government Employees | 5 | 2.2% |
| Federal Government Employees | 7 | 3.0% |
| Unpaid Family Workers | 0 | 0.0% |
| Total | 231 | 100.0% |
Employment Status by Age in Hayti
According to the labor force statistics for Hayti, out of the total population over 16 years of age (294), 79.9% or 235 individuals are in the labor force, with 1.7% or 4 of them unemployed. The age group with the highest labor force participation rate is 30 to 34 years, with 100.0% or 6 individuals in the labor force. Within the labor force, the 65 to 74 years age range has the highest percentage of unemployed individuals, with 28.6% or 4 of them being unemployed.
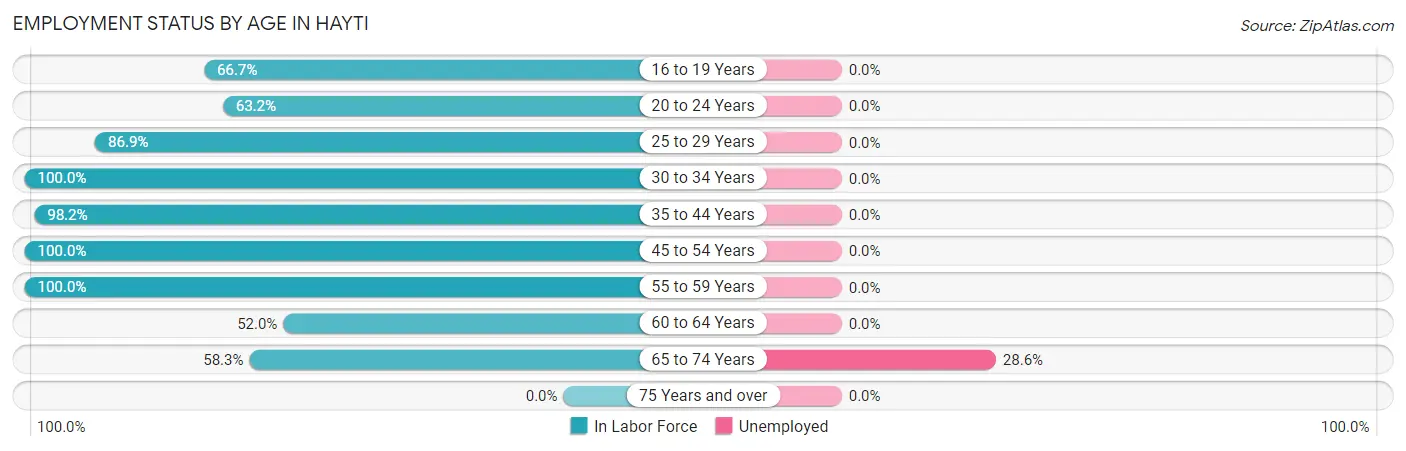
| Age Bracket | In Labor Force | Unemployed |
| 16 to 19 Years | 12 (66.7%) | 0 (0.0%) |
| 20 to 24 Years | 12 (63.2%) | 0 (0.0%) |
| 25 to 29 Years | 53 (86.9%) | 0 (0.0%) |
| 30 to 34 Years | 6 (100.0%) | 0 (0.0%) |
| 35 to 44 Years | 54 (98.2%) | 0 (0.0%) |
| 45 to 54 Years | 42 (100.0%) | 0 (0.0%) |
| 55 to 59 Years | 29 (100.0%) | 0 (0.0%) |
| 60 to 64 Years | 13 (52.0%) | 0 (0.0%) |
| 65 to 74 Years | 14 (58.3%) | 4 (28.6%) |
| 75 Years and over | 0 (0.0%) | 0 (0.0%) |
| Total | 235 (79.9%) | 4 (1.7%) |
Employment Status by Educational Attainment in Hayti
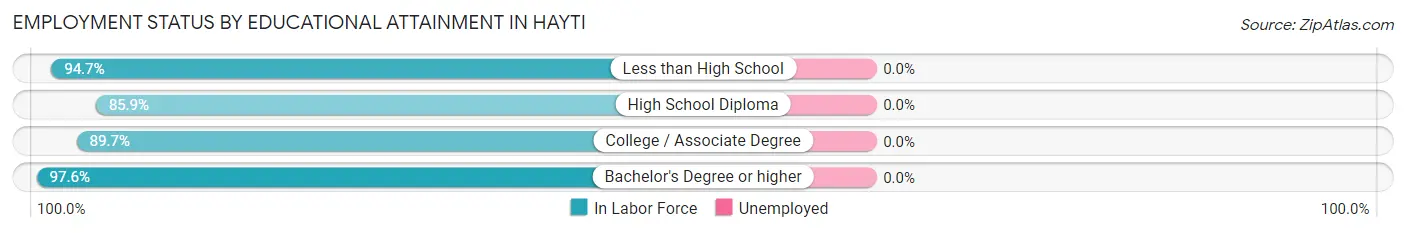
| Educational Attainment | In Labor Force | Unemployed |
| Less than High School | 18 (94.7%) | 0 (0.0%) |
| High School Diploma | 61 (85.9%) | 0 (0.0%) |
| College / Associate Degree | 78 (89.7%) | 0 (0.0%) |
| Bachelor's Degree or higher | 40 (97.6%) | 0 (0.0%) |
| Total | 197 (90.4%) | 0 (0.0%) |
Employment Occupations by Sex in Hayti
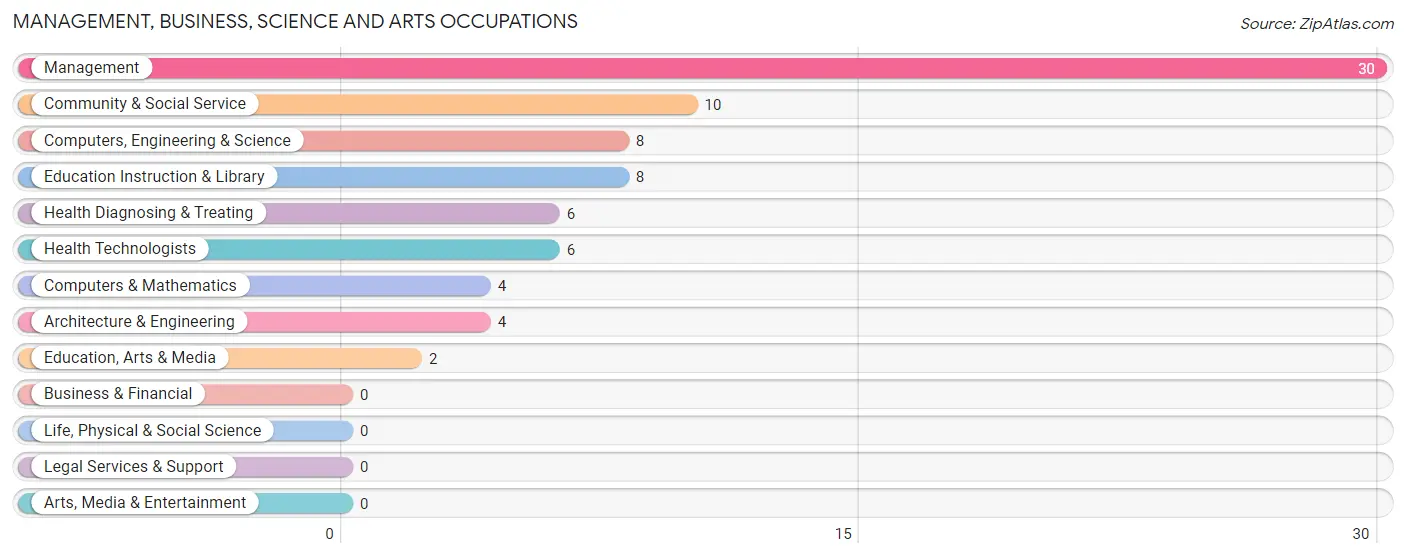
Management, Business, Science and Arts Occupations
The most common Management, Business, Science and Arts occupations in Hayti are Management (30 | 13.0%), Community & Social Service (10 | 4.3%), Computers, Engineering & Science (8 | 3.5%), Education Instruction & Library (8 | 3.5%), and Health Diagnosing & Treating (6 | 2.6%).
Management, Business, Science and Arts Occupations by Sex
Within the Management, Business, Science and Arts occupations in Hayti, the most male-oriented occupations are Management (83.3%), Architecture & Engineering (50.0%), and Computers, Engineering & Science (37.5%), while the most female-oriented occupations are Community & Social Service (100.0%), Education, Arts & Media (100.0%), and Education Instruction & Library (100.0%).
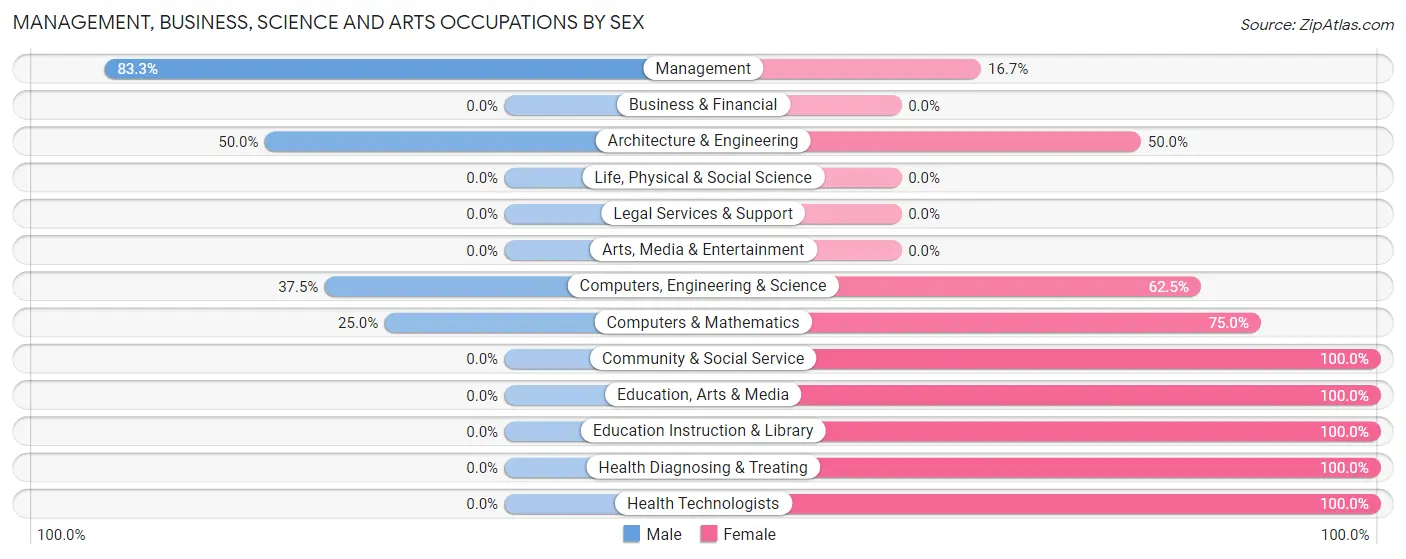
| Occupation | Male | Female |
| Management | 25 (83.3%) | 5 (16.7%) |
| Business & Financial | 0 (0.0%) | 0 (0.0%) |
| Computers, Engineering & Science | 3 (37.5%) | 5 (62.5%) |
| Computers & Mathematics | 1 (25.0%) | 3 (75.0%) |
| Architecture & Engineering | 2 (50.0%) | 2 (50.0%) |
| Life, Physical & Social Science | 0 (0.0%) | 0 (0.0%) |
| Community & Social Service | 0 (0.0%) | 10 (100.0%) |
| Education, Arts & Media | 0 (0.0%) | 2 (100.0%) |
| Legal Services & Support | 0 (0.0%) | 0 (0.0%) |
| Education Instruction & Library | 0 (0.0%) | 8 (100.0%) |
| Arts, Media & Entertainment | 0 (0.0%) | 0 (0.0%) |
| Health Diagnosing & Treating | 0 (0.0%) | 6 (100.0%) |
| Health Technologists | 0 (0.0%) | 6 (100.0%) |
| Total (Category) | 28 (51.8%) | 26 (48.1%) |
| Total (Overall) | 111 (48.0%) | 120 (51.9%) |
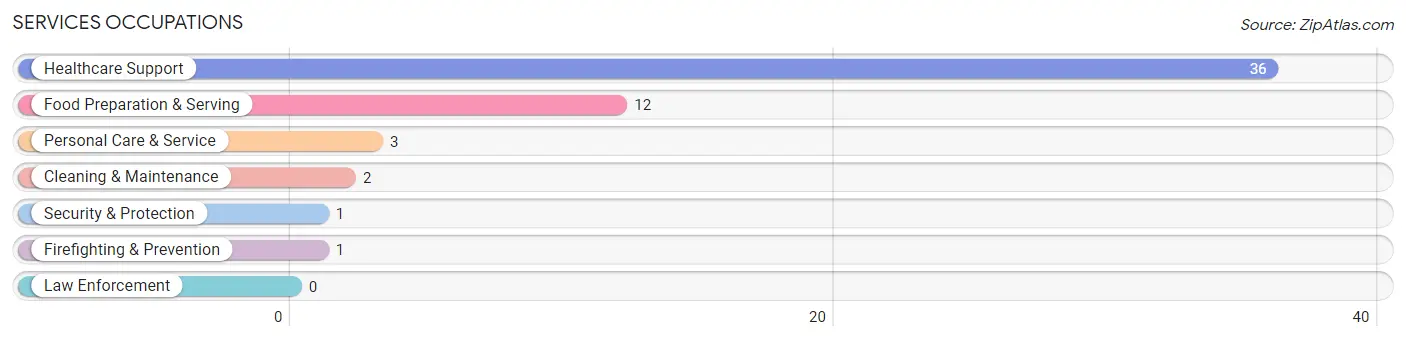
Services Occupations
The most common Services occupations in Hayti are Healthcare Support (36 | 15.6%), Food Preparation & Serving (12 | 5.2%), Personal Care & Service (3 | 1.3%), Cleaning & Maintenance (2 | 0.9%), and Security & Protection (1 | 0.4%).
Services Occupations by Sex
Within the Services occupations in Hayti, the most male-oriented occupations are Security & Protection (100.0%), Firefighting & Prevention (100.0%), and Cleaning & Maintenance (100.0%), while the most female-oriented occupations are Healthcare Support (100.0%), Personal Care & Service (100.0%), and Food Preparation & Serving (58.3%).
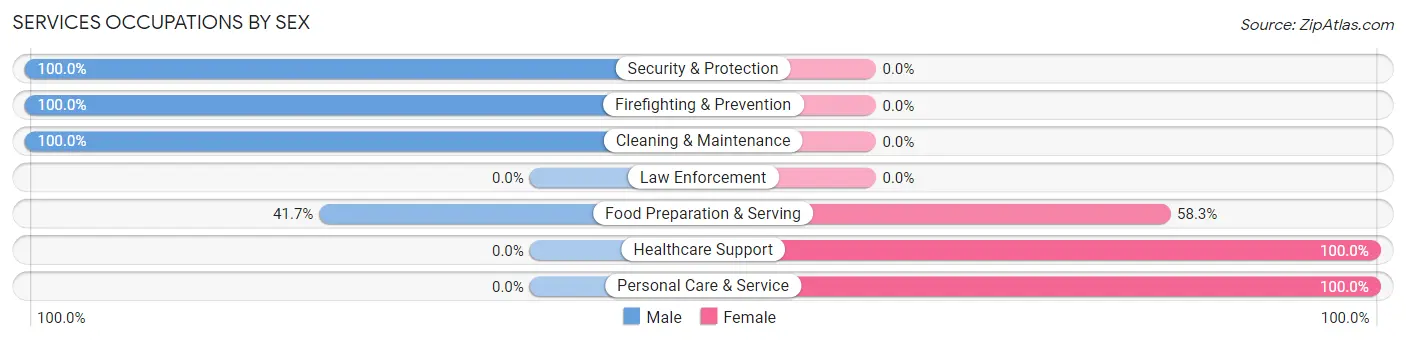
| Occupation | Male | Female |
| Healthcare Support | 0 (0.0%) | 36 (100.0%) |
| Security & Protection | 1 (100.0%) | 0 (0.0%) |
| Firefighting & Prevention | 1 (100.0%) | 0 (0.0%) |
| Law Enforcement | 0 (0.0%) | 0 (0.0%) |
| Food Preparation & Serving | 5 (41.7%) | 7 (58.3%) |
| Cleaning & Maintenance | 2 (100.0%) | 0 (0.0%) |
| Personal Care & Service | 0 (0.0%) | 3 (100.0%) |
| Total (Category) | 8 (14.8%) | 46 (85.2%) |
| Total (Overall) | 111 (48.0%) | 120 (51.9%) |
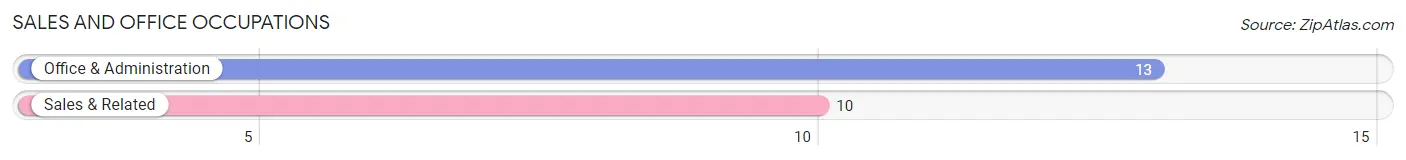
Sales and Office Occupations
The most common Sales and Office occupations in Hayti are Office & Administration (13 | 5.6%), and Sales & Related (10 | 4.3%).
Sales and Office Occupations by Sex
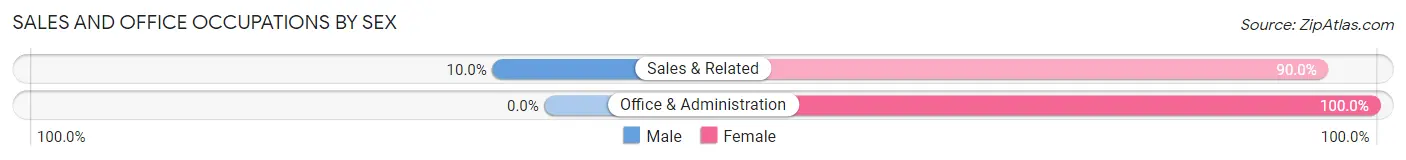
| Occupation | Male | Female |
| Sales & Related | 1 (10.0%) | 9 (90.0%) |
| Office & Administration | 0 (0.0%) | 13 (100.0%) |
| Total (Category) | 1 (4.3%) | 22 (95.7%) |
| Total (Overall) | 111 (48.0%) | 120 (51.9%) |
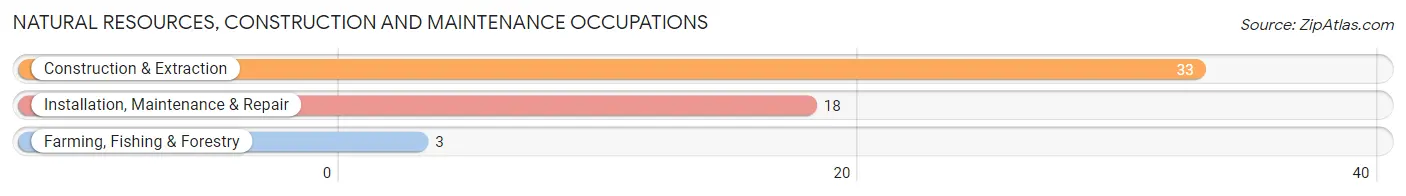
Natural Resources, Construction and Maintenance Occupations
The most common Natural Resources, Construction and Maintenance occupations in Hayti are Construction & Extraction (33 | 14.3%), Installation, Maintenance & Repair (18 | 7.8%), and Farming, Fishing & Forestry (3 | 1.3%).
Natural Resources, Construction and Maintenance Occupations by Sex
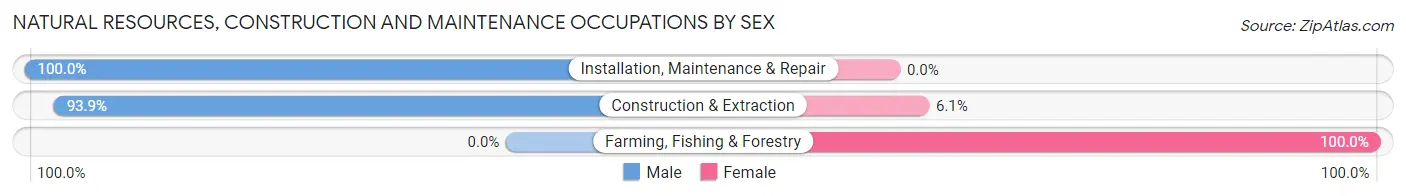
| Occupation | Male | Female |
| Farming, Fishing & Forestry | 0 (0.0%) | 3 (100.0%) |
| Construction & Extraction | 31 (93.9%) | 2 (6.1%) |
| Installation, Maintenance & Repair | 18 (100.0%) | 0 (0.0%) |
| Total (Category) | 49 (90.7%) | 5 (9.3%) |
| Total (Overall) | 111 (48.0%) | 120 (51.9%) |
Production, Transportation and Moving Occupations
The most common Production, Transportation and Moving occupations in Hayti are Production (31 | 13.4%), Material Moving (8 | 3.5%), and Transportation (7 | 3.0%).
Production, Transportation and Moving Occupations by Sex
| Occupation | Male | Female |
| Production | 14 (45.2%) | 17 (54.8%) |
| Transportation | 4 (57.1%) | 3 (42.9%) |
| Material Moving | 7 (87.5%) | 1 (12.5%) |
| Total (Category) | 25 (54.3%) | 21 (45.7%) |
| Total (Overall) | 111 (48.0%) | 120 (51.9%) |
Employment Industries by Sex in Hayti
Employment Industries in Hayti
The major employment industries in Hayti include Health Care & Social Assistance (49 | 21.2%), Construction (47 | 20.3%), Manufacturing (44 | 19.1%), Agriculture, Fishing & Hunting (23 | 10.0%), and Retail Trade (16 | 6.9%).
Employment Industries by Sex in Hayti
The Hayti industries that see more men than women are Utilities (100.0%), Construction (89.4%), and Accommodation & Food Services (71.4%), whereas the industries that tend to have a higher number of women are Wholesale Trade (100.0%), Health Care & Social Assistance (100.0%), and Finance & Insurance (87.5%).
| Industry | Male | Female |
| Agriculture, Fishing & Hunting | 14 (60.9%) | 9 (39.1%) |
| Mining, Quarrying, & Extraction | 0 (0.0%) | 0 (0.0%) |
| Construction | 42 (89.4%) | 5 (10.6%) |
| Manufacturing | 24 (54.5%) | 20 (45.5%) |
| Wholesale Trade | 0 (0.0%) | 2 (100.0%) |
| Retail Trade | 7 (43.8%) | 9 (56.2%) |
| Transportation & Warehousing | 4 (50.0%) | 4 (50.0%) |
| Utilities | 8 (100.0%) | 0 (0.0%) |
| Information | 0 (0.0%) | 0 (0.0%) |
| Finance & Insurance | 1 (12.5%) | 7 (87.5%) |
| Real Estate, Rental & Leasing | 0 (0.0%) | 0 (0.0%) |
| Professional & Scientific | 0 (0.0%) | 0 (0.0%) |
| Enterprise Management | 0 (0.0%) | 0 (0.0%) |
| Administrative & Support | 0 (0.0%) | 0 (0.0%) |
| Educational Services | 2 (18.2%) | 9 (81.8%) |
| Health Care & Social Assistance | 0 (0.0%) | 49 (100.0%) |
| Arts, Entertainment & Recreation | 0 (0.0%) | 0 (0.0%) |
| Accommodation & Food Services | 5 (71.4%) | 2 (28.6%) |
| Public Administration | 1 (33.3%) | 2 (66.7%) |
| Total | 111 (48.0%) | 120 (51.9%) |
Education in Hayti
School Enrollment in Hayti
The most common levels of schooling among the 78 students in Hayti are middle school (28 | 35.9%), high school (23 | 29.5%), and elementary school (11 | 14.1%).
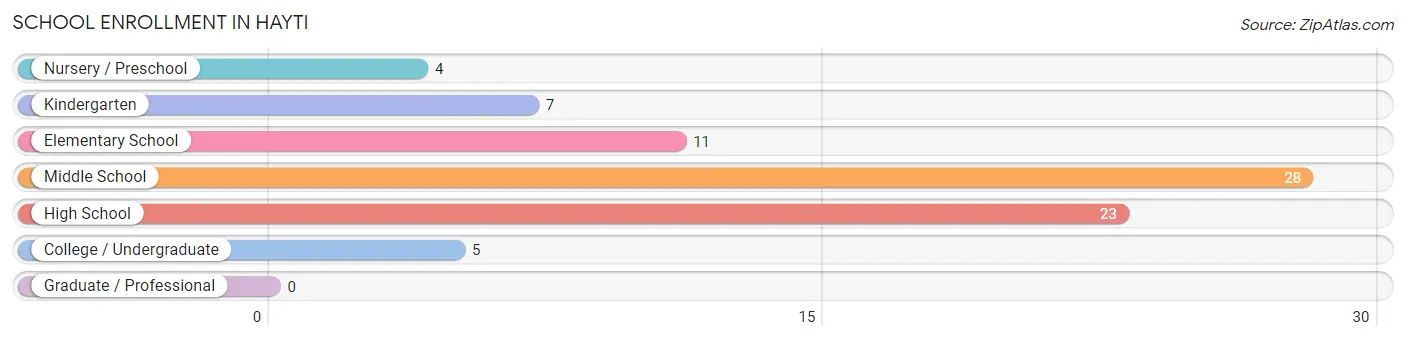
| School Level | # Students | % Students |
| Nursery / Preschool | 4 | 5.1% |
| Kindergarten | 7 | 9.0% |
| Elementary School | 11 | 14.1% |
| Middle School | 28 | 35.9% |
| High School | 23 | 29.5% |
| College / Undergraduate | 5 | 6.4% |
| Graduate / Professional | 0 | 0.0% |
| Total | 78 | 100.0% |
School Enrollment by Age by Funding Source in Hayti
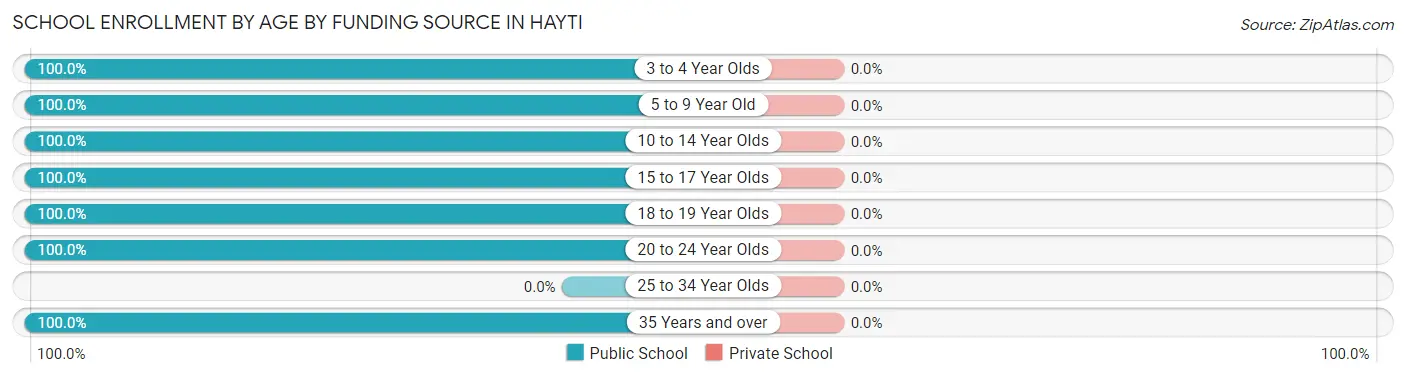
| Age Bracket | Public School | Private School |
| 3 to 4 Year Olds | 4 (100.0%) | 0 (0.0%) |
| 5 to 9 Year Old | 18 (100.0%) | 0 (0.0%) |
| 10 to 14 Year Olds | 29 (100.0%) | 0 (0.0%) |
| 15 to 17 Year Olds | 14 (100.0%) | 0 (0.0%) |
| 18 to 19 Year Olds | 8 (100.0%) | 0 (0.0%) |
| 20 to 24 Year Olds | 4 (100.0%) | 0 (0.0%) |
| 25 to 34 Year Olds | 0 (0.0%) | 0 (0.0%) |
| 35 Years and over | 1 (100.0%) | 0 (0.0%) |
| Total | 78 (100.0%) | 0 (0.0%) |
Educational Attainment by Field of Study in Hayti
Social sciences (11 | 19.3%), business (11 | 19.3%), arts & humanities (10 | 17.5%), bio, nature & agricultural (8 | 14.0%), and computers & mathematics (5 | 8.8%) are the most common fields of study among 57 individuals in Hayti who have obtained a bachelor's degree or higher.
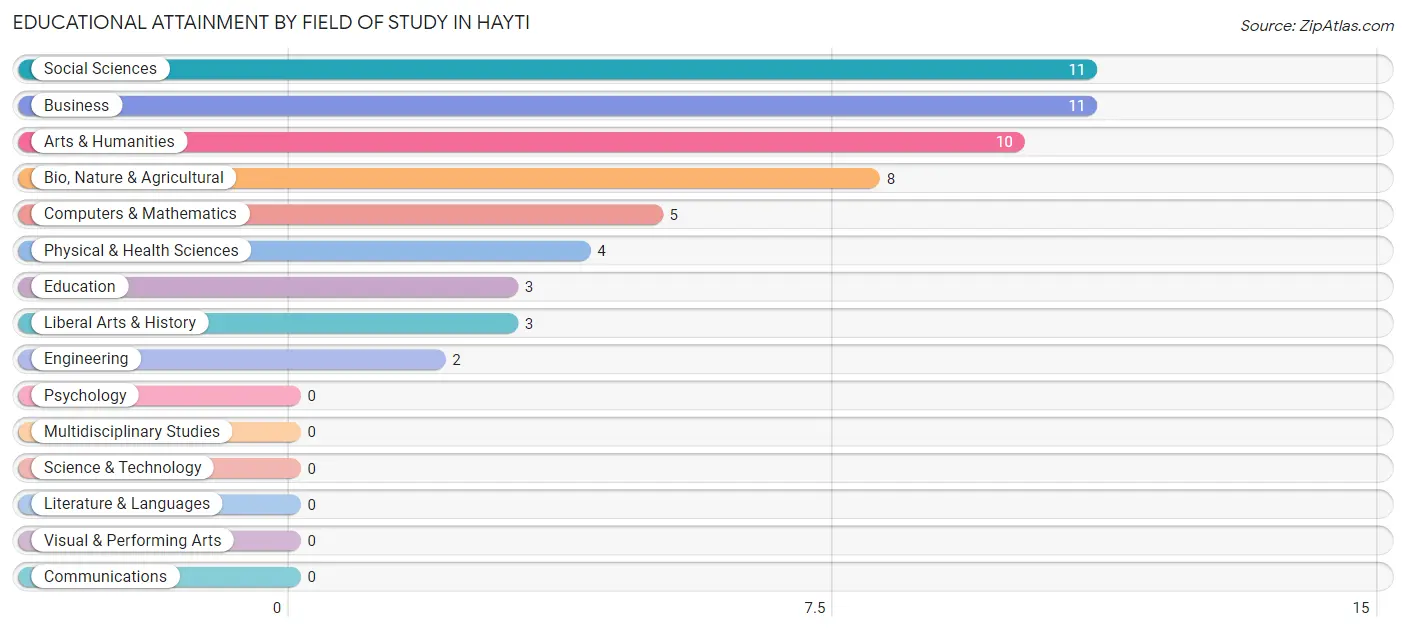
| Field of Study | # Graduates | % Graduates |
| Computers & Mathematics | 5 | 8.8% |
| Bio, Nature & Agricultural | 8 | 14.0% |
| Physical & Health Sciences | 4 | 7.0% |
| Psychology | 0 | 0.0% |
| Social Sciences | 11 | 19.3% |
| Engineering | 2 | 3.5% |
| Multidisciplinary Studies | 0 | 0.0% |
| Science & Technology | 0 | 0.0% |
| Business | 11 | 19.3% |
| Education | 3 | 5.3% |
| Literature & Languages | 0 | 0.0% |
| Liberal Arts & History | 3 | 5.3% |
| Visual & Performing Arts | 0 | 0.0% |
| Communications | 0 | 0.0% |
| Arts & Humanities | 10 | 17.5% |
| Total | 57 | 100.0% |
Transportation & Commute in Hayti
Vehicle Availability by Sex in Hayti
The most prevalent vehicle ownership categories in Hayti are males with 2 vehicles (34, accounting for 30.6%) and females with 2 vehicles (19, making up 28.3%).
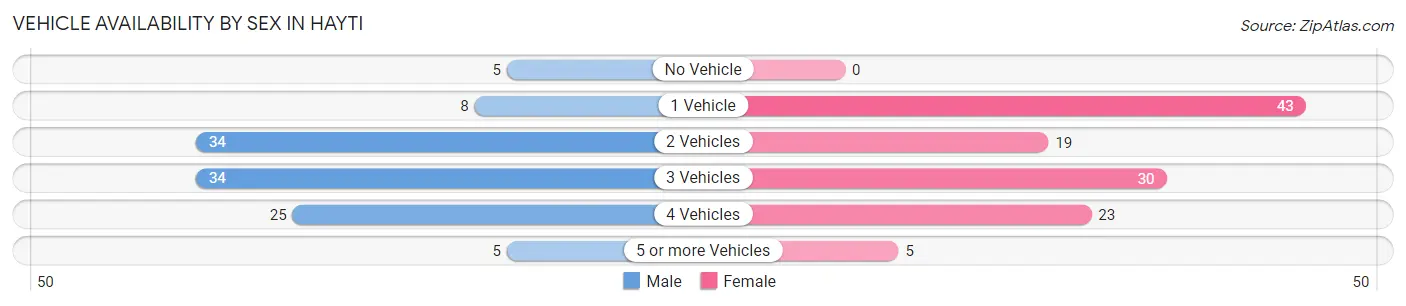
| Vehicles Available | Male | Female |
| No Vehicle | 5 (4.5%) | 0 (0.0%) |
| 1 Vehicle | 8 (7.2%) | 43 (35.8%) |
| 2 Vehicles | 34 (30.6%) | 19 (15.8%) |
| 3 Vehicles | 34 (30.6%) | 30 (25.0%) |
| 4 Vehicles | 25 (22.5%) | 23 (19.2%) |
| 5 or more Vehicles | 5 (4.5%) | 5 (4.2%) |
| Total | 111 (100.0%) | 120 (100.0%) |
Commute Time in Hayti
The most frequently occuring commute durations in Hayti are 10 to 14 minutes (79 commuters, 35.1%), 5 to 9 minutes (37 commuters, 16.4%), and 20 to 24 minutes (21 commuters, 9.3%).
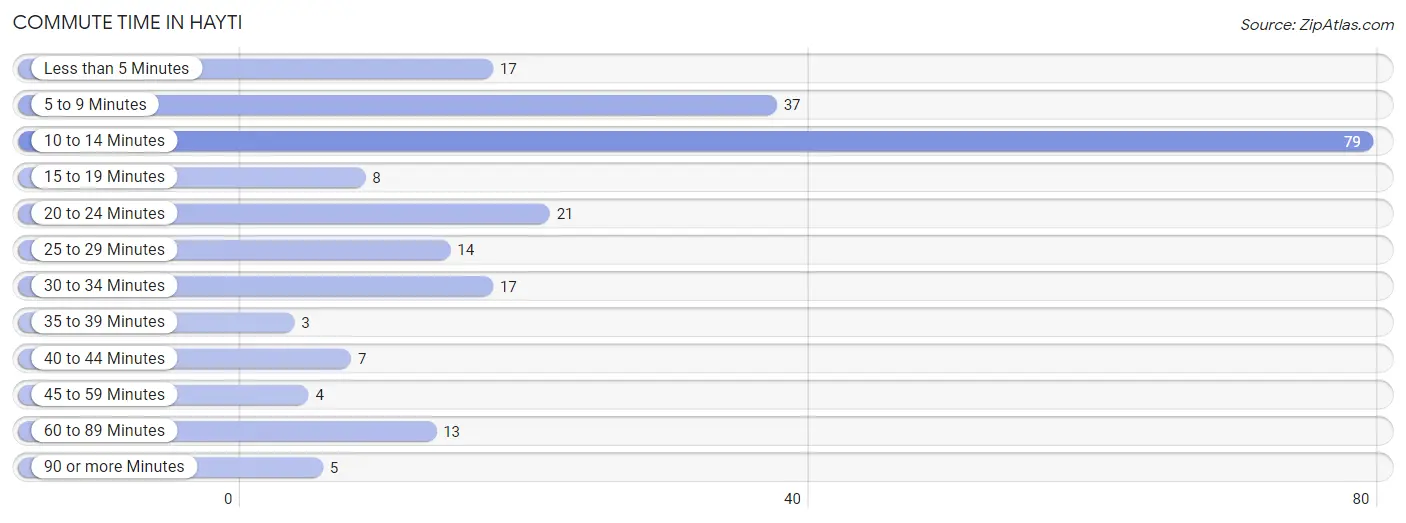
| Commute Time | # Commuters | % Commuters |
| Less than 5 Minutes | 17 | 7.6% |
| 5 to 9 Minutes | 37 | 16.4% |
| 10 to 14 Minutes | 79 | 35.1% |
| 15 to 19 Minutes | 8 | 3.6% |
| 20 to 24 Minutes | 21 | 9.3% |
| 25 to 29 Minutes | 14 | 6.2% |
| 30 to 34 Minutes | 17 | 7.6% |
| 35 to 39 Minutes | 3 | 1.3% |
| 40 to 44 Minutes | 7 | 3.1% |
| 45 to 59 Minutes | 4 | 1.8% |
| 60 to 89 Minutes | 13 | 5.8% |
| 90 or more Minutes | 5 | 2.2% |
Commute Time by Sex in Hayti
The most common commute times in Hayti are 5 to 9 minutes (29 commuters, 26.4%) for males and 10 to 14 minutes (61 commuters, 53.0%) for females.
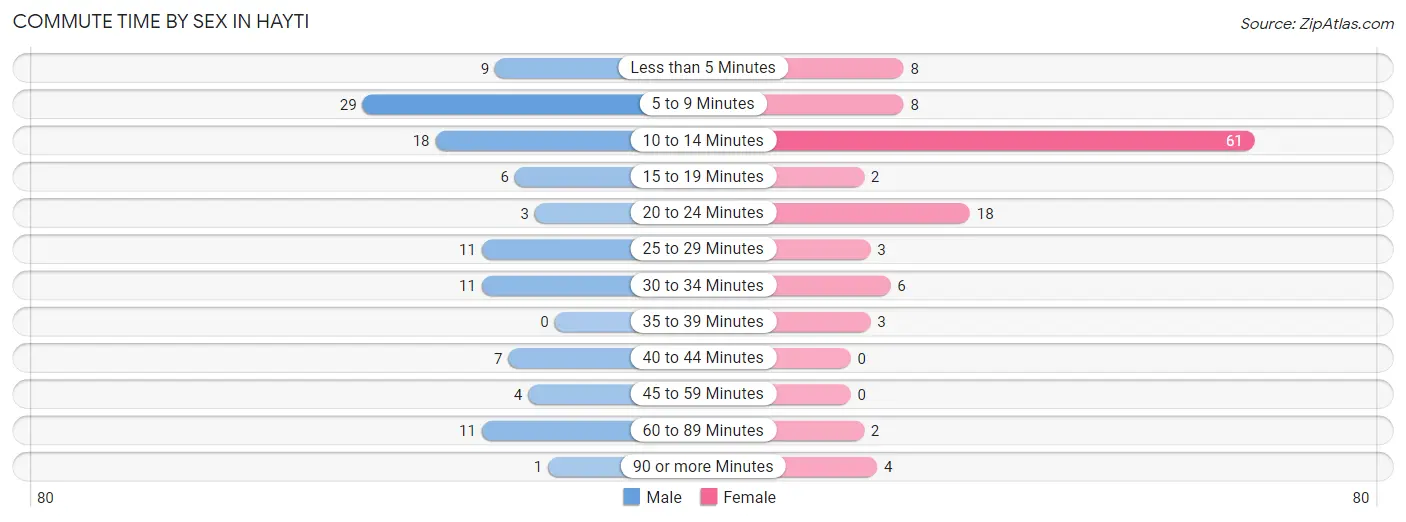
| Commute Time | Male | Female |
| Less than 5 Minutes | 9 (8.2%) | 8 (7.0%) |
| 5 to 9 Minutes | 29 (26.4%) | 8 (7.0%) |
| 10 to 14 Minutes | 18 (16.4%) | 61 (53.0%) |
| 15 to 19 Minutes | 6 (5.4%) | 2 (1.7%) |
| 20 to 24 Minutes | 3 (2.7%) | 18 (15.7%) |
| 25 to 29 Minutes | 11 (10.0%) | 3 (2.6%) |
| 30 to 34 Minutes | 11 (10.0%) | 6 (5.2%) |
| 35 to 39 Minutes | 0 (0.0%) | 3 (2.6%) |
| 40 to 44 Minutes | 7 (6.4%) | 0 (0.0%) |
| 45 to 59 Minutes | 4 (3.6%) | 0 (0.0%) |
| 60 to 89 Minutes | 11 (10.0%) | 2 (1.7%) |
| 90 or more Minutes | 1 (0.9%) | 4 (3.5%) |
Time of Departure to Work by Sex in Hayti
The most frequent times of departure to work in Hayti are 7:30 AM to 7:59 AM (30, 27.3%) for males and 6:30 AM to 6:59 AM (38, 33.0%) for females.
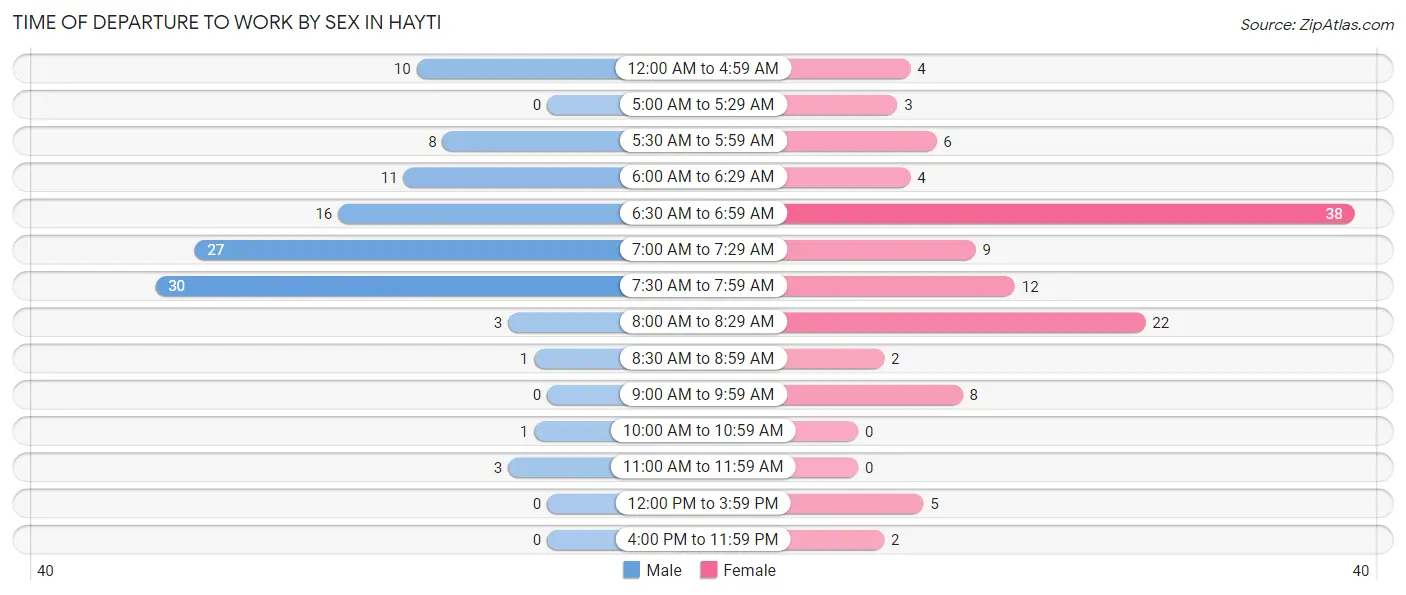
| Time of Departure | Male | Female |
| 12:00 AM to 4:59 AM | 10 (9.1%) | 4 (3.5%) |
| 5:00 AM to 5:29 AM | 0 (0.0%) | 3 (2.6%) |
| 5:30 AM to 5:59 AM | 8 (7.3%) | 6 (5.2%) |
| 6:00 AM to 6:29 AM | 11 (10.0%) | 4 (3.5%) |
| 6:30 AM to 6:59 AM | 16 (14.5%) | 38 (33.0%) |
| 7:00 AM to 7:29 AM | 27 (24.5%) | 9 (7.8%) |
| 7:30 AM to 7:59 AM | 30 (27.3%) | 12 (10.4%) |
| 8:00 AM to 8:29 AM | 3 (2.7%) | 22 (19.1%) |
| 8:30 AM to 8:59 AM | 1 (0.9%) | 2 (1.7%) |
| 9:00 AM to 9:59 AM | 0 (0.0%) | 8 (7.0%) |
| 10:00 AM to 10:59 AM | 1 (0.9%) | 0 (0.0%) |
| 11:00 AM to 11:59 AM | 3 (2.7%) | 0 (0.0%) |
| 12:00 PM to 3:59 PM | 0 (0.0%) | 5 (4.3%) |
| 4:00 PM to 11:59 PM | 0 (0.0%) | 2 (1.7%) |
| Total | 110 (100.0%) | 115 (100.0%) |
Housing Occupancy in Hayti
Occupancy by Ownership in Hayti
Of the total 173 dwellings in Hayti, owner-occupied units account for 129 (74.6%), while renter-occupied units make up 44 (25.4%).
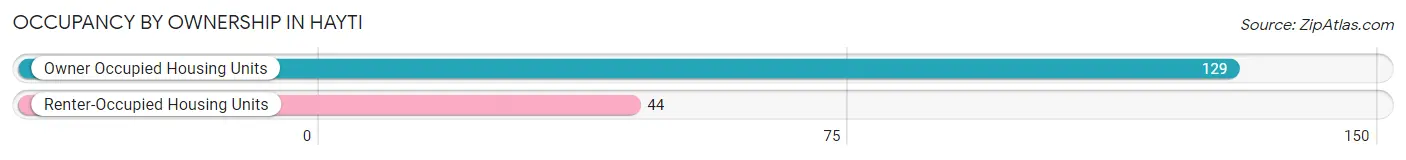
| Occupancy | # Housing Units | % Housing Units |
| Owner Occupied Housing Units | 129 | 74.6% |
| Renter-Occupied Housing Units | 44 | 25.4% |
| Total Occupied Housing Units | 173 | 100.0% |
Occupancy by Household Size in Hayti
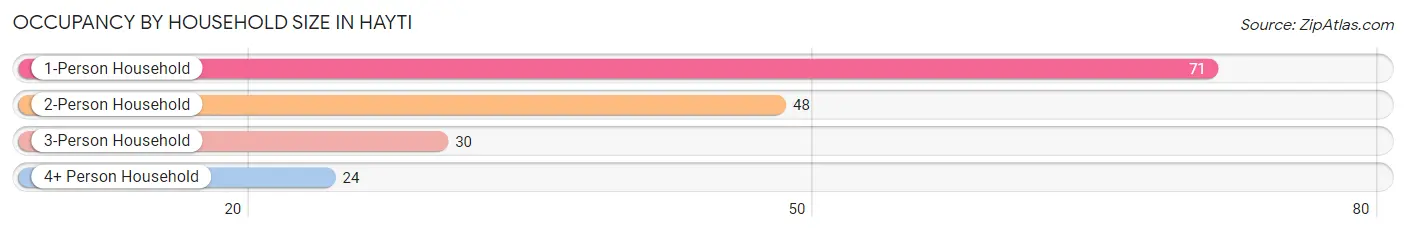
| Household Size | # Housing Units | % Housing Units |
| 1-Person Household | 71 | 41.0% |
| 2-Person Household | 48 | 27.8% |
| 3-Person Household | 30 | 17.3% |
| 4+ Person Household | 24 | 13.9% |
| Total Housing Units | 173 | 100.0% |
Occupancy by Ownership by Household Size in Hayti
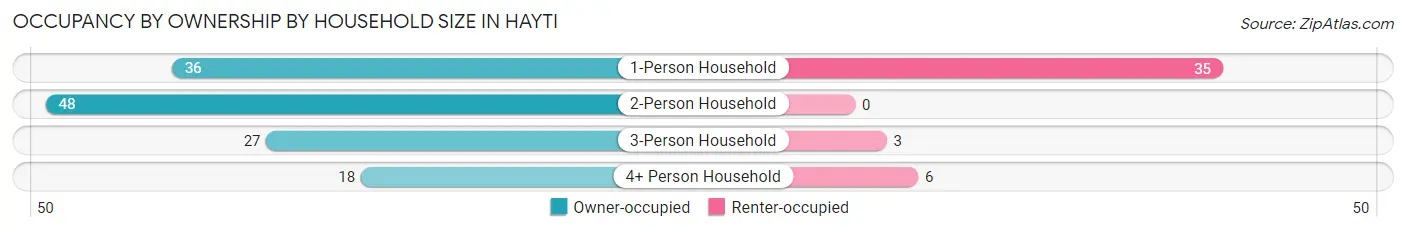
| Household Size | Owner-occupied | Renter-occupied |
| 1-Person Household | 36 (50.7%) | 35 (49.3%) |
| 2-Person Household | 48 (100.0%) | 0 (0.0%) |
| 3-Person Household | 27 (90.0%) | 3 (10.0%) |
| 4+ Person Household | 18 (75.0%) | 6 (25.0%) |
| Total Housing Units | 129 (74.6%) | 44 (25.4%) |
Occupancy by Educational Attainment in Hayti
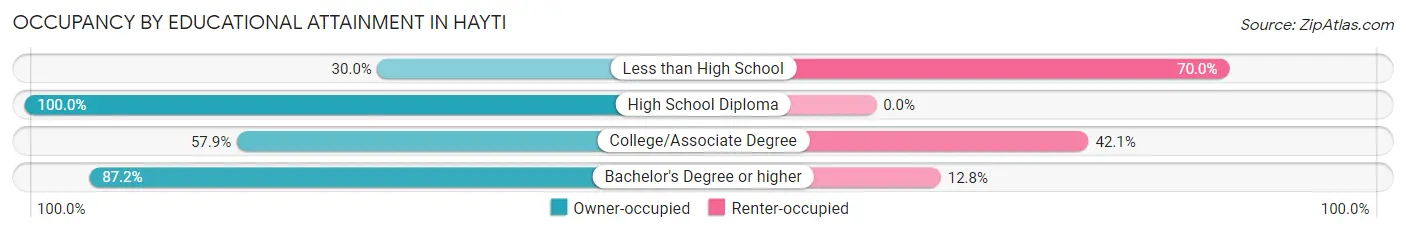
| Household Size | Owner-occupied | Renter-occupied |
| Less than High School | 3 (30.0%) | 7 (70.0%) |
| High School Diploma | 48 (100.0%) | 0 (0.0%) |
| College/Associate Degree | 44 (57.9%) | 32 (42.1%) |
| Bachelor's Degree or higher | 34 (87.2%) | 5 (12.8%) |
Occupancy by Age of Householder in Hayti
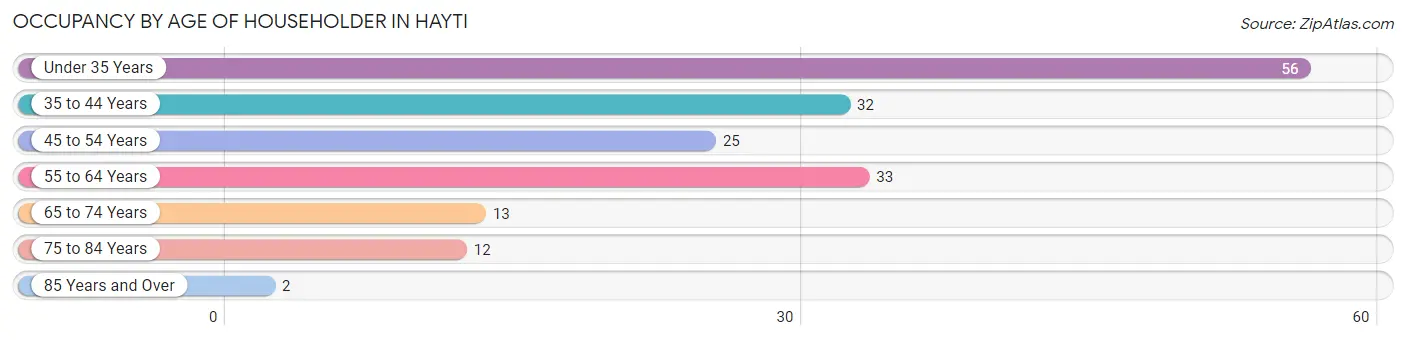
| Age Bracket | # Households | % Households |
| Under 35 Years | 56 | 32.4% |
| 35 to 44 Years | 32 | 18.5% |
| 45 to 54 Years | 25 | 14.4% |
| 55 to 64 Years | 33 | 19.1% |
| 65 to 74 Years | 13 | 7.5% |
| 75 to 84 Years | 12 | 6.9% |
| 85 Years and Over | 2 | 1.2% |
| Total | 173 | 100.0% |
Housing Finances in Hayti
Median Income by Occupancy in Hayti
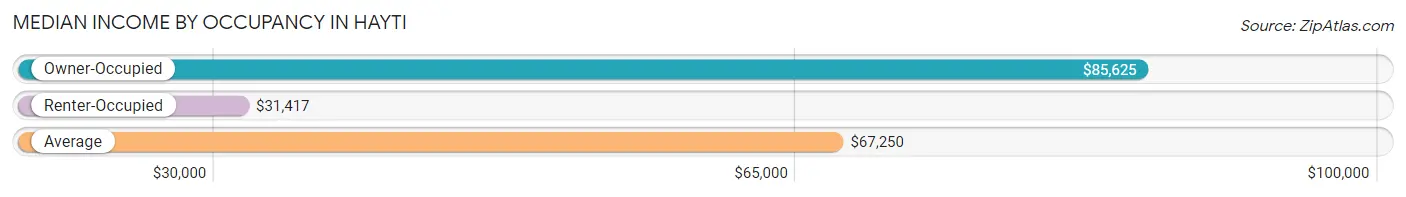
| Occupancy Type | # Households | Median Income |
| Owner-Occupied | 129 (74.6%) | $85,625 |
| Renter-Occupied | 44 (25.4%) | $31,417 |
| Average | 173 (100.0%) | $67,250 |
Occupancy by Householder Income Bracket in Hayti
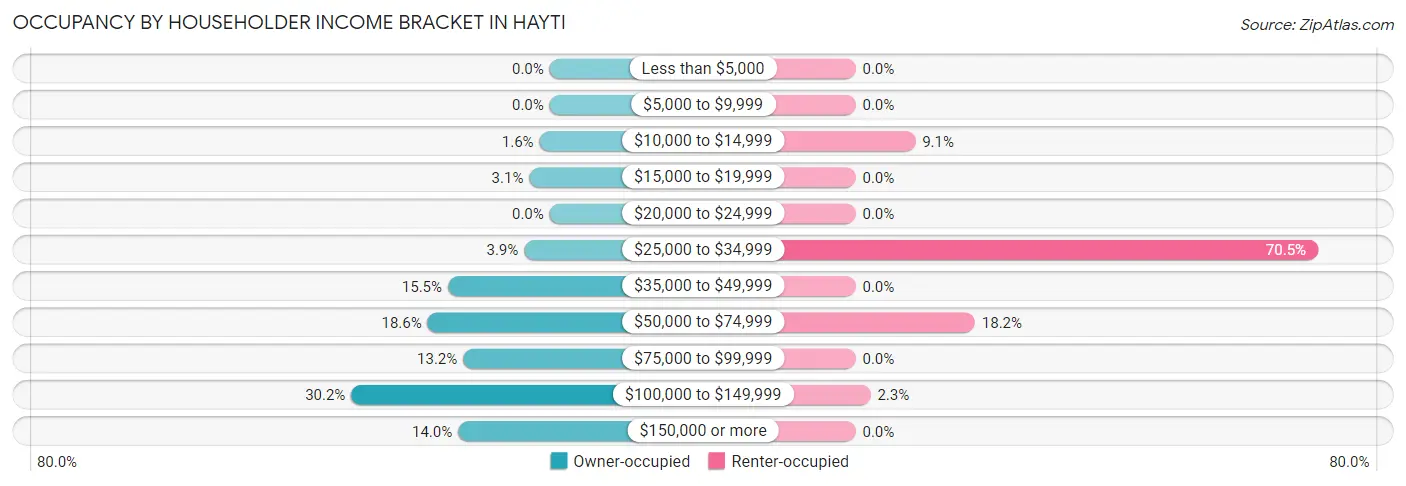
| Income Bracket | Owner-occupied | Renter-occupied |
| Less than $5,000 | 0 (0.0%) | 0 (0.0%) |
| $5,000 to $9,999 | 0 (0.0%) | 0 (0.0%) |
| $10,000 to $14,999 | 2 (1.5%) | 4 (9.1%) |
| $15,000 to $19,999 | 4 (3.1%) | 0 (0.0%) |
| $20,000 to $24,999 | 0 (0.0%) | 0 (0.0%) |
| $25,000 to $34,999 | 5 (3.9%) | 31 (70.5%) |
| $35,000 to $49,999 | 20 (15.5%) | 0 (0.0%) |
| $50,000 to $74,999 | 24 (18.6%) | 8 (18.2%) |
| $75,000 to $99,999 | 17 (13.2%) | 0 (0.0%) |
| $100,000 to $149,999 | 39 (30.2%) | 1 (2.3%) |
| $150,000 or more | 18 (14.0%) | 0 (0.0%) |
| Total | 129 (100.0%) | 44 (100.0%) |
Monthly Housing Cost Tiers in Hayti
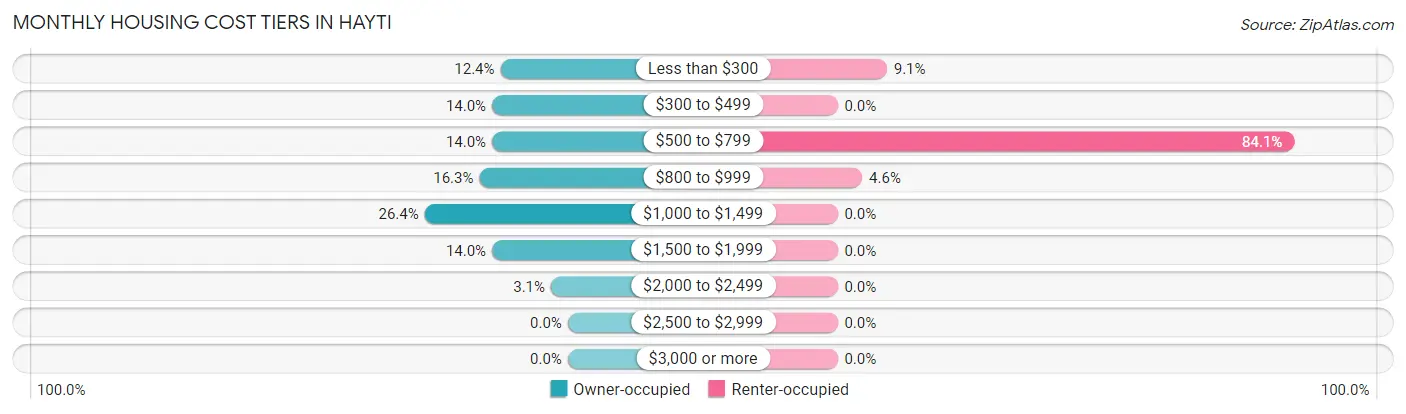
| Monthly Cost | Owner-occupied | Renter-occupied |
| Less than $300 | 16 (12.4%) | 4 (9.1%) |
| $300 to $499 | 18 (14.0%) | 0 (0.0%) |
| $500 to $799 | 18 (14.0%) | 37 (84.1%) |
| $800 to $999 | 21 (16.3%) | 2 (4.5%) |
| $1,000 to $1,499 | 34 (26.4%) | 0 (0.0%) |
| $1,500 to $1,999 | 18 (14.0%) | 0 (0.0%) |
| $2,000 to $2,499 | 4 (3.1%) | 0 (0.0%) |
| $2,500 to $2,999 | 0 (0.0%) | 0 (0.0%) |
| $3,000 or more | 0 (0.0%) | 0 (0.0%) |
| Total | 129 (100.0%) | 44 (100.0%) |
Physical Housing Characteristics in Hayti
Housing Structures in Hayti
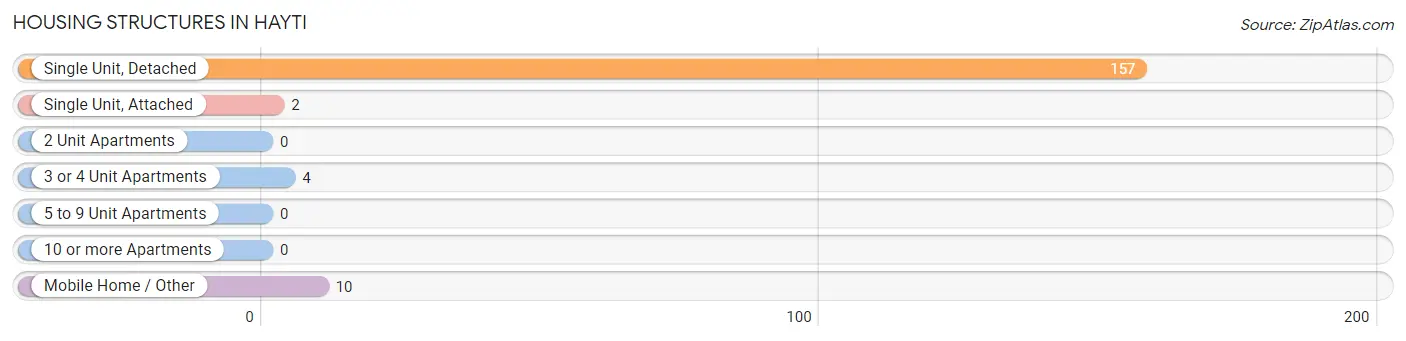
| Structure Type | # Housing Units | % Housing Units |
| Single Unit, Detached | 157 | 90.7% |
| Single Unit, Attached | 2 | 1.2% |
| 2 Unit Apartments | 0 | 0.0% |
| 3 or 4 Unit Apartments | 4 | 2.3% |
| 5 to 9 Unit Apartments | 0 | 0.0% |
| 10 or more Apartments | 0 | 0.0% |
| Mobile Home / Other | 10 | 5.8% |
| Total | 173 | 100.0% |
Housing Structures by Occupancy in Hayti
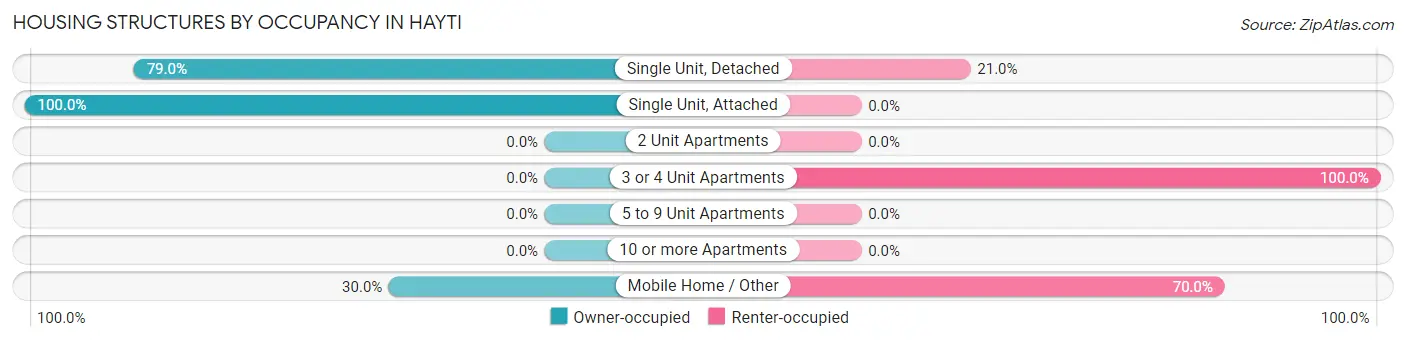
| Structure Type | Owner-occupied | Renter-occupied |
| Single Unit, Detached | 124 (79.0%) | 33 (21.0%) |
| Single Unit, Attached | 2 (100.0%) | 0 (0.0%) |
| 2 Unit Apartments | 0 (0.0%) | 0 (0.0%) |
| 3 or 4 Unit Apartments | 0 (0.0%) | 4 (100.0%) |
| 5 to 9 Unit Apartments | 0 (0.0%) | 0 (0.0%) |
| 10 or more Apartments | 0 (0.0%) | 0 (0.0%) |
| Mobile Home / Other | 3 (30.0%) | 7 (70.0%) |
| Total | 129 (74.6%) | 44 (25.4%) |
Housing Structures by Number of Rooms in Hayti
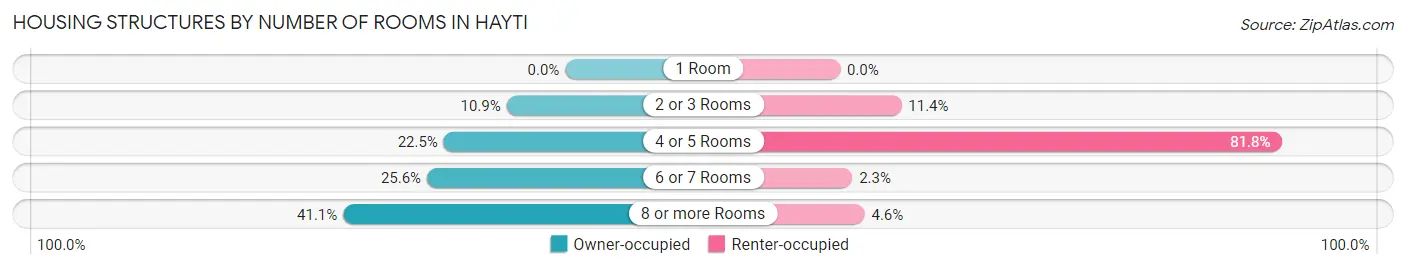
| Number of Rooms | Owner-occupied | Renter-occupied |
| 1 Room | 0 (0.0%) | 0 (0.0%) |
| 2 or 3 Rooms | 14 (10.8%) | 5 (11.4%) |
| 4 or 5 Rooms | 29 (22.5%) | 36 (81.8%) |
| 6 or 7 Rooms | 33 (25.6%) | 1 (2.3%) |
| 8 or more Rooms | 53 (41.1%) | 2 (4.5%) |
| Total | 129 (100.0%) | 44 (100.0%) |
Housing Structure by Heating Type in Hayti
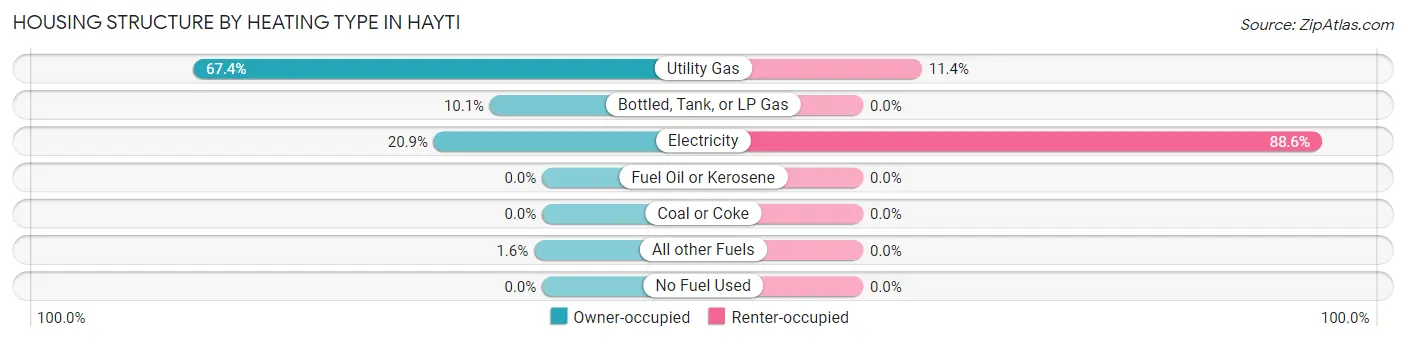
| Heating Type | Owner-occupied | Renter-occupied |
| Utility Gas | 87 (67.4%) | 5 (11.4%) |
| Bottled, Tank, or LP Gas | 13 (10.1%) | 0 (0.0%) |
| Electricity | 27 (20.9%) | 39 (88.6%) |
| Fuel Oil or Kerosene | 0 (0.0%) | 0 (0.0%) |
| Coal or Coke | 0 (0.0%) | 0 (0.0%) |
| All other Fuels | 2 (1.5%) | 0 (0.0%) |
| No Fuel Used | 0 (0.0%) | 0 (0.0%) |
| Total | 129 (100.0%) | 44 (100.0%) |
Household Vehicle Usage in Hayti
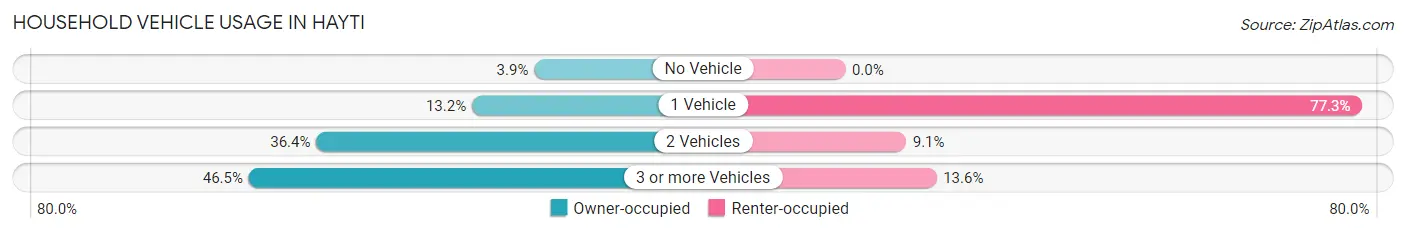
| Vehicles per Household | Owner-occupied | Renter-occupied |
| No Vehicle | 5 (3.9%) | 0 (0.0%) |
| 1 Vehicle | 17 (13.2%) | 34 (77.3%) |
| 2 Vehicles | 47 (36.4%) | 4 (9.1%) |
| 3 or more Vehicles | 60 (46.5%) | 6 (13.6%) |
| Total | 129 (100.0%) | 44 (100.0%) |
Real Estate & Mortgages in Hayti
Real Estate and Mortgage Overview in Hayti
| Characteristic | Without Mortgage | With Mortgage |
| Housing Units | 43 | 86 |
| Median Property Value | $108,000 | $117,500 |
| Median Household Income | $73,250 | $11 |
| Monthly Housing Costs | $381 | $0 |
| Real Estate Taxes | $1,017 | $1 |
Property Value by Mortgage Status in Hayti
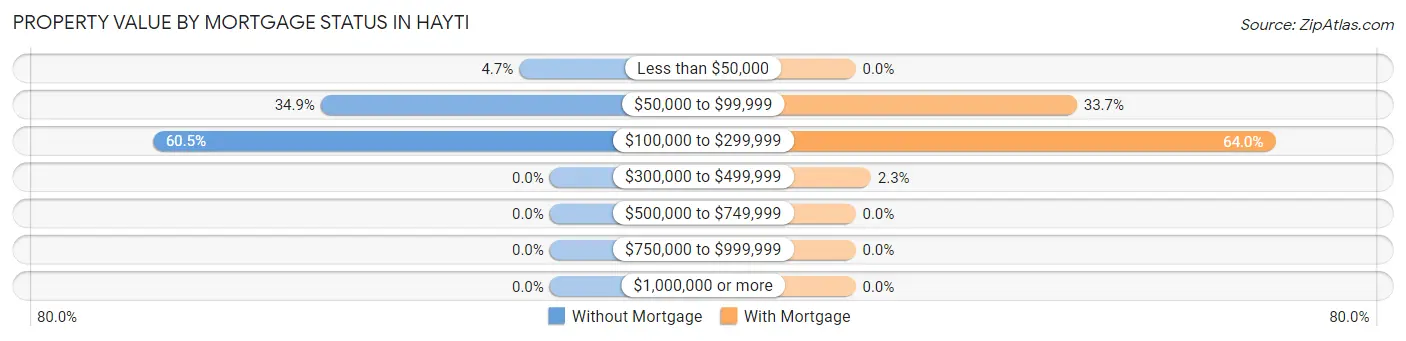
| Property Value | Without Mortgage | With Mortgage |
| Less than $50,000 | 2 (4.6%) | 0 (0.0%) |
| $50,000 to $99,999 | 15 (34.9%) | 29 (33.7%) |
| $100,000 to $299,999 | 26 (60.5%) | 55 (63.9%) |
| $300,000 to $499,999 | 0 (0.0%) | 2 (2.3%) |
| $500,000 to $749,999 | 0 (0.0%) | 0 (0.0%) |
| $750,000 to $999,999 | 0 (0.0%) | 0 (0.0%) |
| $1,000,000 or more | 0 (0.0%) | 0 (0.0%) |
| Total | 43 (100.0%) | 86 (100.0%) |
Household Income by Mortgage Status in Hayti
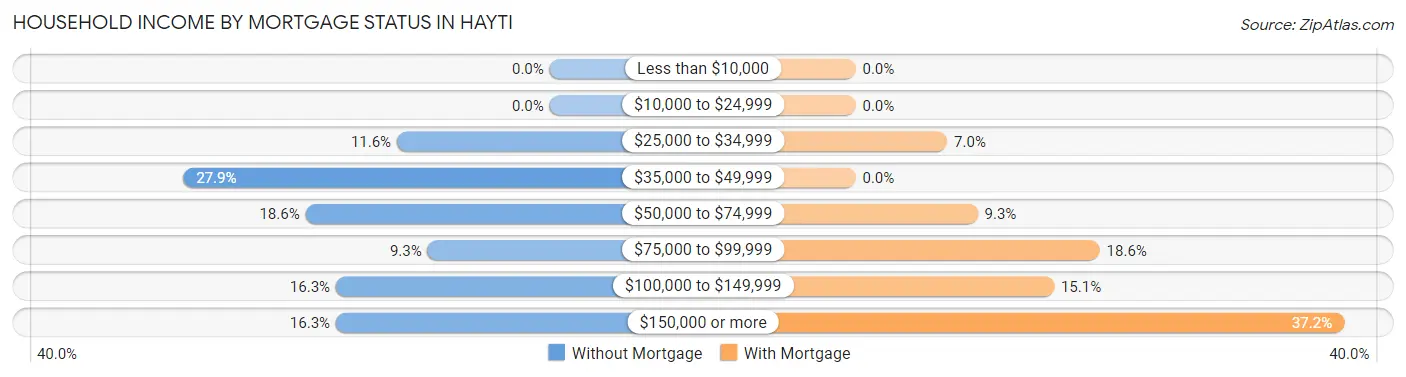
| Household Income | Without Mortgage | With Mortgage |
| Less than $10,000 | 0 (0.0%) | 0 (0.0%) |
| $10,000 to $24,999 | 0 (0.0%) | 0 (0.0%) |
| $25,000 to $34,999 | 5 (11.6%) | 6 (7.0%) |
| $35,000 to $49,999 | 12 (27.9%) | 0 (0.0%) |
| $50,000 to $74,999 | 8 (18.6%) | 8 (9.3%) |
| $75,000 to $99,999 | 4 (9.3%) | 16 (18.6%) |
| $100,000 to $149,999 | 7 (16.3%) | 13 (15.1%) |
| $150,000 or more | 7 (16.3%) | 32 (37.2%) |
| Total | 43 (100.0%) | 86 (100.0%) |
Property Value to Household Income Ratio in Hayti
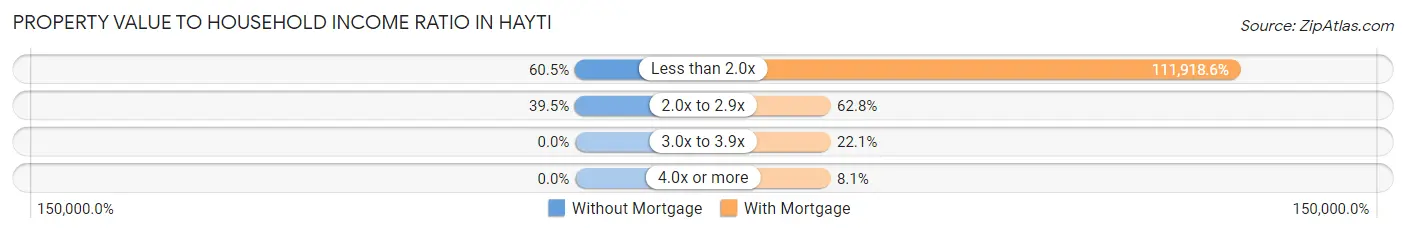
| Value-to-Income Ratio | Without Mortgage | With Mortgage |
| Less than 2.0x | 26 (60.5%) | 96,250 (111,918.6%) |
| 2.0x to 2.9x | 17 (39.5%) | 54 (62.8%) |
| 3.0x to 3.9x | 0 (0.0%) | 19 (22.1%) |
| 4.0x or more | 0 (0.0%) | 7 (8.1%) |
| Total | 43 (100.0%) | 86 (100.0%) |
Real Estate Taxes by Mortgage Status in Hayti
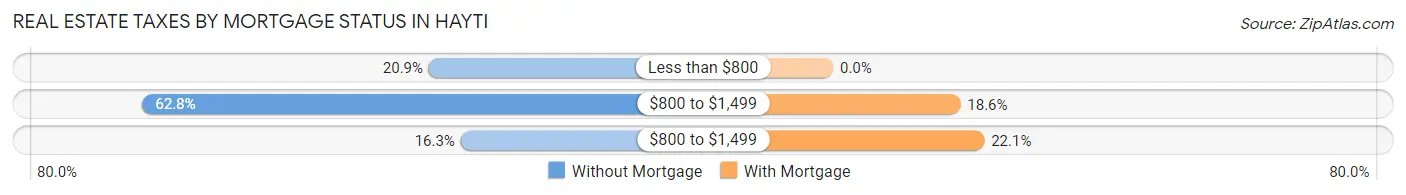
| Property Taxes | Without Mortgage | With Mortgage |
| Less than $800 | 9 (20.9%) | 0 (0.0%) |
| $800 to $1,499 | 27 (62.8%) | 16 (18.6%) |
| $800 to $1,499 | 7 (16.3%) | 19 (22.1%) |
| Total | 43 (100.0%) | 86 (100.0%) |
Health & Disability in Hayti
Health Insurance Coverage by Age in Hayti
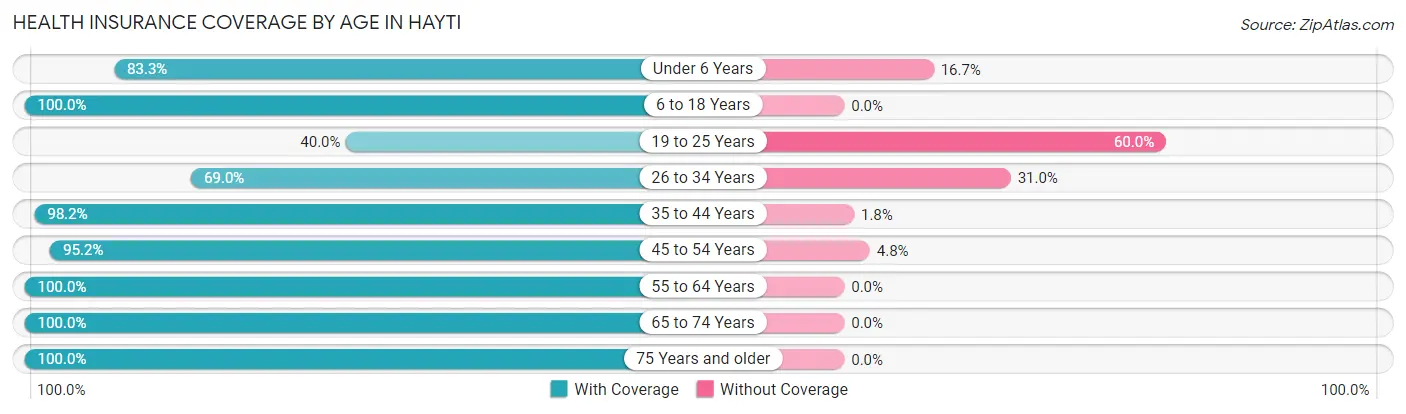
| Age Bracket | With Coverage | Without Coverage |
| Under 6 Years | 25 (83.3%) | 5 (16.7%) |
| 6 to 18 Years | 60 (100.0%) | 0 (0.0%) |
| 19 to 25 Years | 24 (40.0%) | 36 (60.0%) |
| 26 to 34 Years | 20 (69.0%) | 9 (31.0%) |
| 35 to 44 Years | 54 (98.2%) | 1 (1.8%) |
| 45 to 54 Years | 40 (95.2%) | 2 (4.8%) |
| 55 to 64 Years | 54 (100.0%) | 0 (0.0%) |
| 65 to 74 Years | 24 (100.0%) | 0 (0.0%) |
| 75 Years and older | 15 (100.0%) | 0 (0.0%) |
| Total | 316 (85.6%) | 53 (14.4%) |
Health Insurance Coverage by Citizenship Status in Hayti
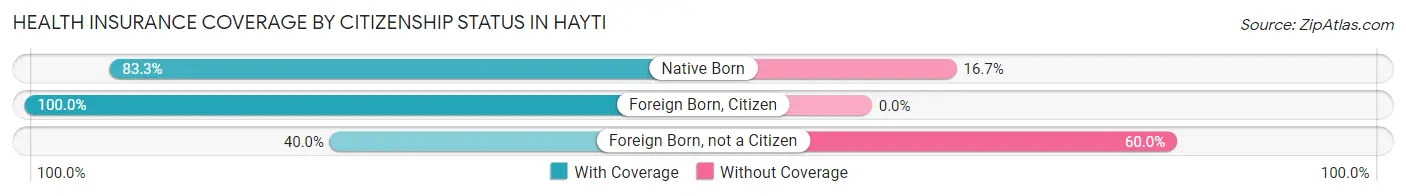
| Citizenship Status | With Coverage | Without Coverage |
| Native Born | 25 (83.3%) | 5 (16.7%) |
| Foreign Born, Citizen | 60 (100.0%) | 0 (0.0%) |
| Foreign Born, not a Citizen | 24 (40.0%) | 36 (60.0%) |
Health Insurance Coverage by Household Income in Hayti
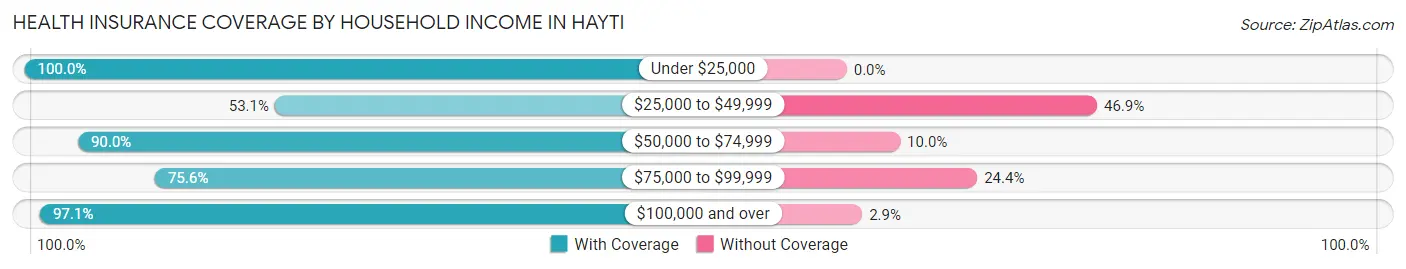
| Household Income | With Coverage | Without Coverage |
| Under $25,000 | 17 (100.0%) | 0 (0.0%) |
| $25,000 to $49,999 | 34 (53.1%) | 30 (46.9%) |
| $50,000 to $74,999 | 63 (90.0%) | 7 (10.0%) |
| $75,000 to $99,999 | 34 (75.6%) | 11 (24.4%) |
| $100,000 and over | 168 (97.1%) | 5 (2.9%) |
Public vs Private Health Insurance Coverage by Age in Hayti
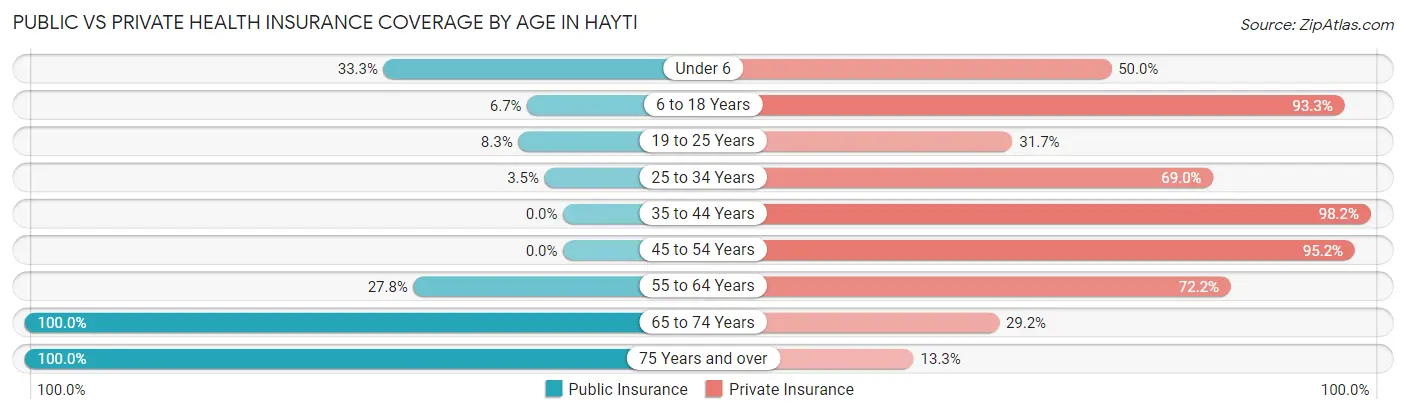
| Age Bracket | Public Insurance | Private Insurance |
| Under 6 | 10 (33.3%) | 15 (50.0%) |
| 6 to 18 Years | 4 (6.7%) | 56 (93.3%) |
| 19 to 25 Years | 5 (8.3%) | 19 (31.7%) |
| 25 to 34 Years | 1 (3.5%) | 20 (69.0%) |
| 35 to 44 Years | 0 (0.0%) | 54 (98.2%) |
| 45 to 54 Years | 0 (0.0%) | 40 (95.2%) |
| 55 to 64 Years | 15 (27.8%) | 39 (72.2%) |
| 65 to 74 Years | 24 (100.0%) | 7 (29.2%) |
| 75 Years and over | 15 (100.0%) | 2 (13.3%) |
| Total | 74 (20.1%) | 252 (68.3%) |
Disability Status by Sex by Age in Hayti
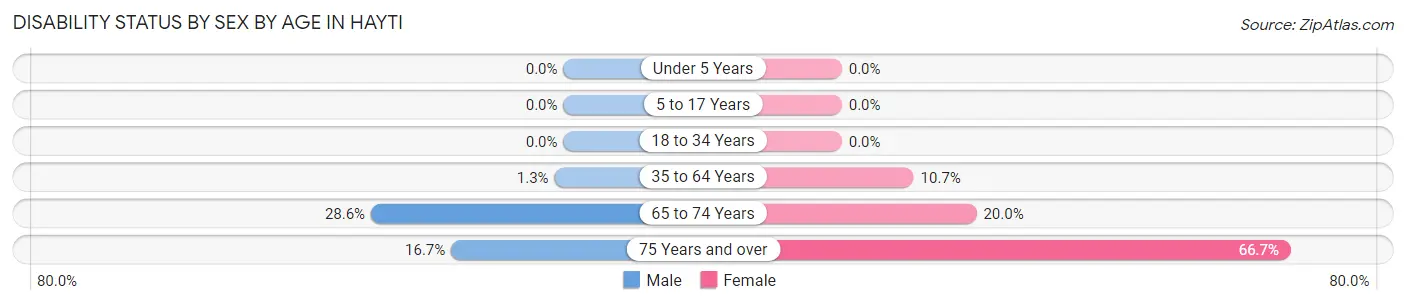
| Age Bracket | Male | Female |
| Under 5 Years | 0 (0.0%) | 0 (0.0%) |
| 5 to 17 Years | 0 (0.0%) | 0 (0.0%) |
| 18 to 34 Years | 0 (0.0%) | 0 (0.0%) |
| 35 to 64 Years | 1 (1.3%) | 8 (10.7%) |
| 65 to 74 Years | 4 (28.6%) | 2 (20.0%) |
| 75 Years and over | 2 (16.7%) | 2 (66.7%) |
Disability Class by Sex by Age in Hayti
Disability Class: Hearing Difficulty
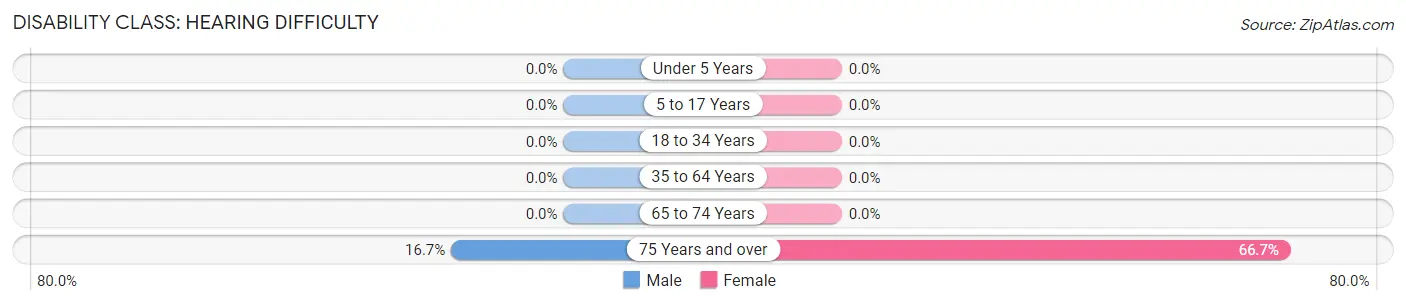
| Age Bracket | Male | Female |
| Under 5 Years | 0 (0.0%) | 0 (0.0%) |
| 5 to 17 Years | 0 (0.0%) | 0 (0.0%) |
| 18 to 34 Years | 0 (0.0%) | 0 (0.0%) |
| 35 to 64 Years | 0 (0.0%) | 0 (0.0%) |
| 65 to 74 Years | 0 (0.0%) | 0 (0.0%) |
| 75 Years and over | 2 (16.7%) | 2 (66.7%) |
Disability Class: Vision Difficulty
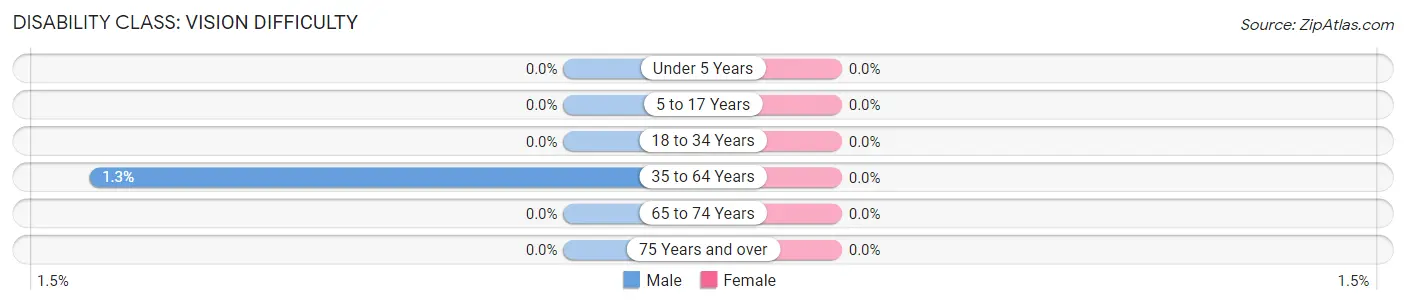
| Age Bracket | Male | Female |
| Under 5 Years | 0 (0.0%) | 0 (0.0%) |
| 5 to 17 Years | 0 (0.0%) | 0 (0.0%) |
| 18 to 34 Years | 0 (0.0%) | 0 (0.0%) |
| 35 to 64 Years | 1 (1.3%) | 0 (0.0%) |
| 65 to 74 Years | 0 (0.0%) | 0 (0.0%) |
| 75 Years and over | 0 (0.0%) | 0 (0.0%) |
Disability Class: Cognitive Difficulty
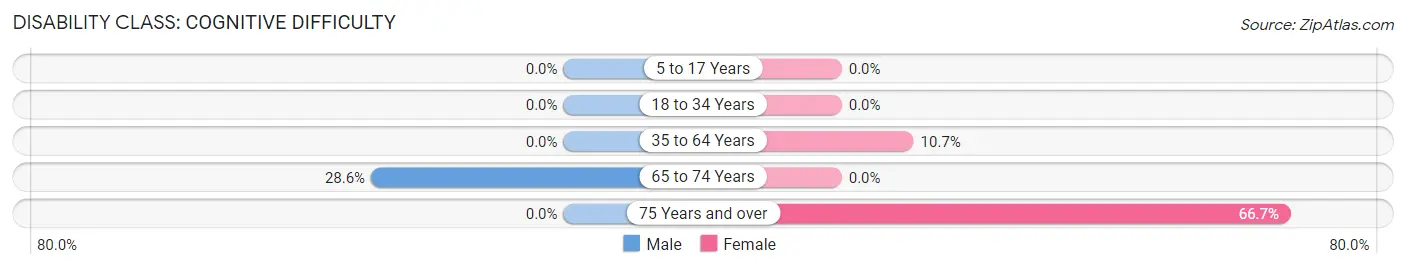
| Age Bracket | Male | Female |
| 5 to 17 Years | 0 (0.0%) | 0 (0.0%) |
| 18 to 34 Years | 0 (0.0%) | 0 (0.0%) |
| 35 to 64 Years | 0 (0.0%) | 8 (10.7%) |
| 65 to 74 Years | 4 (28.6%) | 0 (0.0%) |
| 75 Years and over | 0 (0.0%) | 2 (66.7%) |
Disability Class: Ambulatory Difficulty
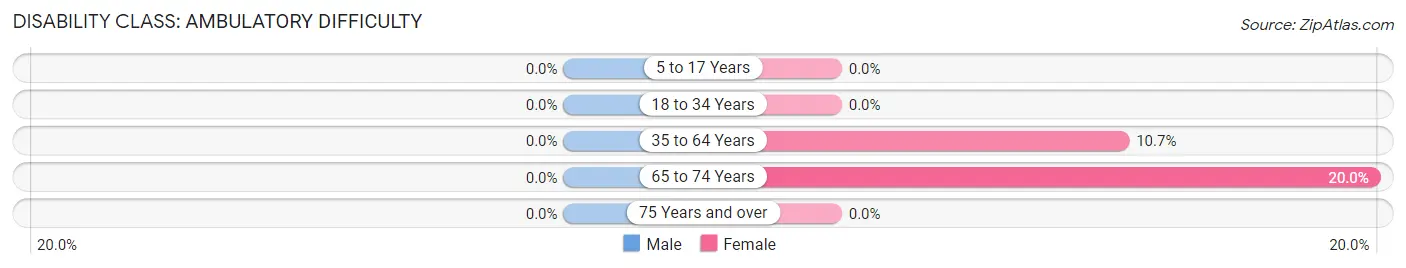
| Age Bracket | Male | Female |
| 5 to 17 Years | 0 (0.0%) | 0 (0.0%) |
| 18 to 34 Years | 0 (0.0%) | 0 (0.0%) |
| 35 to 64 Years | 0 (0.0%) | 8 (10.7%) |
| 65 to 74 Years | 0 (0.0%) | 2 (20.0%) |
| 75 Years and over | 0 (0.0%) | 0 (0.0%) |
Disability Class: Self-Care Difficulty
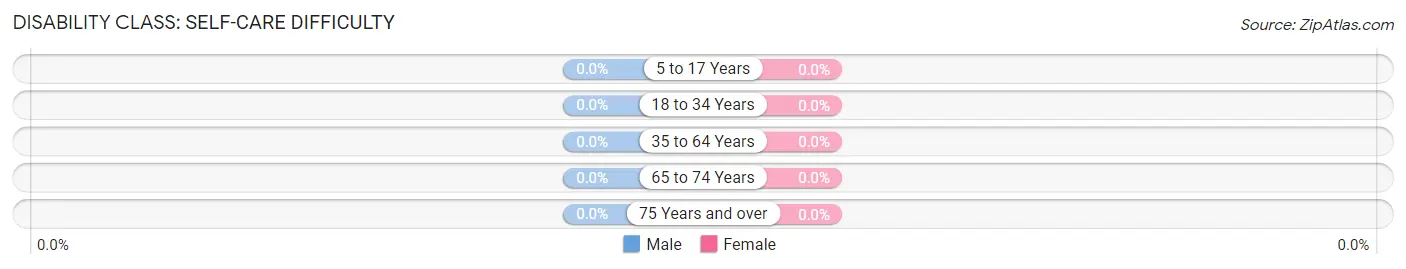
| Age Bracket | Male | Female |
| 5 to 17 Years | 0 (0.0%) | 0 (0.0%) |
| 18 to 34 Years | 0 (0.0%) | 0 (0.0%) |
| 35 to 64 Years | 0 (0.0%) | 0 (0.0%) |
| 65 to 74 Years | 0 (0.0%) | 0 (0.0%) |
| 75 Years and over | 0 (0.0%) | 0 (0.0%) |
Technology Access in Hayti
Computing Device Access in Hayti
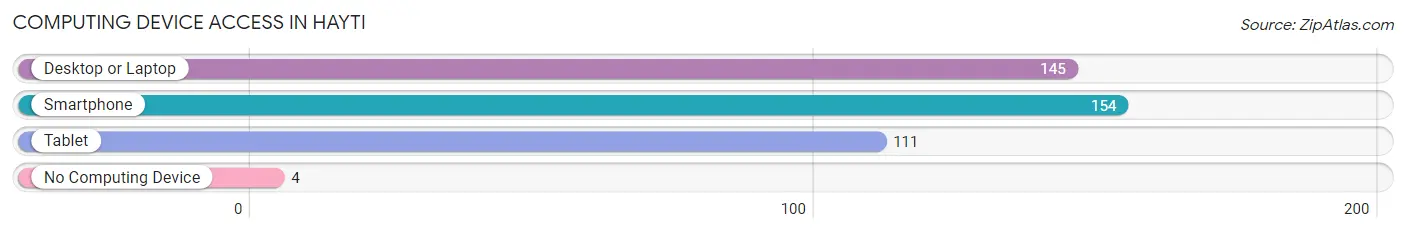
| Device Type | # Households | % Households |
| Desktop or Laptop | 145 | 83.8% |
| Smartphone | 154 | 89.0% |
| Tablet | 111 | 64.2% |
| No Computing Device | 4 | 2.3% |
| Total | 173 | 100.0% |
Internet Access in Hayti
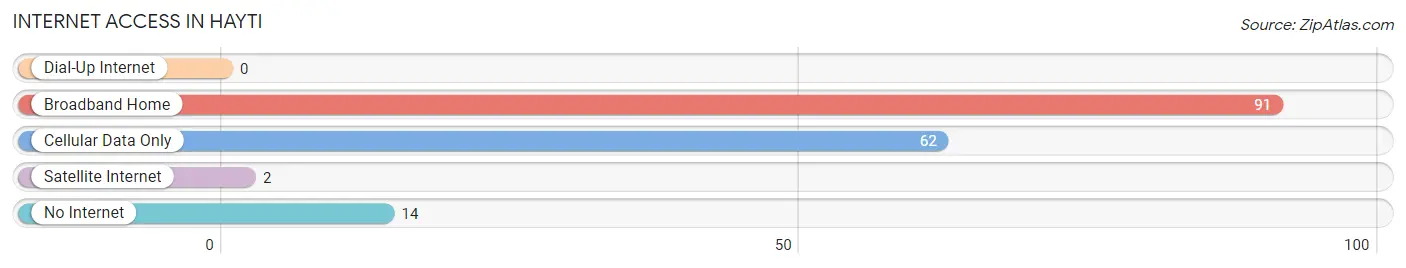
| Internet Type | # Households | % Households |
| Dial-Up Internet | 0 | 0.0% |
| Broadband Home | 91 | 52.6% |
| Cellular Data Only | 62 | 35.8% |
| Satellite Internet | 2 | 1.2% |
| No Internet | 14 | 8.1% |
| Total | 173 | 100.0% |
Hayti Summary
HISTORY
The small town of Hayti, South Dakota is located in the southeastern corner of the state, just a few miles from the Minnesota border. The town was founded in 1881 by a group of settlers from Minnesota who were looking for a place to settle and start a new life. The town was named after the town of Hayti, Missouri, which was founded by freed slaves in the late 1800s.
The town of Hayti was originally a farming community, with the main crops being wheat, corn, and oats. The town also had a small sawmill and a few other businesses. In the early 1900s, the town began to grow and prosper, and by the 1920s it had become a thriving community with a population of over 500 people.
The town of Hayti was also home to a number of churches, including the First Baptist Church, which was founded in 1883. The town also had a school, which was built in 1885 and served as the primary educational institution for the town until it closed in the 1950s.
The town of Hayti experienced a period of decline in the mid-1900s, as many of the town’s residents moved away in search of better opportunities. By the 1970s, the population had dropped to just over 200 people. However, in recent years, the town has seen a resurgence in population and is now home to over 500 people.
GEOGRAPHY
The town of Hayti is located in the southeastern corner of South Dakota, just a few miles from the Minnesota border. The town is situated in the rolling hills of the Coteau des Prairies, which is a region of the Great Plains. The town is located on the banks of the Big Sioux River, which is a tributary of the Missouri River.
The town of Hayti is located in the center of the town of Hayti Township, which is part of the larger Brookings County. The town is located about 25 miles south of the city of Brookings, which is the county seat. The town is also located about 40 miles east of the city of Sioux Falls, which is the largest city in the state.
The town of Hayti is located in a rural area, and the surrounding area is mostly farmland. The town is located in a region of the state that is known for its rolling hills and prairies. The town is also located in an area that is known for its abundant wildlife, including deer, pheasants, and other game animals.
ECONOMY
The economy of the town of Hayti is largely based on agriculture. The town is located in an area of the state that is known for its fertile soil and abundant rainfall, which makes it ideal for growing crops. The main crops grown in the area are wheat, corn, and oats. The town also has a small sawmill, which produces lumber for the local market.
The town of Hayti also has a few small businesses, including a grocery store, a hardware store, and a few restaurants. The town also has a few small manufacturing businesses, which produce a variety of products, including furniture and clothing.
DEMOGRAPHICS
The town of Hayti has a population of over 500 people, according to the 2010 census. The town is predominantly white, with over 90% of the population being of European descent. The town also has a small Hispanic population, which makes up about 5% of the population.
The town of Hayti is a predominantly Christian community, with over 80% of the population identifying as Christian. The town also has a small Jewish population, which makes up about 1% of the population.
The town of Hayti is a small, rural community that is known for its friendly atmosphere and strong sense of community. The town is a great place to raise a family, and the town’s residents take pride in their town and its history.
Common Questions
What is Per Capita Income in Hayti?
Per Capita income in Hayti is $38,603.
What is the Median Family Income in Hayti?
Median Family Income in Hayti is $107,500.
What is the Median Household income in Hayti?
Median Household Income in Hayti is $67,250.
What is Income or Wage Gap in Hayti?
Income or Wage Gap in Hayti is 41.8%.
Women in Hayti earn 58.2 cents for every dollar earned by a man.
What is Inequality or Gini Index in Hayti?
Inequality or Gini Index in Hayti is 0.37.
What is the Total Population of Hayti?
Total Population of Hayti is 369.
What is the Total Male Population of Hayti?
Total Male Population of Hayti is 176.
What is the Total Female Population of Hayti?
Total Female Population of Hayti is 193.
What is the Ratio of Males per 100 Females in Hayti?
There are 91.19 Males per 100 Females in Hayti.
What is the Ratio of Females per 100 Males in Hayti?
There are 109.66 Females per 100 Males in Hayti.
What is the Median Population Age in Hayti?
Median Population Age in Hayti is 35.8 Years.
What is the Average Family Size in Hayti
Average Family Size in Hayti is 2.9 People.
What is the Average Household Size in Hayti
Average Household Size in Hayti is 2.1 People.
How Large is the Labor Force in Hayti?
There are 235 People in the Labor Forcein in Hayti.
What is the Percentage of People in the Labor Force in Hayti?
79.9% of People are in the Labor Force in Hayti.
What is the Unemployment Rate in Hayti?
Unemployment Rate in Hayti is 1.7%.