Humboldt, SD Map & Demographics
Humboldt Map
Humboldt Overview
$33,783
PER CAPITA INCOME
$92,375
AVG FAMILY INCOME
$90,250
AVG HOUSEHOLD INCOME
38.6%
WAGE / INCOME GAP [ % ]
61.4¢/ $1
WAGE / INCOME GAP [ $ ]
0.28
INEQUALITY / GINI INDEX
619
TOTAL POPULATION
296
MALE POPULATION
323
FEMALE POPULATION
91.64
MALES / 100 FEMALES
109.12
FEMALES / 100 MALES
33.2
MEDIAN AGE
3.2
AVG FAMILY SIZE
2.8
AVG HOUSEHOLD SIZE
354
LABOR FORCE [ PEOPLE ]
81.9%
PERCENT IN LABOR FORCE
1.1%
UNEMPLOYMENT RATE
Humboldt Zip Codes
Humboldt Area Codes
Income in Humboldt
Income Overview in Humboldt
Per Capita Income in Humboldt is $33,783, while median incomes of families and households are $92,375 and $90,250 respectively.
| Characteristic | Number | Measure |
| Per Capita Income | 619 | $33,783 |
| Median Family Income | 167 | $92,375 |
| Mean Family Income | 167 | $93,840 |
| Median Household Income | 222 | $90,250 |
| Mean Household Income | 222 | $88,411 |
| Income Deficit | 167 | $0 |
| Wage / Income Gap (%) | 619 | 38.61% |
| Wage / Income Gap ($) | 619 | 61.39¢ per $1 |
| Gini / Inequality Index | 619 | 0.28 |
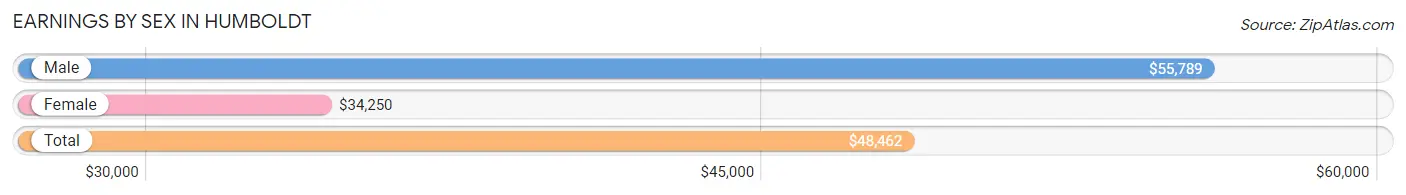
Earnings by Sex in Humboldt
Average Earnings in Humboldt are $48,462, $55,789 for men and $34,250 for women, a difference of 38.6%.
| Sex | Number | Average Earnings |
| Male | 198 (52.7%) | $55,789 |
| Female | 178 (47.3%) | $34,250 |
| Total | 376 (100.0%) | $48,462 |
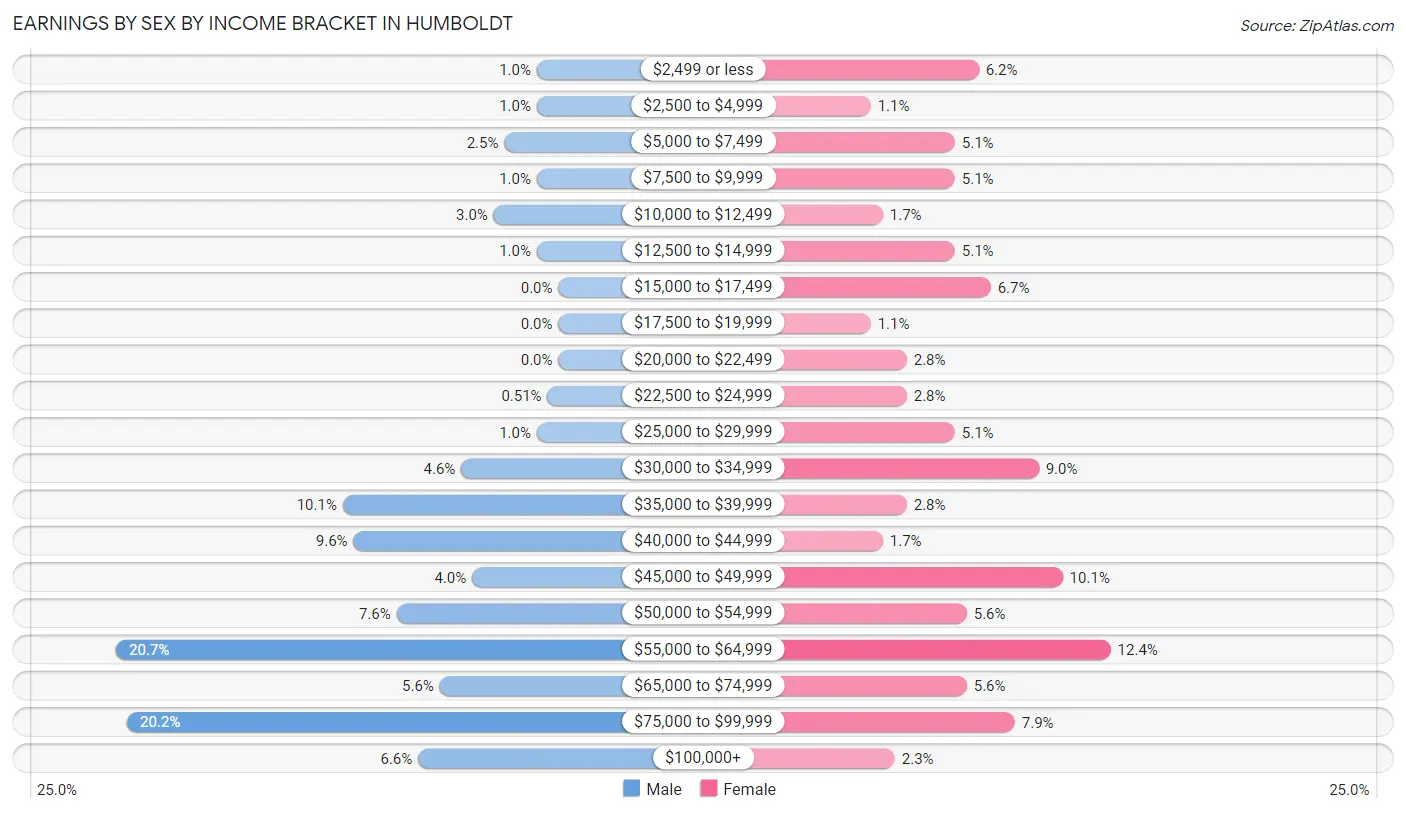
Earnings by Sex by Income Bracket in Humboldt
The most common earnings brackets in Humboldt are $55,000 to $64,999 for men (41 | 20.7%) and $55,000 to $64,999 for women (22 | 12.4%).
| Income | Male | Female |
| $2,499 or less | 2 (1.0%) | 11 (6.2%) |
| $2,500 to $4,999 | 2 (1.0%) | 2 (1.1%) |
| $5,000 to $7,499 | 5 (2.5%) | 9 (5.1%) |
| $7,500 to $9,999 | 2 (1.0%) | 9 (5.1%) |
| $10,000 to $12,499 | 6 (3.0%) | 3 (1.7%) |
| $12,500 to $14,999 | 2 (1.0%) | 9 (5.1%) |
| $15,000 to $17,499 | 0 (0.0%) | 12 (6.7%) |
| $17,500 to $19,999 | 0 (0.0%) | 2 (1.1%) |
| $20,000 to $22,499 | 0 (0.0%) | 5 (2.8%) |
| $22,500 to $24,999 | 1 (0.5%) | 5 (2.8%) |
| $25,000 to $29,999 | 2 (1.0%) | 9 (5.1%) |
| $30,000 to $34,999 | 9 (4.5%) | 16 (9.0%) |
| $35,000 to $39,999 | 20 (10.1%) | 5 (2.8%) |
| $40,000 to $44,999 | 19 (9.6%) | 3 (1.7%) |
| $45,000 to $49,999 | 8 (4.0%) | 18 (10.1%) |
| $50,000 to $54,999 | 15 (7.6%) | 10 (5.6%) |
| $55,000 to $64,999 | 41 (20.7%) | 22 (12.4%) |
| $65,000 to $74,999 | 11 (5.6%) | 10 (5.6%) |
| $75,000 to $99,999 | 40 (20.2%) | 14 (7.9%) |
| $100,000+ | 13 (6.6%) | 4 (2.2%) |
| Total | 198 (100.0%) | 178 (100.0%) |
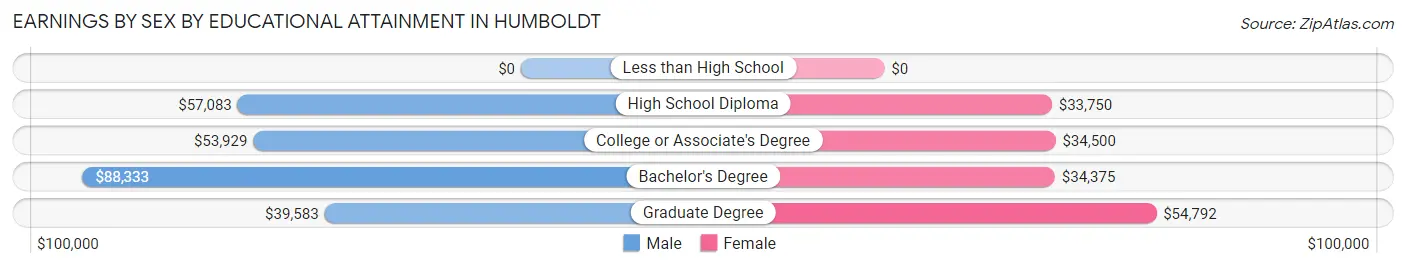
Earnings by Sex by Educational Attainment in Humboldt
Average earnings in Humboldt are $56,513 for men and $37,083 for women, a difference of 34.4%. Men with an educational attainment of bachelor's degree enjoy the highest average annual earnings of $88,333, while those with graduate degree education earn the least with $39,583. Women with an educational attainment of graduate degree earn the most with the average annual earnings of $54,792, while those with high school diploma education have the smallest earnings of $33,750.
| Educational Attainment | Male Income | Female Income |
| Less than High School | - | - |
| High School Diploma | $57,083 | $33,750 |
| College or Associate's Degree | $53,929 | $34,500 |
| Bachelor's Degree | $88,333 | $34,375 |
| Graduate Degree | $39,583 | $54,792 |
| Total | $56,513 | $37,083 |
Family Income in Humboldt
Family Income Brackets in Humboldt
According to the Humboldt family income data, there are 56 families falling into the $100,000 to $149,999 income range, which is the most common income bracket and makes up 33.5% of all families.
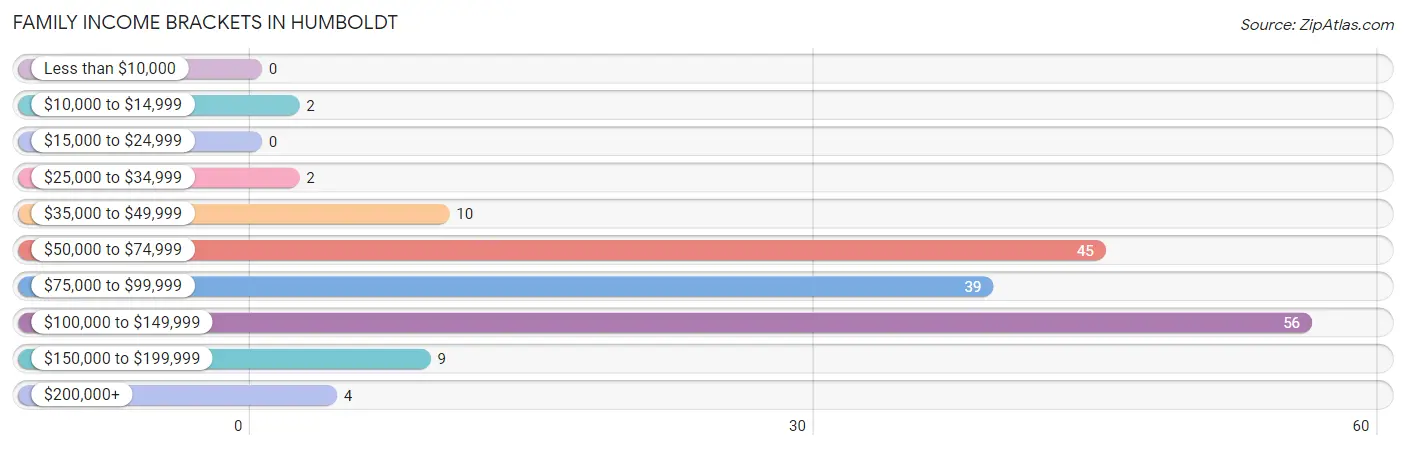
| Income Bracket | # Families | % Families |
| Less than $10,000 | 0 | 0.0% |
| $10,000 to $14,999 | 2 | 1.2% |
| $15,000 to $24,999 | 0 | 0.0% |
| $25,000 to $34,999 | 2 | 1.2% |
| $35,000 to $49,999 | 10 | 6.0% |
| $50,000 to $74,999 | 45 | 26.9% |
| $75,000 to $99,999 | 39 | 23.4% |
| $100,000 to $149,999 | 56 | 33.5% |
| $150,000 to $199,999 | 9 | 5.4% |
| $200,000+ | 4 | 2.4% |
Family Income by Famaliy Size in Humboldt
5-person families (22 | 13.2%) account for the highest median family income in Humboldt with $103,750 per family, while 2-person families (70 | 41.9%) have the highest median income of $45,625 per family member.
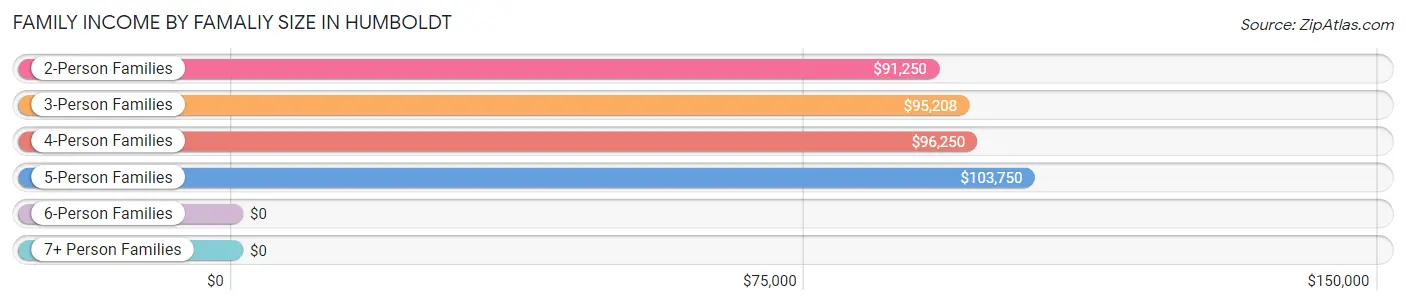
| Income Bracket | # Families | Median Income |
| 2-Person Families | 70 (41.9%) | $91,250 |
| 3-Person Families | 39 (23.4%) | $95,208 |
| 4-Person Families | 36 (21.6%) | $96,250 |
| 5-Person Families | 22 (13.2%) | $103,750 |
| 6-Person Families | 0 (0.0%) | $0 |
| 7+ Person Families | 0 (0.0%) | $0 |
| Total | 167 (100.0%) | $92,375 |
Family Income by Number of Earners in Humboldt
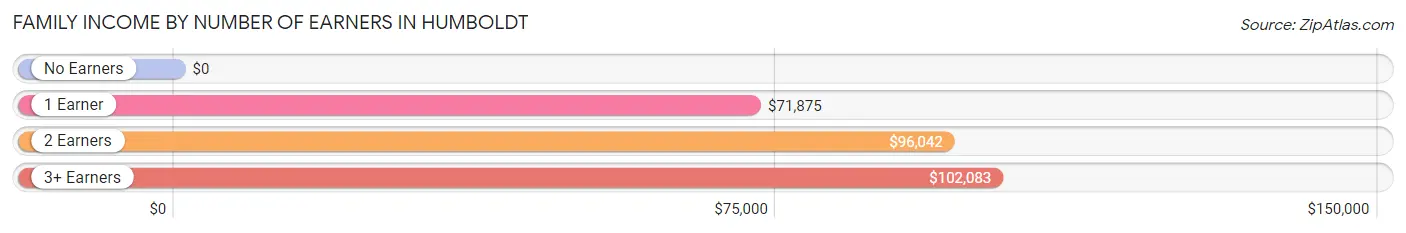
| Number of Earners | # Families | Median Income |
| No Earners | 6 (3.6%) | $0 |
| 1 Earner | 43 (25.8%) | $71,875 |
| 2 Earners | 95 (56.9%) | $96,042 |
| 3+ Earners | 23 (13.8%) | $102,083 |
| Total | 167 (100.0%) | $92,375 |
Household Income in Humboldt
Household Income Brackets in Humboldt
With 69 households falling in the category, the $100,000 to $149,999 income range is the most frequent in Humboldt, accounting for 31.1% of all households.
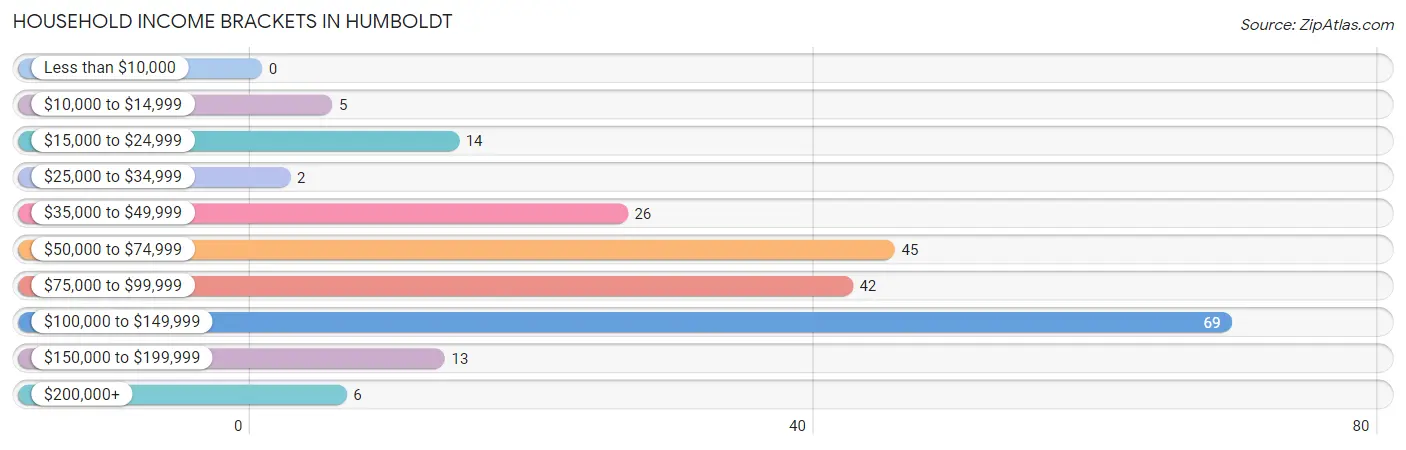
| Income Bracket | # Households | % Households |
| Less than $10,000 | 0 | 0.0% |
| $10,000 to $14,999 | 5 | 2.3% |
| $15,000 to $24,999 | 14 | 6.3% |
| $25,000 to $34,999 | 2 | 0.9% |
| $35,000 to $49,999 | 26 | 11.7% |
| $50,000 to $74,999 | 45 | 20.3% |
| $75,000 to $99,999 | 42 | 18.9% |
| $100,000 to $149,999 | 69 | 31.1% |
| $150,000 to $199,999 | 13 | 5.9% |
| $200,000+ | 6 | 2.7% |
Household Income by Householder Age in Humboldt
The median household income in Humboldt is $90,250, with the highest median household income of $100,417 found in the 25 to 44 years age bracket for the primary householder. A total of 123 households (55.4%) fall into this category. Meanwhile, the 65+ years age bracket for the primary householder has the lowest median household income of $68,750, with 40 households (18.0%) in this group.
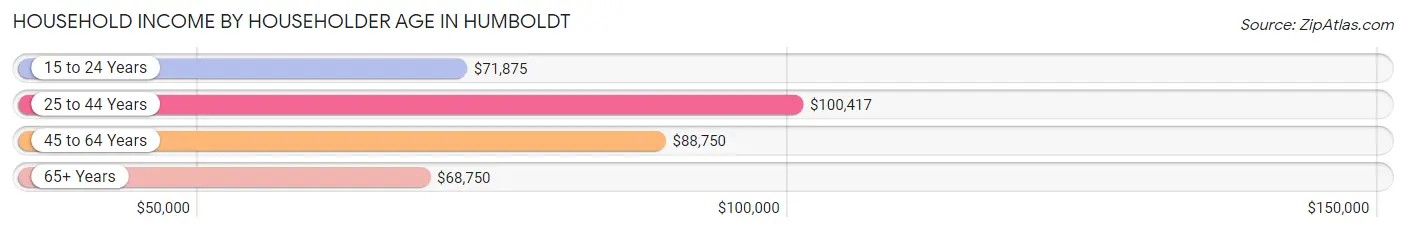
| Income Bracket | # Households | Median Income |
| 15 to 24 Years | 7 (3.2%) | $71,875 |
| 25 to 44 Years | 123 (55.4%) | $100,417 |
| 45 to 64 Years | 52 (23.4%) | $88,750 |
| 65+ Years | 40 (18.0%) | $68,750 |
| Total | 222 (100.0%) | $90,250 |
Poverty in Humboldt
Income Below Poverty by Sex and Age in Humboldt
With 1.0% poverty level for males and 1.2% for females among the residents of Humboldt, 75 year old and over males and 65 to 74 year old females are the most vulnerable to poverty, with 1 males (16.7%) and 2 females (9.5%) in their respective age groups living below the poverty level.
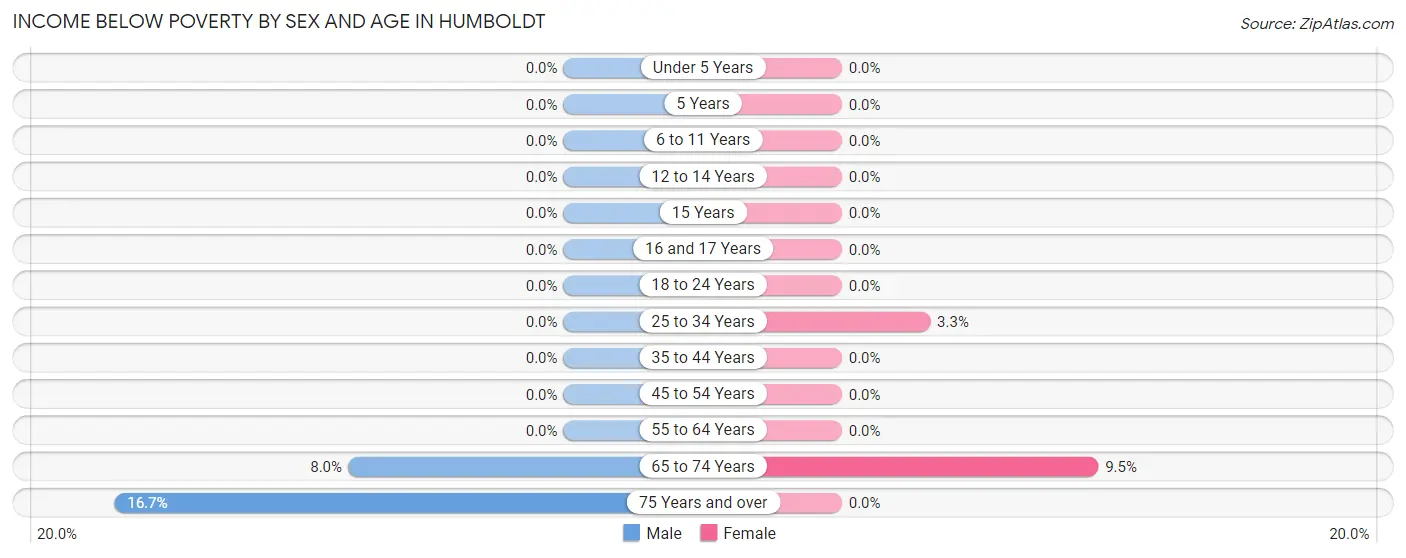
| Age Bracket | Male | Female |
| Under 5 Years | 0 (0.0%) | 0 (0.0%) |
| 5 Years | 0 (0.0%) | 0 (0.0%) |
| 6 to 11 Years | 0 (0.0%) | 0 (0.0%) |
| 12 to 14 Years | 0 (0.0%) | 0 (0.0%) |
| 15 Years | 0 (0.0%) | 0 (0.0%) |
| 16 and 17 Years | 0 (0.0%) | 0 (0.0%) |
| 18 to 24 Years | 0 (0.0%) | 0 (0.0%) |
| 25 to 34 Years | 0 (0.0%) | 2 (3.3%) |
| 35 to 44 Years | 0 (0.0%) | 0 (0.0%) |
| 45 to 54 Years | 0 (0.0%) | 0 (0.0%) |
| 55 to 64 Years | 0 (0.0%) | 0 (0.0%) |
| 65 to 74 Years | 2 (8.0%) | 2 (9.5%) |
| 75 Years and over | 1 (16.7%) | 0 (0.0%) |
| Total | 3 (1.0%) | 4 (1.2%) |
Income Above Poverty by Sex and Age in Humboldt
According to the poverty statistics in Humboldt, males aged under 5 years and females aged under 5 years are the age groups that are most secure financially, with 100.0% of males and 100.0% of females in these age groups living above the poverty line.
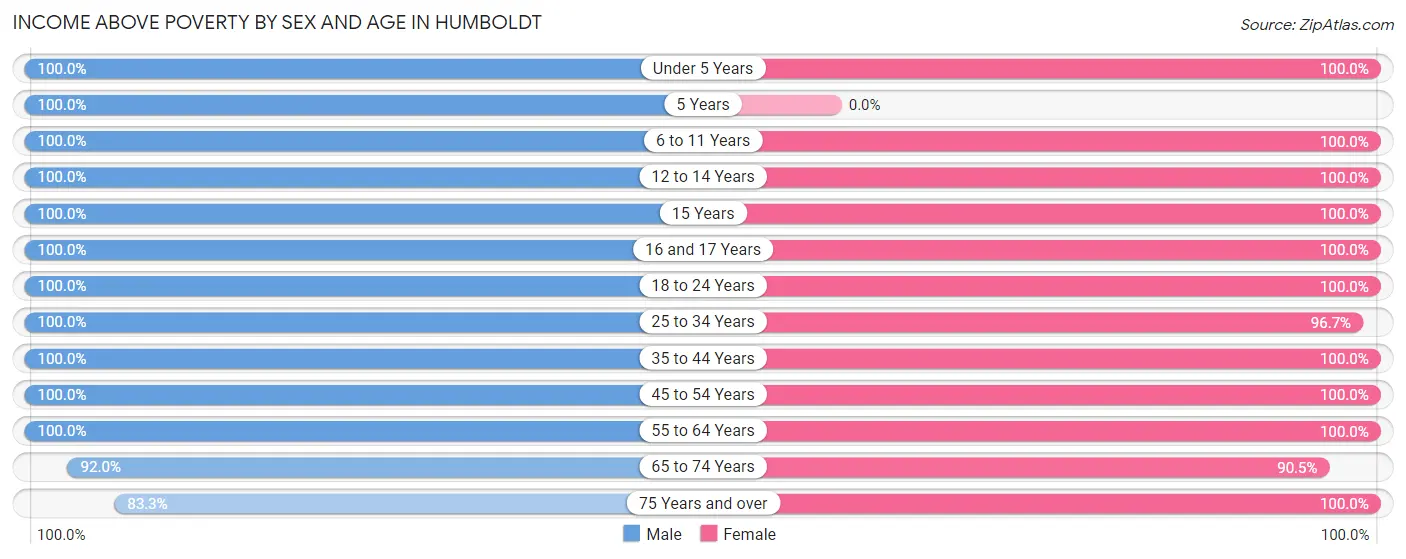
| Age Bracket | Male | Female |
| Under 5 Years | 24 (100.0%) | 27 (100.0%) |
| 5 Years | 7 (100.0%) | 0 (0.0%) |
| 6 to 11 Years | 29 (100.0%) | 40 (100.0%) |
| 12 to 14 Years | 8 (100.0%) | 38 (100.0%) |
| 15 Years | 9 (100.0%) | 5 (100.0%) |
| 16 and 17 Years | 7 (100.0%) | 3 (100.0%) |
| 18 to 24 Years | 9 (100.0%) | 25 (100.0%) |
| 25 to 34 Years | 56 (100.0%) | 59 (96.7%) |
| 35 to 44 Years | 63 (100.0%) | 45 (100.0%) |
| 45 to 54 Years | 32 (100.0%) | 43 (100.0%) |
| 55 to 64 Years | 21 (100.0%) | 6 (100.0%) |
| 65 to 74 Years | 23 (92.0%) | 19 (90.5%) |
| 75 Years and over | 5 (83.3%) | 9 (100.0%) |
| Total | 293 (99.0%) | 319 (98.8%) |
Income Below Poverty Among Married-Couple Families in Humboldt
The poverty statistics for married-couple families in Humboldt show that 1.6% or 2 of the total 128 families live below the poverty line. Families with no children have the highest poverty rate of 3.6%, comprising of 2 families. On the other hand, families with 1 or 2 children have the lowest poverty rate of 0.0%, which includes 0 families.
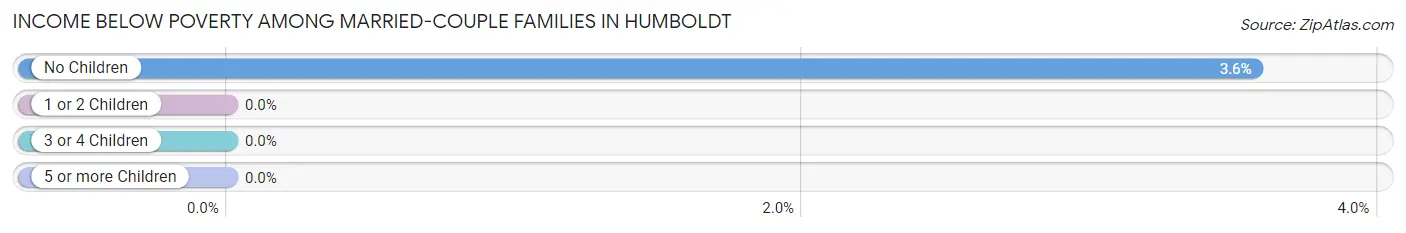
| Children | Above Poverty | Below Poverty |
| No Children | 54 (96.4%) | 2 (3.6%) |
| 1 or 2 Children | 50 (100.0%) | 0 (0.0%) |
| 3 or 4 Children | 22 (100.0%) | 0 (0.0%) |
| 5 or more Children | 0 (0.0%) | 0 (0.0%) |
| Total | 126 (98.4%) | 2 (1.6%) |
Income Below Poverty Among Single-Parent Households in Humboldt
| Children | Single Father | Single Mother |
| No Children | 0 (0.0%) | 0 (0.0%) |
| 1 or 2 Children | 0 (0.0%) | 0 (0.0%) |
| 3 or 4 Children | 0 (0.0%) | 0 (0.0%) |
| 5 or more Children | 0 (0.0%) | 0 (0.0%) |
| Total | 0 (0.0%) | 0 (0.0%) |
Income Below Poverty Among Married-Couple vs Single-Parent Households in Humboldt
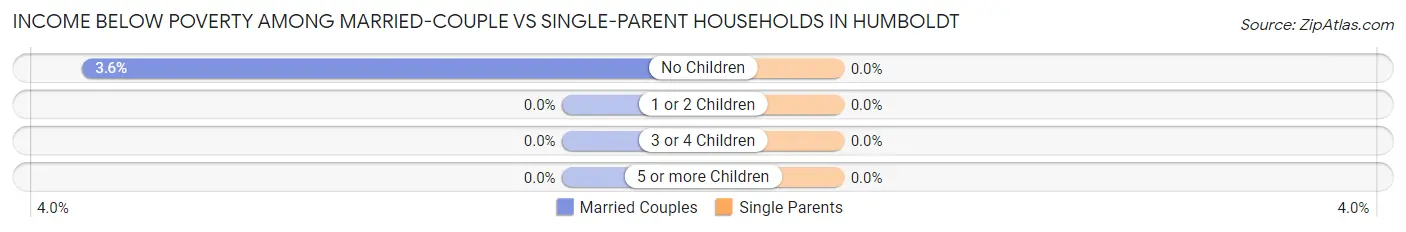
| Children | Married-Couple Families | Single-Parent Households |
| No Children | 2 (3.6%) | 0 (0.0%) |
| 1 or 2 Children | 0 (0.0%) | 0 (0.0%) |
| 3 or 4 Children | 0 (0.0%) | 0 (0.0%) |
| 5 or more Children | 0 (0.0%) | 0 (0.0%) |
| Total | 2 (1.6%) | 0 (0.0%) |
Race in Humboldt
The most populous races in Humboldt are White / Caucasian (515 | 83.2%), Two or more Races (98 | 15.8%), and Hispanic or Latino (51 | 8.2%).
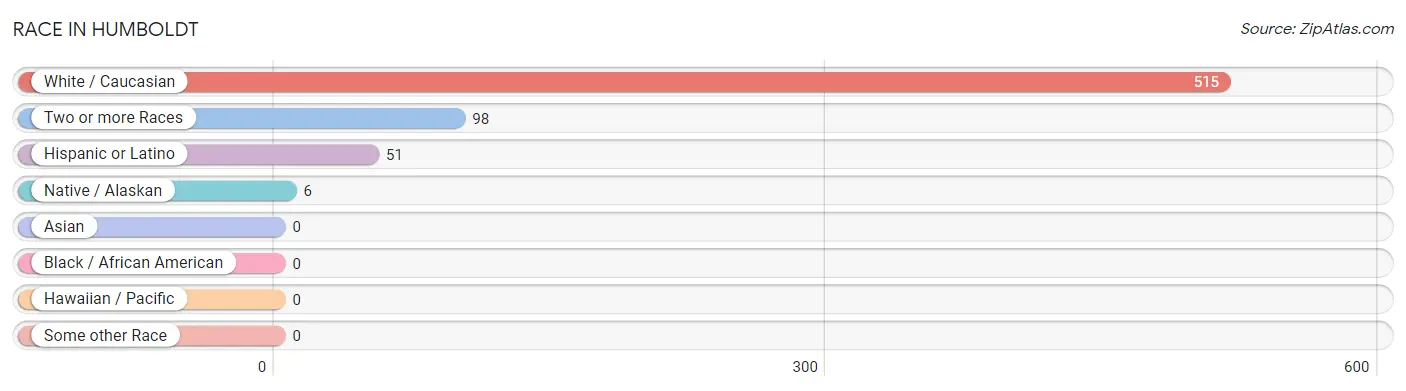
| Race | # Population | % Population |
| Asian | 0 | 0.0% |
| Black / African American | 0 | 0.0% |
| Hawaiian / Pacific | 0 | 0.0% |
| Hispanic or Latino | 51 | 8.2% |
| Native / Alaskan | 6 | 1.0% |
| White / Caucasian | 515 | 83.2% |
| Two or more Races | 98 | 15.8% |
| Some other Race | 0 | 0.0% |
| Total | 619 | 100.0% |
Ancestry in Humboldt
The most populous ancestries reported in Humboldt are German (264 | 42.6%), Norwegian (142 | 22.9%), Irish (61 | 9.9%), Spanish (51 | 8.2%), and American (48 | 7.7%), together accounting for 91.4% of all Humboldt residents.
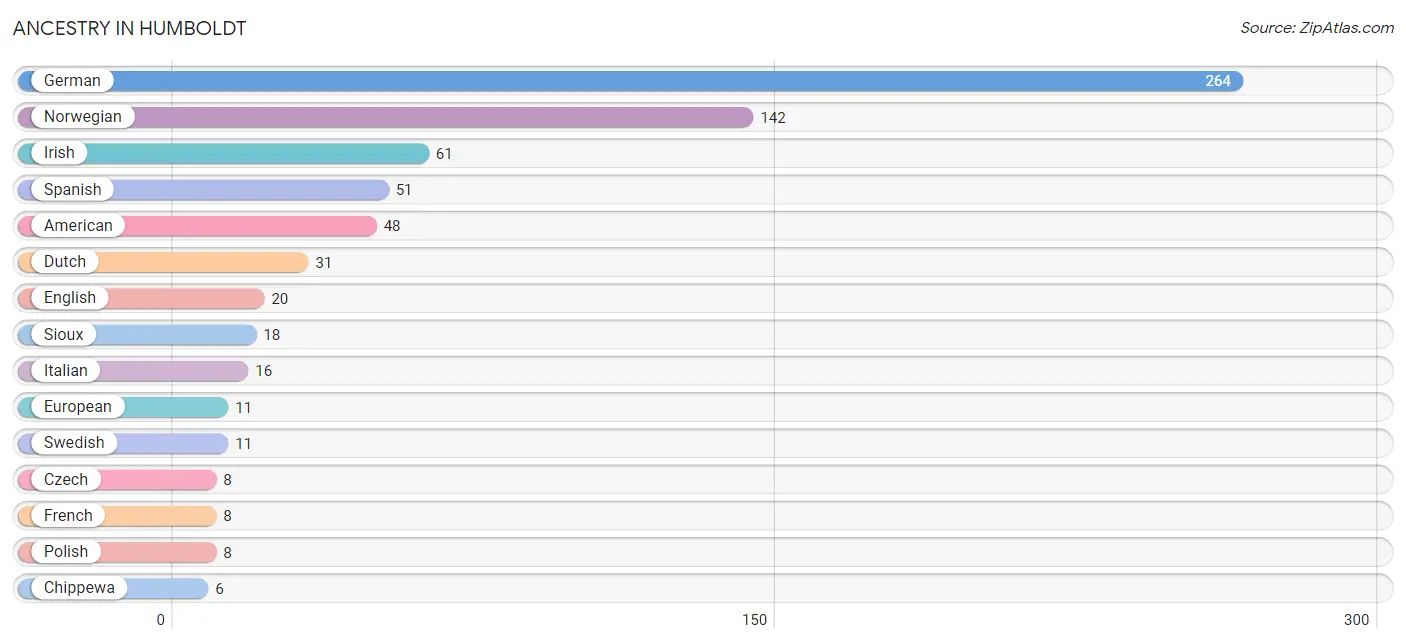
| Ancestry | # Population | % Population |
| American | 48 | 7.7% |
| Austrian | 5 | 0.8% |
| Burmese | 5 | 0.8% |
| Chippewa | 6 | 1.0% |
| Czech | 8 | 1.3% |
| Danish | 2 | 0.3% |
| Dutch | 31 | 5.0% |
| English | 20 | 3.2% |
| European | 11 | 1.8% |
| French | 8 | 1.3% |
| French Canadian | 3 | 0.5% |
| German | 264 | 42.6% |
| Greek | 5 | 0.8% |
| Irish | 61 | 9.9% |
| Italian | 16 | 2.6% |
| Norwegian | 142 | 22.9% |
| Polish | 8 | 1.3% |
| Russian | 2 | 0.3% |
| Scotch-Irish | 2 | 0.3% |
| Scottish | 2 | 0.3% |
| Sioux | 18 | 2.9% |
| Slovak | 5 | 0.8% |
| Spanish | 51 | 8.2% |
| Swedish | 11 | 1.8% |
| Welsh | 3 | 0.5% | View All 25 Rows |
Immigrants in Humboldt
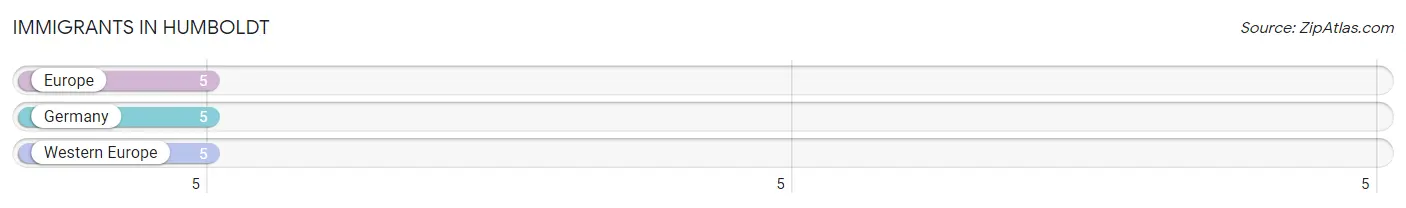
The most numerous immigrant groups reported in Humboldt came from Europe (5 | 0.8%), Germany (5 | 0.8%), and Western Europe (5 | 0.8%), together accounting for 2.4% of all Humboldt residents.
| Immigration Origin | # Population | % Population |
| Europe | 5 | 0.8% |
| Germany | 5 | 0.8% |
| Western Europe | 5 | 0.8% | View All 3 Rows |
Sex and Age in Humboldt
Sex and Age in Humboldt
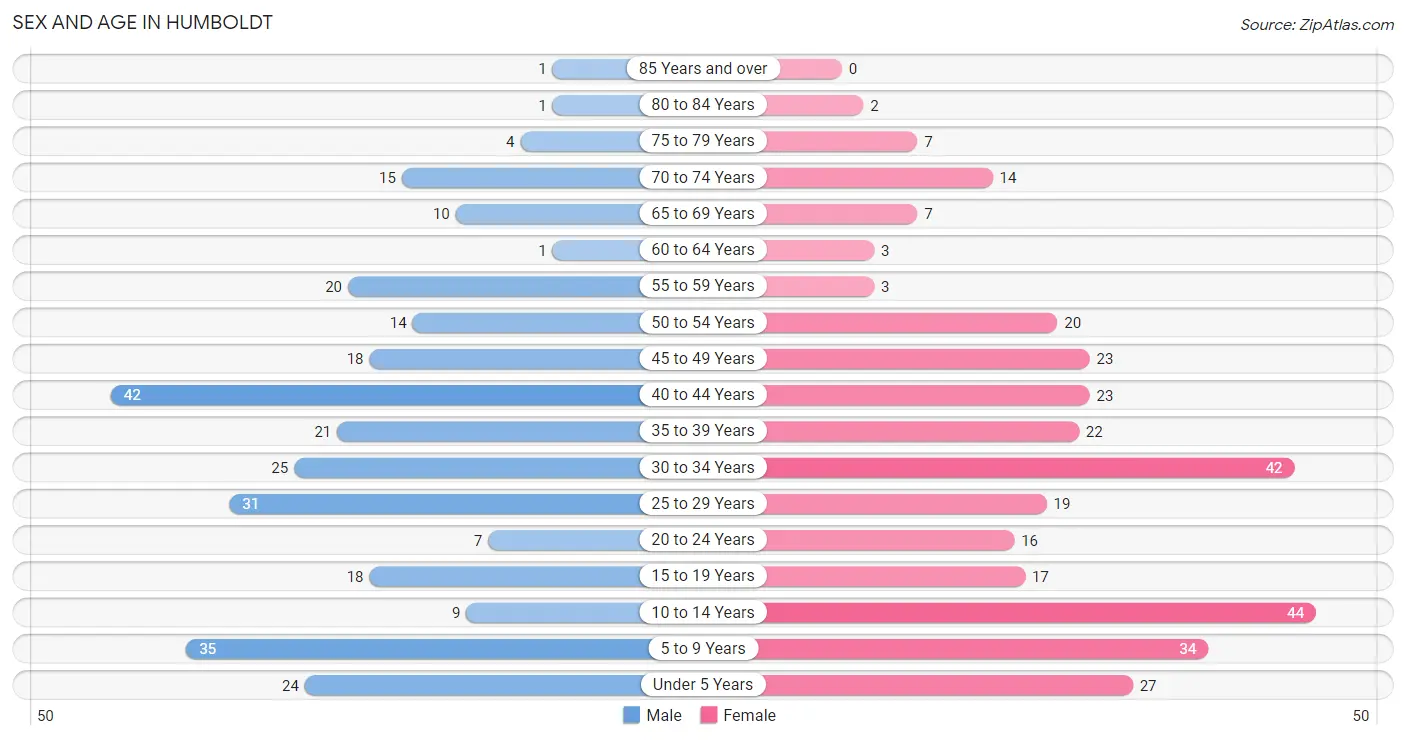
The most populous age groups in Humboldt are 40 to 44 Years (42 | 14.2%) for men and 10 to 14 Years (44 | 13.6%) for women.
| Age Bracket | Male | Female |
| Under 5 Years | 24 (8.1%) | 27 (8.4%) |
| 5 to 9 Years | 35 (11.8%) | 34 (10.5%) |
| 10 to 14 Years | 9 (3.0%) | 44 (13.6%) |
| 15 to 19 Years | 18 (6.1%) | 17 (5.3%) |
| 20 to 24 Years | 7 (2.4%) | 16 (5.0%) |
| 25 to 29 Years | 31 (10.5%) | 19 (5.9%) |
| 30 to 34 Years | 25 (8.5%) | 42 (13.0%) |
| 35 to 39 Years | 21 (7.1%) | 22 (6.8%) |
| 40 to 44 Years | 42 (14.2%) | 23 (7.1%) |
| 45 to 49 Years | 18 (6.1%) | 23 (7.1%) |
| 50 to 54 Years | 14 (4.7%) | 20 (6.2%) |
| 55 to 59 Years | 20 (6.8%) | 3 (0.9%) |
| 60 to 64 Years | 1 (0.3%) | 3 (0.9%) |
| 65 to 69 Years | 10 (3.4%) | 7 (2.2%) |
| 70 to 74 Years | 15 (5.1%) | 14 (4.3%) |
| 75 to 79 Years | 4 (1.3%) | 7 (2.2%) |
| 80 to 84 Years | 1 (0.3%) | 2 (0.6%) |
| 85 Years and over | 1 (0.3%) | 0 (0.0%) |
| Total | 296 (100.0%) | 323 (100.0%) |
Families and Households in Humboldt
Median Family Size in Humboldt
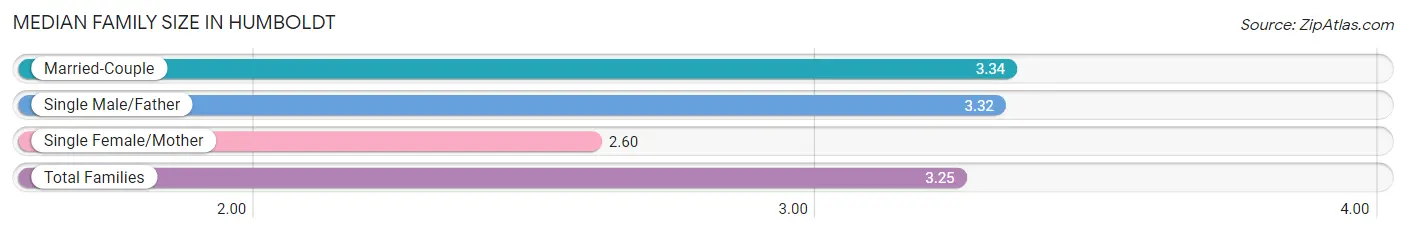
The median family size in Humboldt is 3.25 persons per family, with married-couple families (128 | 76.6%) accounting for the largest median family size of 3.34 persons per family. On the other hand, single female/mother families (20 | 12.0%) represent the smallest median family size with 2.60 persons per family.
| Family Type | # Families | Family Size |
| Married-Couple | 128 (76.6%) | 3.34 |
| Single Male/Father | 19 (11.4%) | 3.32 |
| Single Female/Mother | 20 (12.0%) | 2.60 |
| Total Families | 167 (100.0%) | 3.25 |
Median Household Size in Humboldt
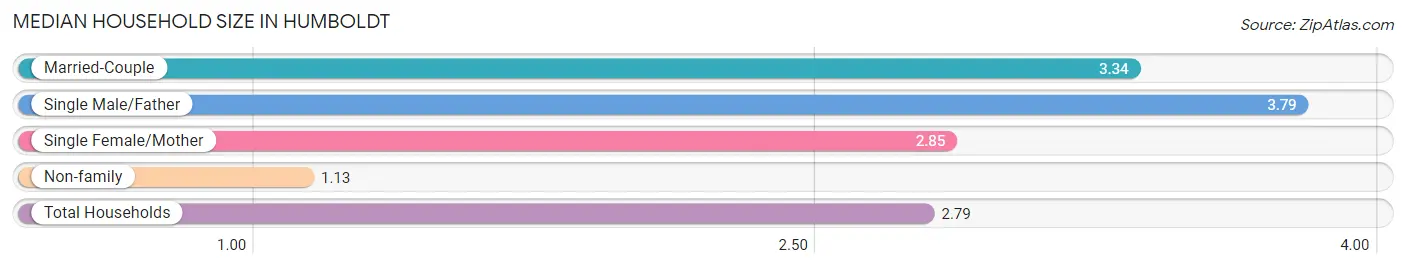
The median household size in Humboldt is 2.79 persons per household, with single male/father households (19 | 8.6%) accounting for the largest median household size of 3.79 persons per household. non-family households (55 | 24.8%) represent the smallest median household size with 1.13 persons per household.
| Household Type | # Households | Household Size |
| Married-Couple | 128 (57.7%) | 3.34 |
| Single Male/Father | 19 (8.6%) | 3.79 |
| Single Female/Mother | 20 (9.0%) | 2.85 |
| Non-family | 55 (24.8%) | 1.13 |
| Total Households | 222 (100.0%) | 2.79 |
Household Size by Marriage Status in Humboldt
Out of a total of 222 households in Humboldt, 167 (75.2%) are family households, while 55 (24.8%) are nonfamily households. The most numerous type of family households are 2-person households, comprising 59, and the most common type of nonfamily households are 1-person households, comprising 47.
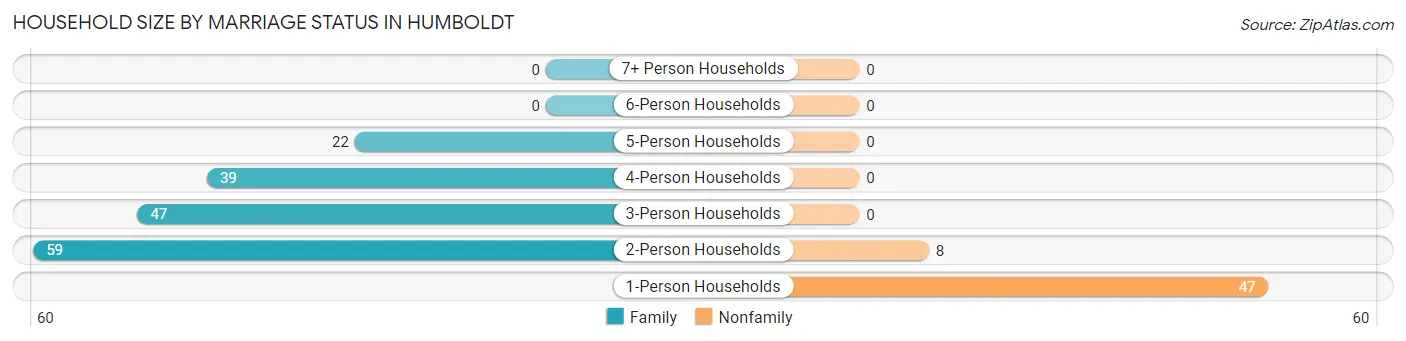
| Household Size | Family Households | Nonfamily Households |
| 1-Person Households | - | 47 (21.2%) |
| 2-Person Households | 59 (26.6%) | 8 (3.6%) |
| 3-Person Households | 47 (21.2%) | 0 (0.0%) |
| 4-Person Households | 39 (17.6%) | 0 (0.0%) |
| 5-Person Households | 22 (9.9%) | 0 (0.0%) |
| 6-Person Households | 0 (0.0%) | 0 (0.0%) |
| 7+ Person Households | 0 (0.0%) | 0 (0.0%) |
| Total | 167 (75.2%) | 55 (24.8%) |
Female Fertility in Humboldt
Fertility by Age in Humboldt
Average fertility rate in Humboldt is 54.0 births per 1,000 women. Women in the age bracket of 20 to 34 years have the highest fertility rate with 91.0 births per 1,000 women. Women in the age bracket of 20 to 34 years acount for 77.8% of all women with births.
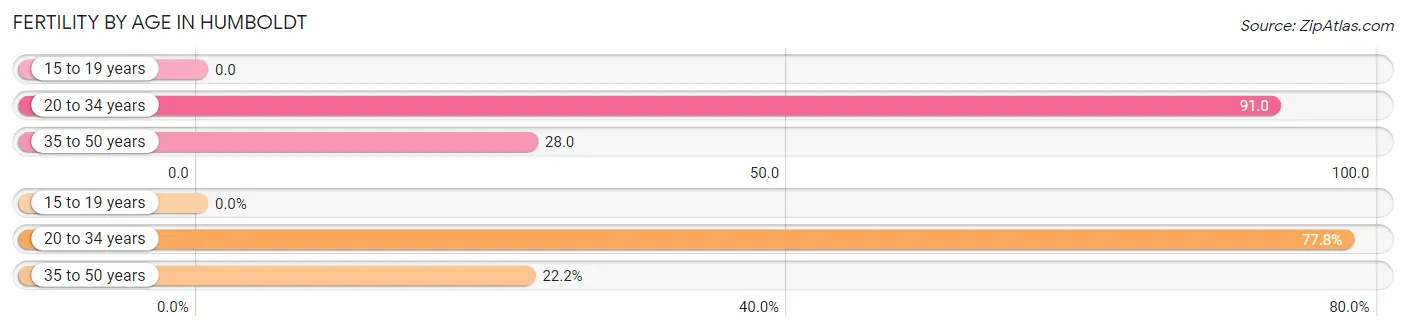
| Age Bracket | Women with Births | Births / 1,000 Women |
| 15 to 19 years | 0 (0.0%) | 0.0 |
| 20 to 34 years | 7 (77.8%) | 91.0 |
| 35 to 50 years | 2 (22.2%) | 28.0 |
| Total | 9 (100.0%) | 54.0 |
Fertility by Age by Marriage Status in Humboldt
44.4% of women with births (9) in Humboldt are married. The highest percentage of unmarried women with births falls into 35 to 50 years age bracket with 100.0% of them unmarried at the time of birth, while the lowest percentage of unmarried women with births belong to 20 to 34 years age bracket with 42.9% of them unmarried.
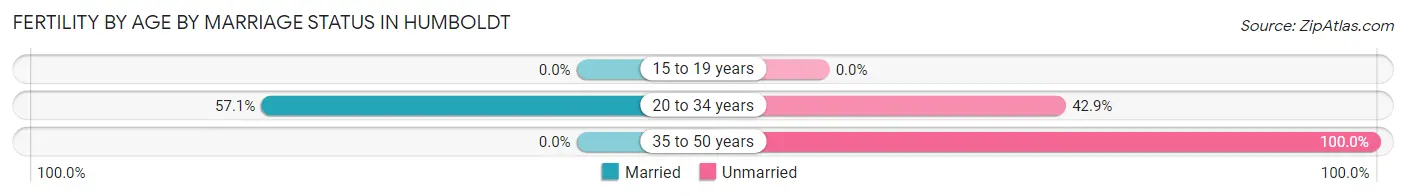
| Age Bracket | Married | Unmarried |
| 15 to 19 years | 0 (0.0%) | 0 (0.0%) |
| 20 to 34 years | 4 (57.1%) | 3 (42.9%) |
| 35 to 50 years | 0 (0.0%) | 2 (100.0%) |
| Total | 4 (44.4%) | 5 (55.6%) |
Fertility by Education in Humboldt
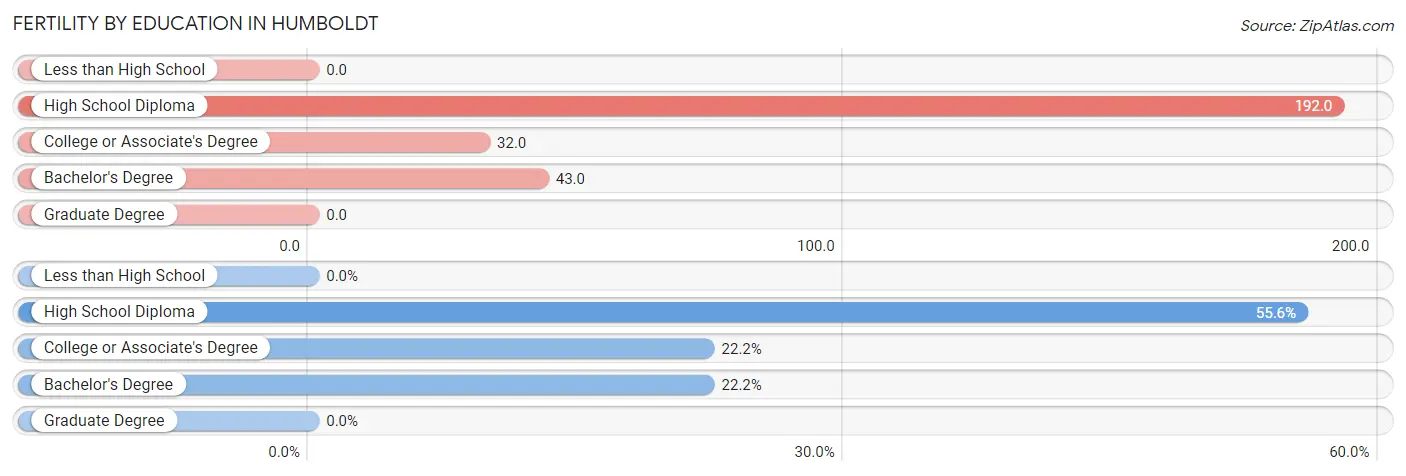
| Educational Attainment | Women with Births | Births / 1,000 Women |
| Less than High School | 0 (0.0%) | 0.0 |
| High School Diploma | 5 (55.6%) | 192.0 |
| College or Associate's Degree | 2 (22.2%) | 32.0 |
| Bachelor's Degree | 2 (22.2%) | 43.0 |
| Graduate Degree | 0 (0.0%) | 0.0 |
| Total | 9 (100.0%) | 54.0 |
Fertility by Education by Marriage Status in Humboldt
55.6% of women with births in Humboldt are unmarried. Women with the educational attainment of college or associate's degree are most likely to be married with 100.0% of them married at childbirth, while women with the educational attainment of high school diploma are least likely to be married with 100.0% of them unmarried at childbirth.
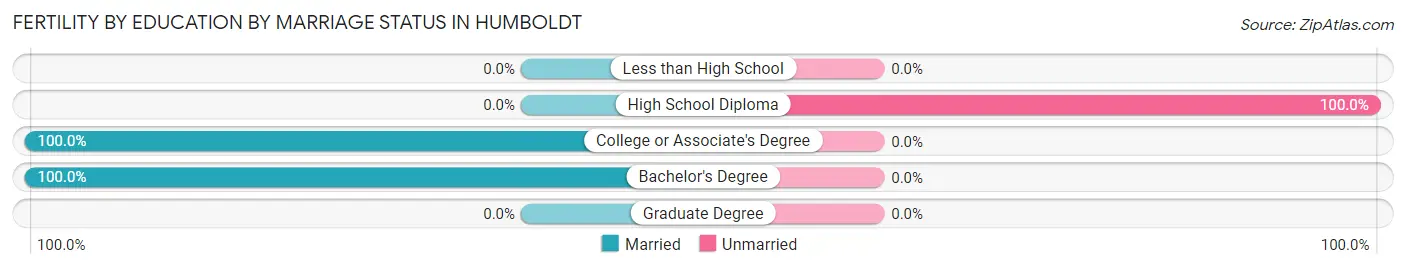
| Educational Attainment | Married | Unmarried |
| Less than High School | 0 (0.0%) | 0 (0.0%) |
| High School Diploma | 0 (0.0%) | 5 (100.0%) |
| College or Associate's Degree | 2 (100.0%) | 0 (0.0%) |
| Bachelor's Degree | 2 (100.0%) | 0 (0.0%) |
| Graduate Degree | 0 (0.0%) | 0 (0.0%) |
| Total | 4 (44.4%) | 5 (55.6%) |
Employment Characteristics in Humboldt
Employment by Class of Employer in Humboldt
Among the 344 employed individuals in Humboldt, private company employees (235 | 68.3%), self-employed (not incorporated) (34 | 9.9%), and local government employees (29 | 8.4%) make up the most common classes of employment.
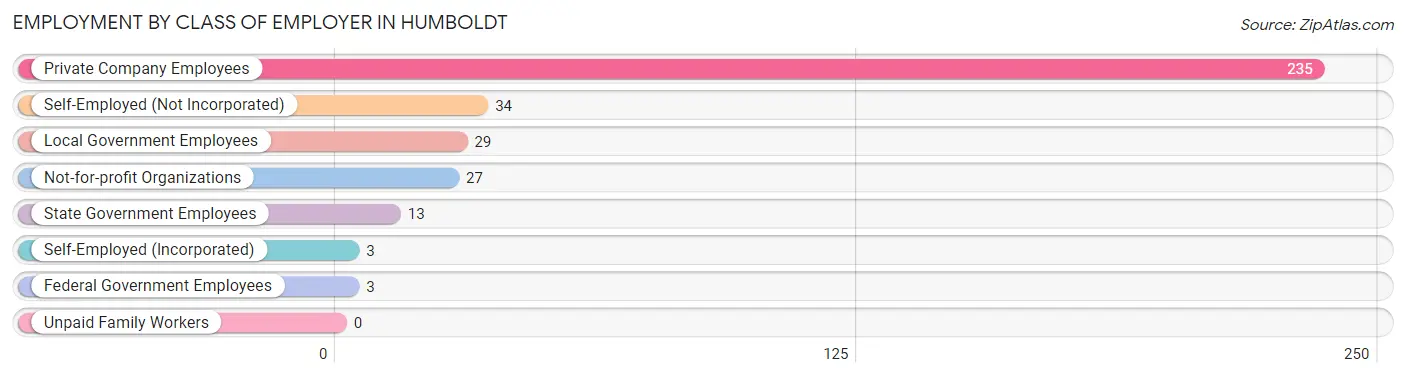
| Employer Class | # Employees | % Employees |
| Private Company Employees | 235 | 68.3% |
| Self-Employed (Incorporated) | 3 | 0.9% |
| Self-Employed (Not Incorporated) | 34 | 9.9% |
| Not-for-profit Organizations | 27 | 7.9% |
| Local Government Employees | 29 | 8.4% |
| State Government Employees | 13 | 3.8% |
| Federal Government Employees | 3 | 0.9% |
| Unpaid Family Workers | 0 | 0.0% |
| Total | 344 | 100.0% |
Employment Status by Age in Humboldt
According to the labor force statistics for Humboldt, out of the total population over 16 years of age (432), 81.9% or 354 individuals are in the labor force, with 1.1% or 4 of them unemployed. The age group with the highest labor force participation rate is 55 to 59 years, with 100.0% or 23 individuals in the labor force. Within the labor force, the 16 to 19 years age range has the highest percentage of unemployed individuals, with 16.7% or 2 of them being unemployed.
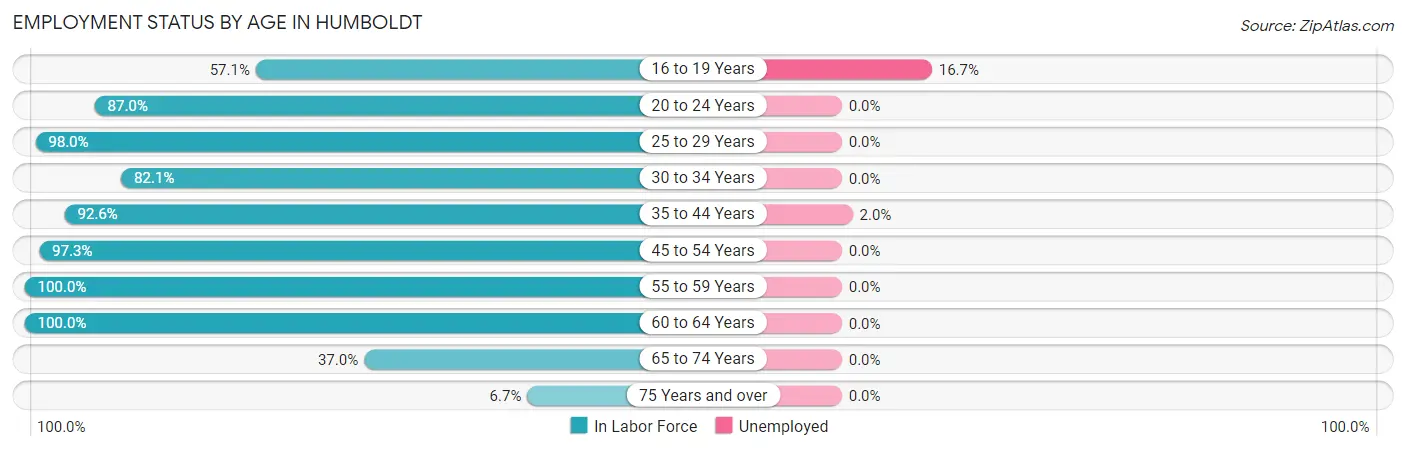
| Age Bracket | In Labor Force | Unemployed |
| 16 to 19 Years | 12 (57.1%) | 2 (16.7%) |
| 20 to 24 Years | 20 (87.0%) | 0 (0.0%) |
| 25 to 29 Years | 49 (98.0%) | 0 (0.0%) |
| 30 to 34 Years | 55 (82.1%) | 0 (0.0%) |
| 35 to 44 Years | 100 (92.6%) | 2 (2.0%) |
| 45 to 54 Years | 73 (97.3%) | 0 (0.0%) |
| 55 to 59 Years | 23 (100.0%) | 0 (0.0%) |
| 60 to 64 Years | 4 (100.0%) | 0 (0.0%) |
| 65 to 74 Years | 17 (37.0%) | 0 (0.0%) |
| 75 Years and over | 1 (6.7%) | 0 (0.0%) |
| Total | 354 (81.9%) | 4 (1.1%) |
Employment Status by Educational Attainment in Humboldt
According to labor force statistics for Humboldt, 93.0% of individuals (304) out of the total population between 25 and 64 years of age (327) are in the labor force, with 0.7% or 2 of them being unemployed. The group with the highest labor force participation rate are those with the educational attainment of high school diploma, with 100.0% or 62 individuals in the labor force. Within the labor force, individuals with college / associate degree education have the highest percentage of unemployment, with 1.5% or 2 of them being unemployed.
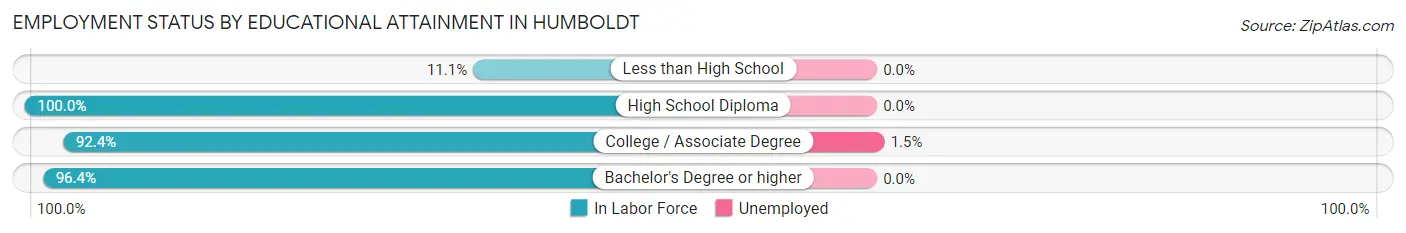
| Educational Attainment | In Labor Force | Unemployed |
| Less than High School | 1 (11.1%) | 0 (0.0%) |
| High School Diploma | 62 (100.0%) | 0 (0.0%) |
| College / Associate Degree | 133 (92.4%) | 2 (1.5%) |
| Bachelor's Degree or higher | 108 (96.4%) | 0 (0.0%) |
| Total | 304 (93.0%) | 2 (0.7%) |
Employment Occupations by Sex in Humboldt
Management, Business, Science and Arts Occupations
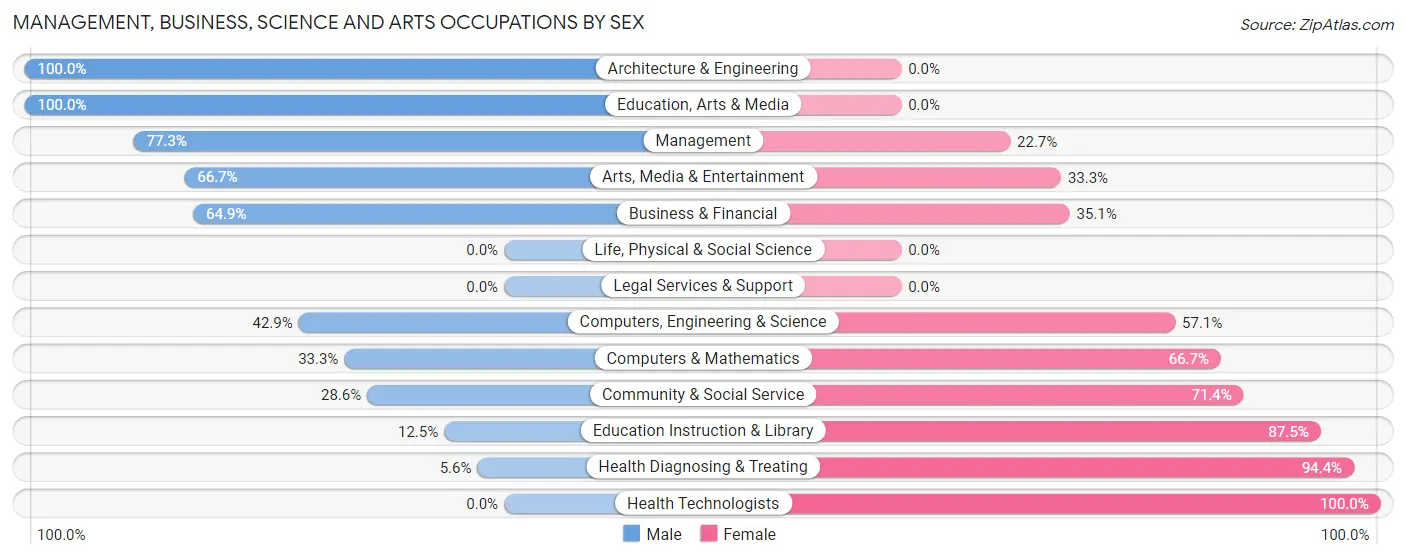
The most common Management, Business, Science and Arts occupations in Humboldt are Business & Financial (37 | 10.6%), Health Diagnosing & Treating (36 | 10.3%), Management (22 | 6.3%), Community & Social Service (21 | 6.0%), and Education Instruction & Library (16 | 4.6%).

Management, Business, Science and Arts Occupations by Sex
Within the Management, Business, Science and Arts occupations in Humboldt, the most male-oriented occupations are Architecture & Engineering (100.0%), Education, Arts & Media (100.0%), and Management (77.3%), while the most female-oriented occupations are Health Technologists (100.0%), Health Diagnosing & Treating (94.4%), and Education Instruction & Library (87.5%).
| Occupation | Male | Female |
| Management | 17 (77.3%) | 5 (22.7%) |
| Business & Financial | 24 (64.9%) | 13 (35.1%) |
| Computers, Engineering & Science | 6 (42.9%) | 8 (57.1%) |
| Computers & Mathematics | 4 (33.3%) | 8 (66.7%) |
| Architecture & Engineering | 2 (100.0%) | 0 (0.0%) |
| Life, Physical & Social Science | 0 (0.0%) | 0 (0.0%) |
| Community & Social Service | 6 (28.6%) | 15 (71.4%) |
| Education, Arts & Media | 2 (100.0%) | 0 (0.0%) |
| Legal Services & Support | 0 (0.0%) | 0 (0.0%) |
| Education Instruction & Library | 2 (12.5%) | 14 (87.5%) |
| Arts, Media & Entertainment | 2 (66.7%) | 1 (33.3%) |
| Health Diagnosing & Treating | 2 (5.6%) | 34 (94.4%) |
| Health Technologists | 0 (0.0%) | 15 (100.0%) |
| Total (Category) | 55 (42.3%) | 75 (57.7%) |
| Total (Overall) | 186 (53.1%) | 164 (46.9%) |
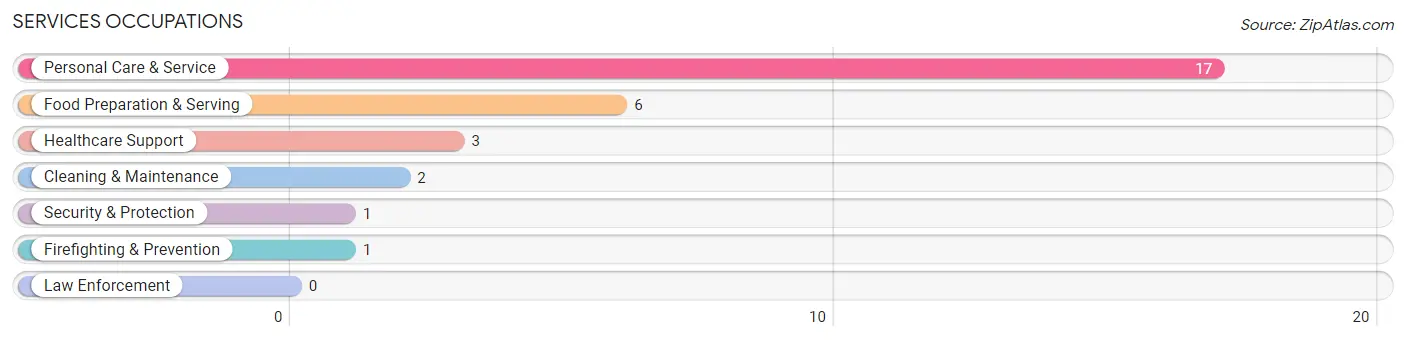
Services Occupations
The most common Services occupations in Humboldt are Personal Care & Service (17 | 4.9%), Food Preparation & Serving (6 | 1.7%), Healthcare Support (3 | 0.9%), Cleaning & Maintenance (2 | 0.6%), and Security & Protection (1 | 0.3%).
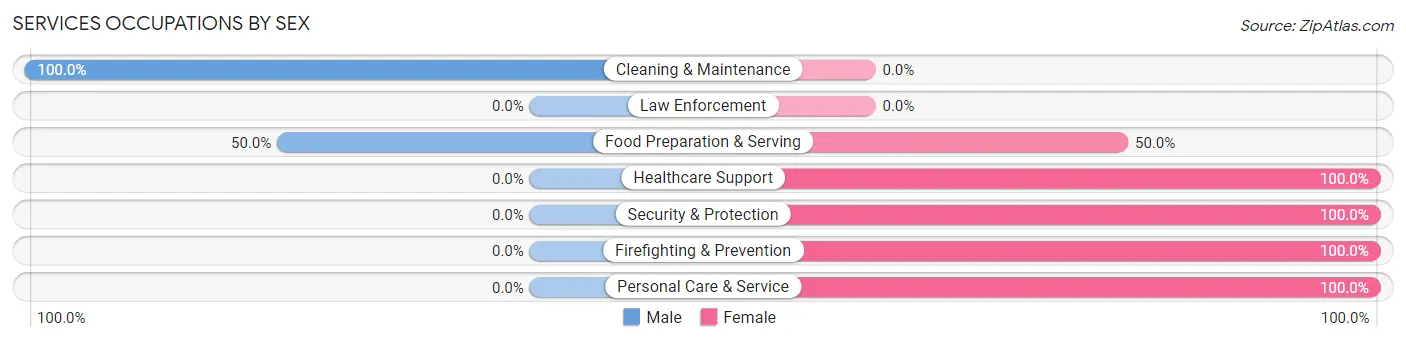
Services Occupations by Sex
Within the Services occupations in Humboldt, the most male-oriented occupations are Cleaning & Maintenance (100.0%), and Food Preparation & Serving (50.0%), while the most female-oriented occupations are Healthcare Support (100.0%), Security & Protection (100.0%), and Firefighting & Prevention (100.0%).
| Occupation | Male | Female |
| Healthcare Support | 0 (0.0%) | 3 (100.0%) |
| Security & Protection | 0 (0.0%) | 1 (100.0%) |
| Firefighting & Prevention | 0 (0.0%) | 1 (100.0%) |
| Law Enforcement | 0 (0.0%) | 0 (0.0%) |
| Food Preparation & Serving | 3 (50.0%) | 3 (50.0%) |
| Cleaning & Maintenance | 2 (100.0%) | 0 (0.0%) |
| Personal Care & Service | 0 (0.0%) | 17 (100.0%) |
| Total (Category) | 5 (17.2%) | 24 (82.8%) |
| Total (Overall) | 186 (53.1%) | 164 (46.9%) |
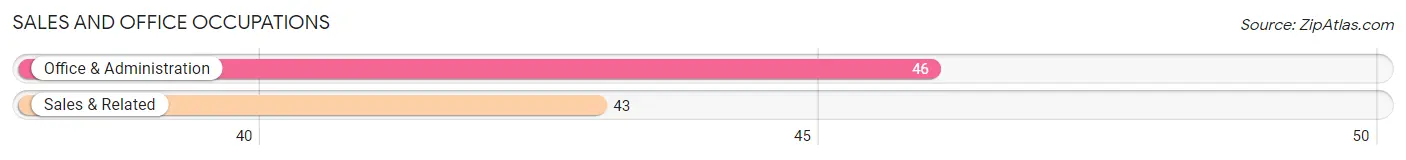
Sales and Office Occupations
The most common Sales and Office occupations in Humboldt are Office & Administration (46 | 13.1%), and Sales & Related (43 | 12.3%).
Sales and Office Occupations by Sex
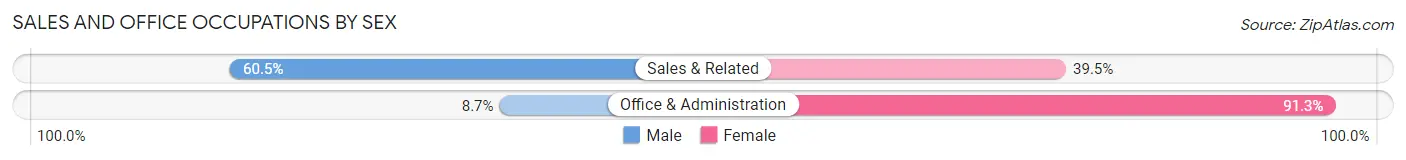
| Occupation | Male | Female |
| Sales & Related | 26 (60.5%) | 17 (39.5%) |
| Office & Administration | 4 (8.7%) | 42 (91.3%) |
| Total (Category) | 30 (33.7%) | 59 (66.3%) |
| Total (Overall) | 186 (53.1%) | 164 (46.9%) |
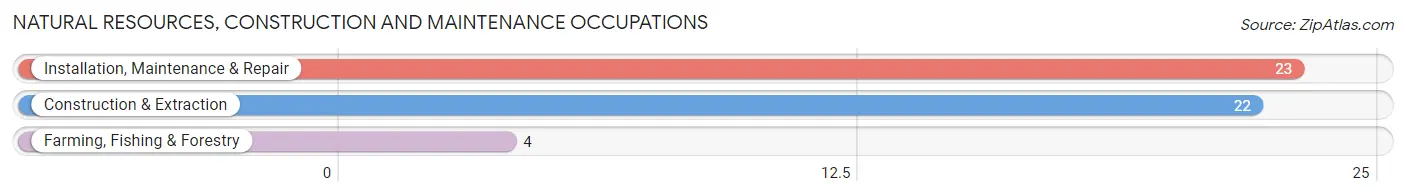
Natural Resources, Construction and Maintenance Occupations
The most common Natural Resources, Construction and Maintenance occupations in Humboldt are Installation, Maintenance & Repair (23 | 6.6%), Construction & Extraction (22 | 6.3%), and Farming, Fishing & Forestry (4 | 1.1%).
Natural Resources, Construction and Maintenance Occupations by Sex
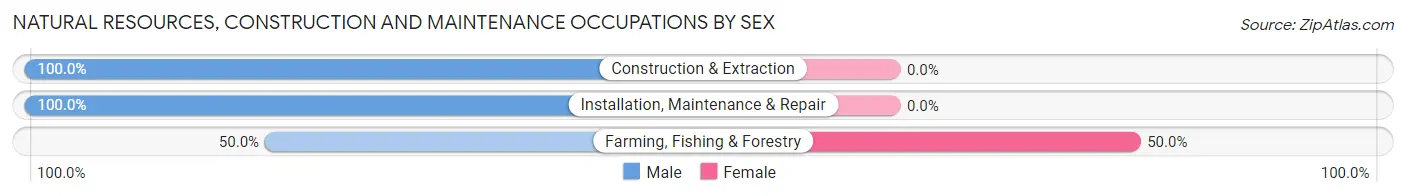
| Occupation | Male | Female |
| Farming, Fishing & Forestry | 2 (50.0%) | 2 (50.0%) |
| Construction & Extraction | 22 (100.0%) | 0 (0.0%) |
| Installation, Maintenance & Repair | 23 (100.0%) | 0 (0.0%) |
| Total (Category) | 47 (95.9%) | 2 (4.1%) |
| Total (Overall) | 186 (53.1%) | 164 (46.9%) |
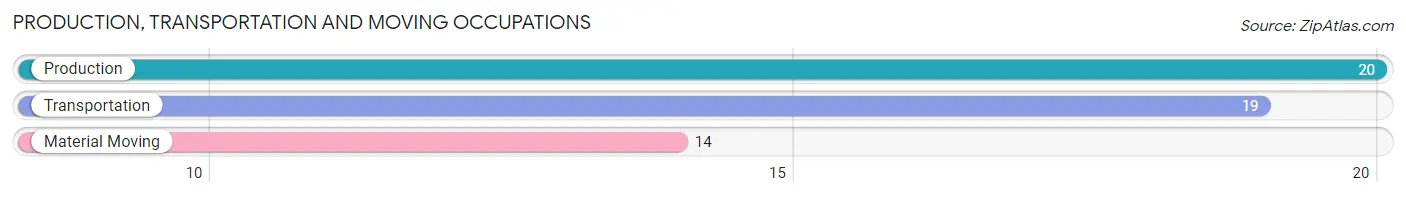
Production, Transportation and Moving Occupations
The most common Production, Transportation and Moving occupations in Humboldt are Production (20 | 5.7%), Transportation (19 | 5.4%), and Material Moving (14 | 4.0%).
Production, Transportation and Moving Occupations by Sex
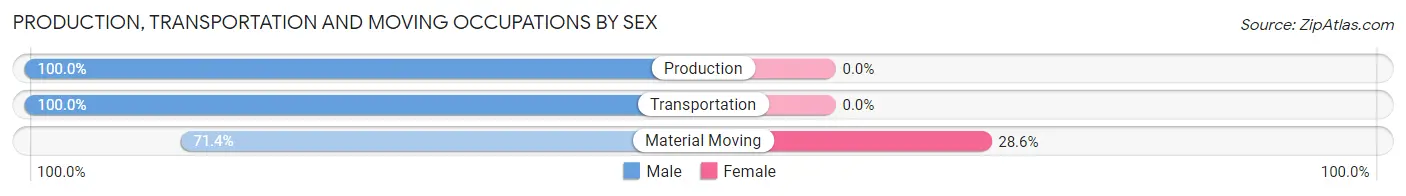
| Occupation | Male | Female |
| Production | 20 (100.0%) | 0 (0.0%) |
| Transportation | 19 (100.0%) | 0 (0.0%) |
| Material Moving | 10 (71.4%) | 4 (28.6%) |
| Total (Category) | 49 (92.4%) | 4 (7.5%) |
| Total (Overall) | 186 (53.1%) | 164 (46.9%) |
Employment Industries by Sex in Humboldt
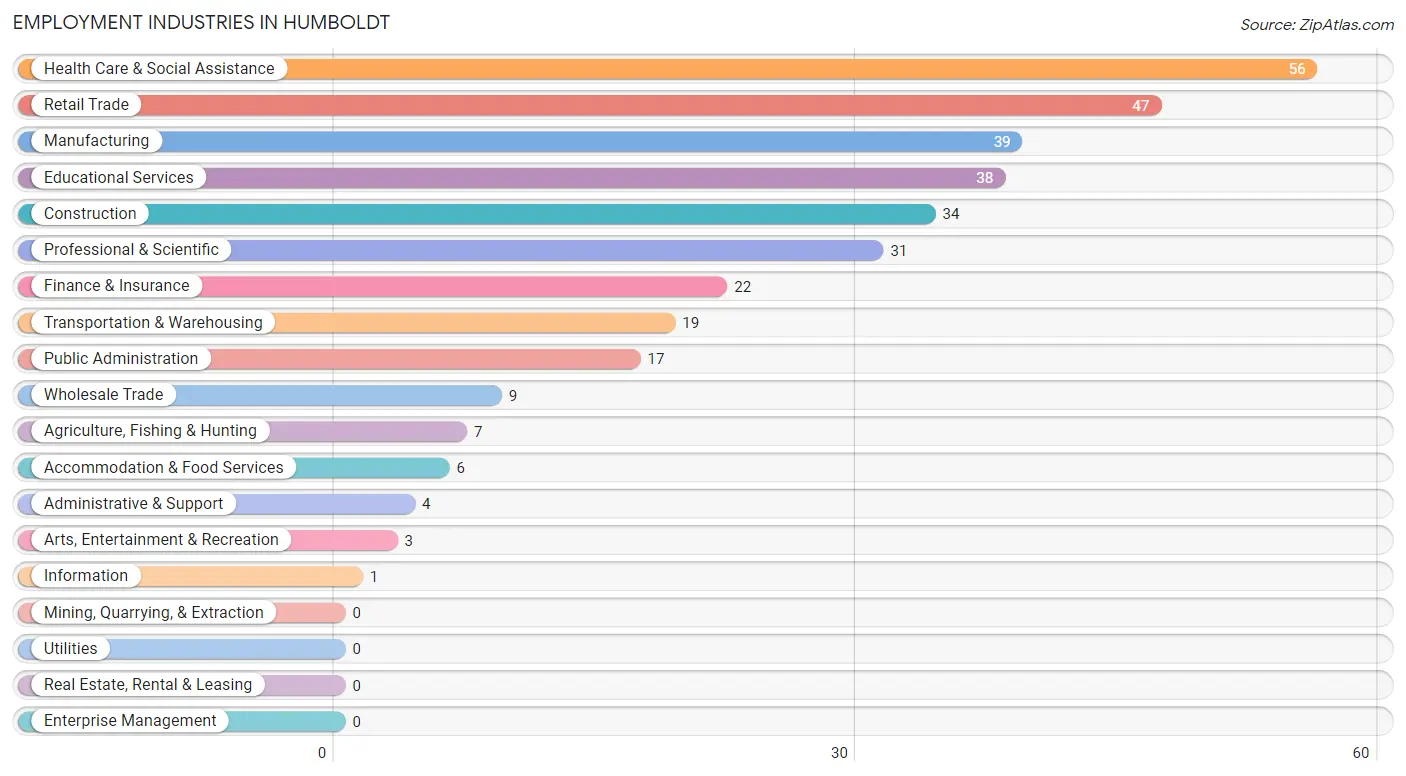
Employment Industries in Humboldt
The major employment industries in Humboldt include Health Care & Social Assistance (56 | 16.0%), Retail Trade (47 | 13.4%), Manufacturing (39 | 11.1%), Educational Services (38 | 10.9%), and Construction (34 | 9.7%).
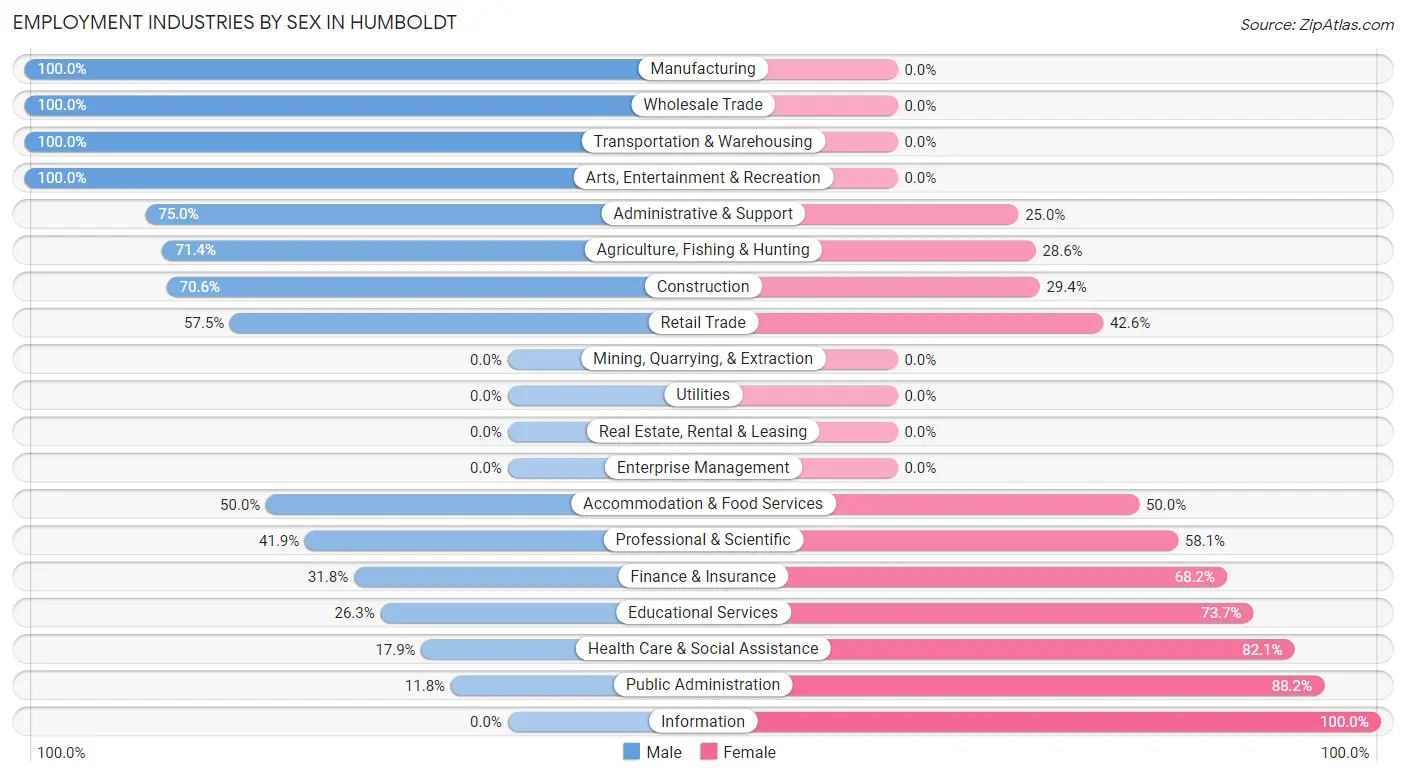
Employment Industries by Sex in Humboldt
The Humboldt industries that see more men than women are Manufacturing (100.0%), Wholesale Trade (100.0%), and Transportation & Warehousing (100.0%), whereas the industries that tend to have a higher number of women are Information (100.0%), Public Administration (88.2%), and Health Care & Social Assistance (82.1%).
| Industry | Male | Female |
| Agriculture, Fishing & Hunting | 5 (71.4%) | 2 (28.6%) |
| Mining, Quarrying, & Extraction | 0 (0.0%) | 0 (0.0%) |
| Construction | 24 (70.6%) | 10 (29.4%) |
| Manufacturing | 39 (100.0%) | 0 (0.0%) |
| Wholesale Trade | 9 (100.0%) | 0 (0.0%) |
| Retail Trade | 27 (57.5%) | 20 (42.5%) |
| Transportation & Warehousing | 19 (100.0%) | 0 (0.0%) |
| Utilities | 0 (0.0%) | 0 (0.0%) |
| Information | 0 (0.0%) | 1 (100.0%) |
| Finance & Insurance | 7 (31.8%) | 15 (68.2%) |
| Real Estate, Rental & Leasing | 0 (0.0%) | 0 (0.0%) |
| Professional & Scientific | 13 (41.9%) | 18 (58.1%) |
| Enterprise Management | 0 (0.0%) | 0 (0.0%) |
| Administrative & Support | 3 (75.0%) | 1 (25.0%) |
| Educational Services | 10 (26.3%) | 28 (73.7%) |
| Health Care & Social Assistance | 10 (17.9%) | 46 (82.1%) |
| Arts, Entertainment & Recreation | 3 (100.0%) | 0 (0.0%) |
| Accommodation & Food Services | 3 (50.0%) | 3 (50.0%) |
| Public Administration | 2 (11.8%) | 15 (88.2%) |
| Total | 186 (53.1%) | 164 (46.9%) |
Education in Humboldt
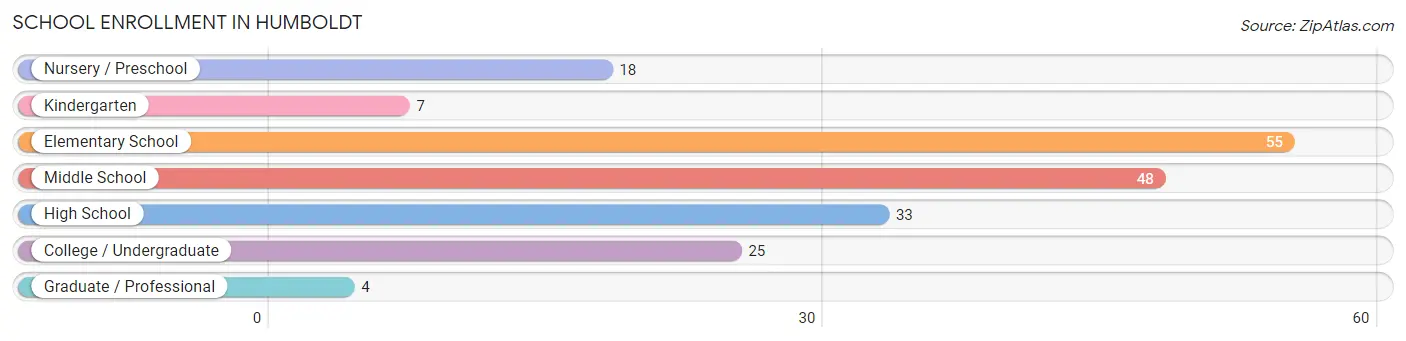
School Enrollment in Humboldt
The most common levels of schooling among the 190 students in Humboldt are elementary school (55 | 28.9%), middle school (48 | 25.3%), and high school (33 | 17.4%).
| School Level | # Students | % Students |
| Nursery / Preschool | 18 | 9.5% |
| Kindergarten | 7 | 3.7% |
| Elementary School | 55 | 28.9% |
| Middle School | 48 | 25.3% |
| High School | 33 | 17.4% |
| College / Undergraduate | 25 | 13.2% |
| Graduate / Professional | 4 | 2.1% |
| Total | 190 | 100.0% |
School Enrollment by Age by Funding Source in Humboldt
Out of a total of 190 students who are enrolled in schools in Humboldt, 7 (3.7%) attend a private institution, while the remaining 183 (96.3%) are enrolled in public schools. The age group of 25 to 34 year olds has the highest likelihood of being enrolled in private schools, with 2 (13.3% in the age bracket) enrolled. Conversely, the age group of 10 to 14 year olds has the lowest likelihood of being enrolled in a private school, with 53 (100.0% in the age bracket) attending a public institution.
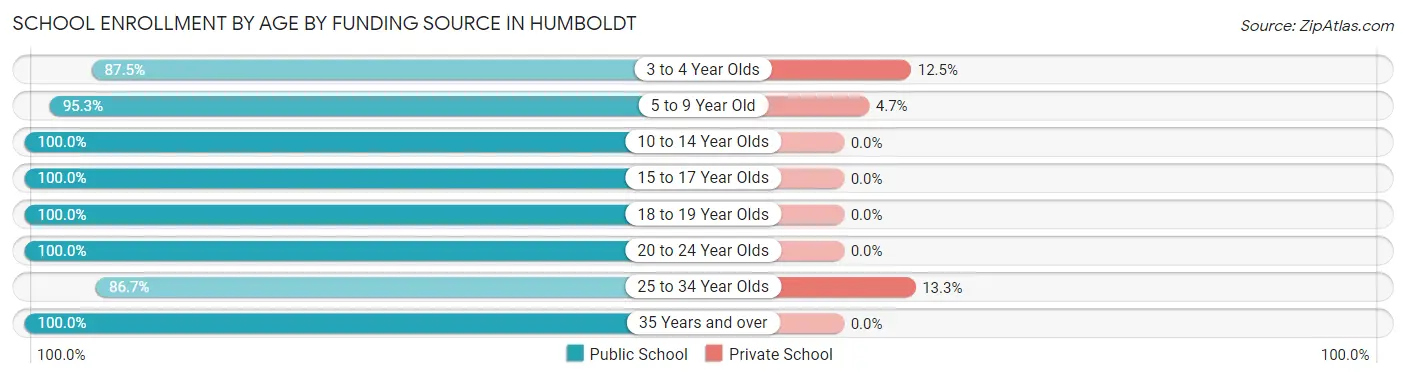
| Age Bracket | Public School | Private School |
| 3 to 4 Year Olds | 14 (87.5%) | 2 (12.5%) |
| 5 to 9 Year Old | 61 (95.3%) | 3 (4.7%) |
| 10 to 14 Year Olds | 53 (100.0%) | 0 (0.0%) |
| 15 to 17 Year Olds | 24 (100.0%) | 0 (0.0%) |
| 18 to 19 Year Olds | 6 (100.0%) | 0 (0.0%) |
| 20 to 24 Year Olds | 6 (100.0%) | 0 (0.0%) |
| 25 to 34 Year Olds | 13 (86.7%) | 2 (13.3%) |
| 35 Years and over | 6 (100.0%) | 0 (0.0%) |
| Total | 183 (96.3%) | 7 (3.7%) |
Educational Attainment by Field of Study in Humboldt
Education (37 | 27.0%), business (23 | 16.8%), science & technology (20 | 14.6%), computers & mathematics (15 | 11.0%), and multidisciplinary studies (11 | 8.0%) are the most common fields of study among 137 individuals in Humboldt who have obtained a bachelor's degree or higher.
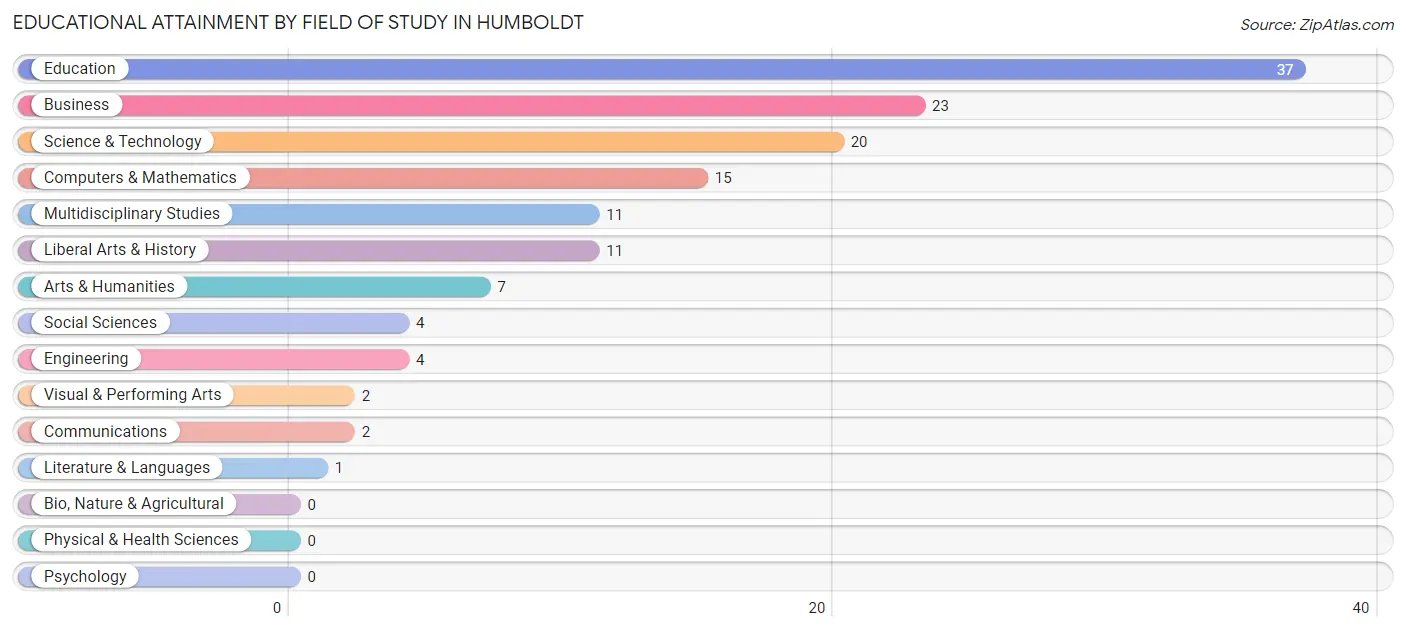
| Field of Study | # Graduates | % Graduates |
| Computers & Mathematics | 15 | 11.0% |
| Bio, Nature & Agricultural | 0 | 0.0% |
| Physical & Health Sciences | 0 | 0.0% |
| Psychology | 0 | 0.0% |
| Social Sciences | 4 | 2.9% |
| Engineering | 4 | 2.9% |
| Multidisciplinary Studies | 11 | 8.0% |
| Science & Technology | 20 | 14.6% |
| Business | 23 | 16.8% |
| Education | 37 | 27.0% |
| Literature & Languages | 1 | 0.7% |
| Liberal Arts & History | 11 | 8.0% |
| Visual & Performing Arts | 2 | 1.5% |
| Communications | 2 | 1.5% |
| Arts & Humanities | 7 | 5.1% |
| Total | 137 | 100.0% |
Transportation & Commute in Humboldt
Vehicle Availability by Sex in Humboldt
The most prevalent vehicle ownership categories in Humboldt are males with 3 vehicles (85, accounting for 46.0%) and females with 3 vehicles (75, making up 53.5%).
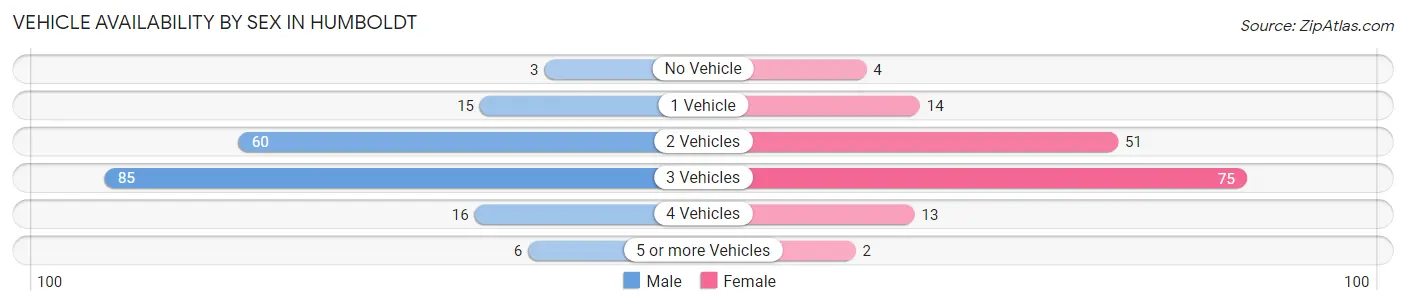
| Vehicles Available | Male | Female |
| No Vehicle | 3 (1.6%) | 4 (2.5%) |
| 1 Vehicle | 15 (8.1%) | 14 (8.8%) |
| 2 Vehicles | 60 (32.4%) | 51 (32.1%) |
| 3 Vehicles | 85 (46.0%) | 75 (47.2%) |
| 4 Vehicles | 16 (8.6%) | 13 (8.2%) |
| 5 or more Vehicles | 6 (3.2%) | 2 (1.3%) |
| Total | 185 (100.0%) | 159 (100.0%) |
Commute Time in Humboldt
The most frequently occuring commute durations in Humboldt are 30 to 34 minutes (90 commuters, 30.7%), 35 to 39 minutes (49 commuters, 16.7%), and 40 to 44 minutes (31 commuters, 10.6%).
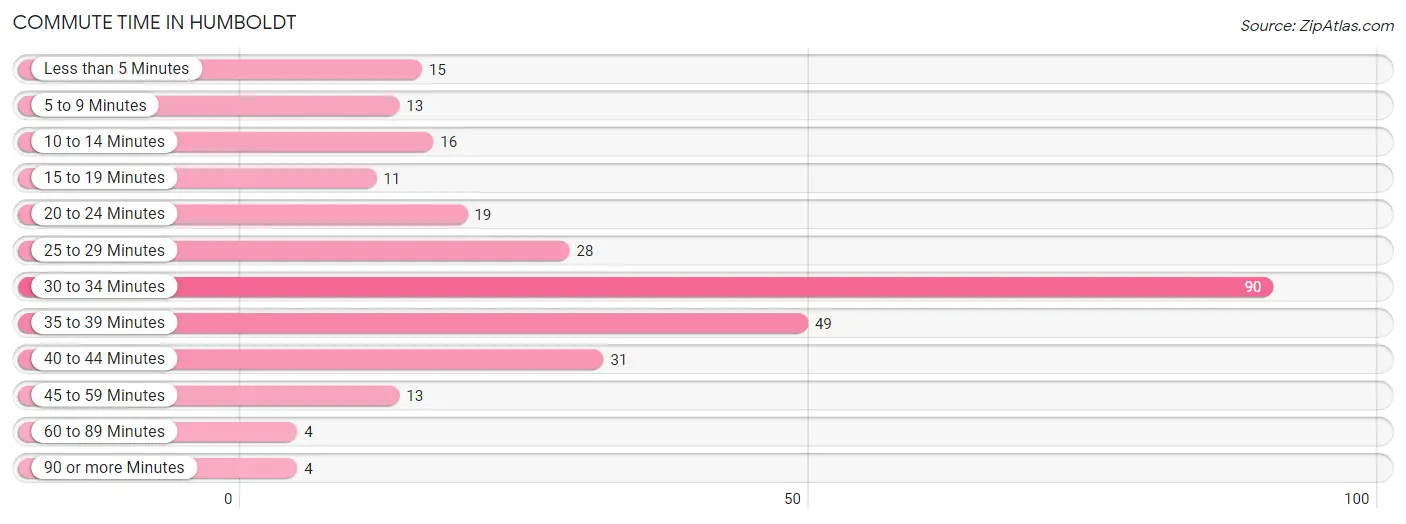
| Commute Time | # Commuters | % Commuters |
| Less than 5 Minutes | 15 | 5.1% |
| 5 to 9 Minutes | 13 | 4.4% |
| 10 to 14 Minutes | 16 | 5.5% |
| 15 to 19 Minutes | 11 | 3.7% |
| 20 to 24 Minutes | 19 | 6.5% |
| 25 to 29 Minutes | 28 | 9.6% |
| 30 to 34 Minutes | 90 | 30.7% |
| 35 to 39 Minutes | 49 | 16.7% |
| 40 to 44 Minutes | 31 | 10.6% |
| 45 to 59 Minutes | 13 | 4.4% |
| 60 to 89 Minutes | 4 | 1.4% |
| 90 or more Minutes | 4 | 1.4% |
Commute Time by Sex in Humboldt
The most common commute times in Humboldt are 30 to 34 minutes (58 commuters, 33.3%) for males and 30 to 34 minutes (32 commuters, 26.9%) for females.
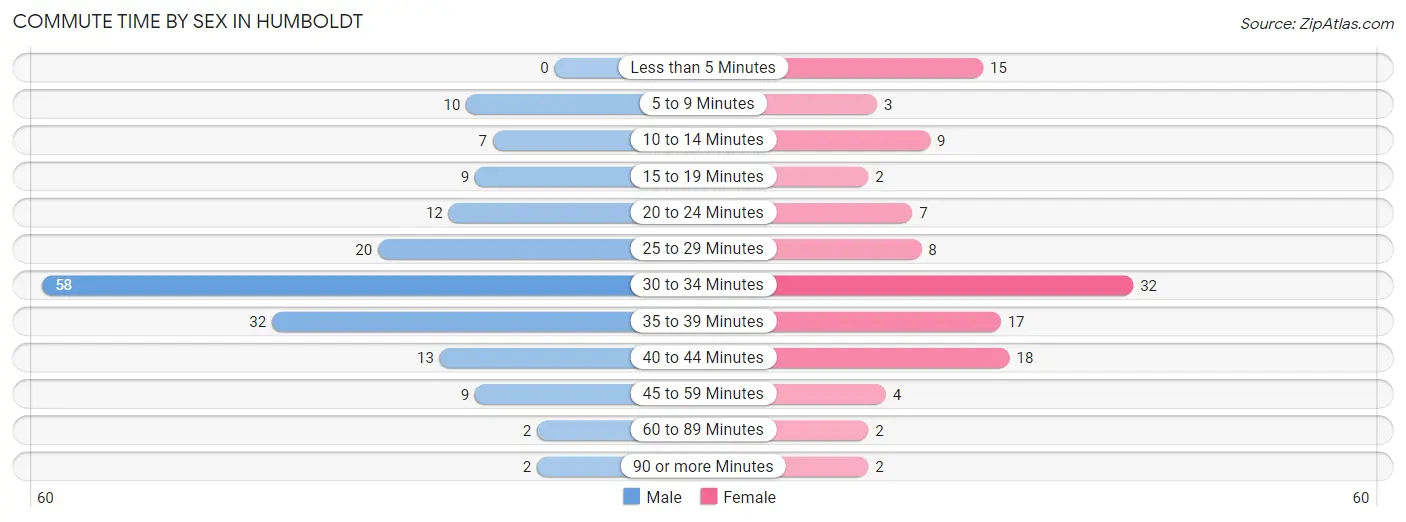
| Commute Time | Male | Female |
| Less than 5 Minutes | 0 (0.0%) | 15 (12.6%) |
| 5 to 9 Minutes | 10 (5.8%) | 3 (2.5%) |
| 10 to 14 Minutes | 7 (4.0%) | 9 (7.6%) |
| 15 to 19 Minutes | 9 (5.2%) | 2 (1.7%) |
| 20 to 24 Minutes | 12 (6.9%) | 7 (5.9%) |
| 25 to 29 Minutes | 20 (11.5%) | 8 (6.7%) |
| 30 to 34 Minutes | 58 (33.3%) | 32 (26.9%) |
| 35 to 39 Minutes | 32 (18.4%) | 17 (14.3%) |
| 40 to 44 Minutes | 13 (7.5%) | 18 (15.1%) |
| 45 to 59 Minutes | 9 (5.2%) | 4 (3.4%) |
| 60 to 89 Minutes | 2 (1.1%) | 2 (1.7%) |
| 90 or more Minutes | 2 (1.1%) | 2 (1.7%) |
Time of Departure to Work by Sex in Humboldt
The most frequent times of departure to work in Humboldt are 7:30 AM to 7:59 AM (46, 26.4%) for males and 6:30 AM to 6:59 AM (25, 21.0%) for females.
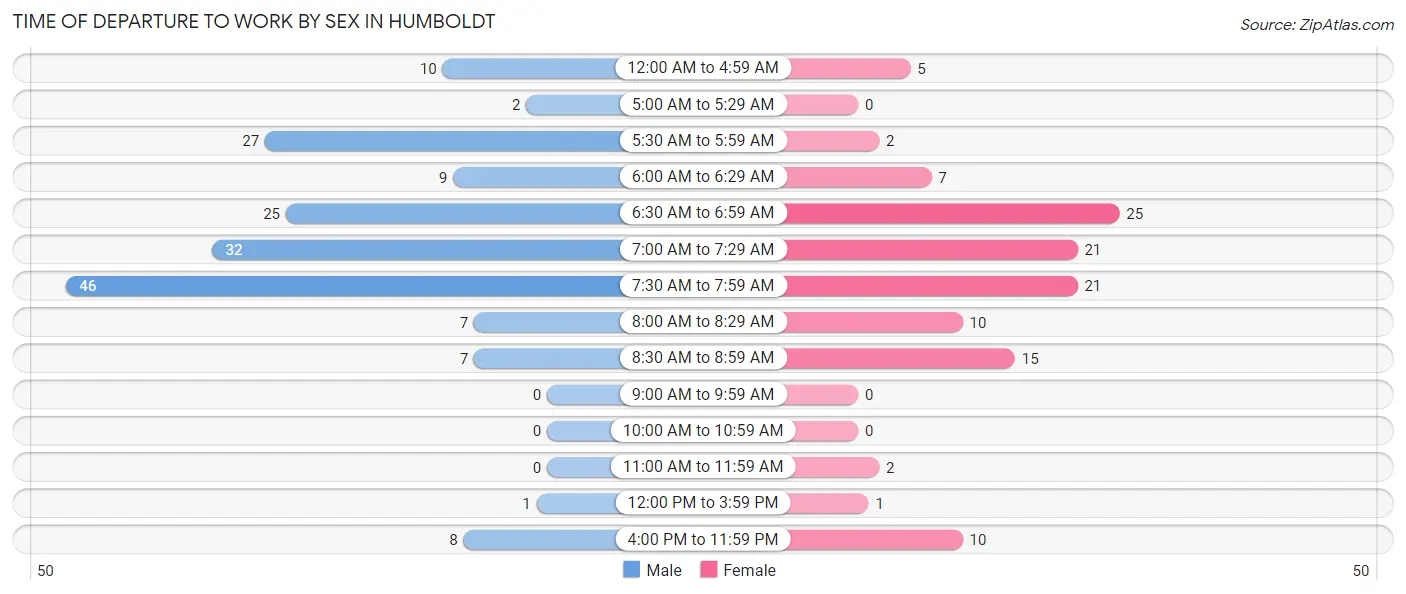
| Time of Departure | Male | Female |
| 12:00 AM to 4:59 AM | 10 (5.8%) | 5 (4.2%) |
| 5:00 AM to 5:29 AM | 2 (1.1%) | 0 (0.0%) |
| 5:30 AM to 5:59 AM | 27 (15.5%) | 2 (1.7%) |
| 6:00 AM to 6:29 AM | 9 (5.2%) | 7 (5.9%) |
| 6:30 AM to 6:59 AM | 25 (14.4%) | 25 (21.0%) |
| 7:00 AM to 7:29 AM | 32 (18.4%) | 21 (17.6%) |
| 7:30 AM to 7:59 AM | 46 (26.4%) | 21 (17.6%) |
| 8:00 AM to 8:29 AM | 7 (4.0%) | 10 (8.4%) |
| 8:30 AM to 8:59 AM | 7 (4.0%) | 15 (12.6%) |
| 9:00 AM to 9:59 AM | 0 (0.0%) | 0 (0.0%) |
| 10:00 AM to 10:59 AM | 0 (0.0%) | 0 (0.0%) |
| 11:00 AM to 11:59 AM | 0 (0.0%) | 2 (1.7%) |
| 12:00 PM to 3:59 PM | 1 (0.6%) | 1 (0.8%) |
| 4:00 PM to 11:59 PM | 8 (4.6%) | 10 (8.4%) |
| Total | 174 (100.0%) | 119 (100.0%) |
Housing Occupancy in Humboldt
Occupancy by Ownership in Humboldt
Of the total 222 dwellings in Humboldt, owner-occupied units account for 188 (84.7%), while renter-occupied units make up 34 (15.3%).
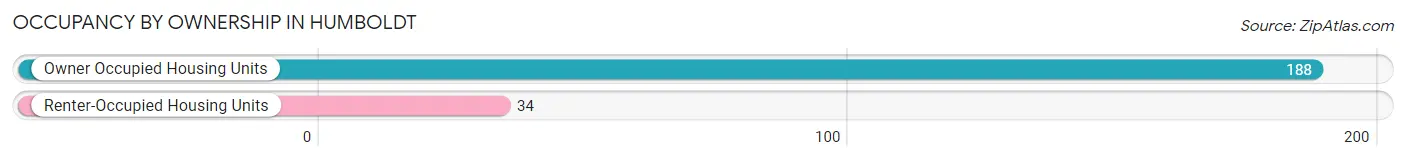
| Occupancy | # Housing Units | % Housing Units |
| Owner Occupied Housing Units | 188 | 84.7% |
| Renter-Occupied Housing Units | 34 | 15.3% |
| Total Occupied Housing Units | 222 | 100.0% |
Occupancy by Household Size in Humboldt
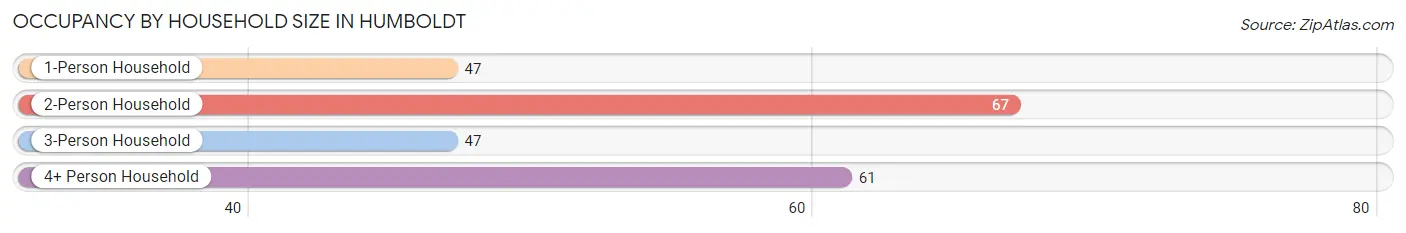
| Household Size | # Housing Units | % Housing Units |
| 1-Person Household | 47 | 21.2% |
| 2-Person Household | 67 | 30.2% |
| 3-Person Household | 47 | 21.2% |
| 4+ Person Household | 61 | 27.5% |
| Total Housing Units | 222 | 100.0% |
Occupancy by Ownership by Household Size in Humboldt
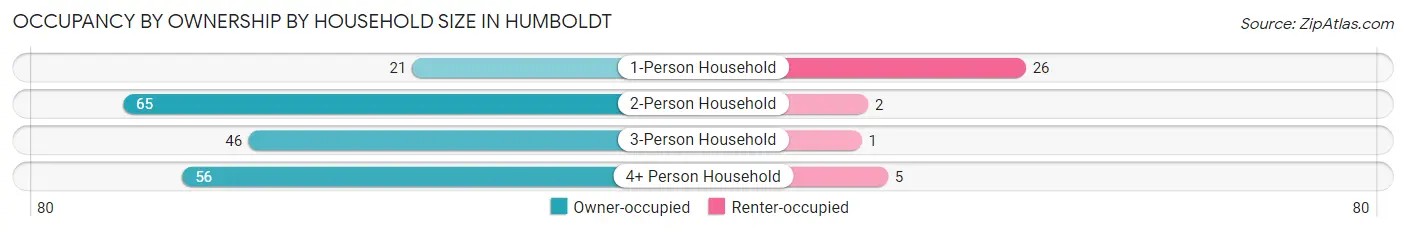
| Household Size | Owner-occupied | Renter-occupied |
| 1-Person Household | 21 (44.7%) | 26 (55.3%) |
| 2-Person Household | 65 (97.0%) | 2 (3.0%) |
| 3-Person Household | 46 (97.9%) | 1 (2.1%) |
| 4+ Person Household | 56 (91.8%) | 5 (8.2%) |
| Total Housing Units | 188 (84.7%) | 34 (15.3%) |
Occupancy by Educational Attainment in Humboldt
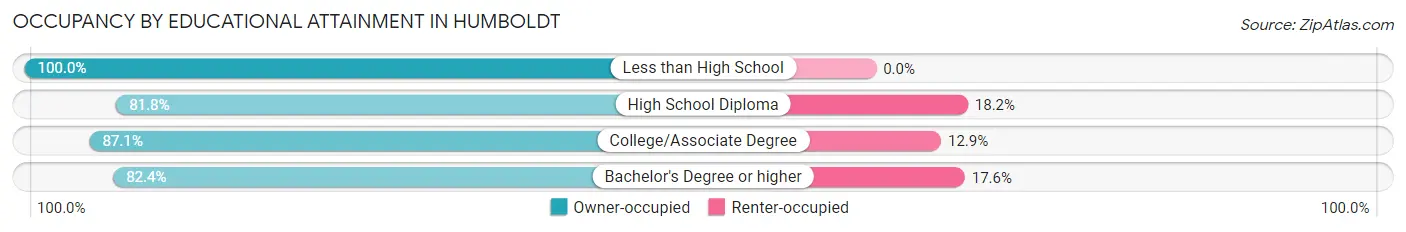
| Household Size | Owner-occupied | Renter-occupied |
| Less than High School | 3 (100.0%) | 0 (0.0%) |
| High School Diploma | 36 (81.8%) | 8 (18.2%) |
| College/Associate Degree | 88 (87.1%) | 13 (12.9%) |
| Bachelor's Degree or higher | 61 (82.4%) | 13 (17.6%) |
Occupancy by Age of Householder in Humboldt
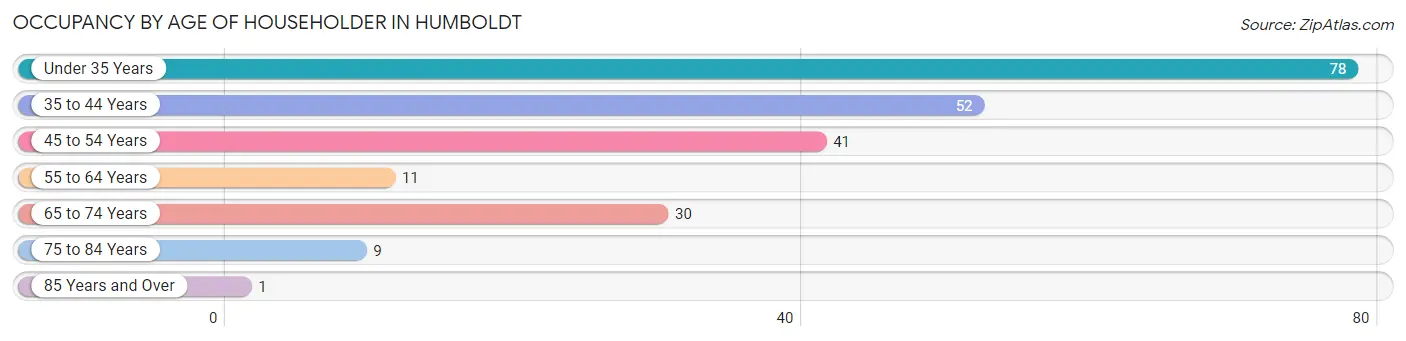
| Age Bracket | # Households | % Households |
| Under 35 Years | 78 | 35.1% |
| 35 to 44 Years | 52 | 23.4% |
| 45 to 54 Years | 41 | 18.5% |
| 55 to 64 Years | 11 | 5.0% |
| 65 to 74 Years | 30 | 13.5% |
| 75 to 84 Years | 9 | 4.1% |
| 85 Years and Over | 1 | 0.4% |
| Total | 222 | 100.0% |
Housing Finances in Humboldt
Median Income by Occupancy in Humboldt
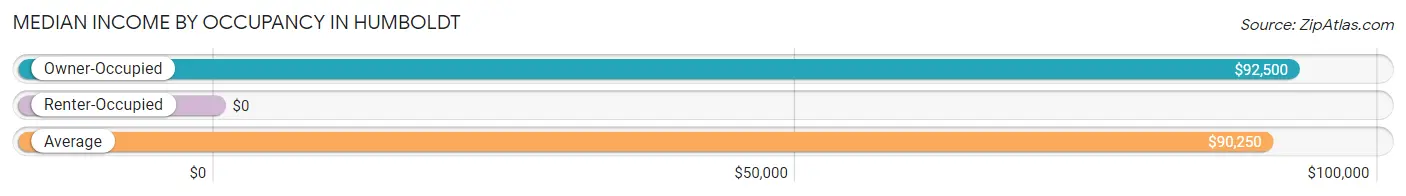
| Occupancy Type | # Households | Median Income |
| Owner-Occupied | 188 (84.7%) | $92,500 |
| Renter-Occupied | 34 (15.3%) | $0 |
| Average | 222 (100.0%) | $90,250 |
Occupancy by Householder Income Bracket in Humboldt
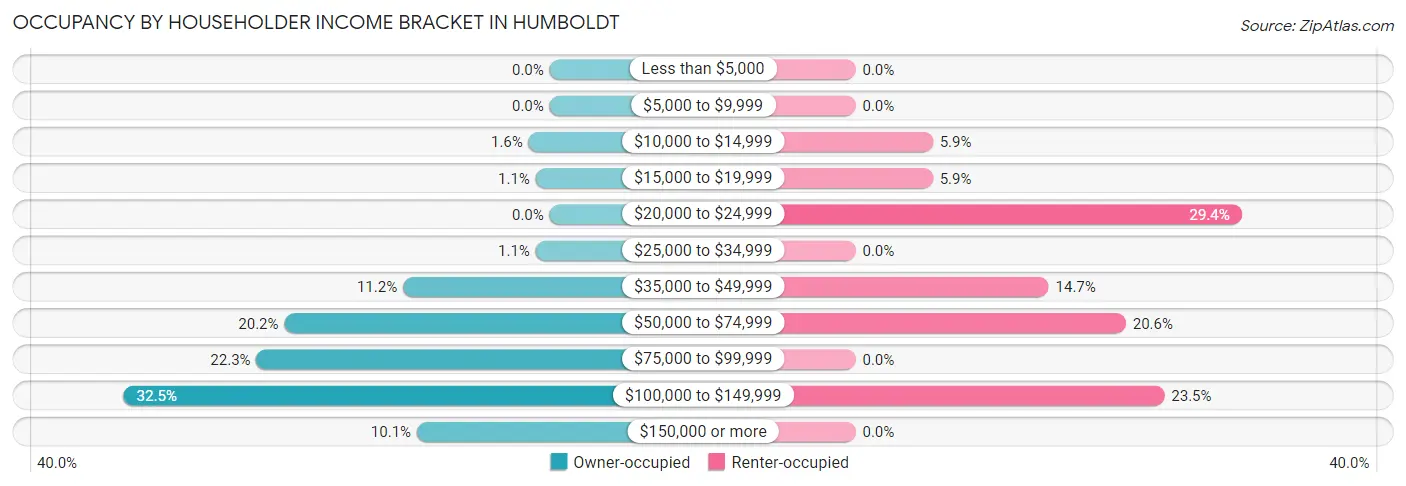
| Income Bracket | Owner-occupied | Renter-occupied |
| Less than $5,000 | 0 (0.0%) | 0 (0.0%) |
| $5,000 to $9,999 | 0 (0.0%) | 0 (0.0%) |
| $10,000 to $14,999 | 3 (1.6%) | 2 (5.9%) |
| $15,000 to $19,999 | 2 (1.1%) | 2 (5.9%) |
| $20,000 to $24,999 | 0 (0.0%) | 10 (29.4%) |
| $25,000 to $34,999 | 2 (1.1%) | 0 (0.0%) |
| $35,000 to $49,999 | 21 (11.2%) | 5 (14.7%) |
| $50,000 to $74,999 | 38 (20.2%) | 7 (20.6%) |
| $75,000 to $99,999 | 42 (22.3%) | 0 (0.0%) |
| $100,000 to $149,999 | 61 (32.5%) | 8 (23.5%) |
| $150,000 or more | 19 (10.1%) | 0 (0.0%) |
| Total | 188 (100.0%) | 34 (100.0%) |
Monthly Housing Cost Tiers in Humboldt
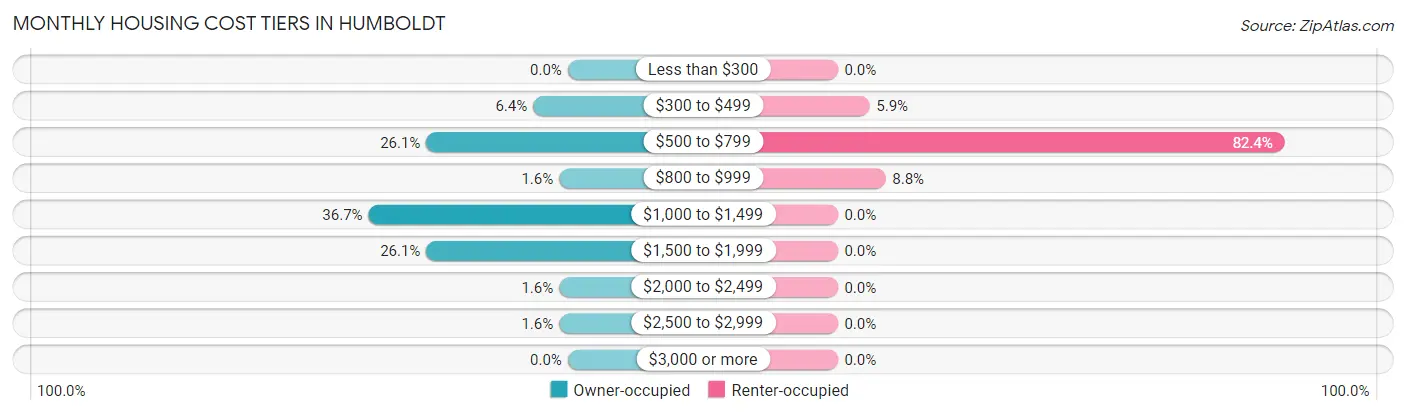
| Monthly Cost | Owner-occupied | Renter-occupied |
| Less than $300 | 0 (0.0%) | 0 (0.0%) |
| $300 to $499 | 12 (6.4%) | 2 (5.9%) |
| $500 to $799 | 49 (26.1%) | 28 (82.4%) |
| $800 to $999 | 3 (1.6%) | 3 (8.8%) |
| $1,000 to $1,499 | 69 (36.7%) | 0 (0.0%) |
| $1,500 to $1,999 | 49 (26.1%) | 0 (0.0%) |
| $2,000 to $2,499 | 3 (1.6%) | 0 (0.0%) |
| $2,500 to $2,999 | 3 (1.6%) | 0 (0.0%) |
| $3,000 or more | 0 (0.0%) | 0 (0.0%) |
| Total | 188 (100.0%) | 34 (100.0%) |
Physical Housing Characteristics in Humboldt
Housing Structures in Humboldt
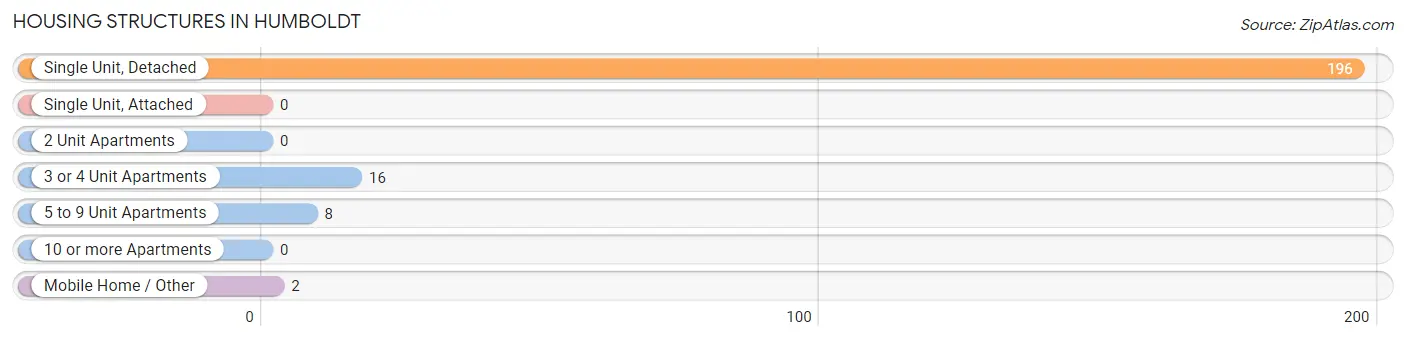
| Structure Type | # Housing Units | % Housing Units |
| Single Unit, Detached | 196 | 88.3% |
| Single Unit, Attached | 0 | 0.0% |
| 2 Unit Apartments | 0 | 0.0% |
| 3 or 4 Unit Apartments | 16 | 7.2% |
| 5 to 9 Unit Apartments | 8 | 3.6% |
| 10 or more Apartments | 0 | 0.0% |
| Mobile Home / Other | 2 | 0.9% |
| Total | 222 | 100.0% |
Housing Structures by Occupancy in Humboldt
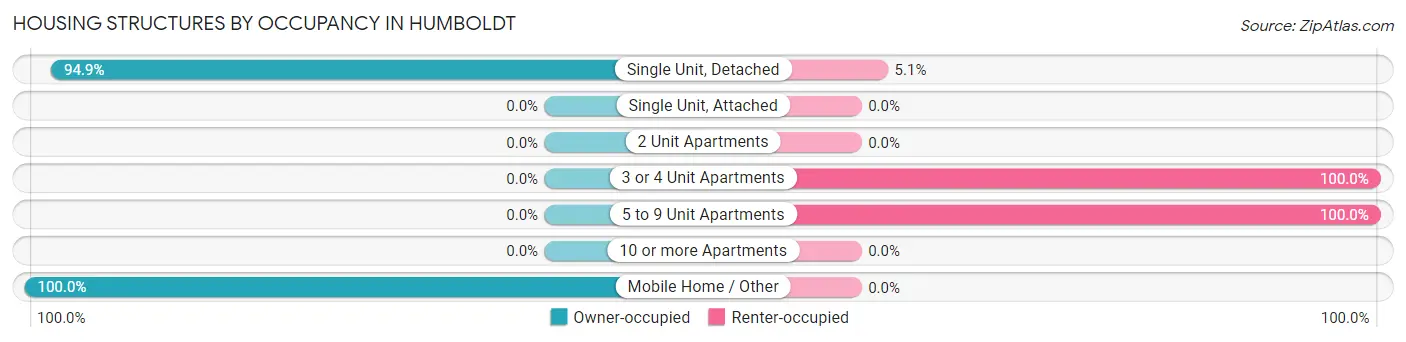
| Structure Type | Owner-occupied | Renter-occupied |
| Single Unit, Detached | 186 (94.9%) | 10 (5.1%) |
| Single Unit, Attached | 0 (0.0%) | 0 (0.0%) |
| 2 Unit Apartments | 0 (0.0%) | 0 (0.0%) |
| 3 or 4 Unit Apartments | 0 (0.0%) | 16 (100.0%) |
| 5 to 9 Unit Apartments | 0 (0.0%) | 8 (100.0%) |
| 10 or more Apartments | 0 (0.0%) | 0 (0.0%) |
| Mobile Home / Other | 2 (100.0%) | 0 (0.0%) |
| Total | 188 (84.7%) | 34 (15.3%) |
Housing Structures by Number of Rooms in Humboldt
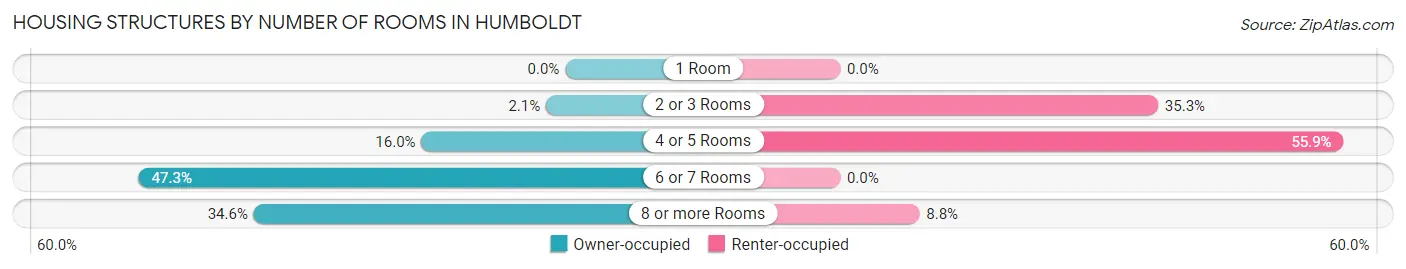
| Number of Rooms | Owner-occupied | Renter-occupied |
| 1 Room | 0 (0.0%) | 0 (0.0%) |
| 2 or 3 Rooms | 4 (2.1%) | 12 (35.3%) |
| 4 or 5 Rooms | 30 (16.0%) | 19 (55.9%) |
| 6 or 7 Rooms | 89 (47.3%) | 0 (0.0%) |
| 8 or more Rooms | 65 (34.6%) | 3 (8.8%) |
| Total | 188 (100.0%) | 34 (100.0%) |
Housing Structure by Heating Type in Humboldt
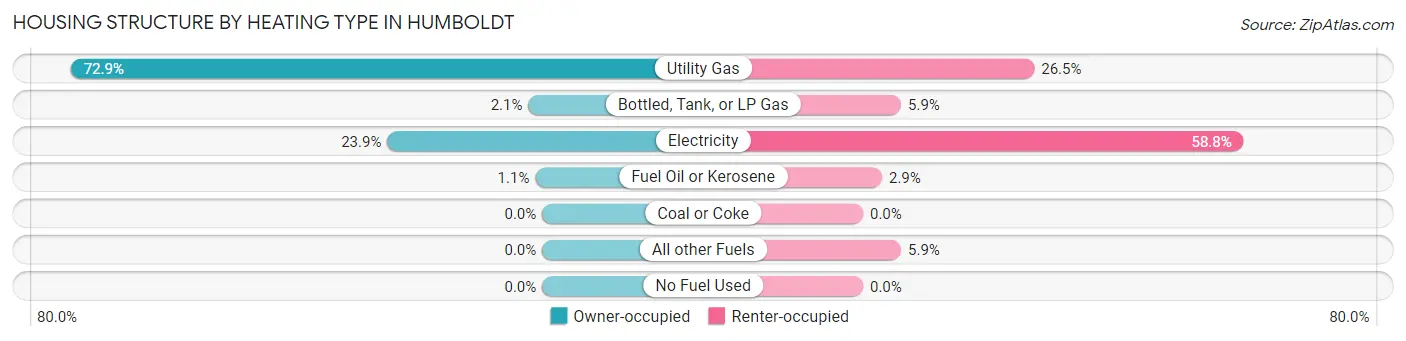
| Heating Type | Owner-occupied | Renter-occupied |
| Utility Gas | 137 (72.9%) | 9 (26.5%) |
| Bottled, Tank, or LP Gas | 4 (2.1%) | 2 (5.9%) |
| Electricity | 45 (23.9%) | 20 (58.8%) |
| Fuel Oil or Kerosene | 2 (1.1%) | 1 (2.9%) |
| Coal or Coke | 0 (0.0%) | 0 (0.0%) |
| All other Fuels | 0 (0.0%) | 2 (5.9%) |
| No Fuel Used | 0 (0.0%) | 0 (0.0%) |
| Total | 188 (100.0%) | 34 (100.0%) |
Household Vehicle Usage in Humboldt
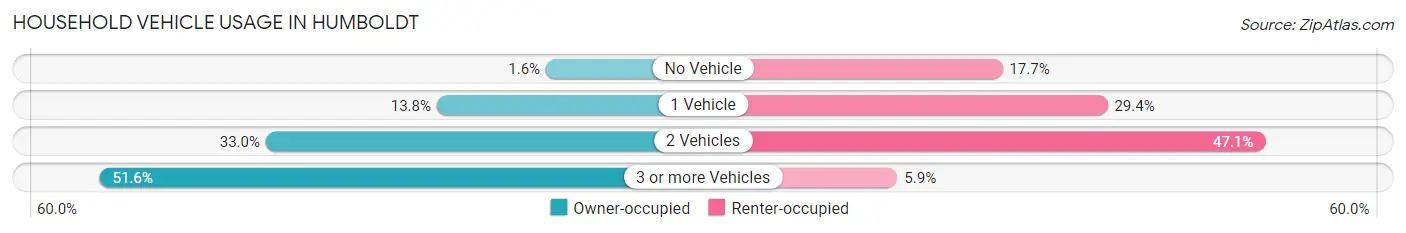
| Vehicles per Household | Owner-occupied | Renter-occupied |
| No Vehicle | 3 (1.6%) | 6 (17.6%) |
| 1 Vehicle | 26 (13.8%) | 10 (29.4%) |
| 2 Vehicles | 62 (33.0%) | 16 (47.1%) |
| 3 or more Vehicles | 97 (51.6%) | 2 (5.9%) |
| Total | 188 (100.0%) | 34 (100.0%) |
Real Estate & Mortgages in Humboldt
Real Estate and Mortgage Overview in Humboldt
| Characteristic | Without Mortgage | With Mortgage |
| Housing Units | 59 | 129 |
| Median Property Value | $197,900 | $175,600 |
| Median Household Income | $86,094 | $14 |
| Monthly Housing Costs | $626 | $0 |
| Real Estate Taxes | $2,346 | $0 |
Property Value by Mortgage Status in Humboldt
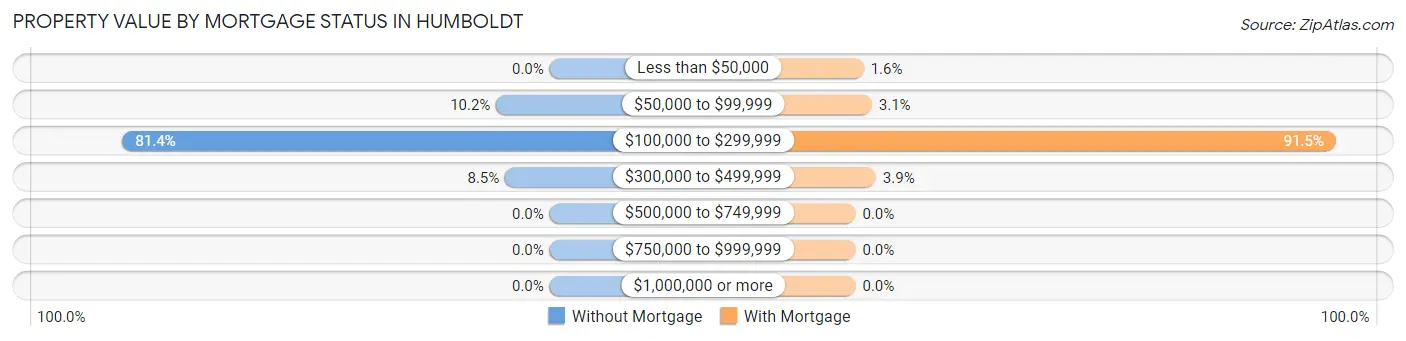
| Property Value | Without Mortgage | With Mortgage |
| Less than $50,000 | 0 (0.0%) | 2 (1.5%) |
| $50,000 to $99,999 | 6 (10.2%) | 4 (3.1%) |
| $100,000 to $299,999 | 48 (81.4%) | 118 (91.5%) |
| $300,000 to $499,999 | 5 (8.5%) | 5 (3.9%) |
| $500,000 to $749,999 | 0 (0.0%) | 0 (0.0%) |
| $750,000 to $999,999 | 0 (0.0%) | 0 (0.0%) |
| $1,000,000 or more | 0 (0.0%) | 0 (0.0%) |
| Total | 59 (100.0%) | 129 (100.0%) |
Household Income by Mortgage Status in Humboldt
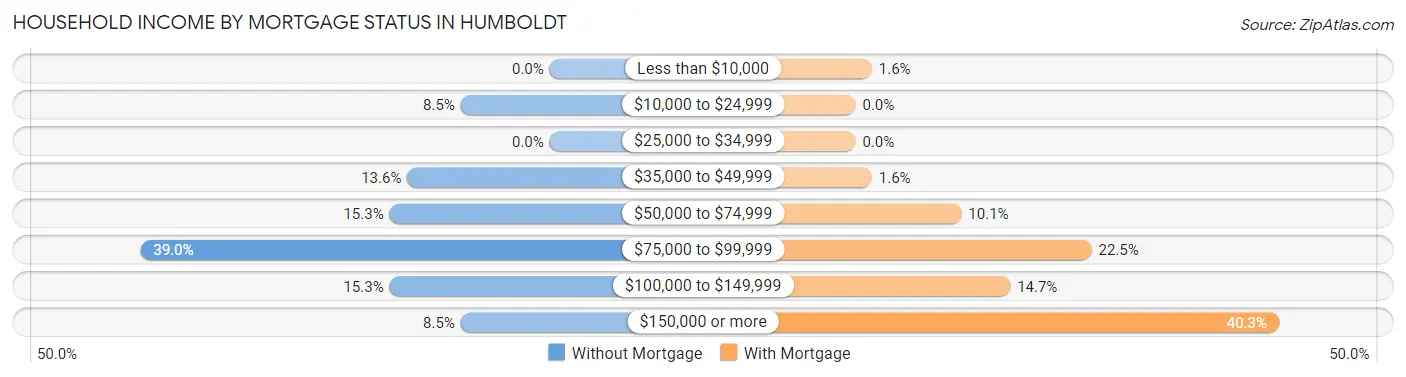
| Household Income | Without Mortgage | With Mortgage |
| Less than $10,000 | 0 (0.0%) | 2 (1.5%) |
| $10,000 to $24,999 | 5 (8.5%) | 0 (0.0%) |
| $25,000 to $34,999 | 0 (0.0%) | 0 (0.0%) |
| $35,000 to $49,999 | 8 (13.6%) | 2 (1.5%) |
| $50,000 to $74,999 | 9 (15.2%) | 13 (10.1%) |
| $75,000 to $99,999 | 23 (39.0%) | 29 (22.5%) |
| $100,000 to $149,999 | 9 (15.2%) | 19 (14.7%) |
| $150,000 or more | 5 (8.5%) | 52 (40.3%) |
| Total | 59 (100.0%) | 129 (100.0%) |
Property Value to Household Income Ratio in Humboldt
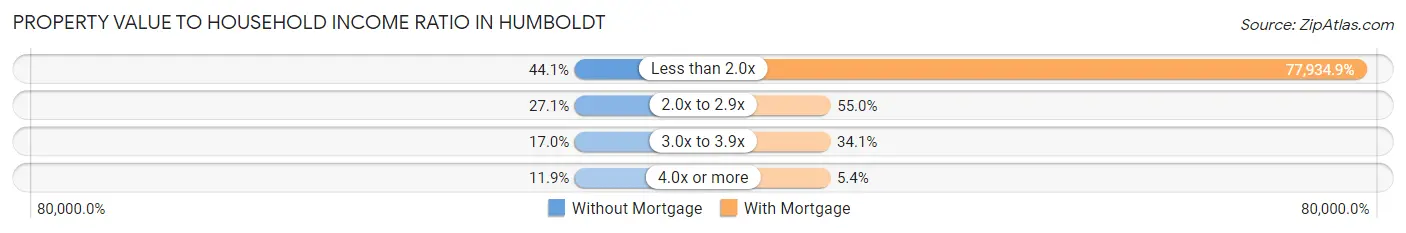
| Value-to-Income Ratio | Without Mortgage | With Mortgage |
| Less than 2.0x | 26 (44.1%) | 100,536 (77,934.9%) |
| 2.0x to 2.9x | 16 (27.1%) | 71 (55.0%) |
| 3.0x to 3.9x | 10 (17.0%) | 44 (34.1%) |
| 4.0x or more | 7 (11.9%) | 7 (5.4%) |
| Total | 59 (100.0%) | 129 (100.0%) |
Real Estate Taxes by Mortgage Status in Humboldt
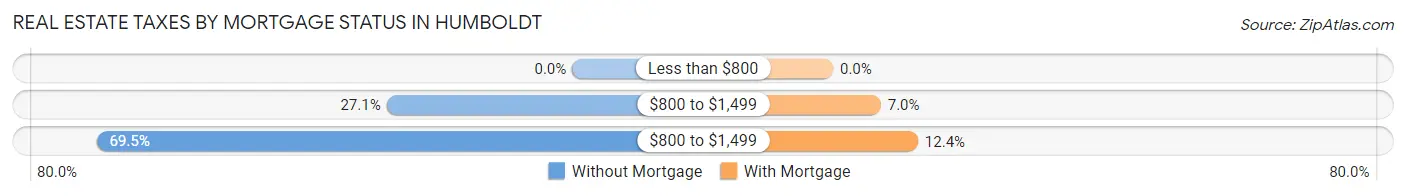
| Property Taxes | Without Mortgage | With Mortgage |
| Less than $800 | 0 (0.0%) | 0 (0.0%) |
| $800 to $1,499 | 16 (27.1%) | 9 (7.0%) |
| $800 to $1,499 | 41 (69.5%) | 16 (12.4%) |
| Total | 59 (100.0%) | 129 (100.0%) |
Health & Disability in Humboldt
Health Insurance Coverage by Age in Humboldt
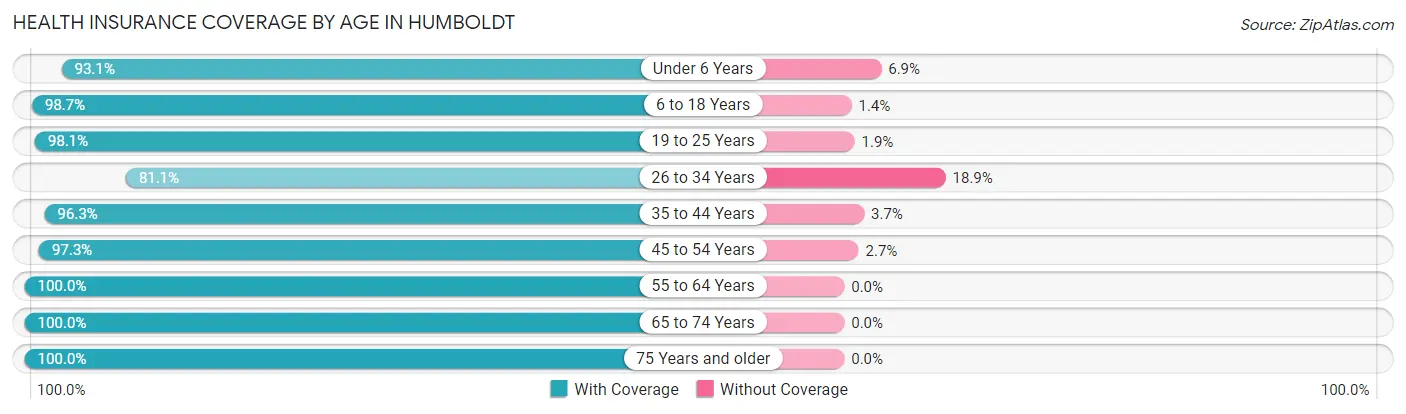
| Age Bracket | With Coverage | Without Coverage |
| Under 6 Years | 54 (93.1%) | 4 (6.9%) |
| 6 to 18 Years | 146 (98.7%) | 2 (1.3%) |
| 19 to 25 Years | 51 (98.1%) | 1 (1.9%) |
| 26 to 34 Years | 73 (81.1%) | 17 (18.9%) |
| 35 to 44 Years | 104 (96.3%) | 4 (3.7%) |
| 45 to 54 Years | 73 (97.3%) | 2 (2.7%) |
| 55 to 64 Years | 27 (100.0%) | 0 (0.0%) |
| 65 to 74 Years | 46 (100.0%) | 0 (0.0%) |
| 75 Years and older | 15 (100.0%) | 0 (0.0%) |
| Total | 589 (95.2%) | 30 (4.9%) |
Health Insurance Coverage by Citizenship Status in Humboldt
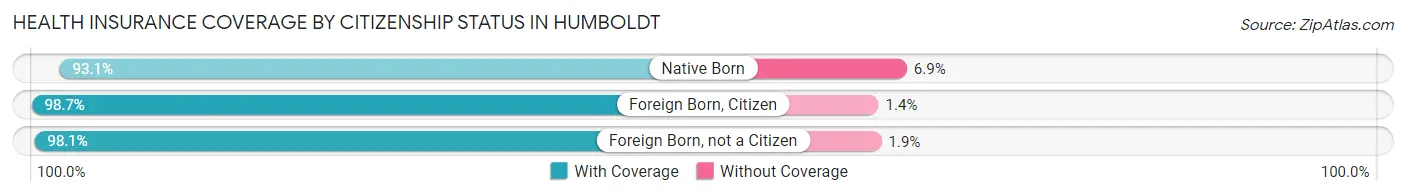
| Citizenship Status | With Coverage | Without Coverage |
| Native Born | 54 (93.1%) | 4 (6.9%) |
| Foreign Born, Citizen | 146 (98.7%) | 2 (1.3%) |
| Foreign Born, not a Citizen | 51 (98.1%) | 1 (1.9%) |
Health Insurance Coverage by Household Income in Humboldt
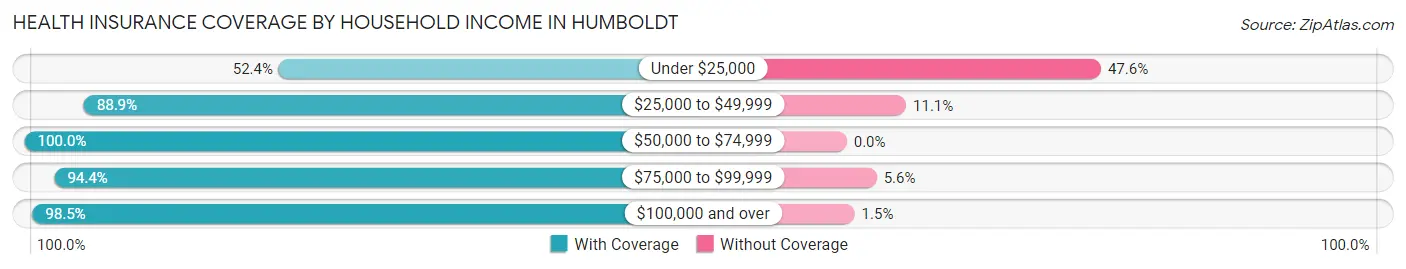
| Household Income | With Coverage | Without Coverage |
| Under $25,000 | 11 (52.4%) | 10 (47.6%) |
| $25,000 to $49,999 | 72 (88.9%) | 9 (11.1%) |
| $50,000 to $74,999 | 120 (100.0%) | 0 (0.0%) |
| $75,000 to $99,999 | 118 (94.4%) | 7 (5.6%) |
| $100,000 and over | 268 (98.5%) | 4 (1.5%) |
Public vs Private Health Insurance Coverage by Age in Humboldt
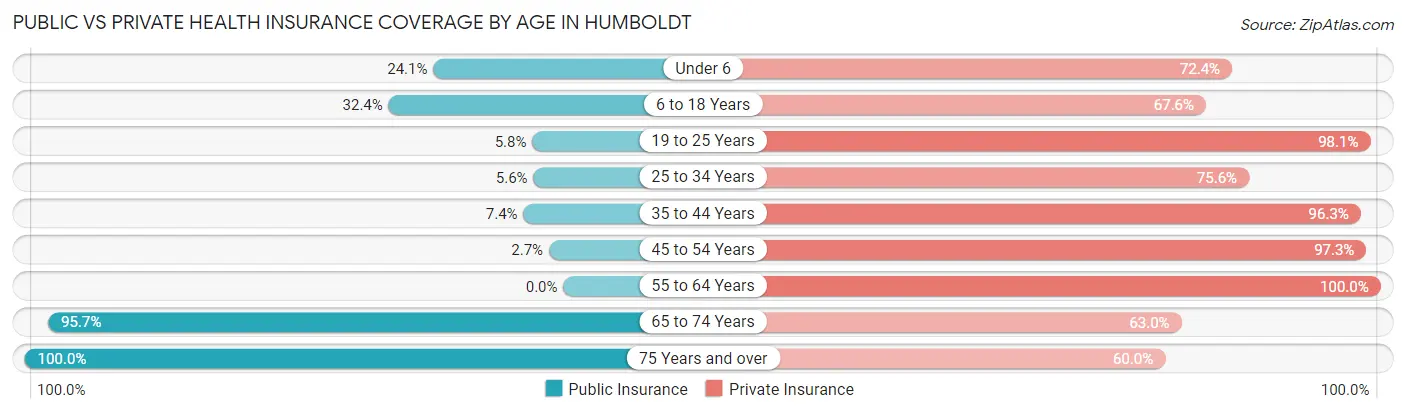
| Age Bracket | Public Insurance | Private Insurance |
| Under 6 | 14 (24.1%) | 42 (72.4%) |
| 6 to 18 Years | 48 (32.4%) | 100 (67.6%) |
| 19 to 25 Years | 3 (5.8%) | 51 (98.1%) |
| 25 to 34 Years | 5 (5.6%) | 68 (75.6%) |
| 35 to 44 Years | 8 (7.4%) | 104 (96.3%) |
| 45 to 54 Years | 2 (2.7%) | 73 (97.3%) |
| 55 to 64 Years | 0 (0.0%) | 27 (100.0%) |
| 65 to 74 Years | 44 (95.7%) | 29 (63.0%) |
| 75 Years and over | 15 (100.0%) | 9 (60.0%) |
| Total | 139 (22.5%) | 503 (81.3%) |
Disability Status by Sex by Age in Humboldt
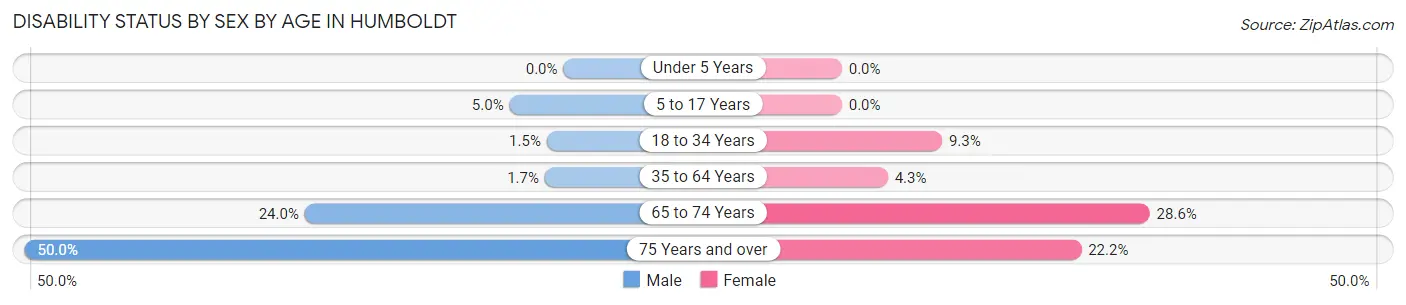
| Age Bracket | Male | Female |
| Under 5 Years | 0 (0.0%) | 0 (0.0%) |
| 5 to 17 Years | 3 (5.0%) | 0 (0.0%) |
| 18 to 34 Years | 1 (1.5%) | 8 (9.3%) |
| 35 to 64 Years | 2 (1.7%) | 4 (4.3%) |
| 65 to 74 Years | 6 (24.0%) | 6 (28.6%) |
| 75 Years and over | 3 (50.0%) | 2 (22.2%) |
Disability Class by Sex by Age in Humboldt
Disability Class: Hearing Difficulty
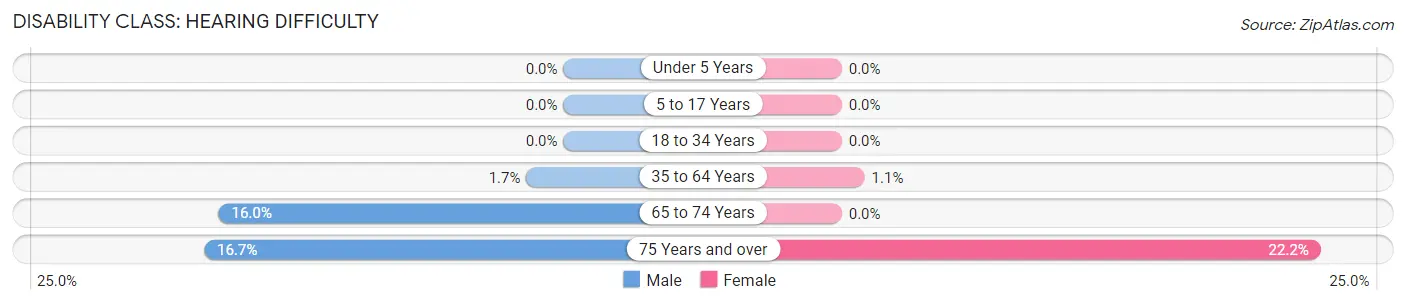
| Age Bracket | Male | Female |
| Under 5 Years | 0 (0.0%) | 0 (0.0%) |
| 5 to 17 Years | 0 (0.0%) | 0 (0.0%) |
| 18 to 34 Years | 0 (0.0%) | 0 (0.0%) |
| 35 to 64 Years | 2 (1.7%) | 1 (1.1%) |
| 65 to 74 Years | 4 (16.0%) | 0 (0.0%) |
| 75 Years and over | 1 (16.7%) | 2 (22.2%) |
Disability Class: Vision Difficulty
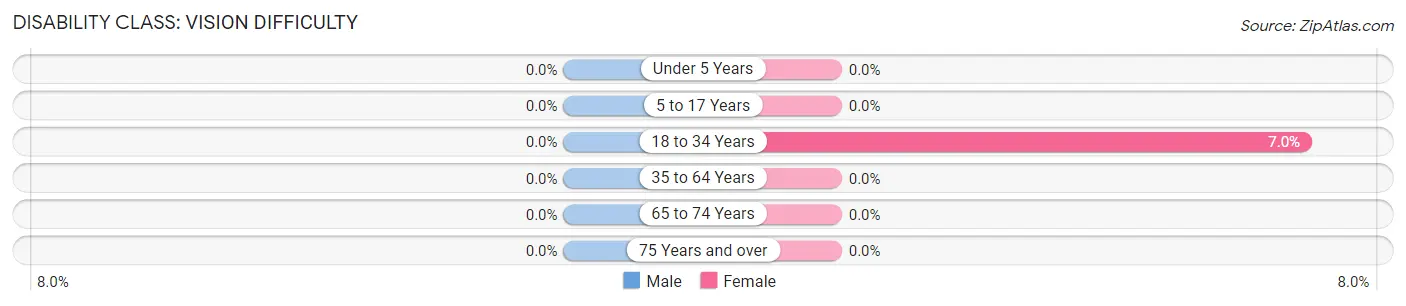
| Age Bracket | Male | Female |
| Under 5 Years | 0 (0.0%) | 0 (0.0%) |
| 5 to 17 Years | 0 (0.0%) | 0 (0.0%) |
| 18 to 34 Years | 0 (0.0%) | 6 (7.0%) |
| 35 to 64 Years | 0 (0.0%) | 0 (0.0%) |
| 65 to 74 Years | 0 (0.0%) | 0 (0.0%) |
| 75 Years and over | 0 (0.0%) | 0 (0.0%) |
Disability Class: Cognitive Difficulty
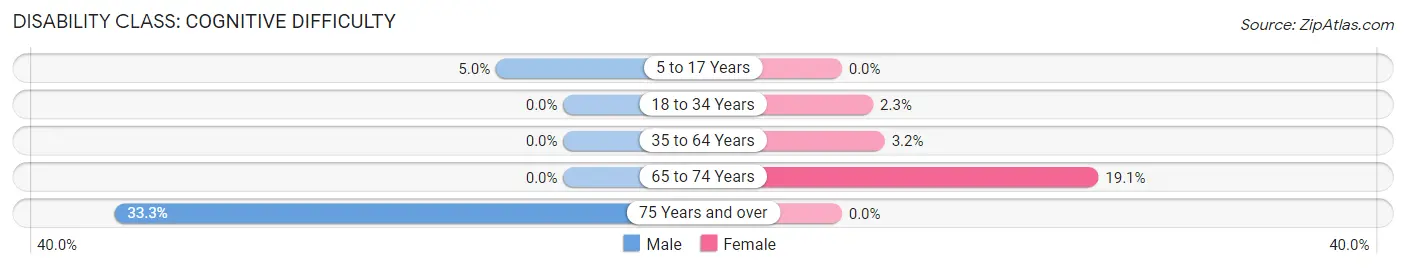
| Age Bracket | Male | Female |
| 5 to 17 Years | 3 (5.0%) | 0 (0.0%) |
| 18 to 34 Years | 0 (0.0%) | 2 (2.3%) |
| 35 to 64 Years | 0 (0.0%) | 3 (3.2%) |
| 65 to 74 Years | 0 (0.0%) | 4 (19.1%) |
| 75 Years and over | 2 (33.3%) | 0 (0.0%) |
Disability Class: Ambulatory Difficulty
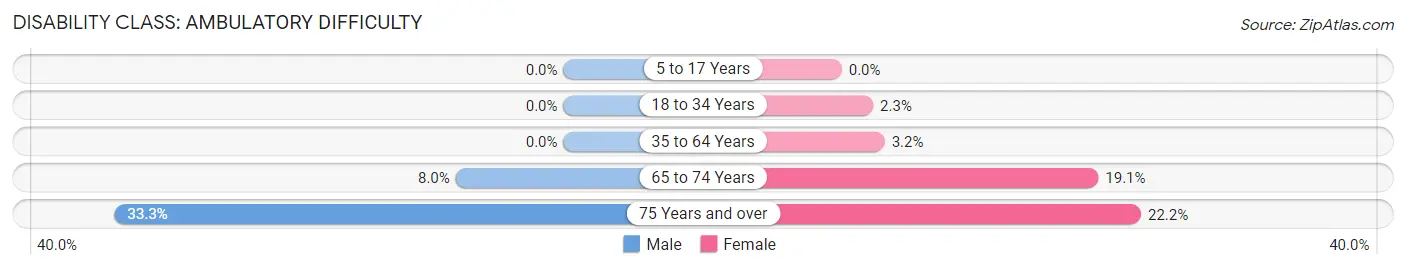
| Age Bracket | Male | Female |
| 5 to 17 Years | 0 (0.0%) | 0 (0.0%) |
| 18 to 34 Years | 0 (0.0%) | 2 (2.3%) |
| 35 to 64 Years | 0 (0.0%) | 3 (3.2%) |
| 65 to 74 Years | 2 (8.0%) | 4 (19.1%) |
| 75 Years and over | 2 (33.3%) | 2 (22.2%) |
Disability Class: Self-Care Difficulty
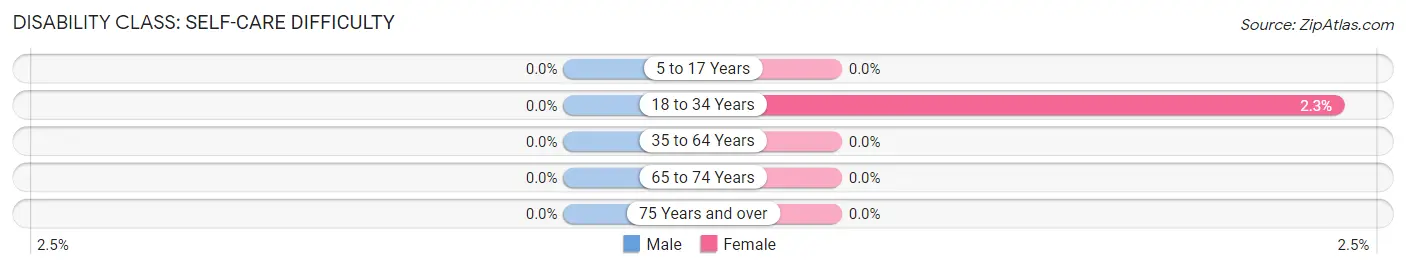
| Age Bracket | Male | Female |
| 5 to 17 Years | 0 (0.0%) | 0 (0.0%) |
| 18 to 34 Years | 0 (0.0%) | 2 (2.3%) |
| 35 to 64 Years | 0 (0.0%) | 0 (0.0%) |
| 65 to 74 Years | 0 (0.0%) | 0 (0.0%) |
| 75 Years and over | 0 (0.0%) | 0 (0.0%) |
Technology Access in Humboldt
Computing Device Access in Humboldt
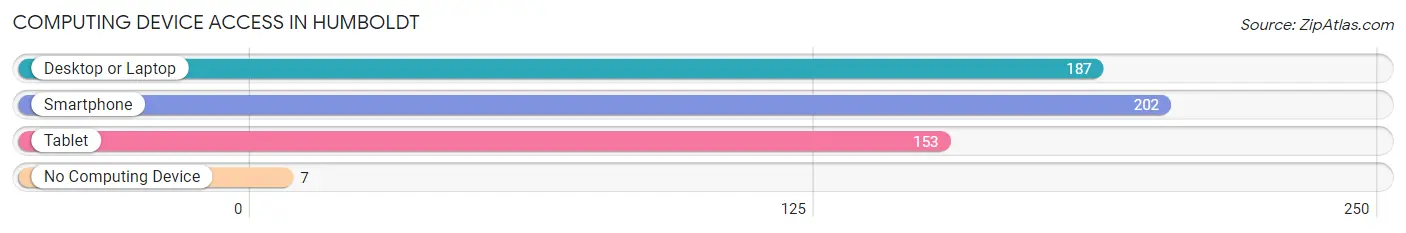
| Device Type | # Households | % Households |
| Desktop or Laptop | 187 | 84.2% |
| Smartphone | 202 | 91.0% |
| Tablet | 153 | 68.9% |
| No Computing Device | 7 | 3.2% |
| Total | 222 | 100.0% |
Internet Access in Humboldt
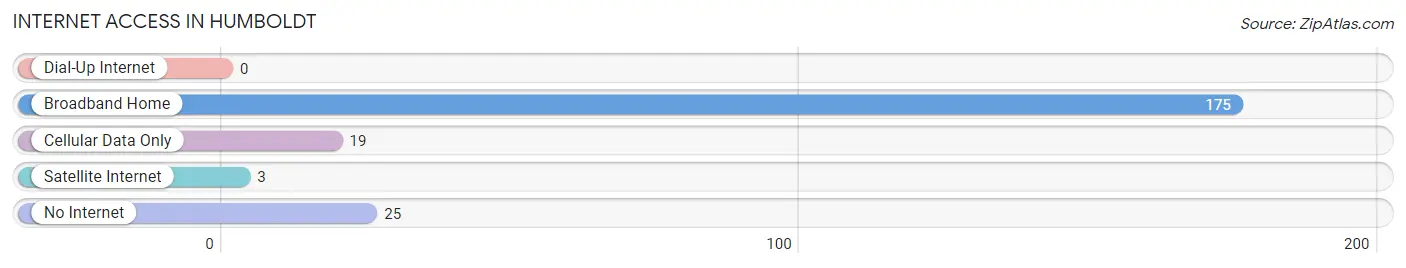
| Internet Type | # Households | % Households |
| Dial-Up Internet | 0 | 0.0% |
| Broadband Home | 175 | 78.8% |
| Cellular Data Only | 19 | 8.6% |
| Satellite Internet | 3 | 1.3% |
| No Internet | 25 | 11.3% |
| Total | 222 | 100.0% |
Humboldt Summary
Humboldt, South Dakota is a small town located in the southeastern corner of the state. It is situated in the rolling hills of the Missouri River Valley, and is home to a population of just over 1,000 people. The town was founded in 1883 and has a rich history of farming, ranching, and small business.
History
Humboldt was founded in 1883 by a group of German immigrants who had come to the area in search of a better life. The town was named after the German city of Humboldt, and the settlers quickly began to build a thriving community. The town was incorporated in 1887, and the first post office was established in 1888.
In the early years, the town was largely agricultural, with many of the settlers growing wheat, corn, and other crops. The town also had a thriving livestock industry, with many of the settlers raising cattle, sheep, and hogs. As the town grew, so did its economy. In the early 1900s, the town had a number of businesses, including a bank, a hotel, a general store, and a blacksmith shop.
The town continued to grow throughout the 20th century, and by the 1950s, it had become a bustling small town. The town had a number of businesses, including a grocery store, a hardware store, a movie theater, and a bowling alley. The town also had a number of churches, including a Catholic church, a Lutheran church, and a Methodist church.
Geography
Humboldt is located in the southeastern corner of South Dakota, in the rolling hills of the Missouri River Valley. The town is situated at an elevation of 1,845 feet, and is surrounded by farmland and rolling hills. The town is located about 25 miles from the state capital of Pierre, and is about an hour and a half drive from Sioux Falls.
The town is located in the Central Time Zone, and has a humid continental climate. The summers are hot and humid, with temperatures reaching into the 90s, while the winters are cold and snowy, with temperatures often dropping below zero.
Economy
Humboldt’s economy is largely based on agriculture and small business. The town has a number of small businesses, including a grocery store, a hardware store, a movie theater, and a bowling alley. The town also has a number of churches, including a Catholic church, a Lutheran church, and a Methodist church.
The town is also home to a number of farms and ranches, which produce a variety of crops, including wheat, corn, soybeans, and hay. The town also has a number of livestock operations, which raise cattle, sheep, and hogs.
Demographics
As of the 2010 census, the population of Humboldt was 1,072. The town has a population density of 1,072 people per square mile. The median age of the population is 44.7 years, and the median household income is $41,250.
The town is predominantly white, with 92.3% of the population identifying as white. The town also has a small Hispanic population, with 4.2% of the population identifying as Hispanic or Latino. The town also has a small African American population, with 1.2% of the population identifying as African American.
Conclusion
Humboldt, South Dakota is a small town located in the southeastern corner of the state. It is situated in the rolling hills of the Missouri River Valley, and is home to a population of just over 1,000 people. The town was founded in 1883 and has a rich history of farming, ranching, and small business. The town’s economy is largely based on agriculture and small business, and the town has a number of churches, businesses, and farms. The town is predominantly white, with 92.3% of the population identifying as white. The town also has a small Hispanic population, with 4.2% of the population identifying as Hispanic or Latino. The town also has a small African American population, with 1.2% of the population identifying as African American.
Common Questions
What is Per Capita Income in Humboldt?
Per Capita income in Humboldt is $33,783.
What is the Median Family Income in Humboldt?
Median Family Income in Humboldt is $92,375.
What is the Median Household income in Humboldt?
Median Household Income in Humboldt is $90,250.
What is Income or Wage Gap in Humboldt?
Income or Wage Gap in Humboldt is 38.6%.
Women in Humboldt earn 61.4 cents for every dollar earned by a man.
What is Inequality or Gini Index in Humboldt?
Inequality or Gini Index in Humboldt is 0.28.
What is the Total Population of Humboldt?
Total Population of Humboldt is 619.
What is the Total Male Population of Humboldt?
Total Male Population of Humboldt is 296.
What is the Total Female Population of Humboldt?
Total Female Population of Humboldt is 323.
What is the Ratio of Males per 100 Females in Humboldt?
There are 91.64 Males per 100 Females in Humboldt.
What is the Ratio of Females per 100 Males in Humboldt?
There are 109.12 Females per 100 Males in Humboldt.
What is the Median Population Age in Humboldt?
Median Population Age in Humboldt is 33.2 Years.
What is the Average Family Size in Humboldt
Average Family Size in Humboldt is 3.2 People.
What is the Average Household Size in Humboldt
Average Household Size in Humboldt is 2.8 People.
How Large is the Labor Force in Humboldt?
There are 354 People in the Labor Forcein in Humboldt.
What is the Percentage of People in the Labor Force in Humboldt?
81.9% of People are in the Labor Force in Humboldt.
What is the Unemployment Rate in Humboldt?
Unemployment Rate in Humboldt is 1.1%.