Stockholm, SD Map & Demographics
Stockholm Map
Stockholm Overview
$28,628
PER CAPITA INCOME
$105,625
AVG FAMILY INCOME
$53,750
AVG HOUSEHOLD INCOME
33.0%
WAGE / INCOME GAP [ % ]
67.0¢/ $1
WAGE / INCOME GAP [ $ ]
0.43
INEQUALITY / GINI INDEX
124
TOTAL POPULATION
72
MALE POPULATION
52
FEMALE POPULATION
138.46
MALES / 100 FEMALES
72.22
FEMALES / 100 MALES
42.0
MEDIAN AGE
3.1
AVG FAMILY SIZE
2.3
AVG HOUSEHOLD SIZE
72
LABOR FORCE [ PEOPLE ]
67.9%
PERCENT IN LABOR FORCE
2.8%
UNEMPLOYMENT RATE
Stockholm Zip Codes
Stockholm Area Codes
Income in Stockholm
Income Overview in Stockholm
Per Capita Income in Stockholm is $28,628, while median incomes of families and households are $105,625 and $53,750 respectively.
| Characteristic | Number | Measure |
| Per Capita Income | 124 | $28,628 |
| Median Family Income | 31 | $105,625 |
| Mean Family Income | 31 | $100,048 |
| Median Household Income | 53 | $53,750 |
| Mean Household Income | 53 | $71,719 |
| Income Deficit | 31 | $0 |
| Wage / Income Gap (%) | 124 | 32.97% |
| Wage / Income Gap ($) | 124 | 67.03¢ per $1 |
| Gini / Inequality Index | 124 | 0.43 |
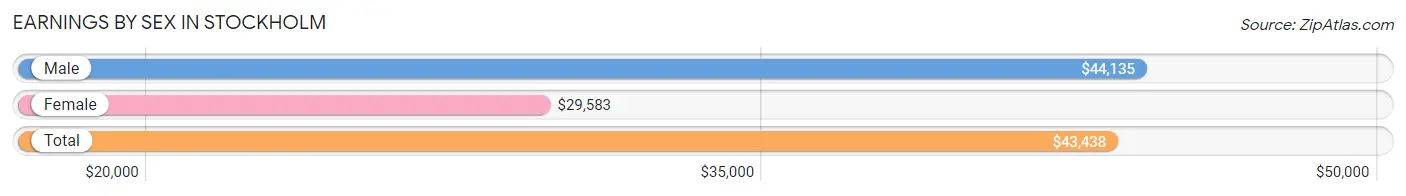
Earnings by Sex in Stockholm
Average Earnings in Stockholm are $43,438, $44,135 for men and $29,583 for women, a difference of 33.0%.
| Sex | Number | Average Earnings |
| Male | 63 (76.8%) | $44,135 |
| Female | 19 (23.2%) | $29,583 |
| Total | 82 (100.0%) | $43,438 |
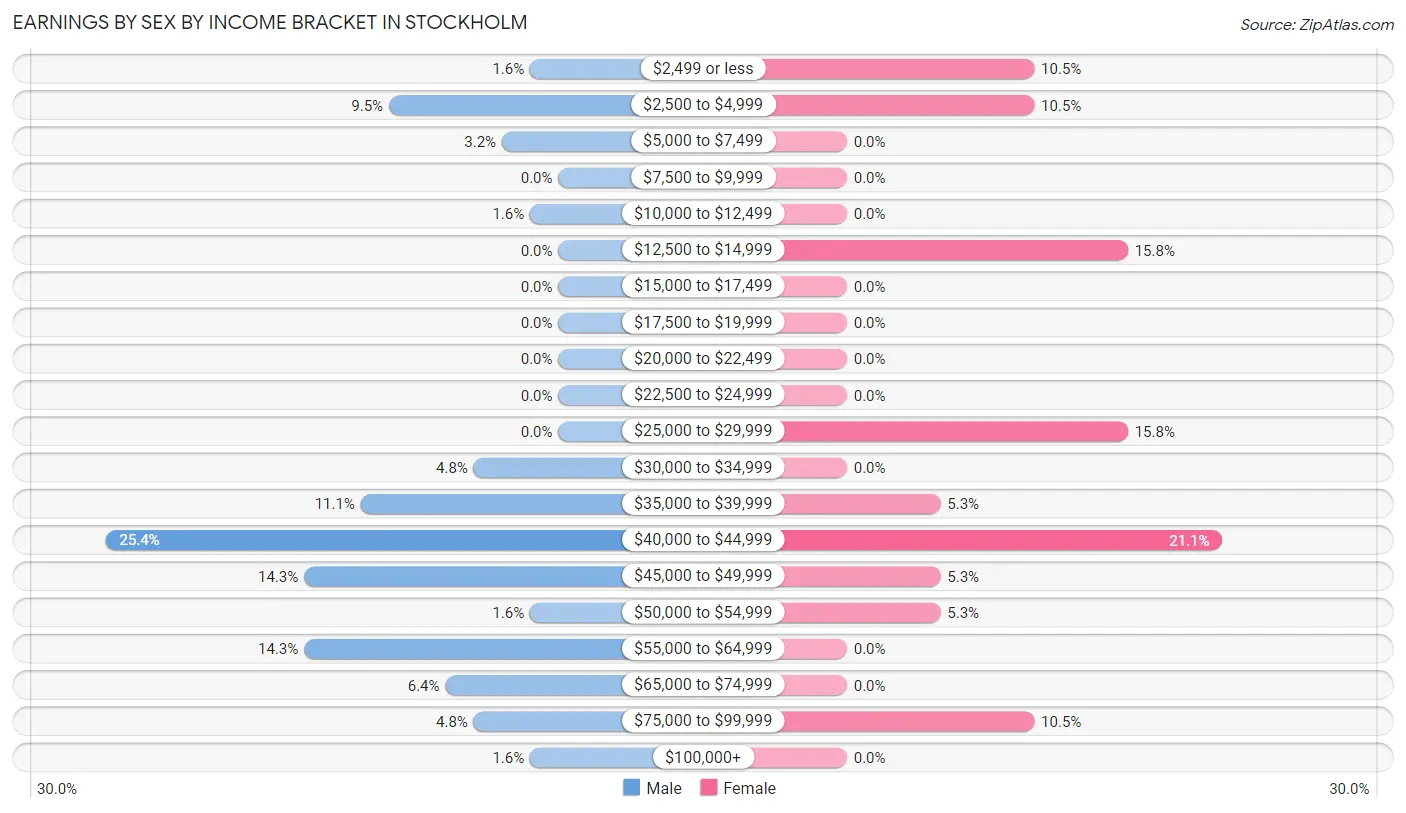
Earnings by Sex by Income Bracket in Stockholm
The most common earnings brackets in Stockholm are $40,000 to $44,999 for men (16 | 25.4%) and $40,000 to $44,999 for women (4 | 21.0%).
| Income | Male | Female |
| $2,499 or less | 1 (1.6%) | 2 (10.5%) |
| $2,500 to $4,999 | 6 (9.5%) | 2 (10.5%) |
| $5,000 to $7,499 | 2 (3.2%) | 0 (0.0%) |
| $7,500 to $9,999 | 0 (0.0%) | 0 (0.0%) |
| $10,000 to $12,499 | 1 (1.6%) | 0 (0.0%) |
| $12,500 to $14,999 | 0 (0.0%) | 3 (15.8%) |
| $15,000 to $17,499 | 0 (0.0%) | 0 (0.0%) |
| $17,500 to $19,999 | 0 (0.0%) | 0 (0.0%) |
| $20,000 to $22,499 | 0 (0.0%) | 0 (0.0%) |
| $22,500 to $24,999 | 0 (0.0%) | 0 (0.0%) |
| $25,000 to $29,999 | 0 (0.0%) | 3 (15.8%) |
| $30,000 to $34,999 | 3 (4.8%) | 0 (0.0%) |
| $35,000 to $39,999 | 7 (11.1%) | 1 (5.3%) |
| $40,000 to $44,999 | 16 (25.4%) | 4 (21.0%) |
| $45,000 to $49,999 | 9 (14.3%) | 1 (5.3%) |
| $50,000 to $54,999 | 1 (1.6%) | 1 (5.3%) |
| $55,000 to $64,999 | 9 (14.3%) | 0 (0.0%) |
| $65,000 to $74,999 | 4 (6.4%) | 0 (0.0%) |
| $75,000 to $99,999 | 3 (4.8%) | 2 (10.5%) |
| $100,000+ | 1 (1.6%) | 0 (0.0%) |
| Total | 63 (100.0%) | 19 (100.0%) |
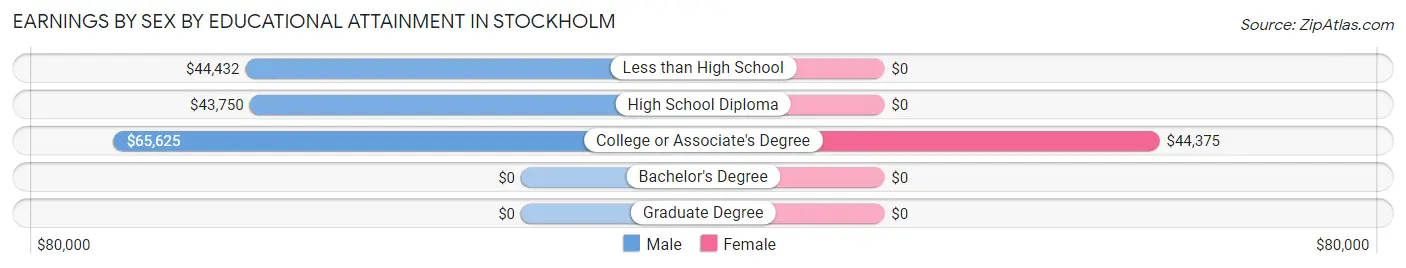
Earnings by Sex by Educational Attainment in Stockholm
Average earnings in Stockholm are $44,327 for men and $29,583 for women, a difference of 33.3%. Men with an educational attainment of college or associate's degree enjoy the highest average annual earnings of $65,625, while those with high school diploma education earn the least with $43,750. Women with an educational attainment of college or associate's degree earn the most with the average annual earnings of $44,375, while those with college or associate's degree education have the smallest earnings of $44,375.
| Educational Attainment | Male Income | Female Income |
| Less than High School | $44,432 | $0 |
| High School Diploma | $43,750 | $0 |
| College or Associate's Degree | $65,625 | $44,375 |
| Bachelor's Degree | - | - |
| Graduate Degree | - | - |
| Total | $44,327 | $29,583 |
Family Income in Stockholm
Family Income Brackets in Stockholm
According to the Stockholm family income data, there are 16 families falling into the $100,000 to $149,999 income range, which is the most common income bracket and makes up 51.6% of all families.
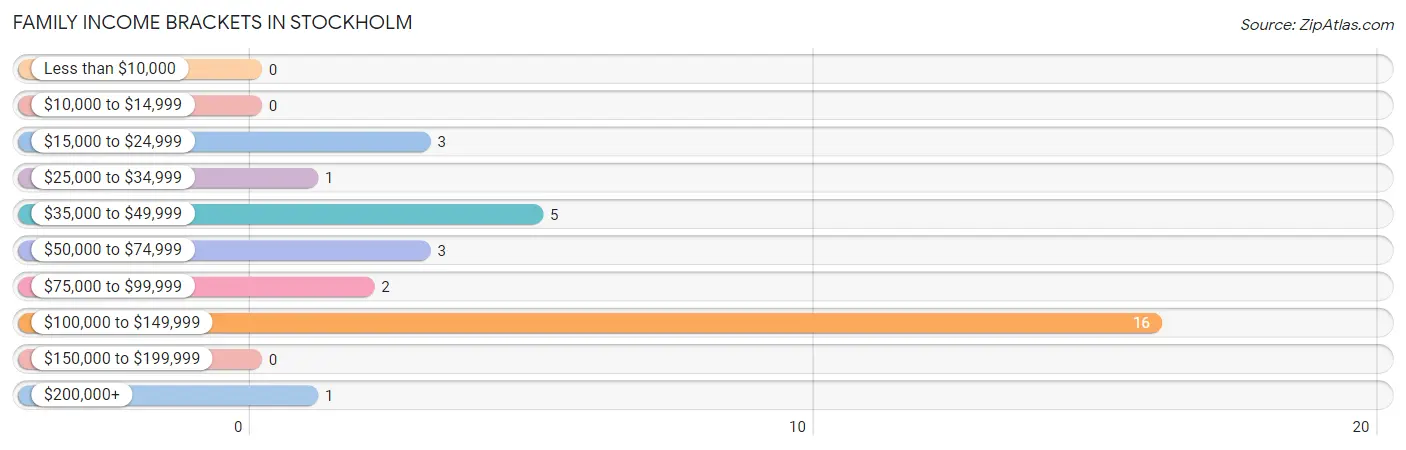
| Income Bracket | # Families | % Families |
| Less than $10,000 | 0 | 0.0% |
| $10,000 to $14,999 | 0 | 0.0% |
| $15,000 to $24,999 | 3 | 9.7% |
| $25,000 to $34,999 | 1 | 3.2% |
| $35,000 to $49,999 | 5 | 16.1% |
| $50,000 to $74,999 | 3 | 9.7% |
| $75,000 to $99,999 | 2 | 6.5% |
| $100,000 to $149,999 | 16 | 51.6% |
| $150,000 to $199,999 | 0 | 0.0% |
| $200,000+ | 1 | 3.2% |
Family Income by Famaliy Size in Stockholm
4-person families (14 | 45.2%) account for the highest median family income in Stockholm with $143,636 per family, while 4-person families (14 | 45.2%) have the highest median income of $35,909 per family member.
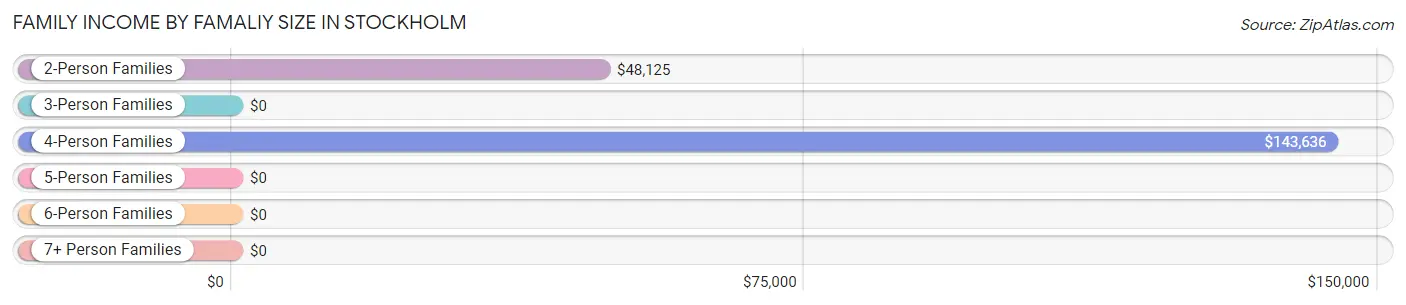
| Income Bracket | # Families | Median Income |
| 2-Person Families | 13 (41.9%) | $48,125 |
| 3-Person Families | 2 (6.5%) | $0 |
| 4-Person Families | 14 (45.2%) | $143,636 |
| 5-Person Families | 1 (3.2%) | $0 |
| 6-Person Families | 0 (0.0%) | $0 |
| 7+ Person Families | 1 (3.2%) | $0 |
| Total | 31 (100.0%) | $105,625 |
Family Income by Number of Earners in Stockholm
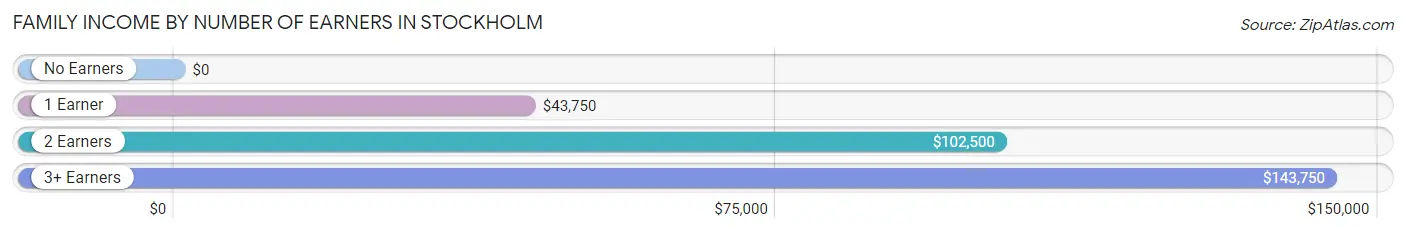
| Number of Earners | # Families | Median Income |
| No Earners | 1 (3.2%) | $0 |
| 1 Earner | 9 (29.0%) | $43,750 |
| 2 Earners | 8 (25.8%) | $102,500 |
| 3+ Earners | 13 (41.9%) | $143,750 |
| Total | 31 (100.0%) | $105,625 |
Household Income in Stockholm
Household Income Brackets in Stockholm
With 17 households falling in the category, the $100,000 to $149,999 income range is the most frequent in Stockholm, accounting for 32.1% of all households.
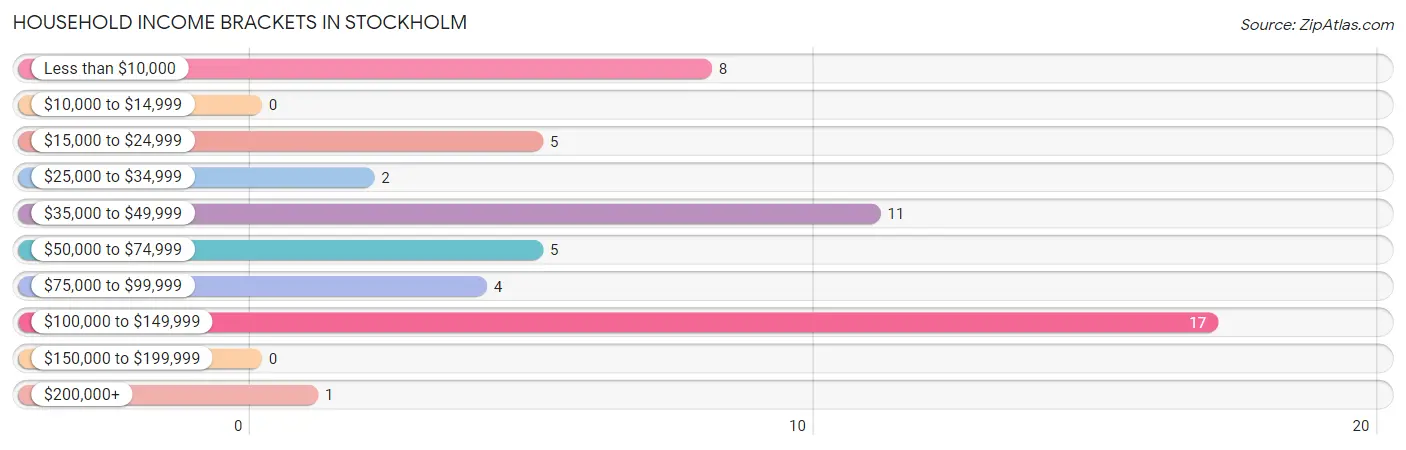
| Income Bracket | # Households | % Households |
| Less than $10,000 | 8 | 15.1% |
| $10,000 to $14,999 | 0 | 0.0% |
| $15,000 to $24,999 | 5 | 9.4% |
| $25,000 to $34,999 | 2 | 3.8% |
| $35,000 to $49,999 | 11 | 20.8% |
| $50,000 to $74,999 | 5 | 9.4% |
| $75,000 to $99,999 | 4 | 7.5% |
| $100,000 to $149,999 | 17 | 32.1% |
| $150,000 to $199,999 | 0 | 0.0% |
| $200,000+ | 1 | 1.9% |
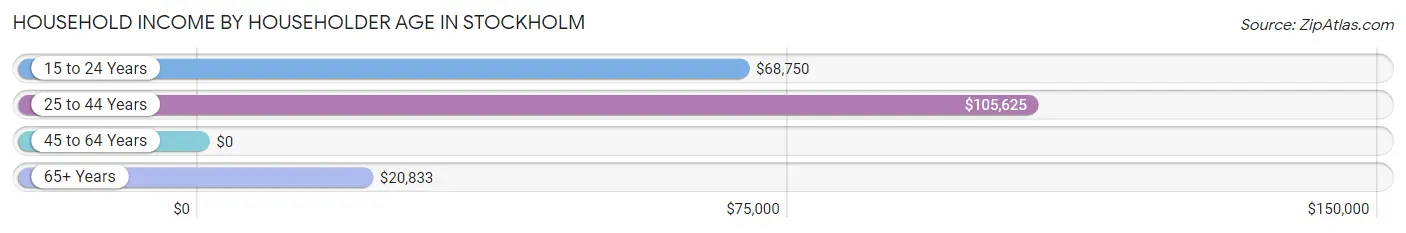
Household Income by Householder Age in Stockholm
The median household income in Stockholm is $53,750, with the highest median household income of $105,625 found in the 25 to 44 years age bracket for the primary householder. A total of 7 households (13.2%) fall into this category. Meanwhile, the 45 to 64 years age bracket for the primary householder has the lowest median household income of $0, with 32 households (60.4%) in this group.
| Income Bracket | # Households | Median Income |
| 15 to 24 Years | 4 (7.5%) | $68,750 |
| 25 to 44 Years | 7 (13.2%) | $105,625 |
| 45 to 64 Years | 32 (60.4%) | $0 |
| 65+ Years | 10 (18.9%) | $20,833 |
| Total | 53 (100.0%) | $53,750 |
Poverty in Stockholm
Income Below Poverty by Sex and Age in Stockholm
With 5.6% poverty level for males and 9.6% for females among the residents of Stockholm, 16 and 17 year old males and 75 year old and over females are the most vulnerable to poverty, with 1 males (100.0%) and 2 females (100.0%) in their respective age groups living below the poverty level.
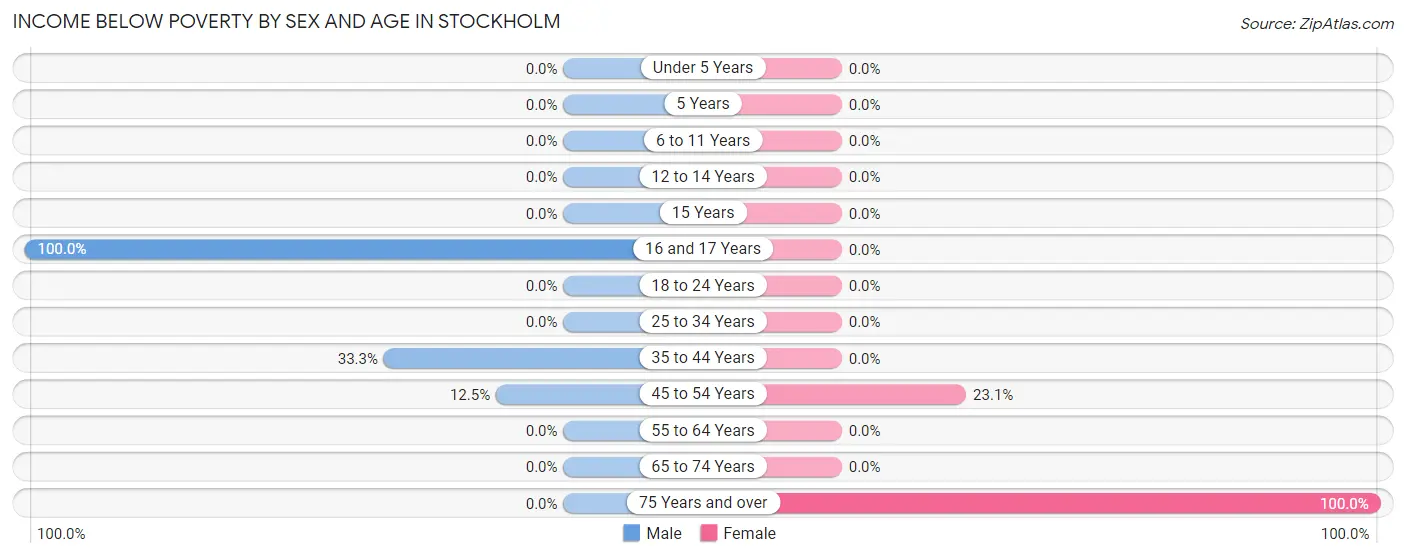
| Age Bracket | Male | Female |
| Under 5 Years | 0 (0.0%) | 0 (0.0%) |
| 5 Years | 0 (0.0%) | 0 (0.0%) |
| 6 to 11 Years | 0 (0.0%) | 0 (0.0%) |
| 12 to 14 Years | 0 (0.0%) | 0 (0.0%) |
| 15 Years | 0 (0.0%) | 0 (0.0%) |
| 16 and 17 Years | 1 (100.0%) | 0 (0.0%) |
| 18 to 24 Years | 0 (0.0%) | 0 (0.0%) |
| 25 to 34 Years | 0 (0.0%) | 0 (0.0%) |
| 35 to 44 Years | 1 (33.3%) | 0 (0.0%) |
| 45 to 54 Years | 2 (12.5%) | 3 (23.1%) |
| 55 to 64 Years | 0 (0.0%) | 0 (0.0%) |
| 65 to 74 Years | 0 (0.0%) | 0 (0.0%) |
| 75 Years and over | 0 (0.0%) | 2 (100.0%) |
| Total | 4 (5.6%) | 5 (9.6%) |
Income Above Poverty by Sex and Age in Stockholm
According to the poverty statistics in Stockholm, males aged under 5 years and females aged under 5 years are the age groups that are most secure financially, with 100.0% of males and 100.0% of females in these age groups living above the poverty line.
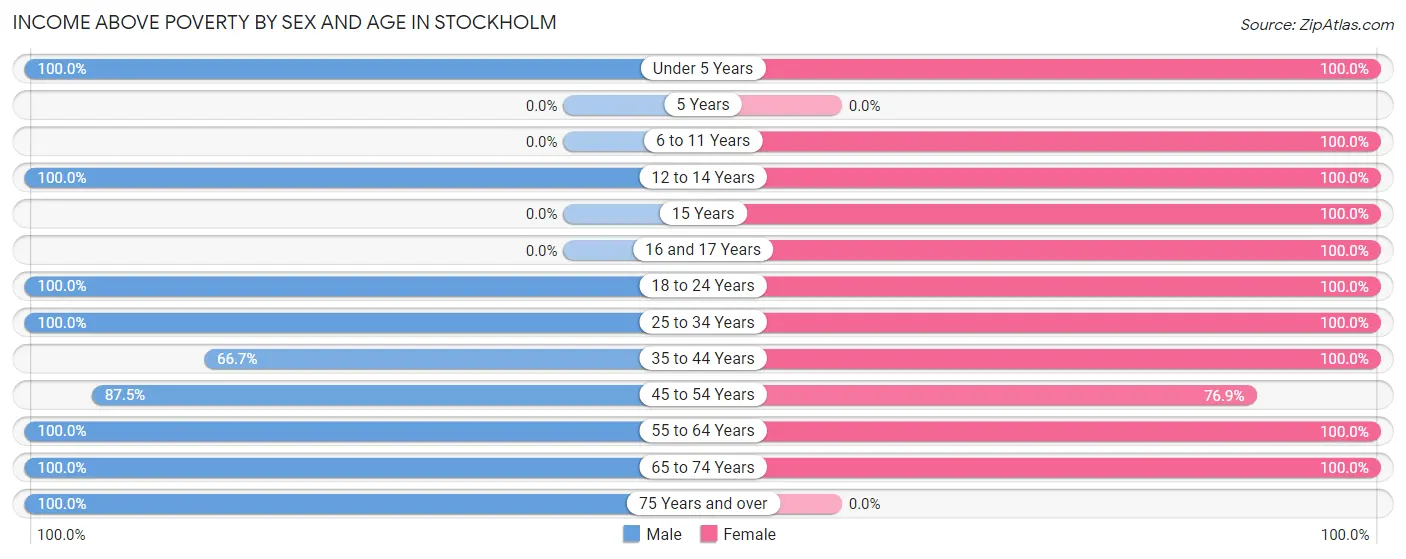
| Age Bracket | Male | Female |
| Under 5 Years | 2 (100.0%) | 3 (100.0%) |
| 5 Years | 0 (0.0%) | 0 (0.0%) |
| 6 to 11 Years | 0 (0.0%) | 8 (100.0%) |
| 12 to 14 Years | 1 (100.0%) | 3 (100.0%) |
| 15 Years | 0 (0.0%) | 1 (100.0%) |
| 16 and 17 Years | 0 (0.0%) | 1 (100.0%) |
| 18 to 24 Years | 21 (100.0%) | 3 (100.0%) |
| 25 to 34 Years | 11 (100.0%) | 3 (100.0%) |
| 35 to 44 Years | 2 (66.7%) | 7 (100.0%) |
| 45 to 54 Years | 14 (87.5%) | 10 (76.9%) |
| 55 to 64 Years | 14 (100.0%) | 2 (100.0%) |
| 65 to 74 Years | 1 (100.0%) | 6 (100.0%) |
| 75 Years and over | 2 (100.0%) | 0 (0.0%) |
| Total | 68 (94.4%) | 47 (90.4%) |
Income Below Poverty Among Married-Couple Families in Stockholm
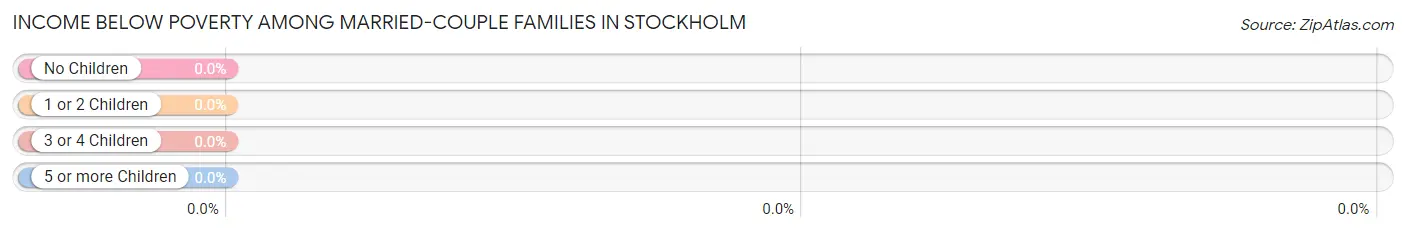
| Children | Above Poverty | Below Poverty |
| No Children | 18 (100.0%) | 0 (0.0%) |
| 1 or 2 Children | 4 (100.0%) | 0 (0.0%) |
| 3 or 4 Children | 2 (100.0%) | 0 (0.0%) |
| 5 or more Children | 0 (0.0%) | 0 (0.0%) |
| Total | 24 (100.0%) | 0 (0.0%) |
Income Below Poverty Among Single-Parent Households in Stockholm
| Children | Single Father | Single Mother |
| No Children | 0 (0.0%) | 0 (0.0%) |
| 1 or 2 Children | 0 (0.0%) | 0 (0.0%) |
| 3 or 4 Children | 0 (0.0%) | 0 (0.0%) |
| 5 or more Children | 0 (0.0%) | 0 (0.0%) |
| Total | 0 (0.0%) | 0 (0.0%) |
Income Below Poverty Among Married-Couple vs Single-Parent Households in Stockholm
| Children | Married-Couple Families | Single-Parent Households |
| No Children | 0 (0.0%) | 0 (0.0%) |
| 1 or 2 Children | 0 (0.0%) | 0 (0.0%) |
| 3 or 4 Children | 0 (0.0%) | 0 (0.0%) |
| 5 or more Children | 0 (0.0%) | 0 (0.0%) |
| Total | 0 (0.0%) | 0 (0.0%) |
Race in Stockholm
The most populous races in Stockholm are White / Caucasian (115 | 92.7%), Two or more Races (8 | 6.5%), and Hispanic or Latino (3 | 2.4%).
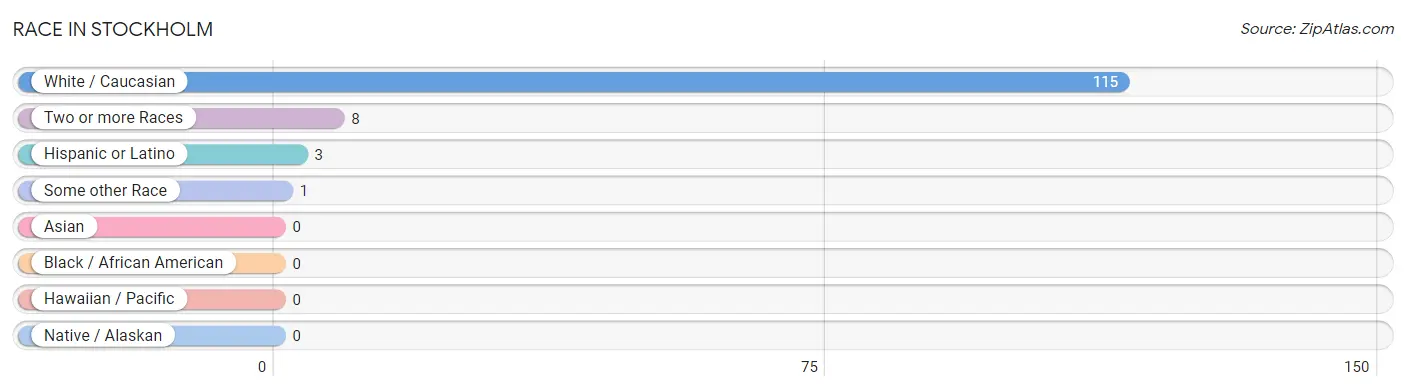
| Race | # Population | % Population |
| Asian | 0 | 0.0% |
| Black / African American | 0 | 0.0% |
| Hawaiian / Pacific | 0 | 0.0% |
| Hispanic or Latino | 3 | 2.4% |
| Native / Alaskan | 0 | 0.0% |
| White / Caucasian | 115 | 92.7% |
| Two or more Races | 8 | 6.5% |
| Some other Race | 1 | 0.8% |
| Total | 124 | 100.0% |
Ancestry in Stockholm
The most populous ancestries reported in Stockholm are German (41 | 33.1%), Swedish (23 | 18.5%), Norwegian (13 | 10.5%), English (11 | 8.9%), and Italian (8 | 6.5%), together accounting for 77.4% of all Stockholm residents.
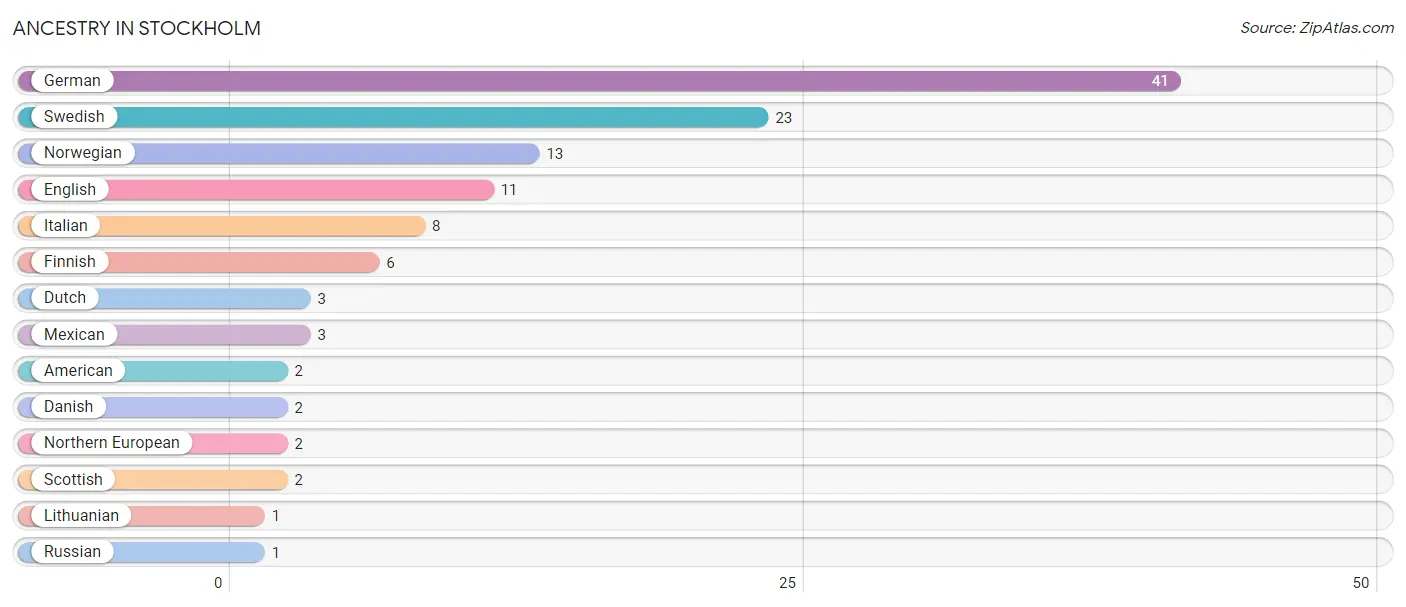
| Ancestry | # Population | % Population |
| American | 2 | 1.6% |
| Danish | 2 | 1.6% |
| Dutch | 3 | 2.4% |
| English | 11 | 8.9% |
| Finnish | 6 | 4.8% |
| German | 41 | 33.1% |
| Italian | 8 | 6.5% |
| Lithuanian | 1 | 0.8% |
| Mexican | 3 | 2.4% |
| Northern European | 2 | 1.6% |
| Norwegian | 13 | 10.5% |
| Russian | 1 | 0.8% |
| Scottish | 2 | 1.6% |
| Swedish | 23 | 18.5% | View All 14 Rows |
Immigrants in Stockholm

| Immigration Origin | # Population | % Population | View All 0 Rows |
Sex and Age in Stockholm
Sex and Age in Stockholm
The most populous age groups in Stockholm are 50 to 54 Years (13 | 18.1%) for men and 50 to 54 Years (8 | 15.4%) for women.
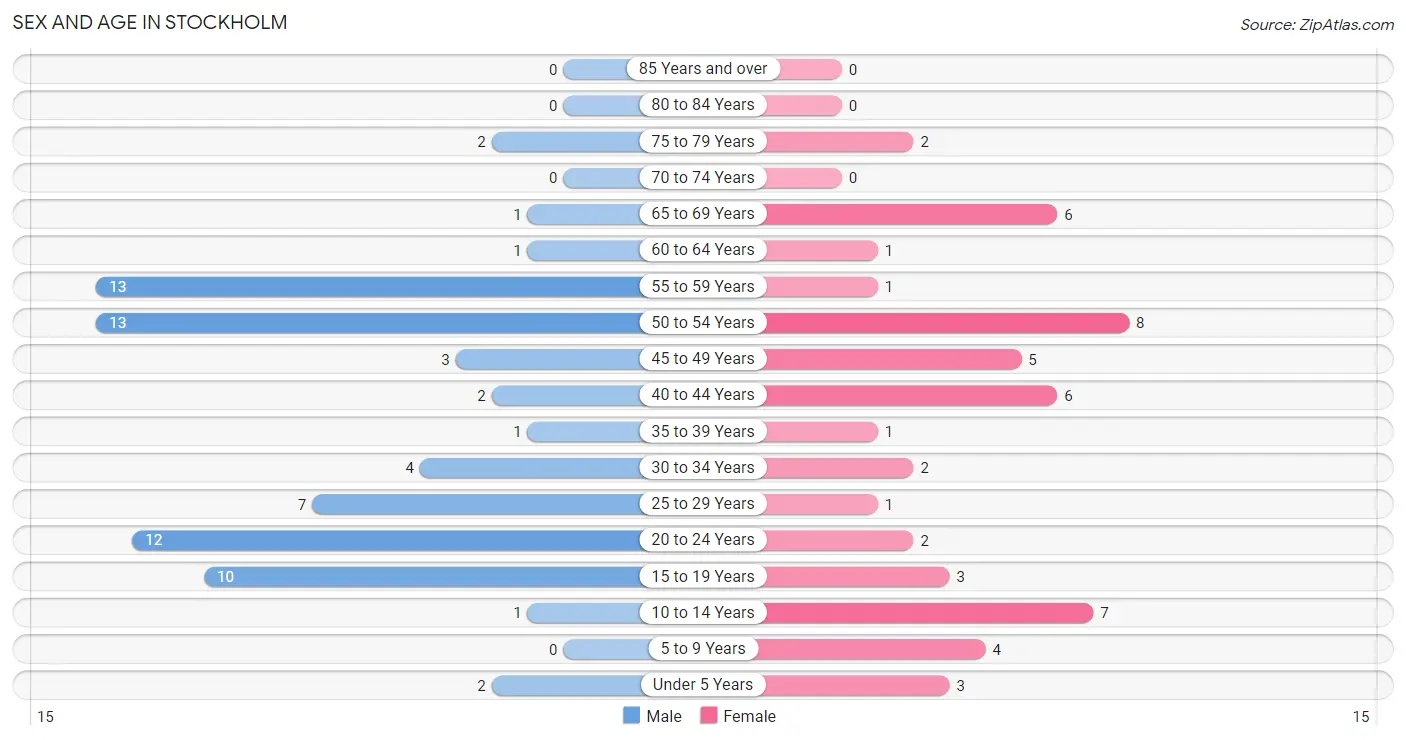
| Age Bracket | Male | Female |
| Under 5 Years | 2 (2.8%) | 3 (5.8%) |
| 5 to 9 Years | 0 (0.0%) | 4 (7.7%) |
| 10 to 14 Years | 1 (1.4%) | 7 (13.5%) |
| 15 to 19 Years | 10 (13.9%) | 3 (5.8%) |
| 20 to 24 Years | 12 (16.7%) | 2 (3.8%) |
| 25 to 29 Years | 7 (9.7%) | 1 (1.9%) |
| 30 to 34 Years | 4 (5.6%) | 2 (3.8%) |
| 35 to 39 Years | 1 (1.4%) | 1 (1.9%) |
| 40 to 44 Years | 2 (2.8%) | 6 (11.5%) |
| 45 to 49 Years | 3 (4.2%) | 5 (9.6%) |
| 50 to 54 Years | 13 (18.1%) | 8 (15.4%) |
| 55 to 59 Years | 13 (18.1%) | 1 (1.9%) |
| 60 to 64 Years | 1 (1.4%) | 1 (1.9%) |
| 65 to 69 Years | 1 (1.4%) | 6 (11.5%) |
| 70 to 74 Years | 0 (0.0%) | 0 (0.0%) |
| 75 to 79 Years | 2 (2.8%) | 2 (3.8%) |
| 80 to 84 Years | 0 (0.0%) | 0 (0.0%) |
| 85 Years and over | 0 (0.0%) | 0 (0.0%) |
| Total | 72 (100.0%) | 52 (100.0%) |
Families and Households in Stockholm
Median Family Size in Stockholm
The median family size in Stockholm is 3.10 persons per family, with married-couple families (24 | 77.4%) accounting for the largest median family size of 3.25 persons per family. On the other hand, single male/father families (3 | 9.7%) represent the smallest median family size with 2.33 persons per family.
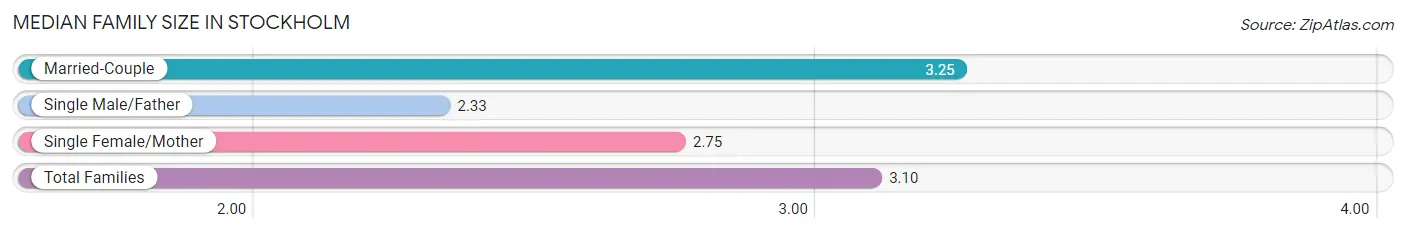
| Family Type | # Families | Family Size |
| Married-Couple | 24 (77.4%) | 3.25 |
| Single Male/Father | 3 (9.7%) | 2.33 |
| Single Female/Mother | 4 (12.9%) | 2.75 |
| Total Families | 31 (100.0%) | 3.10 |
Median Household Size in Stockholm
The median household size in Stockholm is 2.34 persons per household, with single male/father households (3 | 5.7%) accounting for the largest median household size of 3.67 persons per household. non-family households (22 | 41.5%) represent the smallest median household size with 1.05 persons per household.
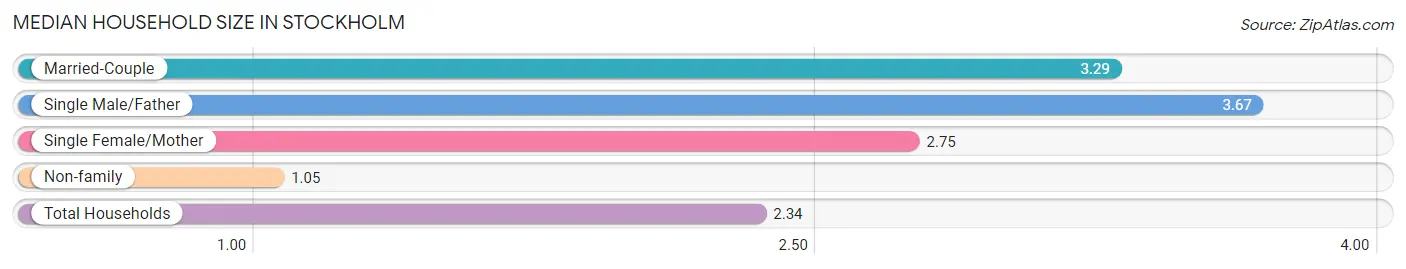
| Household Type | # Households | Household Size |
| Married-Couple | 24 (45.3%) | 3.29 |
| Single Male/Father | 3 (5.7%) | 3.67 |
| Single Female/Mother | 4 (7.5%) | 2.75 |
| Non-family | 22 (41.5%) | 1.05 |
| Total Households | 53 (100.0%) | 2.34 |
Household Size by Marriage Status in Stockholm
Out of a total of 53 households in Stockholm, 31 (58.5%) are family households, while 22 (41.5%) are nonfamily households. The most numerous type of family households are 4-person households, comprising 13, and the most common type of nonfamily households are 1-person households, comprising 20.
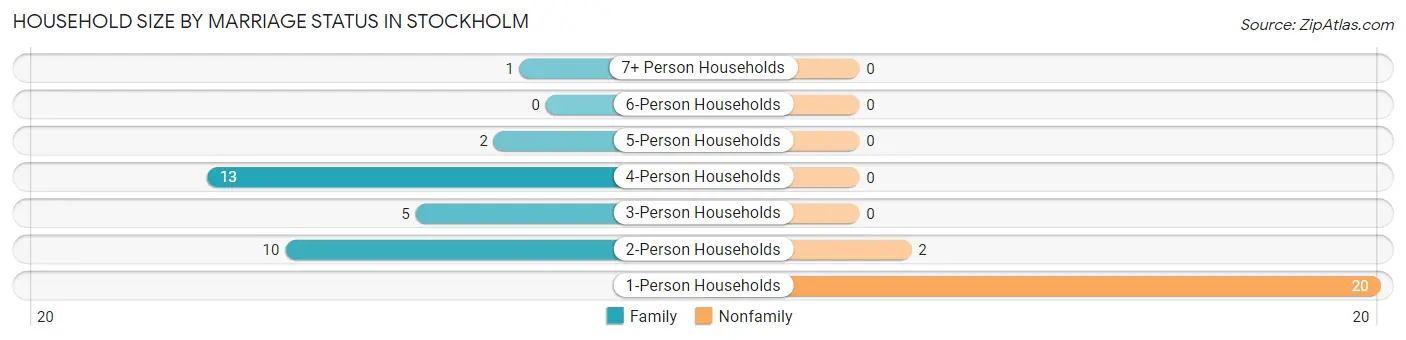
| Household Size | Family Households | Nonfamily Households |
| 1-Person Households | - | 20 (37.7%) |
| 2-Person Households | 10 (18.9%) | 2 (3.8%) |
| 3-Person Households | 5 (9.4%) | 0 (0.0%) |
| 4-Person Households | 13 (24.5%) | 0 (0.0%) |
| 5-Person Households | 2 (3.8%) | 0 (0.0%) |
| 6-Person Households | 0 (0.0%) | 0 (0.0%) |
| 7+ Person Households | 1 (1.9%) | 0 (0.0%) |
| Total | 31 (58.5%) | 22 (41.5%) |
Female Fertility in Stockholm
Fertility by Age in Stockholm
Average fertility rate in Stockholm is 100.0 births per 1,000 women. Women in the age bracket of 20 to 34 years have the highest fertility rate with 200.0 births per 1,000 women. Women in the age bracket of 20 to 34 years acount for 50.0% of all women with births.
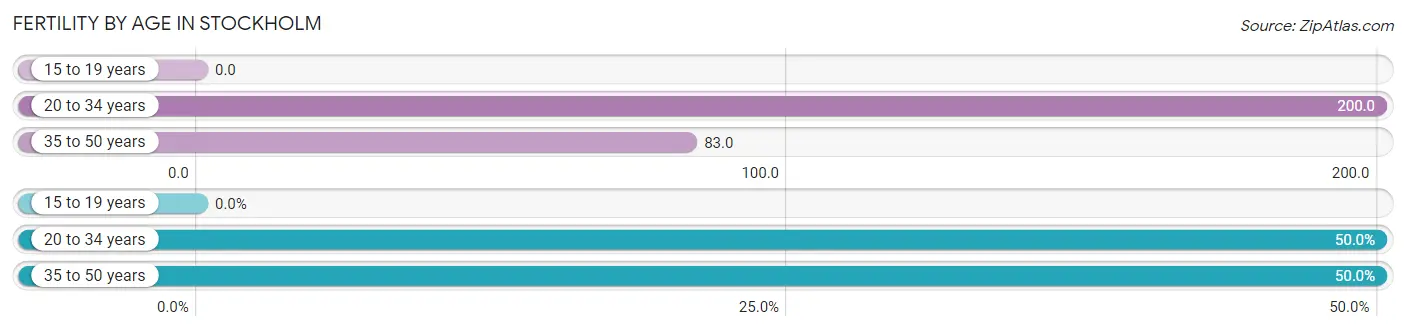
| Age Bracket | Women with Births | Births / 1,000 Women |
| 15 to 19 years | 0 (0.0%) | 0.0 |
| 20 to 34 years | 1 (50.0%) | 200.0 |
| 35 to 50 years | 1 (50.0%) | 83.0 |
| Total | 2 (100.0%) | 100.0 |
Fertility by Age by Marriage Status in Stockholm
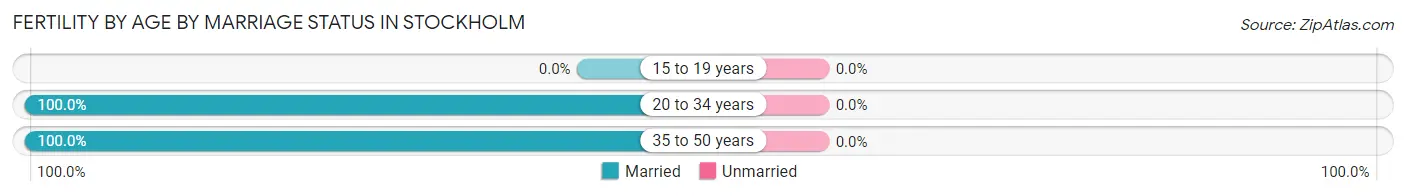
| Age Bracket | Married | Unmarried |
| 15 to 19 years | 0 (0.0%) | 0 (0.0%) |
| 20 to 34 years | 1 (100.0%) | 0 (0.0%) |
| 35 to 50 years | 1 (100.0%) | 0 (0.0%) |
| Total | 2 (100.0%) | 0 (0.0%) |
Fertility by Education in Stockholm
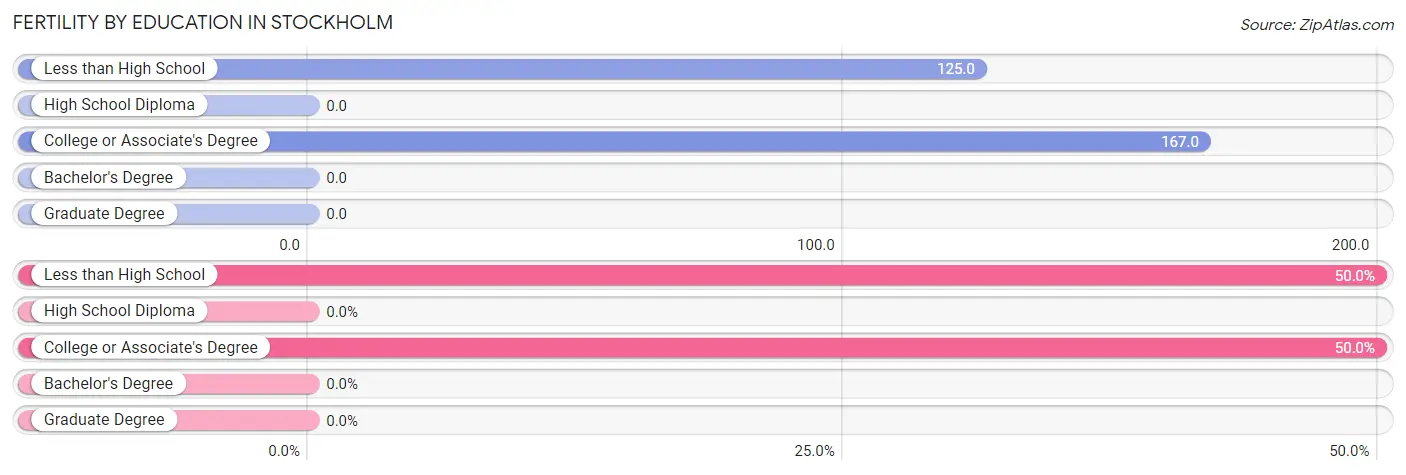
| Educational Attainment | Women with Births | Births / 1,000 Women |
| Less than High School | 1 (50.0%) | 125.0 |
| High School Diploma | 0 (0.0%) | 0.0 |
| College or Associate's Degree | 1 (50.0%) | 167.0 |
| Bachelor's Degree | 0 (0.0%) | 0.0 |
| Graduate Degree | 0 (0.0%) | 0.0 |
| Total | 2 (100.0%) | 100.0 |
Fertility by Education by Marriage Status in Stockholm
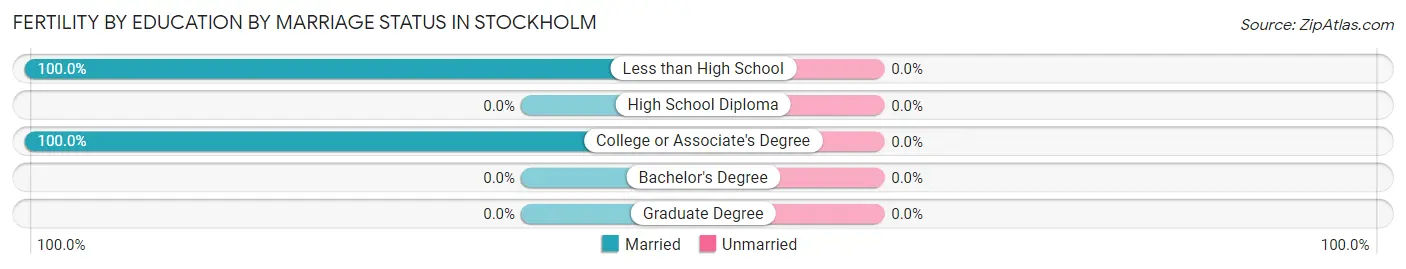
| Educational Attainment | Married | Unmarried |
| Less than High School | 1 (100.0%) | 0 (0.0%) |
| High School Diploma | 0 (0.0%) | 0 (0.0%) |
| College or Associate's Degree | 1 (100.0%) | 0 (0.0%) |
| Bachelor's Degree | 0 (0.0%) | 0 (0.0%) |
| Graduate Degree | 0 (0.0%) | 0 (0.0%) |
| Total | 2 (100.0%) | 0 (0.0%) |
Employment Characteristics in Stockholm
Employment by Class of Employer in Stockholm
Among the 70 employed individuals in Stockholm, private company employees (60 | 85.7%), local government employees (5 | 7.1%), and self-employed (incorporated) (2 | 2.9%) make up the most common classes of employment.
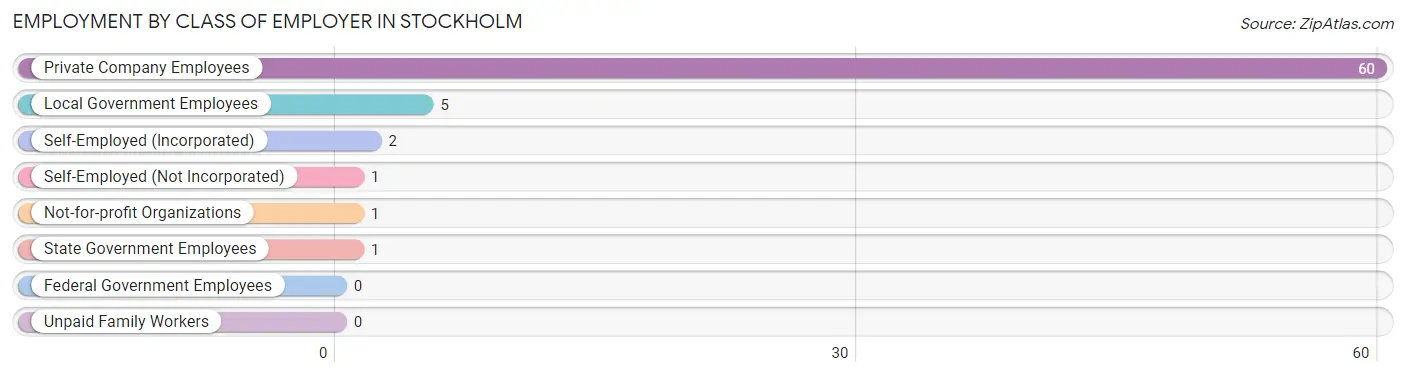
| Employer Class | # Employees | % Employees |
| Private Company Employees | 60 | 85.7% |
| Self-Employed (Incorporated) | 2 | 2.9% |
| Self-Employed (Not Incorporated) | 1 | 1.4% |
| Not-for-profit Organizations | 1 | 1.4% |
| Local Government Employees | 5 | 7.1% |
| State Government Employees | 1 | 1.4% |
| Federal Government Employees | 0 | 0.0% |
| Unpaid Family Workers | 0 | 0.0% |
| Total | 70 | 100.0% |
Employment Status by Age in Stockholm
According to the labor force statistics for Stockholm, out of the total population over 16 years of age (106), 67.9% or 72 individuals are in the labor force, with 2.8% or 2 of them unemployed. The age group with the highest labor force participation rate is 20 to 24 years, with 100.0% or 14 individuals in the labor force. Within the labor force, the 30 to 34 years age range has the highest percentage of unemployed individuals, with 16.7% or 1 of them being unemployed.
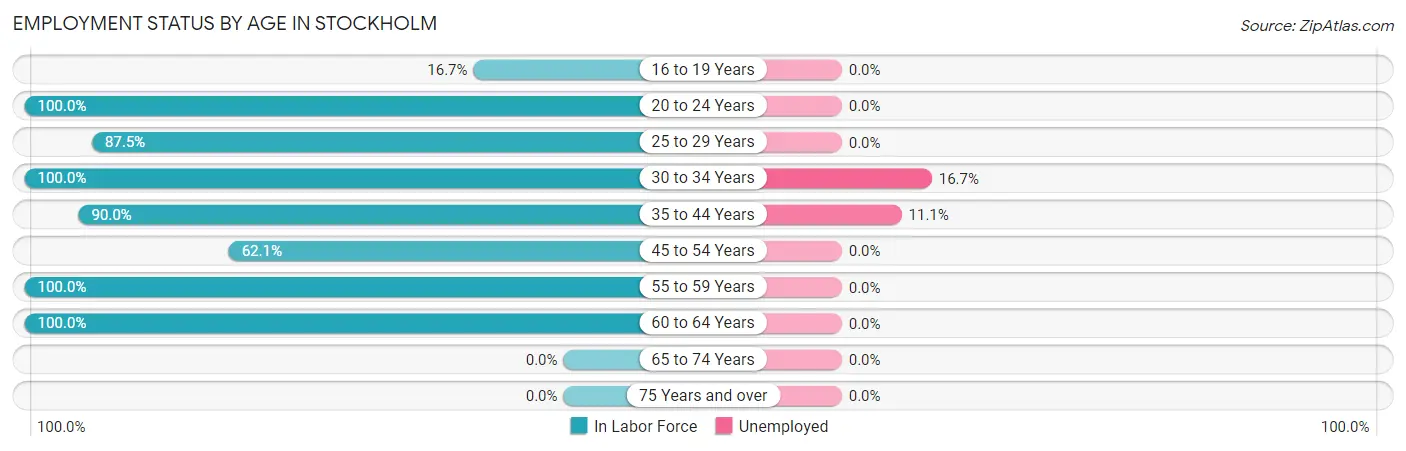
| Age Bracket | In Labor Force | Unemployed |
| 16 to 19 Years | 2 (16.7%) | 0 (0.0%) |
| 20 to 24 Years | 14 (100.0%) | 0 (0.0%) |
| 25 to 29 Years | 7 (87.5%) | 0 (0.0%) |
| 30 to 34 Years | 6 (100.0%) | 1 (16.7%) |
| 35 to 44 Years | 9 (90.0%) | 1 (11.1%) |
| 45 to 54 Years | 18 (62.1%) | 0 (0.0%) |
| 55 to 59 Years | 14 (100.0%) | 0 (0.0%) |
| 60 to 64 Years | 2 (100.0%) | 0 (0.0%) |
| 65 to 74 Years | 0 (0.0%) | 0 (0.0%) |
| 75 Years and over | 0 (0.0%) | 0 (0.0%) |
| Total | 72 (67.9%) | 2 (2.8%) |
Employment Status by Educational Attainment in Stockholm
According to labor force statistics for Stockholm, 81.2% of individuals (56) out of the total population between 25 and 64 years of age (69) are in the labor force, with 3.6% or 2 of them being unemployed. The group with the highest labor force participation rate are those with the educational attainment of bachelor's degree or higher, with 100.0% or 5 individuals in the labor force. Within the labor force, individuals with college / associate degree education have the highest percentage of unemployment, with 10.0% or 1 of them being unemployed.
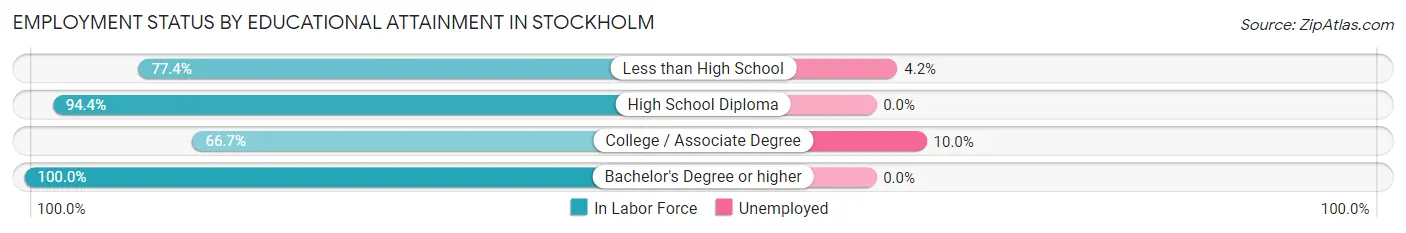
| Educational Attainment | In Labor Force | Unemployed |
| Less than High School | 24 (77.4%) | 1 (4.2%) |
| High School Diploma | 17 (94.4%) | 0 (0.0%) |
| College / Associate Degree | 10 (66.7%) | 2 (10.0%) |
| Bachelor's Degree or higher | 5 (100.0%) | 0 (0.0%) |
| Total | 56 (81.2%) | 2 (3.6%) |
Employment Occupations by Sex in Stockholm
Management, Business, Science and Arts Occupations
The most common Management, Business, Science and Arts occupations in Stockholm are Management (5 | 7.1%), Community & Social Service (3 | 4.3%), Education Instruction & Library (2 | 2.9%), Computers, Engineering & Science (1 | 1.4%), and Architecture & Engineering (1 | 1.4%).
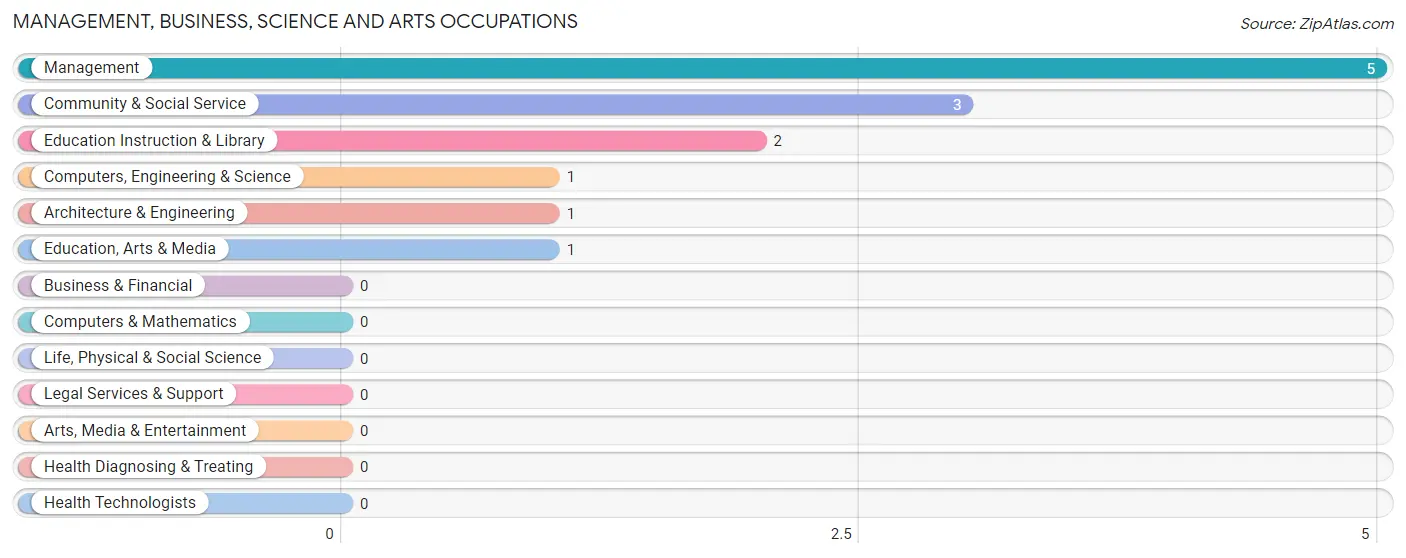
Management, Business, Science and Arts Occupations by Sex
Within the Management, Business, Science and Arts occupations in Stockholm, the most male-oriented occupations are Computers, Engineering & Science (100.0%), Architecture & Engineering (100.0%), and Education, Arts & Media (100.0%), while the most female-oriented occupations are Education Instruction & Library (100.0%), Community & Social Service (66.7%), and Management (60.0%).
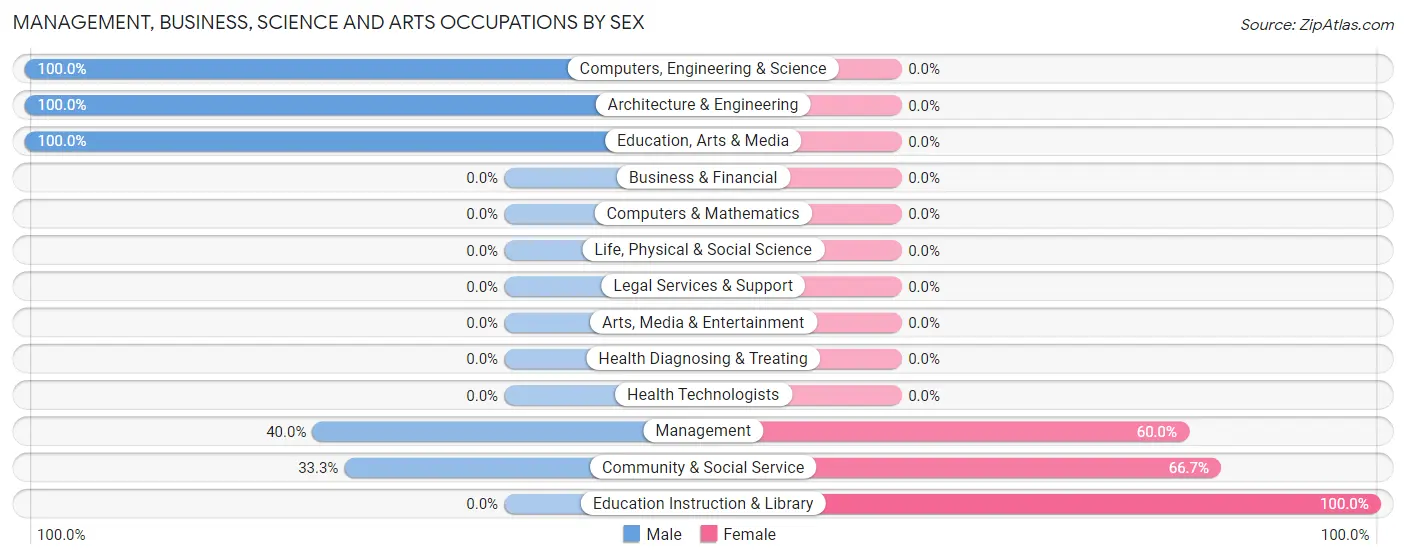
| Occupation | Male | Female |
| Management | 2 (40.0%) | 3 (60.0%) |
| Business & Financial | 0 (0.0%) | 0 (0.0%) |
| Computers, Engineering & Science | 1 (100.0%) | 0 (0.0%) |
| Computers & Mathematics | 0 (0.0%) | 0 (0.0%) |
| Architecture & Engineering | 1 (100.0%) | 0 (0.0%) |
| Life, Physical & Social Science | 0 (0.0%) | 0 (0.0%) |
| Community & Social Service | 1 (33.3%) | 2 (66.7%) |
| Education, Arts & Media | 1 (100.0%) | 0 (0.0%) |
| Legal Services & Support | 0 (0.0%) | 0 (0.0%) |
| Education Instruction & Library | 0 (0.0%) | 2 (100.0%) |
| Arts, Media & Entertainment | 0 (0.0%) | 0 (0.0%) |
| Health Diagnosing & Treating | 0 (0.0%) | 0 (0.0%) |
| Health Technologists | 0 (0.0%) | 0 (0.0%) |
| Total (Category) | 4 (44.4%) | 5 (55.6%) |
| Total (Overall) | 52 (74.3%) | 18 (25.7%) |
Services Occupations
The most common Services occupations in Stockholm are Food Preparation & Serving (4 | 5.7%), and Cleaning & Maintenance (2 | 2.9%).
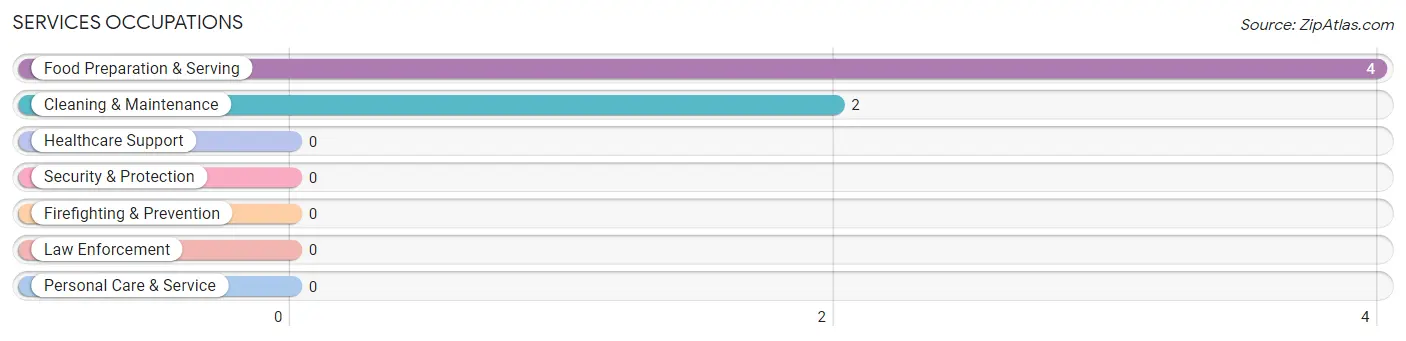
Services Occupations by Sex
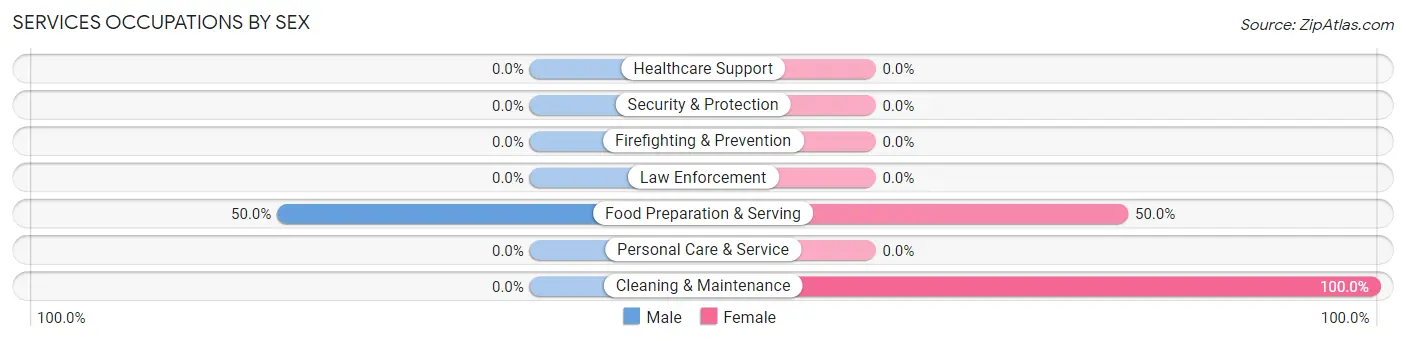
| Occupation | Male | Female |
| Healthcare Support | 0 (0.0%) | 0 (0.0%) |
| Security & Protection | 0 (0.0%) | 0 (0.0%) |
| Firefighting & Prevention | 0 (0.0%) | 0 (0.0%) |
| Law Enforcement | 0 (0.0%) | 0 (0.0%) |
| Food Preparation & Serving | 2 (50.0%) | 2 (50.0%) |
| Cleaning & Maintenance | 0 (0.0%) | 2 (100.0%) |
| Personal Care & Service | 0 (0.0%) | 0 (0.0%) |
| Total (Category) | 2 (33.3%) | 4 (66.7%) |
| Total (Overall) | 52 (74.3%) | 18 (25.7%) |
Sales and Office Occupations
The most common Sales and Office occupations in Stockholm are Sales & Related (4 | 5.7%), and Office & Administration (2 | 2.9%).
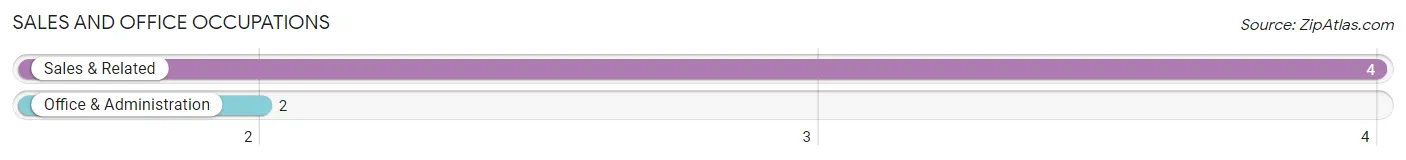
Sales and Office Occupations by Sex
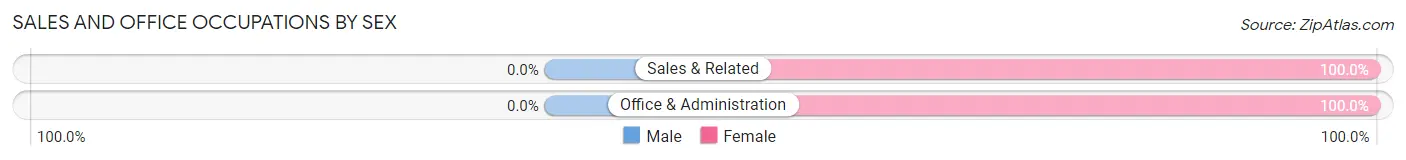
| Occupation | Male | Female |
| Sales & Related | 0 (0.0%) | 4 (100.0%) |
| Office & Administration | 0 (0.0%) | 2 (100.0%) |
| Total (Category) | 0 (0.0%) | 6 (100.0%) |
| Total (Overall) | 52 (74.3%) | 18 (25.7%) |
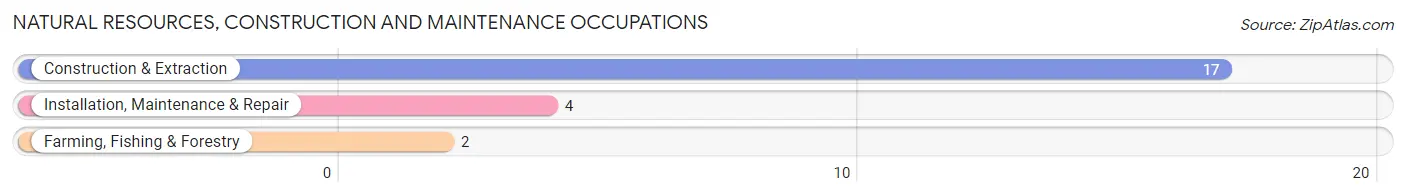
Natural Resources, Construction and Maintenance Occupations
The most common Natural Resources, Construction and Maintenance occupations in Stockholm are Construction & Extraction (17 | 24.3%), Installation, Maintenance & Repair (4 | 5.7%), and Farming, Fishing & Forestry (2 | 2.9%).
Natural Resources, Construction and Maintenance Occupations by Sex
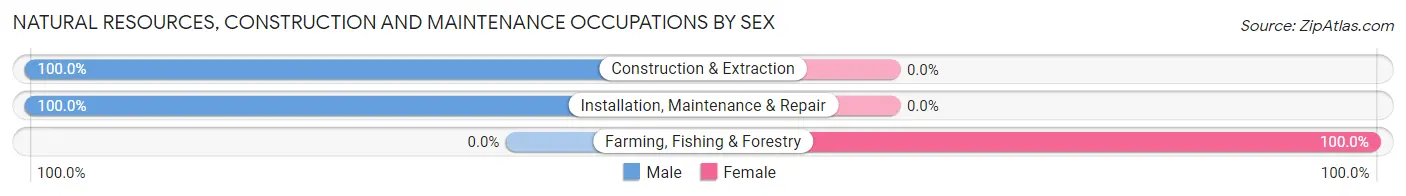
| Occupation | Male | Female |
| Farming, Fishing & Forestry | 0 (0.0%) | 2 (100.0%) |
| Construction & Extraction | 17 (100.0%) | 0 (0.0%) |
| Installation, Maintenance & Repair | 4 (100.0%) | 0 (0.0%) |
| Total (Category) | 21 (91.3%) | 2 (8.7%) |
| Total (Overall) | 52 (74.3%) | 18 (25.7%) |
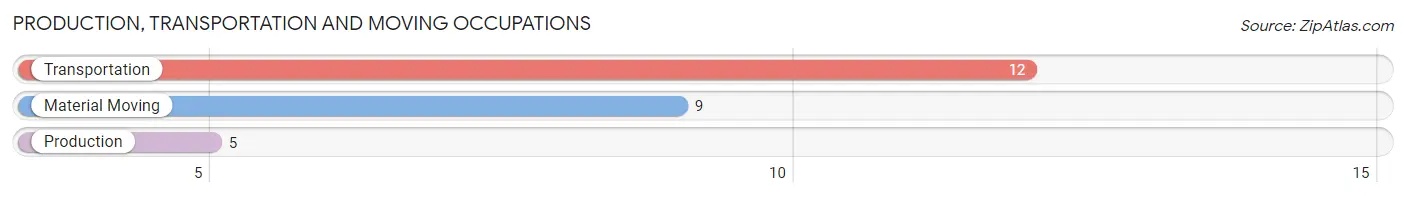
Production, Transportation and Moving Occupations
The most common Production, Transportation and Moving occupations in Stockholm are Transportation (12 | 17.1%), Material Moving (9 | 12.9%), and Production (5 | 7.1%).
Production, Transportation and Moving Occupations by Sex
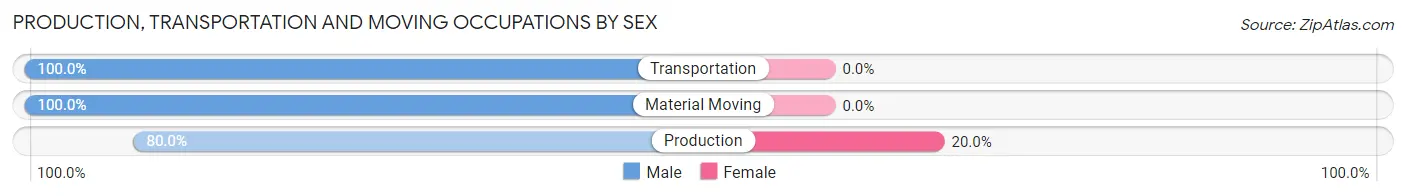
| Occupation | Male | Female |
| Production | 4 (80.0%) | 1 (20.0%) |
| Transportation | 12 (100.0%) | 0 (0.0%) |
| Material Moving | 9 (100.0%) | 0 (0.0%) |
| Total (Category) | 25 (96.2%) | 1 (3.8%) |
| Total (Overall) | 52 (74.3%) | 18 (25.7%) |
Employment Industries by Sex in Stockholm
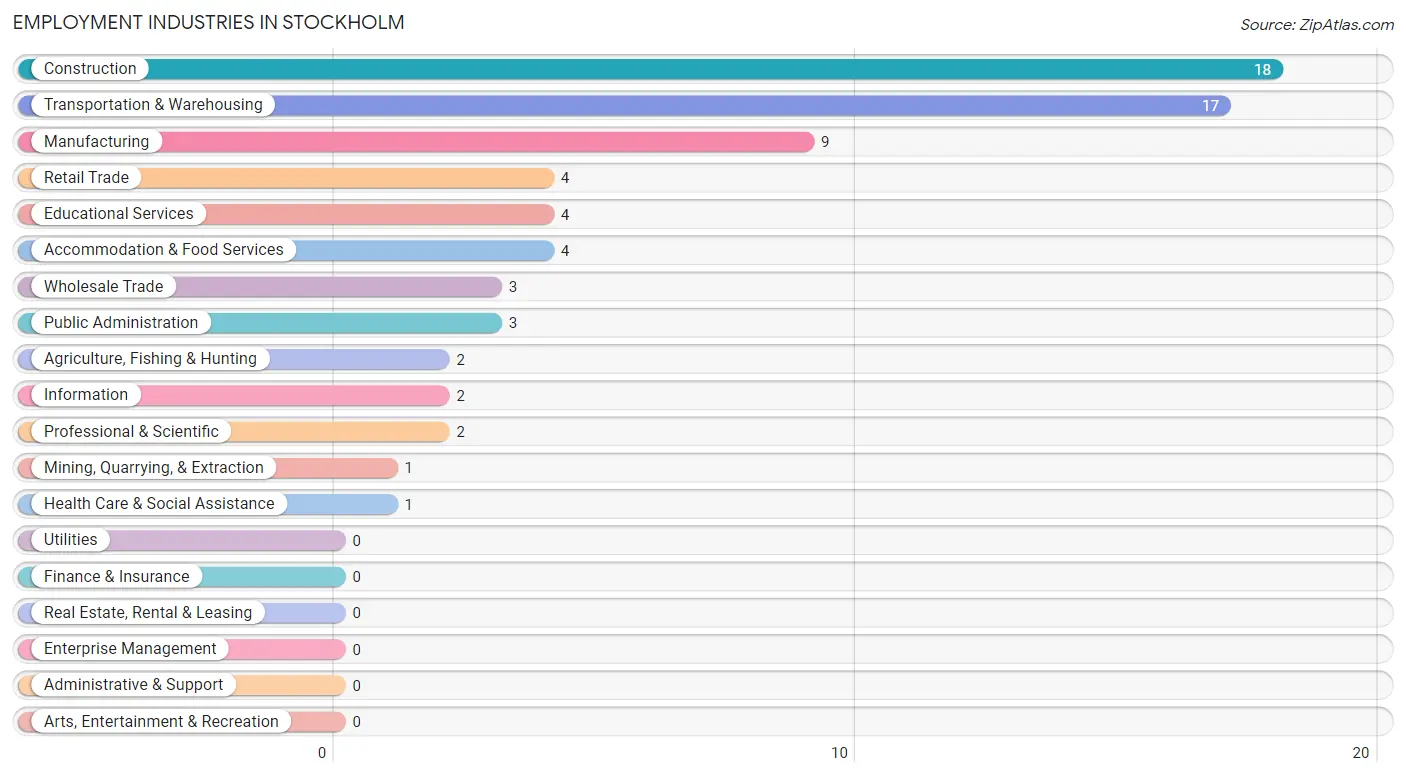
Employment Industries in Stockholm
The major employment industries in Stockholm include Construction (18 | 25.7%), Transportation & Warehousing (17 | 24.3%), Manufacturing (9 | 12.9%), Retail Trade (4 | 5.7%), and Educational Services (4 | 5.7%).
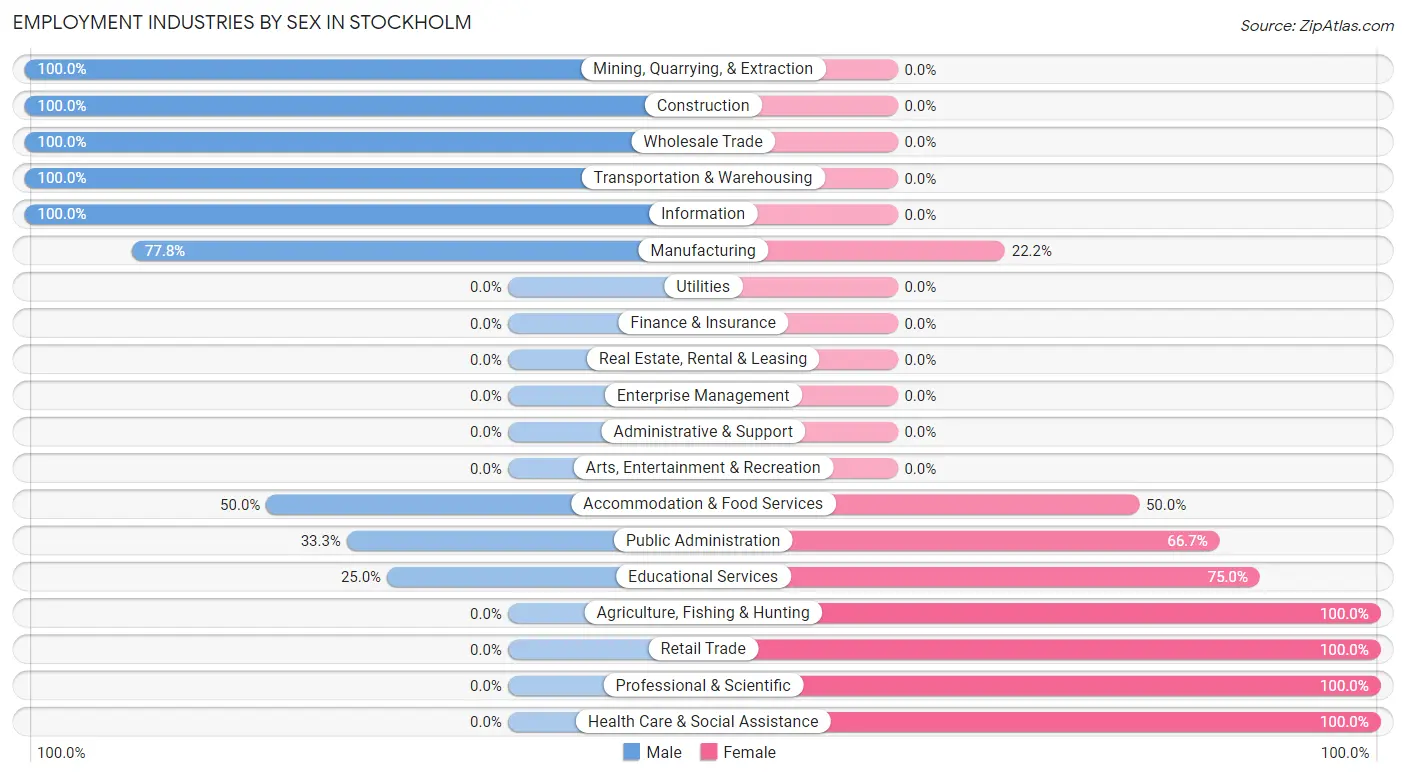
Employment Industries by Sex in Stockholm
The Stockholm industries that see more men than women are Mining, Quarrying, & Extraction (100.0%), Construction (100.0%), and Wholesale Trade (100.0%), whereas the industries that tend to have a higher number of women are Agriculture, Fishing & Hunting (100.0%), Retail Trade (100.0%), and Professional & Scientific (100.0%).
| Industry | Male | Female |
| Agriculture, Fishing & Hunting | 0 (0.0%) | 2 (100.0%) |
| Mining, Quarrying, & Extraction | 1 (100.0%) | 0 (0.0%) |
| Construction | 18 (100.0%) | 0 (0.0%) |
| Manufacturing | 7 (77.8%) | 2 (22.2%) |
| Wholesale Trade | 3 (100.0%) | 0 (0.0%) |
| Retail Trade | 0 (0.0%) | 4 (100.0%) |
| Transportation & Warehousing | 17 (100.0%) | 0 (0.0%) |
| Utilities | 0 (0.0%) | 0 (0.0%) |
| Information | 2 (100.0%) | 0 (0.0%) |
| Finance & Insurance | 0 (0.0%) | 0 (0.0%) |
| Real Estate, Rental & Leasing | 0 (0.0%) | 0 (0.0%) |
| Professional & Scientific | 0 (0.0%) | 2 (100.0%) |
| Enterprise Management | 0 (0.0%) | 0 (0.0%) |
| Administrative & Support | 0 (0.0%) | 0 (0.0%) |
| Educational Services | 1 (25.0%) | 3 (75.0%) |
| Health Care & Social Assistance | 0 (0.0%) | 1 (100.0%) |
| Arts, Entertainment & Recreation | 0 (0.0%) | 0 (0.0%) |
| Accommodation & Food Services | 2 (50.0%) | 2 (50.0%) |
| Public Administration | 1 (33.3%) | 2 (66.7%) |
| Total | 52 (74.3%) | 18 (25.7%) |
Education in Stockholm
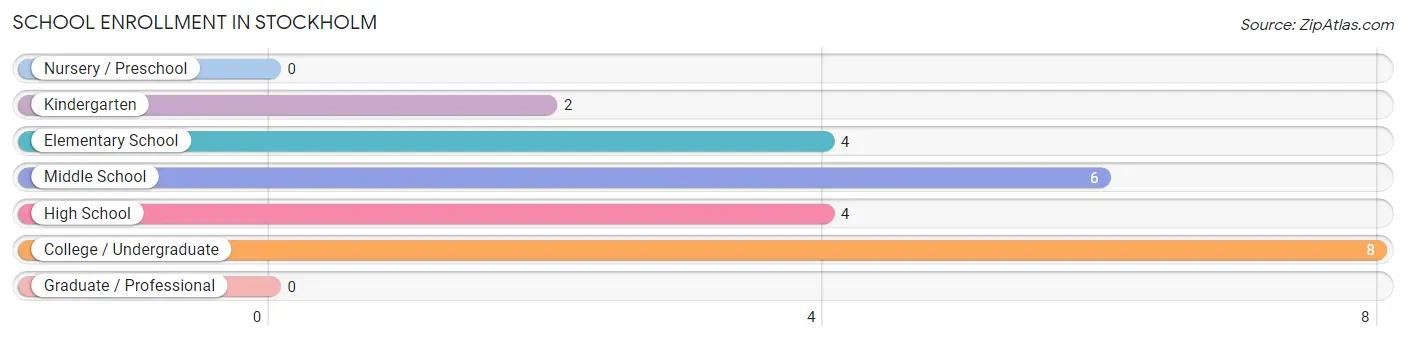
School Enrollment in Stockholm
The most common levels of schooling among the 24 students in Stockholm are college / undergraduate (8 | 33.3%), middle school (6 | 25.0%), and elementary school (4 | 16.7%).
| School Level | # Students | % Students |
| Nursery / Preschool | 0 | 0.0% |
| Kindergarten | 2 | 8.3% |
| Elementary School | 4 | 16.7% |
| Middle School | 6 | 25.0% |
| High School | 4 | 16.7% |
| College / Undergraduate | 8 | 33.3% |
| Graduate / Professional | 0 | 0.0% |
| Total | 24 | 100.0% |
School Enrollment by Age by Funding Source in Stockholm
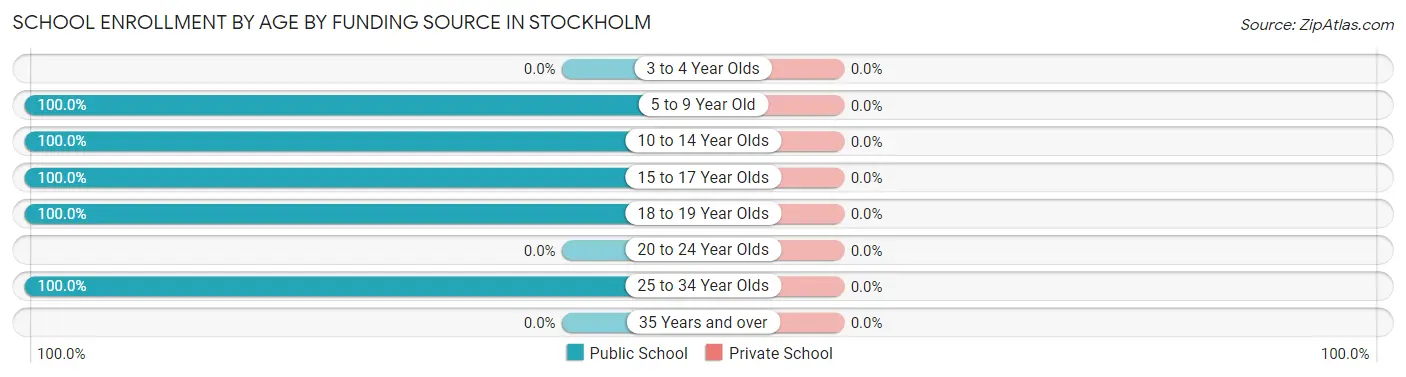
| Age Bracket | Public School | Private School |
| 3 to 4 Year Olds | 0 (0.0%) | 0 (0.0%) |
| 5 to 9 Year Old | 4 (100.0%) | 0 (0.0%) |
| 10 to 14 Year Olds | 8 (100.0%) | 0 (0.0%) |
| 15 to 17 Year Olds | 3 (100.0%) | 0 (0.0%) |
| 18 to 19 Year Olds | 7 (100.0%) | 0 (0.0%) |
| 20 to 24 Year Olds | 0 (0.0%) | 0 (0.0%) |
| 25 to 34 Year Olds | 2 (100.0%) | 0 (0.0%) |
| 35 Years and over | 0 (0.0%) | 0 (0.0%) |
| Total | 24 (100.0%) | 0 (0.0%) |
Educational Attainment by Field of Study in Stockholm
Education (5 | 62.5%), engineering (1 | 12.5%), science & technology (1 | 12.5%), and arts & humanities (1 | 12.5%) are the most common fields of study among 8 individuals in Stockholm who have obtained a bachelor's degree or higher.
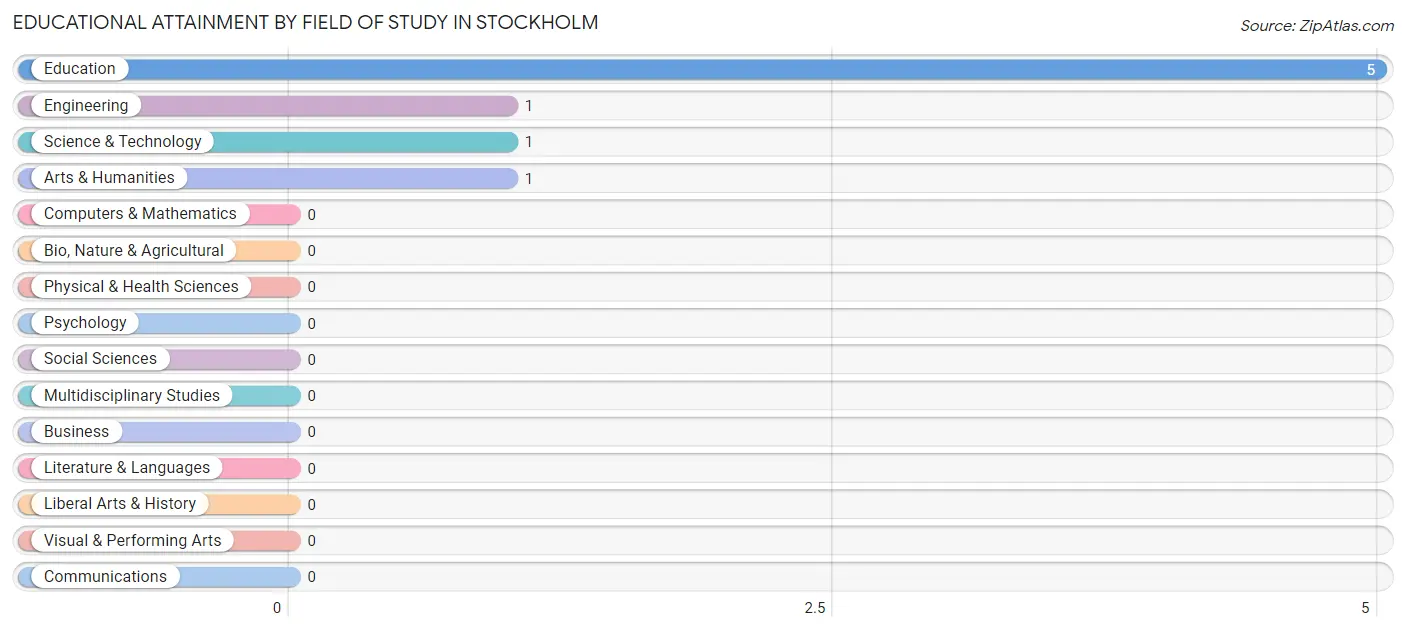
| Field of Study | # Graduates | % Graduates |
| Computers & Mathematics | 0 | 0.0% |
| Bio, Nature & Agricultural | 0 | 0.0% |
| Physical & Health Sciences | 0 | 0.0% |
| Psychology | 0 | 0.0% |
| Social Sciences | 0 | 0.0% |
| Engineering | 1 | 12.5% |
| Multidisciplinary Studies | 0 | 0.0% |
| Science & Technology | 1 | 12.5% |
| Business | 0 | 0.0% |
| Education | 5 | 62.5% |
| Literature & Languages | 0 | 0.0% |
| Liberal Arts & History | 0 | 0.0% |
| Visual & Performing Arts | 0 | 0.0% |
| Communications | 0 | 0.0% |
| Arts & Humanities | 1 | 12.5% |
| Total | 8 | 100.0% |
Transportation & Commute in Stockholm
Vehicle Availability by Sex in Stockholm
The most prevalent vehicle ownership categories in Stockholm are males with 3 vehicles (32, accounting for 61.5%) and females with 3 vehicles (3, making up 177.8%).
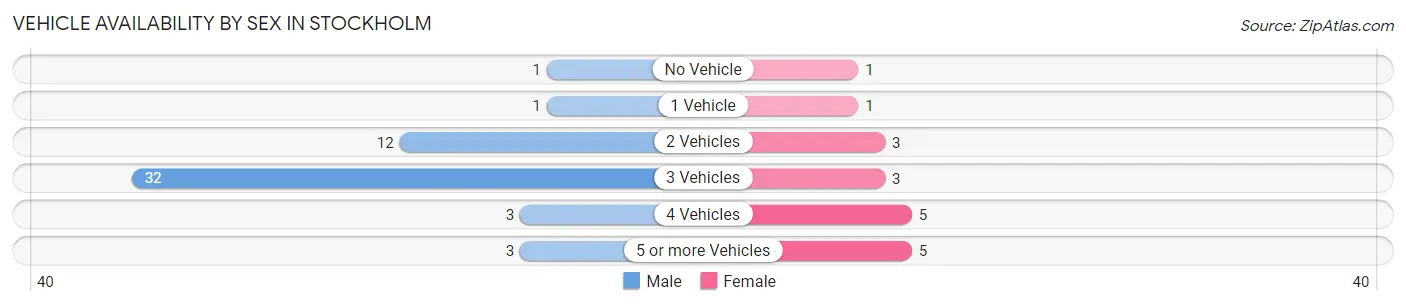
| Vehicles Available | Male | Female |
| No Vehicle | 1 (1.9%) | 1 (5.6%) |
| 1 Vehicle | 1 (1.9%) | 1 (5.6%) |
| 2 Vehicles | 12 (23.1%) | 3 (16.7%) |
| 3 Vehicles | 32 (61.5%) | 3 (16.7%) |
| 4 Vehicles | 3 (5.8%) | 5 (27.8%) |
| 5 or more Vehicles | 3 (5.8%) | 5 (27.8%) |
| Total | 52 (100.0%) | 18 (100.0%) |
Commute Time in Stockholm
The most frequently occuring commute durations in Stockholm are 30 to 34 minutes (22 commuters, 32.4%), 15 to 19 minutes (18 commuters, 26.5%), and 20 to 24 minutes (9 commuters, 13.2%).
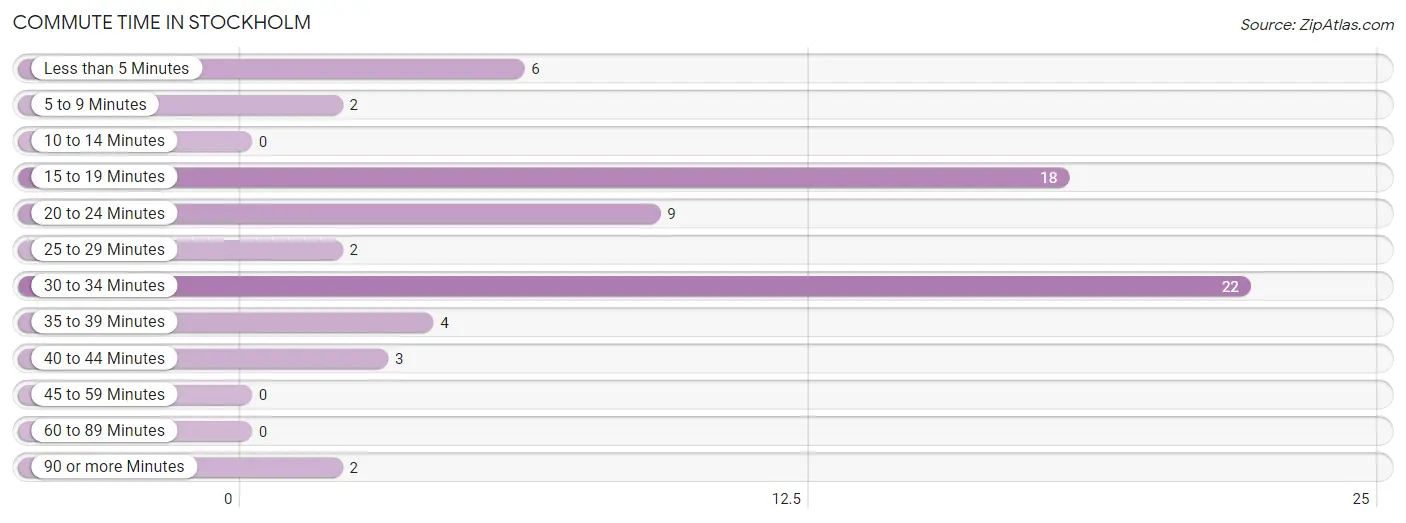
| Commute Time | # Commuters | % Commuters |
| Less than 5 Minutes | 6 | 8.8% |
| 5 to 9 Minutes | 2 | 2.9% |
| 10 to 14 Minutes | 0 | 0.0% |
| 15 to 19 Minutes | 18 | 26.5% |
| 20 to 24 Minutes | 9 | 13.2% |
| 25 to 29 Minutes | 2 | 2.9% |
| 30 to 34 Minutes | 22 | 32.4% |
| 35 to 39 Minutes | 4 | 5.9% |
| 40 to 44 Minutes | 3 | 4.4% |
| 45 to 59 Minutes | 0 | 0.0% |
| 60 to 89 Minutes | 0 | 0.0% |
| 90 or more Minutes | 2 | 2.9% |
Commute Time by Sex in Stockholm
The most common commute times in Stockholm are 30 to 34 minutes (22 commuters, 42.3%) for males and 20 to 24 minutes (6 commuters, 37.5%) for females.
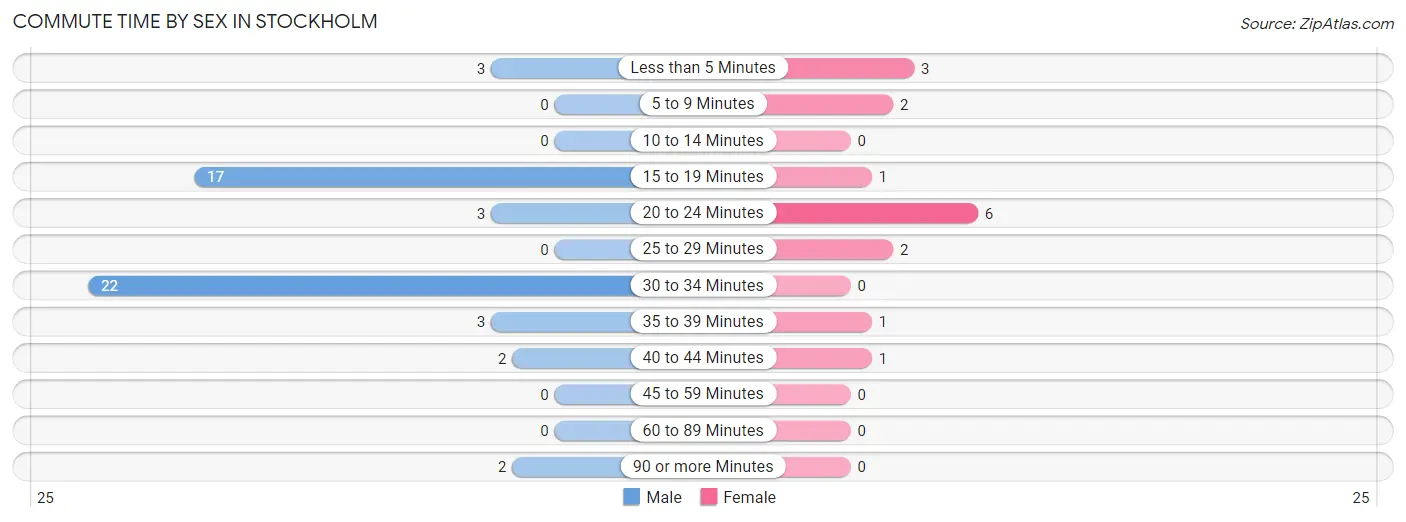
| Commute Time | Male | Female |
| Less than 5 Minutes | 3 (5.8%) | 3 (18.8%) |
| 5 to 9 Minutes | 0 (0.0%) | 2 (12.5%) |
| 10 to 14 Minutes | 0 (0.0%) | 0 (0.0%) |
| 15 to 19 Minutes | 17 (32.7%) | 1 (6.2%) |
| 20 to 24 Minutes | 3 (5.8%) | 6 (37.5%) |
| 25 to 29 Minutes | 0 (0.0%) | 2 (12.5%) |
| 30 to 34 Minutes | 22 (42.3%) | 0 (0.0%) |
| 35 to 39 Minutes | 3 (5.8%) | 1 (6.2%) |
| 40 to 44 Minutes | 2 (3.8%) | 1 (6.2%) |
| 45 to 59 Minutes | 0 (0.0%) | 0 (0.0%) |
| 60 to 89 Minutes | 0 (0.0%) | 0 (0.0%) |
| 90 or more Minutes | 2 (3.8%) | 0 (0.0%) |
Time of Departure to Work by Sex in Stockholm
The most frequent times of departure to work in Stockholm are 5:30 AM to 5:59 AM (17, 32.7%) for males and 7:00 AM to 7:29 AM (6, 37.5%) for females.
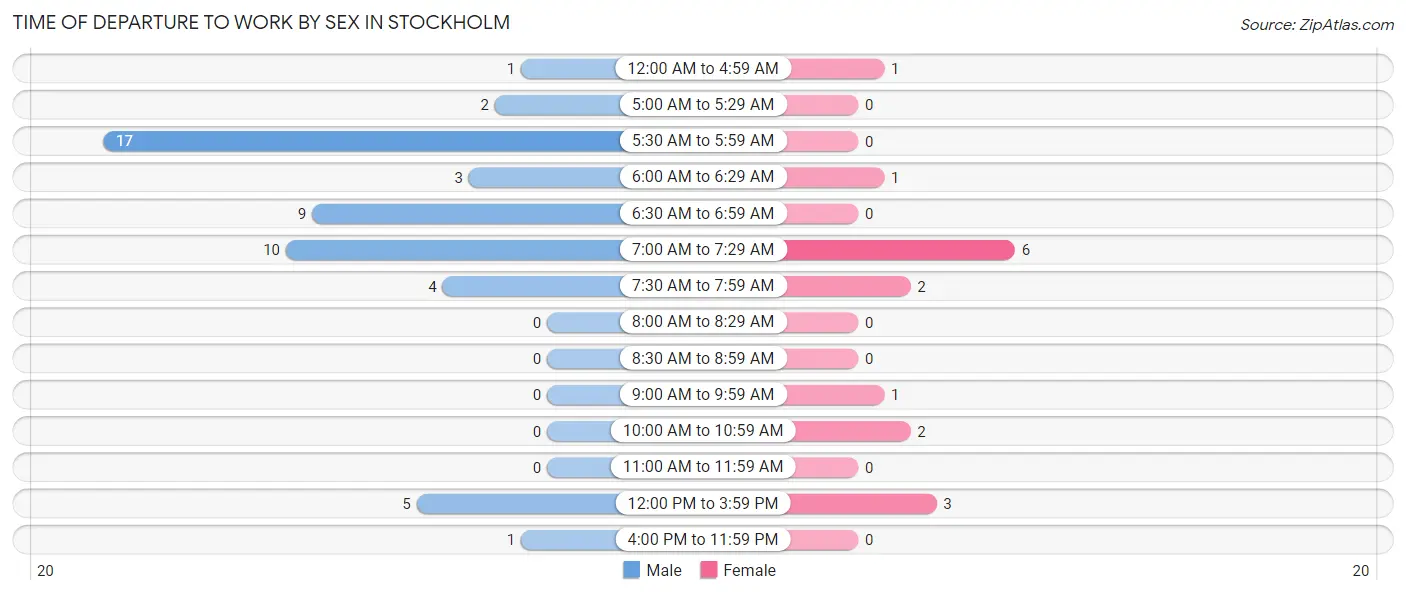
| Time of Departure | Male | Female |
| 12:00 AM to 4:59 AM | 1 (1.9%) | 1 (6.2%) |
| 5:00 AM to 5:29 AM | 2 (3.8%) | 0 (0.0%) |
| 5:30 AM to 5:59 AM | 17 (32.7%) | 0 (0.0%) |
| 6:00 AM to 6:29 AM | 3 (5.8%) | 1 (6.2%) |
| 6:30 AM to 6:59 AM | 9 (17.3%) | 0 (0.0%) |
| 7:00 AM to 7:29 AM | 10 (19.2%) | 6 (37.5%) |
| 7:30 AM to 7:59 AM | 4 (7.7%) | 2 (12.5%) |
| 8:00 AM to 8:29 AM | 0 (0.0%) | 0 (0.0%) |
| 8:30 AM to 8:59 AM | 0 (0.0%) | 0 (0.0%) |
| 9:00 AM to 9:59 AM | 0 (0.0%) | 1 (6.2%) |
| 10:00 AM to 10:59 AM | 0 (0.0%) | 2 (12.5%) |
| 11:00 AM to 11:59 AM | 0 (0.0%) | 0 (0.0%) |
| 12:00 PM to 3:59 PM | 5 (9.6%) | 3 (18.8%) |
| 4:00 PM to 11:59 PM | 1 (1.9%) | 0 (0.0%) |
| Total | 52 (100.0%) | 16 (100.0%) |
Housing Occupancy in Stockholm
Occupancy by Ownership in Stockholm
Of the total 53 dwellings in Stockholm, owner-occupied units account for 40 (75.5%), while renter-occupied units make up 13 (24.5%).
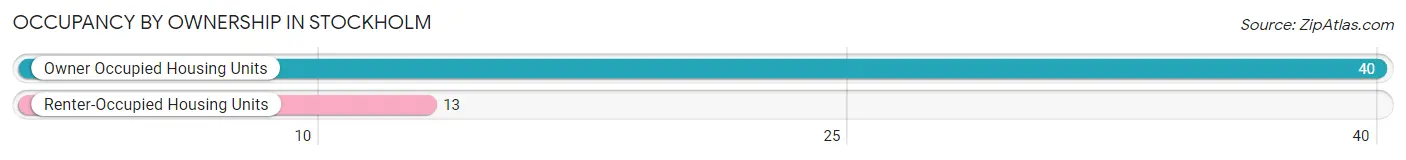
| Occupancy | # Housing Units | % Housing Units |
| Owner Occupied Housing Units | 40 | 75.5% |
| Renter-Occupied Housing Units | 13 | 24.5% |
| Total Occupied Housing Units | 53 | 100.0% |
Occupancy by Household Size in Stockholm
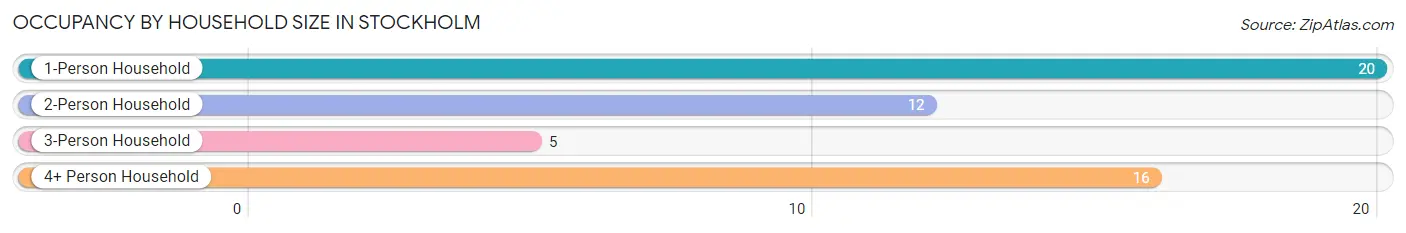
| Household Size | # Housing Units | % Housing Units |
| 1-Person Household | 20 | 37.7% |
| 2-Person Household | 12 | 22.6% |
| 3-Person Household | 5 | 9.4% |
| 4+ Person Household | 16 | 30.2% |
| Total Housing Units | 53 | 100.0% |
Occupancy by Ownership by Household Size in Stockholm
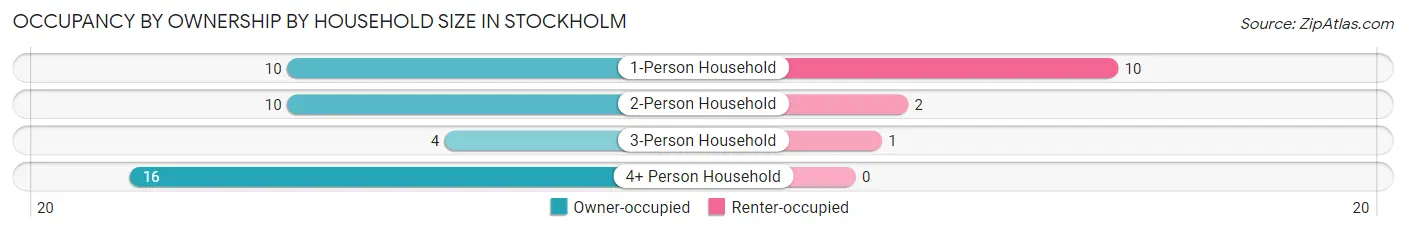
| Household Size | Owner-occupied | Renter-occupied |
| 1-Person Household | 10 (50.0%) | 10 (50.0%) |
| 2-Person Household | 10 (83.3%) | 2 (16.7%) |
| 3-Person Household | 4 (80.0%) | 1 (20.0%) |
| 4+ Person Household | 16 (100.0%) | 0 (0.0%) |
| Total Housing Units | 40 (75.5%) | 13 (24.5%) |
Occupancy by Educational Attainment in Stockholm
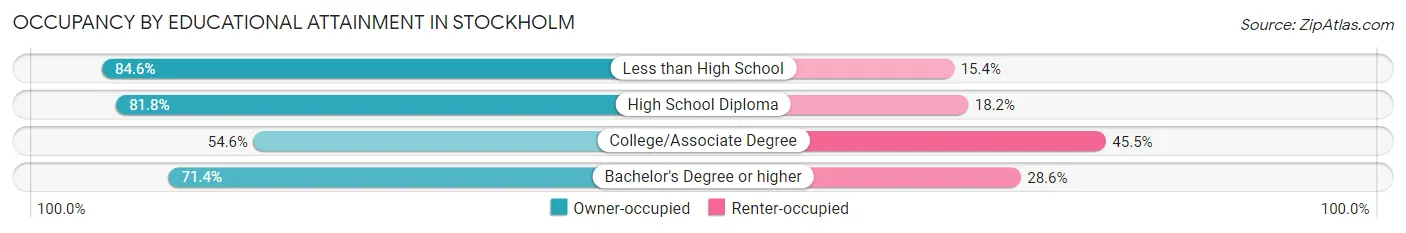
| Household Size | Owner-occupied | Renter-occupied |
| Less than High School | 11 (84.6%) | 2 (15.4%) |
| High School Diploma | 18 (81.8%) | 4 (18.2%) |
| College/Associate Degree | 6 (54.5%) | 5 (45.5%) |
| Bachelor's Degree or higher | 5 (71.4%) | 2 (28.6%) |
Occupancy by Age of Householder in Stockholm
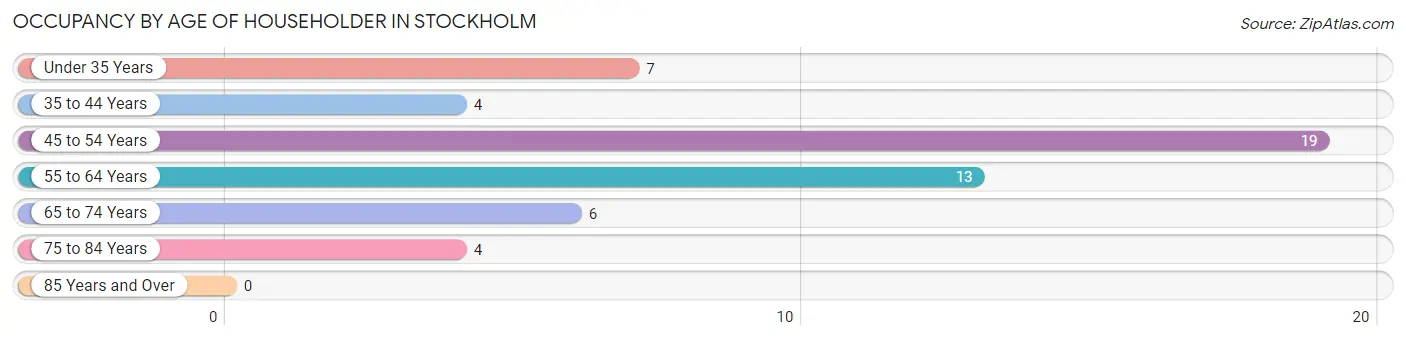
| Age Bracket | # Households | % Households |
| Under 35 Years | 7 | 13.2% |
| 35 to 44 Years | 4 | 7.5% |
| 45 to 54 Years | 19 | 35.8% |
| 55 to 64 Years | 13 | 24.5% |
| 65 to 74 Years | 6 | 11.3% |
| 75 to 84 Years | 4 | 7.5% |
| 85 Years and Over | 0 | 0.0% |
| Total | 53 | 100.0% |
Housing Finances in Stockholm
Median Income by Occupancy in Stockholm
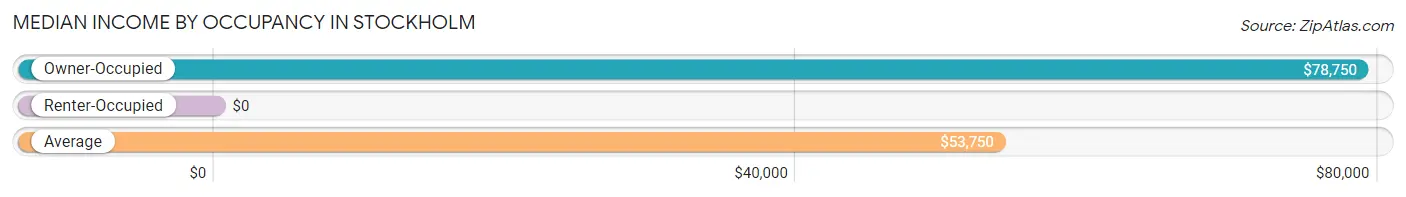
| Occupancy Type | # Households | Median Income |
| Owner-Occupied | 40 (75.5%) | $78,750 |
| Renter-Occupied | 13 (24.5%) | $0 |
| Average | 53 (100.0%) | $53,750 |
Occupancy by Householder Income Bracket in Stockholm
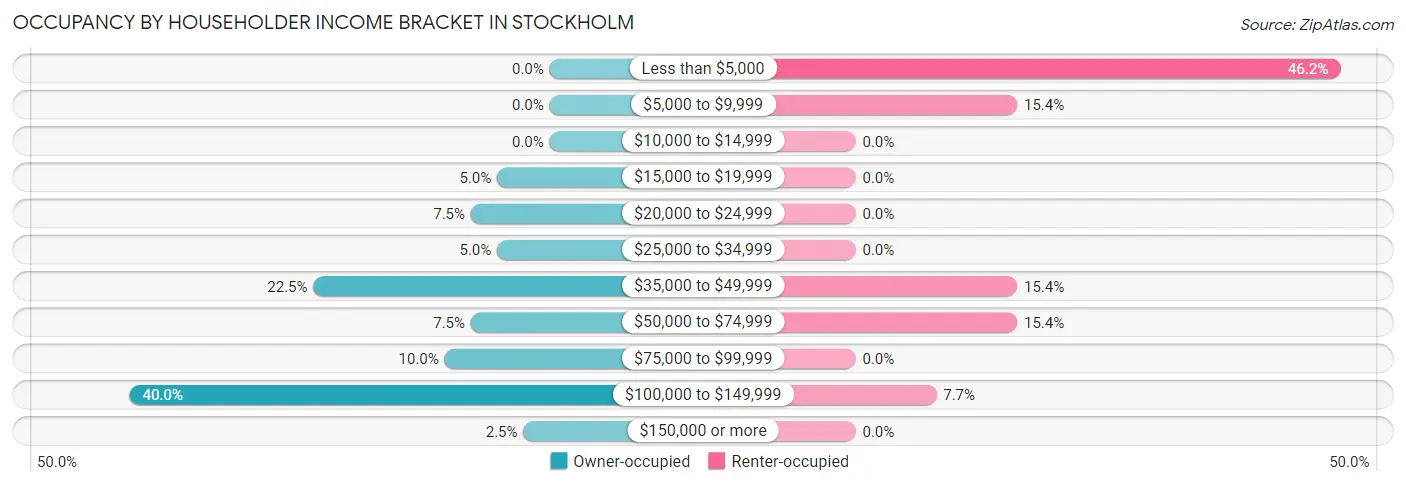
| Income Bracket | Owner-occupied | Renter-occupied |
| Less than $5,000 | 0 (0.0%) | 6 (46.2%) |
| $5,000 to $9,999 | 0 (0.0%) | 2 (15.4%) |
| $10,000 to $14,999 | 0 (0.0%) | 0 (0.0%) |
| $15,000 to $19,999 | 2 (5.0%) | 0 (0.0%) |
| $20,000 to $24,999 | 3 (7.5%) | 0 (0.0%) |
| $25,000 to $34,999 | 2 (5.0%) | 0 (0.0%) |
| $35,000 to $49,999 | 9 (22.5%) | 2 (15.4%) |
| $50,000 to $74,999 | 3 (7.5%) | 2 (15.4%) |
| $75,000 to $99,999 | 4 (10.0%) | 0 (0.0%) |
| $100,000 to $149,999 | 16 (40.0%) | 1 (7.7%) |
| $150,000 or more | 1 (2.5%) | 0 (0.0%) |
| Total | 40 (100.0%) | 13 (100.0%) |
Monthly Housing Cost Tiers in Stockholm

| Monthly Cost | Owner-occupied | Renter-occupied |
| Less than $300 | 4 (10.0%) | 2 (15.4%) |
| $300 to $499 | 13 (32.5%) | 4 (30.8%) |
| $500 to $799 | 3 (7.5%) | 3 (23.1%) |
| $800 to $999 | 13 (32.5%) | 0 (0.0%) |
| $1,000 to $1,499 | 4 (10.0%) | 0 (0.0%) |
| $1,500 to $1,999 | 2 (5.0%) | 0 (0.0%) |
| $2,000 to $2,499 | 1 (2.5%) | 0 (0.0%) |
| $2,500 to $2,999 | 0 (0.0%) | 0 (0.0%) |
| $3,000 or more | 0 (0.0%) | 0 (0.0%) |
| Total | 40 (100.0%) | 13 (100.0%) |
Physical Housing Characteristics in Stockholm
Housing Structures in Stockholm
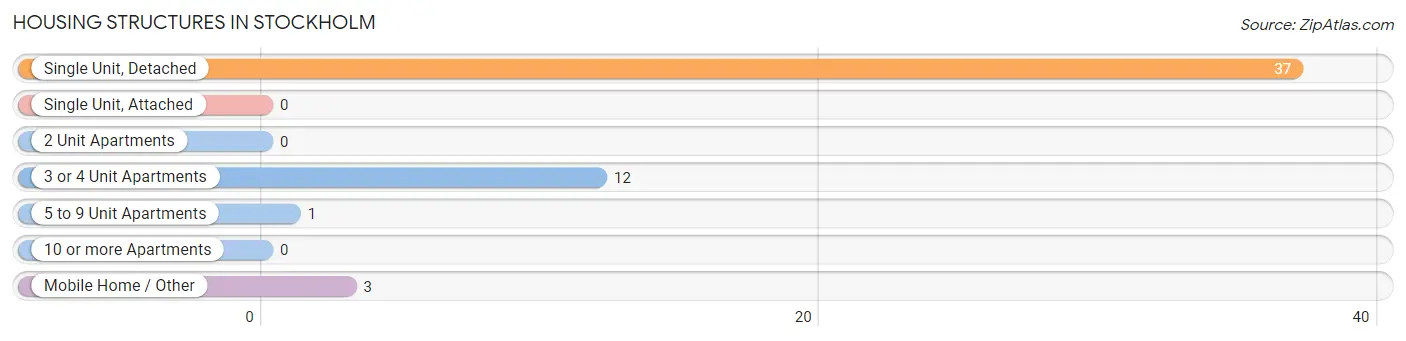
| Structure Type | # Housing Units | % Housing Units |
| Single Unit, Detached | 37 | 69.8% |
| Single Unit, Attached | 0 | 0.0% |
| 2 Unit Apartments | 0 | 0.0% |
| 3 or 4 Unit Apartments | 12 | 22.6% |
| 5 to 9 Unit Apartments | 1 | 1.9% |
| 10 or more Apartments | 0 | 0.0% |
| Mobile Home / Other | 3 | 5.7% |
| Total | 53 | 100.0% |
Housing Structures by Occupancy in Stockholm
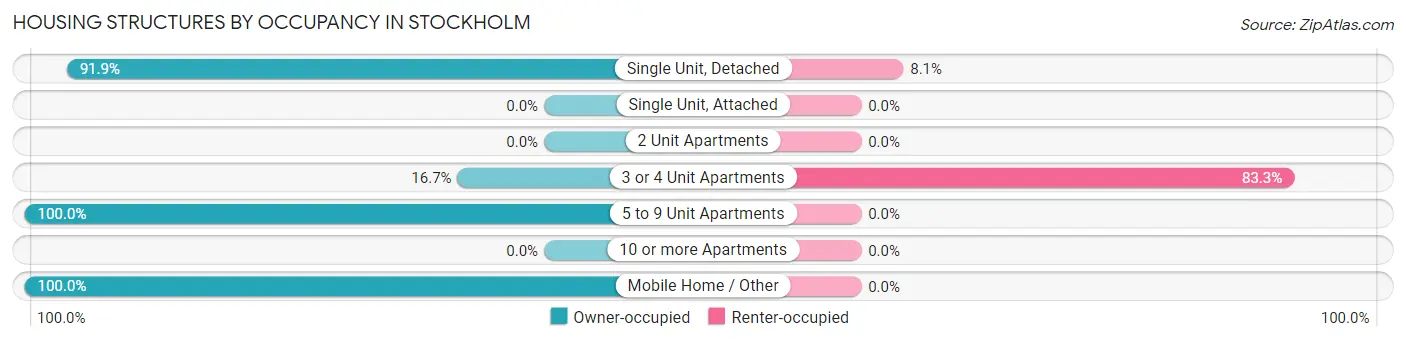
| Structure Type | Owner-occupied | Renter-occupied |
| Single Unit, Detached | 34 (91.9%) | 3 (8.1%) |
| Single Unit, Attached | 0 (0.0%) | 0 (0.0%) |
| 2 Unit Apartments | 0 (0.0%) | 0 (0.0%) |
| 3 or 4 Unit Apartments | 2 (16.7%) | 10 (83.3%) |
| 5 to 9 Unit Apartments | 1 (100.0%) | 0 (0.0%) |
| 10 or more Apartments | 0 (0.0%) | 0 (0.0%) |
| Mobile Home / Other | 3 (100.0%) | 0 (0.0%) |
| Total | 40 (75.5%) | 13 (24.5%) |
Housing Structures by Number of Rooms in Stockholm
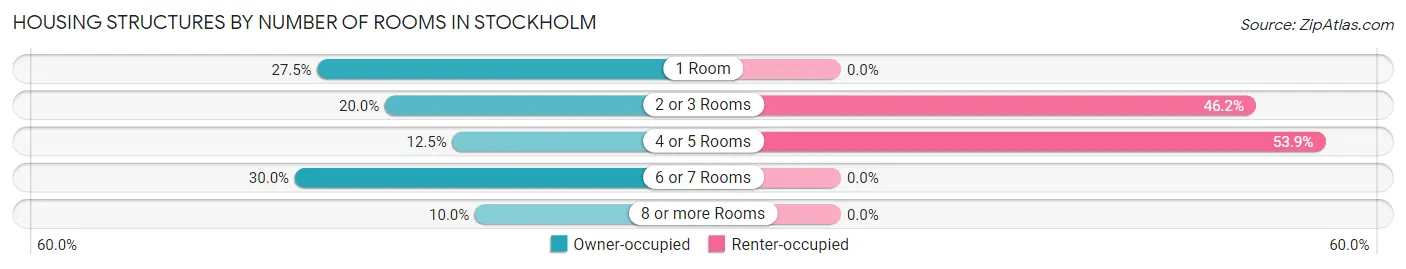
| Number of Rooms | Owner-occupied | Renter-occupied |
| 1 Room | 11 (27.5%) | 0 (0.0%) |
| 2 or 3 Rooms | 8 (20.0%) | 6 (46.2%) |
| 4 or 5 Rooms | 5 (12.5%) | 7 (53.8%) |
| 6 or 7 Rooms | 12 (30.0%) | 0 (0.0%) |
| 8 or more Rooms | 4 (10.0%) | 0 (0.0%) |
| Total | 40 (100.0%) | 13 (100.0%) |
Housing Structure by Heating Type in Stockholm
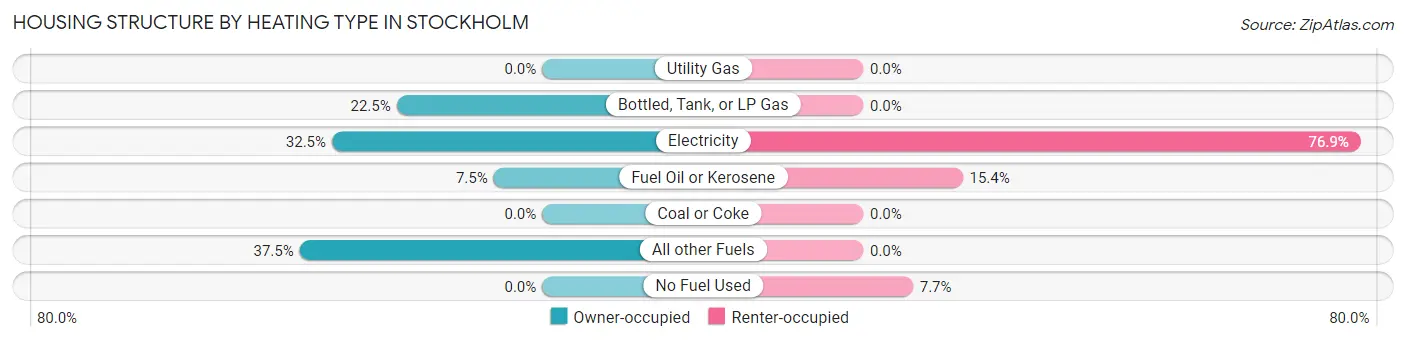
| Heating Type | Owner-occupied | Renter-occupied |
| Utility Gas | 0 (0.0%) | 0 (0.0%) |
| Bottled, Tank, or LP Gas | 9 (22.5%) | 0 (0.0%) |
| Electricity | 13 (32.5%) | 10 (76.9%) |
| Fuel Oil or Kerosene | 3 (7.5%) | 2 (15.4%) |
| Coal or Coke | 0 (0.0%) | 0 (0.0%) |
| All other Fuels | 15 (37.5%) | 0 (0.0%) |
| No Fuel Used | 0 (0.0%) | 1 (7.7%) |
| Total | 40 (100.0%) | 13 (100.0%) |
Household Vehicle Usage in Stockholm
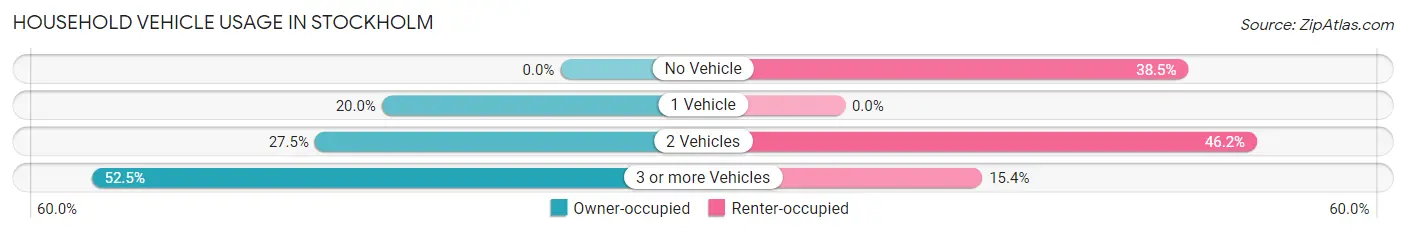
| Vehicles per Household | Owner-occupied | Renter-occupied |
| No Vehicle | 0 (0.0%) | 5 (38.5%) |
| 1 Vehicle | 8 (20.0%) | 0 (0.0%) |
| 2 Vehicles | 11 (27.5%) | 6 (46.2%) |
| 3 or more Vehicles | 21 (52.5%) | 2 (15.4%) |
| Total | 40 (100.0%) | 13 (100.0%) |
Real Estate & Mortgages in Stockholm
Real Estate and Mortgage Overview in Stockholm
| Characteristic | Without Mortgage | With Mortgage |
| Housing Units | 20 | 20 |
| Median Property Value | - | - |
| Median Household Income | $39,000 | $1 |
| Monthly Housing Costs | $430 | $0 |
| Real Estate Taxes | - | - |
Property Value by Mortgage Status in Stockholm
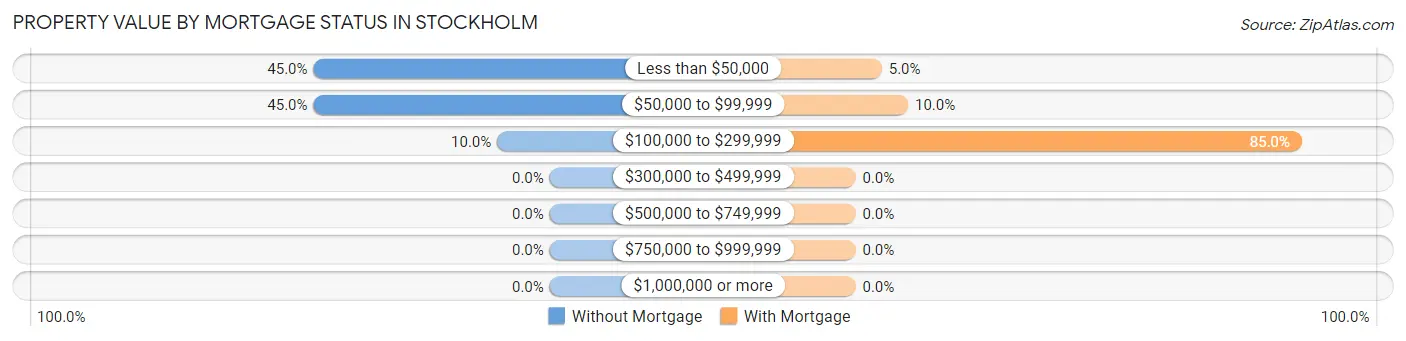
| Property Value | Without Mortgage | With Mortgage |
| Less than $50,000 | 9 (45.0%) | 1 (5.0%) |
| $50,000 to $99,999 | 9 (45.0%) | 2 (10.0%) |
| $100,000 to $299,999 | 2 (10.0%) | 17 (85.0%) |
| $300,000 to $499,999 | 0 (0.0%) | 0 (0.0%) |
| $500,000 to $749,999 | 0 (0.0%) | 0 (0.0%) |
| $750,000 to $999,999 | 0 (0.0%) | 0 (0.0%) |
| $1,000,000 or more | 0 (0.0%) | 0 (0.0%) |
| Total | 20 (100.0%) | 20 (100.0%) |
Household Income by Mortgage Status in Stockholm
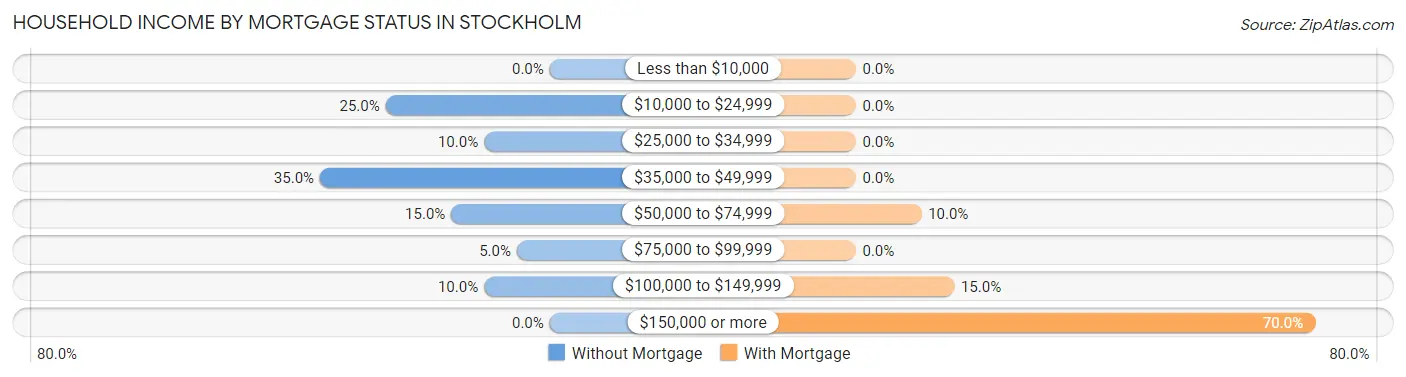
| Household Income | Without Mortgage | With Mortgage |
| Less than $10,000 | 0 (0.0%) | 0 (0.0%) |
| $10,000 to $24,999 | 5 (25.0%) | 0 (0.0%) |
| $25,000 to $34,999 | 2 (10.0%) | 0 (0.0%) |
| $35,000 to $49,999 | 7 (35.0%) | 0 (0.0%) |
| $50,000 to $74,999 | 3 (15.0%) | 2 (10.0%) |
| $75,000 to $99,999 | 1 (5.0%) | 0 (0.0%) |
| $100,000 to $149,999 | 2 (10.0%) | 3 (15.0%) |
| $150,000 or more | 0 (0.0%) | 14 (70.0%) |
| Total | 20 (100.0%) | 20 (100.0%) |
Property Value to Household Income Ratio in Stockholm
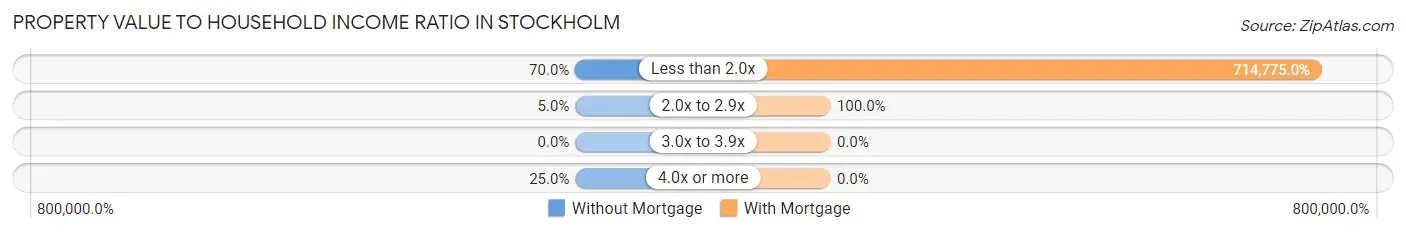
| Value-to-Income Ratio | Without Mortgage | With Mortgage |
| Less than 2.0x | 14 (70.0%) | 142,955 (714,775.0%) |
| 2.0x to 2.9x | 1 (5.0%) | 20 (100.0%) |
| 3.0x to 3.9x | 0 (0.0%) | 0 (0.0%) |
| 4.0x or more | 5 (25.0%) | 0 (0.0%) |
| Total | 20 (100.0%) | 20 (100.0%) |
Real Estate Taxes by Mortgage Status in Stockholm
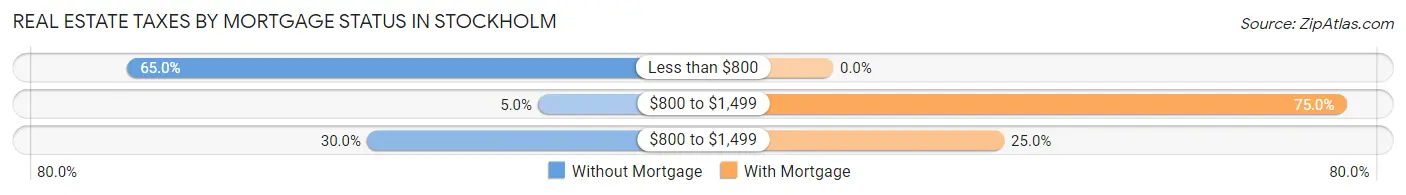
| Property Taxes | Without Mortgage | With Mortgage |
| Less than $800 | 13 (65.0%) | 0 (0.0%) |
| $800 to $1,499 | 1 (5.0%) | 15 (75.0%) |
| $800 to $1,499 | 6 (30.0%) | 5 (25.0%) |
| Total | 20 (100.0%) | 20 (100.0%) |
Health & Disability in Stockholm
Health Insurance Coverage by Age in Stockholm
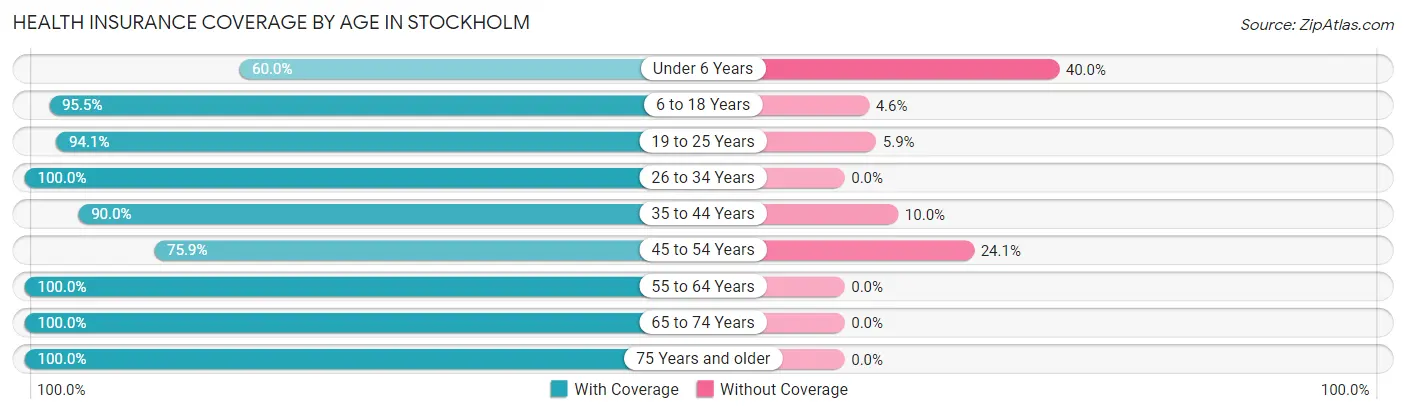
| Age Bracket | With Coverage | Without Coverage |
| Under 6 Years | 3 (60.0%) | 2 (40.0%) |
| 6 to 18 Years | 21 (95.5%) | 1 (4.5%) |
| 19 to 25 Years | 16 (94.1%) | 1 (5.9%) |
| 26 to 34 Years | 14 (100.0%) | 0 (0.0%) |
| 35 to 44 Years | 9 (90.0%) | 1 (10.0%) |
| 45 to 54 Years | 22 (75.9%) | 7 (24.1%) |
| 55 to 64 Years | 16 (100.0%) | 0 (0.0%) |
| 65 to 74 Years | 7 (100.0%) | 0 (0.0%) |
| 75 Years and older | 4 (100.0%) | 0 (0.0%) |
| Total | 112 (90.3%) | 12 (9.7%) |
Health Insurance Coverage by Citizenship Status in Stockholm
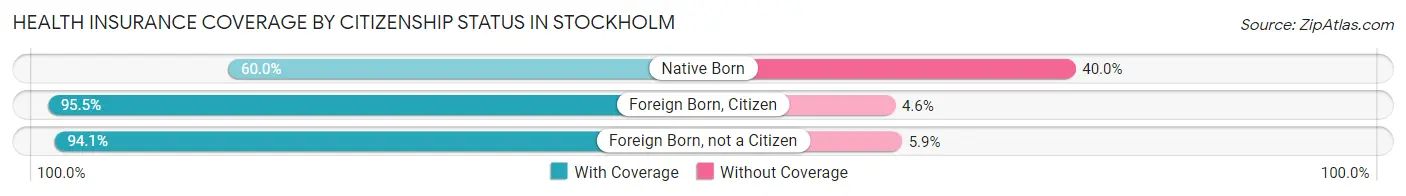
| Citizenship Status | With Coverage | Without Coverage |
| Native Born | 3 (60.0%) | 2 (40.0%) |
| Foreign Born, Citizen | 21 (95.5%) | 1 (4.5%) |
| Foreign Born, not a Citizen | 16 (94.1%) | 1 (5.9%) |
Health Insurance Coverage by Household Income in Stockholm
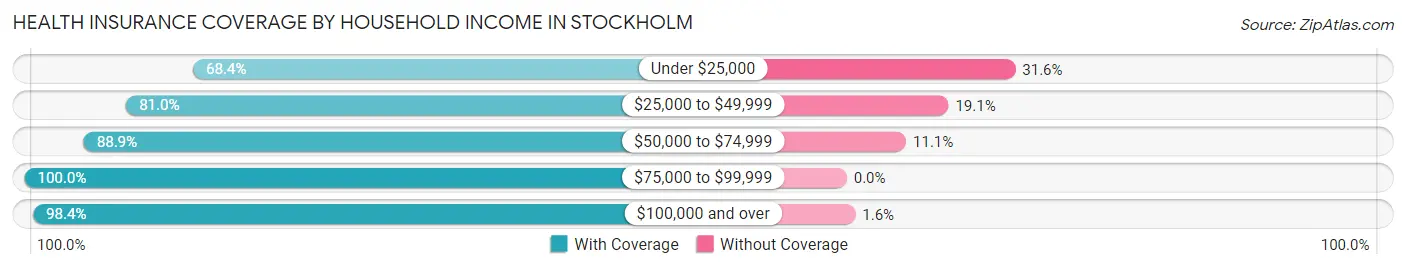
| Household Income | With Coverage | Without Coverage |
| Under $25,000 | 13 (68.4%) | 6 (31.6%) |
| $25,000 to $49,999 | 17 (80.9%) | 4 (19.1%) |
| $50,000 to $74,999 | 8 (88.9%) | 1 (11.1%) |
| $75,000 to $99,999 | 13 (100.0%) | 0 (0.0%) |
| $100,000 and over | 61 (98.4%) | 1 (1.6%) |
Public vs Private Health Insurance Coverage by Age in Stockholm
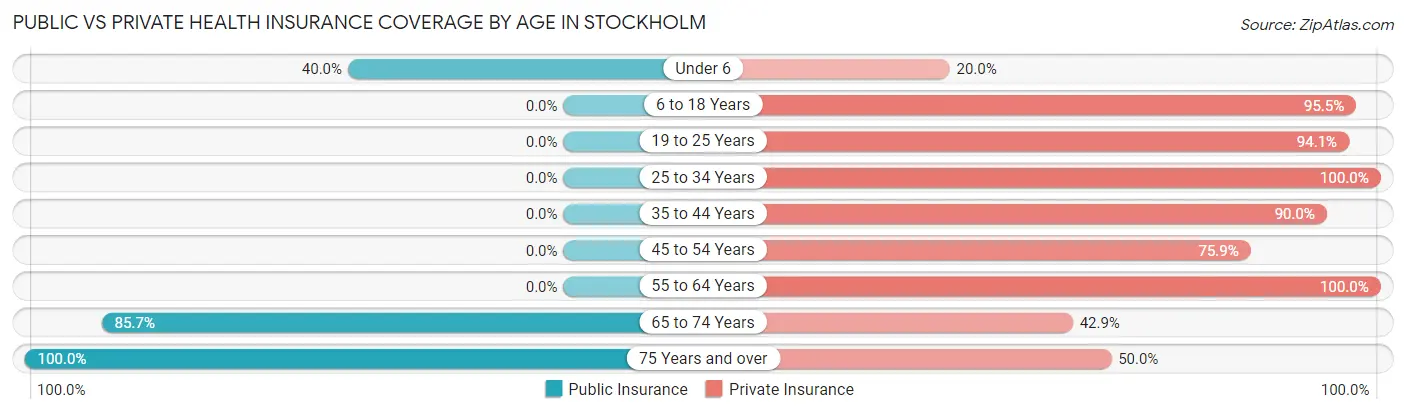
| Age Bracket | Public Insurance | Private Insurance |
| Under 6 | 2 (40.0%) | 1 (20.0%) |
| 6 to 18 Years | 0 (0.0%) | 21 (95.5%) |
| 19 to 25 Years | 0 (0.0%) | 16 (94.1%) |
| 25 to 34 Years | 0 (0.0%) | 14 (100.0%) |
| 35 to 44 Years | 0 (0.0%) | 9 (90.0%) |
| 45 to 54 Years | 0 (0.0%) | 22 (75.9%) |
| 55 to 64 Years | 0 (0.0%) | 16 (100.0%) |
| 65 to 74 Years | 6 (85.7%) | 3 (42.9%) |
| 75 Years and over | 4 (100.0%) | 2 (50.0%) |
| Total | 12 (9.7%) | 104 (83.9%) |
Disability Status by Sex by Age in Stockholm
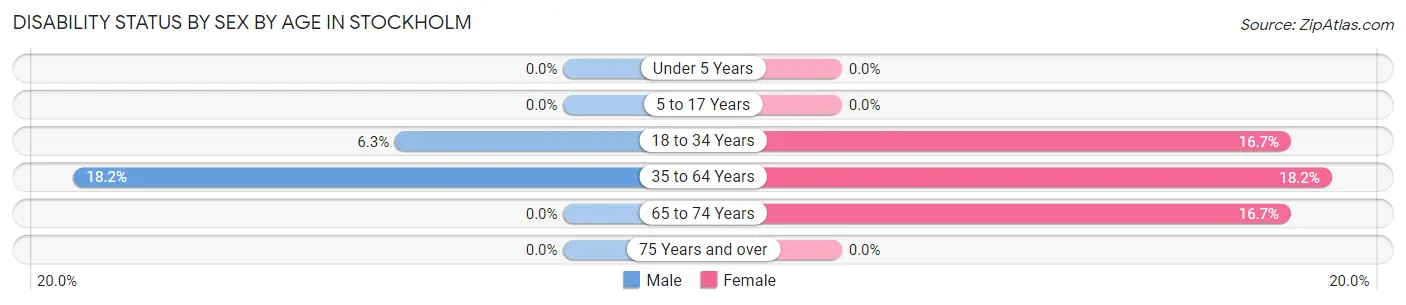
| Age Bracket | Male | Female |
| Under 5 Years | 0 (0.0%) | 0 (0.0%) |
| 5 to 17 Years | 0 (0.0%) | 0 (0.0%) |
| 18 to 34 Years | 2 (6.2%) | 1 (16.7%) |
| 35 to 64 Years | 6 (18.2%) | 4 (18.2%) |
| 65 to 74 Years | 0 (0.0%) | 1 (16.7%) |
| 75 Years and over | 0 (0.0%) | 0 (0.0%) |
Disability Class by Sex by Age in Stockholm
Disability Class: Hearing Difficulty
| Age Bracket | Male | Female |
| Under 5 Years | 0 (0.0%) | 0 (0.0%) |
| 5 to 17 Years | 0 (0.0%) | 0 (0.0%) |
| 18 to 34 Years | 0 (0.0%) | 0 (0.0%) |
| 35 to 64 Years | 0 (0.0%) | 0 (0.0%) |
| 65 to 74 Years | 0 (0.0%) | 0 (0.0%) |
| 75 Years and over | 0 (0.0%) | 0 (0.0%) |
Disability Class: Vision Difficulty
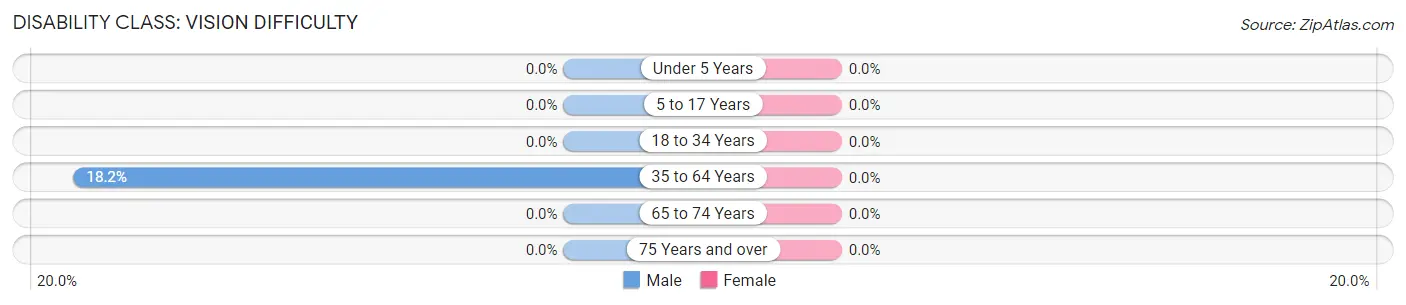
| Age Bracket | Male | Female |
| Under 5 Years | 0 (0.0%) | 0 (0.0%) |
| 5 to 17 Years | 0 (0.0%) | 0 (0.0%) |
| 18 to 34 Years | 0 (0.0%) | 0 (0.0%) |
| 35 to 64 Years | 6 (18.2%) | 0 (0.0%) |
| 65 to 74 Years | 0 (0.0%) | 0 (0.0%) |
| 75 Years and over | 0 (0.0%) | 0 (0.0%) |
Disability Class: Cognitive Difficulty
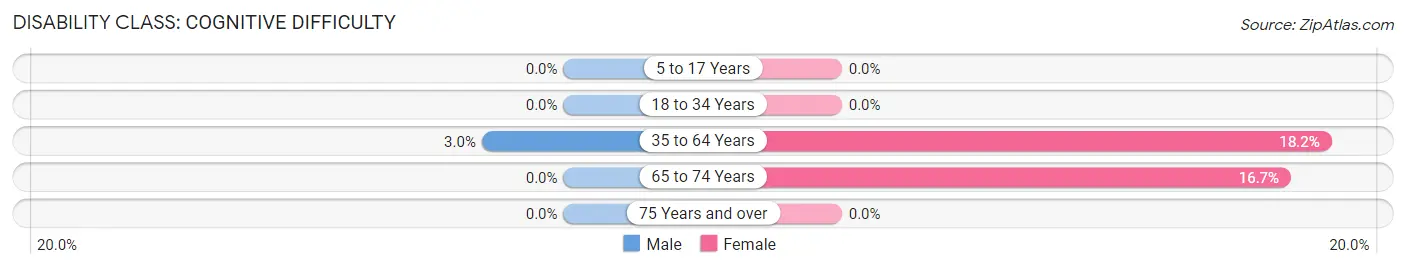
| Age Bracket | Male | Female |
| 5 to 17 Years | 0 (0.0%) | 0 (0.0%) |
| 18 to 34 Years | 0 (0.0%) | 0 (0.0%) |
| 35 to 64 Years | 1 (3.0%) | 4 (18.2%) |
| 65 to 74 Years | 0 (0.0%) | 1 (16.7%) |
| 75 Years and over | 0 (0.0%) | 0 (0.0%) |
Disability Class: Ambulatory Difficulty
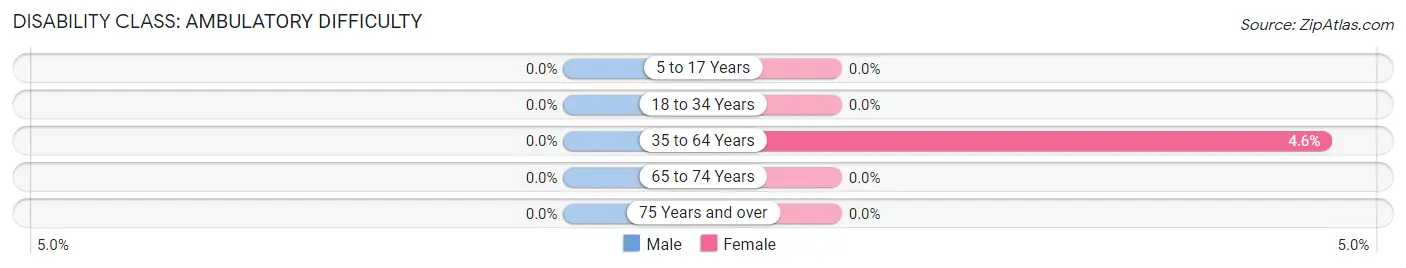
| Age Bracket | Male | Female |
| 5 to 17 Years | 0 (0.0%) | 0 (0.0%) |
| 18 to 34 Years | 0 (0.0%) | 0 (0.0%) |
| 35 to 64 Years | 0 (0.0%) | 1 (4.5%) |
| 65 to 74 Years | 0 (0.0%) | 0 (0.0%) |
| 75 Years and over | 0 (0.0%) | 0 (0.0%) |
Disability Class: Self-Care Difficulty
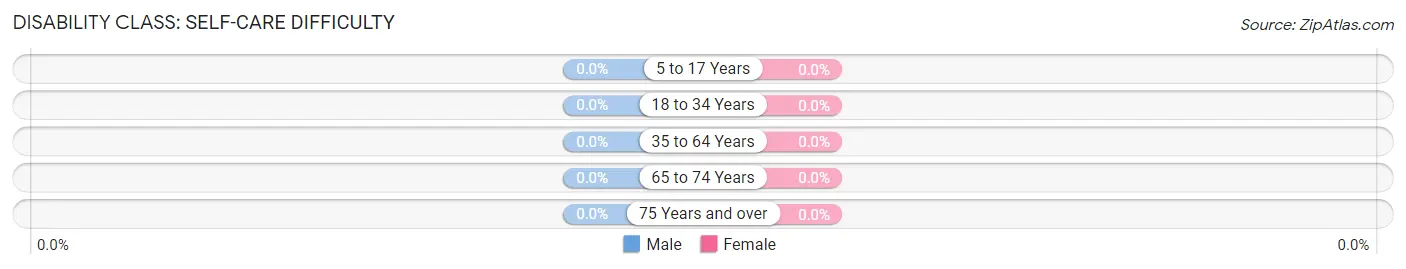
| Age Bracket | Male | Female |
| 5 to 17 Years | 0 (0.0%) | 0 (0.0%) |
| 18 to 34 Years | 0 (0.0%) | 0 (0.0%) |
| 35 to 64 Years | 0 (0.0%) | 0 (0.0%) |
| 65 to 74 Years | 0 (0.0%) | 0 (0.0%) |
| 75 Years and over | 0 (0.0%) | 0 (0.0%) |
Technology Access in Stockholm
Computing Device Access in Stockholm
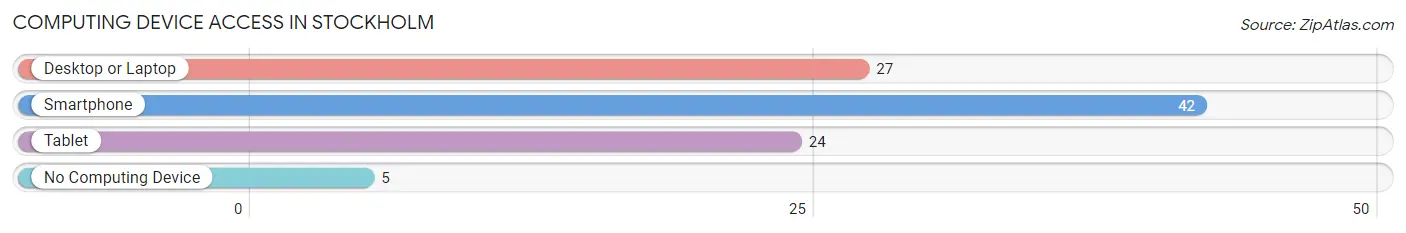
| Device Type | # Households | % Households |
| Desktop or Laptop | 27 | 50.9% |
| Smartphone | 42 | 79.2% |
| Tablet | 24 | 45.3% |
| No Computing Device | 5 | 9.4% |
| Total | 53 | 100.0% |
Internet Access in Stockholm
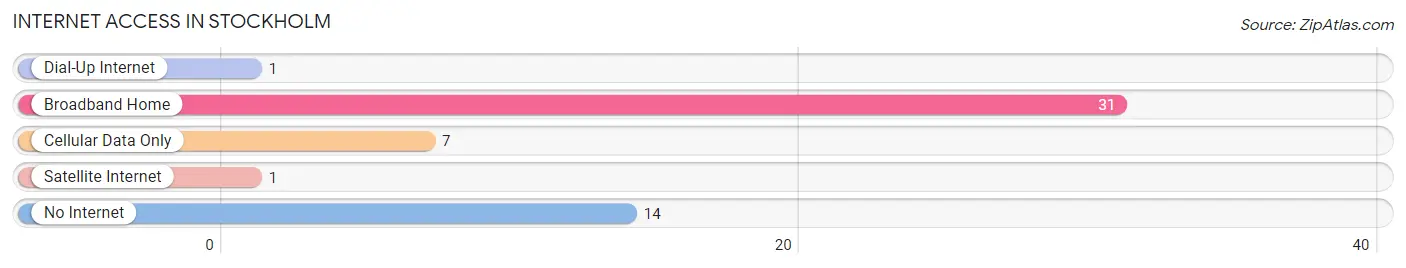
| Internet Type | # Households | % Households |
| Dial-Up Internet | 1 | 1.9% |
| Broadband Home | 31 | 58.5% |
| Cellular Data Only | 7 | 13.2% |
| Satellite Internet | 1 | 1.9% |
| No Internet | 14 | 26.4% |
| Total | 53 | 100.0% |
Stockholm Summary
Stockholm is the capital of Sweden and the most populous city in the country. It is located on the east coast of Sweden, at the mouth of Lake Mälaren, and is the cultural, media, political, and economic center of the country. Stockholm is a global city, ranked as an Alpha- world city by the Globalization and World Cities Research Network.
History
The history of Stockholm dates back to the 13th century, when it was founded by Birger Jarl, a Swedish statesman. The city was originally a small fishing village, but it quickly grew in importance and became the capital of Sweden in 1634. During the 17th century, Stockholm was a major center of trade and commerce, and it was also the site of several important battles during the Thirty Years' War.
In the 18th century, Stockholm became a major cultural center, and it was home to many of the leading figures of the Swedish Enlightenment. During this period, the city was also the site of several important scientific discoveries, including the discovery of oxygen by Carl Wilhelm Scheele.
In the 19th century, Stockholm experienced a period of rapid industrialization and population growth. The city was also the site of several important political events, including the establishment of the Swedish Social Democratic Party in 1889.
Geography
Stockholm is located on the east coast of Sweden, at the mouth of Lake Mälaren. The city is spread across 14 islands, connected by 57 bridges. The city is surrounded by forests and lakes, and it is home to several parks and green spaces.
The city has a humid continental climate, with cold winters and mild summers. The average temperature in January is -3°C (27°F), and the average temperature in July is 17°C (63°F).
Economy
Stockholm is the economic and financial center of Sweden. The city is home to many of the country’s largest companies, including Ericsson, Volvo, and Electrolux. The city is also a major center for banking and finance, and it is home to the Stockholm Stock Exchange.
The city is a major tourist destination, and it is home to many of the country’s most popular attractions, including the Vasa Museum, the Royal Palace, and the Skansen open-air museum.
Demographics
As of 2020, the population of Stockholm is estimated to be 1,973,731. The city is ethnically diverse, with the largest ethnic groups being Swedish (84.2%), Finnish (3.3%), and Middle Eastern (2.2%).
The city is also home to a large immigrant population, with the largest immigrant groups being from Iraq (2.2%), Syria (1.7%), and Somalia (1.3%).
The official language of Stockholm is Swedish, but English is widely spoken in the city. The majority of the population is Christian (76.2%), with the largest denominations being Lutheran (63.2%) and Catholic (7.2%).
Common Questions
What is Per Capita Income in Stockholm?
Per Capita income in Stockholm is $28,628.
What is the Median Family Income in Stockholm?
Median Family Income in Stockholm is $105,625.
What is the Median Household income in Stockholm?
Median Household Income in Stockholm is $53,750.
What is Income or Wage Gap in Stockholm?
Income or Wage Gap in Stockholm is 33.0%.
Women in Stockholm earn 67.0 cents for every dollar earned by a man.
What is Inequality or Gini Index in Stockholm?
Inequality or Gini Index in Stockholm is 0.43.
What is the Total Population of Stockholm?
Total Population of Stockholm is 124.
What is the Total Male Population of Stockholm?
Total Male Population of Stockholm is 72.
What is the Total Female Population of Stockholm?
Total Female Population of Stockholm is 52.
What is the Ratio of Males per 100 Females in Stockholm?
There are 138.46 Males per 100 Females in Stockholm.
What is the Ratio of Females per 100 Males in Stockholm?
There are 72.22 Females per 100 Males in Stockholm.
What is the Median Population Age in Stockholm?
Median Population Age in Stockholm is 42.0 Years.
What is the Average Family Size in Stockholm
Average Family Size in Stockholm is 3.1 People.
What is the Average Household Size in Stockholm
Average Household Size in Stockholm is 2.3 People.
How Large is the Labor Force in Stockholm?
There are 72 People in the Labor Forcein in Stockholm.
What is the Percentage of People in the Labor Force in Stockholm?
67.9% of People are in the Labor Force in Stockholm.
What is the Unemployment Rate in Stockholm?
Unemployment Rate in Stockholm is 2.8%.