Valley Springs, SD Map & Demographics
Valley Springs Map
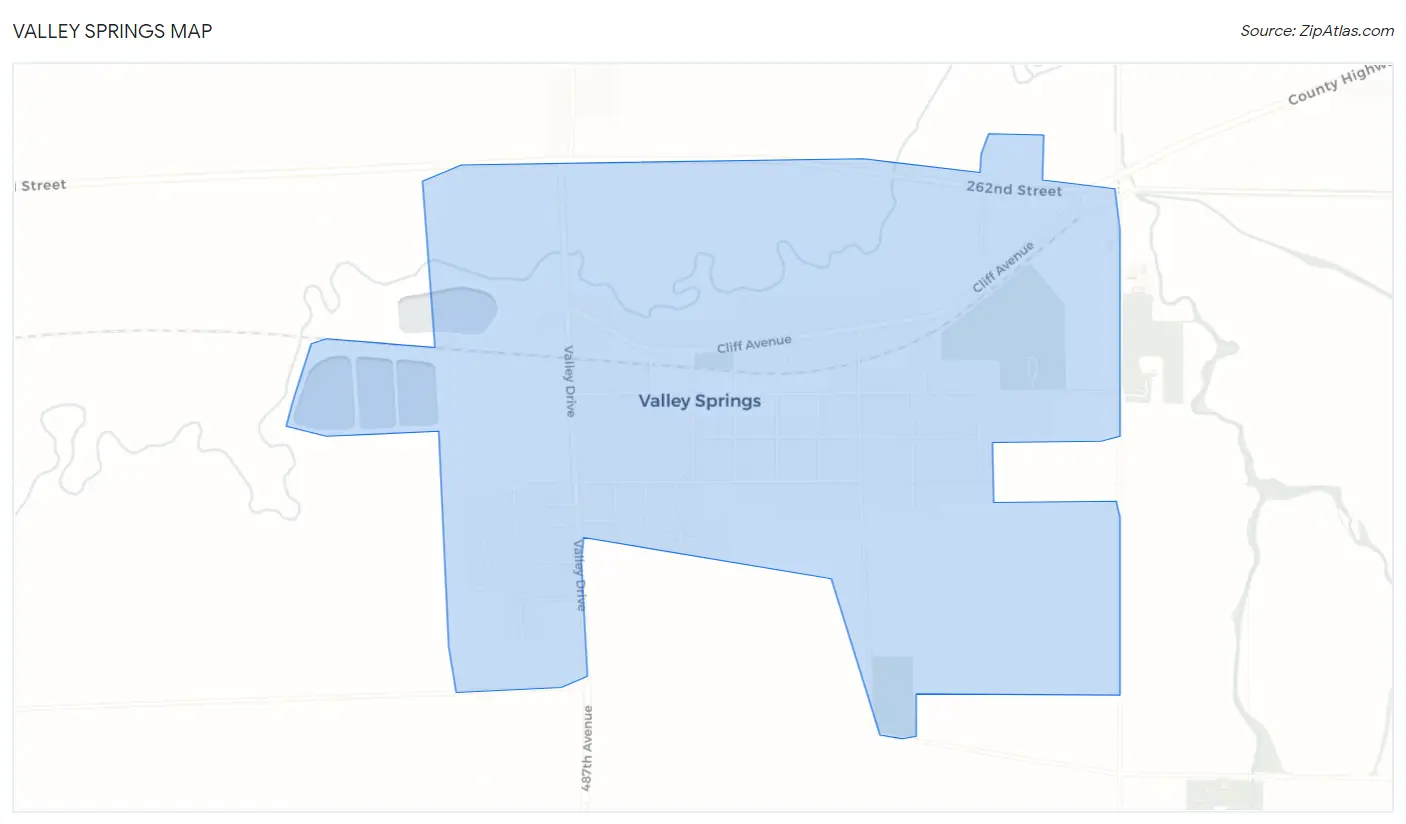
Valley Springs Overview
$40,412
PER CAPITA INCOME
$81,719
AVG FAMILY INCOME
$94,722
AVG HOUSEHOLD INCOME
22.0%
WAGE / INCOME GAP [ % ]
78.0¢/ $1
WAGE / INCOME GAP [ $ ]
0.26
INEQUALITY / GINI INDEX
963
TOTAL POPULATION
594
MALE POPULATION
369
FEMALE POPULATION
160.98
MALES / 100 FEMALES
62.12
FEMALES / 100 MALES
43.0
MEDIAN AGE
3.1
AVG FAMILY SIZE
2.9
AVG HOUSEHOLD SIZE
647
LABOR FORCE [ PEOPLE ]
84.8%
PERCENT IN LABOR FORCE
3.6%
UNEMPLOYMENT RATE
Valley Springs Zip Codes
Valley Springs Area Codes
Income in Valley Springs
Income Overview in Valley Springs
Per Capita Income in Valley Springs is $40,412, while median incomes of families and households are $81,719 and $94,722 respectively.
| Characteristic | Number | Measure |
| Per Capita Income | 963 | $40,412 |
| Median Family Income | 211 | $81,719 |
| Mean Family Income | 211 | $87,285 |
| Median Household Income | 330 | $94,722 |
| Mean Household Income | 330 | $96,858 |
| Income Deficit | 211 | $0 |
| Wage / Income Gap (%) | 963 | 21.99% |
| Wage / Income Gap ($) | 963 | 78.01¢ per $1 |
| Gini / Inequality Index | 963 | 0.26 |
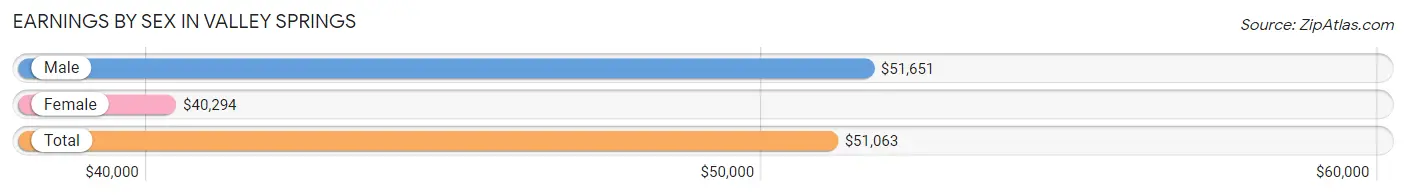
Earnings by Sex in Valley Springs
Average Earnings in Valley Springs are $51,063, $51,651 for men and $40,294 for women, a difference of 22.0%.
| Sex | Number | Average Earnings |
| Male | 454 (70.5%) | $51,651 |
| Female | 190 (29.5%) | $40,294 |
| Total | 644 (100.0%) | $51,063 |
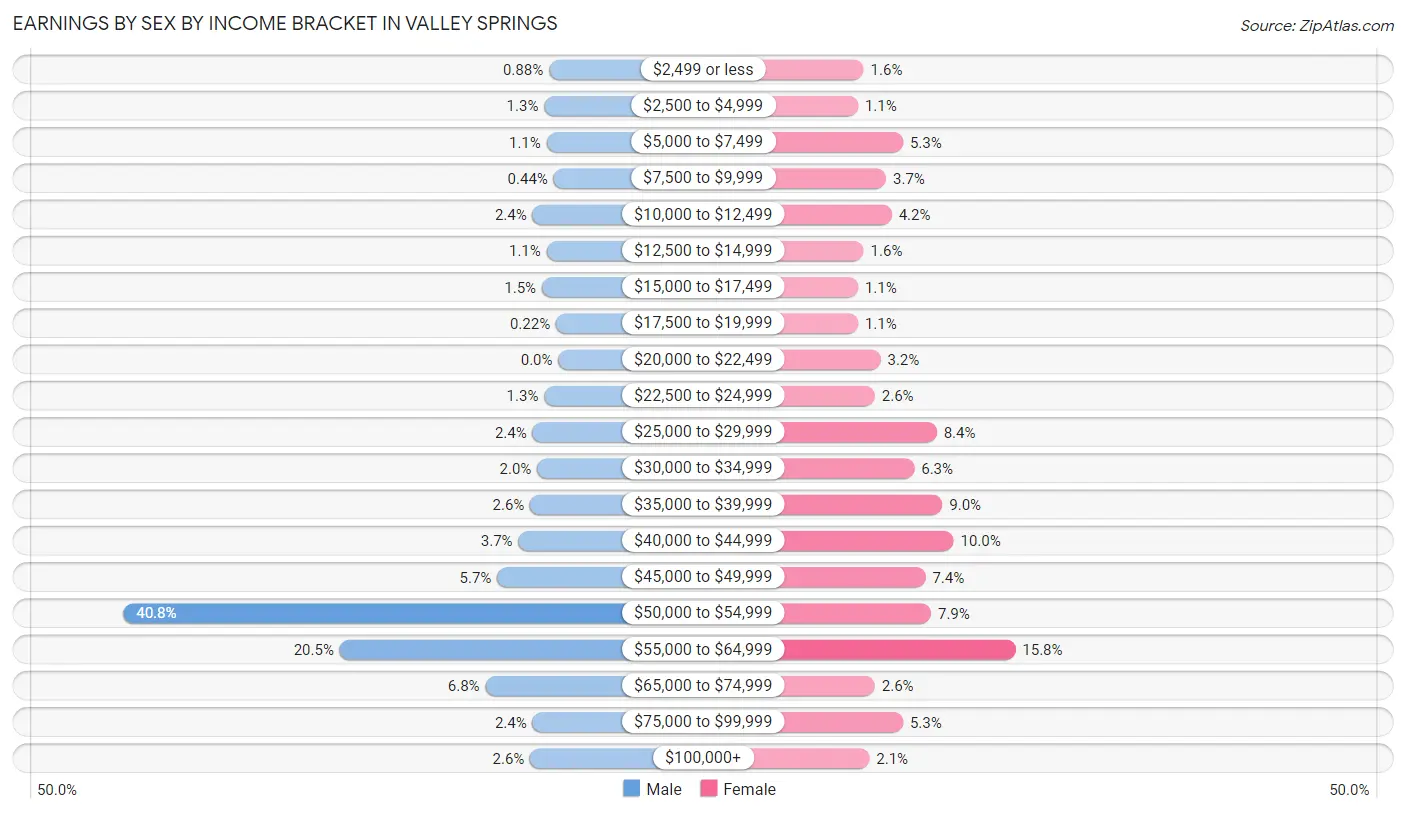
Earnings by Sex by Income Bracket in Valley Springs
The most common earnings brackets in Valley Springs are $50,000 to $54,999 for men (185 | 40.7%) and $55,000 to $64,999 for women (30 | 15.8%).
| Income | Male | Female |
| $2,499 or less | 4 (0.9%) | 3 (1.6%) |
| $2,500 to $4,999 | 6 (1.3%) | 2 (1.1%) |
| $5,000 to $7,499 | 5 (1.1%) | 10 (5.3%) |
| $7,500 to $9,999 | 2 (0.4%) | 7 (3.7%) |
| $10,000 to $12,499 | 11 (2.4%) | 8 (4.2%) |
| $12,500 to $14,999 | 5 (1.1%) | 3 (1.6%) |
| $15,000 to $17,499 | 7 (1.5%) | 2 (1.1%) |
| $17,500 to $19,999 | 1 (0.2%) | 2 (1.1%) |
| $20,000 to $22,499 | 0 (0.0%) | 6 (3.2%) |
| $22,500 to $24,999 | 6 (1.3%) | 5 (2.6%) |
| $25,000 to $29,999 | 11 (2.4%) | 16 (8.4%) |
| $30,000 to $34,999 | 9 (2.0%) | 12 (6.3%) |
| $35,000 to $39,999 | 12 (2.6%) | 17 (8.9%) |
| $40,000 to $44,999 | 17 (3.7%) | 19 (10.0%) |
| $45,000 to $49,999 | 26 (5.7%) | 14 (7.4%) |
| $50,000 to $54,999 | 185 (40.7%) | 15 (7.9%) |
| $55,000 to $64,999 | 93 (20.5%) | 30 (15.8%) |
| $65,000 to $74,999 | 31 (6.8%) | 5 (2.6%) |
| $75,000 to $99,999 | 11 (2.4%) | 10 (5.3%) |
| $100,000+ | 12 (2.6%) | 4 (2.1%) |
| Total | 454 (100.0%) | 190 (100.0%) |
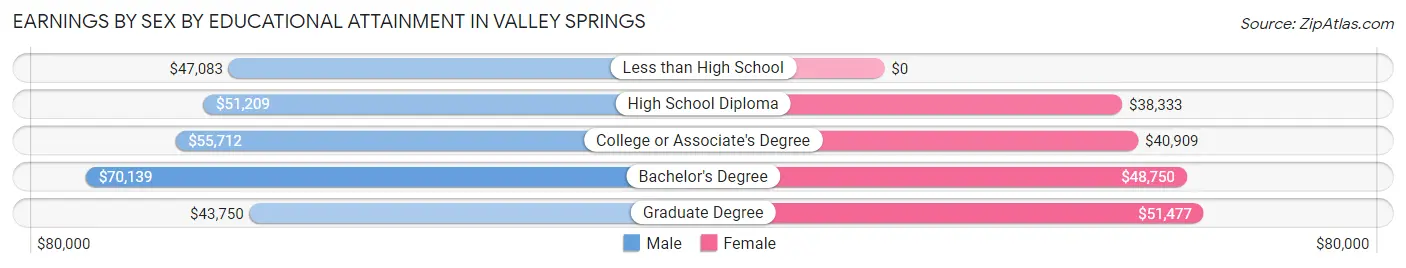
Earnings by Sex by Educational Attainment in Valley Springs
Average earnings in Valley Springs are $51,879 for men and $41,641 for women, a difference of 19.7%. Men with an educational attainment of bachelor's degree enjoy the highest average annual earnings of $70,139, while those with graduate degree education earn the least with $43,750. Women with an educational attainment of graduate degree earn the most with the average annual earnings of $51,477, while those with high school diploma education have the smallest earnings of $38,333.
| Educational Attainment | Male Income | Female Income |
| Less than High School | $47,083 | $0 |
| High School Diploma | $51,209 | $38,333 |
| College or Associate's Degree | $55,712 | $40,909 |
| Bachelor's Degree | $70,139 | $48,750 |
| Graduate Degree | $43,750 | $51,477 |
| Total | $51,879 | $41,641 |
Family Income in Valley Springs
Family Income Brackets in Valley Springs
According to the Valley Springs family income data, there are 76 families falling into the $100,000 to $149,999 income range, which is the most common income bracket and makes up 36.0% of all families.
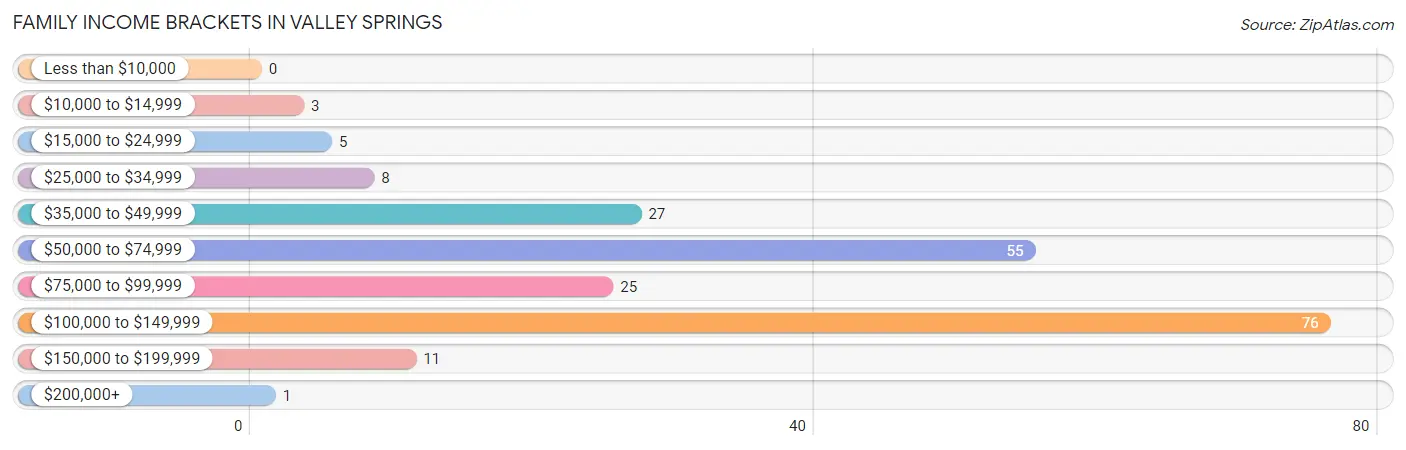
| Income Bracket | # Families | % Families |
| Less than $10,000 | 0 | 0.0% |
| $10,000 to $14,999 | 3 | 1.4% |
| $15,000 to $24,999 | 5 | 2.4% |
| $25,000 to $34,999 | 8 | 3.8% |
| $35,000 to $49,999 | 27 | 12.8% |
| $50,000 to $74,999 | 55 | 26.1% |
| $75,000 to $99,999 | 25 | 11.8% |
| $100,000 to $149,999 | 76 | 36.0% |
| $150,000 to $199,999 | 11 | 5.2% |
| $200,000+ | 1 | 0.5% |
Family Income by Famaliy Size in Valley Springs
4-person families (29 | 13.7%) account for the highest median family income in Valley Springs with $126,875 per family, while 2-person families (101 | 47.9%) have the highest median income of $40,625 per family member.
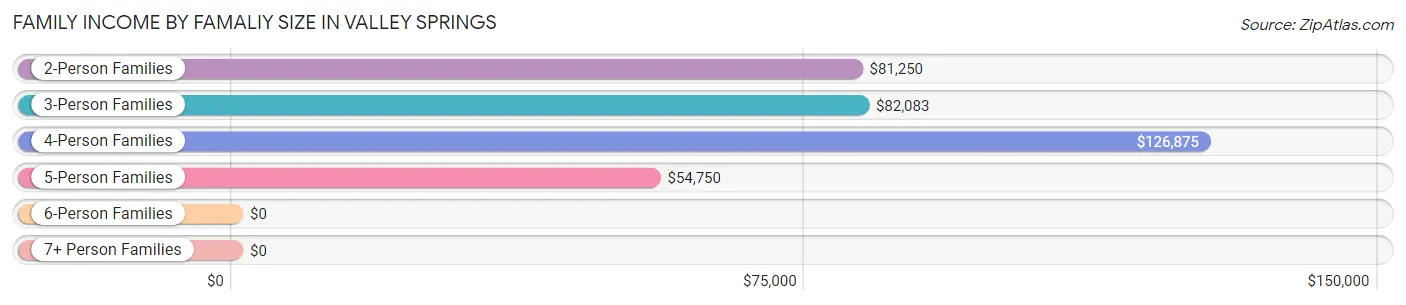
| Income Bracket | # Families | Median Income |
| 2-Person Families | 101 (47.9%) | $81,250 |
| 3-Person Families | 41 (19.4%) | $82,083 |
| 4-Person Families | 29 (13.7%) | $126,875 |
| 5-Person Families | 32 (15.2%) | $54,750 |
| 6-Person Families | 6 (2.8%) | $0 |
| 7+ Person Families | 2 (0.9%) | $0 |
| Total | 211 (100.0%) | $81,719 |
Family Income by Number of Earners in Valley Springs
The median family income in Valley Springs is $81,719, with families comprising 3+ earners (27) having the highest median family income of $130,250, while families with 1 earner (69) have the lowest median family income of $49,875, accounting for 12.8% and 32.7% of families, respectively.
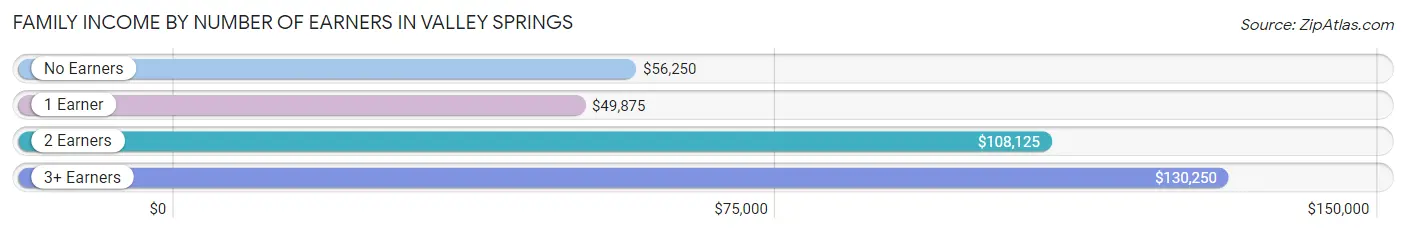
| Number of Earners | # Families | Median Income |
| No Earners | 14 (6.6%) | $56,250 |
| 1 Earner | 69 (32.7%) | $49,875 |
| 2 Earners | 101 (47.9%) | $108,125 |
| 3+ Earners | 27 (12.8%) | $130,250 |
| Total | 211 (100.0%) | $81,719 |
Household Income in Valley Springs
Household Income Brackets in Valley Springs
With 149 households falling in the category, the $100,000 to $149,999 income range is the most frequent in Valley Springs, accounting for 45.2% of all households.
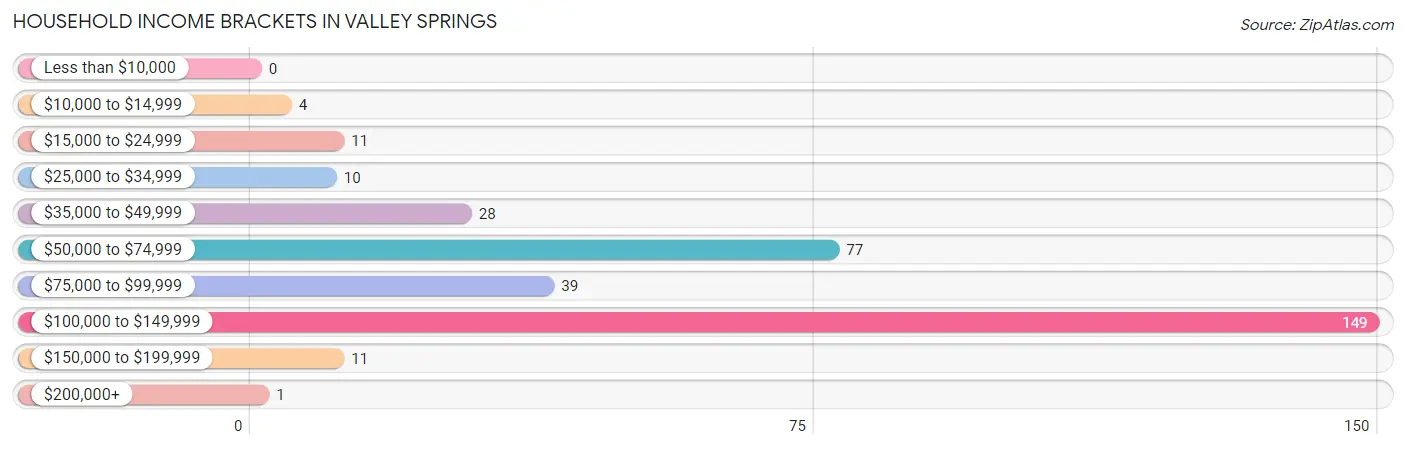
| Income Bracket | # Households | % Households |
| Less than $10,000 | 0 | 0.0% |
| $10,000 to $14,999 | 4 | 1.2% |
| $15,000 to $24,999 | 11 | 3.3% |
| $25,000 to $34,999 | 10 | 3.0% |
| $35,000 to $49,999 | 28 | 8.5% |
| $50,000 to $74,999 | 77 | 23.3% |
| $75,000 to $99,999 | 39 | 11.8% |
| $100,000 to $149,999 | 149 | 45.2% |
| $150,000 to $199,999 | 11 | 3.3% |
| $200,000+ | 1 | 0.3% |
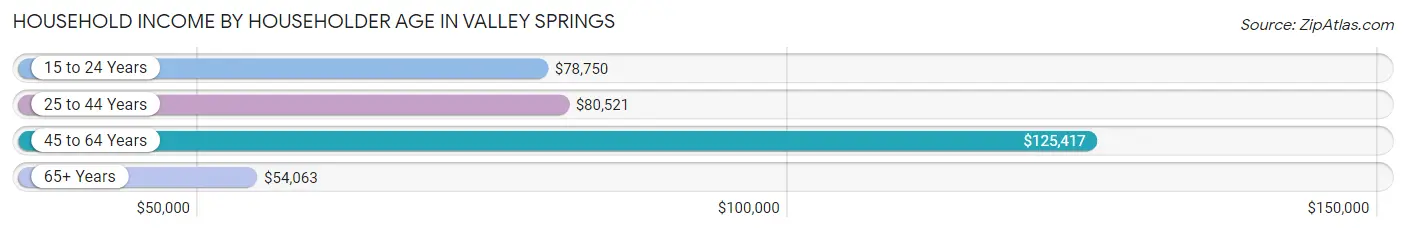
Household Income by Householder Age in Valley Springs
The median household income in Valley Springs is $94,722, with the highest median household income of $125,417 found in the 45 to 64 years age bracket for the primary householder. A total of 166 households (50.3%) fall into this category. Meanwhile, the 65+ years age bracket for the primary householder has the lowest median household income of $54,063, with 51 households (15.4%) in this group.
| Income Bracket | # Households | Median Income |
| 15 to 24 Years | 8 (2.4%) | $78,750 |
| 25 to 44 Years | 105 (31.8%) | $80,521 |
| 45 to 64 Years | 166 (50.3%) | $125,417 |
| 65+ Years | 51 (15.4%) | $54,063 |
| Total | 330 (100.0%) | $94,722 |
Poverty in Valley Springs
Income Below Poverty by Sex and Age in Valley Springs
With 5.1% poverty level for males and 3.5% for females among the residents of Valley Springs, 18 to 24 year old males and 5 year old females are the most vulnerable to poverty, with 6 males (26.1%) and 2 females (100.0%) in their respective age groups living below the poverty level.
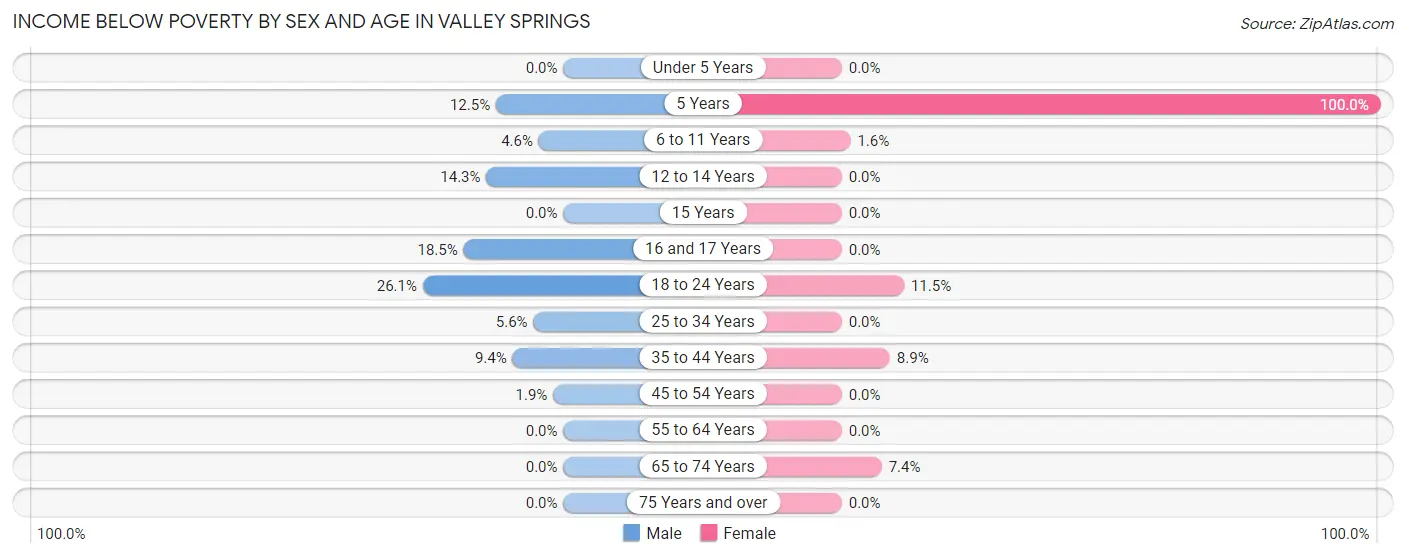
| Age Bracket | Male | Female |
| Under 5 Years | 0 (0.0%) | 0 (0.0%) |
| 5 Years | 1 (12.5%) | 2 (100.0%) |
| 6 to 11 Years | 2 (4.5%) | 1 (1.6%) |
| 12 to 14 Years | 3 (14.3%) | 0 (0.0%) |
| 15 Years | 0 (0.0%) | 0 (0.0%) |
| 16 and 17 Years | 5 (18.5%) | 0 (0.0%) |
| 18 to 24 Years | 6 (26.1%) | 3 (11.5%) |
| 25 to 34 Years | 3 (5.6%) | 0 (0.0%) |
| 35 to 44 Years | 5 (9.4%) | 5 (8.9%) |
| 45 to 54 Years | 5 (1.9%) | 0 (0.0%) |
| 55 to 64 Years | 0 (0.0%) | 0 (0.0%) |
| 65 to 74 Years | 0 (0.0%) | 2 (7.4%) |
| 75 Years and over | 0 (0.0%) | 0 (0.0%) |
| Total | 30 (5.1%) | 13 (3.5%) |
Income Above Poverty by Sex and Age in Valley Springs
According to the poverty statistics in Valley Springs, males aged under 5 years and females aged under 5 years are the age groups that are most secure financially, with 100.0% of males and 100.0% of females in these age groups living above the poverty line.
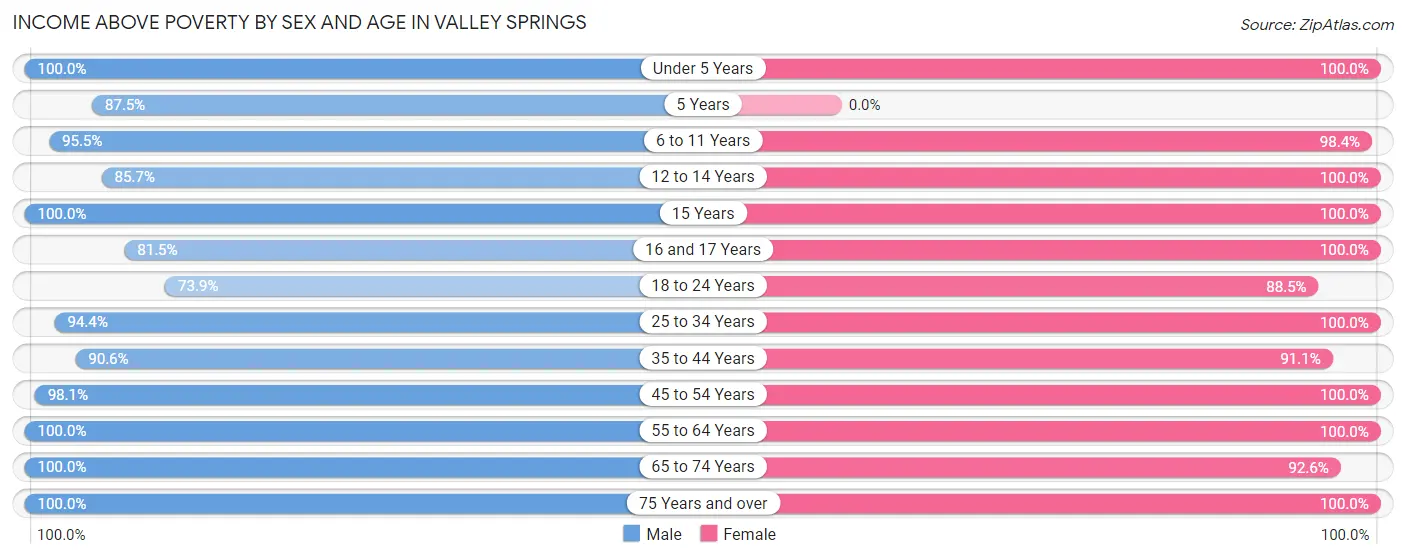
| Age Bracket | Male | Female |
| Under 5 Years | 19 (100.0%) | 11 (100.0%) |
| 5 Years | 7 (87.5%) | 0 (0.0%) |
| 6 to 11 Years | 42 (95.5%) | 61 (98.4%) |
| 12 to 14 Years | 18 (85.7%) | 23 (100.0%) |
| 15 Years | 2 (100.0%) | 5 (100.0%) |
| 16 and 17 Years | 22 (81.5%) | 6 (100.0%) |
| 18 to 24 Years | 17 (73.9%) | 23 (88.5%) |
| 25 to 34 Years | 51 (94.4%) | 54 (100.0%) |
| 35 to 44 Years | 48 (90.6%) | 51 (91.1%) |
| 45 to 54 Years | 259 (98.1%) | 29 (100.0%) |
| 55 to 64 Years | 38 (100.0%) | 56 (100.0%) |
| 65 to 74 Years | 33 (100.0%) | 25 (92.6%) |
| 75 Years and over | 8 (100.0%) | 9 (100.0%) |
| Total | 564 (95.0%) | 353 (96.5%) |
Income Below Poverty Among Married-Couple Families in Valley Springs
The poverty statistics for married-couple families in Valley Springs show that 3.8% or 5 of the total 131 families live below the poverty line. Families with 3 or 4 children have the highest poverty rate of 12.5%, comprising of 3 families. On the other hand, families with no children have the lowest poverty rate of 0.0%, which includes 0 families.
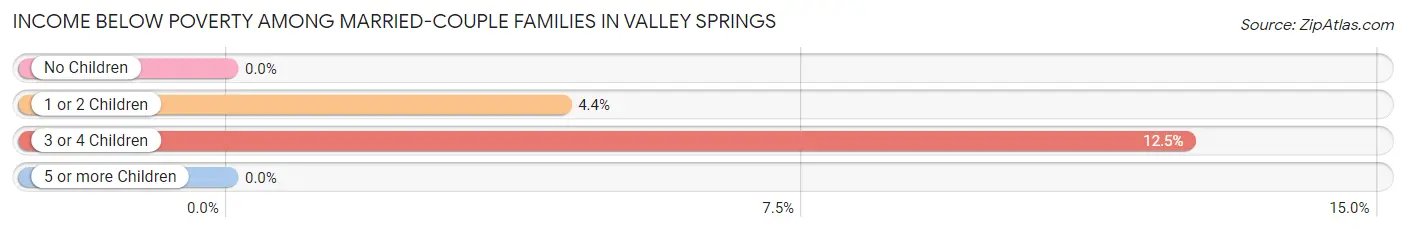
| Children | Above Poverty | Below Poverty |
| No Children | 59 (100.0%) | 0 (0.0%) |
| 1 or 2 Children | 44 (95.7%) | 2 (4.3%) |
| 3 or 4 Children | 21 (87.5%) | 3 (12.5%) |
| 5 or more Children | 2 (100.0%) | 0 (0.0%) |
| Total | 126 (96.2%) | 5 (3.8%) |
Income Below Poverty Among Single-Parent Households in Valley Springs
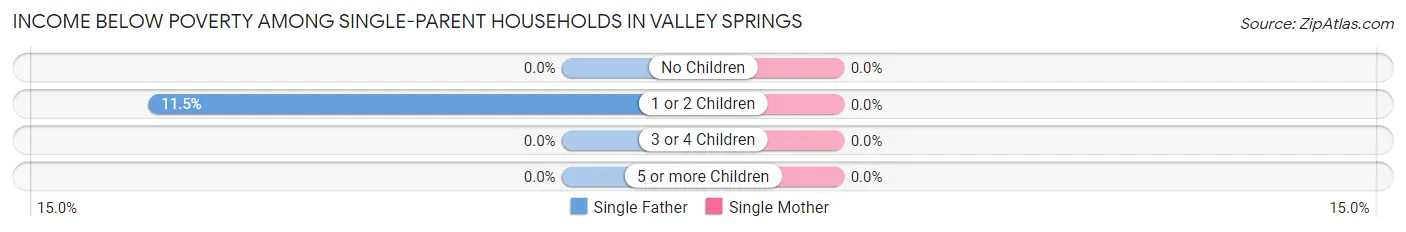
| Children | Single Father | Single Mother |
| No Children | 0 (0.0%) | 0 (0.0%) |
| 1 or 2 Children | 3 (11.5%) | 0 (0.0%) |
| 3 or 4 Children | 0 (0.0%) | 0 (0.0%) |
| 5 or more Children | 0 (0.0%) | 0 (0.0%) |
| Total | 3 (7.0%) | 0 (0.0%) |
Income Below Poverty Among Married-Couple vs Single-Parent Households in Valley Springs
The poverty data for Valley Springs shows that 5 of the married-couple family households (3.8%) and 3 of the single-parent households (3.7%) are living below the poverty level. Within the married-couple family households, those with 3 or 4 children have the highest poverty rate, with 3 households (12.5%) falling below the poverty line. Among the single-parent households, those with 1 or 2 children have the highest poverty rate, with 3 household (7.9%) living below poverty.
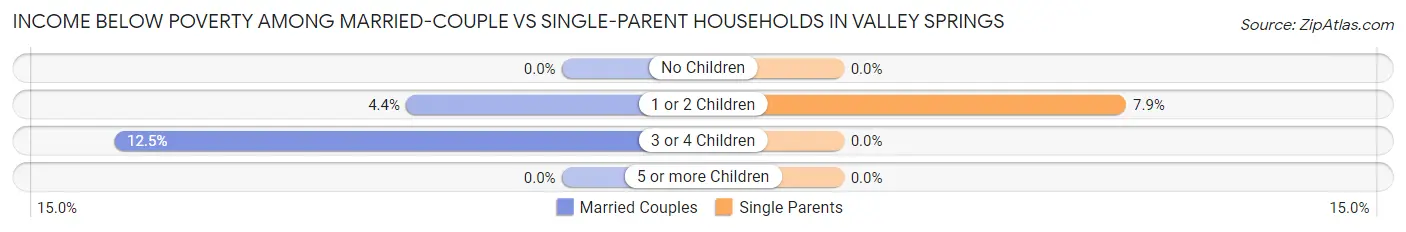
| Children | Married-Couple Families | Single-Parent Households |
| No Children | 0 (0.0%) | 0 (0.0%) |
| 1 or 2 Children | 2 (4.3%) | 3 (7.9%) |
| 3 or 4 Children | 3 (12.5%) | 0 (0.0%) |
| 5 or more Children | 0 (0.0%) | 0 (0.0%) |
| Total | 5 (3.8%) | 3 (3.7%) |
Race in Valley Springs
The most populous races in Valley Springs are White / Caucasian (941 | 97.7%), Two or more Races (14 | 1.5%), and Black / African American (6 | 0.6%).
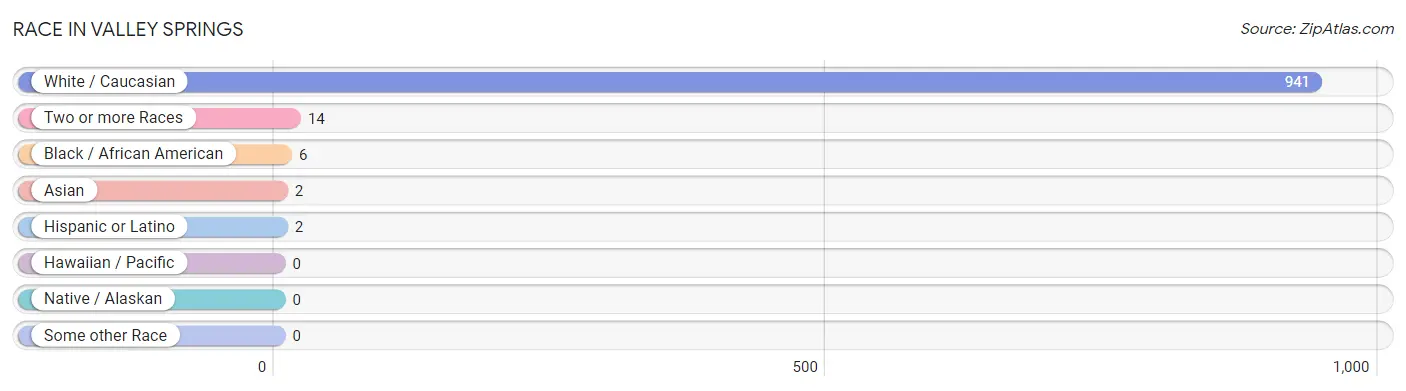
| Race | # Population | % Population |
| Asian | 2 | 0.2% |
| Black / African American | 6 | 0.6% |
| Hawaiian / Pacific | 0 | 0.0% |
| Hispanic or Latino | 2 | 0.2% |
| Native / Alaskan | 0 | 0.0% |
| White / Caucasian | 941 | 97.7% |
| Two or more Races | 14 | 1.5% |
| Some other Race | 0 | 0.0% |
| Total | 963 | 100.0% |
Ancestry in Valley Springs
The most populous ancestries reported in Valley Springs are German (554 | 57.5%), Russian (142 | 14.7%), Irish (112 | 11.6%), Norwegian (92 | 9.6%), and Dutch (88 | 9.1%), together accounting for 102.6% of all Valley Springs residents.
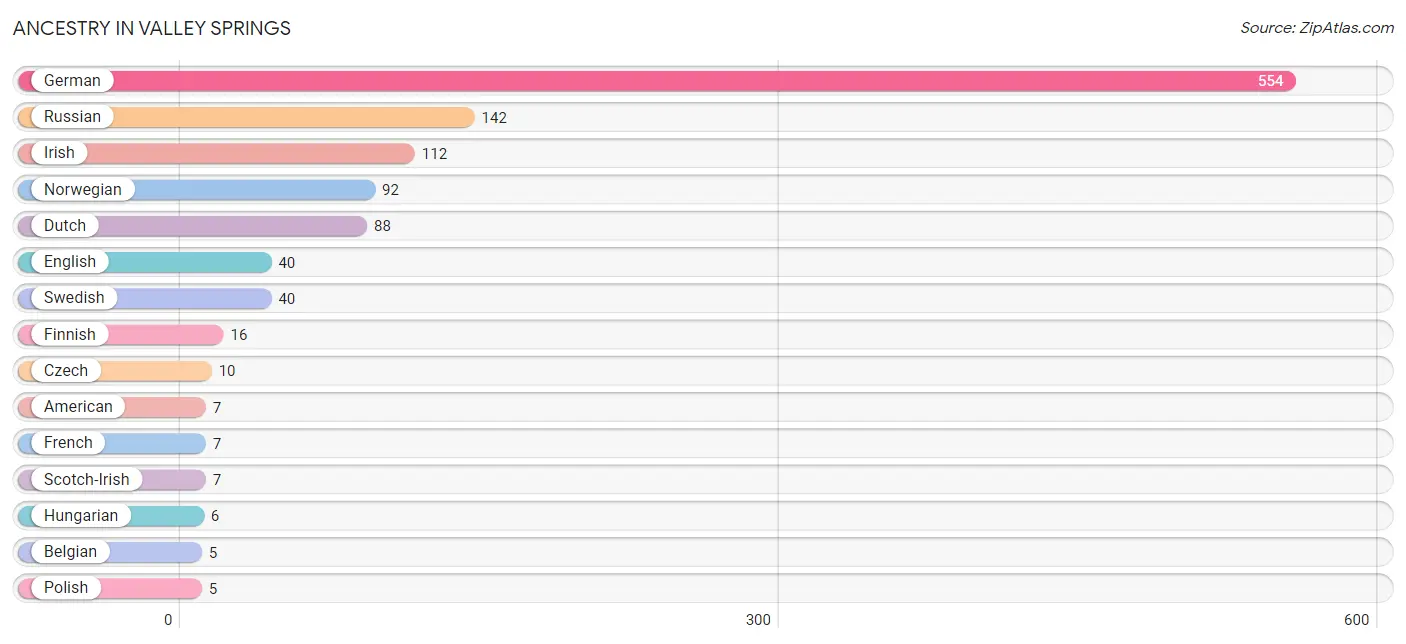
| Ancestry | # Population | % Population |
| American | 7 | 0.7% |
| Belgian | 5 | 0.5% |
| Croatian | 2 | 0.2% |
| Czech | 10 | 1.0% |
| Danish | 4 | 0.4% |
| Dutch | 88 | 9.1% |
| English | 40 | 4.2% |
| European | 4 | 0.4% |
| Finnish | 16 | 1.7% |
| French | 7 | 0.7% |
| French Canadian | 4 | 0.4% |
| German | 554 | 57.5% |
| Greek | 2 | 0.2% |
| Hungarian | 6 | 0.6% |
| Irish | 112 | 11.6% |
| Italian | 2 | 0.2% |
| Luxembourger | 3 | 0.3% |
| Mexican | 2 | 0.2% |
| Norwegian | 92 | 9.6% |
| Polish | 5 | 0.5% |
| Portuguese | 4 | 0.4% |
| Russian | 142 | 14.7% |
| Scotch-Irish | 7 | 0.7% |
| Scottish | 1 | 0.1% |
| Sri Lankan | 2 | 0.2% |
| Swedish | 40 | 4.2% |
| Welsh | 1 | 0.1% |
| Yugoslavian | 2 | 0.2% | View All 28 Rows |
Immigrants in Valley Springs
The most numerous immigrant groups reported in Valley Springs came from Asia (2 | 0.2%), South Eastern Asia (2 | 0.2%), and Vietnam (2 | 0.2%), together accounting for 0.6% of all Valley Springs residents.
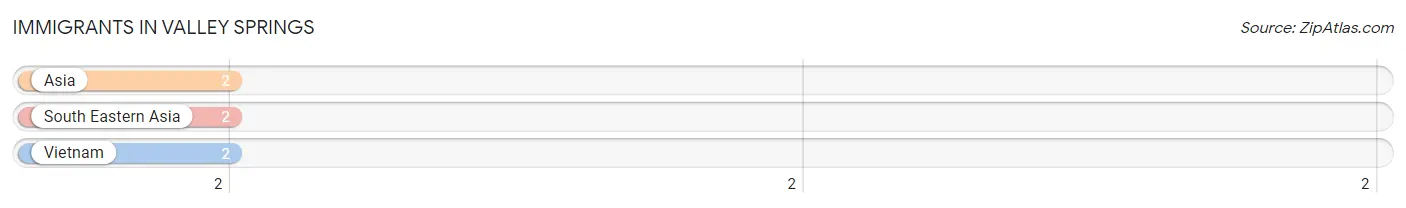
| Immigration Origin | # Population | % Population |
| Asia | 2 | 0.2% |
| South Eastern Asia | 2 | 0.2% |
| Vietnam | 2 | 0.2% | View All 3 Rows |
Sex and Age in Valley Springs
Sex and Age in Valley Springs
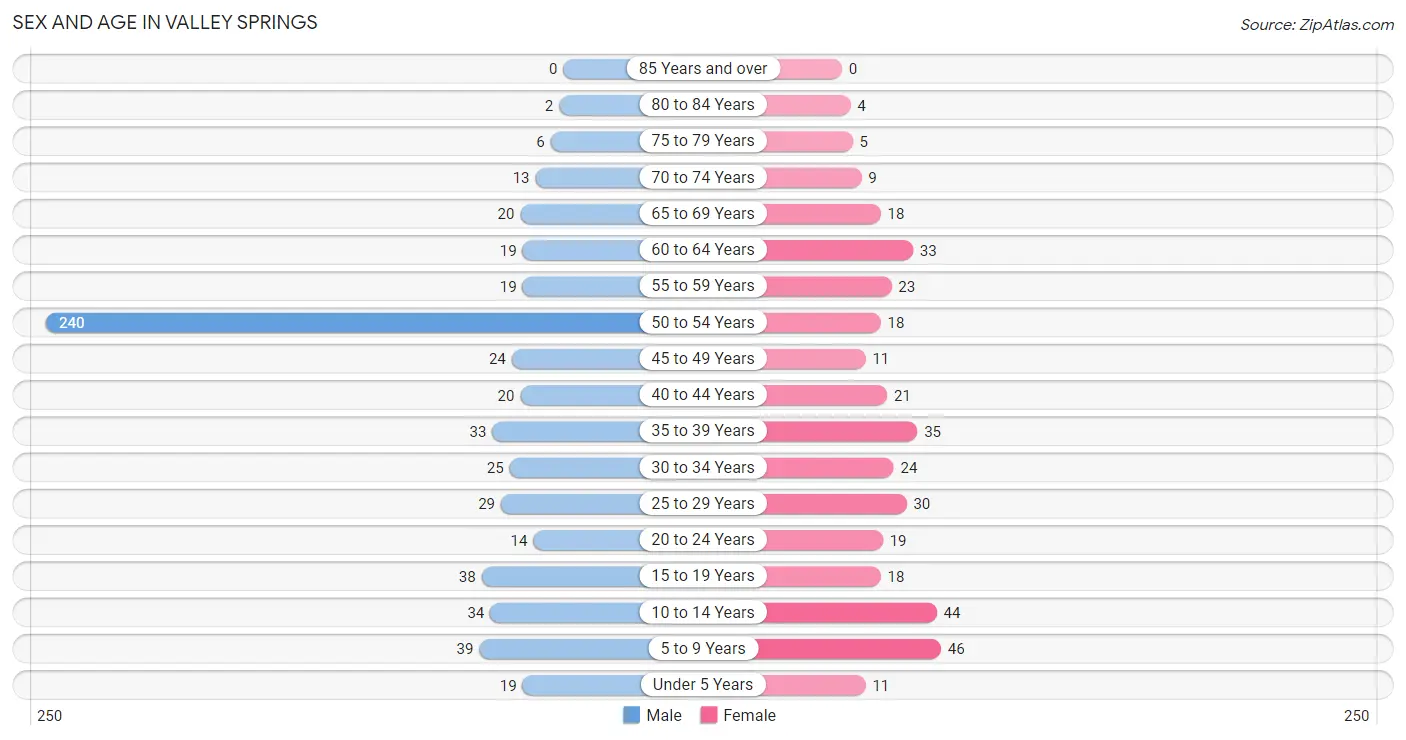
The most populous age groups in Valley Springs are 50 to 54 Years (240 | 40.4%) for men and 5 to 9 Years (46 | 12.5%) for women.
| Age Bracket | Male | Female |
| Under 5 Years | 19 (3.2%) | 11 (3.0%) |
| 5 to 9 Years | 39 (6.6%) | 46 (12.5%) |
| 10 to 14 Years | 34 (5.7%) | 44 (11.9%) |
| 15 to 19 Years | 38 (6.4%) | 18 (4.9%) |
| 20 to 24 Years | 14 (2.4%) | 19 (5.1%) |
| 25 to 29 Years | 29 (4.9%) | 30 (8.1%) |
| 30 to 34 Years | 25 (4.2%) | 24 (6.5%) |
| 35 to 39 Years | 33 (5.6%) | 35 (9.5%) |
| 40 to 44 Years | 20 (3.4%) | 21 (5.7%) |
| 45 to 49 Years | 24 (4.0%) | 11 (3.0%) |
| 50 to 54 Years | 240 (40.4%) | 18 (4.9%) |
| 55 to 59 Years | 19 (3.2%) | 23 (6.2%) |
| 60 to 64 Years | 19 (3.2%) | 33 (8.9%) |
| 65 to 69 Years | 20 (3.4%) | 18 (4.9%) |
| 70 to 74 Years | 13 (2.2%) | 9 (2.4%) |
| 75 to 79 Years | 6 (1.0%) | 5 (1.4%) |
| 80 to 84 Years | 2 (0.3%) | 4 (1.1%) |
| 85 Years and over | 0 (0.0%) | 0 (0.0%) |
| Total | 594 (100.0%) | 369 (100.0%) |
Families and Households in Valley Springs
Median Family Size in Valley Springs
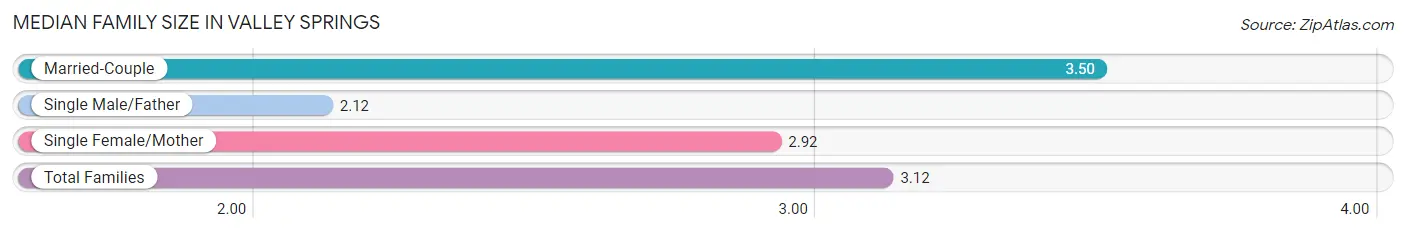
The median family size in Valley Springs is 3.12 persons per family, with married-couple families (131 | 62.1%) accounting for the largest median family size of 3.5 persons per family. On the other hand, single male/father families (43 | 20.4%) represent the smallest median family size with 2.12 persons per family.
| Family Type | # Families | Family Size |
| Married-Couple | 131 (62.1%) | 3.50 |
| Single Male/Father | 43 (20.4%) | 2.12 |
| Single Female/Mother | 37 (17.5%) | 2.92 |
| Total Families | 211 (100.0%) | 3.12 |
Median Household Size in Valley Springs
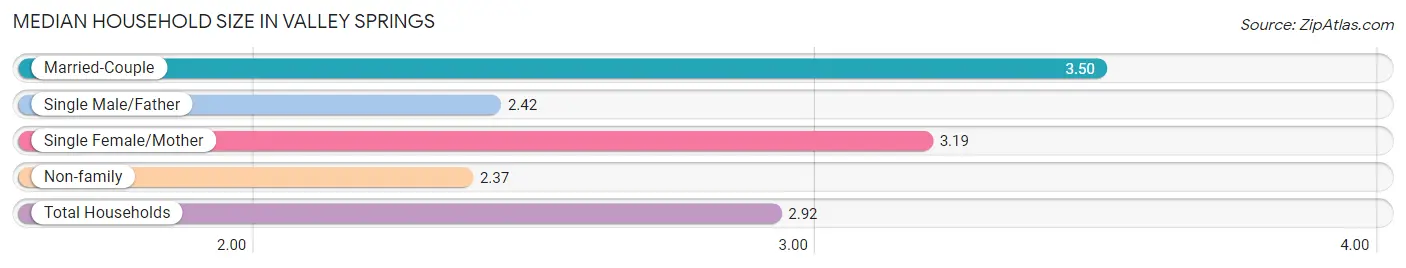
The median household size in Valley Springs is 2.92 persons per household, with married-couple households (131 | 39.7%) accounting for the largest median household size of 3.5 persons per household. non-family households (119 | 36.1%) represent the smallest median household size with 2.37 persons per household.
| Household Type | # Households | Household Size |
| Married-Couple | 131 (39.7%) | 3.50 |
| Single Male/Father | 43 (13.0%) | 2.42 |
| Single Female/Mother | 37 (11.2%) | 3.19 |
| Non-family | 119 (36.1%) | 2.37 |
| Total Households | 330 (100.0%) | 2.92 |
Household Size by Marriage Status in Valley Springs
Out of a total of 330 households in Valley Springs, 211 (63.9%) are family households, while 119 (36.1%) are nonfamily households. The most numerous type of family households are 2-person households, comprising 96, and the most common type of nonfamily households are 2-person households, comprising 82.
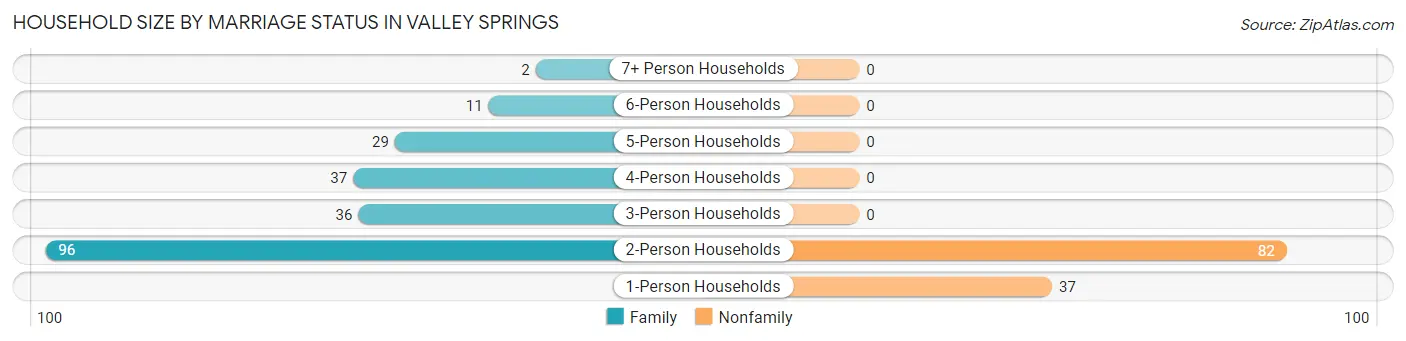
| Household Size | Family Households | Nonfamily Households |
| 1-Person Households | - | 37 (11.2%) |
| 2-Person Households | 96 (29.1%) | 82 (24.8%) |
| 3-Person Households | 36 (10.9%) | 0 (0.0%) |
| 4-Person Households | 37 (11.2%) | 0 (0.0%) |
| 5-Person Households | 29 (8.8%) | 0 (0.0%) |
| 6-Person Households | 11 (3.3%) | 0 (0.0%) |
| 7+ Person Households | 2 (0.6%) | 0 (0.0%) |
| Total | 211 (63.9%) | 119 (36.1%) |
Female Fertility in Valley Springs
Fertility by Age in Valley Springs
Average fertility rate in Valley Springs is 67.0 births per 1,000 women. Women in the age bracket of 20 to 34 years have the highest fertility rate with 123.0 births per 1,000 women. Women in the age bracket of 20 to 34 years acount for 81.8% of all women with births.
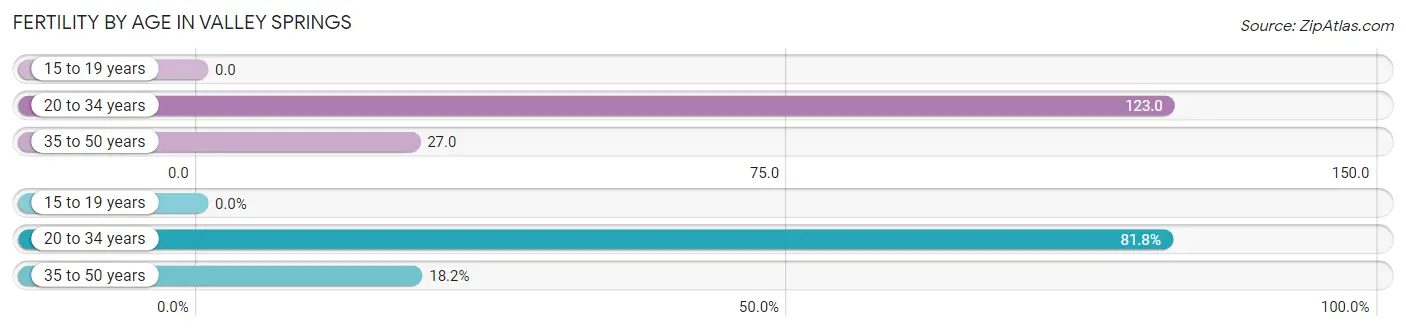
| Age Bracket | Women with Births | Births / 1,000 Women |
| 15 to 19 years | 0 (0.0%) | 0.0 |
| 20 to 34 years | 9 (81.8%) | 123.0 |
| 35 to 50 years | 2 (18.2%) | 27.0 |
| Total | 11 (100.0%) | 67.0 |
Fertility by Age by Marriage Status in Valley Springs
54.5% of women with births (11) in Valley Springs are married. The highest percentage of unmarried women with births falls into 20 to 34 years age bracket with 55.6% of them unmarried at the time of birth, while the lowest percentage of unmarried women with births belong to 35 to 50 years age bracket with 0.0% of them unmarried.
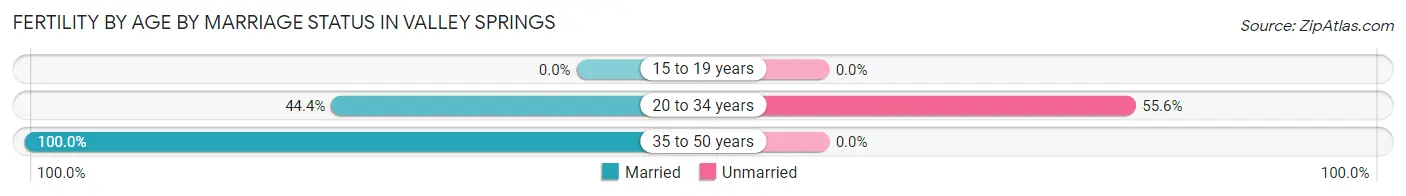
| Age Bracket | Married | Unmarried |
| 15 to 19 years | 0 (0.0%) | 0 (0.0%) |
| 20 to 34 years | 4 (44.4%) | 5 (55.6%) |
| 35 to 50 years | 2 (100.0%) | 0 (0.0%) |
| Total | 6 (54.5%) | 5 (45.5%) |
Fertility by Education in Valley Springs
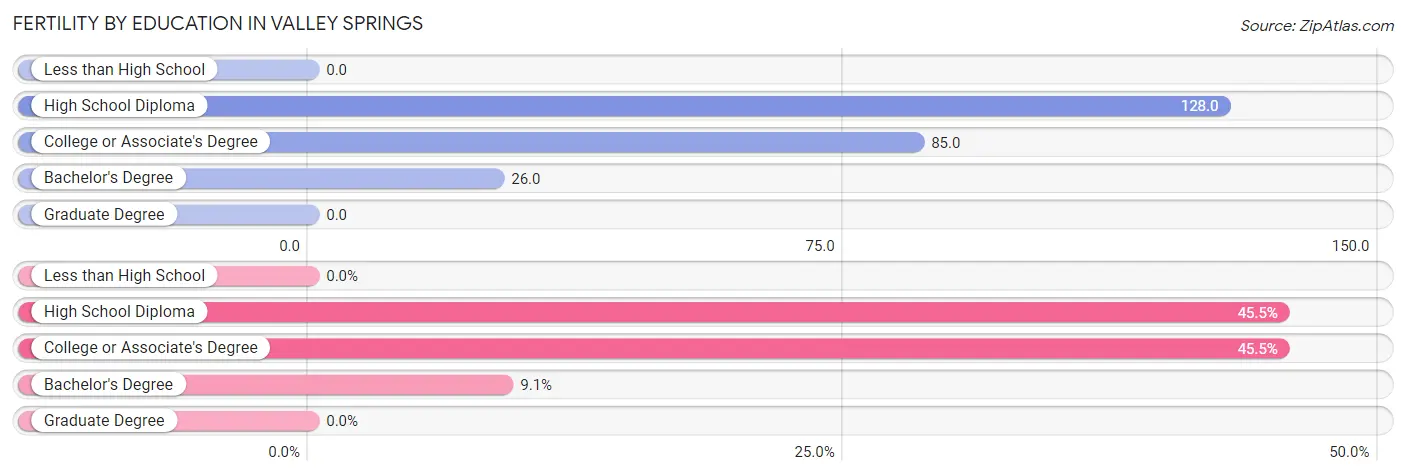
| Educational Attainment | Women with Births | Births / 1,000 Women |
| Less than High School | 0 (0.0%) | 0.0 |
| High School Diploma | 5 (45.5%) | 128.0 |
| College or Associate's Degree | 5 (45.5%) | 85.0 |
| Bachelor's Degree | 1 (9.1%) | 26.0 |
| Graduate Degree | 0 (0.0%) | 0.0 |
| Total | 11 (100.0%) | 67.0 |
Fertility by Education by Marriage Status in Valley Springs
45.5% of women with births in Valley Springs are unmarried. Women with the educational attainment of high school diploma are most likely to be married with 100.0% of them married at childbirth, while women with the educational attainment of college or associate's degree are least likely to be married with 100.0% of them unmarried at childbirth.
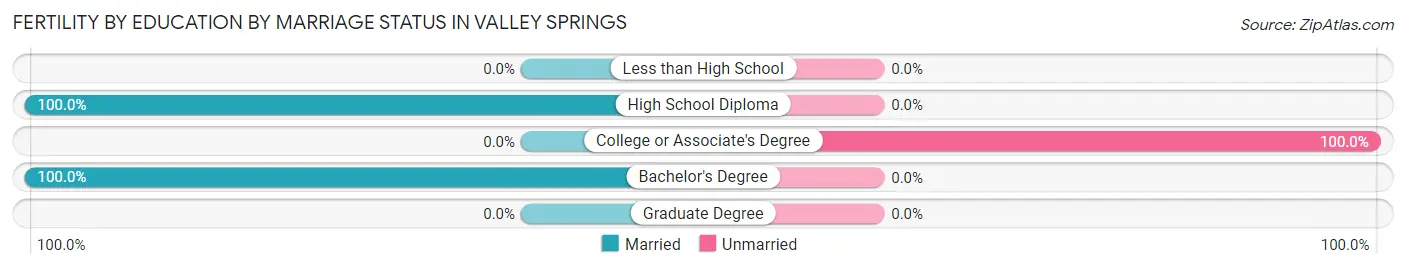
| Educational Attainment | Married | Unmarried |
| Less than High School | 0 (0.0%) | 0 (0.0%) |
| High School Diploma | 5 (100.0%) | 0 (0.0%) |
| College or Associate's Degree | 0 (0.0%) | 5 (100.0%) |
| Bachelor's Degree | 1 (100.0%) | 0 (0.0%) |
| Graduate Degree | 0 (0.0%) | 0 (0.0%) |
| Total | 6 (54.5%) | 5 (45.5%) |
Employment Characteristics in Valley Springs
Employment by Class of Employer in Valley Springs
Among the 613 employed individuals in Valley Springs, private company employees (386 | 63.0%), local government employees (153 | 25.0%), and not-for-profit organizations (29 | 4.7%) make up the most common classes of employment.
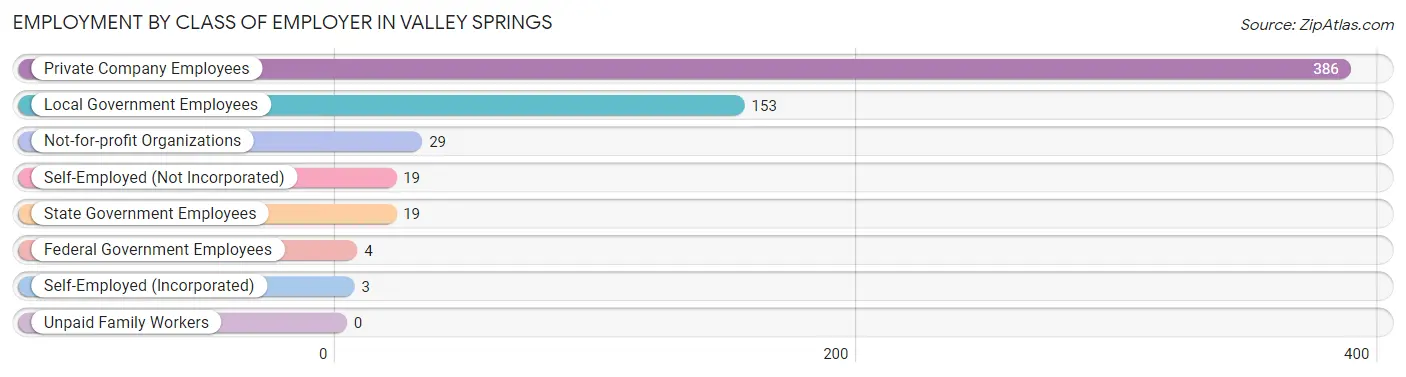
| Employer Class | # Employees | % Employees |
| Private Company Employees | 386 | 63.0% |
| Self-Employed (Incorporated) | 3 | 0.5% |
| Self-Employed (Not Incorporated) | 19 | 3.1% |
| Not-for-profit Organizations | 29 | 4.7% |
| Local Government Employees | 153 | 25.0% |
| State Government Employees | 19 | 3.1% |
| Federal Government Employees | 4 | 0.6% |
| Unpaid Family Workers | 0 | 0.0% |
| Total | 613 | 100.0% |
Employment Status by Age in Valley Springs
According to the labor force statistics for Valley Springs, out of the total population over 16 years of age (763), 84.8% or 647 individuals are in the labor force, with 3.6% or 23 of them unemployed. The age group with the highest labor force participation rate is 45 to 54 years, with 98.6% or 289 individuals in the labor force. Within the labor force, the 16 to 19 years age range has the highest percentage of unemployed individuals, with 13.0% or 3 of them being unemployed.
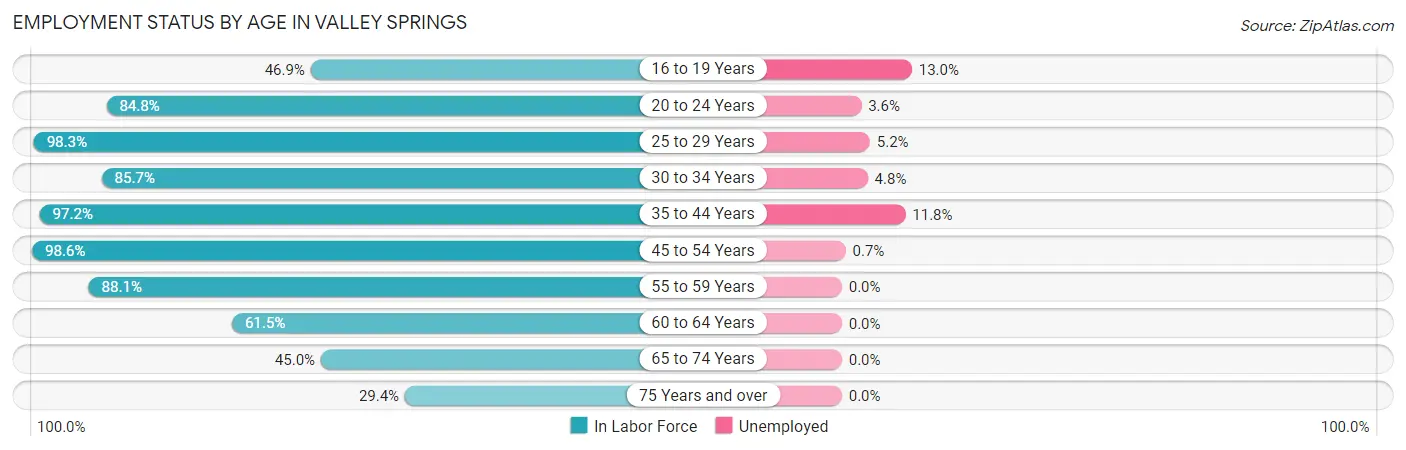
| Age Bracket | In Labor Force | Unemployed |
| 16 to 19 Years | 23 (46.9%) | 3 (13.0%) |
| 20 to 24 Years | 28 (84.8%) | 1 (3.6%) |
| 25 to 29 Years | 58 (98.3%) | 3 (5.2%) |
| 30 to 34 Years | 42 (85.7%) | 2 (4.8%) |
| 35 to 44 Years | 106 (97.2%) | 13 (11.8%) |
| 45 to 54 Years | 289 (98.6%) | 2 (0.7%) |
| 55 to 59 Years | 37 (88.1%) | 0 (0.0%) |
| 60 to 64 Years | 32 (61.5%) | 0 (0.0%) |
| 65 to 74 Years | 27 (45.0%) | 0 (0.0%) |
| 75 Years and over | 5 (29.4%) | 0 (0.0%) |
| Total | 647 (84.8%) | 23 (3.6%) |
Employment Status by Educational Attainment in Valley Springs
According to labor force statistics for Valley Springs, 93.4% of individuals (564) out of the total population between 25 and 64 years of age (604) are in the labor force, with 3.4% or 19 of them being unemployed. The group with the highest labor force participation rate are those with the educational attainment of college / associate degree, with 97.3% or 218 individuals in the labor force. Within the labor force, individuals with college / associate degree education have the highest percentage of unemployment, with 6.5% or 14 of them being unemployed.
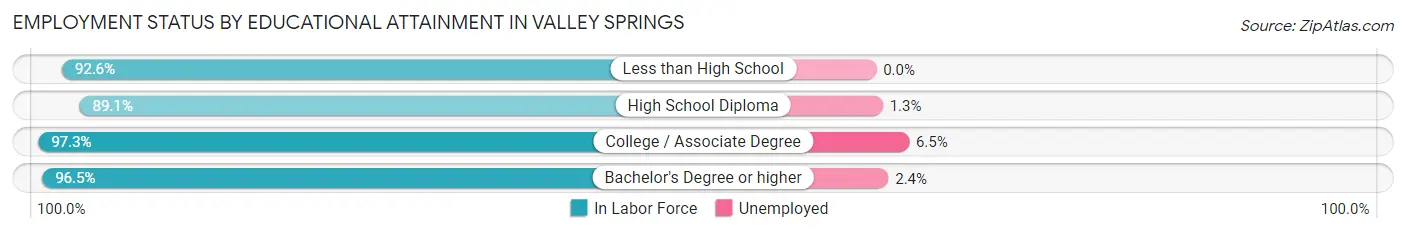
| Educational Attainment | In Labor Force | Unemployed |
| Less than High School | 25 (92.6%) | 0 (0.0%) |
| High School Diploma | 238 (89.1%) | 3 (1.3%) |
| College / Associate Degree | 218 (97.3%) | 15 (6.5%) |
| Bachelor's Degree or higher | 83 (96.5%) | 2 (2.4%) |
| Total | 564 (93.4%) | 21 (3.4%) |
Employment Occupations by Sex in Valley Springs
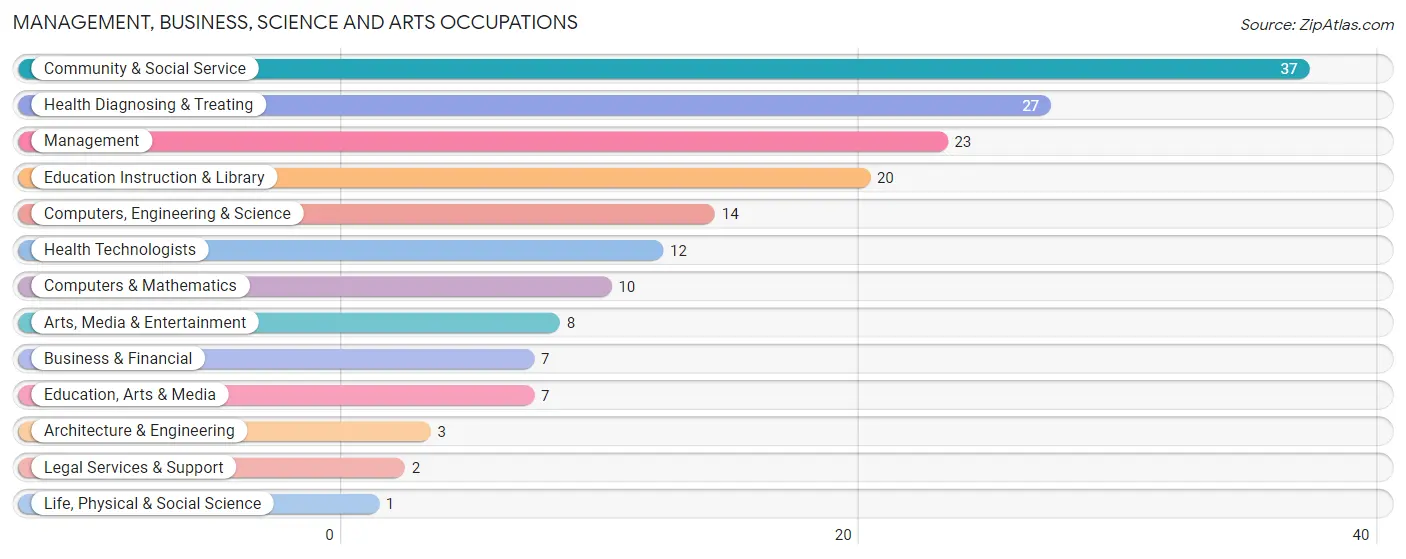
Management, Business, Science and Arts Occupations
The most common Management, Business, Science and Arts occupations in Valley Springs are Community & Social Service (37 | 6.0%), Health Diagnosing & Treating (27 | 4.3%), Management (23 | 3.7%), Education Instruction & Library (20 | 3.2%), and Computers, Engineering & Science (14 | 2.3%).
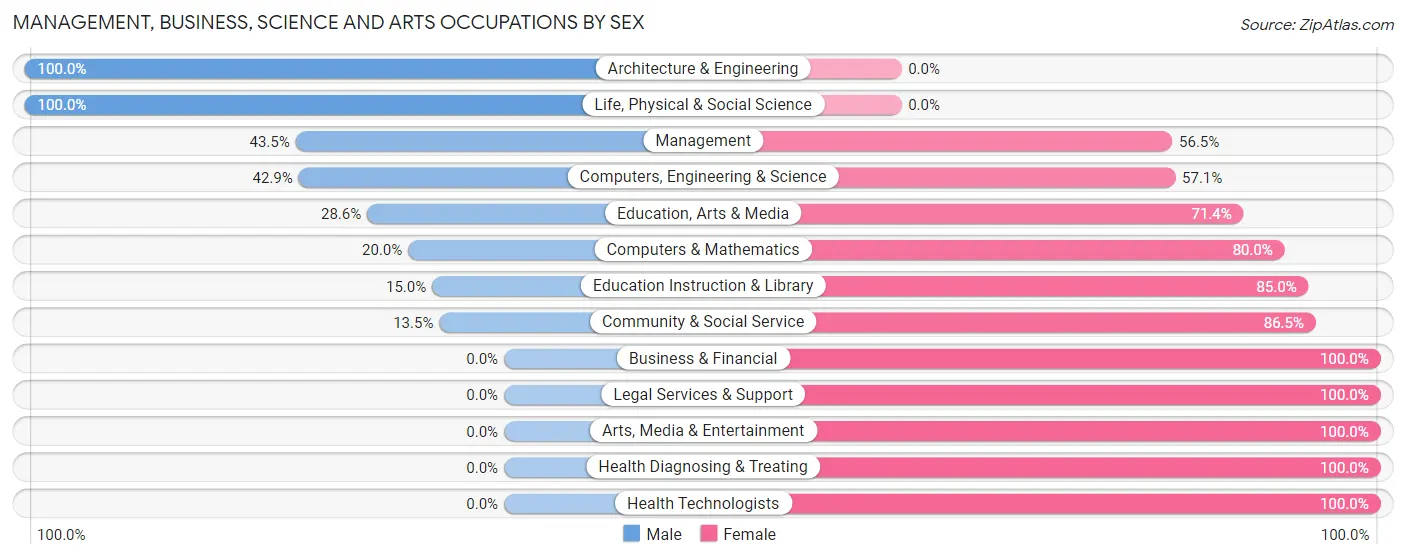
Management, Business, Science and Arts Occupations by Sex
Within the Management, Business, Science and Arts occupations in Valley Springs, the most male-oriented occupations are Architecture & Engineering (100.0%), Life, Physical & Social Science (100.0%), and Management (43.5%), while the most female-oriented occupations are Business & Financial (100.0%), Legal Services & Support (100.0%), and Arts, Media & Entertainment (100.0%).
| Occupation | Male | Female |
| Management | 10 (43.5%) | 13 (56.5%) |
| Business & Financial | 0 (0.0%) | 7 (100.0%) |
| Computers, Engineering & Science | 6 (42.9%) | 8 (57.1%) |
| Computers & Mathematics | 2 (20.0%) | 8 (80.0%) |
| Architecture & Engineering | 3 (100.0%) | 0 (0.0%) |
| Life, Physical & Social Science | 1 (100.0%) | 0 (0.0%) |
| Community & Social Service | 5 (13.5%) | 32 (86.5%) |
| Education, Arts & Media | 2 (28.6%) | 5 (71.4%) |
| Legal Services & Support | 0 (0.0%) | 2 (100.0%) |
| Education Instruction & Library | 3 (15.0%) | 17 (85.0%) |
| Arts, Media & Entertainment | 0 (0.0%) | 8 (100.0%) |
| Health Diagnosing & Treating | 0 (0.0%) | 27 (100.0%) |
| Health Technologists | 0 (0.0%) | 12 (100.0%) |
| Total (Category) | 21 (19.4%) | 87 (80.6%) |
| Total (Overall) | 438 (70.7%) | 182 (29.3%) |
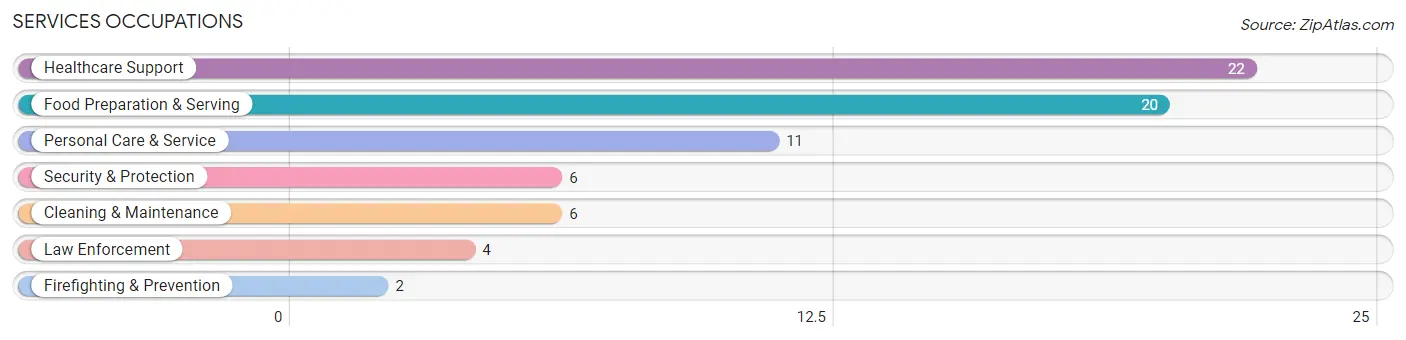
Services Occupations
The most common Services occupations in Valley Springs are Healthcare Support (22 | 3.5%), Food Preparation & Serving (20 | 3.2%), Personal Care & Service (11 | 1.8%), Security & Protection (6 | 1.0%), and Cleaning & Maintenance (6 | 1.0%).
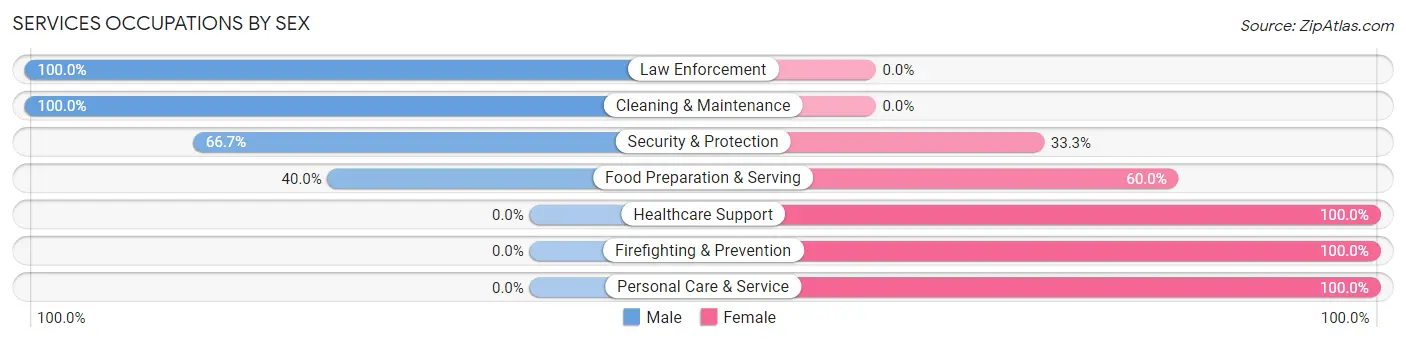
Services Occupations by Sex
Within the Services occupations in Valley Springs, the most male-oriented occupations are Law Enforcement (100.0%), Cleaning & Maintenance (100.0%), and Security & Protection (66.7%), while the most female-oriented occupations are Healthcare Support (100.0%), Firefighting & Prevention (100.0%), and Personal Care & Service (100.0%).
| Occupation | Male | Female |
| Healthcare Support | 0 (0.0%) | 22 (100.0%) |
| Security & Protection | 4 (66.7%) | 2 (33.3%) |
| Firefighting & Prevention | 0 (0.0%) | 2 (100.0%) |
| Law Enforcement | 4 (100.0%) | 0 (0.0%) |
| Food Preparation & Serving | 8 (40.0%) | 12 (60.0%) |
| Cleaning & Maintenance | 6 (100.0%) | 0 (0.0%) |
| Personal Care & Service | 0 (0.0%) | 11 (100.0%) |
| Total (Category) | 18 (27.7%) | 47 (72.3%) |
| Total (Overall) | 438 (70.7%) | 182 (29.3%) |
Sales and Office Occupations
The most common Sales and Office occupations in Valley Springs are Office & Administration (38 | 6.1%), and Sales & Related (35 | 5.7%).
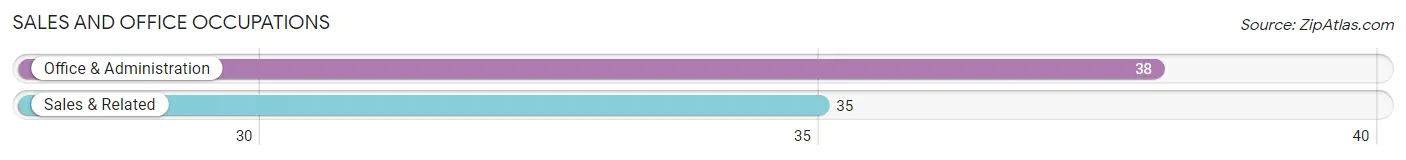
Sales and Office Occupations by Sex
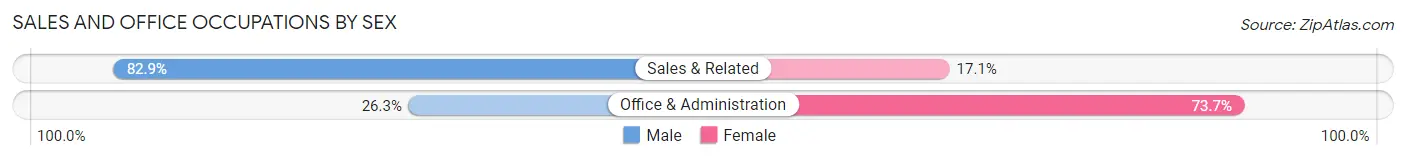
| Occupation | Male | Female |
| Sales & Related | 29 (82.9%) | 6 (17.1%) |
| Office & Administration | 10 (26.3%) | 28 (73.7%) |
| Total (Category) | 39 (53.4%) | 34 (46.6%) |
| Total (Overall) | 438 (70.7%) | 182 (29.3%) |
Natural Resources, Construction and Maintenance Occupations
The most common Natural Resources, Construction and Maintenance occupations in Valley Springs are Construction & Extraction (186 | 30.0%), and Installation, Maintenance & Repair (30 | 4.8%).
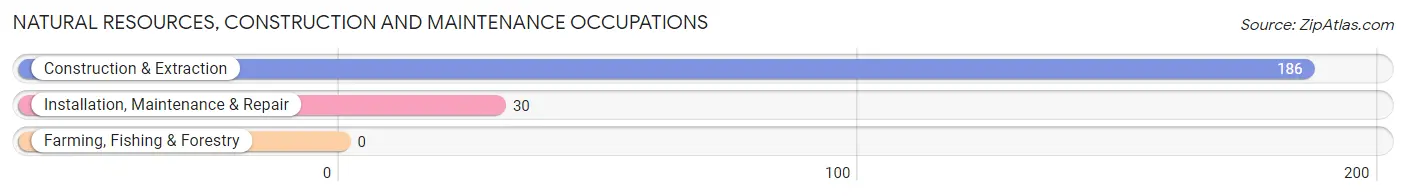
Natural Resources, Construction and Maintenance Occupations by Sex
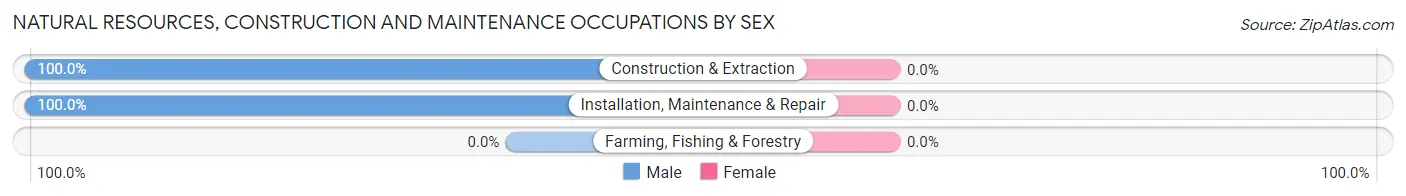
| Occupation | Male | Female |
| Farming, Fishing & Forestry | 0 (0.0%) | 0 (0.0%) |
| Construction & Extraction | 186 (100.0%) | 0 (0.0%) |
| Installation, Maintenance & Repair | 30 (100.0%) | 0 (0.0%) |
| Total (Category) | 216 (100.0%) | 0 (0.0%) |
| Total (Overall) | 438 (70.7%) | 182 (29.3%) |
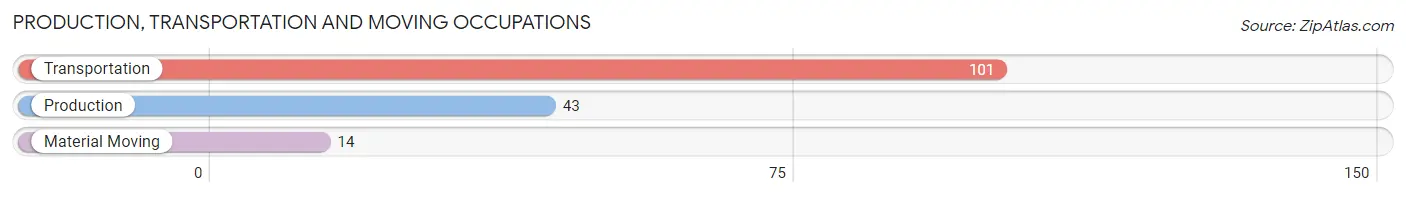
Production, Transportation and Moving Occupations
The most common Production, Transportation and Moving occupations in Valley Springs are Transportation (101 | 16.3%), Production (43 | 6.9%), and Material Moving (14 | 2.3%).
Production, Transportation and Moving Occupations by Sex
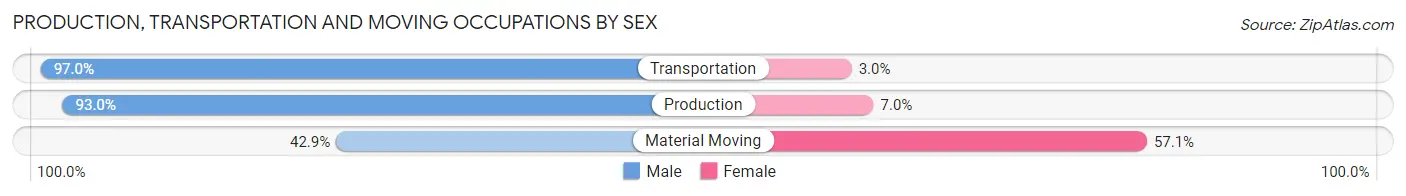
| Occupation | Male | Female |
| Production | 40 (93.0%) | 3 (7.0%) |
| Transportation | 98 (97.0%) | 3 (3.0%) |
| Material Moving | 6 (42.9%) | 8 (57.1%) |
| Total (Category) | 144 (91.1%) | 14 (8.9%) |
| Total (Overall) | 438 (70.7%) | 182 (29.3%) |
Employment Industries by Sex in Valley Springs
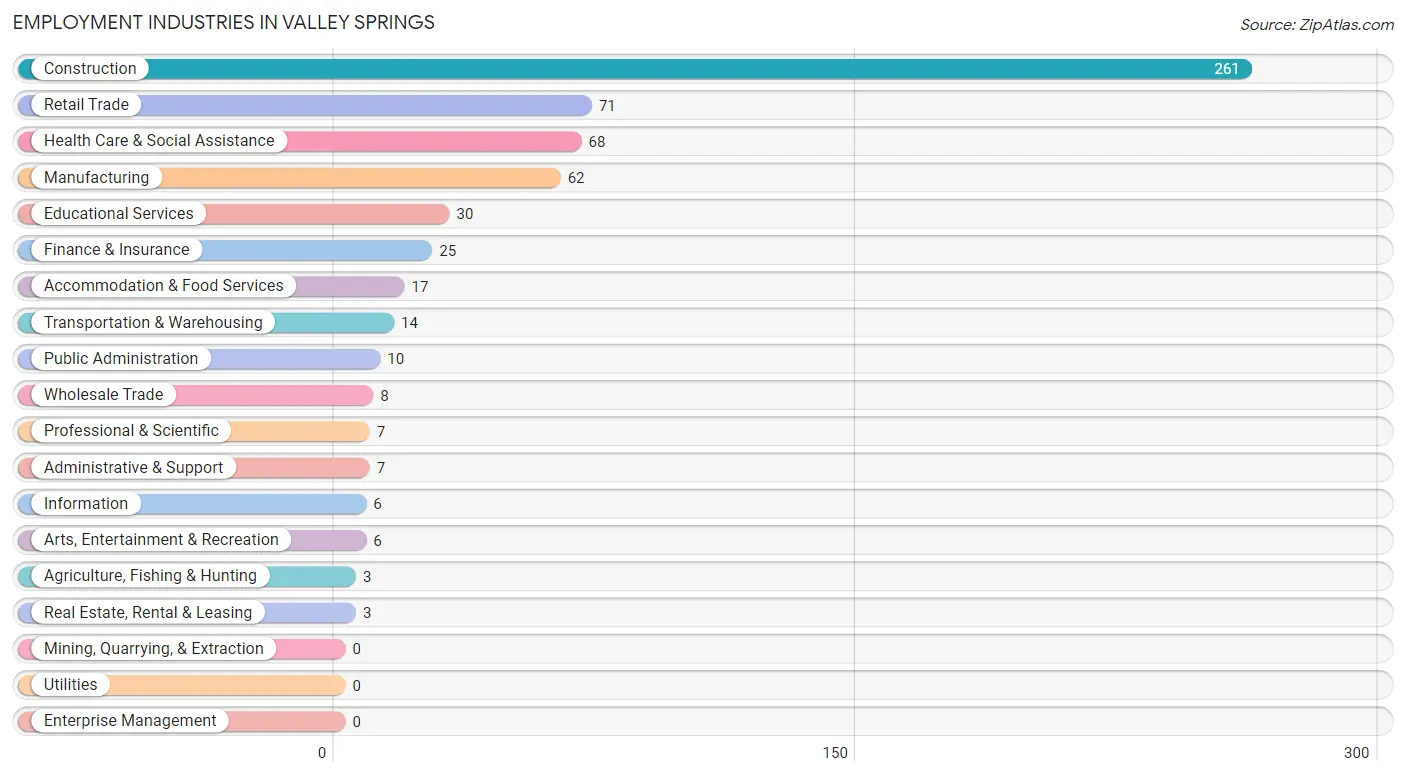
Employment Industries in Valley Springs
The major employment industries in Valley Springs include Construction (261 | 42.1%), Retail Trade (71 | 11.5%), Health Care & Social Assistance (68 | 11.0%), Manufacturing (62 | 10.0%), and Educational Services (30 | 4.8%).
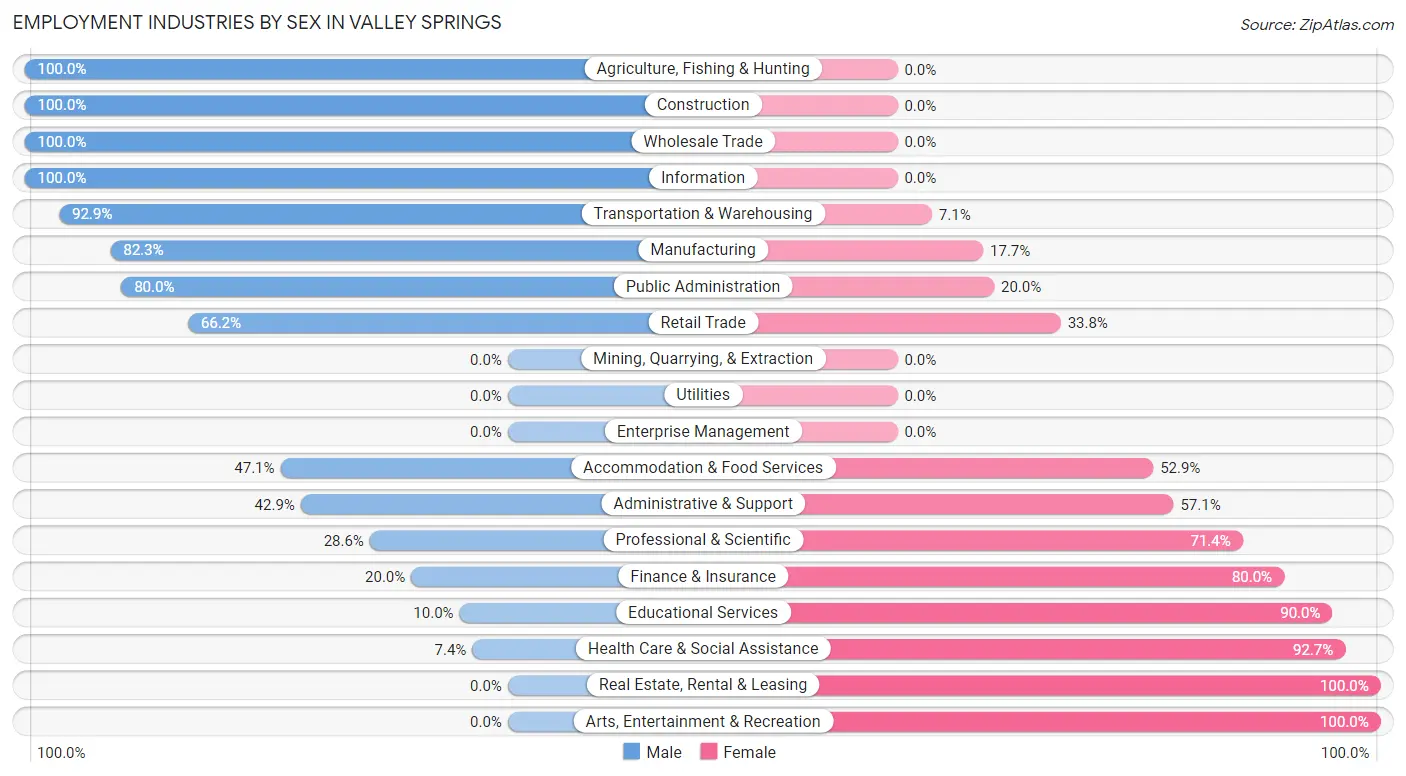
Employment Industries by Sex in Valley Springs
The Valley Springs industries that see more men than women are Agriculture, Fishing & Hunting (100.0%), Construction (100.0%), and Wholesale Trade (100.0%), whereas the industries that tend to have a higher number of women are Real Estate, Rental & Leasing (100.0%), Arts, Entertainment & Recreation (100.0%), and Health Care & Social Assistance (92.6%).
| Industry | Male | Female |
| Agriculture, Fishing & Hunting | 3 (100.0%) | 0 (0.0%) |
| Mining, Quarrying, & Extraction | 0 (0.0%) | 0 (0.0%) |
| Construction | 261 (100.0%) | 0 (0.0%) |
| Manufacturing | 51 (82.3%) | 11 (17.7%) |
| Wholesale Trade | 8 (100.0%) | 0 (0.0%) |
| Retail Trade | 47 (66.2%) | 24 (33.8%) |
| Transportation & Warehousing | 13 (92.9%) | 1 (7.1%) |
| Utilities | 0 (0.0%) | 0 (0.0%) |
| Information | 6 (100.0%) | 0 (0.0%) |
| Finance & Insurance | 5 (20.0%) | 20 (80.0%) |
| Real Estate, Rental & Leasing | 0 (0.0%) | 3 (100.0%) |
| Professional & Scientific | 2 (28.6%) | 5 (71.4%) |
| Enterprise Management | 0 (0.0%) | 0 (0.0%) |
| Administrative & Support | 3 (42.9%) | 4 (57.1%) |
| Educational Services | 3 (10.0%) | 27 (90.0%) |
| Health Care & Social Assistance | 5 (7.3%) | 63 (92.6%) |
| Arts, Entertainment & Recreation | 0 (0.0%) | 6 (100.0%) |
| Accommodation & Food Services | 8 (47.1%) | 9 (52.9%) |
| Public Administration | 8 (80.0%) | 2 (20.0%) |
| Total | 438 (70.7%) | 182 (29.3%) |
Education in Valley Springs
School Enrollment in Valley Springs
The most common levels of schooling among the 222 students in Valley Springs are elementary school (74 | 33.3%), middle school (66 | 29.7%), and high school (45 | 20.3%).
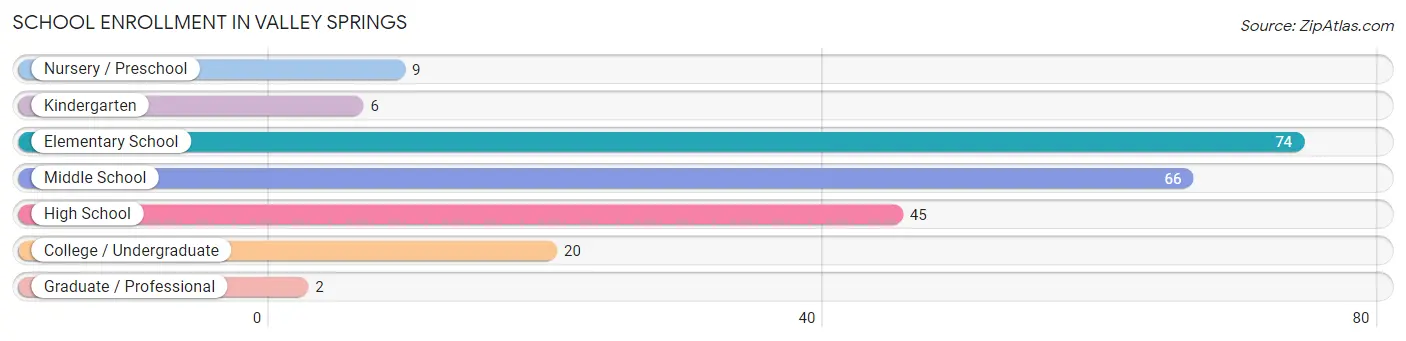
| School Level | # Students | % Students |
| Nursery / Preschool | 9 | 4.1% |
| Kindergarten | 6 | 2.7% |
| Elementary School | 74 | 33.3% |
| Middle School | 66 | 29.7% |
| High School | 45 | 20.3% |
| College / Undergraduate | 20 | 9.0% |
| Graduate / Professional | 2 | 0.9% |
| Total | 222 | 100.0% |
School Enrollment by Age by Funding Source in Valley Springs
Out of a total of 222 students who are enrolled in schools in Valley Springs, 9 (4.1%) attend a private institution, while the remaining 213 (95.9%) are enrolled in public schools. The age group of 3 to 4 year olds has the highest likelihood of being enrolled in private schools, with 2 (100.0% in the age bracket) enrolled. Conversely, the age group of 15 to 17 year olds has the lowest likelihood of being enrolled in a private school, with 38 (100.0% in the age bracket) attending a public institution.
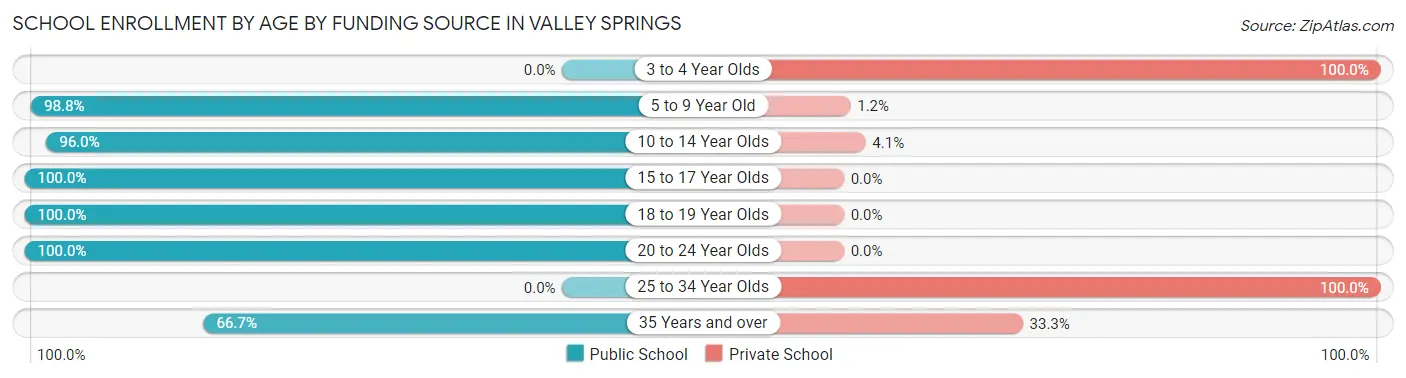
| Age Bracket | Public School | Private School |
| 3 to 4 Year Olds | 0 (0.0%) | 2 (100.0%) |
| 5 to 9 Year Old | 80 (98.8%) | 1 (1.2%) |
| 10 to 14 Year Olds | 71 (96.0%) | 3 (4.1%) |
| 15 to 17 Year Olds | 38 (100.0%) | 0 (0.0%) |
| 18 to 19 Year Olds | 14 (100.0%) | 0 (0.0%) |
| 20 to 24 Year Olds | 8 (100.0%) | 0 (0.0%) |
| 25 to 34 Year Olds | 0 (0.0%) | 2 (100.0%) |
| 35 Years and over | 2 (66.7%) | 1 (33.3%) |
| Total | 213 (95.9%) | 9 (4.1%) |
Educational Attainment by Field of Study in Valley Springs
Business (24 | 25.0%), education (20 | 20.8%), bio, nature & agricultural (13 | 13.5%), engineering (7 | 7.3%), and communications (7 | 7.3%) are the most common fields of study among 96 individuals in Valley Springs who have obtained a bachelor's degree or higher.
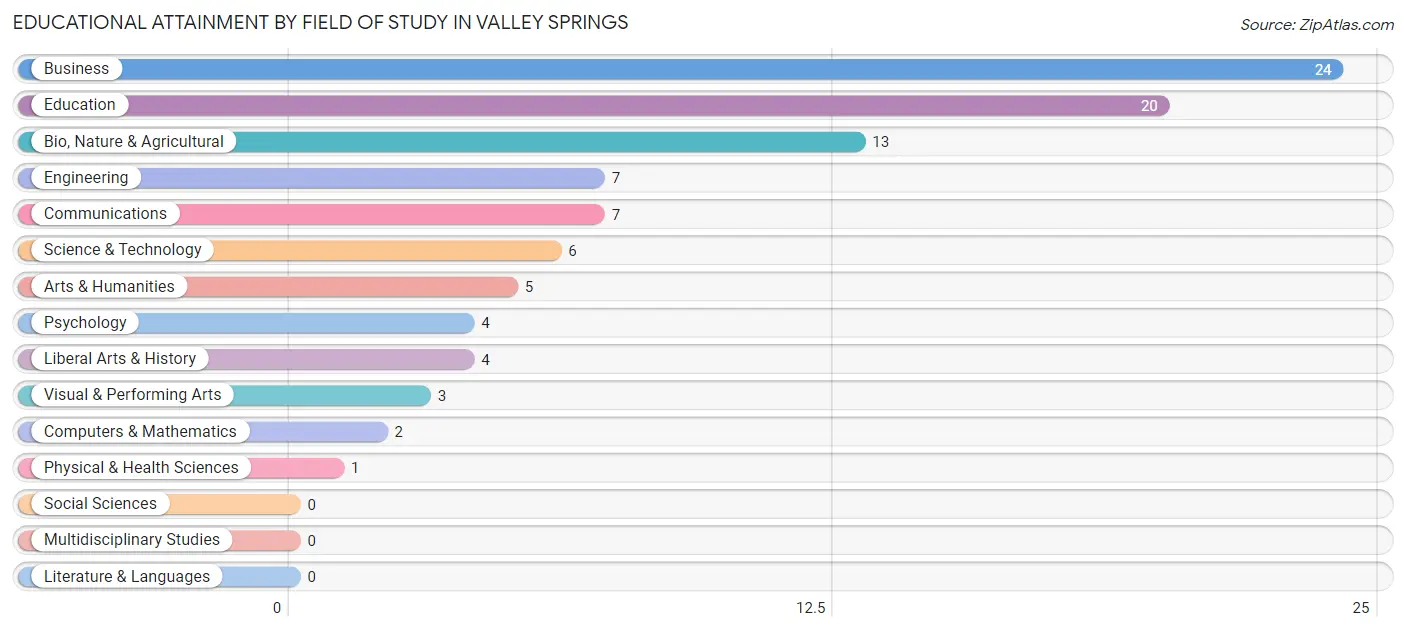
| Field of Study | # Graduates | % Graduates |
| Computers & Mathematics | 2 | 2.1% |
| Bio, Nature & Agricultural | 13 | 13.5% |
| Physical & Health Sciences | 1 | 1.0% |
| Psychology | 4 | 4.2% |
| Social Sciences | 0 | 0.0% |
| Engineering | 7 | 7.3% |
| Multidisciplinary Studies | 0 | 0.0% |
| Science & Technology | 6 | 6.2% |
| Business | 24 | 25.0% |
| Education | 20 | 20.8% |
| Literature & Languages | 0 | 0.0% |
| Liberal Arts & History | 4 | 4.2% |
| Visual & Performing Arts | 3 | 3.1% |
| Communications | 7 | 7.3% |
| Arts & Humanities | 5 | 5.2% |
| Total | 96 | 100.0% |
Transportation & Commute in Valley Springs
Vehicle Availability by Sex in Valley Springs
The most prevalent vehicle ownership categories in Valley Springs are males with 2 vehicles (281, accounting for 64.3%) and females with 2 vehicles (76, making up 159.7%).
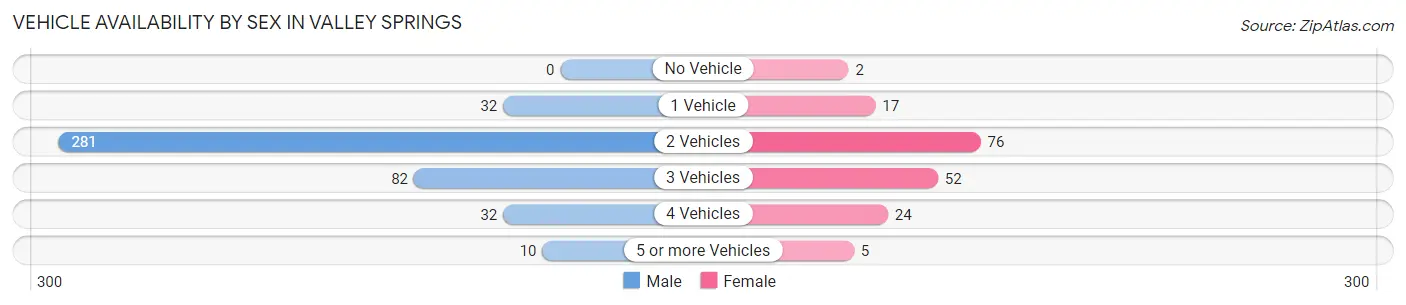
| Vehicles Available | Male | Female |
| No Vehicle | 0 (0.0%) | 2 (1.1%) |
| 1 Vehicle | 32 (7.3%) | 17 (9.7%) |
| 2 Vehicles | 281 (64.3%) | 76 (43.2%) |
| 3 Vehicles | 82 (18.8%) | 52 (29.5%) |
| 4 Vehicles | 32 (7.3%) | 24 (13.6%) |
| 5 or more Vehicles | 10 (2.3%) | 5 (2.8%) |
| Total | 437 (100.0%) | 176 (100.0%) |
Commute Time in Valley Springs
The most frequently occuring commute durations in Valley Springs are 20 to 24 minutes (291 commuters, 49.2%), 30 to 34 minutes (71 commuters, 12.0%), and 15 to 19 minutes (70 commuters, 11.8%).
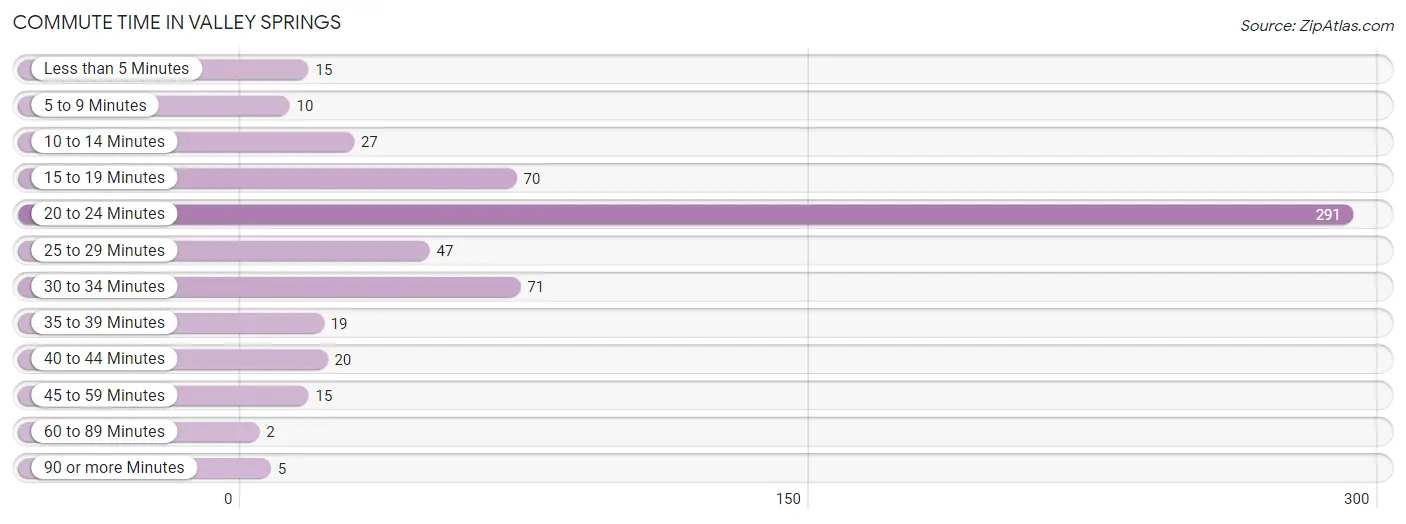
| Commute Time | # Commuters | % Commuters |
| Less than 5 Minutes | 15 | 2.5% |
| 5 to 9 Minutes | 10 | 1.7% |
| 10 to 14 Minutes | 27 | 4.6% |
| 15 to 19 Minutes | 70 | 11.8% |
| 20 to 24 Minutes | 291 | 49.2% |
| 25 to 29 Minutes | 47 | 7.9% |
| 30 to 34 Minutes | 71 | 12.0% |
| 35 to 39 Minutes | 19 | 3.2% |
| 40 to 44 Minutes | 20 | 3.4% |
| 45 to 59 Minutes | 15 | 2.5% |
| 60 to 89 Minutes | 2 | 0.3% |
| 90 or more Minutes | 5 | 0.8% |
Commute Time by Sex in Valley Springs
The most common commute times in Valley Springs are 20 to 24 minutes (257 commuters, 59.1%) for males and 20 to 24 minutes (34 commuters, 21.7%) for females.
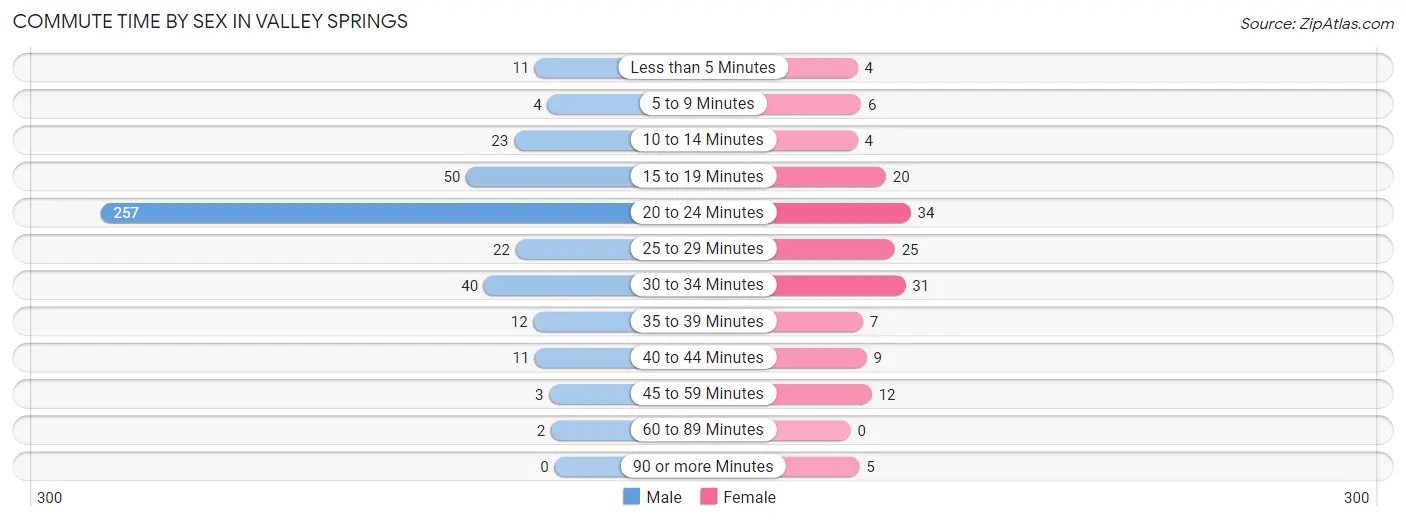
| Commute Time | Male | Female |
| Less than 5 Minutes | 11 (2.5%) | 4 (2.5%) |
| 5 to 9 Minutes | 4 (0.9%) | 6 (3.8%) |
| 10 to 14 Minutes | 23 (5.3%) | 4 (2.5%) |
| 15 to 19 Minutes | 50 (11.5%) | 20 (12.7%) |
| 20 to 24 Minutes | 257 (59.1%) | 34 (21.7%) |
| 25 to 29 Minutes | 22 (5.1%) | 25 (15.9%) |
| 30 to 34 Minutes | 40 (9.2%) | 31 (19.8%) |
| 35 to 39 Minutes | 12 (2.8%) | 7 (4.5%) |
| 40 to 44 Minutes | 11 (2.5%) | 9 (5.7%) |
| 45 to 59 Minutes | 3 (0.7%) | 12 (7.6%) |
| 60 to 89 Minutes | 2 (0.5%) | 0 (0.0%) |
| 90 or more Minutes | 0 (0.0%) | 5 (3.2%) |
Time of Departure to Work by Sex in Valley Springs
The most frequent times of departure to work in Valley Springs are 7:00 AM to 7:29 AM (179, 41.1%) for males and 7:00 AM to 7:29 AM (35, 22.3%) for females.
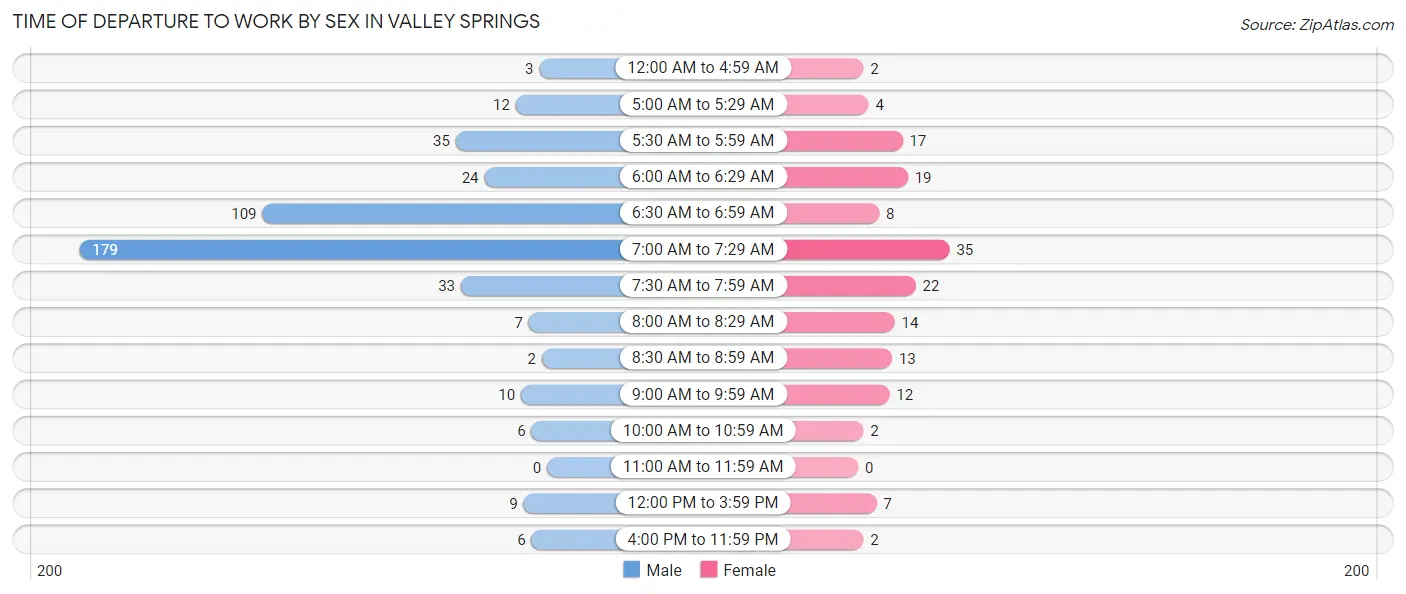
| Time of Departure | Male | Female |
| 12:00 AM to 4:59 AM | 3 (0.7%) | 2 (1.3%) |
| 5:00 AM to 5:29 AM | 12 (2.8%) | 4 (2.5%) |
| 5:30 AM to 5:59 AM | 35 (8.1%) | 17 (10.8%) |
| 6:00 AM to 6:29 AM | 24 (5.5%) | 19 (12.1%) |
| 6:30 AM to 6:59 AM | 109 (25.1%) | 8 (5.1%) |
| 7:00 AM to 7:29 AM | 179 (41.1%) | 35 (22.3%) |
| 7:30 AM to 7:59 AM | 33 (7.6%) | 22 (14.0%) |
| 8:00 AM to 8:29 AM | 7 (1.6%) | 14 (8.9%) |
| 8:30 AM to 8:59 AM | 2 (0.5%) | 13 (8.3%) |
| 9:00 AM to 9:59 AM | 10 (2.3%) | 12 (7.6%) |
| 10:00 AM to 10:59 AM | 6 (1.4%) | 2 (1.3%) |
| 11:00 AM to 11:59 AM | 0 (0.0%) | 0 (0.0%) |
| 12:00 PM to 3:59 PM | 9 (2.1%) | 7 (4.5%) |
| 4:00 PM to 11:59 PM | 6 (1.4%) | 2 (1.3%) |
| Total | 435 (100.0%) | 157 (100.0%) |
Housing Occupancy in Valley Springs
Occupancy by Ownership in Valley Springs
Of the total 330 dwellings in Valley Springs, owner-occupied units account for 265 (80.3%), while renter-occupied units make up 65 (19.7%).
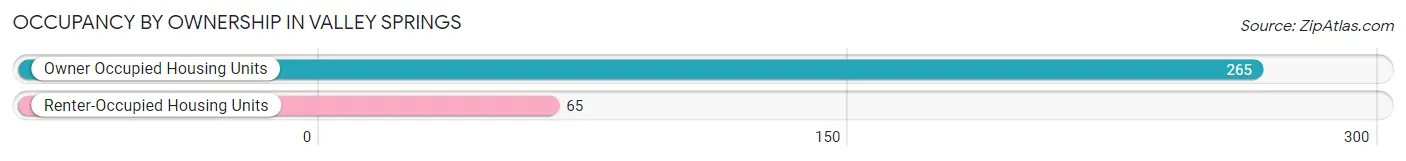
| Occupancy | # Housing Units | % Housing Units |
| Owner Occupied Housing Units | 265 | 80.3% |
| Renter-Occupied Housing Units | 65 | 19.7% |
| Total Occupied Housing Units | 330 | 100.0% |
Occupancy by Household Size in Valley Springs
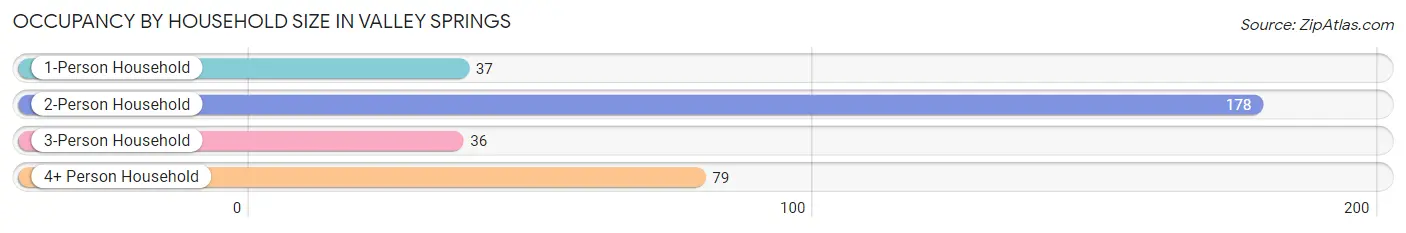
| Household Size | # Housing Units | % Housing Units |
| 1-Person Household | 37 | 11.2% |
| 2-Person Household | 178 | 53.9% |
| 3-Person Household | 36 | 10.9% |
| 4+ Person Household | 79 | 23.9% |
| Total Housing Units | 330 | 100.0% |
Occupancy by Ownership by Household Size in Valley Springs
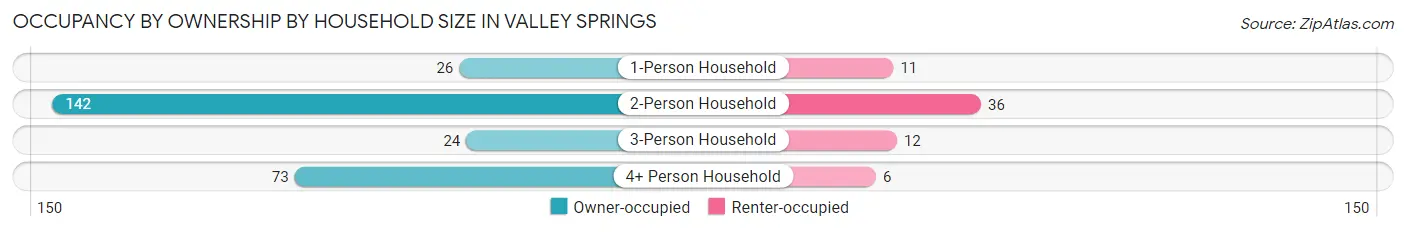
| Household Size | Owner-occupied | Renter-occupied |
| 1-Person Household | 26 (70.3%) | 11 (29.7%) |
| 2-Person Household | 142 (79.8%) | 36 (20.2%) |
| 3-Person Household | 24 (66.7%) | 12 (33.3%) |
| 4+ Person Household | 73 (92.4%) | 6 (7.6%) |
| Total Housing Units | 265 (80.3%) | 65 (19.7%) |
Occupancy by Educational Attainment in Valley Springs
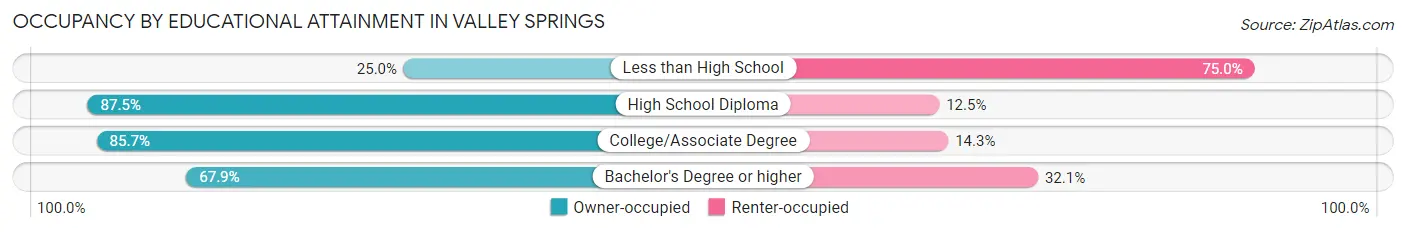
| Household Size | Owner-occupied | Renter-occupied |
| Less than High School | 4 (25.0%) | 12 (75.0%) |
| High School Diploma | 63 (87.5%) | 9 (12.5%) |
| College/Associate Degree | 162 (85.7%) | 27 (14.3%) |
| Bachelor's Degree or higher | 36 (67.9%) | 17 (32.1%) |
Occupancy by Age of Householder in Valley Springs
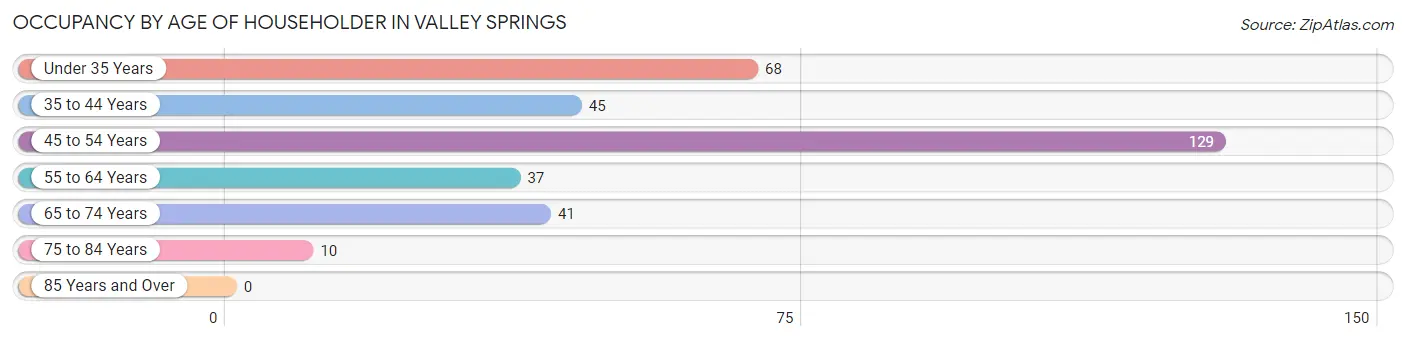
| Age Bracket | # Households | % Households |
| Under 35 Years | 68 | 20.6% |
| 35 to 44 Years | 45 | 13.6% |
| 45 to 54 Years | 129 | 39.1% |
| 55 to 64 Years | 37 | 11.2% |
| 65 to 74 Years | 41 | 12.4% |
| 75 to 84 Years | 10 | 3.0% |
| 85 Years and Over | 0 | 0.0% |
| Total | 330 | 100.0% |
Housing Finances in Valley Springs
Median Income by Occupancy in Valley Springs
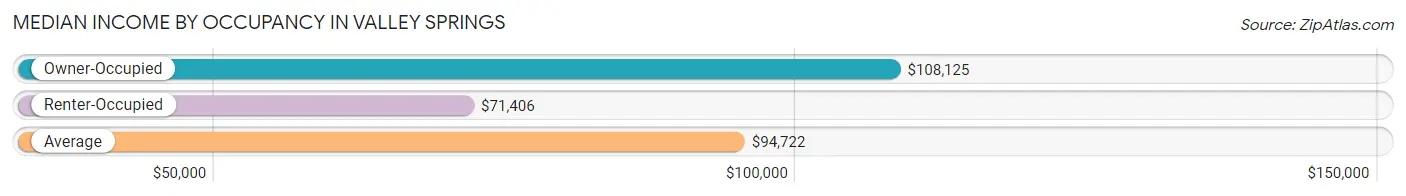
| Occupancy Type | # Households | Median Income |
| Owner-Occupied | 265 (80.3%) | $108,125 |
| Renter-Occupied | 65 (19.7%) | $71,406 |
| Average | 330 (100.0%) | $94,722 |
Occupancy by Householder Income Bracket in Valley Springs
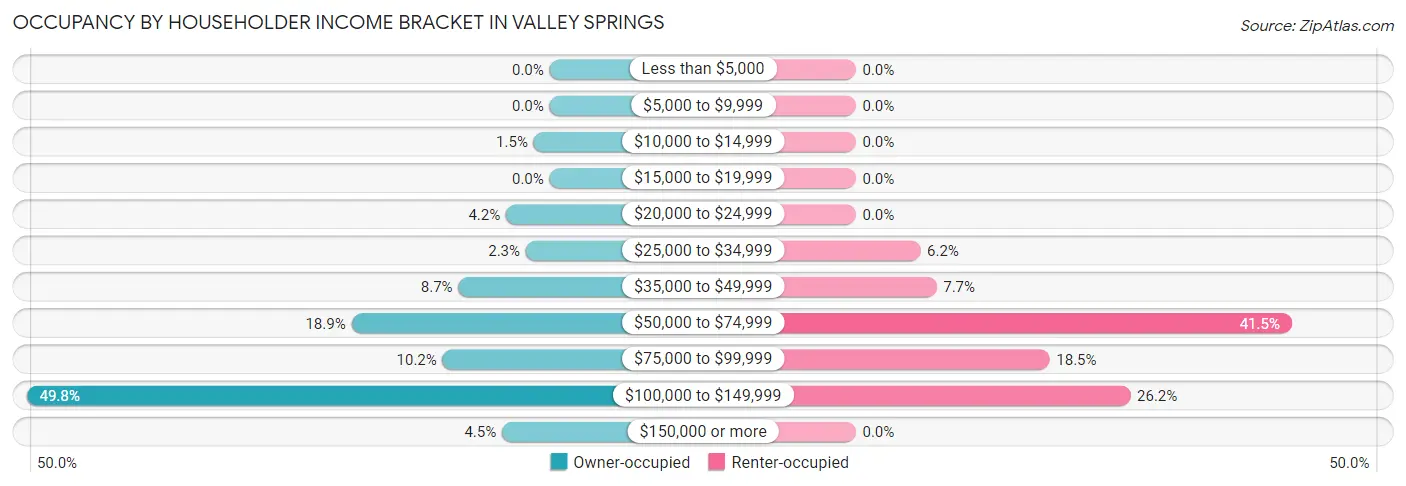
| Income Bracket | Owner-occupied | Renter-occupied |
| Less than $5,000 | 0 (0.0%) | 0 (0.0%) |
| $5,000 to $9,999 | 0 (0.0%) | 0 (0.0%) |
| $10,000 to $14,999 | 4 (1.5%) | 0 (0.0%) |
| $15,000 to $19,999 | 0 (0.0%) | 0 (0.0%) |
| $20,000 to $24,999 | 11 (4.2%) | 0 (0.0%) |
| $25,000 to $34,999 | 6 (2.3%) | 4 (6.1%) |
| $35,000 to $49,999 | 23 (8.7%) | 5 (7.7%) |
| $50,000 to $74,999 | 50 (18.9%) | 27 (41.5%) |
| $75,000 to $99,999 | 27 (10.2%) | 12 (18.5%) |
| $100,000 to $149,999 | 132 (49.8%) | 17 (26.2%) |
| $150,000 or more | 12 (4.5%) | 0 (0.0%) |
| Total | 265 (100.0%) | 65 (100.0%) |
Monthly Housing Cost Tiers in Valley Springs
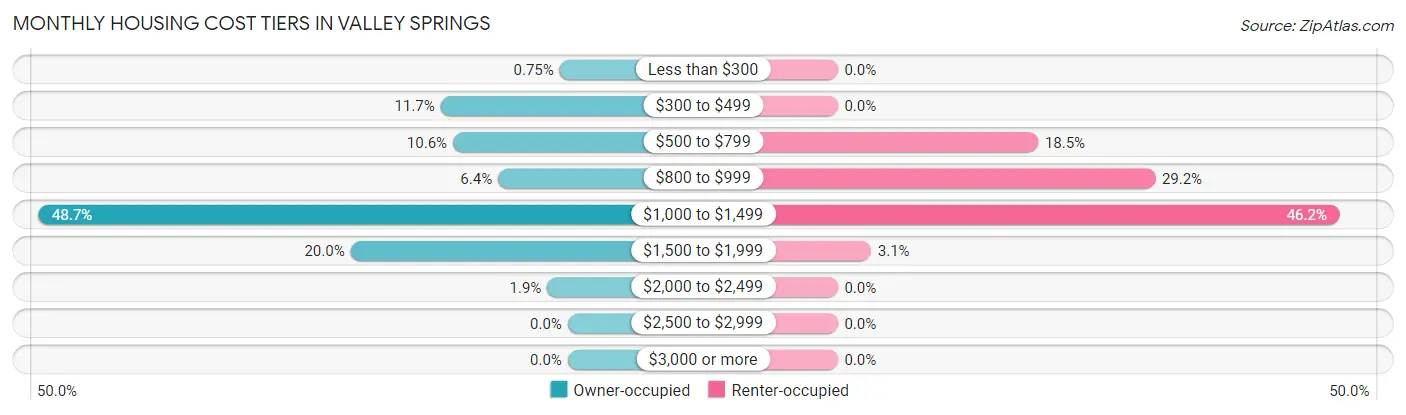
| Monthly Cost | Owner-occupied | Renter-occupied |
| Less than $300 | 2 (0.7%) | 0 (0.0%) |
| $300 to $499 | 31 (11.7%) | 0 (0.0%) |
| $500 to $799 | 28 (10.6%) | 12 (18.5%) |
| $800 to $999 | 17 (6.4%) | 19 (29.2%) |
| $1,000 to $1,499 | 129 (48.7%) | 30 (46.2%) |
| $1,500 to $1,999 | 53 (20.0%) | 2 (3.1%) |
| $2,000 to $2,499 | 5 (1.9%) | 0 (0.0%) |
| $2,500 to $2,999 | 0 (0.0%) | 0 (0.0%) |
| $3,000 or more | 0 (0.0%) | 0 (0.0%) |
| Total | 265 (100.0%) | 65 (100.0%) |
Physical Housing Characteristics in Valley Springs
Housing Structures in Valley Springs
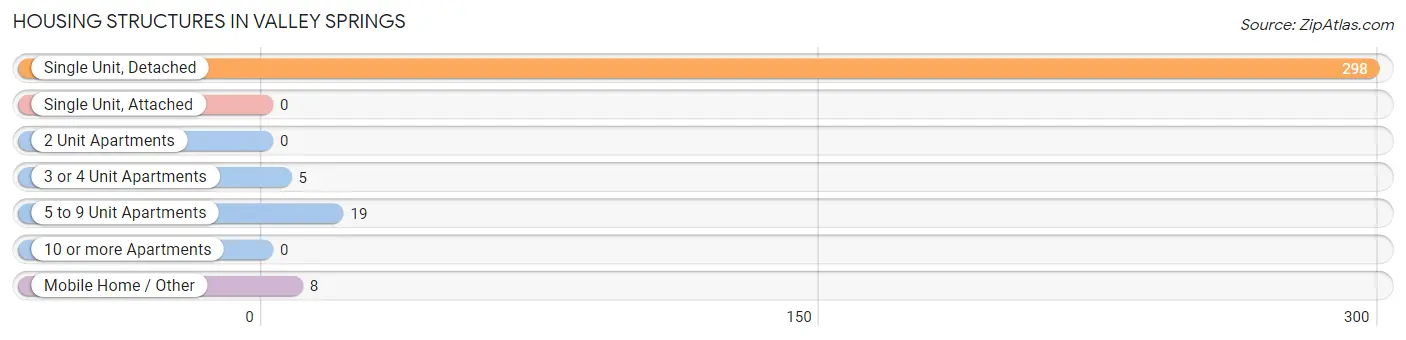
| Structure Type | # Housing Units | % Housing Units |
| Single Unit, Detached | 298 | 90.3% |
| Single Unit, Attached | 0 | 0.0% |
| 2 Unit Apartments | 0 | 0.0% |
| 3 or 4 Unit Apartments | 5 | 1.5% |
| 5 to 9 Unit Apartments | 19 | 5.8% |
| 10 or more Apartments | 0 | 0.0% |
| Mobile Home / Other | 8 | 2.4% |
| Total | 330 | 100.0% |
Housing Structures by Occupancy in Valley Springs
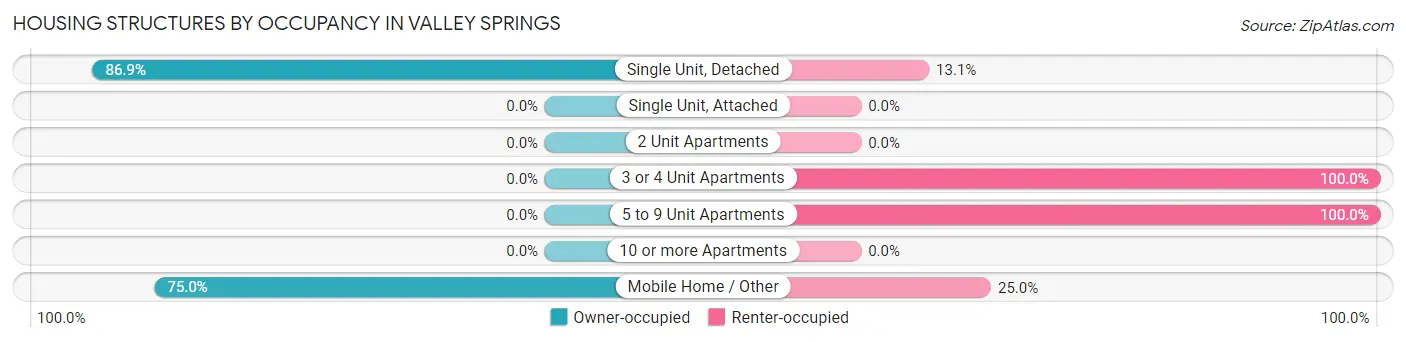
| Structure Type | Owner-occupied | Renter-occupied |
| Single Unit, Detached | 259 (86.9%) | 39 (13.1%) |
| Single Unit, Attached | 0 (0.0%) | 0 (0.0%) |
| 2 Unit Apartments | 0 (0.0%) | 0 (0.0%) |
| 3 or 4 Unit Apartments | 0 (0.0%) | 5 (100.0%) |
| 5 to 9 Unit Apartments | 0 (0.0%) | 19 (100.0%) |
| 10 or more Apartments | 0 (0.0%) | 0 (0.0%) |
| Mobile Home / Other | 6 (75.0%) | 2 (25.0%) |
| Total | 265 (80.3%) | 65 (19.7%) |
Housing Structures by Number of Rooms in Valley Springs
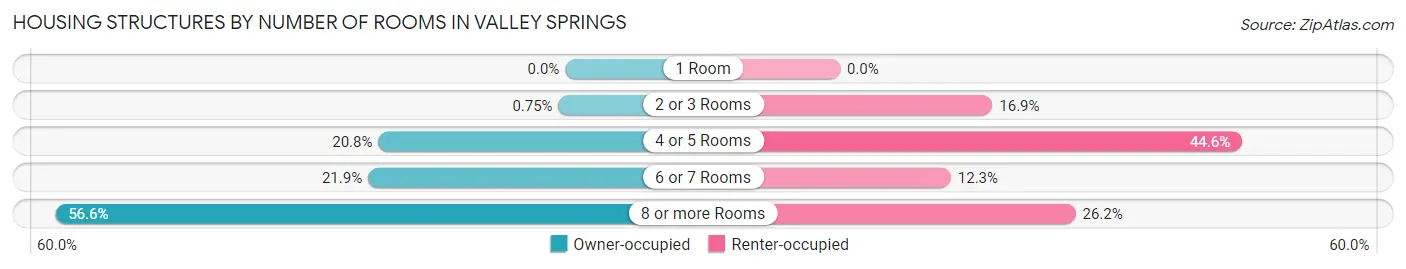
| Number of Rooms | Owner-occupied | Renter-occupied |
| 1 Room | 0 (0.0%) | 0 (0.0%) |
| 2 or 3 Rooms | 2 (0.7%) | 11 (16.9%) |
| 4 or 5 Rooms | 55 (20.7%) | 29 (44.6%) |
| 6 or 7 Rooms | 58 (21.9%) | 8 (12.3%) |
| 8 or more Rooms | 150 (56.6%) | 17 (26.2%) |
| Total | 265 (100.0%) | 65 (100.0%) |
Housing Structure by Heating Type in Valley Springs
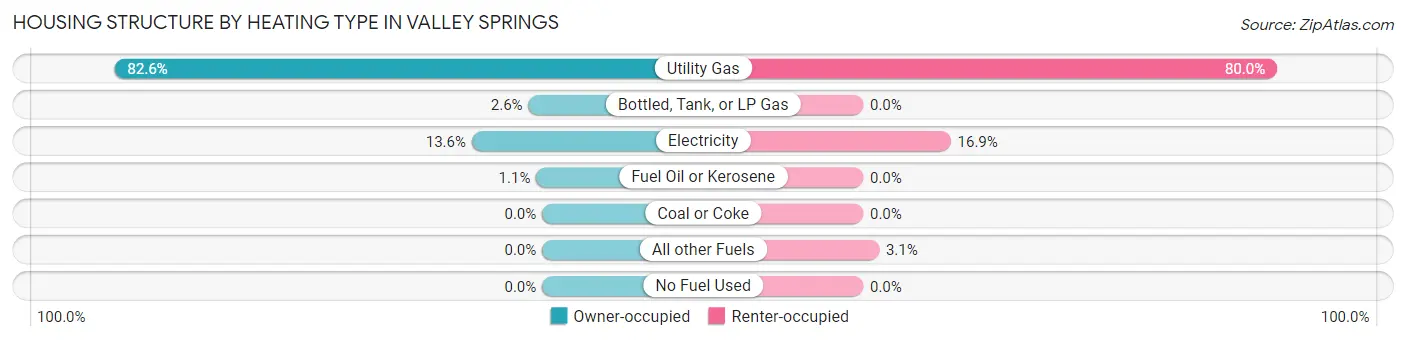
| Heating Type | Owner-occupied | Renter-occupied |
| Utility Gas | 219 (82.6%) | 52 (80.0%) |
| Bottled, Tank, or LP Gas | 7 (2.6%) | 0 (0.0%) |
| Electricity | 36 (13.6%) | 11 (16.9%) |
| Fuel Oil or Kerosene | 3 (1.1%) | 0 (0.0%) |
| Coal or Coke | 0 (0.0%) | 0 (0.0%) |
| All other Fuels | 0 (0.0%) | 2 (3.1%) |
| No Fuel Used | 0 (0.0%) | 0 (0.0%) |
| Total | 265 (100.0%) | 65 (100.0%) |
Household Vehicle Usage in Valley Springs
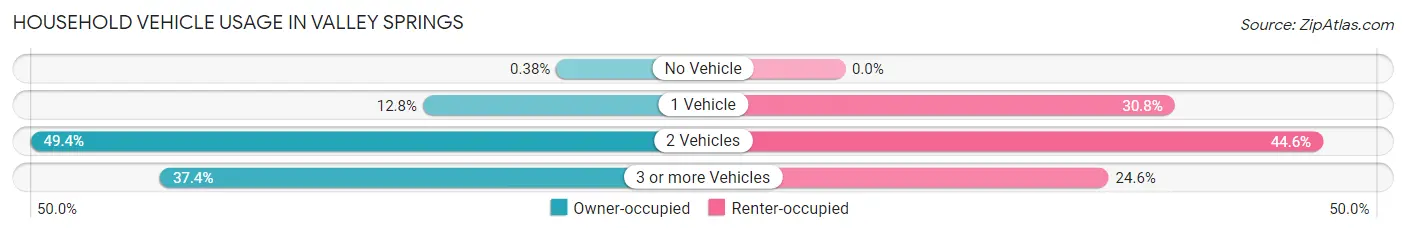
| Vehicles per Household | Owner-occupied | Renter-occupied |
| No Vehicle | 1 (0.4%) | 0 (0.0%) |
| 1 Vehicle | 34 (12.8%) | 20 (30.8%) |
| 2 Vehicles | 131 (49.4%) | 29 (44.6%) |
| 3 or more Vehicles | 99 (37.4%) | 16 (24.6%) |
| Total | 265 (100.0%) | 65 (100.0%) |
Real Estate & Mortgages in Valley Springs
Real Estate and Mortgage Overview in Valley Springs
| Characteristic | Without Mortgage | With Mortgage |
| Housing Units | 60 | 205 |
| Median Property Value | $165,600 | $146,600 |
| Median Household Income | $60,625 | $9 |
| Monthly Housing Costs | $493 | $0 |
| Real Estate Taxes | $2,000 | $0 |
Property Value by Mortgage Status in Valley Springs
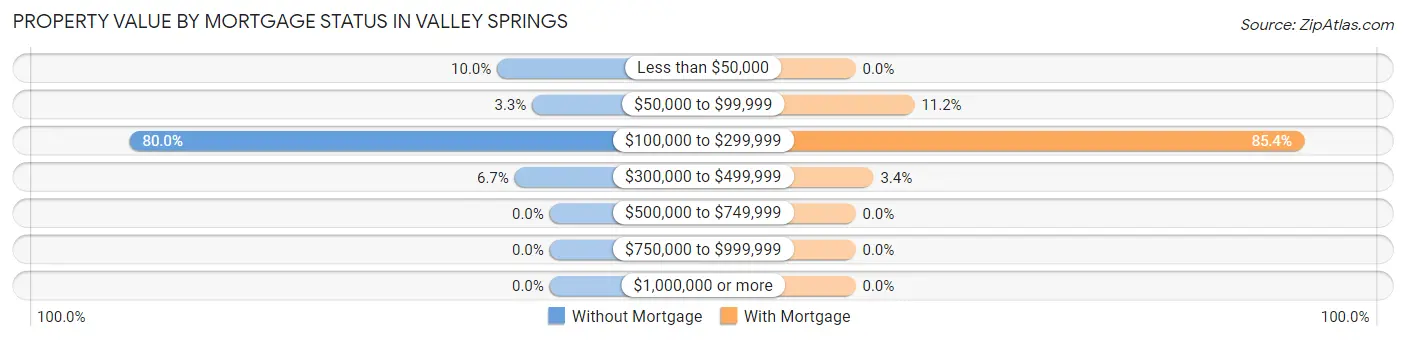
| Property Value | Without Mortgage | With Mortgage |
| Less than $50,000 | 6 (10.0%) | 0 (0.0%) |
| $50,000 to $99,999 | 2 (3.3%) | 23 (11.2%) |
| $100,000 to $299,999 | 48 (80.0%) | 175 (85.4%) |
| $300,000 to $499,999 | 4 (6.7%) | 7 (3.4%) |
| $500,000 to $749,999 | 0 (0.0%) | 0 (0.0%) |
| $750,000 to $999,999 | 0 (0.0%) | 0 (0.0%) |
| $1,000,000 or more | 0 (0.0%) | 0 (0.0%) |
| Total | 60 (100.0%) | 205 (100.0%) |
Household Income by Mortgage Status in Valley Springs
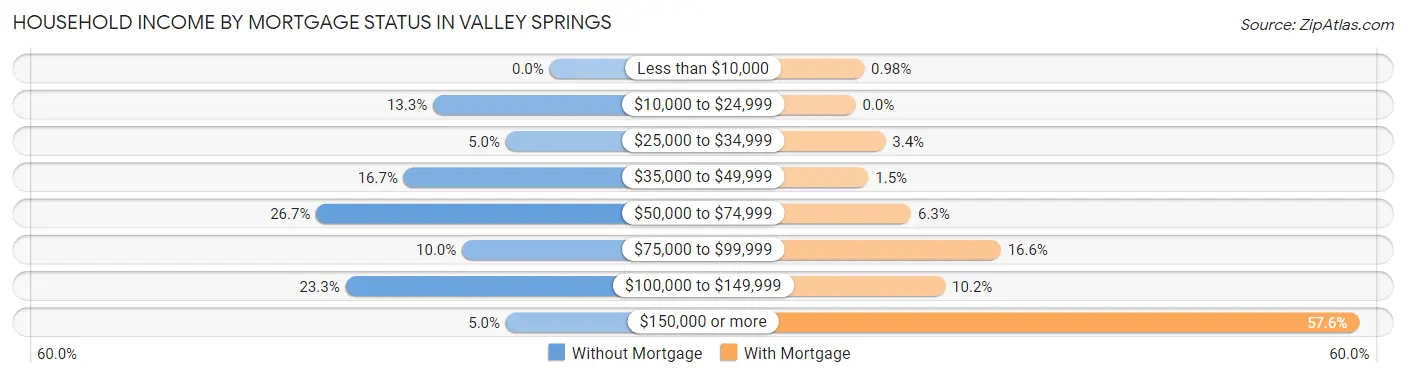
| Household Income | Without Mortgage | With Mortgage |
| Less than $10,000 | 0 (0.0%) | 2 (1.0%) |
| $10,000 to $24,999 | 8 (13.3%) | 0 (0.0%) |
| $25,000 to $34,999 | 3 (5.0%) | 7 (3.4%) |
| $35,000 to $49,999 | 10 (16.7%) | 3 (1.5%) |
| $50,000 to $74,999 | 16 (26.7%) | 13 (6.3%) |
| $75,000 to $99,999 | 6 (10.0%) | 34 (16.6%) |
| $100,000 to $149,999 | 14 (23.3%) | 21 (10.2%) |
| $150,000 or more | 3 (5.0%) | 118 (57.6%) |
| Total | 60 (100.0%) | 205 (100.0%) |
Property Value to Household Income Ratio in Valley Springs
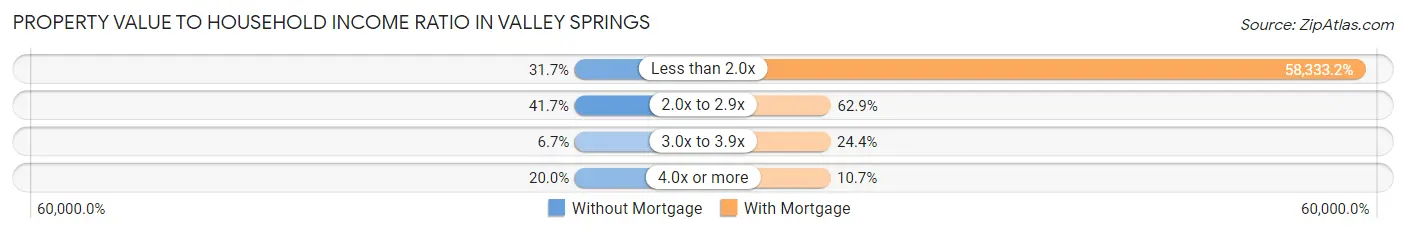
| Value-to-Income Ratio | Without Mortgage | With Mortgage |
| Less than 2.0x | 19 (31.7%) | 119,583 (58,333.2%) |
| 2.0x to 2.9x | 25 (41.7%) | 129 (62.9%) |
| 3.0x to 3.9x | 4 (6.7%) | 50 (24.4%) |
| 4.0x or more | 12 (20.0%) | 22 (10.7%) |
| Total | 60 (100.0%) | 205 (100.0%) |
Real Estate Taxes by Mortgage Status in Valley Springs
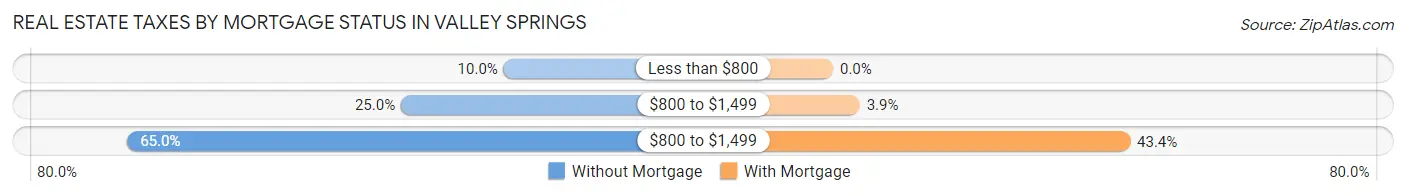
| Property Taxes | Without Mortgage | With Mortgage |
| Less than $800 | 6 (10.0%) | 0 (0.0%) |
| $800 to $1,499 | 15 (25.0%) | 8 (3.9%) |
| $800 to $1,499 | 39 (65.0%) | 89 (43.4%) |
| Total | 60 (100.0%) | 205 (100.0%) |
Health & Disability in Valley Springs
Health Insurance Coverage by Age in Valley Springs
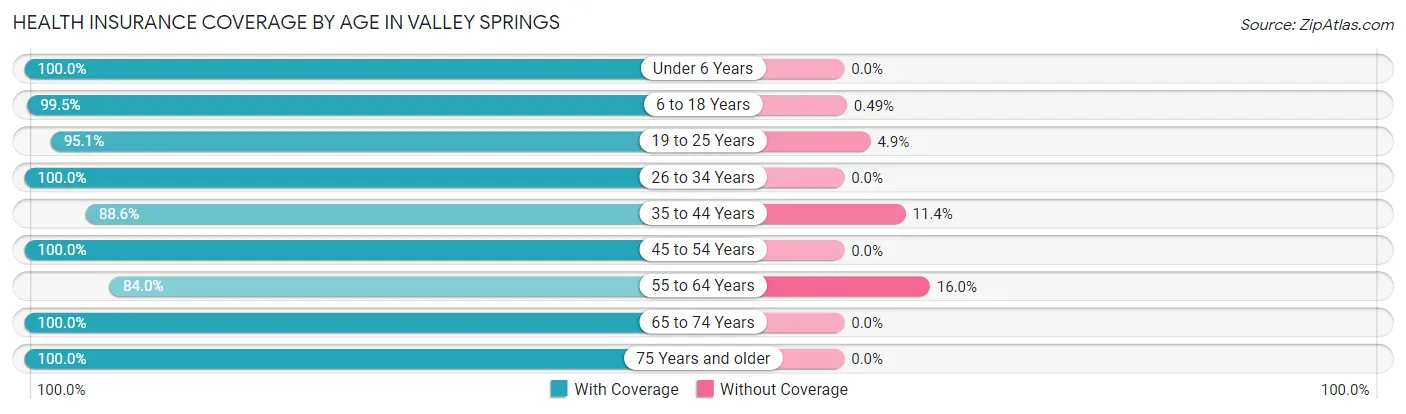
| Age Bracket | With Coverage | Without Coverage |
| Under 6 Years | 40 (100.0%) | 0 (0.0%) |
| 6 to 18 Years | 204 (99.5%) | 1 (0.5%) |
| 19 to 25 Years | 39 (95.1%) | 2 (4.9%) |
| 26 to 34 Years | 104 (100.0%) | 0 (0.0%) |
| 35 to 44 Years | 93 (88.6%) | 12 (11.4%) |
| 45 to 54 Years | 293 (100.0%) | 0 (0.0%) |
| 55 to 64 Years | 79 (84.0%) | 15 (16.0%) |
| 65 to 74 Years | 60 (100.0%) | 0 (0.0%) |
| 75 Years and older | 17 (100.0%) | 0 (0.0%) |
| Total | 929 (96.9%) | 30 (3.1%) |
Health Insurance Coverage by Citizenship Status in Valley Springs
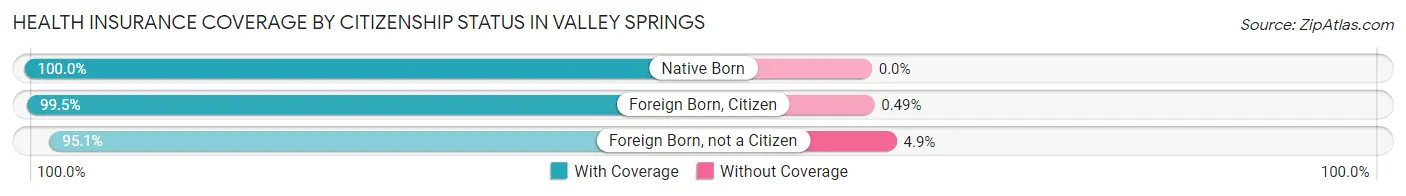
| Citizenship Status | With Coverage | Without Coverage |
| Native Born | 40 (100.0%) | 0 (0.0%) |
| Foreign Born, Citizen | 204 (99.5%) | 1 (0.5%) |
| Foreign Born, not a Citizen | 39 (95.1%) | 2 (4.9%) |
Health Insurance Coverage by Household Income in Valley Springs
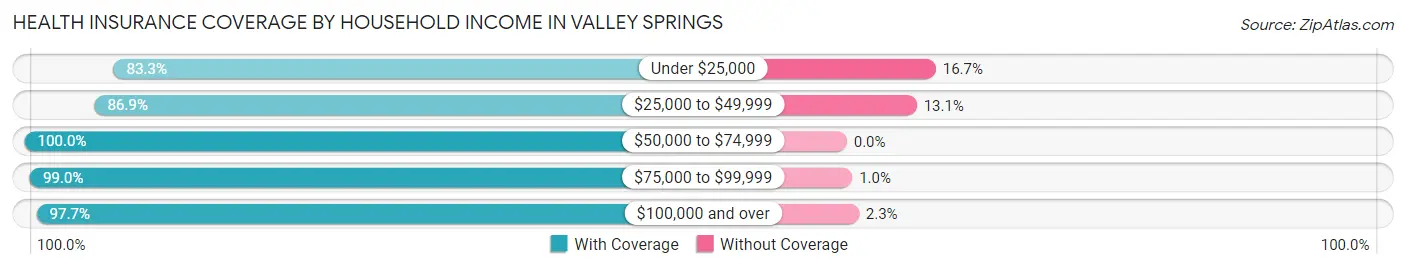
| Household Income | With Coverage | Without Coverage |
| Under $25,000 | 30 (83.3%) | 6 (16.7%) |
| $25,000 to $49,999 | 73 (86.9%) | 11 (13.1%) |
| $50,000 to $74,999 | 209 (100.0%) | 0 (0.0%) |
| $75,000 to $99,999 | 98 (99.0%) | 1 (1.0%) |
| $100,000 and over | 519 (97.7%) | 12 (2.3%) |
Public vs Private Health Insurance Coverage by Age in Valley Springs
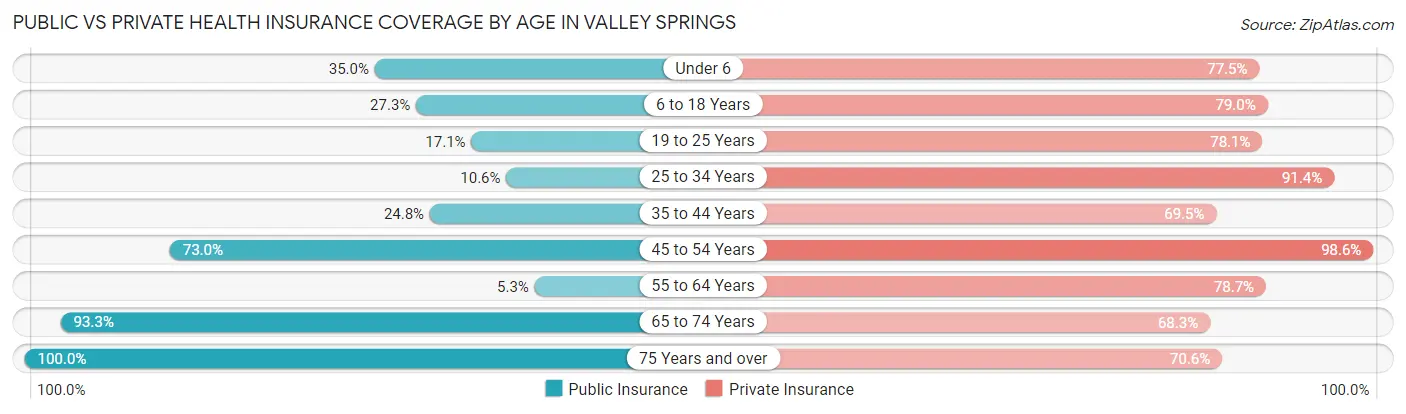
| Age Bracket | Public Insurance | Private Insurance |
| Under 6 | 14 (35.0%) | 31 (77.5%) |
| 6 to 18 Years | 56 (27.3%) | 162 (79.0%) |
| 19 to 25 Years | 7 (17.1%) | 32 (78.0%) |
| 25 to 34 Years | 11 (10.6%) | 95 (91.3%) |
| 35 to 44 Years | 26 (24.8%) | 73 (69.5%) |
| 45 to 54 Years | 214 (73.0%) | 289 (98.6%) |
| 55 to 64 Years | 5 (5.3%) | 74 (78.7%) |
| 65 to 74 Years | 56 (93.3%) | 41 (68.3%) |
| 75 Years and over | 17 (100.0%) | 12 (70.6%) |
| Total | 406 (42.3%) | 809 (84.4%) |
Disability Status by Sex by Age in Valley Springs
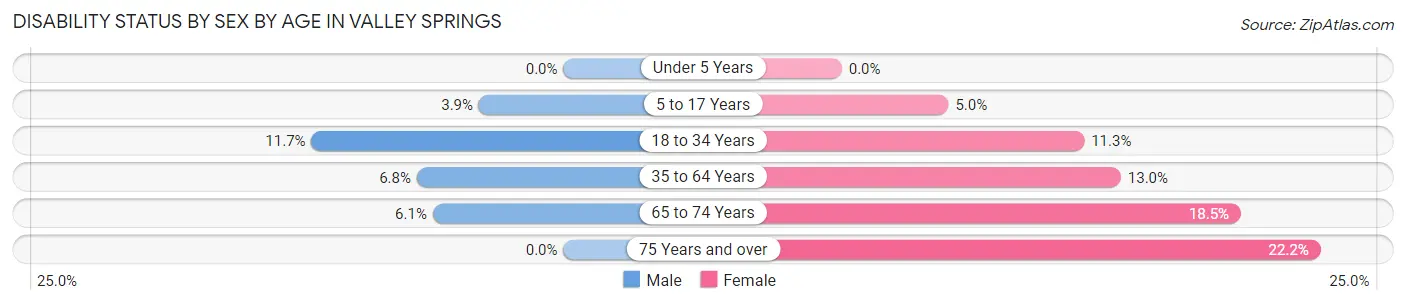
| Age Bracket | Male | Female |
| Under 5 Years | 0 (0.0%) | 0 (0.0%) |
| 5 to 17 Years | 4 (3.9%) | 5 (5.0%) |
| 18 to 34 Years | 9 (11.7%) | 9 (11.3%) |
| 35 to 64 Years | 24 (6.8%) | 18 (13.0%) |
| 65 to 74 Years | 2 (6.1%) | 5 (18.5%) |
| 75 Years and over | 0 (0.0%) | 2 (22.2%) |
Disability Class by Sex by Age in Valley Springs
Disability Class: Hearing Difficulty
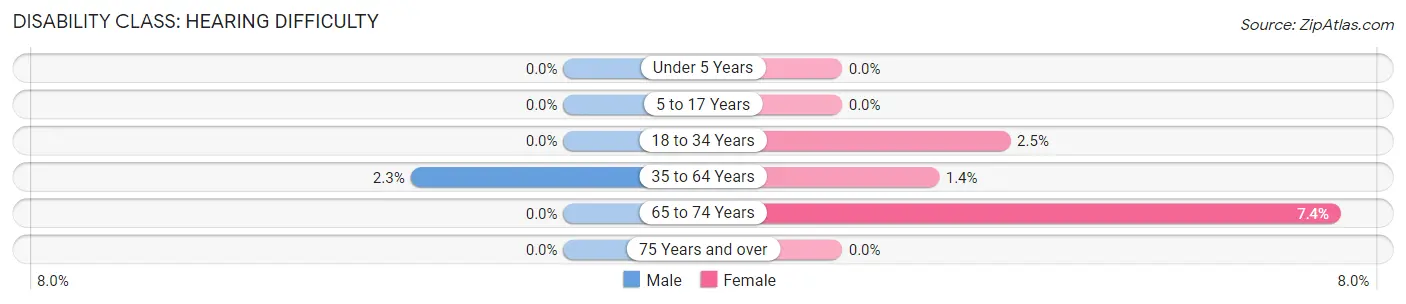
| Age Bracket | Male | Female |
| Under 5 Years | 0 (0.0%) | 0 (0.0%) |
| 5 to 17 Years | 0 (0.0%) | 0 (0.0%) |
| 18 to 34 Years | 0 (0.0%) | 2 (2.5%) |
| 35 to 64 Years | 8 (2.3%) | 2 (1.4%) |
| 65 to 74 Years | 0 (0.0%) | 2 (7.4%) |
| 75 Years and over | 0 (0.0%) | 0 (0.0%) |
Disability Class: Vision Difficulty
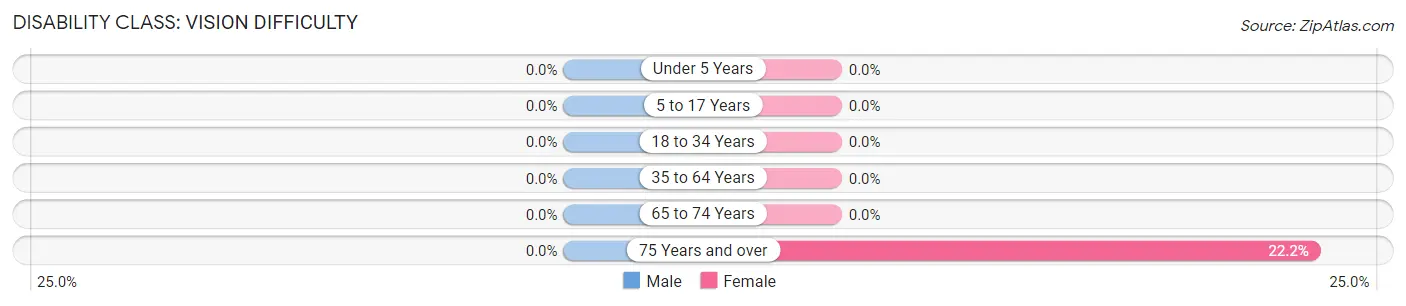
| Age Bracket | Male | Female |
| Under 5 Years | 0 (0.0%) | 0 (0.0%) |
| 5 to 17 Years | 0 (0.0%) | 0 (0.0%) |
| 18 to 34 Years | 0 (0.0%) | 0 (0.0%) |
| 35 to 64 Years | 0 (0.0%) | 0 (0.0%) |
| 65 to 74 Years | 0 (0.0%) | 0 (0.0%) |
| 75 Years and over | 0 (0.0%) | 2 (22.2%) |
Disability Class: Cognitive Difficulty
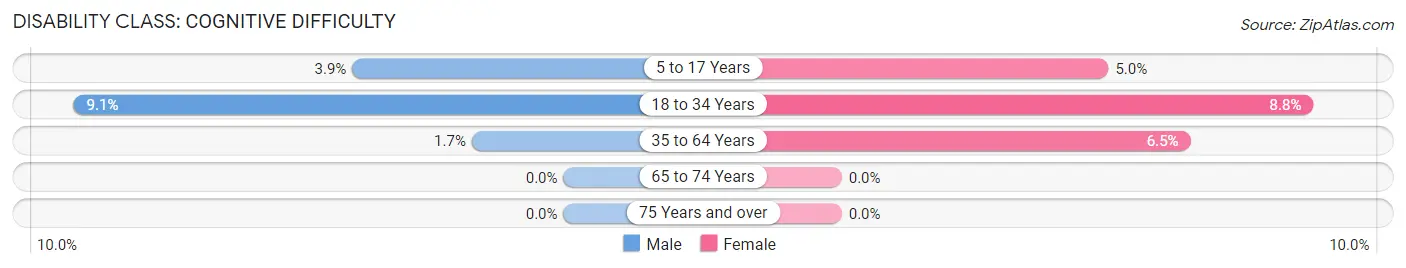
| Age Bracket | Male | Female |
| 5 to 17 Years | 4 (3.9%) | 5 (5.0%) |
| 18 to 34 Years | 7 (9.1%) | 7 (8.7%) |
| 35 to 64 Years | 6 (1.7%) | 9 (6.5%) |
| 65 to 74 Years | 0 (0.0%) | 0 (0.0%) |
| 75 Years and over | 0 (0.0%) | 0 (0.0%) |
Disability Class: Ambulatory Difficulty
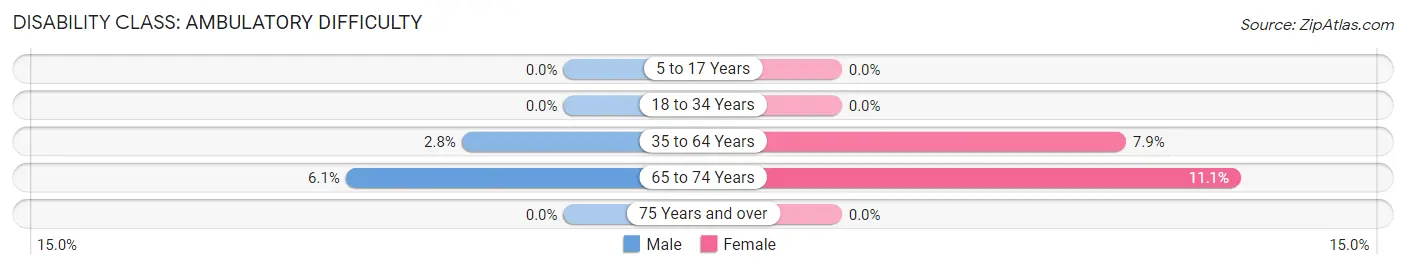
| Age Bracket | Male | Female |
| 5 to 17 Years | 0 (0.0%) | 0 (0.0%) |
| 18 to 34 Years | 0 (0.0%) | 0 (0.0%) |
| 35 to 64 Years | 10 (2.8%) | 11 (7.9%) |
| 65 to 74 Years | 2 (6.1%) | 3 (11.1%) |
| 75 Years and over | 0 (0.0%) | 0 (0.0%) |
Disability Class: Self-Care Difficulty
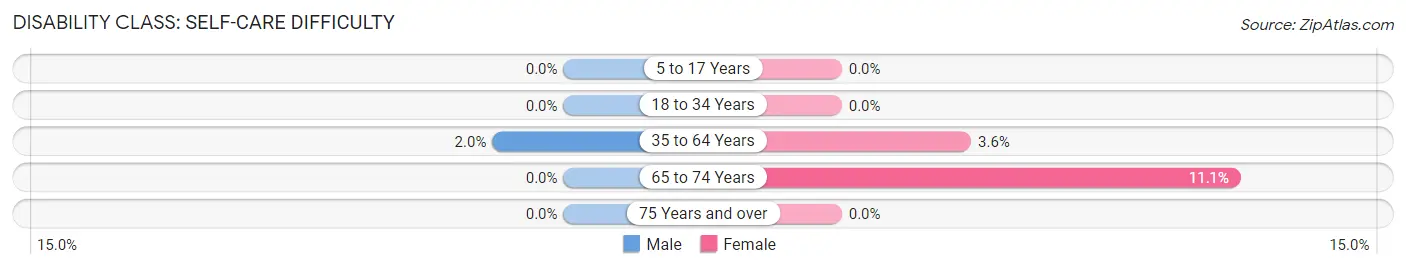
| Age Bracket | Male | Female |
| 5 to 17 Years | 0 (0.0%) | 0 (0.0%) |
| 18 to 34 Years | 0 (0.0%) | 0 (0.0%) |
| 35 to 64 Years | 7 (2.0%) | 5 (3.6%) |
| 65 to 74 Years | 0 (0.0%) | 3 (11.1%) |
| 75 Years and over | 0 (0.0%) | 0 (0.0%) |
Technology Access in Valley Springs
Computing Device Access in Valley Springs
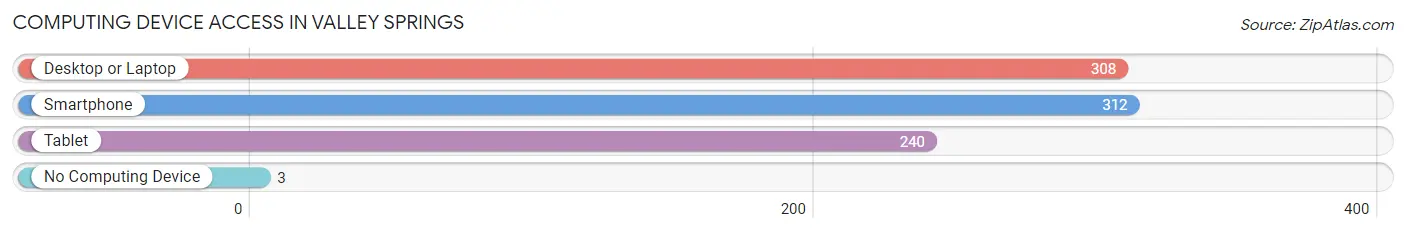
| Device Type | # Households | % Households |
| Desktop or Laptop | 308 | 93.3% |
| Smartphone | 312 | 94.6% |
| Tablet | 240 | 72.7% |
| No Computing Device | 3 | 0.9% |
| Total | 330 | 100.0% |
Internet Access in Valley Springs
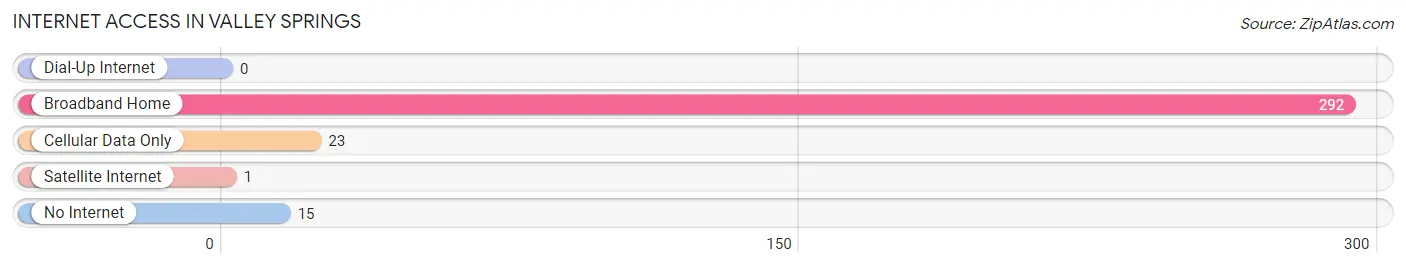
| Internet Type | # Households | % Households |
| Dial-Up Internet | 0 | 0.0% |
| Broadband Home | 292 | 88.5% |
| Cellular Data Only | 23 | 7.0% |
| Satellite Internet | 1 | 0.3% |
| No Internet | 15 | 4.5% |
| Total | 330 | 100.0% |
Valley Springs Summary
Valley Springs is a small town located in Minnehaha County, South Dakota. It is situated on the Big Sioux River, approximately 10 miles south of Sioux Falls. The town was founded in 1881 and has a population of approximately 1,000 people.
History
Valley Springs was founded in 1881 by a group of settlers from Minnesota. The town was named after the nearby Valley Springs, which was a popular destination for settlers. The town was originally a farming community, but soon developed into a small trading center. The first post office was established in 1883 and the first school was built in 1884.
In the early 1900s, the town began to grow and develop. The railroad arrived in 1906, bringing with it new businesses and industry. The town also became a popular tourist destination, with many people coming to visit the nearby Valley Springs.
In the 1950s, the town began to decline as the railroad industry began to decline. However, the town was able to remain a small, rural community. In the late 1990s, the town began to experience a resurgence in growth and development.
Geography
Valley Springs is located in Minnehaha County, South Dakota. It is situated on the Big Sioux River, approximately 10 miles south of Sioux Falls. The town is located in the rolling hills of the Great Plains, with the Big Sioux River running through the center of town. The town is surrounded by farmland and is home to several small lakes.
The climate in Valley Springs is typical of the Great Plains, with hot summers and cold winters. The average temperature in the summer is around 80 degrees Fahrenheit, while the average temperature in the winter is around 20 degrees Fahrenheit.
Economy
Valley Springs is a small, rural community with a population of approximately 1,000 people. The town is primarily a farming community, with many of the residents employed in the agricultural industry. The town also has several small businesses, including a grocery store, a hardware store, and a few restaurants.
The town is also home to several manufacturing companies, including a furniture factory and a plastics factory. The town is also home to a small airport, which serves as a hub for private and commercial flights.
Demographics
As of the 2010 census, the population of Valley Springs was 1,000 people. The racial makeup of the town was 97.2% White, 0.7% African American, 0.3% Native American, 0.2% Asian, 0.1% Pacific Islander, and 1.5% from other races. The median household income was $41,250 and the median family income was $50,000.
Valley Springs is a small, rural community with a population of approximately 1,000 people. The town is primarily a farming community, with many of the residents employed in the agricultural industry. The town also has several small businesses, including a grocery store, a hardware store, and a few restaurants. The town is also home to several manufacturing companies, including a furniture factory and a plastics factory. The town is also home to a small airport, which serves as a hub for private and commercial flights.
Common Questions
What is Per Capita Income in Valley Springs?
Per Capita income in Valley Springs is $40,412.
What is the Median Family Income in Valley Springs?
Median Family Income in Valley Springs is $81,719.
What is the Median Household income in Valley Springs?
Median Household Income in Valley Springs is $94,722.
What is Income or Wage Gap in Valley Springs?
Income or Wage Gap in Valley Springs is 22.0%.
Women in Valley Springs earn 78.0 cents for every dollar earned by a man.
What is Inequality or Gini Index in Valley Springs?
Inequality or Gini Index in Valley Springs is 0.26.
What is the Total Population of Valley Springs?
Total Population of Valley Springs is 963.
What is the Total Male Population of Valley Springs?
Total Male Population of Valley Springs is 594.
What is the Total Female Population of Valley Springs?
Total Female Population of Valley Springs is 369.
What is the Ratio of Males per 100 Females in Valley Springs?
There are 160.98 Males per 100 Females in Valley Springs.
What is the Ratio of Females per 100 Males in Valley Springs?
There are 62.12 Females per 100 Males in Valley Springs.
What is the Median Population Age in Valley Springs?
Median Population Age in Valley Springs is 43.0 Years.
What is the Average Family Size in Valley Springs
Average Family Size in Valley Springs is 3.1 People.
What is the Average Household Size in Valley Springs
Average Household Size in Valley Springs is 2.9 People.
How Large is the Labor Force in Valley Springs?
There are 647 People in the Labor Forcein in Valley Springs.
What is the Percentage of People in the Labor Force in Valley Springs?
84.8% of People are in the Labor Force in Valley Springs.
What is the Unemployment Rate in Valley Springs?
Unemployment Rate in Valley Springs is 3.6%.