Batesland, SD Map & Demographics
Batesland Map
Batesland Overview
$21,351
PER CAPITA INCOME
50.8%
WAGE / INCOME GAP [ % ]
49.2¢/ $1
WAGE / INCOME GAP [ $ ]
0.58
INEQUALITY / GINI INDEX
89
TOTAL POPULATION
53
MALE POPULATION
36
FEMALE POPULATION
147.22
MALES / 100 FEMALES
67.92
FEMALES / 100 MALES
50.1
MEDIAN AGE
3.8
AVG FAMILY SIZE
3.6
AVG HOUSEHOLD SIZE
25
LABOR FORCE [ PEOPLE ]
35.2%
PERCENT IN LABOR FORCE
20.0%
UNEMPLOYMENT RATE
Batesland Zip Codes
Batesland Area Codes
Income in Batesland
Income Overview in Batesland
| Characteristic | Number | Measure |
| Per Capita Income | 89 | $21,351 |
| Median Family Income | 22 | $0 |
| Mean Family Income | 22 | $52,473 |
| Median Household Income | 25 | $0 |
| Mean Household Income | 25 | $70,708 |
| Income Deficit | 22 | $0 |
| Wage / Income Gap (%) | 89 | 50.85% |
| Wage / Income Gap ($) | 89 | 49.15¢ per $1 |
| Gini / Inequality Index | 89 | 0.58 |
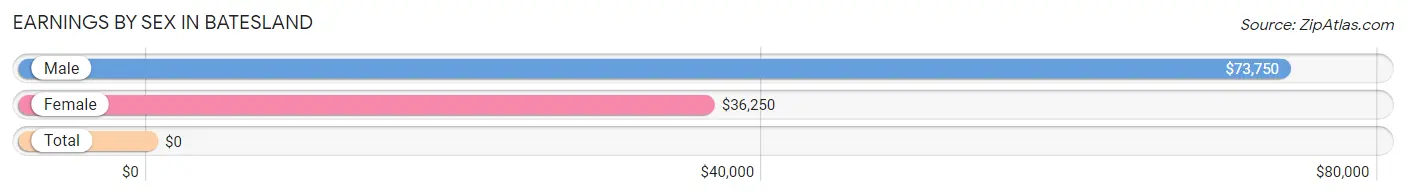
Earnings by Sex in Batesland
| Sex | Number | Average Earnings |
| Male | 6 (27.3%) | $73,750 |
| Female | 16 (72.7%) | $36,250 |
| Total | 22 (100.0%) | $0 |
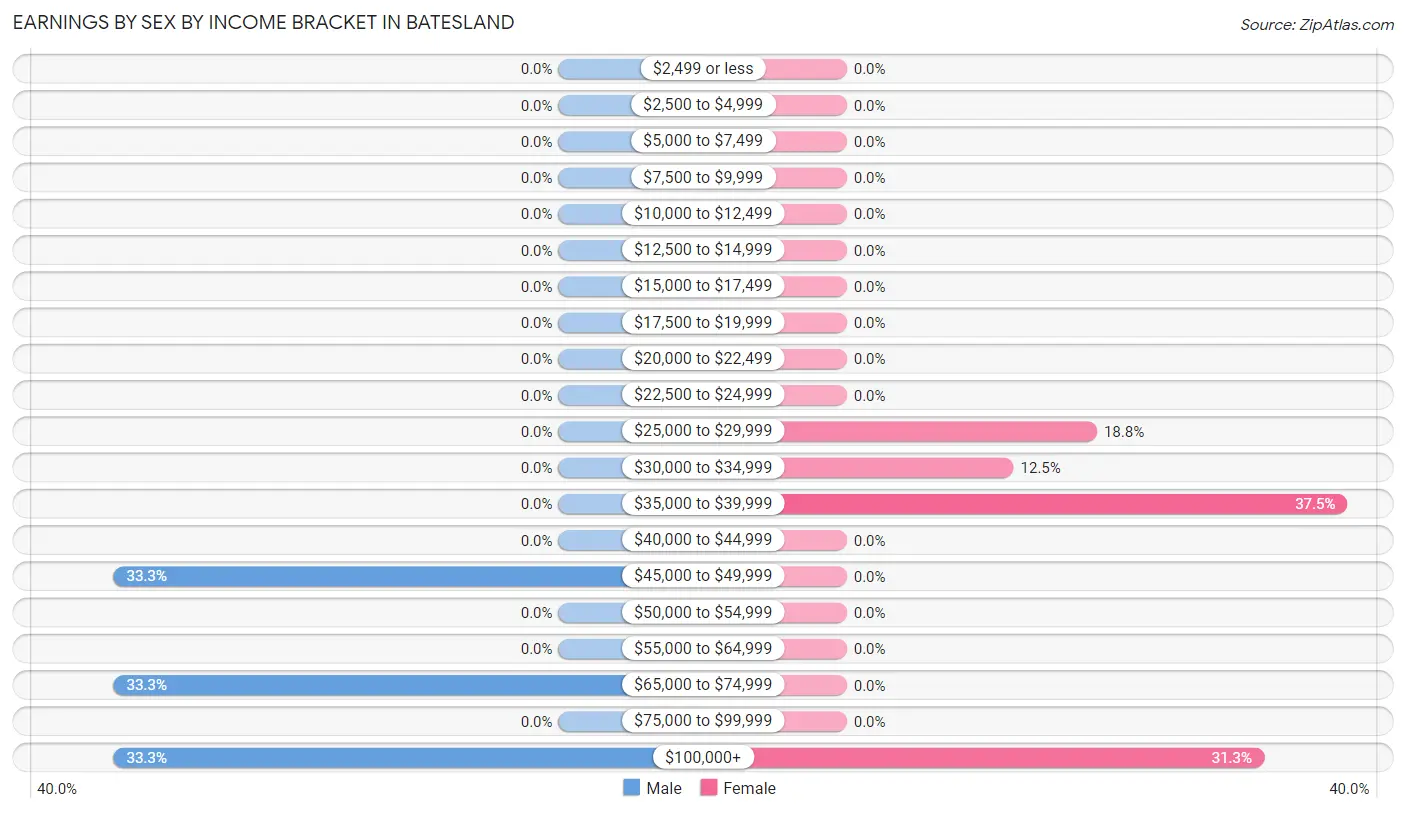
Earnings by Sex by Income Bracket in Batesland
The most common earnings brackets in Batesland are $45,000 to $49,999 for men (2 | 33.3%) and $35,000 to $39,999 for women (6 | 37.5%).
| Income | Male | Female |
| $2,499 or less | 0 (0.0%) | 0 (0.0%) |
| $2,500 to $4,999 | 0 (0.0%) | 0 (0.0%) |
| $5,000 to $7,499 | 0 (0.0%) | 0 (0.0%) |
| $7,500 to $9,999 | 0 (0.0%) | 0 (0.0%) |
| $10,000 to $12,499 | 0 (0.0%) | 0 (0.0%) |
| $12,500 to $14,999 | 0 (0.0%) | 0 (0.0%) |
| $15,000 to $17,499 | 0 (0.0%) | 0 (0.0%) |
| $17,500 to $19,999 | 0 (0.0%) | 0 (0.0%) |
| $20,000 to $22,499 | 0 (0.0%) | 0 (0.0%) |
| $22,500 to $24,999 | 0 (0.0%) | 0 (0.0%) |
| $25,000 to $29,999 | 0 (0.0%) | 3 (18.8%) |
| $30,000 to $34,999 | 0 (0.0%) | 2 (12.5%) |
| $35,000 to $39,999 | 0 (0.0%) | 6 (37.5%) |
| $40,000 to $44,999 | 0 (0.0%) | 0 (0.0%) |
| $45,000 to $49,999 | 2 (33.3%) | 0 (0.0%) |
| $50,000 to $54,999 | 0 (0.0%) | 0 (0.0%) |
| $55,000 to $64,999 | 0 (0.0%) | 0 (0.0%) |
| $65,000 to $74,999 | 2 (33.3%) | 0 (0.0%) |
| $75,000 to $99,999 | 0 (0.0%) | 0 (0.0%) |
| $100,000+ | 2 (33.3%) | 5 (31.2%) |
| Total | 6 (100.0%) | 16 (100.0%) |
Earnings by Sex by Educational Attainment in Batesland
| Educational Attainment | Male Income | Female Income |
| Less than High School | - | - |
| High School Diploma | - | - |
| College or Associate's Degree | - | - |
| Bachelor's Degree | - | - |
| Graduate Degree | - | - |
| Total | $73,750 | $36,250 |
Family Income in Batesland
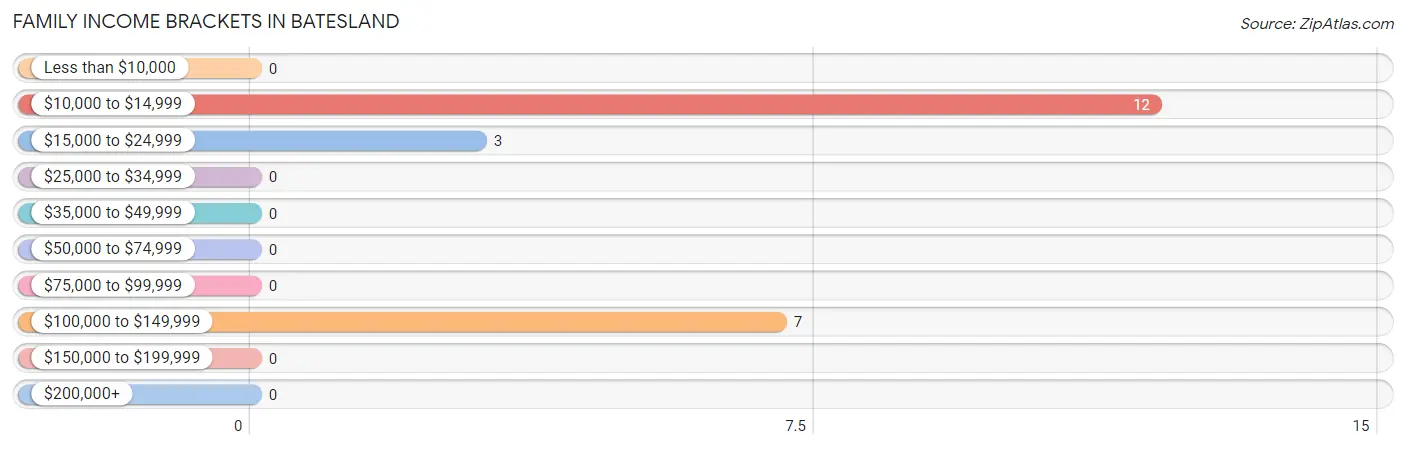
Family Income Brackets in Batesland
According to the Batesland family income data, there are 12 families falling into the $10,000 to $14,999 income range, which is the most common income bracket and makes up 54.5% of all families.
| Income Bracket | # Families | % Families |
| Less than $10,000 | 0 | 0.0% |
| $10,000 to $14,999 | 12 | 54.5% |
| $15,000 to $24,999 | 3 | 13.6% |
| $25,000 to $34,999 | 0 | 0.0% |
| $35,000 to $49,999 | 0 | 0.0% |
| $50,000 to $74,999 | 0 | 0.0% |
| $75,000 to $99,999 | 0 | 0.0% |
| $100,000 to $149,999 | 7 | 31.8% |
| $150,000 to $199,999 | 0 | 0.0% |
| $200,000+ | 0 | 0.0% |
Family Income by Famaliy Size in Batesland
| Income Bracket | # Families | Median Income |
| 2-Person Families | 12 (54.5%) | $0 |
| 3-Person Families | 8 (36.4%) | $0 |
| 4-Person Families | 0 (0.0%) | $0 |
| 5-Person Families | 0 (0.0%) | $0 |
| 6-Person Families | 0 (0.0%) | $0 |
| 7+ Person Families | 2 (9.1%) | $0 |
| Total | 22 (100.0%) | $0 |
Family Income by Number of Earners in Batesland
| Number of Earners | # Families | Median Income |
| No Earners | 15 (68.2%) | $0 |
| 1 Earner | 0 (0.0%) | $0 |
| 2 Earners | 5 (22.7%) | $0 |
| 3+ Earners | 2 (9.1%) | $0 |
| Total | 22 (100.0%) | $0 |
Household Income in Batesland
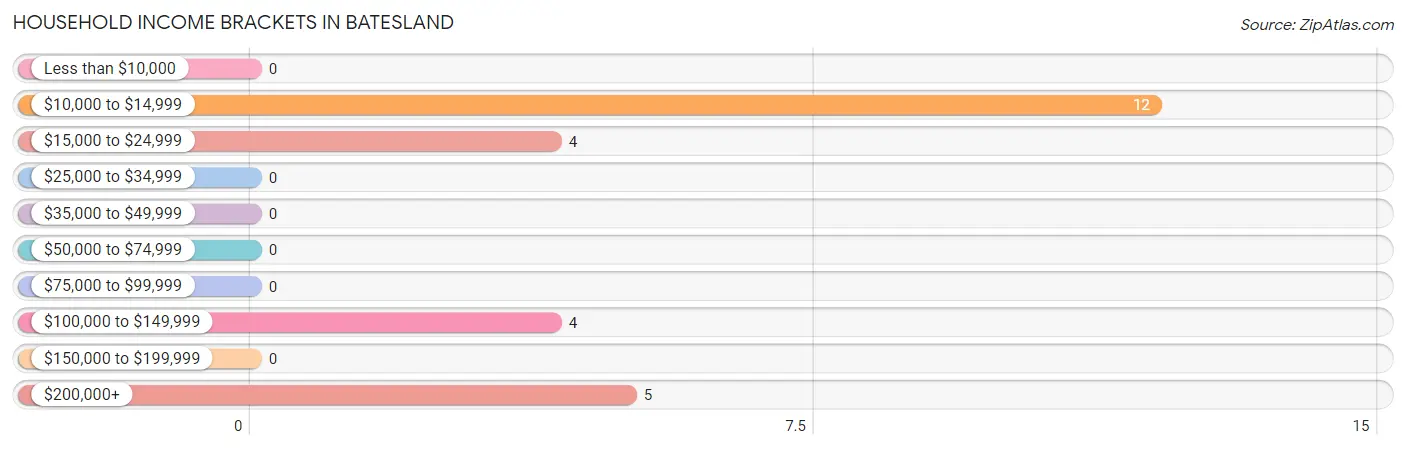
Household Income Brackets in Batesland
With 12 households falling in the category, the $10,000 to $14,999 income range is the most frequent in Batesland, accounting for 48.0% of all households.
| Income Bracket | # Households | % Households |
| Less than $10,000 | 0 | 0.0% |
| $10,000 to $14,999 | 12 | 48.0% |
| $15,000 to $24,999 | 4 | 16.0% |
| $25,000 to $34,999 | 0 | 0.0% |
| $35,000 to $49,999 | 0 | 0.0% |
| $50,000 to $74,999 | 0 | 0.0% |
| $75,000 to $99,999 | 0 | 0.0% |
| $100,000 to $149,999 | 4 | 16.0% |
| $150,000 to $199,999 | 0 | 0.0% |
| $200,000+ | 5 | 20.0% |
Household Income by Householder Age in Batesland
The median household income in Batesland is $0, with the highest median household income of $217,750 found in the 45 to 64 years age bracket for the primary householder. A total of 9 households (36.0%) fall into this category.
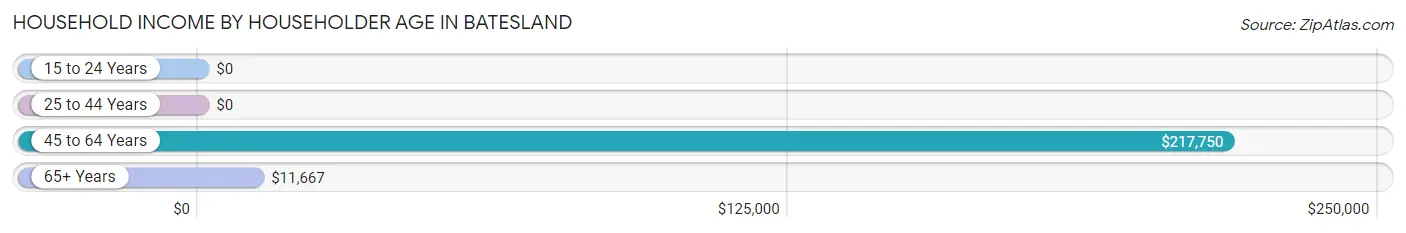
| Income Bracket | # Households | Median Income |
| 15 to 24 Years | 0 (0.0%) | $0 |
| 25 to 44 Years | 0 (0.0%) | $0 |
| 45 to 64 Years | 9 (36.0%) | $217,750 |
| 65+ Years | 16 (64.0%) | $11,667 |
| Total | 25 (100.0%) | $0 |
Poverty in Batesland
Income Below Poverty by Sex and Age in Batesland
With 30.2% poverty level for males and 27.8% for females among the residents of Batesland, 35 to 44 year old males and 12 to 14 year old females are the most vulnerable to poverty, with 4 males (36.4%) and 4 females (100.0%) in their respective age groups living below the poverty level.
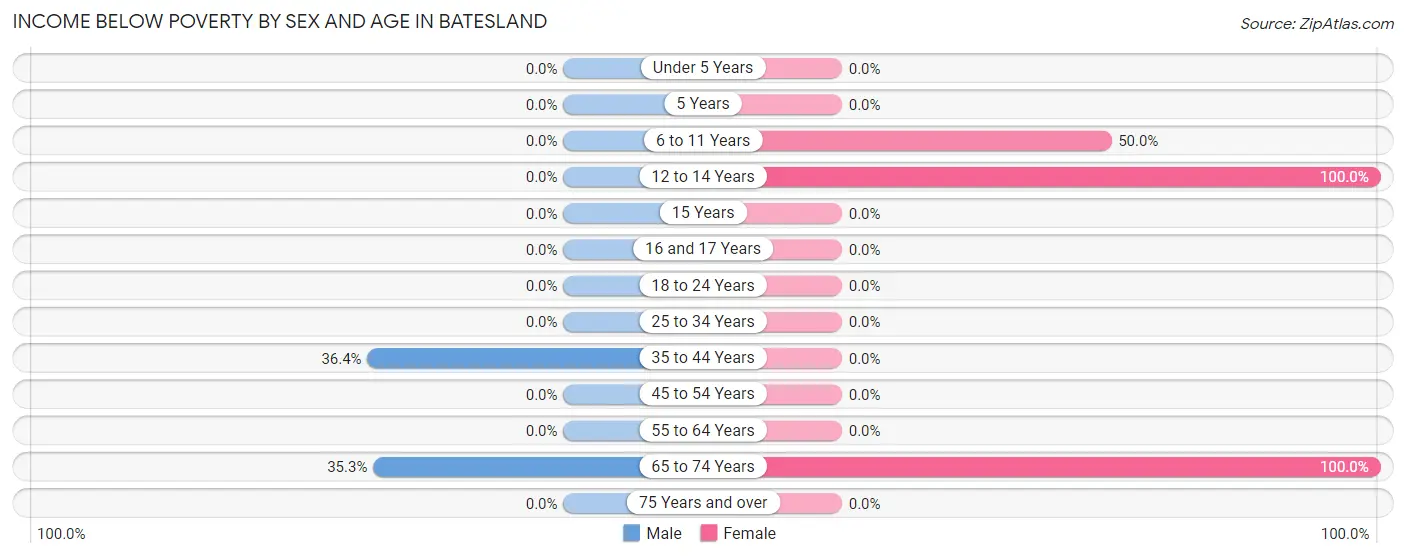
| Age Bracket | Male | Female |
| Under 5 Years | 0 (0.0%) | 0 (0.0%) |
| 5 Years | 0 (0.0%) | 0 (0.0%) |
| 6 to 11 Years | 0 (0.0%) | 3 (50.0%) |
| 12 to 14 Years | 0 (0.0%) | 4 (100.0%) |
| 15 Years | 0 (0.0%) | 0 (0.0%) |
| 16 and 17 Years | 0 (0.0%) | 0 (0.0%) |
| 18 to 24 Years | 0 (0.0%) | 0 (0.0%) |
| 25 to 34 Years | 0 (0.0%) | 0 (0.0%) |
| 35 to 44 Years | 4 (36.4%) | 0 (0.0%) |
| 45 to 54 Years | 0 (0.0%) | 0 (0.0%) |
| 55 to 64 Years | 0 (0.0%) | 0 (0.0%) |
| 65 to 74 Years | 12 (35.3%) | 3 (100.0%) |
| 75 Years and over | 0 (0.0%) | 0 (0.0%) |
| Total | 16 (30.2%) | 10 (27.8%) |
Income Above Poverty by Sex and Age in Batesland
According to the poverty statistics in Batesland, males aged 12 to 14 years and females aged under 5 years are the age groups that are most secure financially, with 100.0% of males and 100.0% of females in these age groups living above the poverty line.
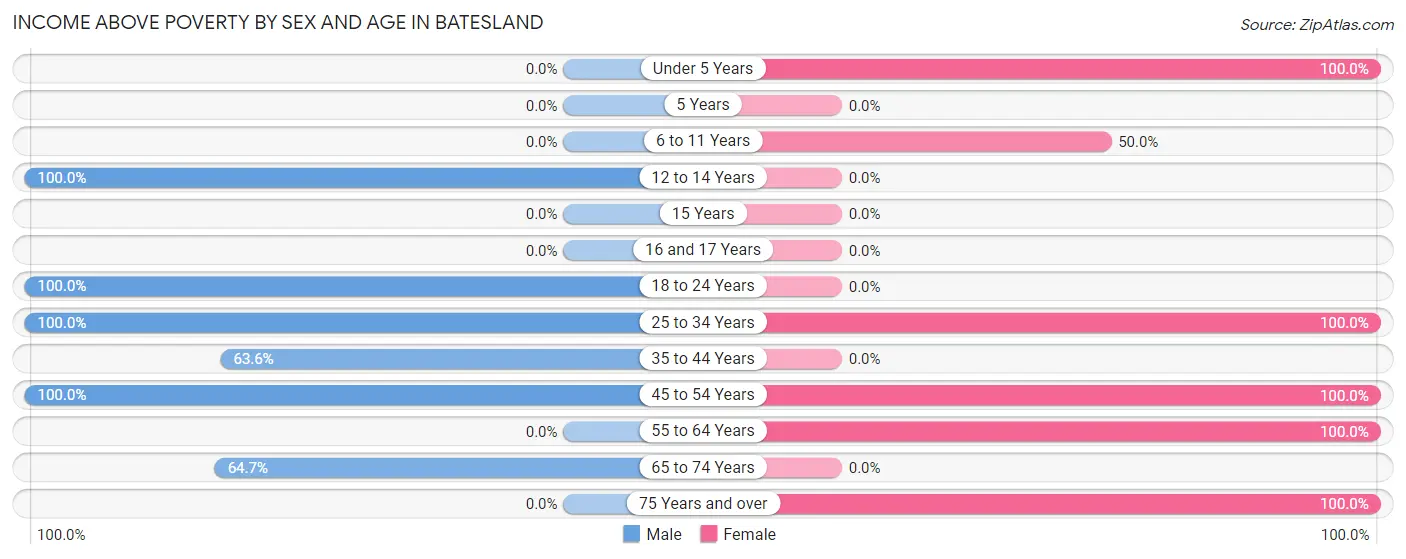
| Age Bracket | Male | Female |
| Under 5 Years | 0 (0.0%) | 6 (100.0%) |
| 5 Years | 0 (0.0%) | 0 (0.0%) |
| 6 to 11 Years | 0 (0.0%) | 3 (50.0%) |
| 12 to 14 Years | 2 (100.0%) | 0 (0.0%) |
| 15 Years | 0 (0.0%) | 0 (0.0%) |
| 16 and 17 Years | 0 (0.0%) | 0 (0.0%) |
| 18 to 24 Years | 2 (100.0%) | 0 (0.0%) |
| 25 to 34 Years | 2 (100.0%) | 9 (100.0%) |
| 35 to 44 Years | 7 (63.6%) | 0 (0.0%) |
| 45 to 54 Years | 2 (100.0%) | 5 (100.0%) |
| 55 to 64 Years | 0 (0.0%) | 2 (100.0%) |
| 65 to 74 Years | 22 (64.7%) | 0 (0.0%) |
| 75 Years and over | 0 (0.0%) | 1 (100.0%) |
| Total | 37 (69.8%) | 26 (72.2%) |
Income Below Poverty Among Married-Couple Families in Batesland
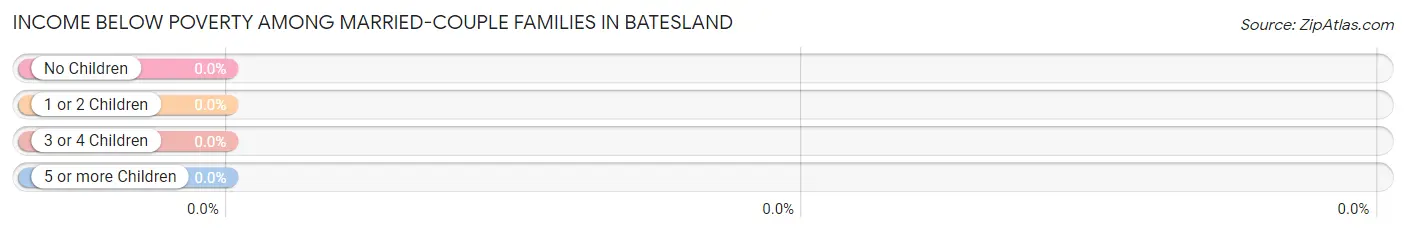
| Children | Above Poverty | Below Poverty |
| No Children | 0 (0.0%) | 0 (0.0%) |
| 1 or 2 Children | 0 (0.0%) | 0 (0.0%) |
| 3 or 4 Children | 2 (100.0%) | 0 (0.0%) |
| 5 or more Children | 0 (0.0%) | 0 (0.0%) |
| Total | 2 (100.0%) | 0 (0.0%) |
Income Below Poverty Among Single-Parent Households in Batesland
According to the poverty data in Batesland, 100.0% or 12 single-father households and 37.5% or 3 single-mother households are living below the poverty line. Among single-father households, those with 1 or 2 children have the highest poverty rate, with 12 households (100.0%) experiencing poverty. Likewise, among single-mother households, those with 1 or 2 children have the highest poverty rate, with 3 households (100.0%) falling below the poverty line.
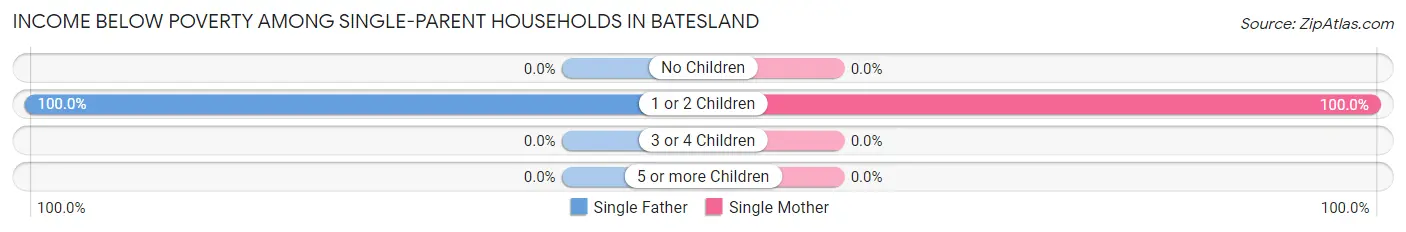
| Children | Single Father | Single Mother |
| No Children | 0 (0.0%) | 0 (0.0%) |
| 1 or 2 Children | 12 (100.0%) | 3 (100.0%) |
| 3 or 4 Children | 0 (0.0%) | 0 (0.0%) |
| 5 or more Children | 0 (0.0%) | 0 (0.0%) |
| Total | 12 (100.0%) | 3 (37.5%) |
Income Below Poverty Among Married-Couple vs Single-Parent Households in Batesland
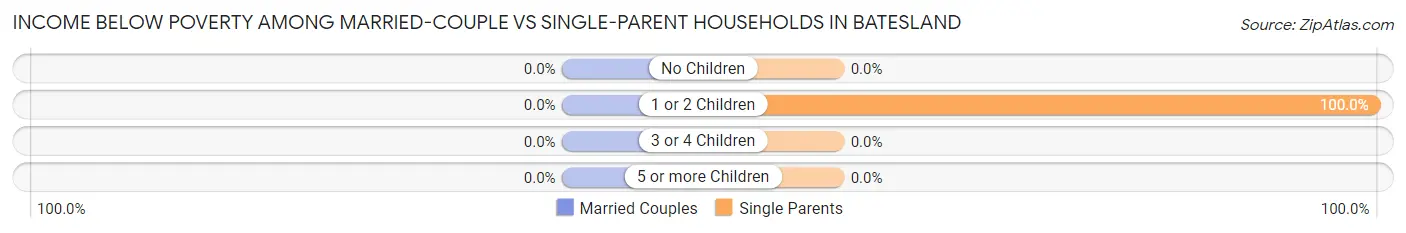
| Children | Married-Couple Families | Single-Parent Households |
| No Children | 0 (0.0%) | 0 (0.0%) |
| 1 or 2 Children | 0 (0.0%) | 15 (100.0%) |
| 3 or 4 Children | 0 (0.0%) | 0 (0.0%) |
| 5 or more Children | 0 (0.0%) | 0 (0.0%) |
| Total | 0 (0.0%) | 15 (75.0%) |
Race in Batesland
The most populous races in Batesland are , and Native / Alaskan (89 | 100.0%).
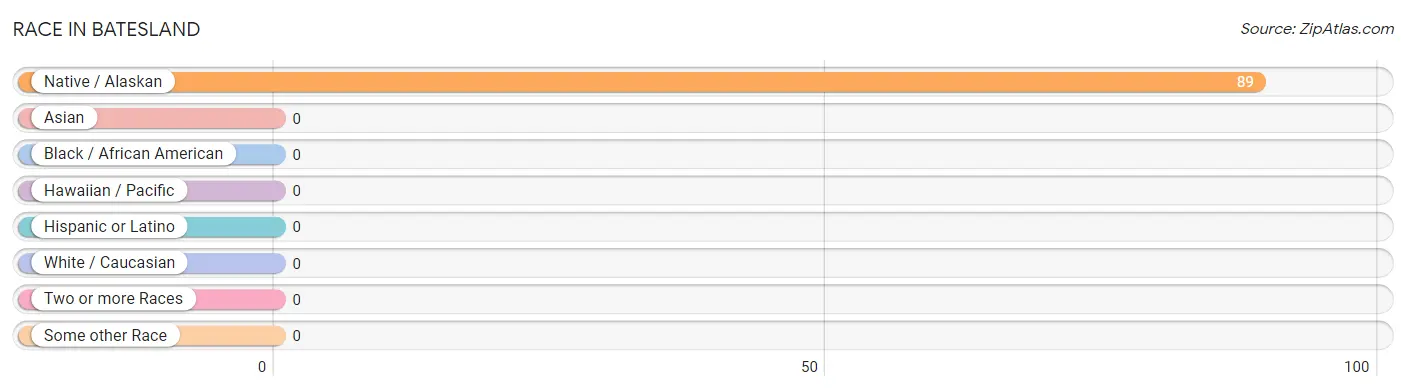
| Race | # Population | % Population |
| Asian | 0 | 0.0% |
| Black / African American | 0 | 0.0% |
| Hawaiian / Pacific | 0 | 0.0% |
| Hispanic or Latino | 0 | 0.0% |
| Native / Alaskan | 89 | 100.0% |
| White / Caucasian | 0 | 0.0% |
| Two or more Races | 0 | 0.0% |
| Some other Race | 0 | 0.0% |
| Total | 89 | 100.0% |
Ancestry in Batesland
The most populous ancestries reported in Batesland are Sioux (87 | 97.8%), and Cheyenne (3 | 3.4%), together accounting for 101.1% of all Batesland residents.
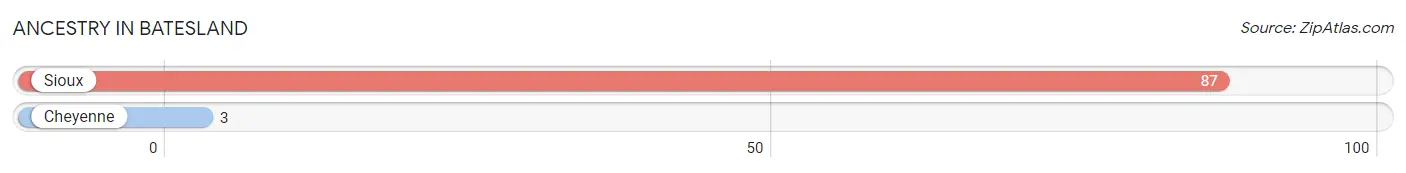
| Ancestry | # Population | % Population |
| Cheyenne | 3 | 3.4% |
| Sioux | 87 | 97.8% | View All 2 Rows |
Immigrants in Batesland

| Immigration Origin | # Population | % Population | View All 0 Rows |
Sex and Age in Batesland
Sex and Age in Batesland
The most populous age groups in Batesland are 65 to 69 Years (34 | 64.1%) for men and 30 to 34 Years (9 | 25.0%) for women.
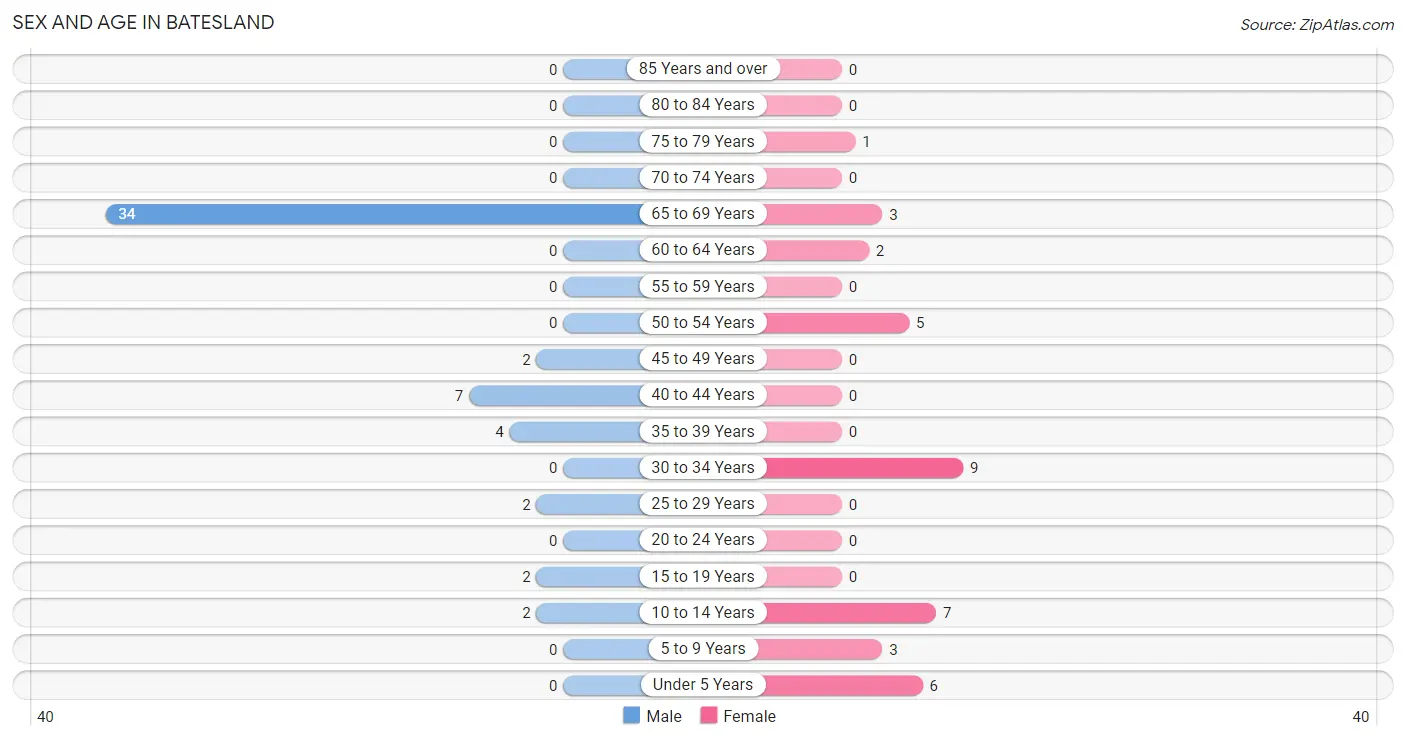
| Age Bracket | Male | Female |
| Under 5 Years | 0 (0.0%) | 6 (16.7%) |
| 5 to 9 Years | 0 (0.0%) | 3 (8.3%) |
| 10 to 14 Years | 2 (3.8%) | 7 (19.4%) |
| 15 to 19 Years | 2 (3.8%) | 0 (0.0%) |
| 20 to 24 Years | 0 (0.0%) | 0 (0.0%) |
| 25 to 29 Years | 2 (3.8%) | 0 (0.0%) |
| 30 to 34 Years | 0 (0.0%) | 9 (25.0%) |
| 35 to 39 Years | 4 (7.5%) | 0 (0.0%) |
| 40 to 44 Years | 7 (13.2%) | 0 (0.0%) |
| 45 to 49 Years | 2 (3.8%) | 0 (0.0%) |
| 50 to 54 Years | 0 (0.0%) | 5 (13.9%) |
| 55 to 59 Years | 0 (0.0%) | 0 (0.0%) |
| 60 to 64 Years | 0 (0.0%) | 2 (5.6%) |
| 65 to 69 Years | 34 (64.1%) | 3 (8.3%) |
| 70 to 74 Years | 0 (0.0%) | 0 (0.0%) |
| 75 to 79 Years | 0 (0.0%) | 1 (2.8%) |
| 80 to 84 Years | 0 (0.0%) | 0 (0.0%) |
| 85 Years and over | 0 (0.0%) | 0 (0.0%) |
| Total | 53 (100.0%) | 36 (100.0%) |
Families and Households in Batesland
Median Family Size in Batesland
The median family size in Batesland is 3.82 persons per family, with married-couple families (2 | 9.1%) accounting for the largest median family size of 22.5 persons per family. On the other hand, single male/father families (12 | 54.5%) represent the smallest median family size with 1.25 persons per family.
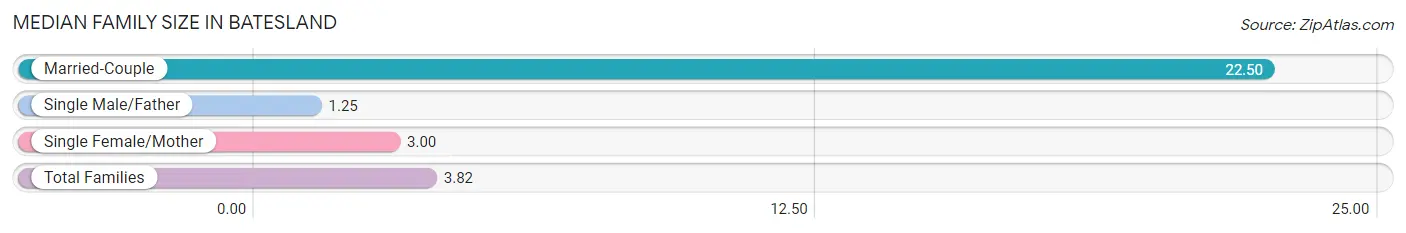
| Family Type | # Families | Family Size |
| Married-Couple | 2 (9.1%) | 22.50 |
| Single Male/Father | 12 (54.5%) | 1.25 |
| Single Female/Mother | 8 (36.4%) | 3.00 |
| Total Families | 22 (100.0%) | 3.82 |
Median Household Size in Batesland
The median household size in Batesland is 3.56 persons per household, with married-couple households (2 | 8.0%) accounting for the largest median household size of 22.5 persons per household. non-family households (3 | 12.0%) represent the smallest median household size with 1.00 persons per household.
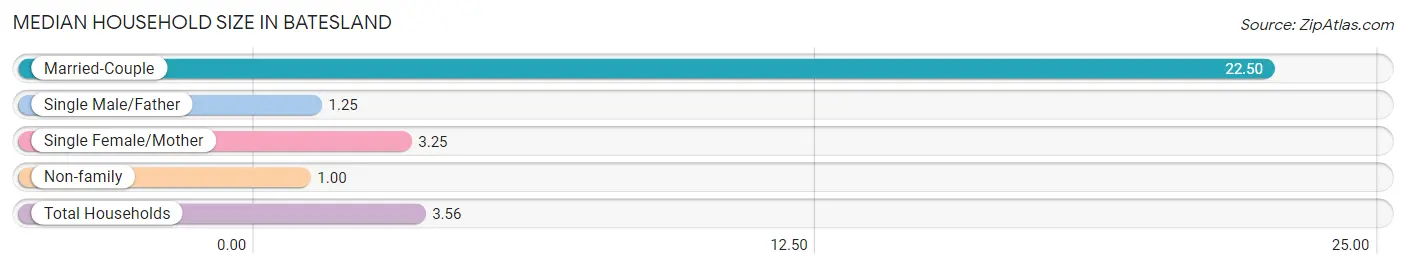
| Household Type | # Households | Household Size |
| Married-Couple | 2 (8.0%) | 22.50 |
| Single Male/Father | 12 (48.0%) | 1.25 |
| Single Female/Mother | 8 (32.0%) | 3.25 |
| Non-family | 3 (12.0%) | 1.00 |
| Total Households | 25 (100.0%) | 3.56 |
Household Size by Marriage Status in Batesland
Out of a total of 25 households in Batesland, 22 (88.0%) are family households, while 3 (12.0%) are nonfamily households. The most numerous type of family households are 2-person households, comprising 12, and the most common type of nonfamily households are 1-person households, comprising 3.
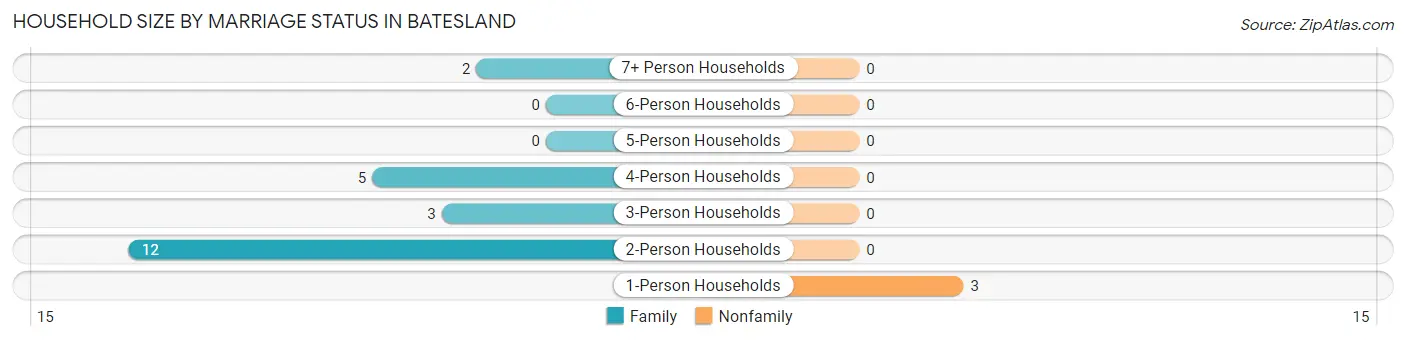
| Household Size | Family Households | Nonfamily Households |
| 1-Person Households | - | 3 (12.0%) |
| 2-Person Households | 12 (48.0%) | 0 (0.0%) |
| 3-Person Households | 3 (12.0%) | 0 (0.0%) |
| 4-Person Households | 5 (20.0%) | 0 (0.0%) |
| 5-Person Households | 0 (0.0%) | 0 (0.0%) |
| 6-Person Households | 0 (0.0%) | 0 (0.0%) |
| 7+ Person Households | 2 (8.0%) | 0 (0.0%) |
| Total | 22 (88.0%) | 3 (12.0%) |
Female Fertility in Batesland
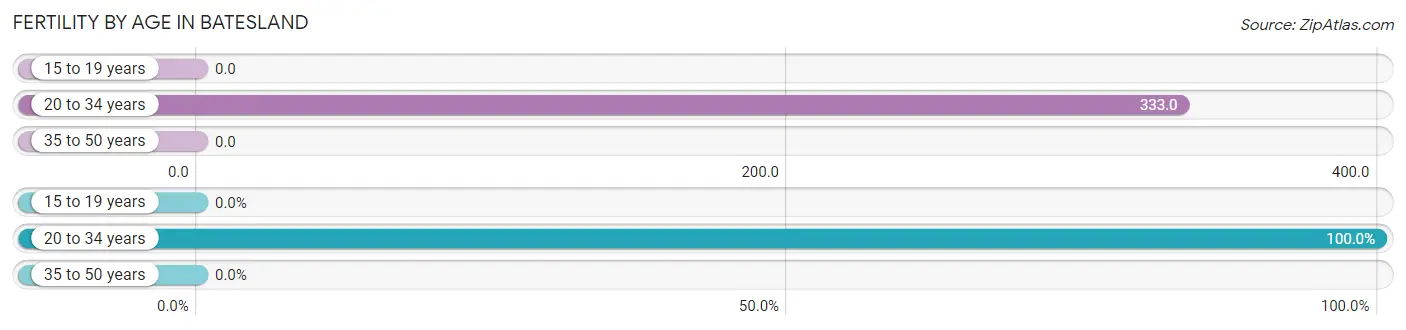
Fertility by Age in Batesland
Average fertility rate in Batesland is 214.0 births per 1,000 women. Women in the age bracket of 20 to 34 years have the highest fertility rate with 333.0 births per 1,000 women. Women in the age bracket of 20 to 34 years acount for 100.0% of all women with births.
| Age Bracket | Women with Births | Births / 1,000 Women |
| 15 to 19 years | 0 (0.0%) | 0.0 |
| 20 to 34 years | 3 (100.0%) | 333.0 |
| 35 to 50 years | 0 (0.0%) | 0.0 |
| Total | 3 (100.0%) | 214.0 |
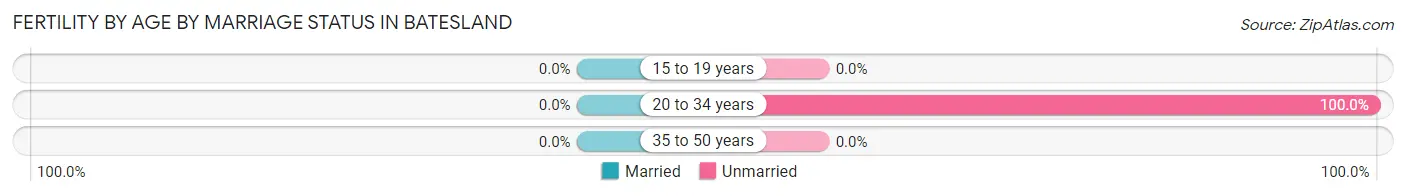
Fertility by Age by Marriage Status in Batesland
| Age Bracket | Married | Unmarried |
| 15 to 19 years | 0 (0.0%) | 0 (0.0%) |
| 20 to 34 years | 0 (0.0%) | 3 (100.0%) |
| 35 to 50 years | 0 (0.0%) | 0 (0.0%) |
| Total | 0 (0.0%) | 3 (100.0%) |
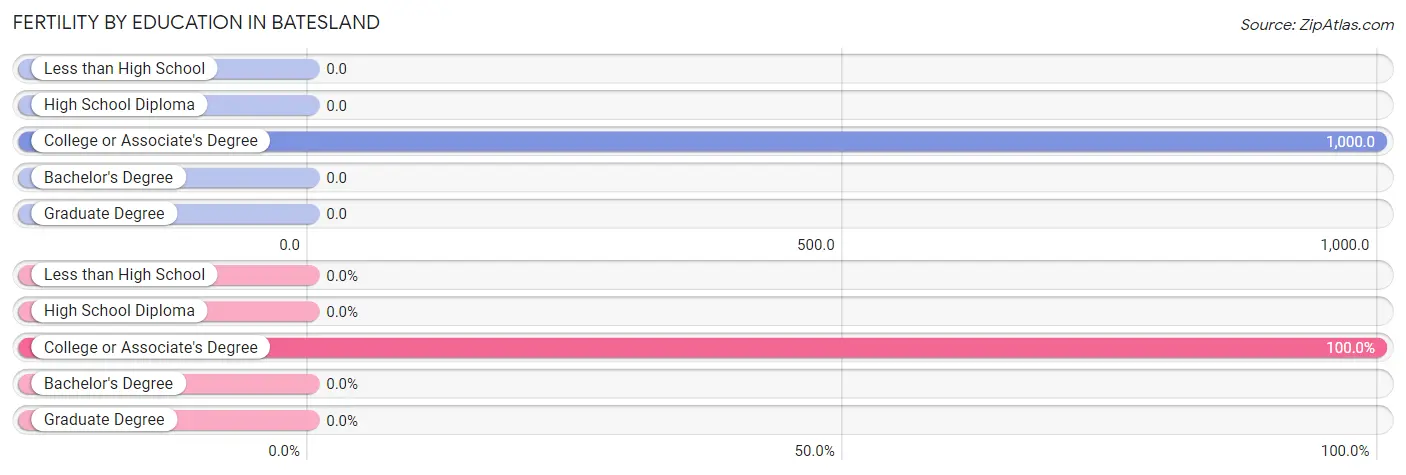
Fertility by Education in Batesland
| Educational Attainment | Women with Births | Births / 1,000 Women |
| Less than High School | 0 (0.0%) | 0.0 |
| High School Diploma | 0 (0.0%) | 0.0 |
| College or Associate's Degree | 3 (100.0%) | 1,000.0 |
| Bachelor's Degree | 0 (0.0%) | 0.0 |
| Graduate Degree | 0 (0.0%) | 0.0 |
| Total | 3 (100.0%) | 214.0 |
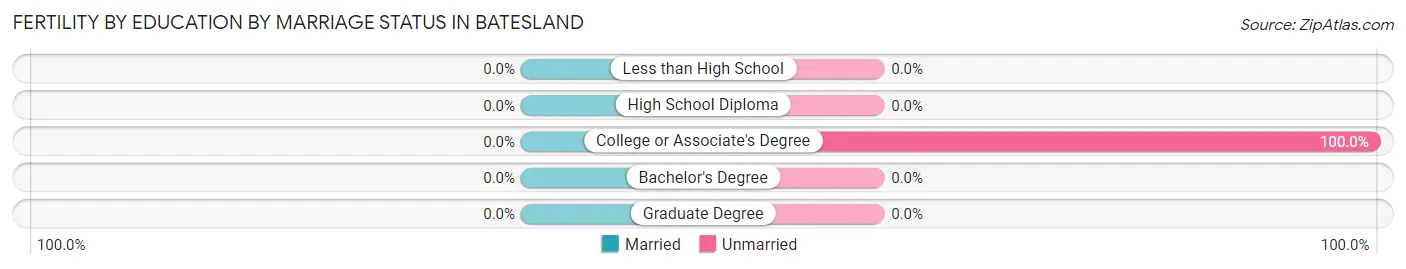
Fertility by Education by Marriage Status in Batesland
| Educational Attainment | Married | Unmarried |
| Less than High School | 0 (0.0%) | 0 (0.0%) |
| High School Diploma | 0 (0.0%) | 0 (0.0%) |
| College or Associate's Degree | 0 (0.0%) | 3 (100.0%) |
| Bachelor's Degree | 0 (0.0%) | 0 (0.0%) |
| Graduate Degree | 0 (0.0%) | 0 (0.0%) |
| Total | 0 (0.0%) | 3 (100.0%) |
Employment Characteristics in Batesland
Employment by Class of Employer in Batesland
Among the 20 employed individuals in Batesland, not-for-profit organizations (11 | 55.0%), federal government employees (7 | 35.0%), and private company employees (2 | 10.0%) make up the most common classes of employment.
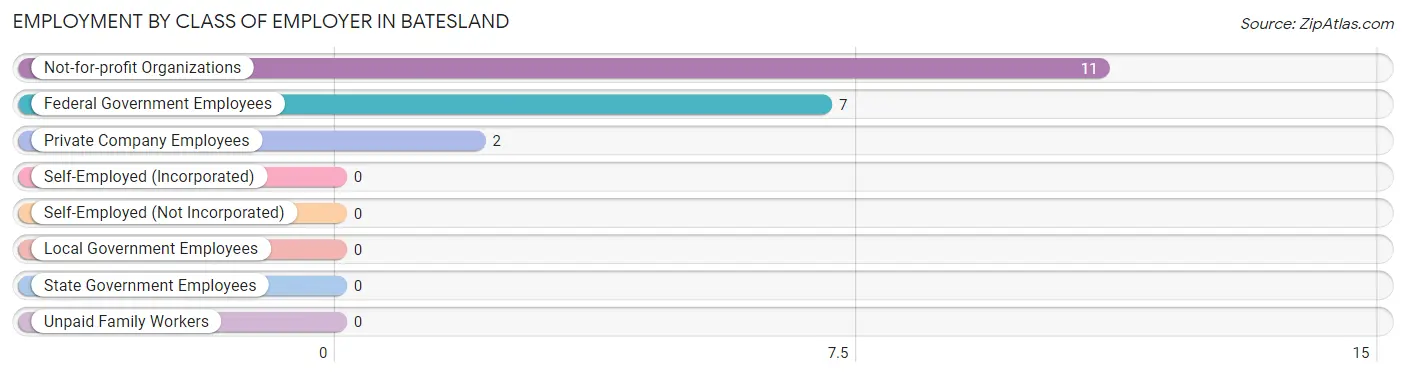
| Employer Class | # Employees | % Employees |
| Private Company Employees | 2 | 10.0% |
| Self-Employed (Incorporated) | 0 | 0.0% |
| Self-Employed (Not Incorporated) | 0 | 0.0% |
| Not-for-profit Organizations | 11 | 55.0% |
| Local Government Employees | 0 | 0.0% |
| State Government Employees | 0 | 0.0% |
| Federal Government Employees | 7 | 35.0% |
| Unpaid Family Workers | 0 | 0.0% |
| Total | 20 | 100.0% |
Employment Status by Age in Batesland
According to the labor force statistics for Batesland, out of the total population over 16 years of age (71), 35.2% or 25 individuals are in the labor force, with 20.0% or 5 of them unemployed. The age group with the highest labor force participation rate is 25 to 29 years, with 100.0% or 2 individuals in the labor force. Within the labor force, the 35 to 44 years age range has the highest percentage of unemployed individuals, with 71.4% or 5 of them being unemployed.
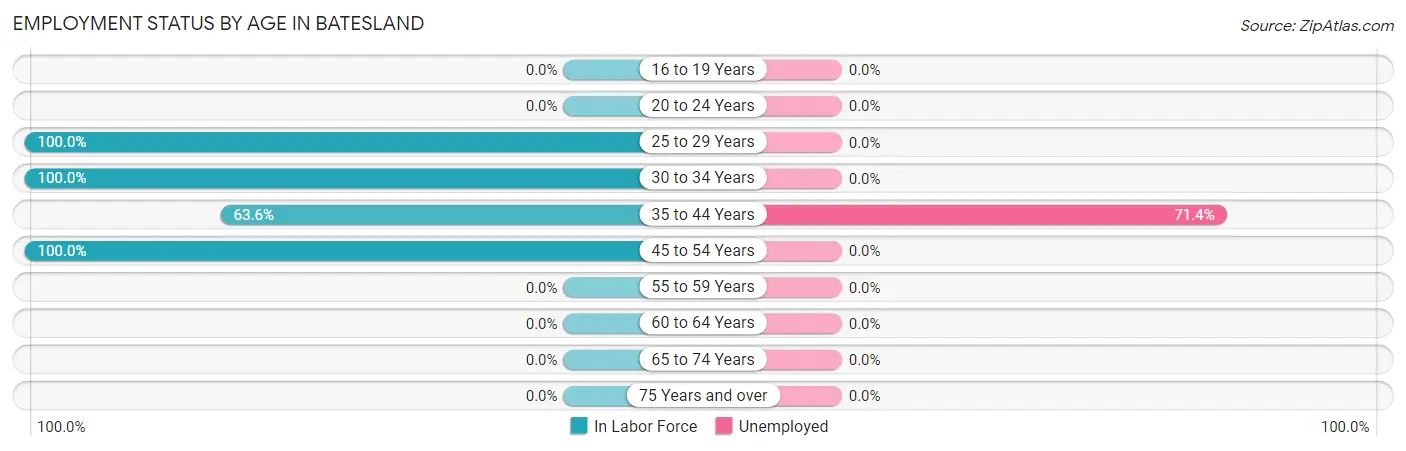
| Age Bracket | In Labor Force | Unemployed |
| 16 to 19 Years | 0 (0.0%) | 0 (0.0%) |
| 20 to 24 Years | 0 (0.0%) | 0 (0.0%) |
| 25 to 29 Years | 2 (100.0%) | 0 (0.0%) |
| 30 to 34 Years | 9 (100.0%) | 0 (0.0%) |
| 35 to 44 Years | 7 (63.6%) | 5 (71.4%) |
| 45 to 54 Years | 7 (100.0%) | 0 (0.0%) |
| 55 to 59 Years | 0 (0.0%) | 0 (0.0%) |
| 60 to 64 Years | 0 (0.0%) | 0 (0.0%) |
| 65 to 74 Years | 0 (0.0%) | 0 (0.0%) |
| 75 Years and over | 0 (0.0%) | 0 (0.0%) |
| Total | 25 (35.2%) | 5 (20.0%) |
Employment Status by Educational Attainment in Batesland
According to labor force statistics for Batesland, 80.6% of individuals (25) out of the total population between 25 and 64 years of age (31) are in the labor force, with 20.0% or 5 of them being unemployed. The group with the highest labor force participation rate are those with the educational attainment of college / associate degree, with 100.0% or 10 individuals in the labor force. Within the labor force, individuals with college / associate degree education have the highest percentage of unemployment, with 50.0% or 5 of them being unemployed.
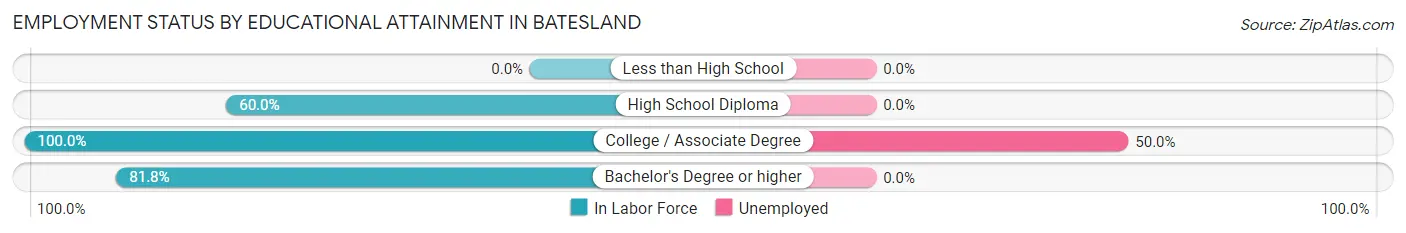
| Educational Attainment | In Labor Force | Unemployed |
| Less than High School | 0 (0.0%) | 0 (0.0%) |
| High School Diploma | 6 (60.0%) | 0 (0.0%) |
| College / Associate Degree | 10 (100.0%) | 5 (50.0%) |
| Bachelor's Degree or higher | 9 (81.8%) | 0 (0.0%) |
| Total | 25 (80.6%) | 6 (20.0%) |
Employment Occupations by Sex in Batesland
Management, Business, Science and Arts Occupations
The most common Management, Business, Science and Arts occupations in Batesland are , and Management (7 | 35.0%).
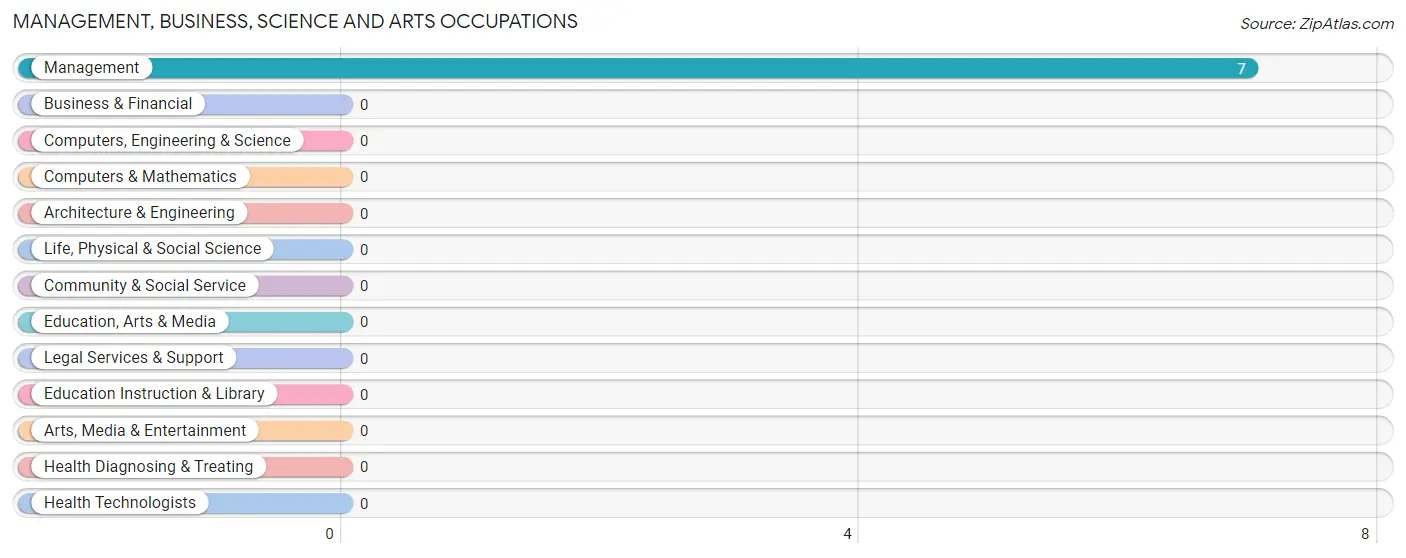
Management, Business, Science and Arts Occupations by Sex
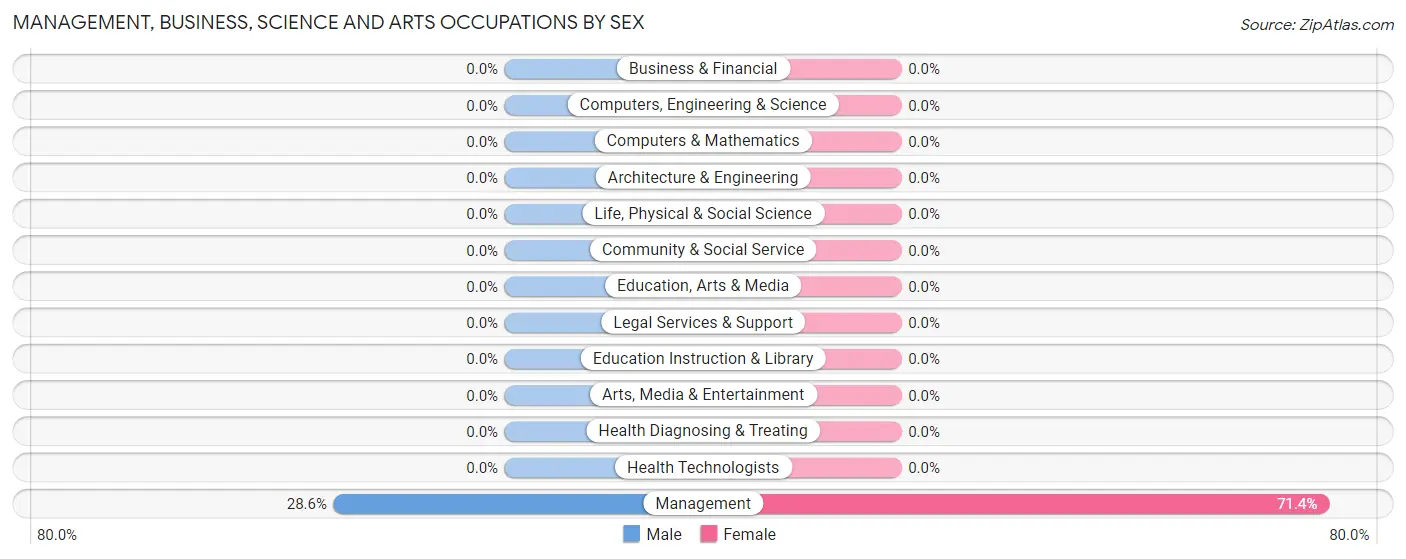
| Occupation | Male | Female |
| Management | 2 (28.6%) | 5 (71.4%) |
| Business & Financial | 0 (0.0%) | 0 (0.0%) |
| Computers, Engineering & Science | 0 (0.0%) | 0 (0.0%) |
| Computers & Mathematics | 0 (0.0%) | 0 (0.0%) |
| Architecture & Engineering | 0 (0.0%) | 0 (0.0%) |
| Life, Physical & Social Science | 0 (0.0%) | 0 (0.0%) |
| Community & Social Service | 0 (0.0%) | 0 (0.0%) |
| Education, Arts & Media | 0 (0.0%) | 0 (0.0%) |
| Legal Services & Support | 0 (0.0%) | 0 (0.0%) |
| Education Instruction & Library | 0 (0.0%) | 0 (0.0%) |
| Arts, Media & Entertainment | 0 (0.0%) | 0 (0.0%) |
| Health Diagnosing & Treating | 0 (0.0%) | 0 (0.0%) |
| Health Technologists | 0 (0.0%) | 0 (0.0%) |
| Total (Category) | 2 (28.6%) | 5 (71.4%) |
| Total (Overall) | 6 (30.0%) | 14 (70.0%) |
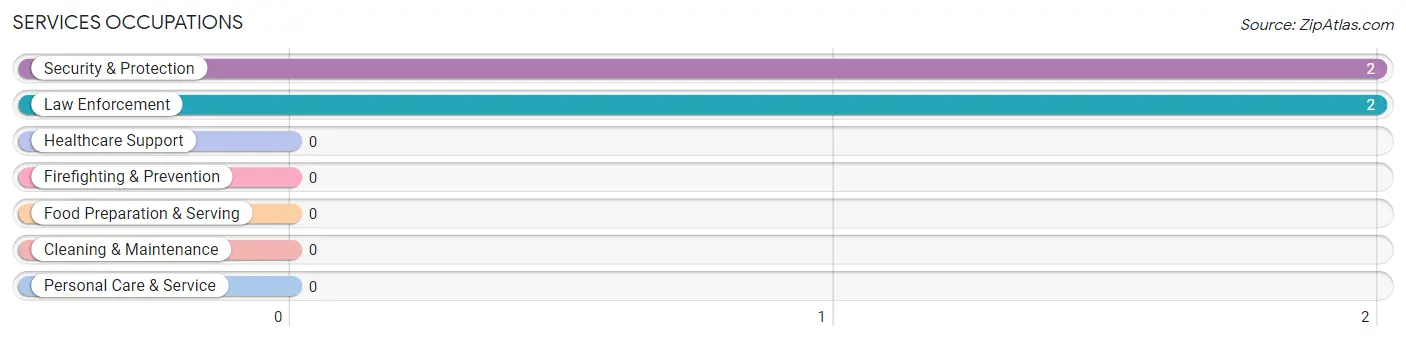
Services Occupations
The most common Services occupations in Batesland are Security & Protection (2 | 10.0%), and Law Enforcement (2 | 10.0%).
Services Occupations by Sex
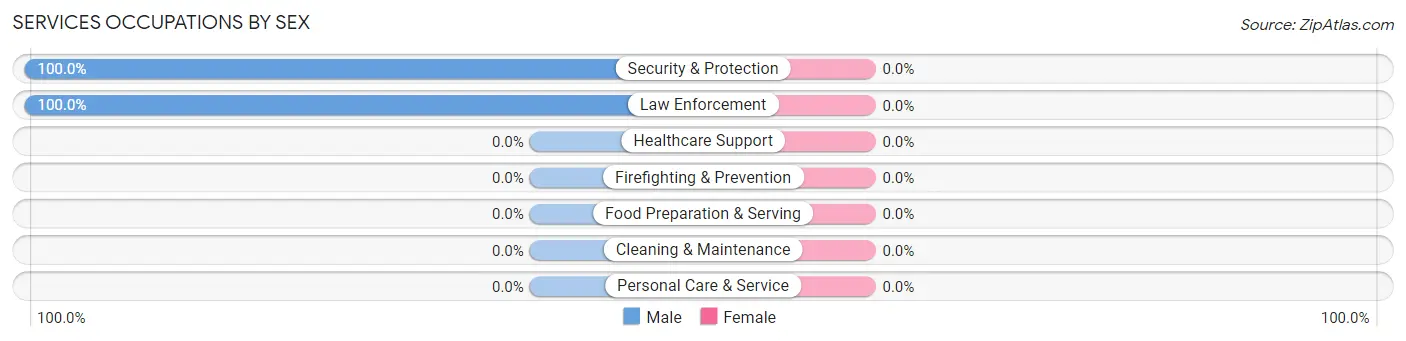
| Occupation | Male | Female |
| Healthcare Support | 0 (0.0%) | 0 (0.0%) |
| Security & Protection | 2 (100.0%) | 0 (0.0%) |
| Firefighting & Prevention | 0 (0.0%) | 0 (0.0%) |
| Law Enforcement | 2 (100.0%) | 0 (0.0%) |
| Food Preparation & Serving | 0 (0.0%) | 0 (0.0%) |
| Cleaning & Maintenance | 0 (0.0%) | 0 (0.0%) |
| Personal Care & Service | 0 (0.0%) | 0 (0.0%) |
| Total (Category) | 2 (100.0%) | 0 (0.0%) |
| Total (Overall) | 6 (30.0%) | 14 (70.0%) |
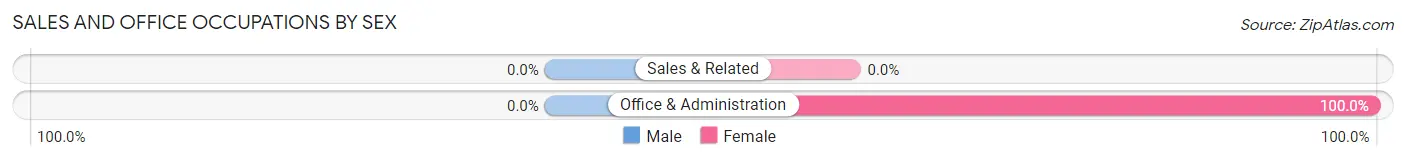
Sales and Office Occupations
The most common Sales and Office occupations in Batesland are , and Office & Administration (9 | 45.0%).
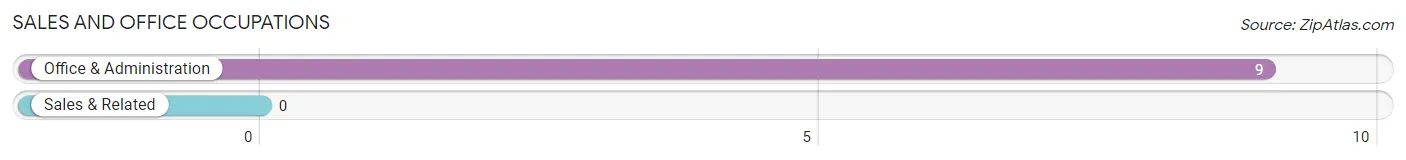
Sales and Office Occupations by Sex
| Occupation | Male | Female |
| Sales & Related | 0 (0.0%) | 0 (0.0%) |
| Office & Administration | 0 (0.0%) | 9 (100.0%) |
| Total (Category) | 0 (0.0%) | 9 (100.0%) |
| Total (Overall) | 6 (30.0%) | 14 (70.0%) |
Natural Resources, Construction and Maintenance Occupations
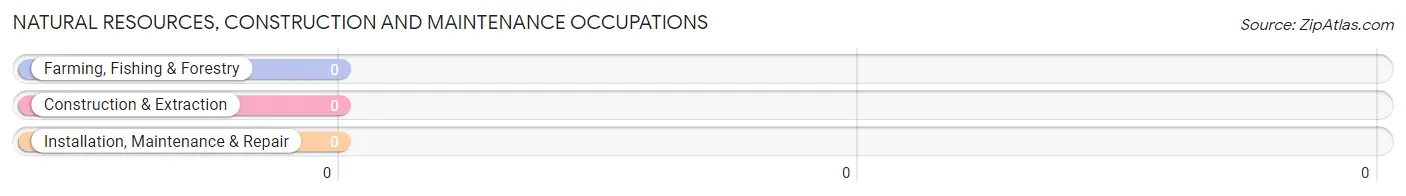
Natural Resources, Construction and Maintenance Occupations by Sex
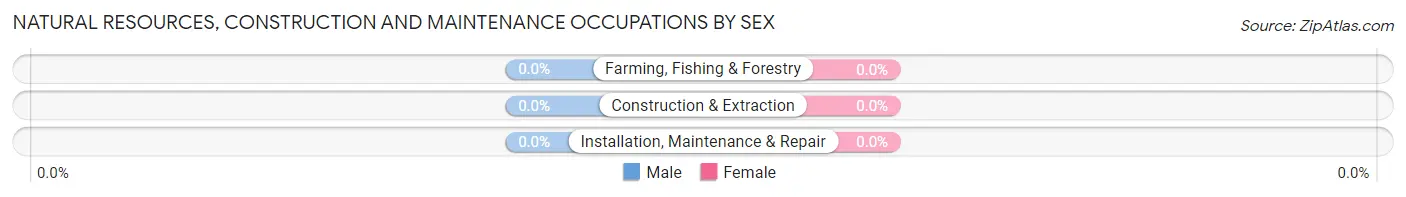
| Occupation | Male | Female |
| Farming, Fishing & Forestry | 0 (0.0%) | 0 (0.0%) |
| Construction & Extraction | 0 (0.0%) | 0 (0.0%) |
| Installation, Maintenance & Repair | 0 (0.0%) | 0 (0.0%) |
| Total (Category) | 0 (0.0%) | 0 (0.0%) |
| Total (Overall) | 6 (30.0%) | 14 (70.0%) |
Production, Transportation and Moving Occupations
The most common Production, Transportation and Moving occupations in Batesland are , and Material Moving (2 | 10.0%).
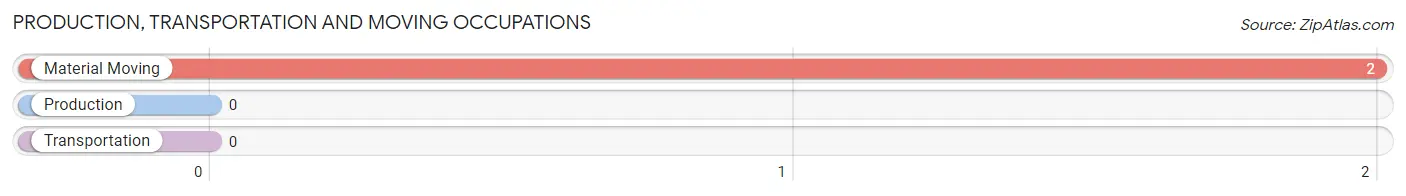
Production, Transportation and Moving Occupations by Sex
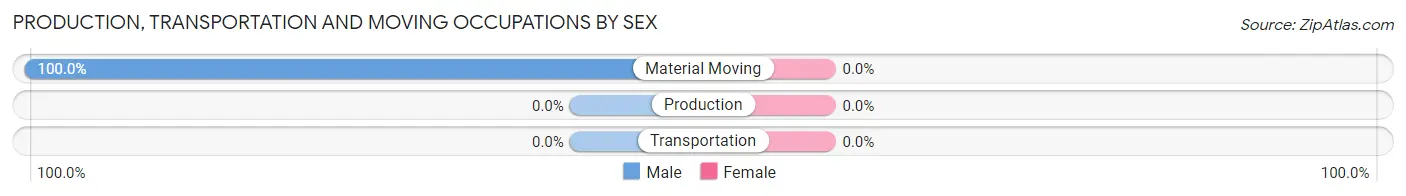
| Occupation | Male | Female |
| Production | 0 (0.0%) | 0 (0.0%) |
| Transportation | 0 (0.0%) | 0 (0.0%) |
| Material Moving | 2 (100.0%) | 0 (0.0%) |
| Total (Category) | 2 (100.0%) | 0 (0.0%) |
| Total (Overall) | 6 (30.0%) | 14 (70.0%) |
Employment Industries by Sex in Batesland
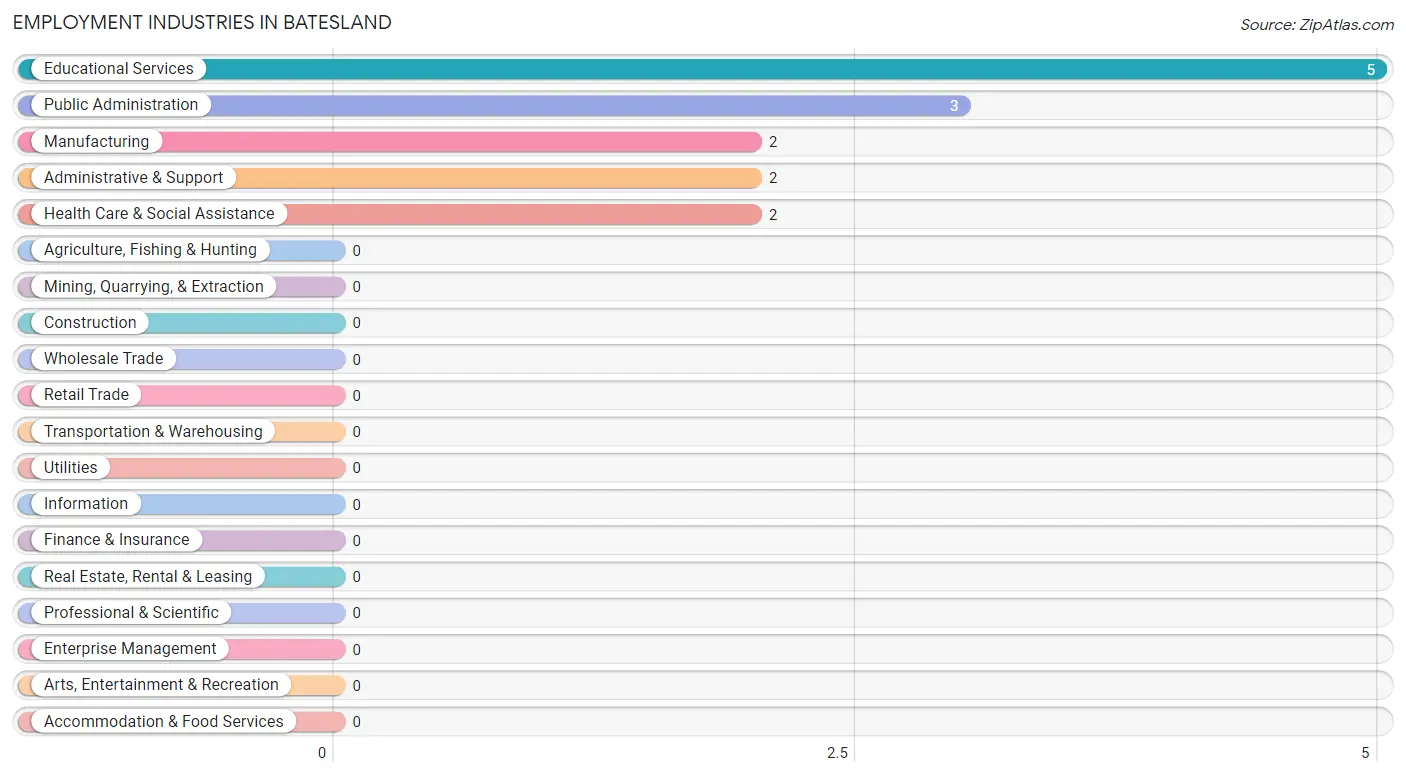
Employment Industries in Batesland
The major employment industries in Batesland include Educational Services (5 | 25.0%), Public Administration (3 | 15.0%), Manufacturing (2 | 10.0%), Administrative & Support (2 | 10.0%), and Health Care & Social Assistance (2 | 10.0%).
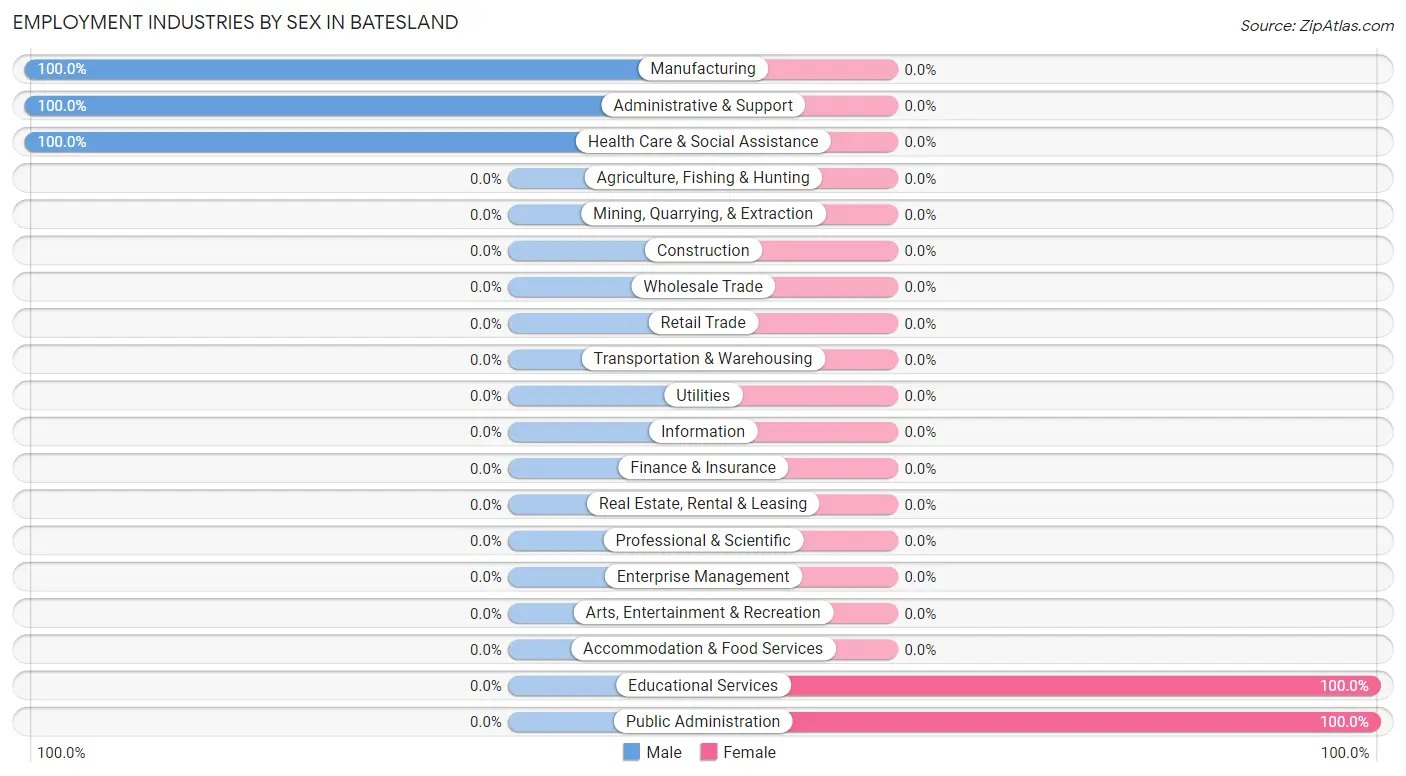
Employment Industries by Sex in Batesland
The Batesland industries that see more men than women are Manufacturing (100.0%), Administrative & Support (100.0%), and Health Care & Social Assistance (100.0%), whereas the industries that tend to have a higher number of women are Educational Services (100.0%), and Public Administration (100.0%).
| Industry | Male | Female |
| Agriculture, Fishing & Hunting | 0 (0.0%) | 0 (0.0%) |
| Mining, Quarrying, & Extraction | 0 (0.0%) | 0 (0.0%) |
| Construction | 0 (0.0%) | 0 (0.0%) |
| Manufacturing | 2 (100.0%) | 0 (0.0%) |
| Wholesale Trade | 0 (0.0%) | 0 (0.0%) |
| Retail Trade | 0 (0.0%) | 0 (0.0%) |
| Transportation & Warehousing | 0 (0.0%) | 0 (0.0%) |
| Utilities | 0 (0.0%) | 0 (0.0%) |
| Information | 0 (0.0%) | 0 (0.0%) |
| Finance & Insurance | 0 (0.0%) | 0 (0.0%) |
| Real Estate, Rental & Leasing | 0 (0.0%) | 0 (0.0%) |
| Professional & Scientific | 0 (0.0%) | 0 (0.0%) |
| Enterprise Management | 0 (0.0%) | 0 (0.0%) |
| Administrative & Support | 2 (100.0%) | 0 (0.0%) |
| Educational Services | 0 (0.0%) | 5 (100.0%) |
| Health Care & Social Assistance | 2 (100.0%) | 0 (0.0%) |
| Arts, Entertainment & Recreation | 0 (0.0%) | 0 (0.0%) |
| Accommodation & Food Services | 0 (0.0%) | 0 (0.0%) |
| Public Administration | 0 (0.0%) | 3 (100.0%) |
| Total | 6 (30.0%) | 14 (70.0%) |
Education in Batesland
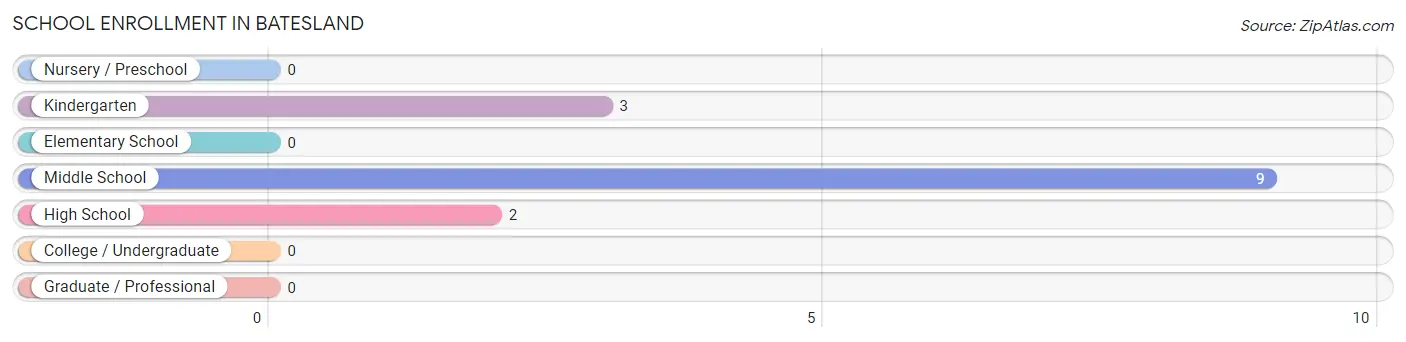
School Enrollment in Batesland
The most common levels of schooling among the 14 students in Batesland are middle school (9 | 64.3%), kindergarten (3 | 21.4%), and high school (2 | 14.3%).
| School Level | # Students | % Students |
| Nursery / Preschool | 0 | 0.0% |
| Kindergarten | 3 | 21.4% |
| Elementary School | 0 | 0.0% |
| Middle School | 9 | 64.3% |
| High School | 2 | 14.3% |
| College / Undergraduate | 0 | 0.0% |
| Graduate / Professional | 0 | 0.0% |
| Total | 14 | 100.0% |
School Enrollment by Age by Funding Source in Batesland
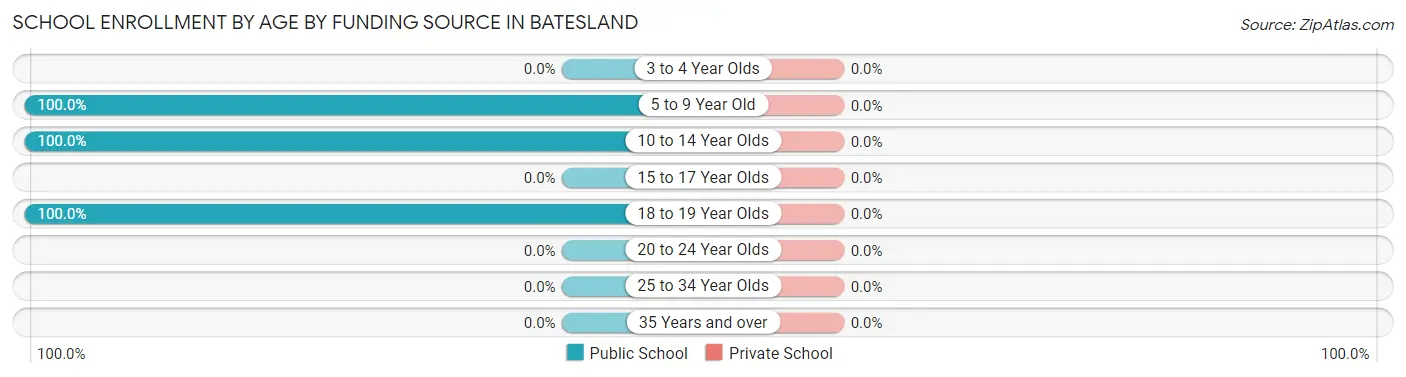
| Age Bracket | Public School | Private School |
| 3 to 4 Year Olds | 0 (0.0%) | 0 (0.0%) |
| 5 to 9 Year Old | 3 (100.0%) | 0 (0.0%) |
| 10 to 14 Year Olds | 9 (100.0%) | 0 (0.0%) |
| 15 to 17 Year Olds | 0 (0.0%) | 0 (0.0%) |
| 18 to 19 Year Olds | 2 (100.0%) | 0 (0.0%) |
| 20 to 24 Year Olds | 0 (0.0%) | 0 (0.0%) |
| 25 to 34 Year Olds | 0 (0.0%) | 0 (0.0%) |
| 35 Years and over | 0 (0.0%) | 0 (0.0%) |
| Total | 14 (100.0%) | 0 (0.0%) |
Educational Attainment by Field of Study in Batesland
Business (9 | 75.0%), arts & humanities (2 | 16.7%), and literature & languages (1 | 8.3%) are the most common fields of study among 12 individuals in Batesland who have obtained a bachelor's degree or higher.
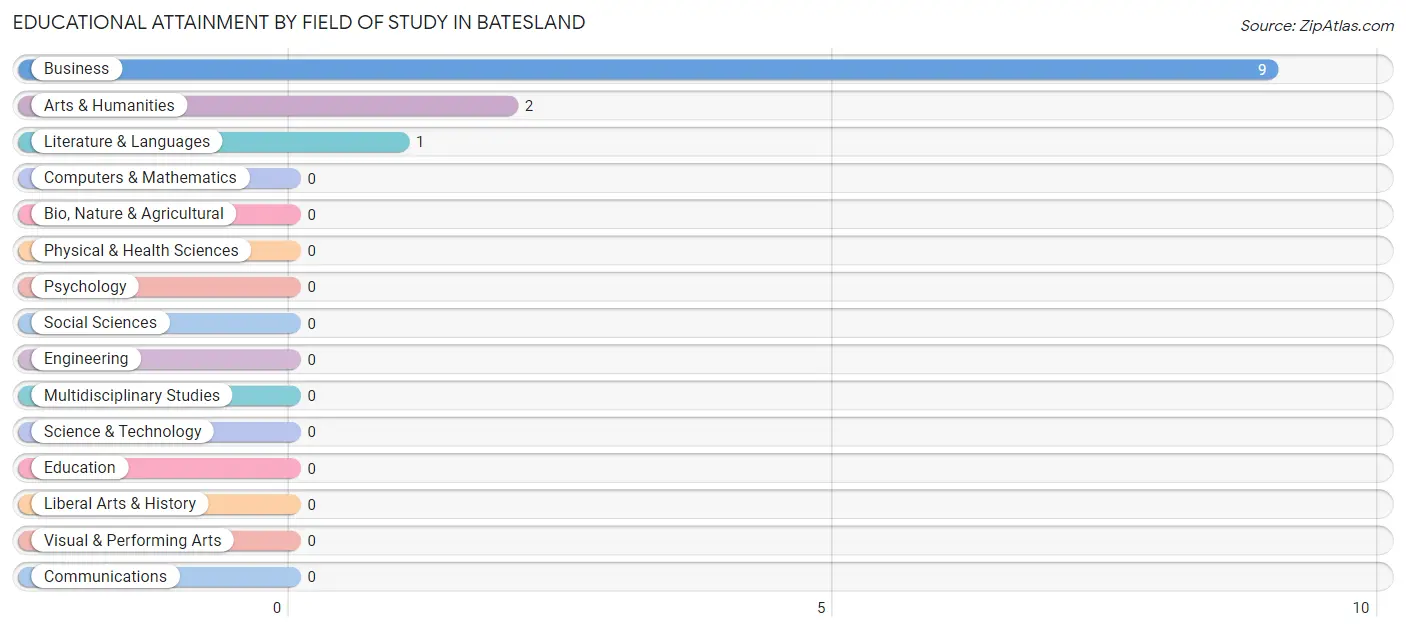
| Field of Study | # Graduates | % Graduates |
| Computers & Mathematics | 0 | 0.0% |
| Bio, Nature & Agricultural | 0 | 0.0% |
| Physical & Health Sciences | 0 | 0.0% |
| Psychology | 0 | 0.0% |
| Social Sciences | 0 | 0.0% |
| Engineering | 0 | 0.0% |
| Multidisciplinary Studies | 0 | 0.0% |
| Science & Technology | 0 | 0.0% |
| Business | 9 | 75.0% |
| Education | 0 | 0.0% |
| Literature & Languages | 1 | 8.3% |
| Liberal Arts & History | 0 | 0.0% |
| Visual & Performing Arts | 0 | 0.0% |
| Communications | 0 | 0.0% |
| Arts & Humanities | 2 | 16.7% |
| Total | 12 | 100.0% |
Transportation & Commute in Batesland
Vehicle Availability by Sex in Batesland
The most prevalent vehicle ownership categories in Batesland are males with 2 vehicles (4, accounting for 66.7%) and females with 2 vehicles (3, making up 28.6%).
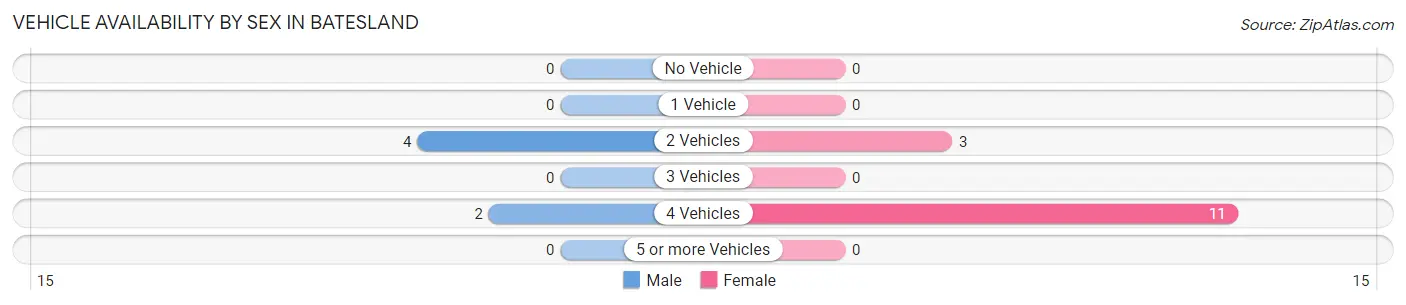
| Vehicles Available | Male | Female |
| No Vehicle | 0 (0.0%) | 0 (0.0%) |
| 1 Vehicle | 0 (0.0%) | 0 (0.0%) |
| 2 Vehicles | 4 (66.7%) | 3 (21.4%) |
| 3 Vehicles | 0 (0.0%) | 0 (0.0%) |
| 4 Vehicles | 2 (33.3%) | 11 (78.6%) |
| 5 or more Vehicles | 0 (0.0%) | 0 (0.0%) |
| Total | 6 (100.0%) | 14 (100.0%) |
Commute Time in Batesland
The most frequently occuring commute durations in Batesland are 30 to 34 minutes (9 commuters, 45.0%), 5 to 9 minutes (7 commuters, 35.0%), and 20 to 24 minutes (2 commuters, 10.0%).
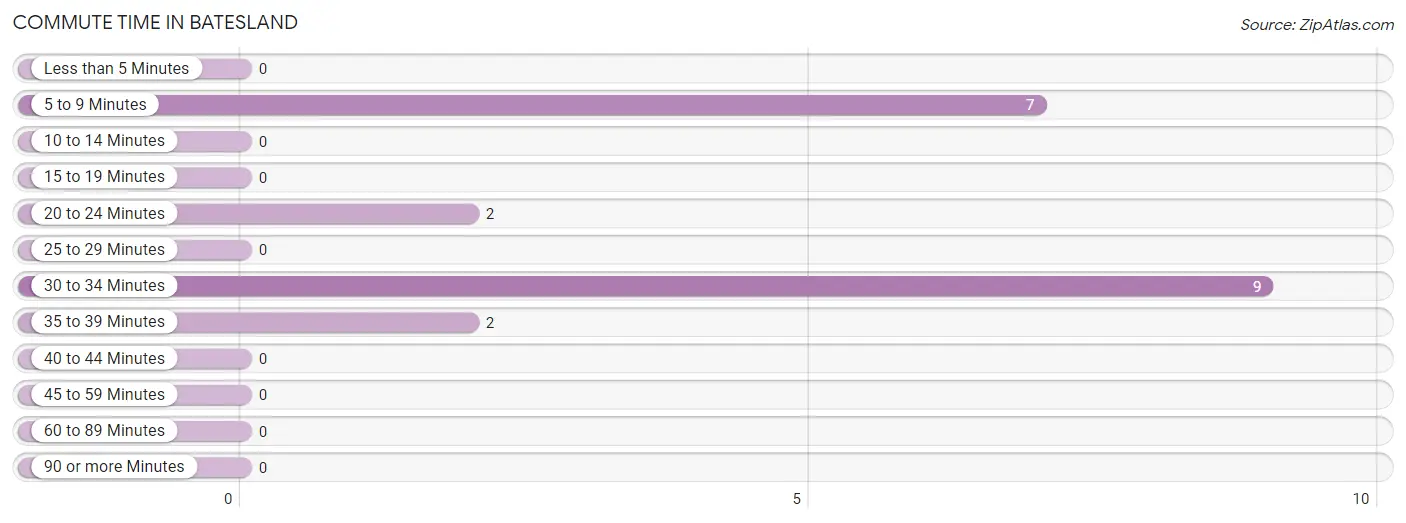
| Commute Time | # Commuters | % Commuters |
| Less than 5 Minutes | 0 | 0.0% |
| 5 to 9 Minutes | 7 | 35.0% |
| 10 to 14 Minutes | 0 | 0.0% |
| 15 to 19 Minutes | 0 | 0.0% |
| 20 to 24 Minutes | 2 | 10.0% |
| 25 to 29 Minutes | 0 | 0.0% |
| 30 to 34 Minutes | 9 | 45.0% |
| 35 to 39 Minutes | 2 | 10.0% |
| 40 to 44 Minutes | 0 | 0.0% |
| 45 to 59 Minutes | 0 | 0.0% |
| 60 to 89 Minutes | 0 | 0.0% |
| 90 or more Minutes | 0 | 0.0% |
Commute Time by Sex in Batesland
The most common commute times in Batesland are 5 to 9 minutes (2 commuters, 33.3%) for males and 30 to 34 minutes (9 commuters, 64.3%) for females.
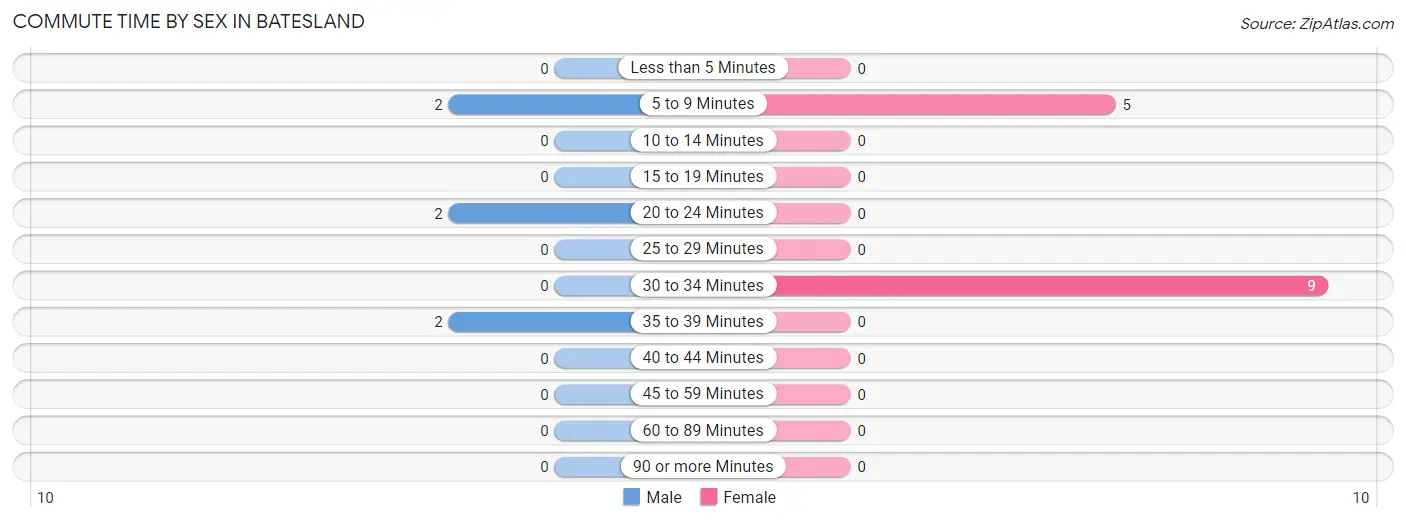
| Commute Time | Male | Female |
| Less than 5 Minutes | 0 (0.0%) | 0 (0.0%) |
| 5 to 9 Minutes | 2 (33.3%) | 5 (35.7%) |
| 10 to 14 Minutes | 0 (0.0%) | 0 (0.0%) |
| 15 to 19 Minutes | 0 (0.0%) | 0 (0.0%) |
| 20 to 24 Minutes | 2 (33.3%) | 0 (0.0%) |
| 25 to 29 Minutes | 0 (0.0%) | 0 (0.0%) |
| 30 to 34 Minutes | 0 (0.0%) | 9 (64.3%) |
| 35 to 39 Minutes | 2 (33.3%) | 0 (0.0%) |
| 40 to 44 Minutes | 0 (0.0%) | 0 (0.0%) |
| 45 to 59 Minutes | 0 (0.0%) | 0 (0.0%) |
| 60 to 89 Minutes | 0 (0.0%) | 0 (0.0%) |
| 90 or more Minutes | 0 (0.0%) | 0 (0.0%) |
Time of Departure to Work by Sex in Batesland
The most frequent times of departure to work in Batesland are 7:00 AM to 7:29 AM (4, 66.7%) for males and 7:00 AM to 7:29 AM (9, 64.3%) for females.
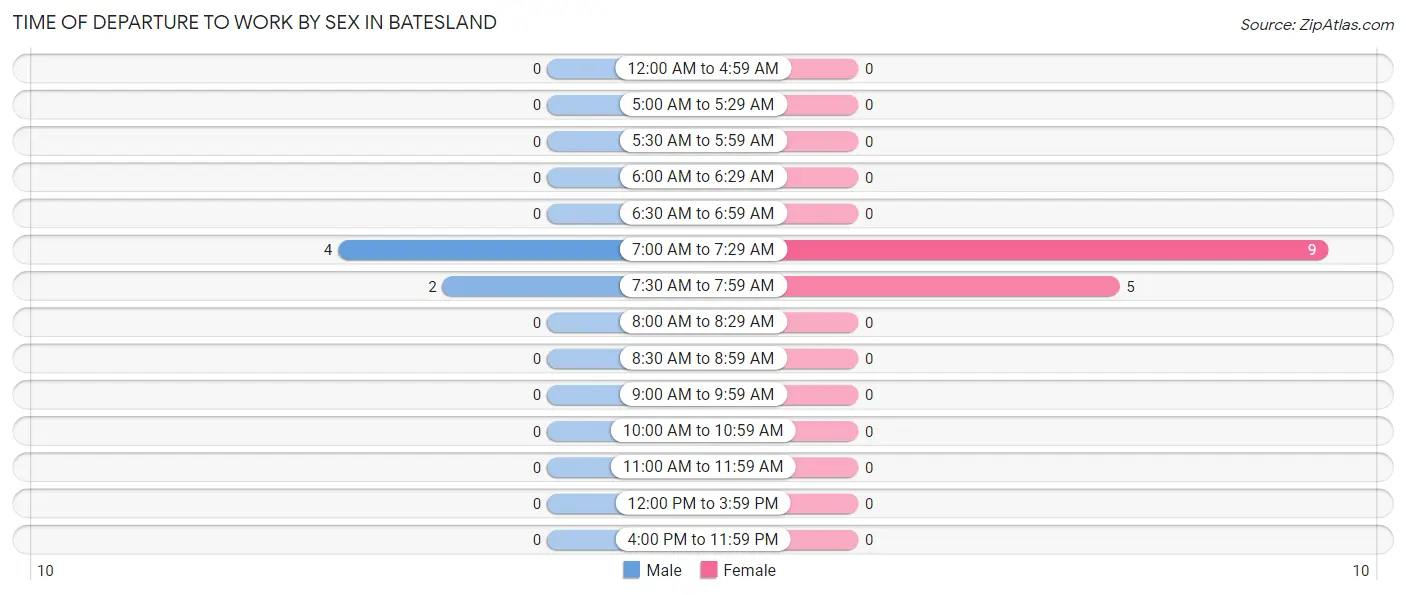
| Time of Departure | Male | Female |
| 12:00 AM to 4:59 AM | 0 (0.0%) | 0 (0.0%) |
| 5:00 AM to 5:29 AM | 0 (0.0%) | 0 (0.0%) |
| 5:30 AM to 5:59 AM | 0 (0.0%) | 0 (0.0%) |
| 6:00 AM to 6:29 AM | 0 (0.0%) | 0 (0.0%) |
| 6:30 AM to 6:59 AM | 0 (0.0%) | 0 (0.0%) |
| 7:00 AM to 7:29 AM | 4 (66.7%) | 9 (64.3%) |
| 7:30 AM to 7:59 AM | 2 (33.3%) | 5 (35.7%) |
| 8:00 AM to 8:29 AM | 0 (0.0%) | 0 (0.0%) |
| 8:30 AM to 8:59 AM | 0 (0.0%) | 0 (0.0%) |
| 9:00 AM to 9:59 AM | 0 (0.0%) | 0 (0.0%) |
| 10:00 AM to 10:59 AM | 0 (0.0%) | 0 (0.0%) |
| 11:00 AM to 11:59 AM | 0 (0.0%) | 0 (0.0%) |
| 12:00 PM to 3:59 PM | 0 (0.0%) | 0 (0.0%) |
| 4:00 PM to 11:59 PM | 0 (0.0%) | 0 (0.0%) |
| Total | 6 (100.0%) | 14 (100.0%) |
Housing Occupancy in Batesland
Occupancy by Ownership in Batesland
Of the total 25 dwellings in Batesland, owner-occupied units account for 25 (100.0%), while renter-occupied units make up 0 (0.0%).
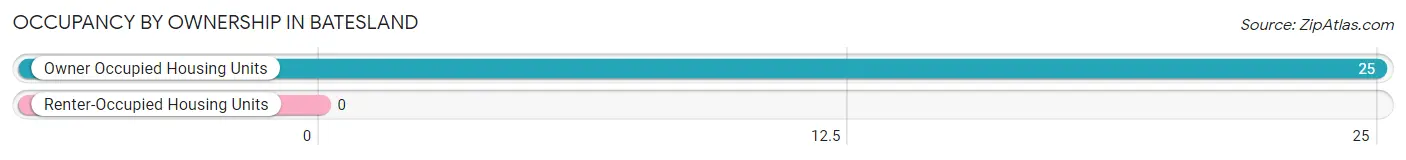
| Occupancy | # Housing Units | % Housing Units |
| Owner Occupied Housing Units | 25 | 100.0% |
| Renter-Occupied Housing Units | 0 | 0.0% |
| Total Occupied Housing Units | 25 | 100.0% |
Occupancy by Household Size in Batesland
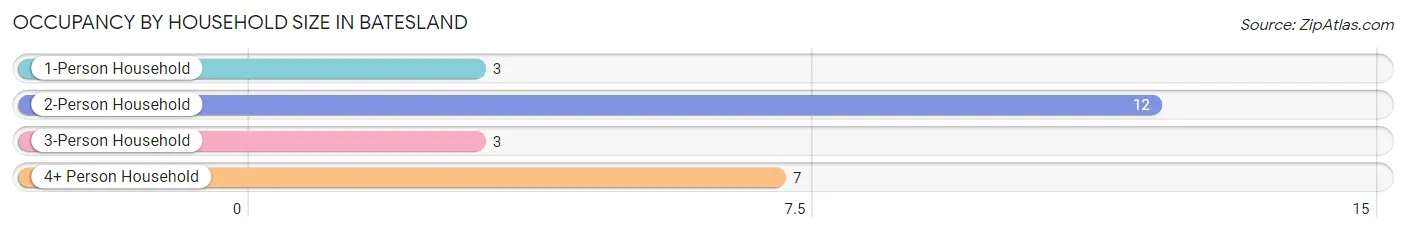
| Household Size | # Housing Units | % Housing Units |
| 1-Person Household | 3 | 12.0% |
| 2-Person Household | 12 | 48.0% |
| 3-Person Household | 3 | 12.0% |
| 4+ Person Household | 7 | 28.0% |
| Total Housing Units | 25 | 100.0% |
Occupancy by Ownership by Household Size in Batesland
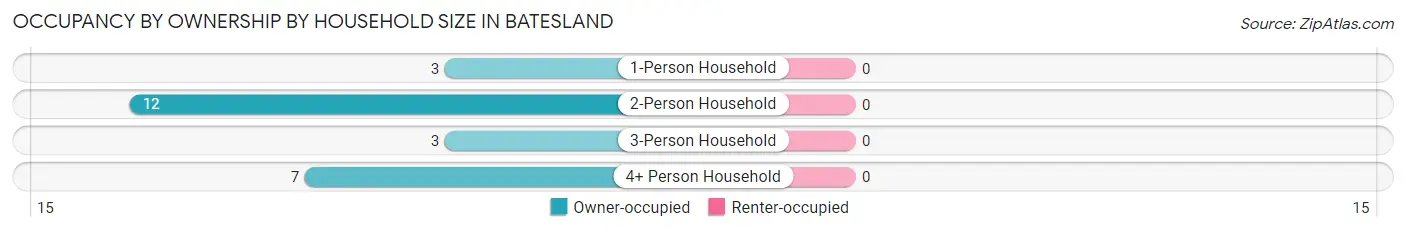
| Household Size | Owner-occupied | Renter-occupied |
| 1-Person Household | 3 (100.0%) | 0 (0.0%) |
| 2-Person Household | 12 (100.0%) | 0 (0.0%) |
| 3-Person Household | 3 (100.0%) | 0 (0.0%) |
| 4+ Person Household | 7 (100.0%) | 0 (0.0%) |
| Total Housing Units | 25 (100.0%) | 0 (0.0%) |
Occupancy by Educational Attainment in Batesland
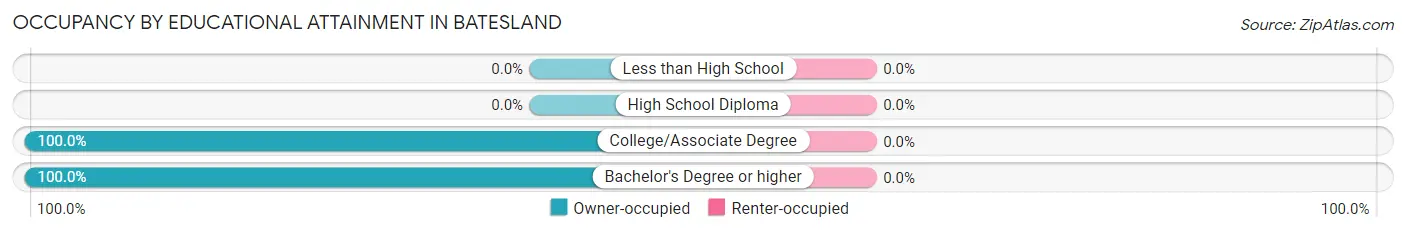
| Household Size | Owner-occupied | Renter-occupied |
| Less than High School | 0 (0.0%) | 0 (0.0%) |
| High School Diploma | 0 (0.0%) | 0 (0.0%) |
| College/Associate Degree | 15 (100.0%) | 0 (0.0%) |
| Bachelor's Degree or higher | 10 (100.0%) | 0 (0.0%) |
Occupancy by Age of Householder in Batesland
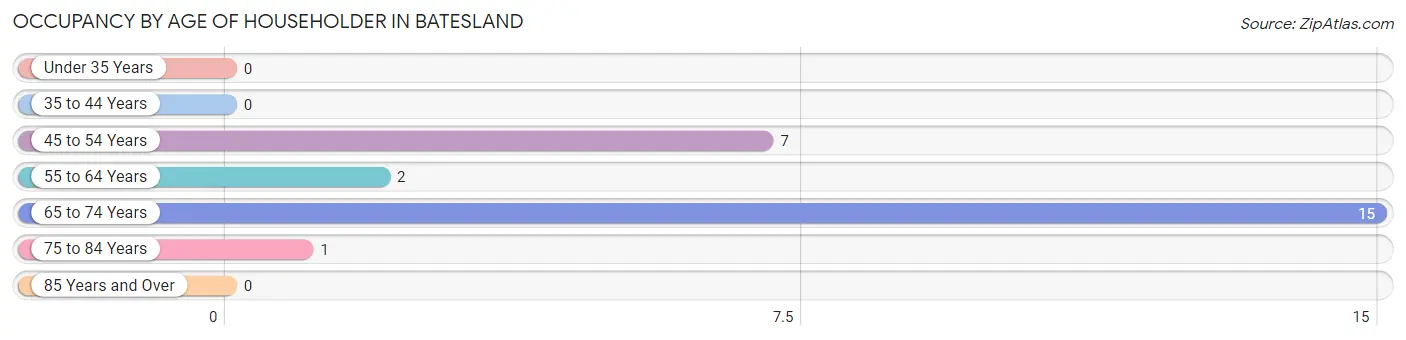
| Age Bracket | # Households | % Households |
| Under 35 Years | 0 | 0.0% |
| 35 to 44 Years | 0 | 0.0% |
| 45 to 54 Years | 7 | 28.0% |
| 55 to 64 Years | 2 | 8.0% |
| 65 to 74 Years | 15 | 60.0% |
| 75 to 84 Years | 1 | 4.0% |
| 85 Years and Over | 0 | 0.0% |
| Total | 25 | 100.0% |
Housing Finances in Batesland
Median Income by Occupancy in Batesland
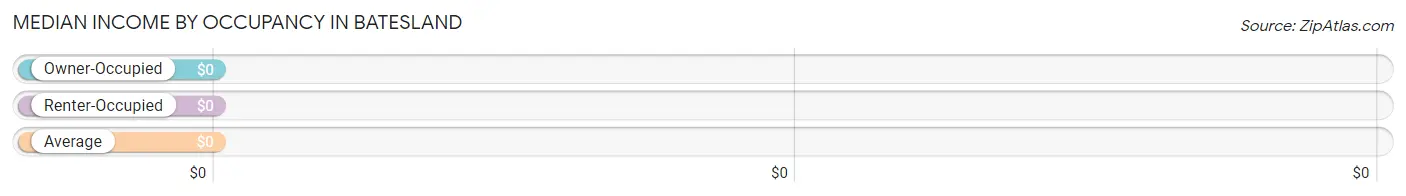
| Occupancy Type | # Households | Median Income |
| Owner-Occupied | 25 (100.0%) | $0 |
| Renter-Occupied | 0 (0.0%) | $0 |
| Average | 25 (100.0%) | $0 |
Occupancy by Householder Income Bracket in Batesland
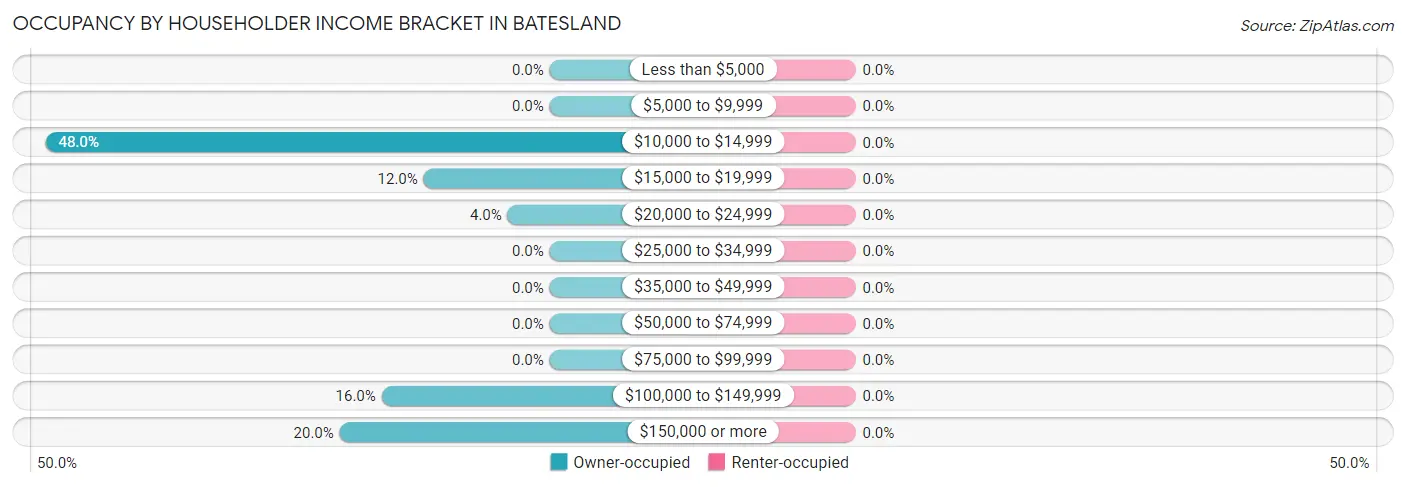
| Income Bracket | Owner-occupied | Renter-occupied |
| Less than $5,000 | 0 (0.0%) | 0 (0.0%) |
| $5,000 to $9,999 | 0 (0.0%) | 0 (0.0%) |
| $10,000 to $14,999 | 12 (48.0%) | 0 (0.0%) |
| $15,000 to $19,999 | 3 (12.0%) | 0 (0.0%) |
| $20,000 to $24,999 | 1 (4.0%) | 0 (0.0%) |
| $25,000 to $34,999 | 0 (0.0%) | 0 (0.0%) |
| $35,000 to $49,999 | 0 (0.0%) | 0 (0.0%) |
| $50,000 to $74,999 | 0 (0.0%) | 0 (0.0%) |
| $75,000 to $99,999 | 0 (0.0%) | 0 (0.0%) |
| $100,000 to $149,999 | 4 (16.0%) | 0 (0.0%) |
| $150,000 or more | 5 (20.0%) | 0 (0.0%) |
| Total | 25 (100.0%) | 0 (0.0%) |
Monthly Housing Cost Tiers in Batesland
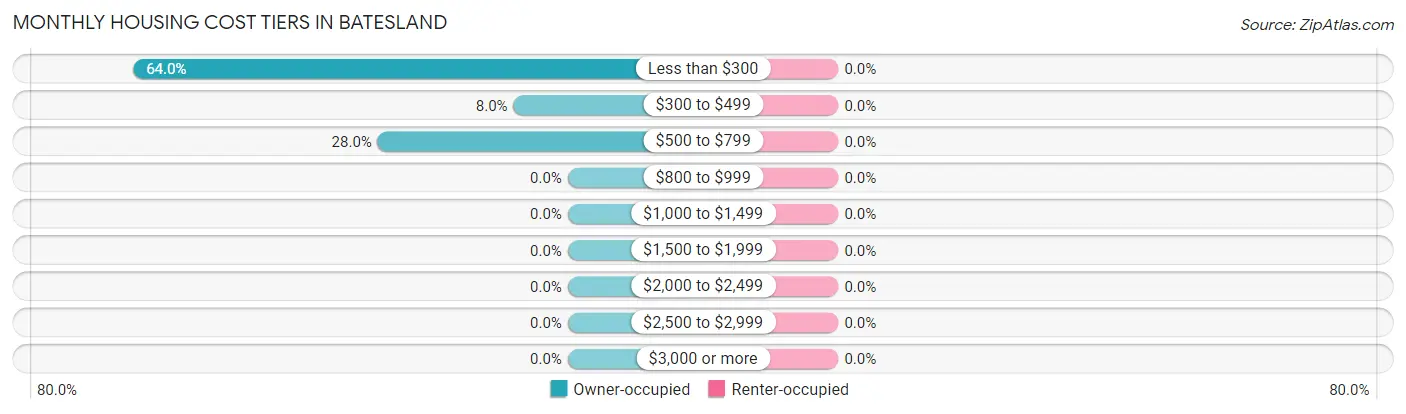
| Monthly Cost | Owner-occupied | Renter-occupied |
| Less than $300 | 16 (64.0%) | 0 (0.0%) |
| $300 to $499 | 2 (8.0%) | 0 (0.0%) |
| $500 to $799 | 7 (28.0%) | 0 (0.0%) |
| $800 to $999 | 0 (0.0%) | 0 (0.0%) |
| $1,000 to $1,499 | 0 (0.0%) | 0 (0.0%) |
| $1,500 to $1,999 | 0 (0.0%) | 0 (0.0%) |
| $2,000 to $2,499 | 0 (0.0%) | 0 (0.0%) |
| $2,500 to $2,999 | 0 (0.0%) | 0 (0.0%) |
| $3,000 or more | 0 (0.0%) | 0 (0.0%) |
| Total | 25 (100.0%) | 0 (0.0%) |
Physical Housing Characteristics in Batesland
Housing Structures in Batesland
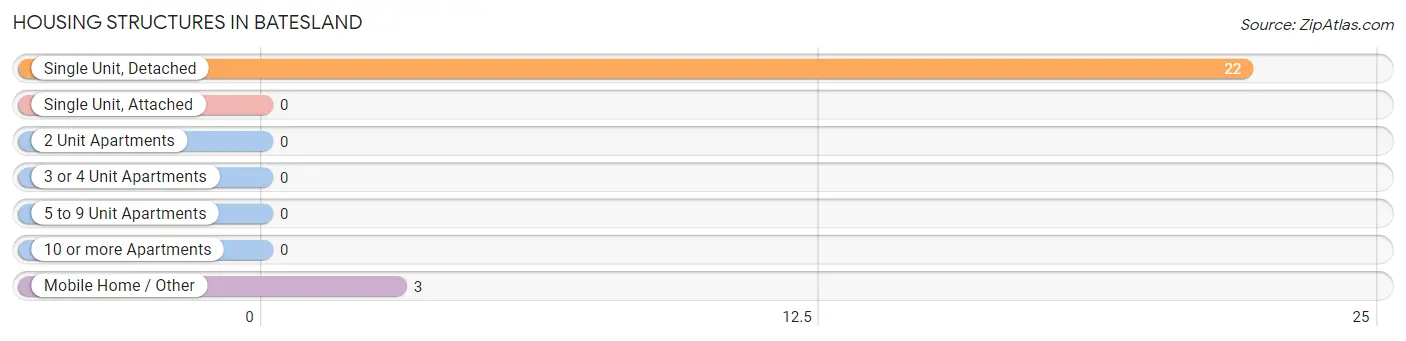
| Structure Type | # Housing Units | % Housing Units |
| Single Unit, Detached | 22 | 88.0% |
| Single Unit, Attached | 0 | 0.0% |
| 2 Unit Apartments | 0 | 0.0% |
| 3 or 4 Unit Apartments | 0 | 0.0% |
| 5 to 9 Unit Apartments | 0 | 0.0% |
| 10 or more Apartments | 0 | 0.0% |
| Mobile Home / Other | 3 | 12.0% |
| Total | 25 | 100.0% |
Housing Structures by Occupancy in Batesland
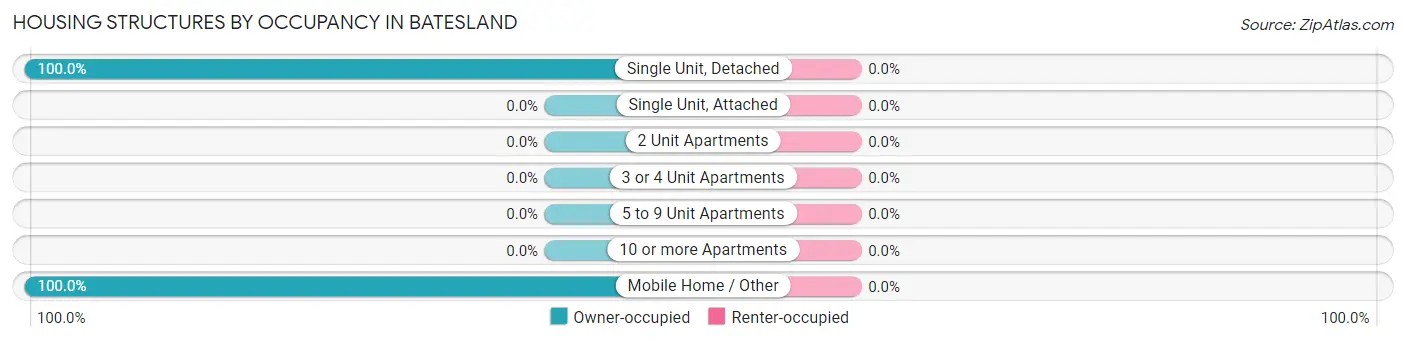
| Structure Type | Owner-occupied | Renter-occupied |
| Single Unit, Detached | 22 (100.0%) | 0 (0.0%) |
| Single Unit, Attached | 0 (0.0%) | 0 (0.0%) |
| 2 Unit Apartments | 0 (0.0%) | 0 (0.0%) |
| 3 or 4 Unit Apartments | 0 (0.0%) | 0 (0.0%) |
| 5 to 9 Unit Apartments | 0 (0.0%) | 0 (0.0%) |
| 10 or more Apartments | 0 (0.0%) | 0 (0.0%) |
| Mobile Home / Other | 3 (100.0%) | 0 (0.0%) |
| Total | 25 (100.0%) | 0 (0.0%) |
Housing Structures by Number of Rooms in Batesland
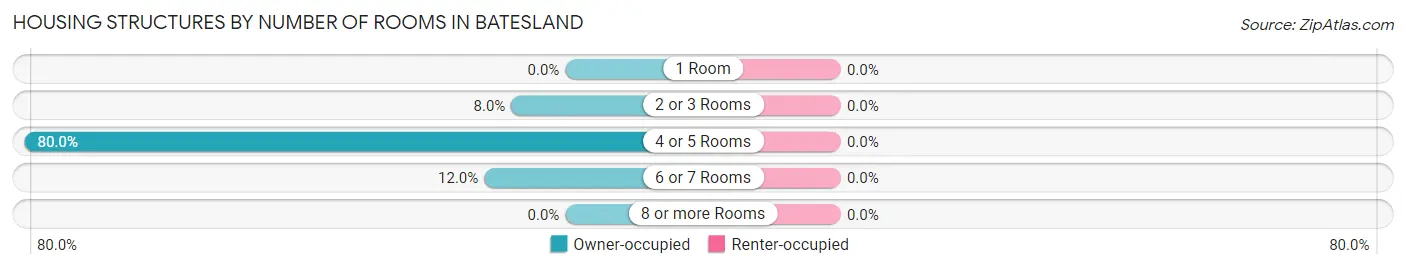
| Number of Rooms | Owner-occupied | Renter-occupied |
| 1 Room | 0 (0.0%) | 0 (0.0%) |
| 2 or 3 Rooms | 2 (8.0%) | 0 (0.0%) |
| 4 or 5 Rooms | 20 (80.0%) | 0 (0.0%) |
| 6 or 7 Rooms | 3 (12.0%) | 0 (0.0%) |
| 8 or more Rooms | 0 (0.0%) | 0 (0.0%) |
| Total | 25 (100.0%) | 0 (0.0%) |
Housing Structure by Heating Type in Batesland
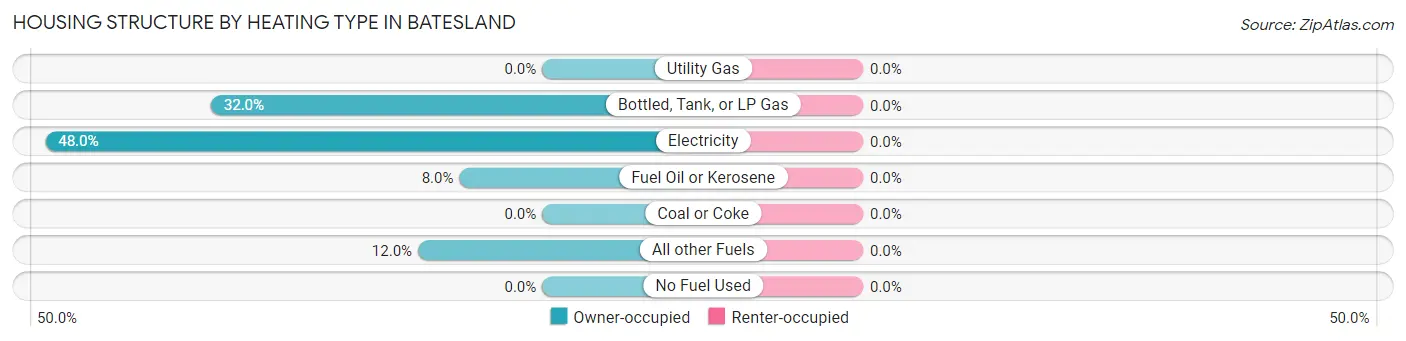
| Heating Type | Owner-occupied | Renter-occupied |
| Utility Gas | 0 (0.0%) | 0 (0.0%) |
| Bottled, Tank, or LP Gas | 8 (32.0%) | 0 (0.0%) |
| Electricity | 12 (48.0%) | 0 (0.0%) |
| Fuel Oil or Kerosene | 2 (8.0%) | 0 (0.0%) |
| Coal or Coke | 0 (0.0%) | 0 (0.0%) |
| All other Fuels | 3 (12.0%) | 0 (0.0%) |
| No Fuel Used | 0 (0.0%) | 0 (0.0%) |
| Total | 25 (100.0%) | 0 (0.0%) |
Household Vehicle Usage in Batesland
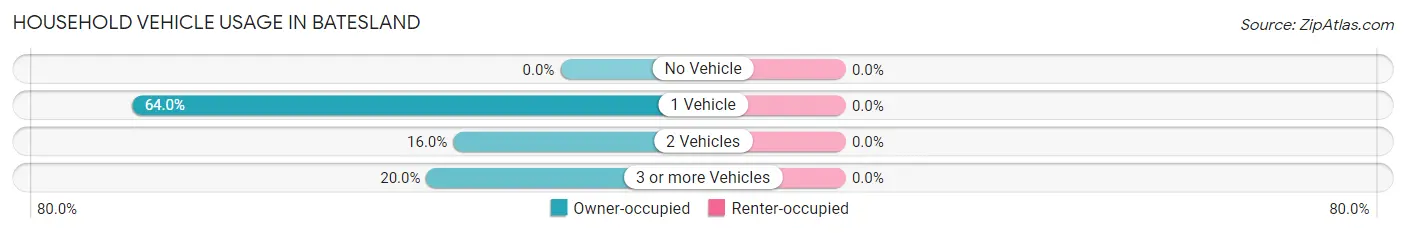
| Vehicles per Household | Owner-occupied | Renter-occupied |
| No Vehicle | 0 (0.0%) | 0 (0.0%) |
| 1 Vehicle | 16 (64.0%) | 0 (0.0%) |
| 2 Vehicles | 4 (16.0%) | 0 (0.0%) |
| 3 or more Vehicles | 5 (20.0%) | 0 (0.0%) |
| Total | 25 (100.0%) | 0 (0.0%) |
Real Estate & Mortgages in Batesland
Real Estate and Mortgage Overview in Batesland
| Characteristic | Without Mortgage | With Mortgage |
| Housing Units | 25 | 0 |
| Median Property Value | $38,100 | $0 |
| Median Household Income | - | - |
| Monthly Housing Costs | - | - |
| Real Estate Taxes | $527 | $0 |
Property Value by Mortgage Status in Batesland
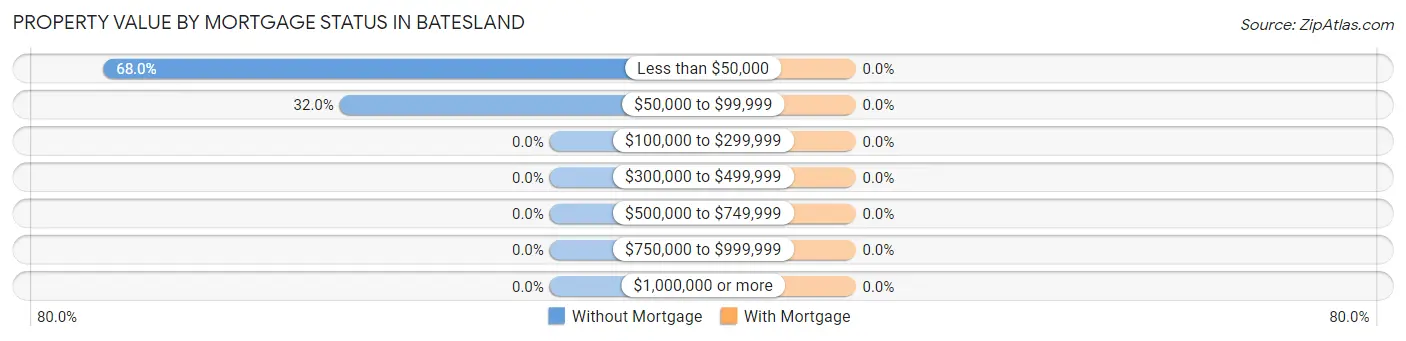
| Property Value | Without Mortgage | With Mortgage |
| Less than $50,000 | 17 (68.0%) | 0 (0.0%) |
| $50,000 to $99,999 | 8 (32.0%) | 0 (0.0%) |
| $100,000 to $299,999 | 0 (0.0%) | 0 (0.0%) |
| $300,000 to $499,999 | 0 (0.0%) | 0 (0.0%) |
| $500,000 to $749,999 | 0 (0.0%) | 0 (0.0%) |
| $750,000 to $999,999 | 0 (0.0%) | 0 (0.0%) |
| $1,000,000 or more | 0 (0.0%) | 0 (0.0%) |
| Total | 25 (100.0%) | 0 (0.0%) |
Household Income by Mortgage Status in Batesland
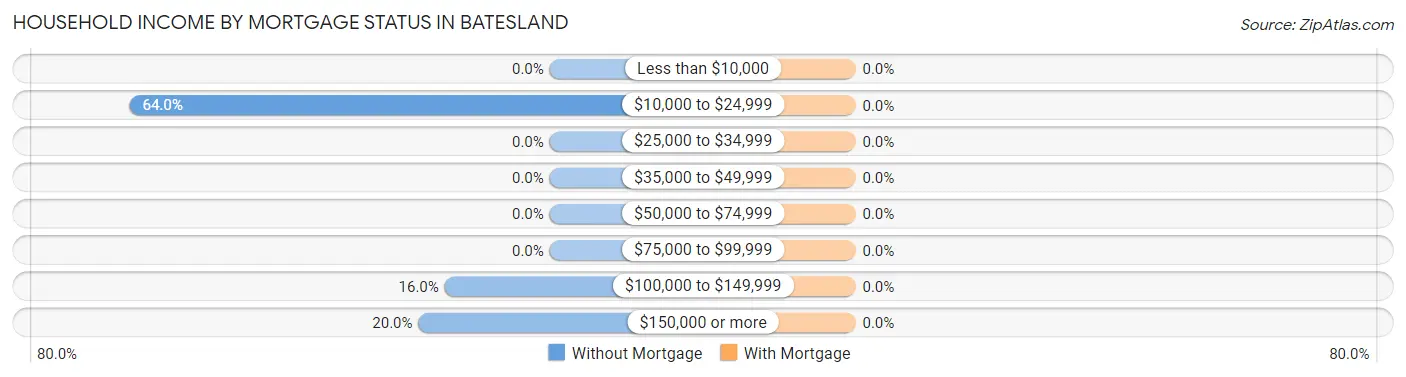
| Household Income | Without Mortgage | With Mortgage |
| Less than $10,000 | 0 (0.0%) | 0 (0.0%) |
| $10,000 to $24,999 | 16 (64.0%) | 0 (0.0%) |
| $25,000 to $34,999 | 0 (0.0%) | 0 (0.0%) |
| $35,000 to $49,999 | 0 (0.0%) | 0 (0.0%) |
| $50,000 to $74,999 | 0 (0.0%) | 0 (0.0%) |
| $75,000 to $99,999 | 0 (0.0%) | 0 (0.0%) |
| $100,000 to $149,999 | 4 (16.0%) | 0 (0.0%) |
| $150,000 or more | 5 (20.0%) | 0 (0.0%) |
| Total | 25 (100.0%) | 0 (0.0%) |
Property Value to Household Income Ratio in Batesland
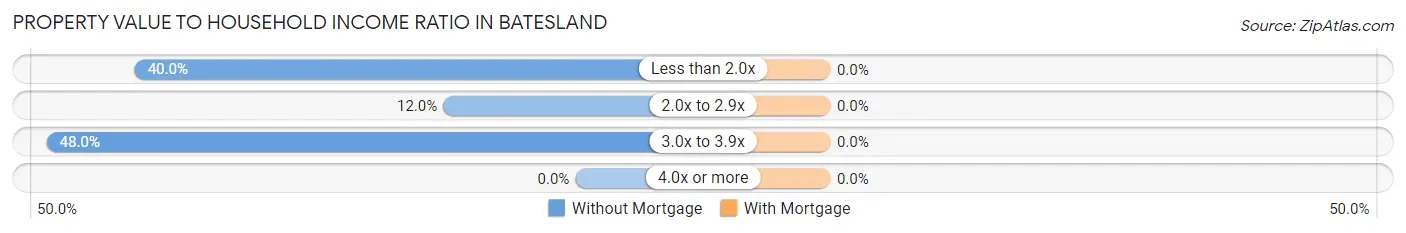
| Value-to-Income Ratio | Without Mortgage | With Mortgage |
| Less than 2.0x | 10 (40.0%) | 0 (0.0%) |
| 2.0x to 2.9x | 3 (12.0%) | 0 (0.0%) |
| 3.0x to 3.9x | 12 (48.0%) | 0 (0.0%) |
| 4.0x or more | 0 (0.0%) | 0 (0.0%) |
| Total | 25 (100.0%) | 0 (0.0%) |
Real Estate Taxes by Mortgage Status in Batesland
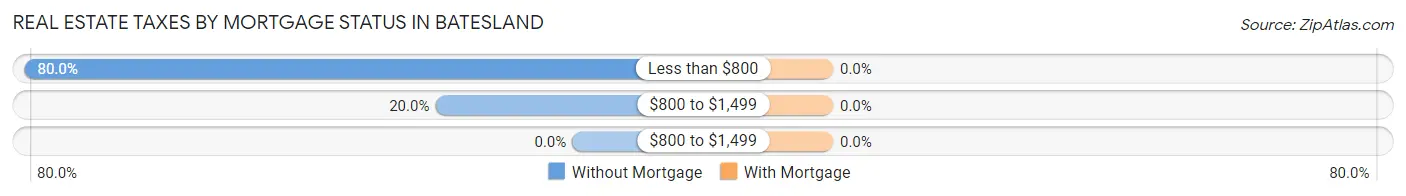
| Property Taxes | Without Mortgage | With Mortgage |
| Less than $800 | 20 (80.0%) | 0 (0.0%) |
| $800 to $1,499 | 5 (20.0%) | 0 (0.0%) |
| $800 to $1,499 | 0 (0.0%) | 0 (0.0%) |
| Total | 25 (100.0%) | 0 (0.0%) |
Health & Disability in Batesland
Health Insurance Coverage by Age in Batesland
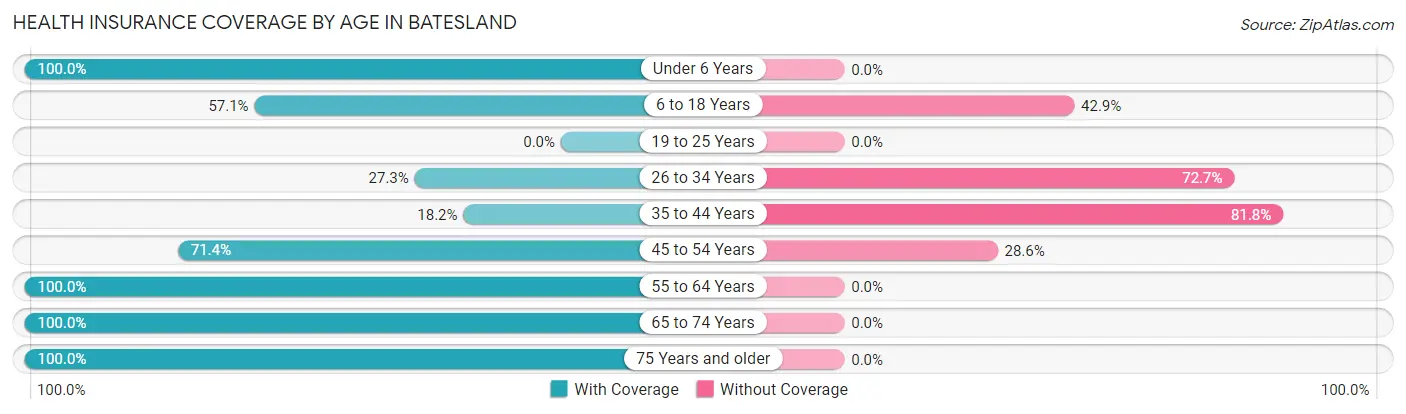
| Age Bracket | With Coverage | Without Coverage |
| Under 6 Years | 6 (100.0%) | 0 (0.0%) |
| 6 to 18 Years | 8 (57.1%) | 6 (42.9%) |
| 19 to 25 Years | 0 (0.0%) | 0 (0.0%) |
| 26 to 34 Years | 3 (27.3%) | 8 (72.7%) |
| 35 to 44 Years | 2 (18.2%) | 9 (81.8%) |
| 45 to 54 Years | 5 (71.4%) | 2 (28.6%) |
| 55 to 64 Years | 2 (100.0%) | 0 (0.0%) |
| 65 to 74 Years | 37 (100.0%) | 0 (0.0%) |
| 75 Years and older | 1 (100.0%) | 0 (0.0%) |
| Total | 64 (71.9%) | 25 (28.1%) |
Health Insurance Coverage by Citizenship Status in Batesland
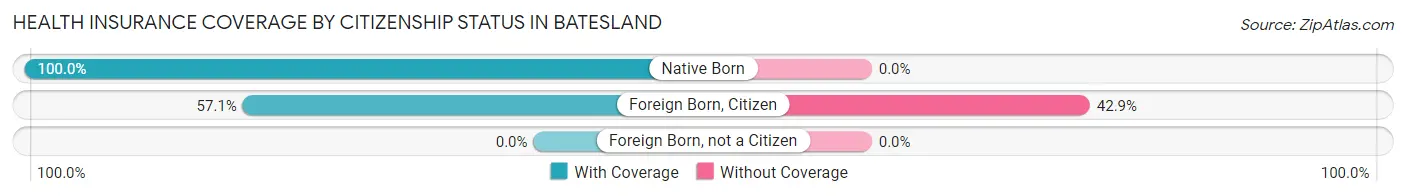
| Citizenship Status | With Coverage | Without Coverage |
| Native Born | 6 (100.0%) | 0 (0.0%) |
| Foreign Born, Citizen | 8 (57.1%) | 6 (42.9%) |
| Foreign Born, not a Citizen | 0 (0.0%) | 0 (0.0%) |
Health Insurance Coverage by Household Income in Batesland
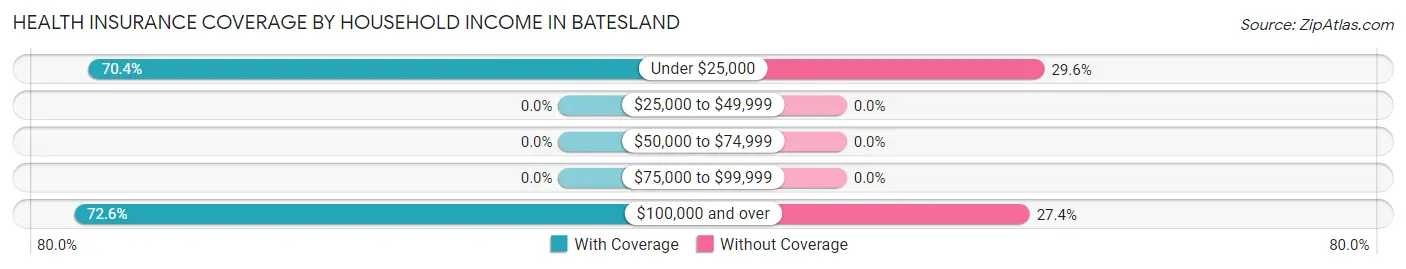
| Household Income | With Coverage | Without Coverage |
| Under $25,000 | 19 (70.4%) | 8 (29.6%) |
| $25,000 to $49,999 | 0 (0.0%) | 0 (0.0%) |
| $50,000 to $74,999 | 0 (0.0%) | 0 (0.0%) |
| $75,000 to $99,999 | 0 (0.0%) | 0 (0.0%) |
| $100,000 and over | 45 (72.6%) | 17 (27.4%) |
Public vs Private Health Insurance Coverage by Age in Batesland
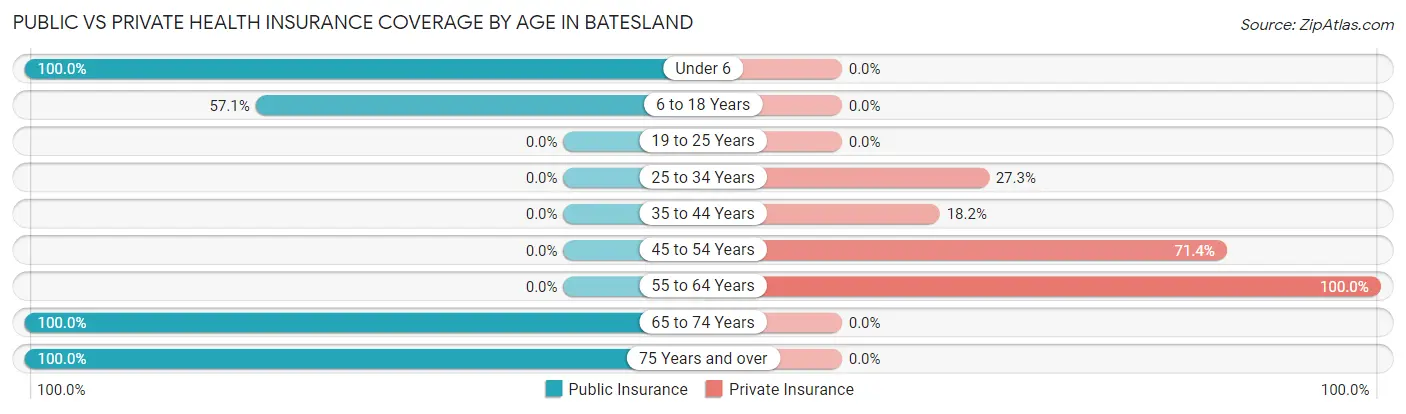
| Age Bracket | Public Insurance | Private Insurance |
| Under 6 | 6 (100.0%) | 0 (0.0%) |
| 6 to 18 Years | 8 (57.1%) | 0 (0.0%) |
| 19 to 25 Years | 0 (0.0%) | 0 (0.0%) |
| 25 to 34 Years | 0 (0.0%) | 3 (27.3%) |
| 35 to 44 Years | 0 (0.0%) | 2 (18.2%) |
| 45 to 54 Years | 0 (0.0%) | 5 (71.4%) |
| 55 to 64 Years | 0 (0.0%) | 2 (100.0%) |
| 65 to 74 Years | 37 (100.0%) | 0 (0.0%) |
| 75 Years and over | 1 (100.0%) | 0 (0.0%) |
| Total | 52 (58.4%) | 12 (13.5%) |
Disability Status by Sex by Age in Batesland
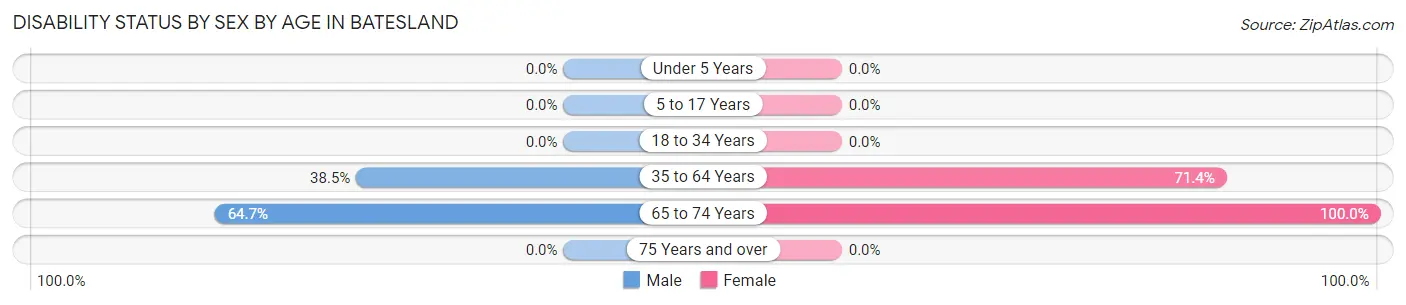
| Age Bracket | Male | Female |
| Under 5 Years | 0 (0.0%) | 0 (0.0%) |
| 5 to 17 Years | 0 (0.0%) | 0 (0.0%) |
| 18 to 34 Years | 0 (0.0%) | 0 (0.0%) |
| 35 to 64 Years | 5 (38.5%) | 5 (71.4%) |
| 65 to 74 Years | 22 (64.7%) | 3 (100.0%) |
| 75 Years and over | 0 (0.0%) | 0 (0.0%) |
Disability Class by Sex by Age in Batesland
Disability Class: Hearing Difficulty
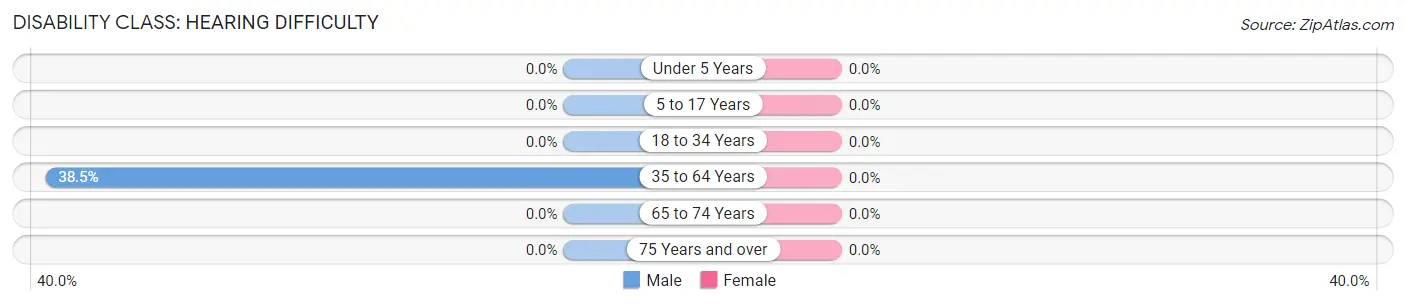
| Age Bracket | Male | Female |
| Under 5 Years | 0 (0.0%) | 0 (0.0%) |
| 5 to 17 Years | 0 (0.0%) | 0 (0.0%) |
| 18 to 34 Years | 0 (0.0%) | 0 (0.0%) |
| 35 to 64 Years | 5 (38.5%) | 0 (0.0%) |
| 65 to 74 Years | 0 (0.0%) | 0 (0.0%) |
| 75 Years and over | 0 (0.0%) | 0 (0.0%) |
Disability Class: Vision Difficulty
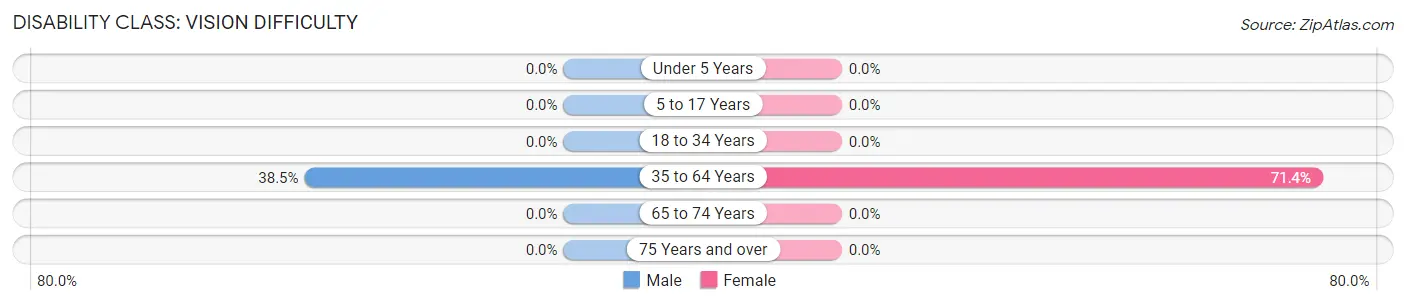
| Age Bracket | Male | Female |
| Under 5 Years | 0 (0.0%) | 0 (0.0%) |
| 5 to 17 Years | 0 (0.0%) | 0 (0.0%) |
| 18 to 34 Years | 0 (0.0%) | 0 (0.0%) |
| 35 to 64 Years | 5 (38.5%) | 5 (71.4%) |
| 65 to 74 Years | 0 (0.0%) | 0 (0.0%) |
| 75 Years and over | 0 (0.0%) | 0 (0.0%) |
Disability Class: Cognitive Difficulty
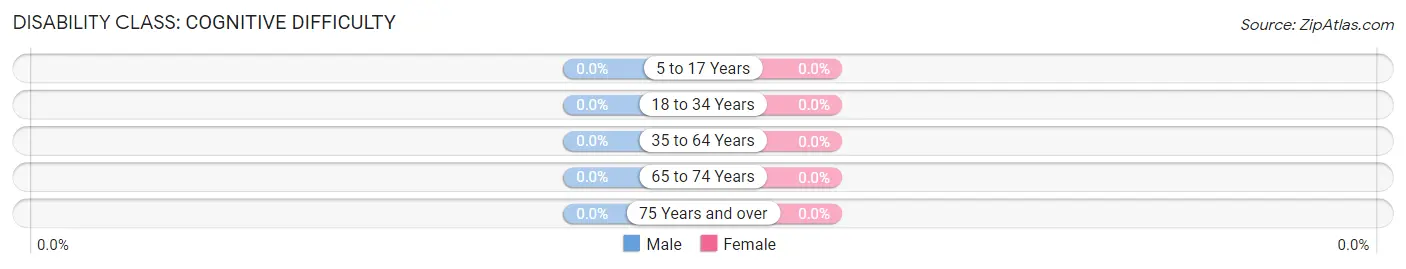
| Age Bracket | Male | Female |
| 5 to 17 Years | 0 (0.0%) | 0 (0.0%) |
| 18 to 34 Years | 0 (0.0%) | 0 (0.0%) |
| 35 to 64 Years | 0 (0.0%) | 0 (0.0%) |
| 65 to 74 Years | 0 (0.0%) | 0 (0.0%) |
| 75 Years and over | 0 (0.0%) | 0 (0.0%) |
Disability Class: Ambulatory Difficulty
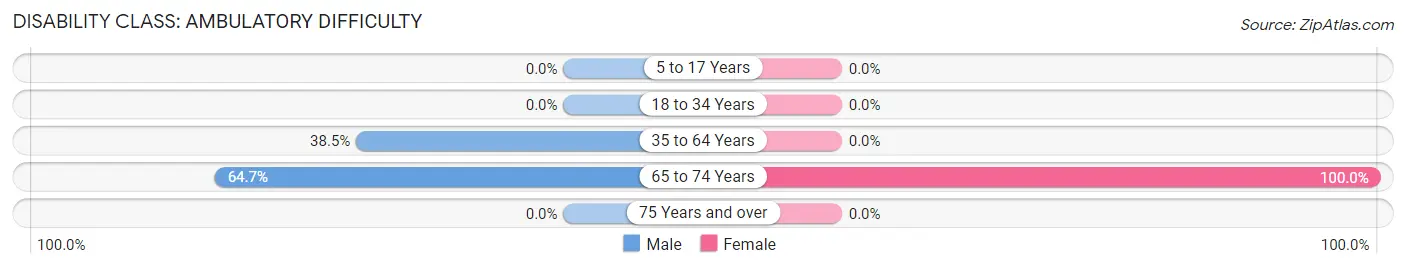
| Age Bracket | Male | Female |
| 5 to 17 Years | 0 (0.0%) | 0 (0.0%) |
| 18 to 34 Years | 0 (0.0%) | 0 (0.0%) |
| 35 to 64 Years | 5 (38.5%) | 0 (0.0%) |
| 65 to 74 Years | 22 (64.7%) | 3 (100.0%) |
| 75 Years and over | 0 (0.0%) | 0 (0.0%) |
Disability Class: Self-Care Difficulty
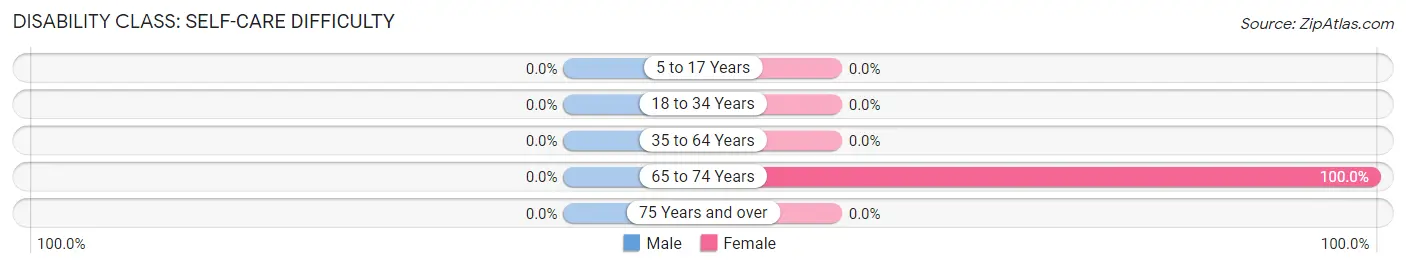
| Age Bracket | Male | Female |
| 5 to 17 Years | 0 (0.0%) | 0 (0.0%) |
| 18 to 34 Years | 0 (0.0%) | 0 (0.0%) |
| 35 to 64 Years | 0 (0.0%) | 0 (0.0%) |
| 65 to 74 Years | 0 (0.0%) | 3 (100.0%) |
| 75 Years and over | 0 (0.0%) | 0 (0.0%) |
Technology Access in Batesland
Computing Device Access in Batesland
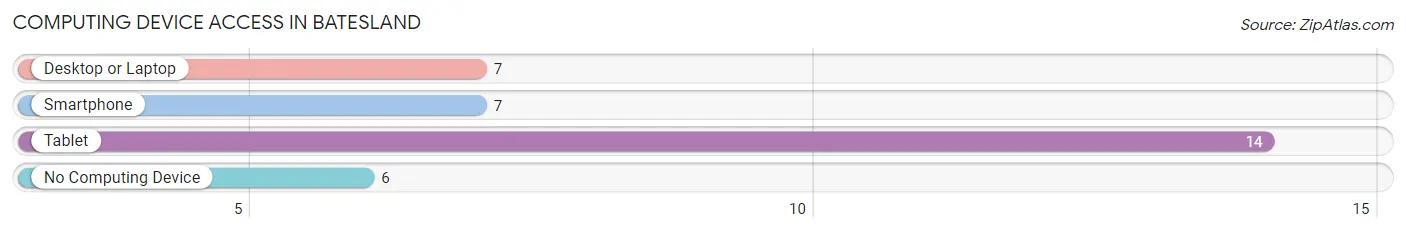
| Device Type | # Households | % Households |
| Desktop or Laptop | 7 | 28.0% |
| Smartphone | 7 | 28.0% |
| Tablet | 14 | 56.0% |
| No Computing Device | 6 | 24.0% |
| Total | 25 | 100.0% |
Internet Access in Batesland
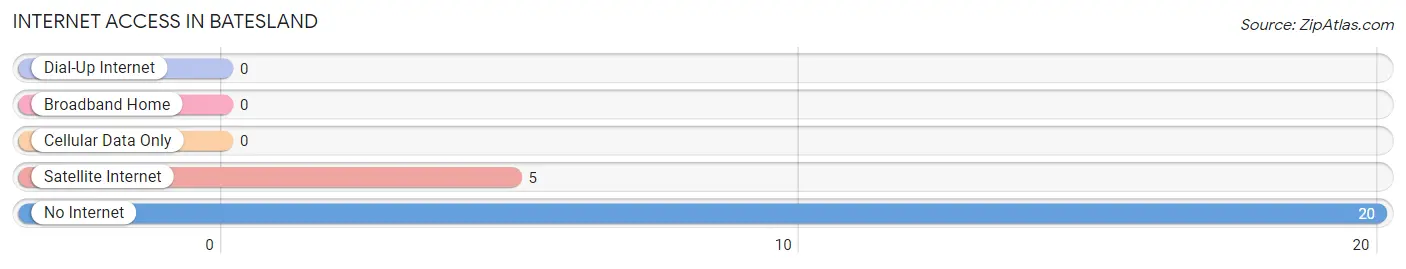
| Internet Type | # Households | % Households |
| Dial-Up Internet | 0 | 0.0% |
| Broadband Home | 0 | 0.0% |
| Cellular Data Only | 0 | 0.0% |
| Satellite Internet | 5 | 20.0% |
| No Internet | 20 | 80.0% |
| Total | 25 | 100.0% |
Batesland Summary
Batesland is a small town located in the southwestern corner of South Dakota, in the Pine Ridge Indian Reservation. It is situated in the Oglala Lakota County, and is the county seat. The town was named after the first postmaster, William Bates, who was appointed in 1887. The population of Batesland was estimated to be 545 in the 2010 census.
Geography
Batesland is located in the southwestern corner of South Dakota, in the Pine Ridge Indian Reservation. It is situated in the Oglala Lakota County, and is the county seat. The town is located at an elevation of 3,845 feet above sea level. The town is surrounded by rolling hills and grasslands, and is located near the Badlands National Park. The town is located at the intersection of US Route 18 and South Dakota Highway 73.
Economy
The economy of Batesland is largely based on agriculture and tourism. The town is home to several small businesses, including a grocery store, a gas station, a restaurant, and a few other small shops. The town also has a post office and a bank. The town is also home to the Oglala Lakota College, which provides educational opportunities to the local community.
The town is also home to the Pine Ridge Indian Reservation, which is home to the Oglala Sioux Tribe. The reservation is home to several businesses, including a casino, a hotel, and a golf course. The reservation also provides employment opportunities to the local community.
Demographics
The population of Batesland was estimated to be 545 in the 2010 census. The population is predominantly Native American, with the majority of the population being of Oglala Sioux descent. The median age of the population is 33.7 years, and the median household income is $25,000. The town has a poverty rate of 33.3%, which is higher than the national average.
The town is served by the Oglala Sioux Tribe School District, which provides educational opportunities to the local community. The town is also home to the Oglala Lakota College, which provides educational opportunities to the local community.
Conclusion
Batesland is a small town located in the southwestern corner of South Dakota, in the Pine Ridge Indian Reservation. It is situated in the Oglala Lakota County, and is the county seat. The town was named after the first postmaster, William Bates, who was appointed in 1887. The population of Batesland was estimated to be 545 in the 2010 census. The economy of Batesland is largely based on agriculture and tourism, and the town is home to several small businesses. The population is predominantly Native American, with the majority of the population being of Oglala Sioux descent. The town is served by the Oglala Sioux Tribe School District, and is home to the Oglala Lakota College.
Common Questions
What is Per Capita Income in Batesland?
Per Capita income in Batesland is $21,351.
What is Income or Wage Gap in Batesland?
Income or Wage Gap in Batesland is 50.8%.
Women in Batesland earn 49.2 cents for every dollar earned by a man.
What is Inequality or Gini Index in Batesland?
Inequality or Gini Index in Batesland is 0.58.
What is the Total Population of Batesland?
Total Population of Batesland is 89.
What is the Total Male Population of Batesland?
Total Male Population of Batesland is 53.
What is the Total Female Population of Batesland?
Total Female Population of Batesland is 36.
What is the Ratio of Males per 100 Females in Batesland?
There are 147.22 Males per 100 Females in Batesland.
What is the Ratio of Females per 100 Males in Batesland?
There are 67.92 Females per 100 Males in Batesland.
What is the Median Population Age in Batesland?
Median Population Age in Batesland is 50.1 Years.
What is the Average Family Size in Batesland
Average Family Size in Batesland is 3.8 People.
What is the Average Household Size in Batesland
Average Household Size in Batesland is 3.6 People.
How Large is the Labor Force in Batesland?
There are 25 People in the Labor Forcein in Batesland.
What is the Percentage of People in the Labor Force in Batesland?
35.2% of People are in the Labor Force in Batesland.
What is the Unemployment Rate in Batesland?
Unemployment Rate in Batesland is 20.0%.