Cities with the Highest Poverty Level Among Children Under the Age of 5 in South Dakota
RELATED REPORTS & OPTIONS
Highest Poverty | Child 0-5
South Dakota
Compare Cities
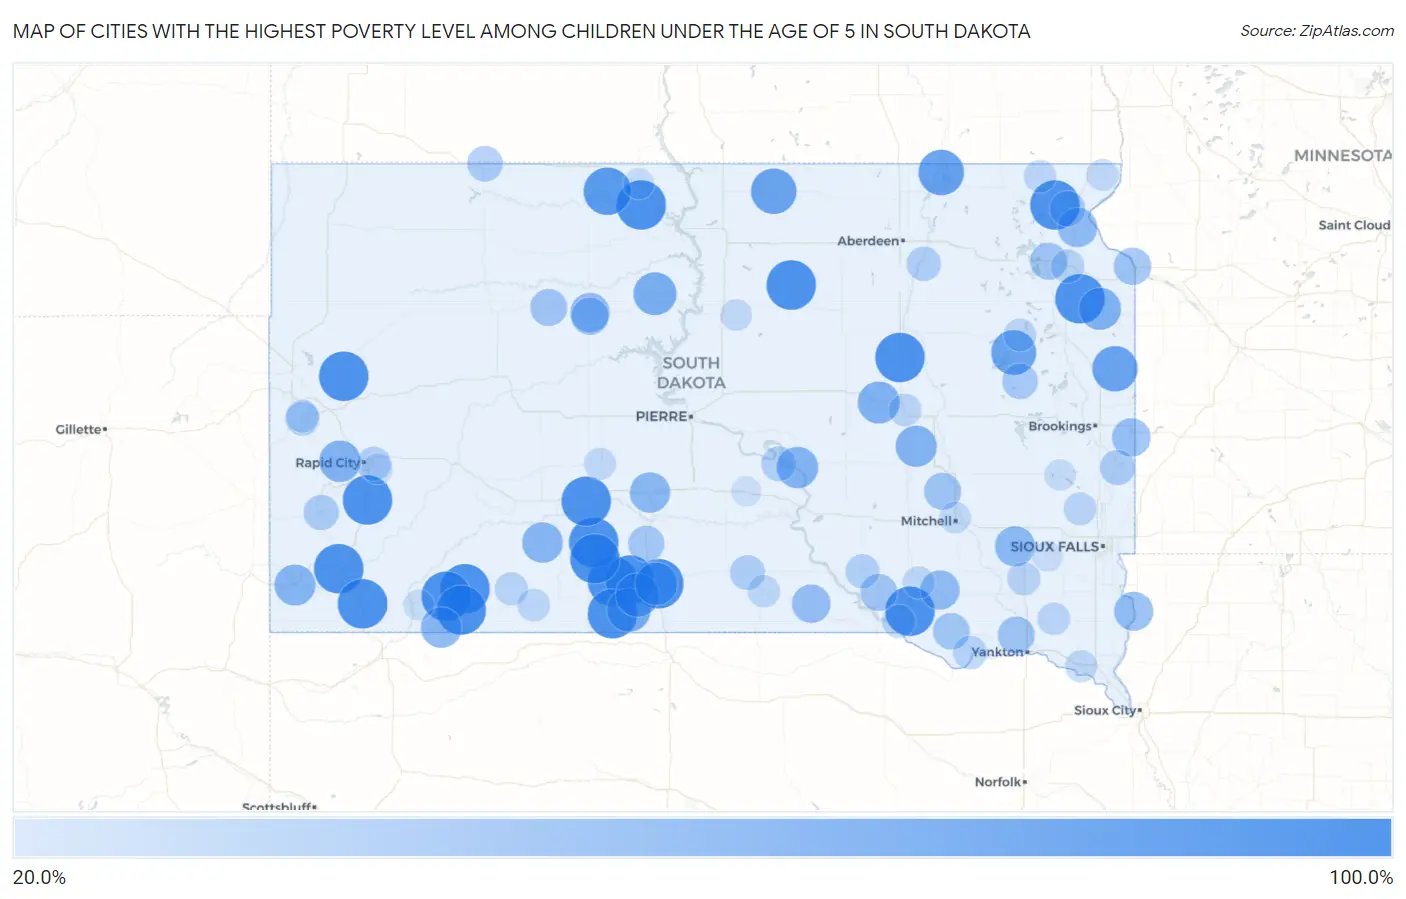
Map of Cities with the Highest Poverty Level Among Children Under the Age of 5 in South Dakota
0.0%
100.0%
Cities with the Highest Poverty Level Among Children Under the Age of 5 in South Dakota
| City | Child Poverty | vs State | vs National | |
| 1. | Hot Springs | 100.0% | 17.4%(+82.6)#1 | 18.1%(+81.9)#12 |
| 2. | Porcupine | 100.0% | 17.4%(+82.6)#2 | 18.1%(+81.9)#161 |
| 3. | Antelope | 100.0% | 17.4%(+82.6)#3 | 18.1%(+81.9)#239 |
| 4. | Manderson White Horse Creek | 100.0% | 17.4%(+82.6)#4 | 18.1%(+81.9)#261 |
| 5. | Parmelee | 100.0% | 17.4%(+82.6)#5 | 18.1%(+81.9)#346 |
| 6. | Wounded Knee | 100.0% | 17.4%(+82.6)#6 | 18.1%(+81.9)#384 |
| 7. | Long Hollow | 100.0% | 17.4%(+82.6)#7 | 18.1%(+81.9)#396 |
| 8. | Hermosa | 100.0% | 17.4%(+82.6)#8 | 18.1%(+81.9)#398 |
| 9. | Little Eagle | 100.0% | 17.4%(+82.6)#9 | 18.1%(+81.9)#405 |
| 10. | Enemy Swim | 100.0% | 17.4%(+82.6)#10 | 18.1%(+81.9)#447 |
| 11. | Soldier Creek | 100.0% | 17.4%(+82.6)#11 | 18.1%(+81.9)#467 |
| 12. | Wakpala | 100.0% | 17.4%(+82.6)#12 | 18.1%(+81.9)#520 |
| 13. | South Shore | 100.0% | 17.4%(+82.6)#13 | 18.1%(+81.9)#539 |
| 14. | Oelrichs | 100.0% | 17.4%(+82.6)#14 | 18.1%(+81.9)#559 |
| 15. | Horse Creek | 100.0% | 17.4%(+82.6)#15 | 18.1%(+81.9)#566 |
| 16. | Tulare | 100.0% | 17.4%(+82.6)#16 | 18.1%(+81.9)#590 |
| 17. | Corn Creek | 100.0% | 17.4%(+82.6)#17 | 18.1%(+81.9)#606 |
| 18. | Swift Bird | 100.0% | 17.4%(+82.6)#18 | 18.1%(+81.9)#610 |
| 19. | Kenel | 100.0% | 17.4%(+82.6)#19 | 18.1%(+81.9)#614 |
| 20. | Spring Creek | 100.0% | 17.4%(+82.6)#20 | 18.1%(+81.9)#639 |
| 21. | Norris | 100.0% | 17.4%(+82.6)#21 | 18.1%(+81.9)#651 |
| 22. | Peever Flats | 100.0% | 17.4%(+82.6)#22 | 18.1%(+81.9)#742 |
| 23. | Belvidere | 100.0% | 17.4%(+82.6)#23 | 18.1%(+81.9)#768 |
| 24. | Vale | 100.0% | 17.4%(+82.6)#24 | 18.1%(+81.9)#774 |
| 25. | Ravinia | 100.0% | 17.4%(+82.6)#25 | 18.1%(+81.9)#851 |
| 26. | Ideal | 100.0% | 17.4%(+82.6)#26 | 18.1%(+81.9)#865 |
| 27. | Onaka | 100.0% | 17.4%(+82.6)#27 | 18.1%(+81.9)#906 |
| 28. | Bullhead | 92.5% | 17.4%(+75.1)#28 | 18.1%(+74.4)#975 |
| 29. | Bridger | 84.6% | 17.4%(+67.2)#29 | 18.1%(+66.6)#1,170 |
| 30. | Hecla | 84.2% | 17.4%(+66.8)#30 | 18.1%(+66.1)#1,184 |
| 31. | Eureka | 83.9% | 17.4%(+66.4)#31 | 18.1%(+65.8)#1,193 |
| 32. | Brandt | 83.3% | 17.4%(+65.9)#32 | 18.1%(+65.3)#1,232 |
| 33. | Naples | 81.8% | 17.4%(+64.4)#33 | 18.1%(+63.8)#1,276 |
| 34. | St Francis | 76.5% | 17.4%(+59.0)#34 | 18.1%(+58.4)#1,467 |
| 35. | Rosebud | 76.3% | 17.4%(+58.9)#35 | 18.1%(+58.3)#1,471 |
| 36. | Clark Colony | 75.0% | 17.4%(+57.6)#36 | 18.1%(+56.9)#1,557 |
| 37. | La Plant | 73.7% | 17.4%(+56.2)#37 | 18.1%(+55.6)#1,605 |
| 38. | Mission | 72.0% | 17.4%(+54.5)#38 | 18.1%(+53.9)#1,675 |
| 39. | Wessington | 70.0% | 17.4%(+52.6)#39 | 18.1%(+51.9)#1,787 |
| 40. | Strandburg | 70.0% | 17.4%(+52.6)#40 | 18.1%(+51.9)#1,789 |
| 41. | Johnson Siding | 67.7% | 17.4%(+50.3)#41 | 18.1%(+49.7)#1,909 |
| 42. | Fort Thompson | 67.5% | 17.4%(+50.0)#42 | 18.1%(+49.4)#1,928 |
| 43. | Alpena | 66.7% | 17.4%(+49.2)#43 | 18.1%(+48.6)#1,990 |
| 44. | Edgemont | 66.0% | 17.4%(+48.5)#44 | 18.1%(+47.9)#2,055 |
| 45. | Pine Ridge | 64.7% | 17.4%(+47.2)#45 | 18.1%(+46.6)#2,145 |
| 46. | Wanblee | 64.2% | 17.4%(+46.7)#46 | 18.1%(+46.1)#2,174 |
| 47. | Murdo | 63.5% | 17.4%(+46.1)#47 | 18.1%(+45.5)#2,225 |
| 48. | Bridgewater | 62.5% | 17.4%(+45.1)#48 | 18.1%(+44.4)#2,302 |
| 49. | Peever | 59.4% | 17.4%(+41.9)#49 | 18.1%(+41.3)#2,580 |
| 50. | North Eagle Butte | 59.1% | 17.4%(+41.7)#50 | 18.1%(+41.1)#2,594 |
| 51. | Delmont | 59.1% | 17.4%(+41.6)#51 | 18.1%(+41.0)#2,602 |
| 52. | Hudson | 58.3% | 17.4%(+40.9)#52 | 18.1%(+40.3)#2,668 |
| 53. | Burke | 56.2% | 17.4%(+38.8)#53 | 18.1%(+38.2)#2,838 |
| 54. | Elkton | 55.8% | 17.4%(+38.3)#54 | 18.1%(+37.7)#2,885 |
| 55. | West Brule | 55.2% | 17.4%(+37.7)#55 | 18.1%(+37.1)#2,959 |
| 56. | Eagle Butte | 51.9% | 17.4%(+34.4)#56 | 18.1%(+33.8)#3,247 |
| 57. | Big Stone City | 51.6% | 17.4%(+34.2)#57 | 18.1%(+33.6)#3,271 |
| 58. | Dupree | 50.0% | 17.4%(+32.6)#58 | 18.1%(+31.9)#3,466 |
| 59. | Letcher | 50.0% | 17.4%(+32.6)#59 | 18.1%(+31.9)#3,548 |
| 60. | Geddes | 50.0% | 17.4%(+32.6)#60 | 18.1%(+31.9)#3,553 |
| 61. | Utica | 50.0% | 17.4%(+32.6)#61 | 18.1%(+31.9)#3,568 |
| 62. | Ortley | 50.0% | 17.4%(+32.6)#62 | 18.1%(+31.9)#3,573 |
| 63. | Avon | 48.7% | 17.4%(+31.3)#63 | 18.1%(+30.7)#3,673 |
| 64. | White River | 47.1% | 17.4%(+29.6)#64 | 18.1%(+29.0)#3,863 |
| 65. | Bryant | 45.4% | 17.4%(+27.9)#65 | 18.1%(+27.3)#4,106 |
| 66. | Lemmon | 44.7% | 17.4%(+27.3)#66 | 18.1%(+26.7)#4,178 |
| 67. | Sisseton | 44.3% | 17.4%(+26.9)#67 | 18.1%(+26.3)#4,249 |
| 68. | Custer | 43.2% | 17.4%(+25.7)#68 | 18.1%(+25.1)#4,406 |
| 69. | Flandreau | 42.5% | 17.4%(+25.1)#69 | 18.1%(+24.5)#4,514 |
| 70. | Winner | 41.7% | 17.4%(+24.2)#70 | 18.1%(+23.6)#4,625 |
| 71. | Lower Brule | 40.9% | 17.4%(+23.5)#71 | 18.1%(+22.8)#4,734 |
| 72. | Stratford | 40.0% | 17.4%(+22.6)#72 | 18.1%(+21.9)#4,925 |
| 73. | Rapid Valley | 39.5% | 17.4%(+22.1)#73 | 18.1%(+21.5)#4,980 |
| 74. | Platte | 38.9% | 17.4%(+21.5)#74 | 18.1%(+20.9)#5,074 |
| 75. | Lead | 38.0% | 17.4%(+20.6)#75 | 18.1%(+20.0)#5,218 |
| 76. | Springfield | 37.7% | 17.4%(+20.3)#76 | 18.1%(+19.7)#5,266 |
| 77. | Summit | 36.4% | 17.4%(+18.9)#77 | 18.1%(+18.3)#5,514 |
| 78. | Pickstown | 35.7% | 17.4%(+18.3)#78 | 18.1%(+17.7)#5,637 |
| 79. | Freeman | 35.2% | 17.4%(+17.7)#79 | 18.1%(+17.1)#5,748 |
| 80. | Allen | 34.9% | 17.4%(+17.4)#80 | 18.1%(+16.8)#5,799 |
| 81. | Colton | 34.0% | 17.4%(+16.6)#81 | 18.1%(+16.0)#5,946 |
| 82. | Wolsey | 33.3% | 17.4%(+15.9)#82 | 18.1%(+15.3)#6,081 |
| 83. | Irene | 33.3% | 17.4%(+15.9)#83 | 18.1%(+15.3)#6,102 |
| 84. | Henry | 33.3% | 17.4%(+15.9)#84 | 18.1%(+15.3)#6,147 |
| 85. | Central City | 33.3% | 17.4%(+15.9)#85 | 18.1%(+15.3)#6,174 |
| 86. | Martin | 33.0% | 17.4%(+15.5)#86 | 18.1%(+14.9)#6,226 |
| 87. | Veblen | 32.6% | 17.4%(+15.1)#87 | 18.1%(+14.5)#6,296 |
| 88. | Colome | 32.4% | 17.4%(+15.0)#88 | 18.1%(+14.4)#6,317 |
| 89. | Vermillion | 31.4% | 17.4%(+14.0)#89 | 18.1%(+13.4)#6,491 |
| 90. | Armour | 31.1% | 17.4%(+13.7)#90 | 18.1%(+13.1)#6,559 |
| 91. | Midland | 30.8% | 17.4%(+13.3)#91 | 18.1%(+12.7)#6,647 |
| 92. | Rosholt | 30.0% | 17.4%(+12.6)#92 | 18.1%(+11.9)#6,811 |
| 93. | Gettysburg | 29.9% | 17.4%(+12.4)#93 | 18.1%(+11.8)#6,854 |
| 94. | Mitchell | 29.6% | 17.4%(+12.2)#94 | 18.1%(+11.6)#6,899 |
| 95. | Madison | 27.9% | 17.4%(+10.4)#95 | 18.1%(+9.80)#7,338 |
| 96. | Green Valley | 26.7% | 17.4%(+9.23)#96 | 18.1%(+8.60)#7,641 |
| 97. | Mclaughlin | 26.6% | 17.4%(+9.12)#97 | 18.1%(+8.50)#7,682 |
| 98. | Oglala | 26.0% | 17.4%(+8.57)#98 | 18.1%(+7.95)#7,799 |
| 99. | Monroe | 25.0% | 17.4%(+7.56)#99 | 18.1%(+6.94)#8,097 |
| 100. | Kennebec | 23.8% | 17.4%(+6.37)#100 | 18.1%(+5.75)#8,401 |
Common Questions
What are the Top 10 Cities with the Highest Poverty Level Among Children Under the Age of 5 in South Dakota?
Top 10 Cities with the Highest Poverty Level Among Children Under the Age of 5 in South Dakota are:
#1
100.0%
#2
100.0%
#3
100.0%
#4
100.0%
#5
100.0%
#6
100.0%
#7
100.0%
#8
100.0%
#9
100.0%
#10
100.0%
What city has the Highest Poverty Level Among Children Under the Age of 5 in South Dakota?
Hot Springs has the Highest Poverty Level Among Children Under the Age of 5 in South Dakota with 100.0%.
What is the Poverty Level Among Children Under the Age of 5 in the State of South Dakota?
Poverty Level Among Children Under the Age of 5 in South Dakota is 17.4%.
What is the Poverty Level Among Children Under the Age of 5 in the United States?
Poverty Level Among Children Under the Age of 5 in the United States is 18.1%.