Whitewood, SD Map & Demographics
Whitewood Map
Whitewood Overview
$37,421
PER CAPITA INCOME
$80,156
AVG FAMILY INCOME
$70,000
AVG HOUSEHOLD INCOME
14.7%
WAGE / INCOME GAP [ % ]
85.3¢/ $1
WAGE / INCOME GAP [ $ ]
0.45
INEQUALITY / GINI INDEX
875
TOTAL POPULATION
435
MALE POPULATION
440
FEMALE POPULATION
98.86
MALES / 100 FEMALES
101.15
FEMALES / 100 MALES
47.2
MEDIAN AGE
3.1
AVG FAMILY SIZE
2.4
AVG HOUSEHOLD SIZE
562
LABOR FORCE [ PEOPLE ]
74.9%
PERCENT IN LABOR FORCE
6.6%
UNEMPLOYMENT RATE
Whitewood Zip Codes
Whitewood Area Codes
Income in Whitewood
Income Overview in Whitewood
Per Capita Income in Whitewood is $37,421, while median incomes of families and households are $80,156 and $70,000 respectively.
| Characteristic | Number | Measure |
| Per Capita Income | 875 | $37,421 |
| Median Family Income | 209 | $80,156 |
| Mean Family Income | 209 | $88,139 |
| Median Household Income | 354 | $70,000 |
| Mean Household Income | 354 | $87,721 |
| Income Deficit | 209 | $0 |
| Wage / Income Gap (%) | 875 | 14.71% |
| Wage / Income Gap ($) | 875 | 85.29¢ per $1 |
| Gini / Inequality Index | 875 | 0.45 |
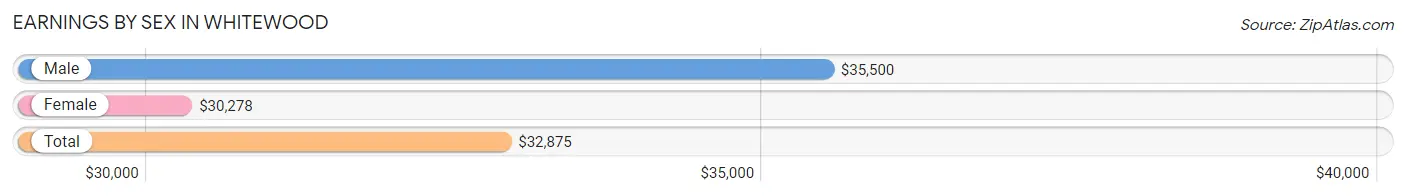
Earnings by Sex in Whitewood
Average Earnings in Whitewood are $32,875, $35,500 for men and $30,278 for women, a difference of 14.7%.
| Sex | Number | Average Earnings |
| Male | 276 (48.2%) | $35,500 |
| Female | 296 (51.7%) | $30,278 |
| Total | 572 (100.0%) | $32,875 |
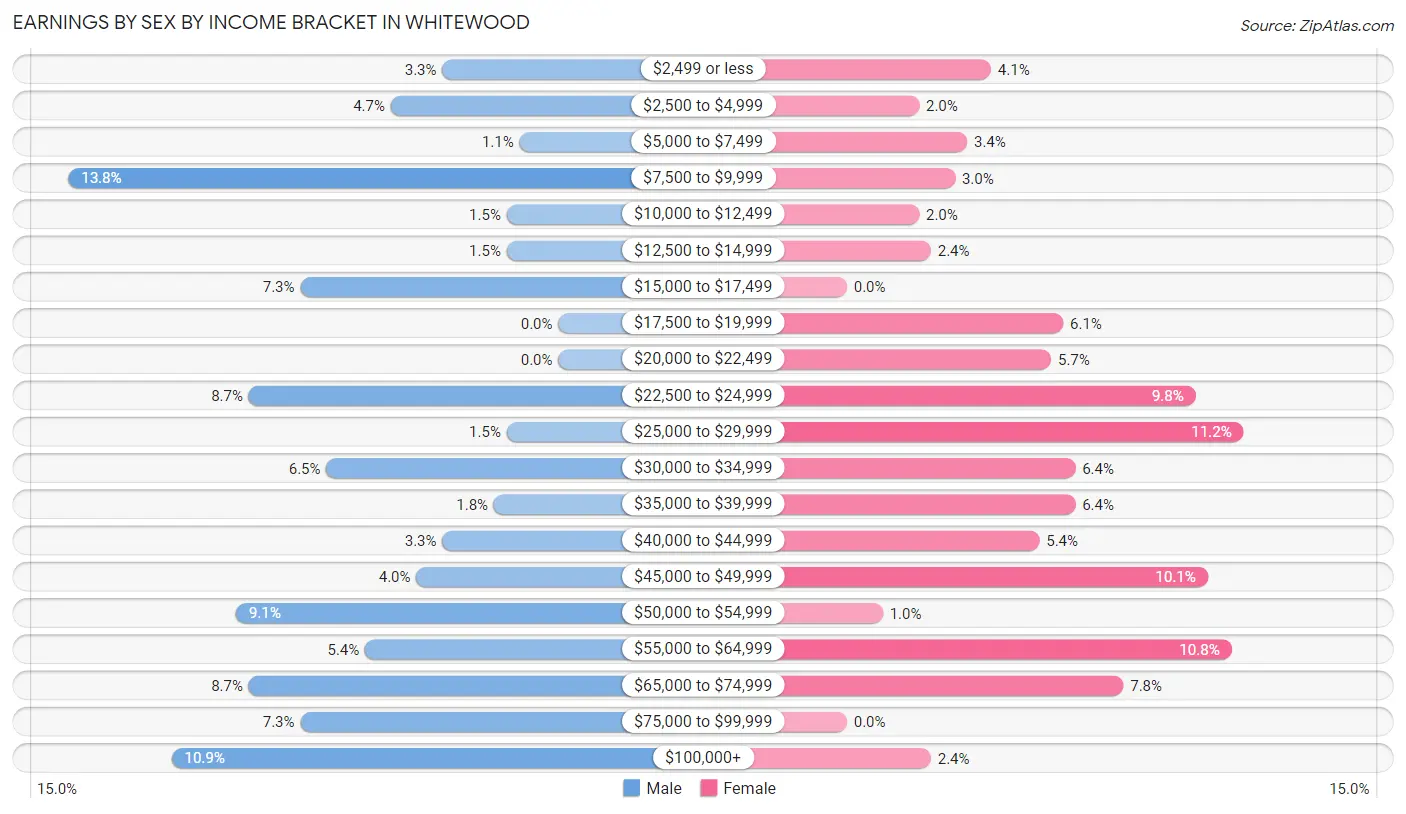
Earnings by Sex by Income Bracket in Whitewood
The most common earnings brackets in Whitewood are $7,500 to $9,999 for men (38 | 13.8%) and $25,000 to $29,999 for women (33 | 11.2%).
| Income | Male | Female |
| $2,499 or less | 9 (3.3%) | 12 (4.1%) |
| $2,500 to $4,999 | 13 (4.7%) | 6 (2.0%) |
| $5,000 to $7,499 | 3 (1.1%) | 10 (3.4%) |
| $7,500 to $9,999 | 38 (13.8%) | 9 (3.0%) |
| $10,000 to $12,499 | 4 (1.5%) | 6 (2.0%) |
| $12,500 to $14,999 | 4 (1.5%) | 7 (2.4%) |
| $15,000 to $17,499 | 20 (7.2%) | 0 (0.0%) |
| $17,500 to $19,999 | 0 (0.0%) | 18 (6.1%) |
| $20,000 to $22,499 | 0 (0.0%) | 17 (5.7%) |
| $22,500 to $24,999 | 24 (8.7%) | 29 (9.8%) |
| $25,000 to $29,999 | 4 (1.5%) | 33 (11.2%) |
| $30,000 to $34,999 | 18 (6.5%) | 19 (6.4%) |
| $35,000 to $39,999 | 5 (1.8%) | 19 (6.4%) |
| $40,000 to $44,999 | 9 (3.3%) | 16 (5.4%) |
| $45,000 to $49,999 | 11 (4.0%) | 30 (10.1%) |
| $50,000 to $54,999 | 25 (9.1%) | 3 (1.0%) |
| $55,000 to $64,999 | 15 (5.4%) | 32 (10.8%) |
| $65,000 to $74,999 | 24 (8.7%) | 23 (7.8%) |
| $75,000 to $99,999 | 20 (7.2%) | 0 (0.0%) |
| $100,000+ | 30 (10.9%) | 7 (2.4%) |
| Total | 276 (100.0%) | 296 (100.0%) |
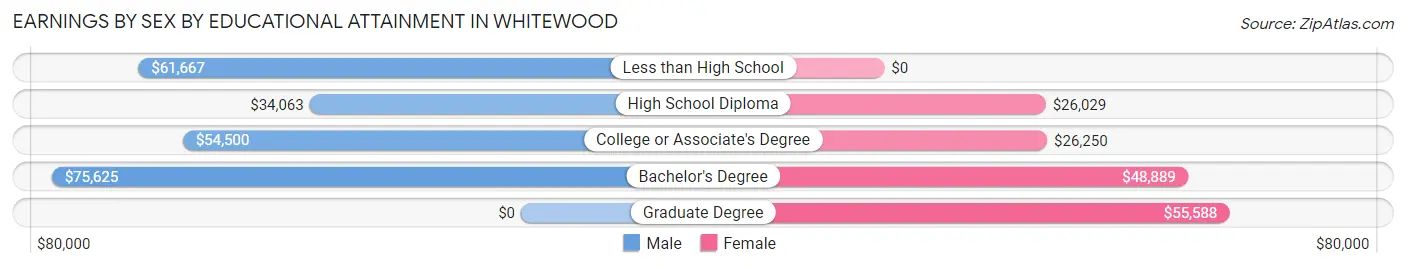
Earnings by Sex by Educational Attainment in Whitewood
Average earnings in Whitewood are $51,125 for men and $32,625 for women, a difference of 36.2%. Men with an educational attainment of bachelor's degree enjoy the highest average annual earnings of $75,625, while those with high school diploma education earn the least with $34,063. Women with an educational attainment of graduate degree earn the most with the average annual earnings of $55,588, while those with high school diploma education have the smallest earnings of $26,029.
| Educational Attainment | Male Income | Female Income |
| Less than High School | $61,667 | $0 |
| High School Diploma | $34,063 | $26,029 |
| College or Associate's Degree | $54,500 | $26,250 |
| Bachelor's Degree | $75,625 | $48,889 |
| Graduate Degree | - | - |
| Total | $51,125 | $32,625 |
Family Income in Whitewood
Family Income Brackets in Whitewood
According to the Whitewood family income data, there are 67 families falling into the $100,000 to $149,999 income range, which is the most common income bracket and makes up 32.1% of all families. Conversely, the less than $10,000 income bracket is the least frequent group with only 1 families (0.5%) belonging to this category.
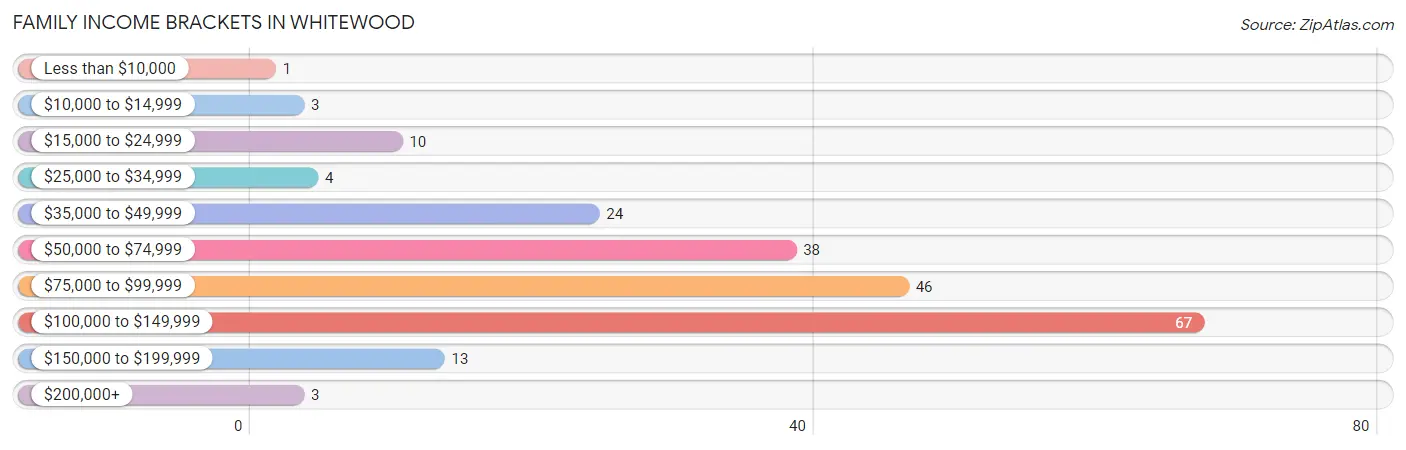
| Income Bracket | # Families | % Families |
| Less than $10,000 | 1 | 0.5% |
| $10,000 to $14,999 | 3 | 1.4% |
| $15,000 to $24,999 | 10 | 4.8% |
| $25,000 to $34,999 | 4 | 1.9% |
| $35,000 to $49,999 | 24 | 11.5% |
| $50,000 to $74,999 | 38 | 18.2% |
| $75,000 to $99,999 | 46 | 22.0% |
| $100,000 to $149,999 | 67 | 32.1% |
| $150,000 to $199,999 | 13 | 6.2% |
| $200,000+ | 3 | 1.4% |
Family Income by Famaliy Size in Whitewood
4-person families (36 | 17.2%) account for the highest median family income in Whitewood with $125,500 per family, while 2-person families (124 | 59.3%) have the highest median income of $37,812 per family member.
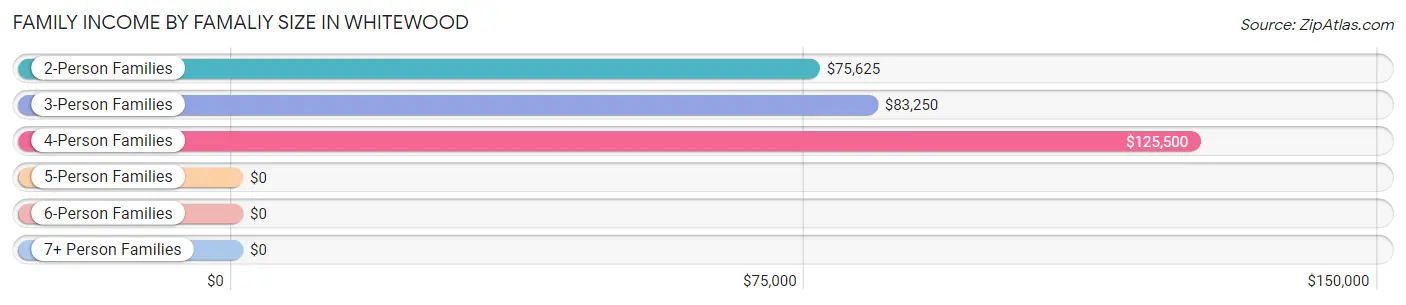
| Income Bracket | # Families | Median Income |
| 2-Person Families | 124 (59.3%) | $75,625 |
| 3-Person Families | 29 (13.9%) | $83,250 |
| 4-Person Families | 36 (17.2%) | $125,500 |
| 5-Person Families | 12 (5.7%) | $0 |
| 6-Person Families | 7 (3.4%) | $0 |
| 7+ Person Families | 1 (0.5%) | $0 |
| Total | 209 (100.0%) | $80,156 |
Family Income by Number of Earners in Whitewood
The median family income in Whitewood is $80,156, with families comprising 3+ earners (30) having the highest median family income of $136,250, while families with 1 earner (38) have the lowest median family income of $45,625, accounting for 14.3% and 18.2% of families, respectively.
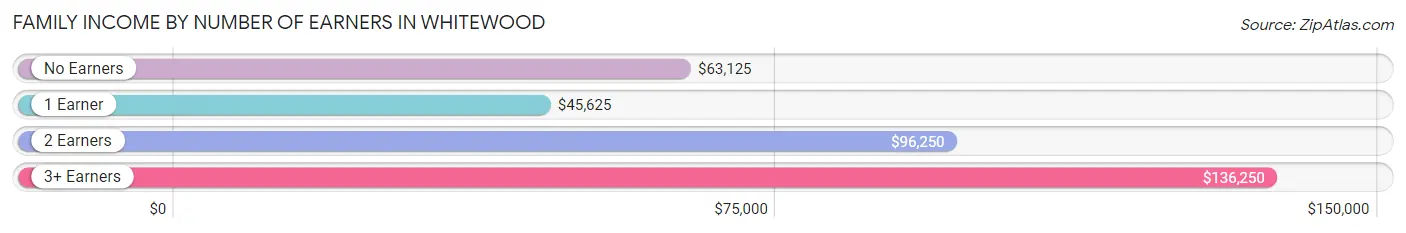
| Number of Earners | # Families | Median Income |
| No Earners | 13 (6.2%) | $63,125 |
| 1 Earner | 38 (18.2%) | $45,625 |
| 2 Earners | 128 (61.2%) | $96,250 |
| 3+ Earners | 30 (14.3%) | $136,250 |
| Total | 209 (100.0%) | $80,156 |
Household Income in Whitewood
Household Income Brackets in Whitewood
With 72 households falling in the category, the $100,000 to $149,999 income range is the most frequent in Whitewood, accounting for 20.3% of all households. In contrast, only 10 households (2.8%) fall into the $200,000+ income bracket, making it the least populous group.
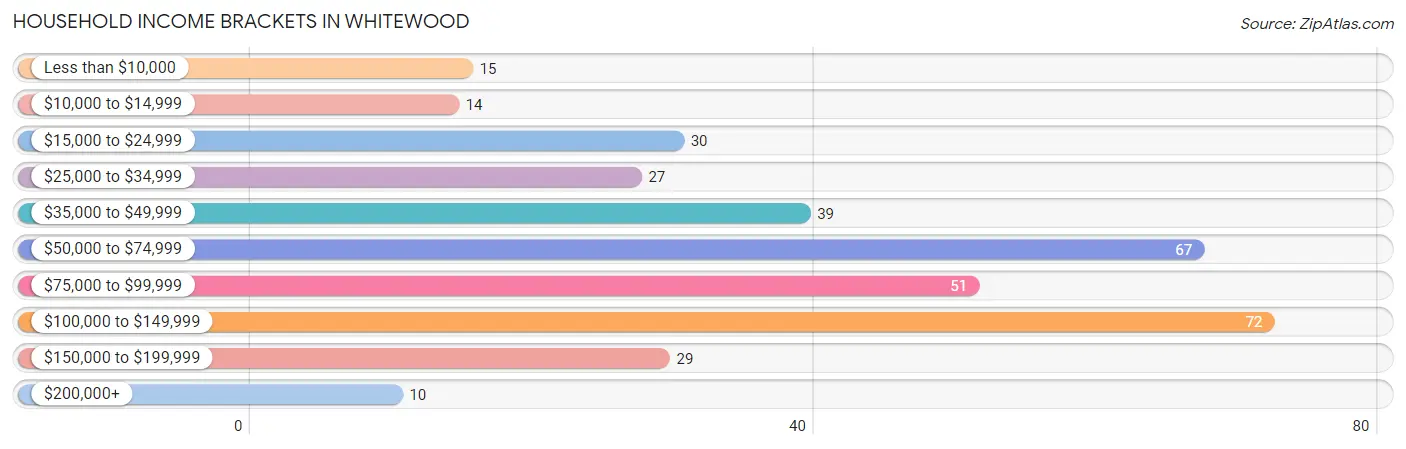
| Income Bracket | # Households | % Households |
| Less than $10,000 | 15 | 4.2% |
| $10,000 to $14,999 | 14 | 4.0% |
| $15,000 to $24,999 | 30 | 8.5% |
| $25,000 to $34,999 | 27 | 7.6% |
| $35,000 to $49,999 | 39 | 11.0% |
| $50,000 to $74,999 | 67 | 18.9% |
| $75,000 to $99,999 | 51 | 14.4% |
| $100,000 to $149,999 | 72 | 20.3% |
| $150,000 to $199,999 | 29 | 8.2% |
| $200,000+ | 10 | 2.8% |
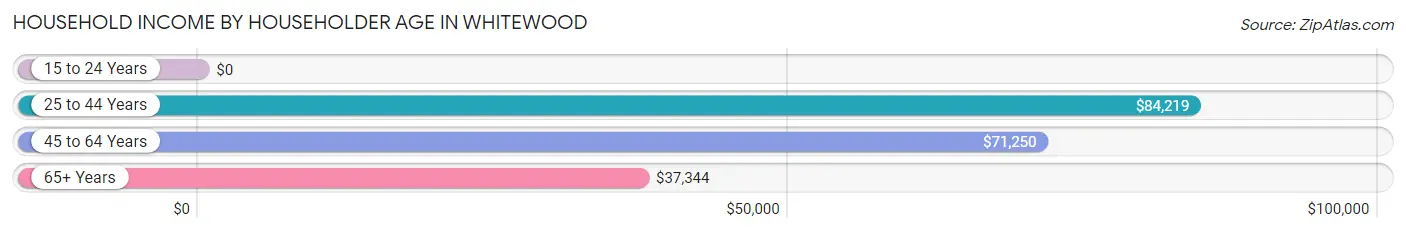
Household Income by Householder Age in Whitewood
The median household income in Whitewood is $70,000, with the highest median household income of $84,219 found in the 25 to 44 years age bracket for the primary householder. A total of 67 households (18.9%) fall into this category. Meanwhile, the 15 to 24 years age bracket for the primary householder has the lowest median household income of $0, with 3 households (0.9%) in this group.
| Income Bracket | # Households | Median Income |
| 15 to 24 Years | 3 (0.9%) | $0 |
| 25 to 44 Years | 67 (18.9%) | $84,219 |
| 45 to 64 Years | 221 (62.4%) | $71,250 |
| 65+ Years | 63 (17.8%) | $37,344 |
| Total | 354 (100.0%) | $70,000 |
Poverty in Whitewood
Income Below Poverty by Sex and Age in Whitewood
With 8.4% poverty level for males and 9.1% for females among the residents of Whitewood, under 5 year old males and 12 to 14 year old females are the most vulnerable to poverty, with 5 males (27.8%) and 4 females (44.4%) in their respective age groups living below the poverty level.
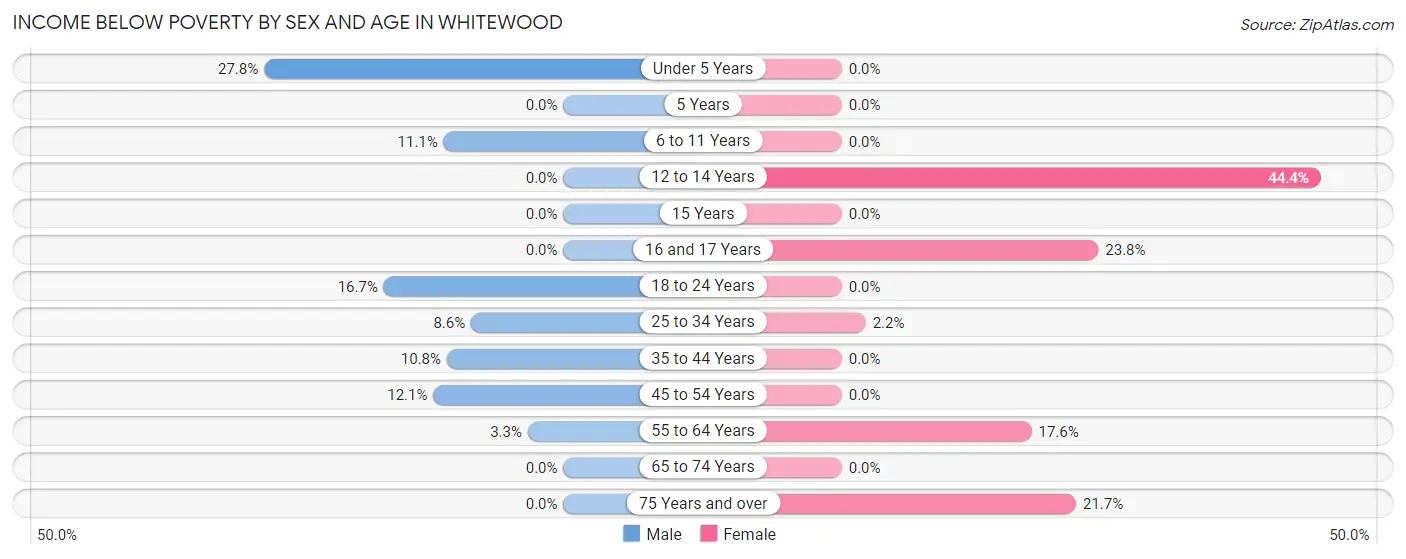
| Age Bracket | Male | Female |
| Under 5 Years | 5 (27.8%) | 0 (0.0%) |
| 5 Years | 0 (0.0%) | 0 (0.0%) |
| 6 to 11 Years | 2 (11.1%) | 0 (0.0%) |
| 12 to 14 Years | 0 (0.0%) | 4 (44.4%) |
| 15 Years | 0 (0.0%) | 0 (0.0%) |
| 16 and 17 Years | 0 (0.0%) | 5 (23.8%) |
| 18 to 24 Years | 8 (16.7%) | 0 (0.0%) |
| 25 to 34 Years | 3 (8.6%) | 1 (2.2%) |
| 35 to 44 Years | 8 (10.8%) | 0 (0.0%) |
| 45 to 54 Years | 7 (12.1%) | 0 (0.0%) |
| 55 to 64 Years | 3 (3.3%) | 25 (17.6%) |
| 65 to 74 Years | 0 (0.0%) | 0 (0.0%) |
| 75 Years and over | 0 (0.0%) | 5 (21.7%) |
| Total | 36 (8.4%) | 40 (9.1%) |
Income Above Poverty by Sex and Age in Whitewood
According to the poverty statistics in Whitewood, males aged 5 years and females aged under 5 years are the age groups that are most secure financially, with 100.0% of males and 100.0% of females in these age groups living above the poverty line.
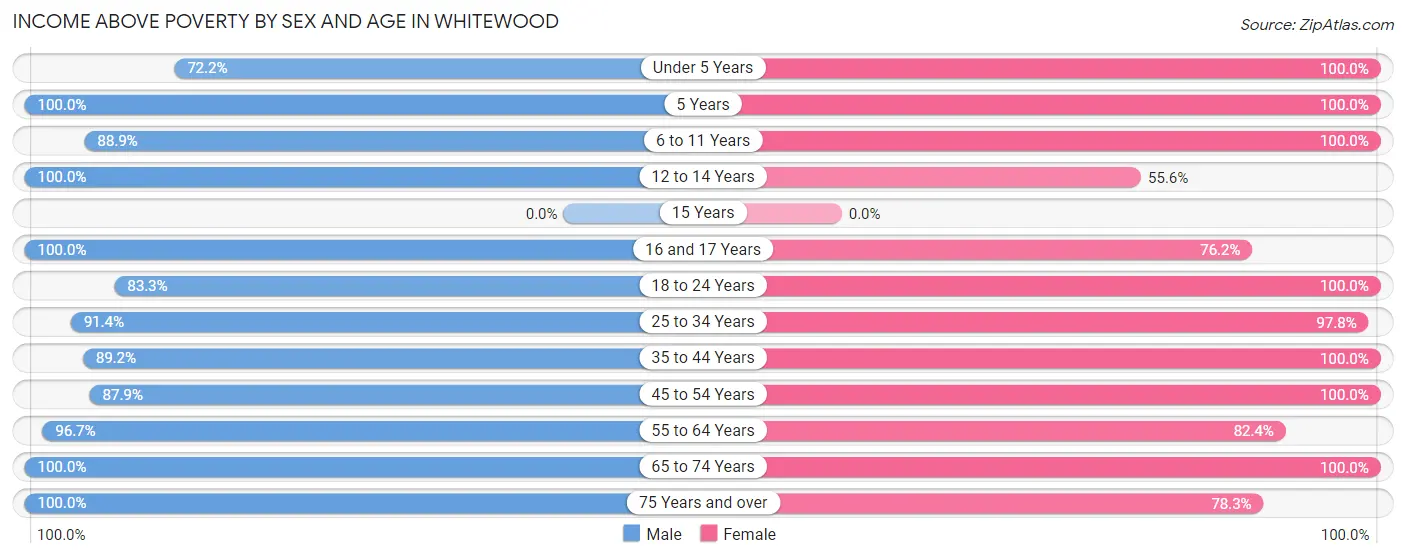
| Age Bracket | Male | Female |
| Under 5 Years | 13 (72.2%) | 14 (100.0%) |
| 5 Years | 13 (100.0%) | 8 (100.0%) |
| 6 to 11 Years | 16 (88.9%) | 26 (100.0%) |
| 12 to 14 Years | 14 (100.0%) | 5 (55.6%) |
| 15 Years | 0 (0.0%) | 0 (0.0%) |
| 16 and 17 Years | 21 (100.0%) | 16 (76.2%) |
| 18 to 24 Years | 40 (83.3%) | 5 (100.0%) |
| 25 to 34 Years | 32 (91.4%) | 44 (97.8%) |
| 35 to 44 Years | 66 (89.2%) | 32 (100.0%) |
| 45 to 54 Years | 51 (87.9%) | 82 (100.0%) |
| 55 to 64 Years | 88 (96.7%) | 117 (82.4%) |
| 65 to 74 Years | 27 (100.0%) | 33 (100.0%) |
| 75 Years and over | 13 (100.0%) | 18 (78.3%) |
| Total | 394 (91.6%) | 400 (90.9%) |
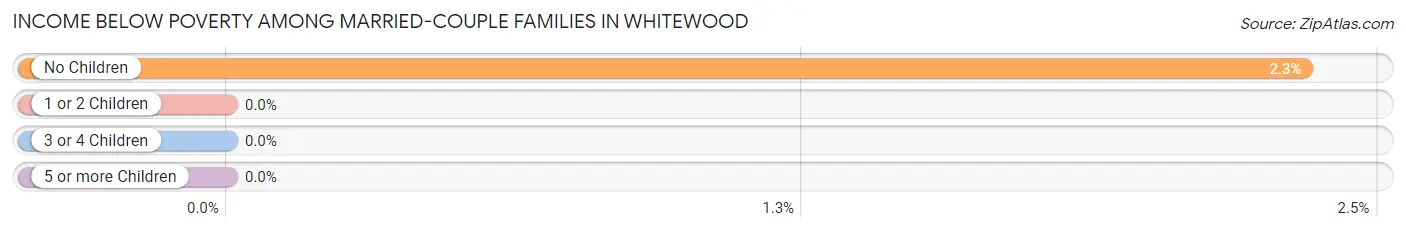
Income Below Poverty Among Married-Couple Families in Whitewood
The poverty statistics for married-couple families in Whitewood show that 1.7% or 3 of the total 176 families live below the poverty line. Families with no children have the highest poverty rate of 2.3%, comprising of 3 families. On the other hand, families with 1 or 2 children have the lowest poverty rate of 0.0%, which includes 0 families.
| Children | Above Poverty | Below Poverty |
| No Children | 125 (97.7%) | 3 (2.3%) |
| 1 or 2 Children | 33 (100.0%) | 0 (0.0%) |
| 3 or 4 Children | 14 (100.0%) | 0 (0.0%) |
| 5 or more Children | 1 (100.0%) | 0 (0.0%) |
| Total | 173 (98.3%) | 3 (1.7%) |
Income Below Poverty Among Single-Parent Households in Whitewood
According to the poverty data in Whitewood, 100.0% or 6 single-father households and 3.7% or 1 single-mother households are living below the poverty line. Among single-father households, those with 1 or 2 children have the highest poverty rate, with 6 households (100.0%) experiencing poverty. Likewise, among single-mother households, those with 1 or 2 children have the highest poverty rate, with 1 households (6.2%) falling below the poverty line.
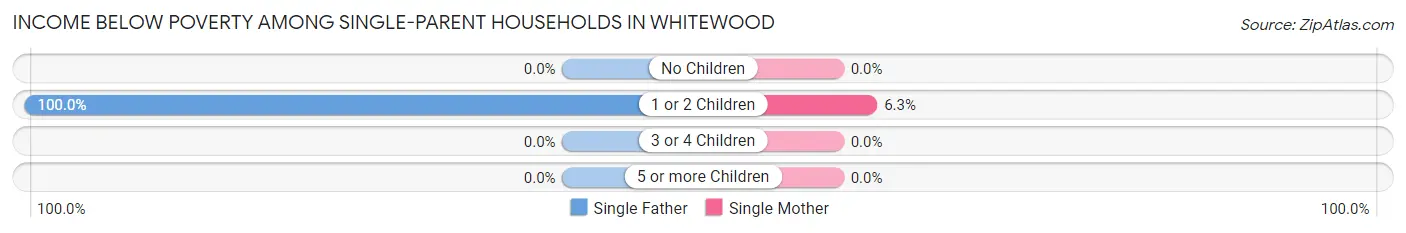
| Children | Single Father | Single Mother |
| No Children | 0 (0.0%) | 0 (0.0%) |
| 1 or 2 Children | 6 (100.0%) | 1 (6.2%) |
| 3 or 4 Children | 0 (0.0%) | 0 (0.0%) |
| 5 or more Children | 0 (0.0%) | 0 (0.0%) |
| Total | 6 (100.0%) | 1 (3.7%) |
Income Below Poverty Among Married-Couple vs Single-Parent Households in Whitewood
The poverty data for Whitewood shows that 3 of the married-couple family households (1.7%) and 7 of the single-parent households (21.2%) are living below the poverty level. Within the married-couple family households, those with no children have the highest poverty rate, with 3 households (2.3%) falling below the poverty line. Among the single-parent households, those with 1 or 2 children have the highest poverty rate, with 7 household (31.8%) living below poverty.
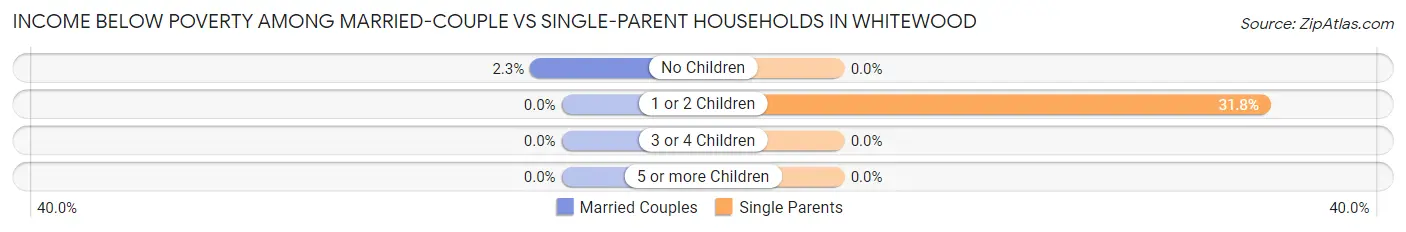
| Children | Married-Couple Families | Single-Parent Households |
| No Children | 3 (2.3%) | 0 (0.0%) |
| 1 or 2 Children | 0 (0.0%) | 7 (31.8%) |
| 3 or 4 Children | 0 (0.0%) | 0 (0.0%) |
| 5 or more Children | 0 (0.0%) | 0 (0.0%) |
| Total | 3 (1.7%) | 7 (21.2%) |
Race in Whitewood
The most populous races in Whitewood are White / Caucasian (823 | 94.1%), Hispanic or Latino (48 | 5.5%), and Two or more Races (40 | 4.6%).
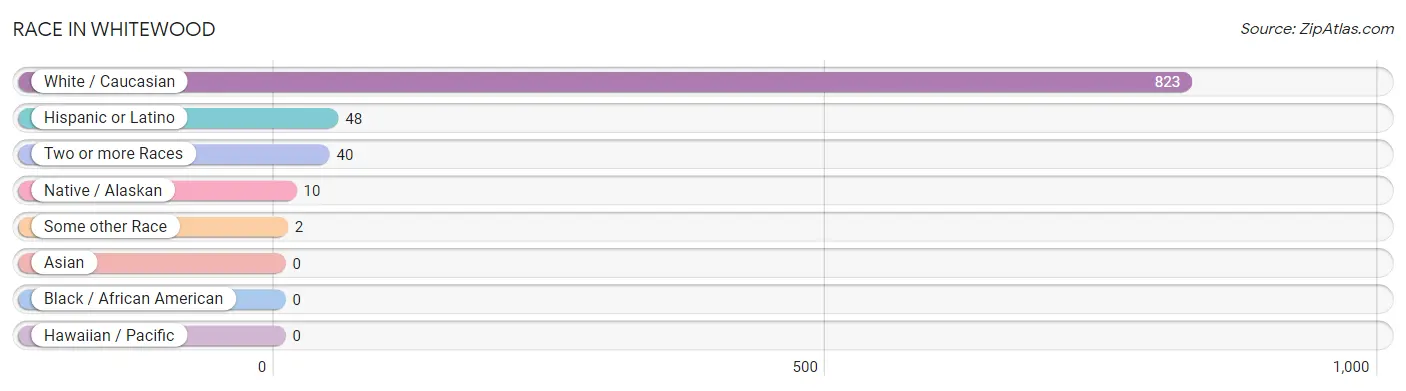
| Race | # Population | % Population |
| Asian | 0 | 0.0% |
| Black / African American | 0 | 0.0% |
| Hawaiian / Pacific | 0 | 0.0% |
| Hispanic or Latino | 48 | 5.5% |
| Native / Alaskan | 10 | 1.1% |
| White / Caucasian | 823 | 94.1% |
| Two or more Races | 40 | 4.6% |
| Some other Race | 2 | 0.2% |
| Total | 875 | 100.0% |
Ancestry in Whitewood
The most populous ancestries reported in Whitewood are German (280 | 32.0%), Irish (148 | 16.9%), English (86 | 9.8%), Norwegian (78 | 8.9%), and American (77 | 8.8%), together accounting for 76.4% of all Whitewood residents.
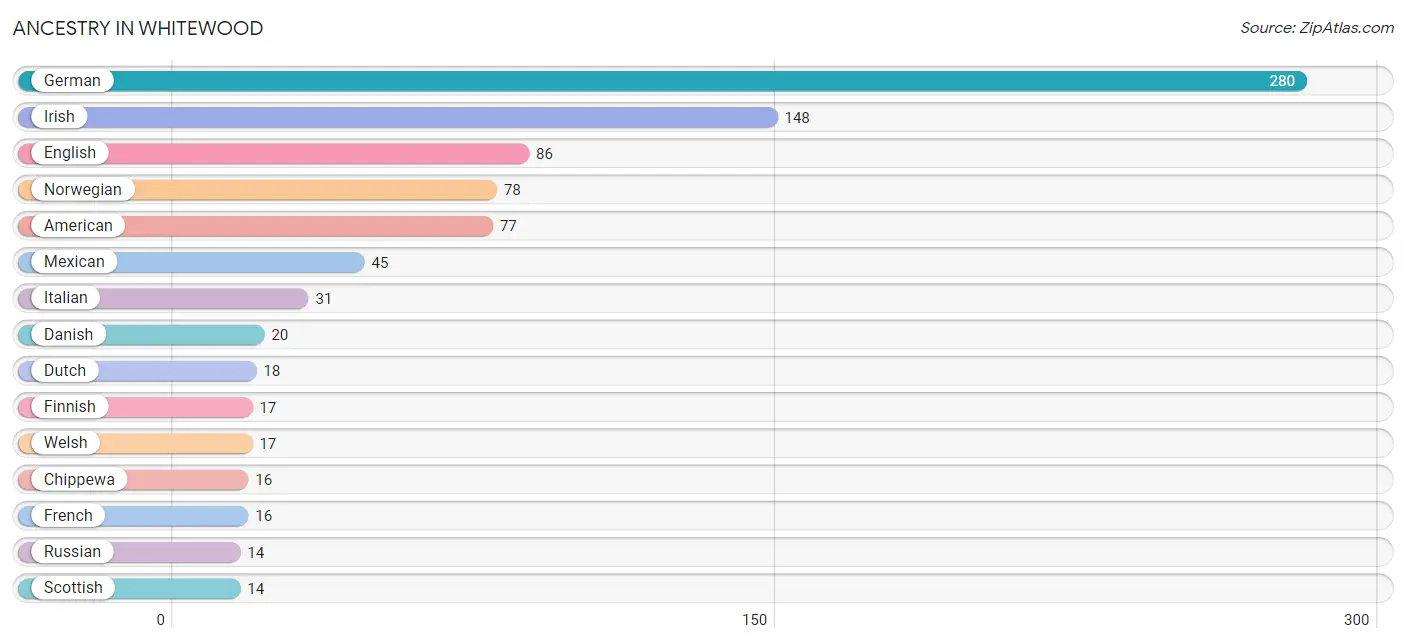
| Ancestry | # Population | % Population |
| American | 77 | 8.8% |
| Belgian | 1 | 0.1% |
| Central American | 2 | 0.2% |
| Cherokee | 2 | 0.2% |
| Chippewa | 16 | 1.8% |
| Czech | 3 | 0.3% |
| Danish | 20 | 2.3% |
| Dutch | 18 | 2.1% |
| Eastern European | 2 | 0.2% |
| English | 86 | 9.8% |
| European | 1 | 0.1% |
| Finnish | 17 | 1.9% |
| French | 16 | 1.8% |
| French Canadian | 7 | 0.8% |
| German | 280 | 32.0% |
| Honduran | 2 | 0.2% |
| Irish | 148 | 16.9% |
| Italian | 31 | 3.5% |
| Mexican | 45 | 5.1% |
| Norwegian | 78 | 8.9% |
| Pennsylvania German | 1 | 0.1% |
| Polish | 8 | 0.9% |
| Russian | 14 | 1.6% |
| Scottish | 14 | 1.6% |
| Sioux | 14 | 1.6% |
| Slovene | 10 | 1.1% |
| Spanish | 1 | 0.1% |
| Swedish | 12 | 1.4% |
| Swiss | 8 | 0.9% |
| Ukrainian | 5 | 0.6% |
| Welsh | 17 | 1.9% | View All 31 Rows |
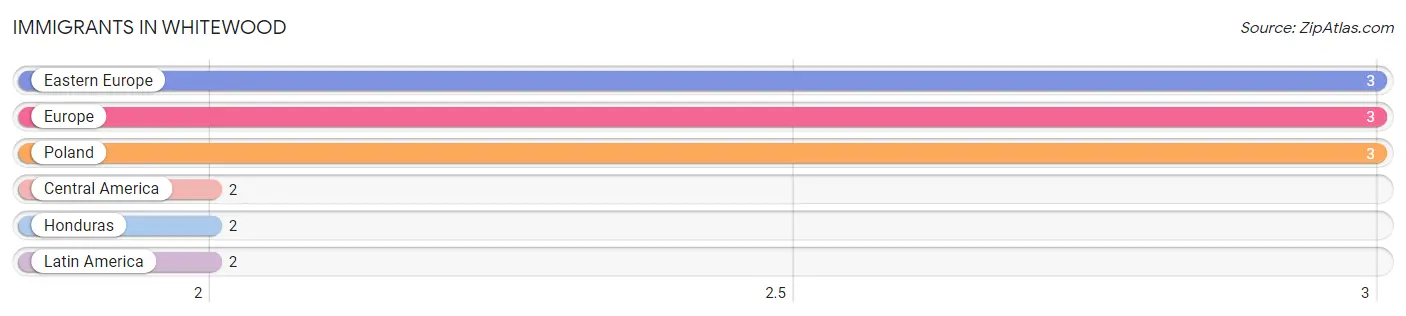
Immigrants in Whitewood
The most numerous immigrant groups reported in Whitewood came from Eastern Europe (3 | 0.3%), Europe (3 | 0.3%), Poland (3 | 0.3%), Central America (2 | 0.2%), and Honduras (2 | 0.2%), together accounting for 1.5% of all Whitewood residents.
| Immigration Origin | # Population | % Population |
| Central America | 2 | 0.2% |
| Eastern Europe | 3 | 0.3% |
| Europe | 3 | 0.3% |
| Honduras | 2 | 0.2% |
| Latin America | 2 | 0.2% |
| Poland | 3 | 0.3% | View All 6 Rows |
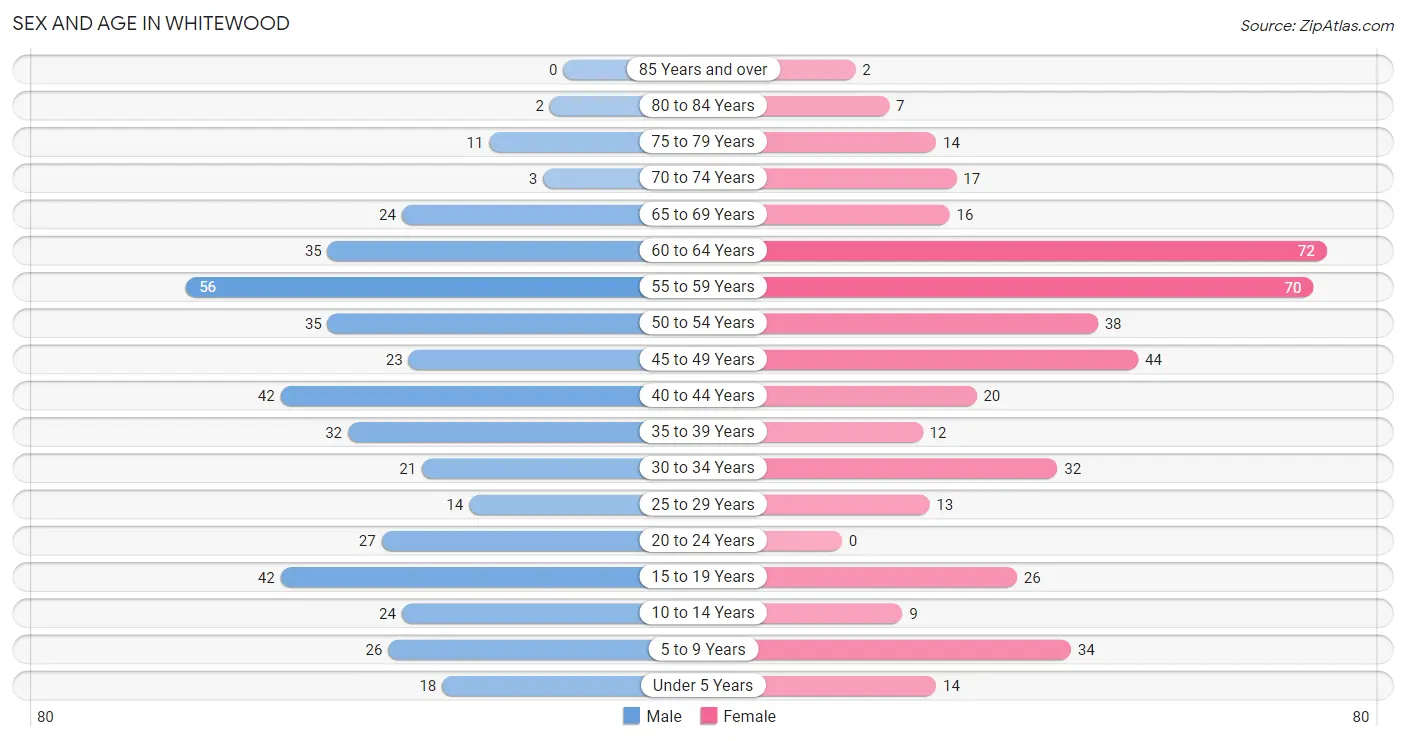
Sex and Age in Whitewood
Sex and Age in Whitewood
The most populous age groups in Whitewood are 55 to 59 Years (56 | 12.9%) for men and 60 to 64 Years (72 | 16.4%) for women.
| Age Bracket | Male | Female |
| Under 5 Years | 18 (4.1%) | 14 (3.2%) |
| 5 to 9 Years | 26 (6.0%) | 34 (7.7%) |
| 10 to 14 Years | 24 (5.5%) | 9 (2.1%) |
| 15 to 19 Years | 42 (9.7%) | 26 (5.9%) |
| 20 to 24 Years | 27 (6.2%) | 0 (0.0%) |
| 25 to 29 Years | 14 (3.2%) | 13 (2.9%) |
| 30 to 34 Years | 21 (4.8%) | 32 (7.3%) |
| 35 to 39 Years | 32 (7.4%) | 12 (2.7%) |
| 40 to 44 Years | 42 (9.7%) | 20 (4.5%) |
| 45 to 49 Years | 23 (5.3%) | 44 (10.0%) |
| 50 to 54 Years | 35 (8.1%) | 38 (8.6%) |
| 55 to 59 Years | 56 (12.9%) | 70 (15.9%) |
| 60 to 64 Years | 35 (8.1%) | 72 (16.4%) |
| 65 to 69 Years | 24 (5.5%) | 16 (3.6%) |
| 70 to 74 Years | 3 (0.7%) | 17 (3.9%) |
| 75 to 79 Years | 11 (2.5%) | 14 (3.2%) |
| 80 to 84 Years | 2 (0.5%) | 7 (1.6%) |
| 85 Years and over | 0 (0.0%) | 2 (0.4%) |
| Total | 435 (100.0%) | 440 (100.0%) |
Families and Households in Whitewood
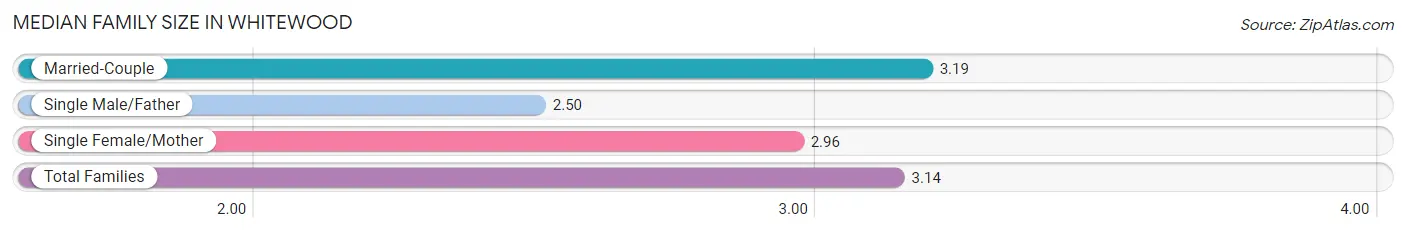
Median Family Size in Whitewood
The median family size in Whitewood is 3.14 persons per family, with married-couple families (176 | 84.2%) accounting for the largest median family size of 3.19 persons per family. On the other hand, single male/father families (6 | 2.9%) represent the smallest median family size with 2.50 persons per family.
| Family Type | # Families | Family Size |
| Married-Couple | 176 (84.2%) | 3.19 |
| Single Male/Father | 6 (2.9%) | 2.50 |
| Single Female/Mother | 27 (12.9%) | 2.96 |
| Total Families | 209 (100.0%) | 3.14 |
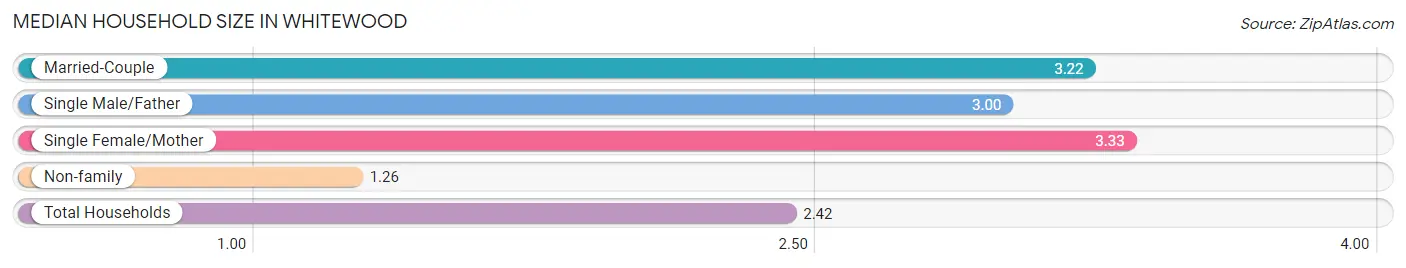
Median Household Size in Whitewood
The median household size in Whitewood is 2.42 persons per household, with single female/mother households (27 | 7.6%) accounting for the largest median household size of 3.33 persons per household. non-family households (145 | 41.0%) represent the smallest median household size with 1.26 persons per household.
| Household Type | # Households | Household Size |
| Married-Couple | 176 (49.7%) | 3.22 |
| Single Male/Father | 6 (1.7%) | 3.00 |
| Single Female/Mother | 27 (7.6%) | 3.33 |
| Non-family | 145 (41.0%) | 1.26 |
| Total Households | 354 (100.0%) | 2.42 |
Household Size by Marriage Status in Whitewood
Out of a total of 354 households in Whitewood, 209 (59.0%) are family households, while 145 (41.0%) are nonfamily households. The most numerous type of family households are 2-person households, comprising 115, and the most common type of nonfamily households are 1-person households, comprising 113.
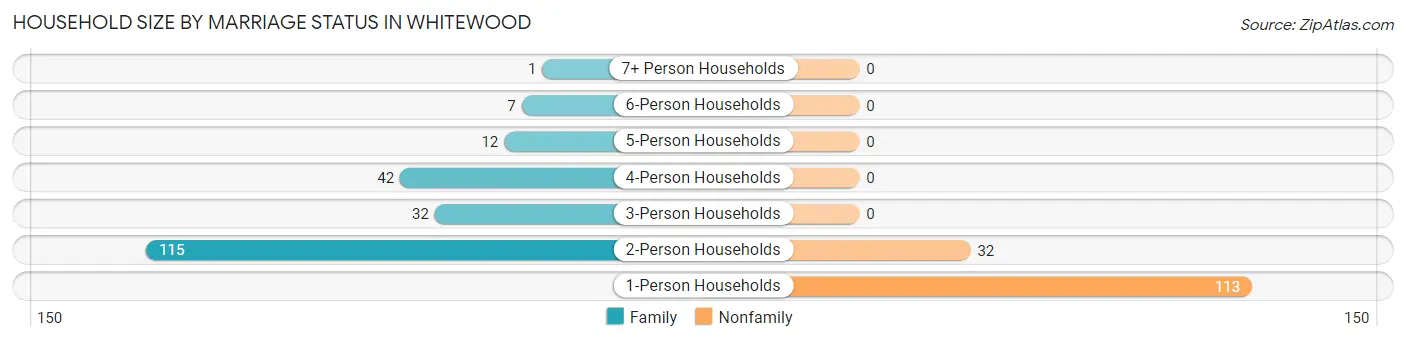
| Household Size | Family Households | Nonfamily Households |
| 1-Person Households | - | 113 (31.9%) |
| 2-Person Households | 115 (32.5%) | 32 (9.0%) |
| 3-Person Households | 32 (9.0%) | 0 (0.0%) |
| 4-Person Households | 42 (11.9%) | 0 (0.0%) |
| 5-Person Households | 12 (3.4%) | 0 (0.0%) |
| 6-Person Households | 7 (2.0%) | 0 (0.0%) |
| 7+ Person Households | 1 (0.3%) | 0 (0.0%) |
| Total | 209 (59.0%) | 145 (41.0%) |
Female Fertility in Whitewood
Fertility by Age in Whitewood
Average fertility rate in Whitewood is 48.0 births per 1,000 women. Women in the age bracket of 20 to 34 years have the highest fertility rate with 89.0 births per 1,000 women. Women in the age bracket of 20 to 34 years acount for 57.1% of all women with births.
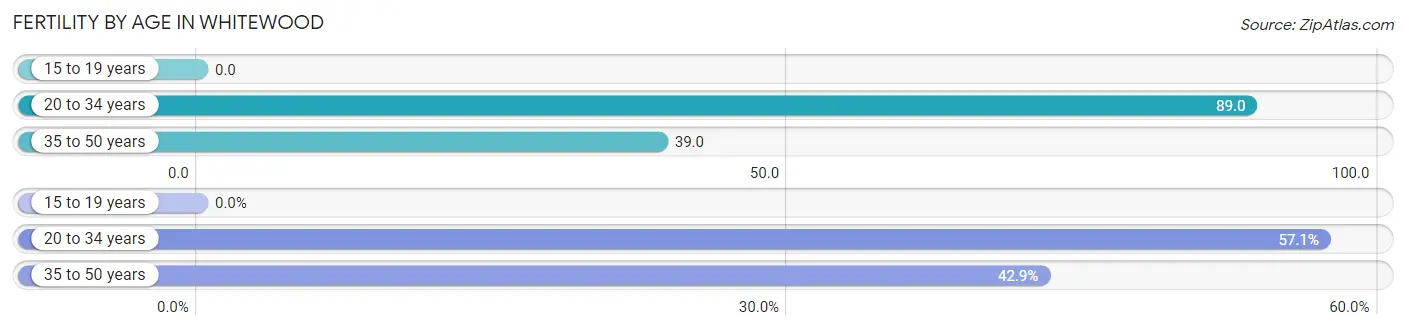
| Age Bracket | Women with Births | Births / 1,000 Women |
| 15 to 19 years | 0 (0.0%) | 0.0 |
| 20 to 34 years | 4 (57.1%) | 89.0 |
| 35 to 50 years | 3 (42.9%) | 39.0 |
| Total | 7 (100.0%) | 48.0 |
Fertility by Age by Marriage Status in Whitewood
42.9% of women with births (7) in Whitewood are married. The highest percentage of unmarried women with births falls into 35 to 50 years age bracket with 100.0% of them unmarried at the time of birth, while the lowest percentage of unmarried women with births belong to 20 to 34 years age bracket with 25.0% of them unmarried.
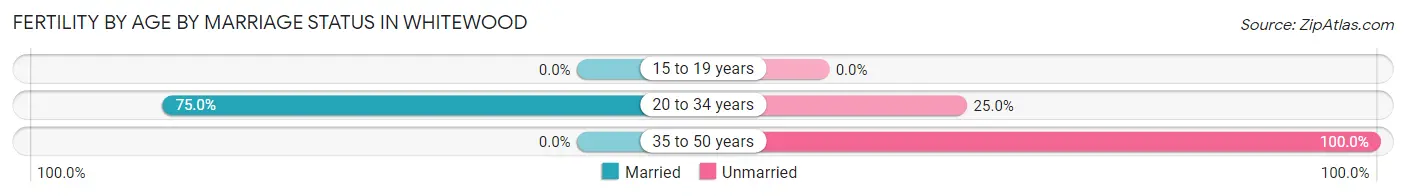
| Age Bracket | Married | Unmarried |
| 15 to 19 years | 0 (0.0%) | 0 (0.0%) |
| 20 to 34 years | 3 (75.0%) | 1 (25.0%) |
| 35 to 50 years | 0 (0.0%) | 3 (100.0%) |
| Total | 3 (42.9%) | 4 (57.1%) |
Fertility by Education in Whitewood
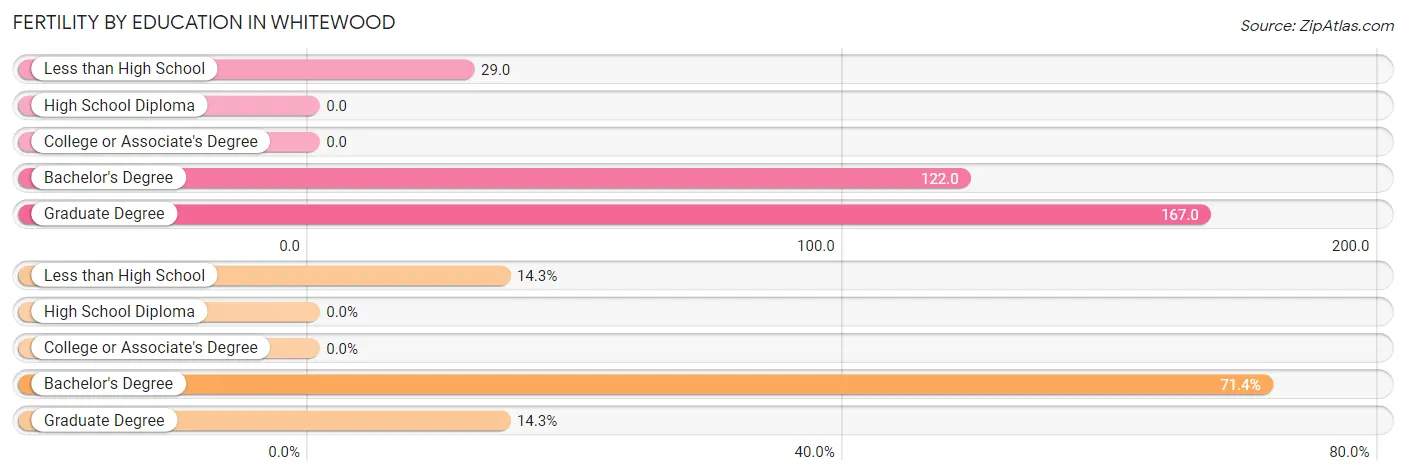
| Educational Attainment | Women with Births | Births / 1,000 Women |
| Less than High School | 1 (14.3%) | 29.0 |
| High School Diploma | 0 (0.0%) | 0.0 |
| College or Associate's Degree | 0 (0.0%) | 0.0 |
| Bachelor's Degree | 5 (71.4%) | 122.0 |
| Graduate Degree | 1 (14.3%) | 167.0 |
| Total | 7 (100.0%) | 48.0 |
Fertility by Education by Marriage Status in Whitewood
57.1% of women with births in Whitewood are unmarried. Women with the educational attainment of graduate degree are most likely to be married with 100.0% of them married at childbirth, while women with the educational attainment of less than high school are least likely to be married with 100.0% of them unmarried at childbirth.
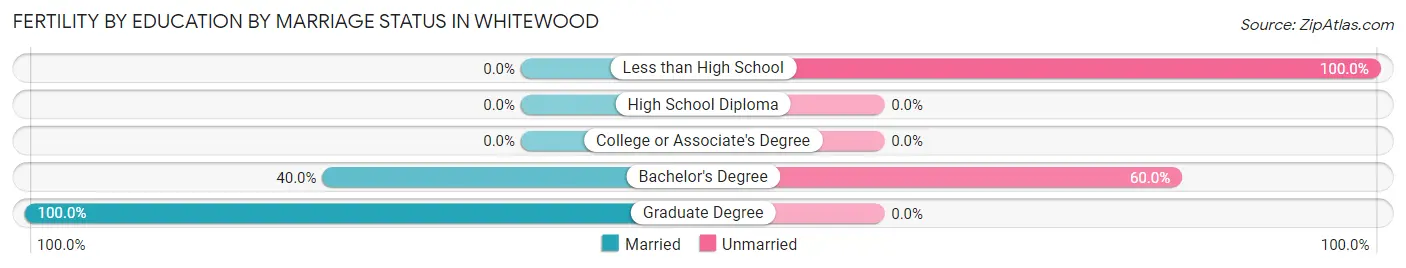
| Educational Attainment | Married | Unmarried |
| Less than High School | 0 (0.0%) | 1 (100.0%) |
| High School Diploma | 0 (0.0%) | 0 (0.0%) |
| College or Associate's Degree | 0 (0.0%) | 0 (0.0%) |
| Bachelor's Degree | 2 (40.0%) | 3 (60.0%) |
| Graduate Degree | 1 (100.0%) | 0 (0.0%) |
| Total | 3 (42.9%) | 4 (57.1%) |
Employment Characteristics in Whitewood
Employment by Class of Employer in Whitewood
Among the 517 employed individuals in Whitewood, private company employees (332 | 64.2%), not-for-profit organizations (43 | 8.3%), and local government employees (41 | 7.9%) make up the most common classes of employment.
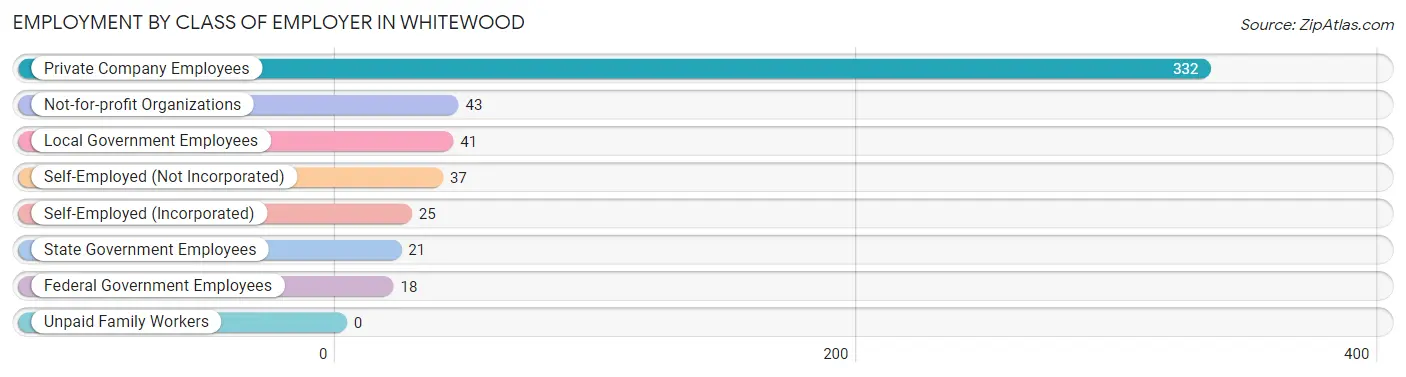
| Employer Class | # Employees | % Employees |
| Private Company Employees | 332 | 64.2% |
| Self-Employed (Incorporated) | 25 | 4.8% |
| Self-Employed (Not Incorporated) | 37 | 7.2% |
| Not-for-profit Organizations | 43 | 8.3% |
| Local Government Employees | 41 | 7.9% |
| State Government Employees | 21 | 4.1% |
| Federal Government Employees | 18 | 3.5% |
| Unpaid Family Workers | 0 | 0.0% |
| Total | 517 | 100.0% |
Employment Status by Age in Whitewood
According to the labor force statistics for Whitewood, out of the total population over 16 years of age (750), 74.9% or 562 individuals are in the labor force, with 6.6% or 37 of them unemployed. The age group with the highest labor force participation rate is 30 to 34 years, with 98.1% or 52 individuals in the labor force. Within the labor force, the 16 to 19 years age range has the highest percentage of unemployed individuals, with 24.5% or 13 of them being unemployed.
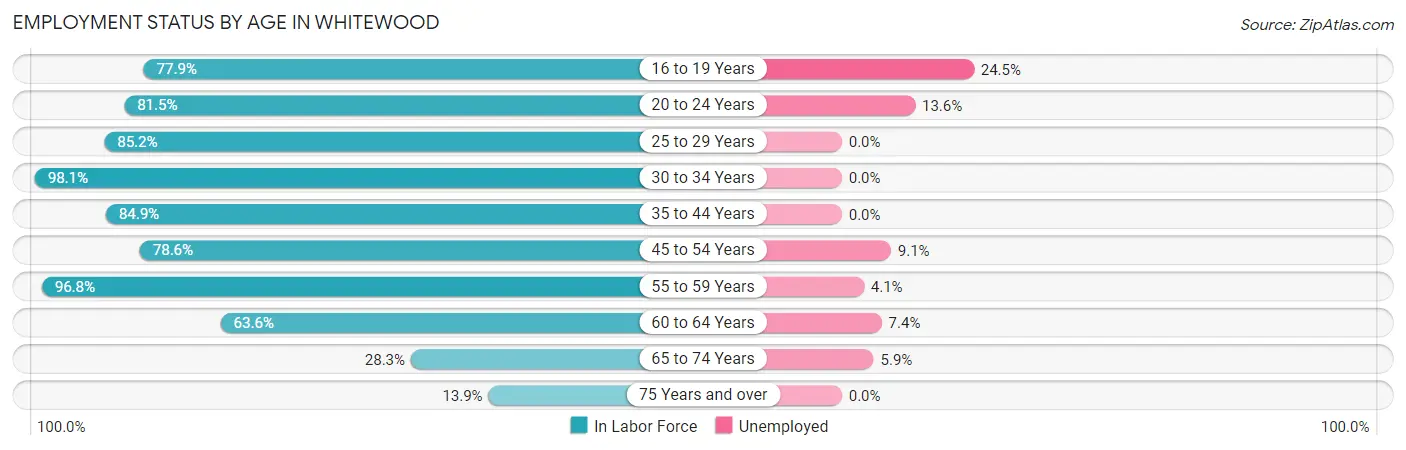
| Age Bracket | In Labor Force | Unemployed |
| 16 to 19 Years | 53 (77.9%) | 13 (24.5%) |
| 20 to 24 Years | 22 (81.5%) | 3 (13.6%) |
| 25 to 29 Years | 23 (85.2%) | 0 (0.0%) |
| 30 to 34 Years | 52 (98.1%) | 0 (0.0%) |
| 35 to 44 Years | 90 (84.9%) | 0 (0.0%) |
| 45 to 54 Years | 110 (78.6%) | 10 (9.1%) |
| 55 to 59 Years | 122 (96.8%) | 5 (4.1%) |
| 60 to 64 Years | 68 (63.6%) | 5 (7.4%) |
| 65 to 74 Years | 17 (28.3%) | 1 (5.9%) |
| 75 Years and over | 5 (13.9%) | 0 (0.0%) |
| Total | 562 (74.9%) | 37 (6.6%) |
Employment Status by Educational Attainment in Whitewood
According to labor force statistics for Whitewood, 83.2% of individuals (465) out of the total population between 25 and 64 years of age (559) are in the labor force, with 4.3% or 20 of them being unemployed. The group with the highest labor force participation rate are those with the educational attainment of bachelor's degree or higher, with 96.1% or 99 individuals in the labor force. Within the labor force, individuals with less than high school education have the highest percentage of unemployment, with 40.5% or 15 of them being unemployed.
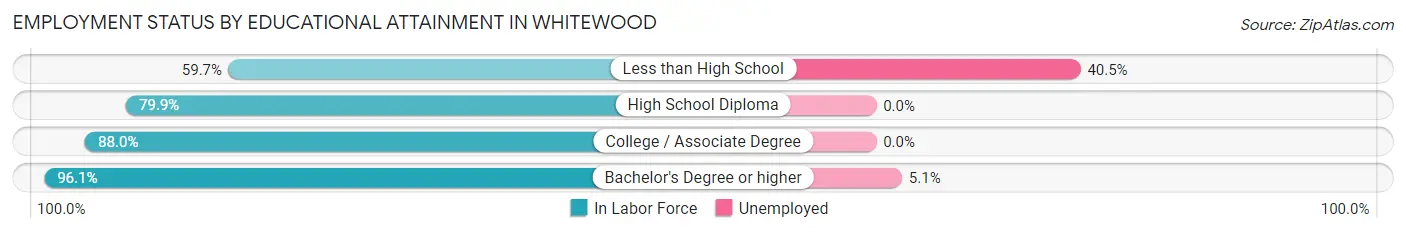
| Educational Attainment | In Labor Force | Unemployed |
| Less than High School | 37 (59.7%) | 25 (40.5%) |
| High School Diploma | 175 (79.9%) | 0 (0.0%) |
| College / Associate Degree | 154 (88.0%) | 0 (0.0%) |
| Bachelor's Degree or higher | 99 (96.1%) | 5 (5.1%) |
| Total | 465 (83.2%) | 24 (4.3%) |
Employment Occupations by Sex in Whitewood
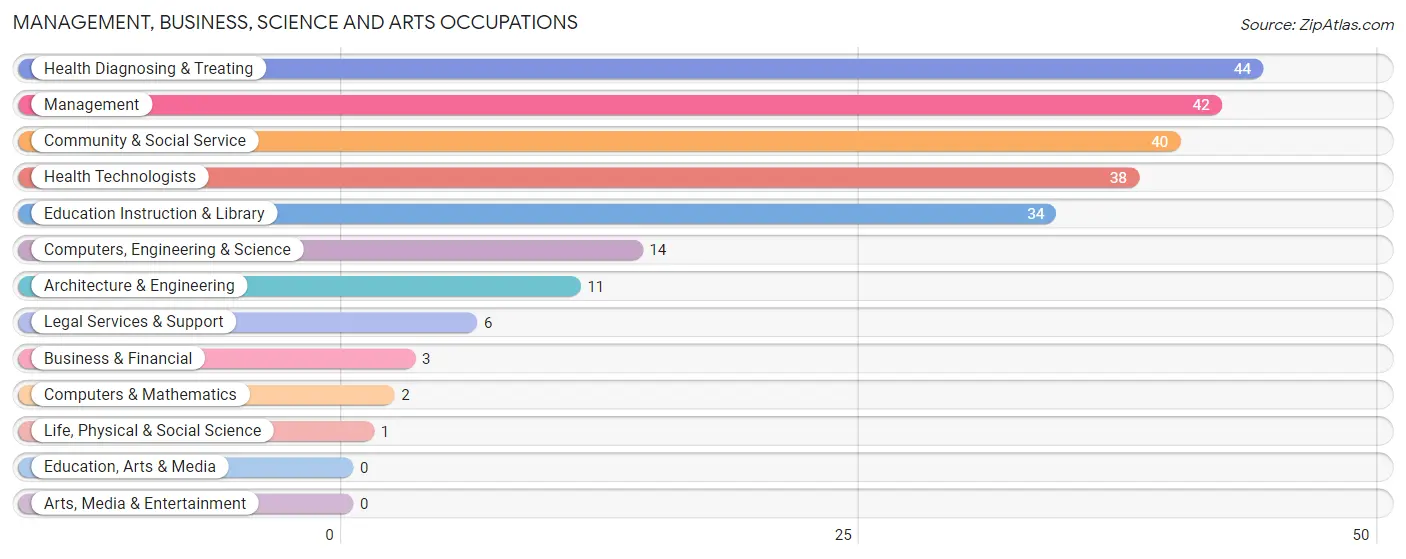
Management, Business, Science and Arts Occupations
The most common Management, Business, Science and Arts occupations in Whitewood are Health Diagnosing & Treating (44 | 8.4%), Management (42 | 8.0%), Community & Social Service (40 | 7.6%), Health Technologists (38 | 7.2%), and Education Instruction & Library (34 | 6.5%).
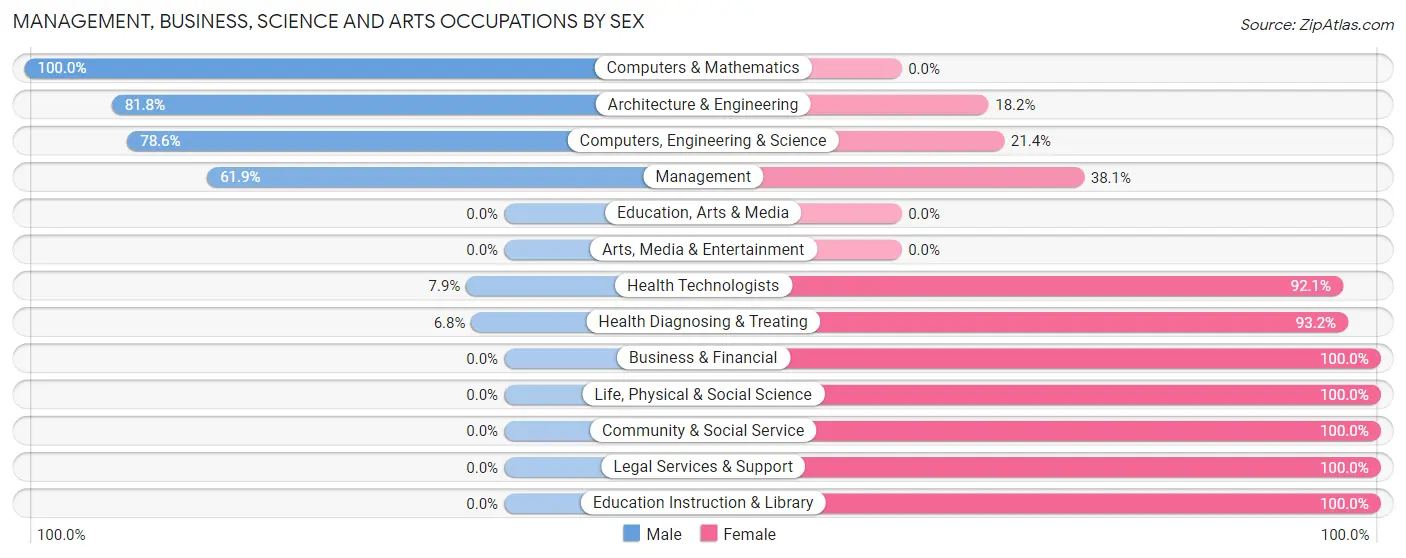
Management, Business, Science and Arts Occupations by Sex
Within the Management, Business, Science and Arts occupations in Whitewood, the most male-oriented occupations are Computers & Mathematics (100.0%), Architecture & Engineering (81.8%), and Computers, Engineering & Science (78.6%), while the most female-oriented occupations are Business & Financial (100.0%), Life, Physical & Social Science (100.0%), and Community & Social Service (100.0%).
| Occupation | Male | Female |
| Management | 26 (61.9%) | 16 (38.1%) |
| Business & Financial | 0 (0.0%) | 3 (100.0%) |
| Computers, Engineering & Science | 11 (78.6%) | 3 (21.4%) |
| Computers & Mathematics | 2 (100.0%) | 0 (0.0%) |
| Architecture & Engineering | 9 (81.8%) | 2 (18.2%) |
| Life, Physical & Social Science | 0 (0.0%) | 1 (100.0%) |
| Community & Social Service | 0 (0.0%) | 40 (100.0%) |
| Education, Arts & Media | 0 (0.0%) | 0 (0.0%) |
| Legal Services & Support | 0 (0.0%) | 6 (100.0%) |
| Education Instruction & Library | 0 (0.0%) | 34 (100.0%) |
| Arts, Media & Entertainment | 0 (0.0%) | 0 (0.0%) |
| Health Diagnosing & Treating | 3 (6.8%) | 41 (93.2%) |
| Health Technologists | 3 (7.9%) | 35 (92.1%) |
| Total (Category) | 40 (28.0%) | 103 (72.0%) |
| Total (Overall) | 253 (48.2%) | 272 (51.8%) |
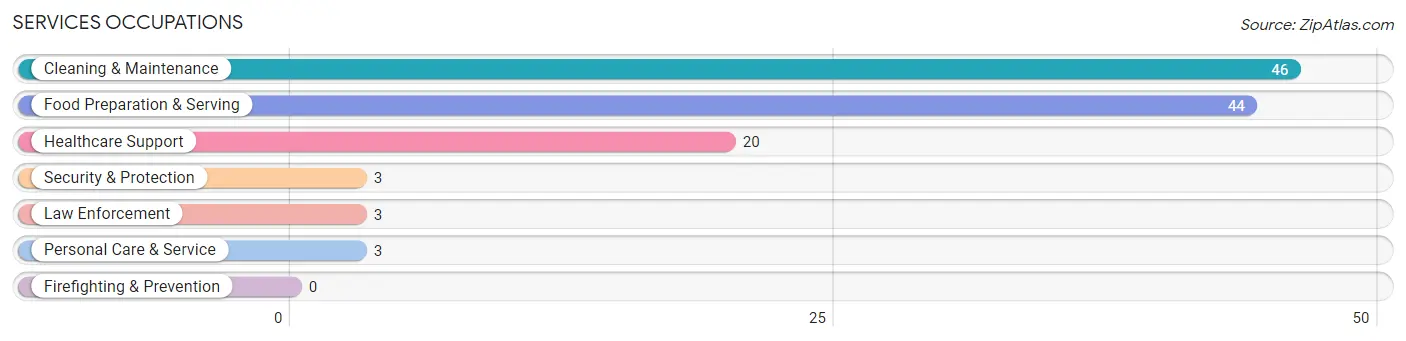
Services Occupations
The most common Services occupations in Whitewood are Cleaning & Maintenance (46 | 8.8%), Food Preparation & Serving (44 | 8.4%), Healthcare Support (20 | 3.8%), Security & Protection (3 | 0.6%), and Law Enforcement (3 | 0.6%).
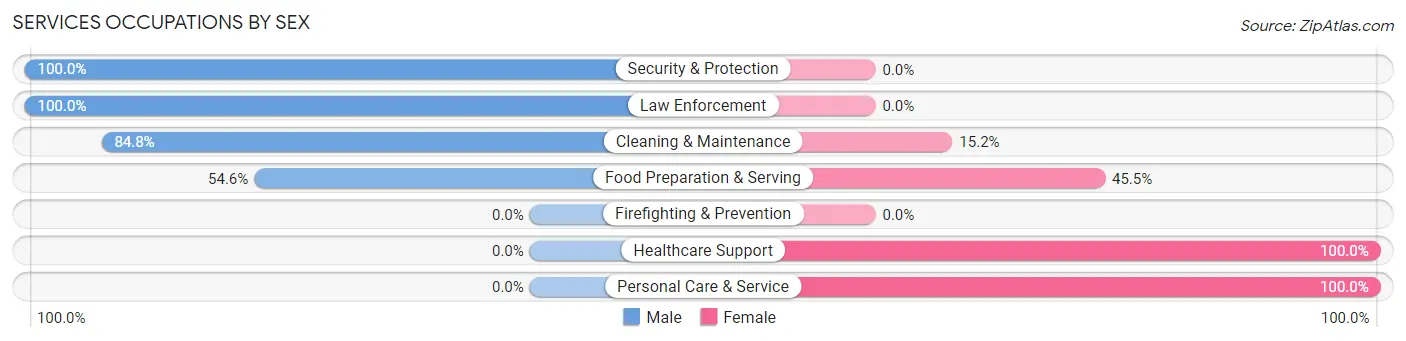
Services Occupations by Sex
Within the Services occupations in Whitewood, the most male-oriented occupations are Security & Protection (100.0%), Law Enforcement (100.0%), and Cleaning & Maintenance (84.8%), while the most female-oriented occupations are Healthcare Support (100.0%), Personal Care & Service (100.0%), and Food Preparation & Serving (45.5%).
| Occupation | Male | Female |
| Healthcare Support | 0 (0.0%) | 20 (100.0%) |
| Security & Protection | 3 (100.0%) | 0 (0.0%) |
| Firefighting & Prevention | 0 (0.0%) | 0 (0.0%) |
| Law Enforcement | 3 (100.0%) | 0 (0.0%) |
| Food Preparation & Serving | 24 (54.5%) | 20 (45.5%) |
| Cleaning & Maintenance | 39 (84.8%) | 7 (15.2%) |
| Personal Care & Service | 0 (0.0%) | 3 (100.0%) |
| Total (Category) | 66 (56.9%) | 50 (43.1%) |
| Total (Overall) | 253 (48.2%) | 272 (51.8%) |
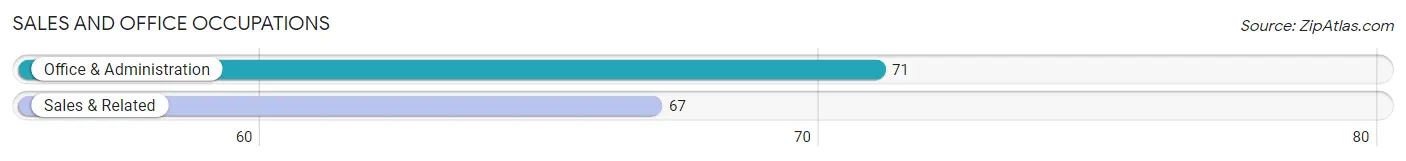
Sales and Office Occupations
The most common Sales and Office occupations in Whitewood are Office & Administration (71 | 13.5%), and Sales & Related (67 | 12.8%).
Sales and Office Occupations by Sex
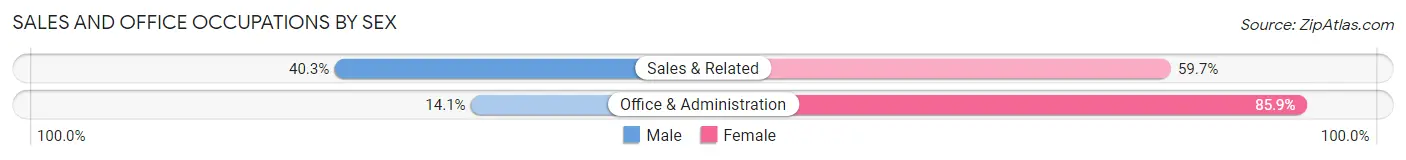
| Occupation | Male | Female |
| Sales & Related | 27 (40.3%) | 40 (59.7%) |
| Office & Administration | 10 (14.1%) | 61 (85.9%) |
| Total (Category) | 37 (26.8%) | 101 (73.2%) |
| Total (Overall) | 253 (48.2%) | 272 (51.8%) |
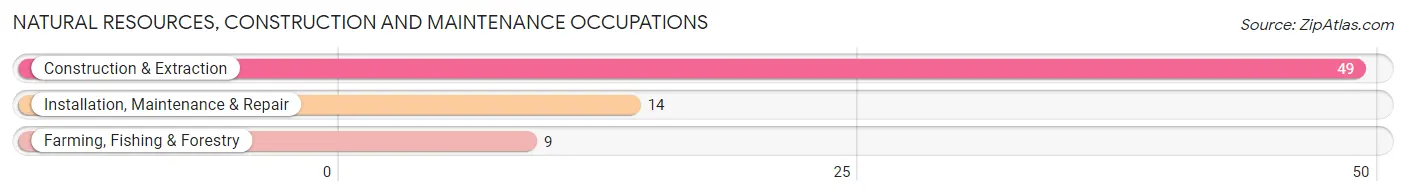
Natural Resources, Construction and Maintenance Occupations
The most common Natural Resources, Construction and Maintenance occupations in Whitewood are Construction & Extraction (49 | 9.3%), Installation, Maintenance & Repair (14 | 2.7%), and Farming, Fishing & Forestry (9 | 1.7%).
Natural Resources, Construction and Maintenance Occupations by Sex
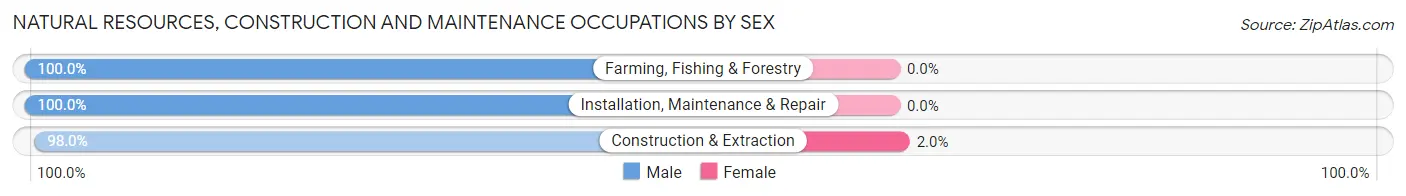
| Occupation | Male | Female |
| Farming, Fishing & Forestry | 9 (100.0%) | 0 (0.0%) |
| Construction & Extraction | 48 (98.0%) | 1 (2.0%) |
| Installation, Maintenance & Repair | 14 (100.0%) | 0 (0.0%) |
| Total (Category) | 71 (98.6%) | 1 (1.4%) |
| Total (Overall) | 253 (48.2%) | 272 (51.8%) |
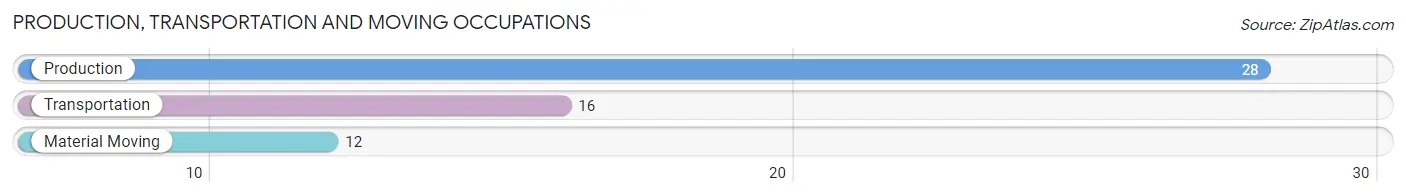
Production, Transportation and Moving Occupations
The most common Production, Transportation and Moving occupations in Whitewood are Production (28 | 5.3%), Transportation (16 | 3.0%), and Material Moving (12 | 2.3%).
Production, Transportation and Moving Occupations by Sex
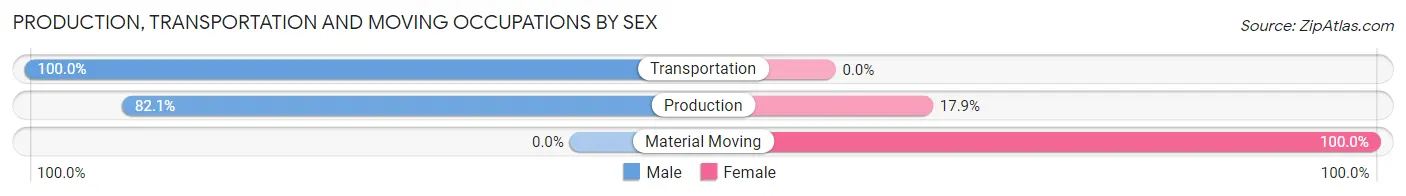
| Occupation | Male | Female |
| Production | 23 (82.1%) | 5 (17.9%) |
| Transportation | 16 (100.0%) | 0 (0.0%) |
| Material Moving | 0 (0.0%) | 12 (100.0%) |
| Total (Category) | 39 (69.6%) | 17 (30.4%) |
| Total (Overall) | 253 (48.2%) | 272 (51.8%) |
Employment Industries by Sex in Whitewood
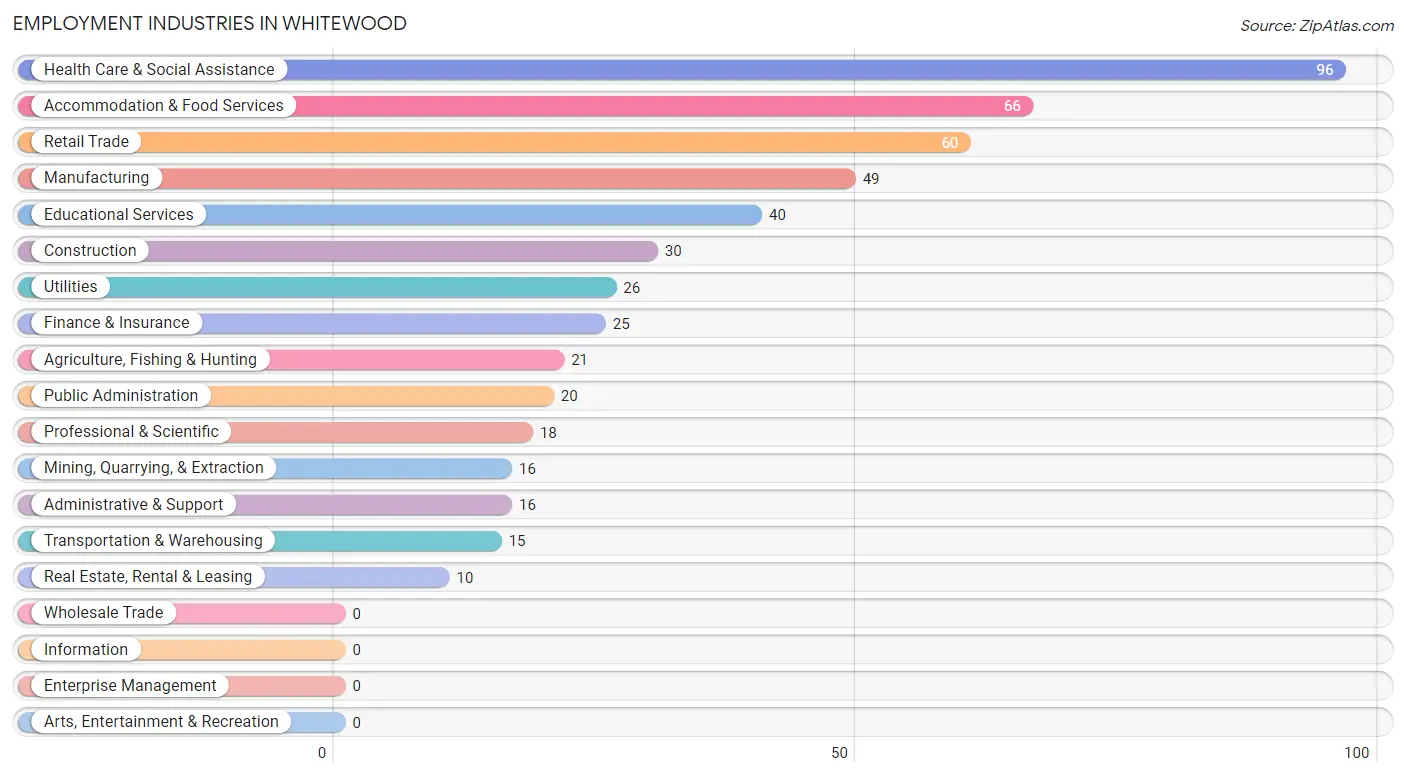
Employment Industries in Whitewood
The major employment industries in Whitewood include Health Care & Social Assistance (96 | 18.3%), Accommodation & Food Services (66 | 12.6%), Retail Trade (60 | 11.4%), Manufacturing (49 | 9.3%), and Educational Services (40 | 7.6%).
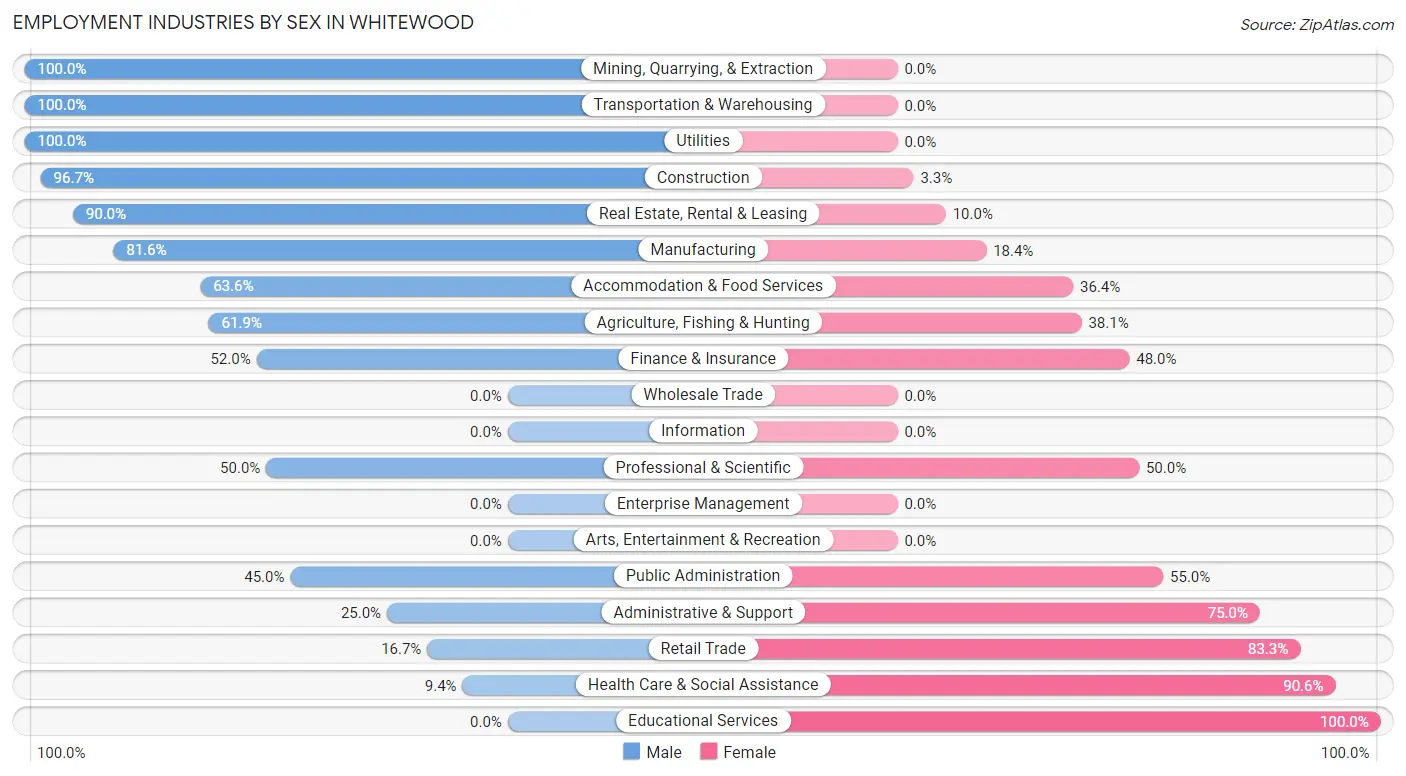
Employment Industries by Sex in Whitewood
The Whitewood industries that see more men than women are Mining, Quarrying, & Extraction (100.0%), Transportation & Warehousing (100.0%), and Utilities (100.0%), whereas the industries that tend to have a higher number of women are Educational Services (100.0%), Health Care & Social Assistance (90.6%), and Retail Trade (83.3%).
| Industry | Male | Female |
| Agriculture, Fishing & Hunting | 13 (61.9%) | 8 (38.1%) |
| Mining, Quarrying, & Extraction | 16 (100.0%) | 0 (0.0%) |
| Construction | 29 (96.7%) | 1 (3.3%) |
| Manufacturing | 40 (81.6%) | 9 (18.4%) |
| Wholesale Trade | 0 (0.0%) | 0 (0.0%) |
| Retail Trade | 10 (16.7%) | 50 (83.3%) |
| Transportation & Warehousing | 15 (100.0%) | 0 (0.0%) |
| Utilities | 26 (100.0%) | 0 (0.0%) |
| Information | 0 (0.0%) | 0 (0.0%) |
| Finance & Insurance | 13 (52.0%) | 12 (48.0%) |
| Real Estate, Rental & Leasing | 9 (90.0%) | 1 (10.0%) |
| Professional & Scientific | 9 (50.0%) | 9 (50.0%) |
| Enterprise Management | 0 (0.0%) | 0 (0.0%) |
| Administrative & Support | 4 (25.0%) | 12 (75.0%) |
| Educational Services | 0 (0.0%) | 40 (100.0%) |
| Health Care & Social Assistance | 9 (9.4%) | 87 (90.6%) |
| Arts, Entertainment & Recreation | 0 (0.0%) | 0 (0.0%) |
| Accommodation & Food Services | 42 (63.6%) | 24 (36.4%) |
| Public Administration | 9 (45.0%) | 11 (55.0%) |
| Total | 253 (48.2%) | 272 (51.8%) |
Education in Whitewood
School Enrollment in Whitewood
The most common levels of schooling among the 170 students in Whitewood are high school (54 | 31.8%), elementary school (38 | 22.4%), and middle school (27 | 15.9%).
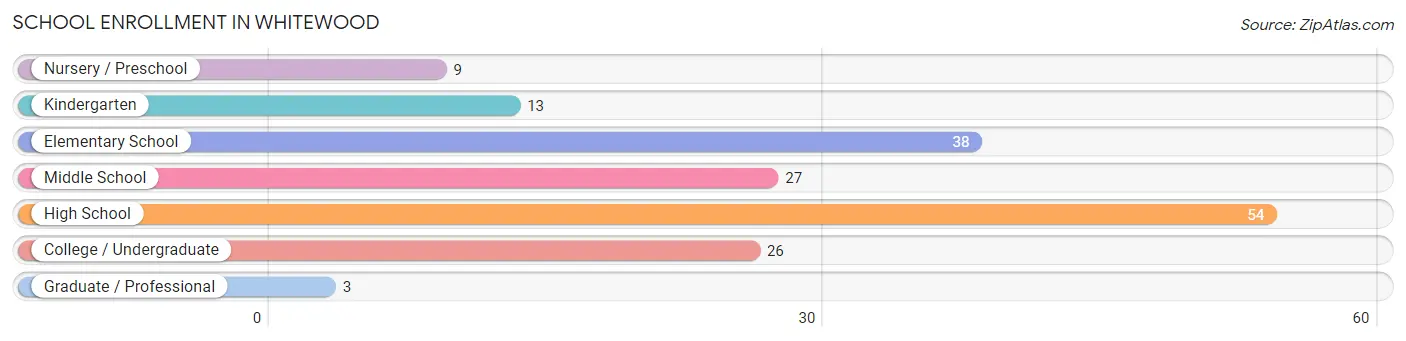
| School Level | # Students | % Students |
| Nursery / Preschool | 9 | 5.3% |
| Kindergarten | 13 | 7.6% |
| Elementary School | 38 | 22.4% |
| Middle School | 27 | 15.9% |
| High School | 54 | 31.8% |
| College / Undergraduate | 26 | 15.3% |
| Graduate / Professional | 3 | 1.8% |
| Total | 170 | 100.0% |
School Enrollment by Age by Funding Source in Whitewood
Out of a total of 170 students who are enrolled in schools in Whitewood, 14 (8.2%) attend a private institution, while the remaining 156 (91.8%) are enrolled in public schools. The age group of 18 to 19 year olds has the highest likelihood of being enrolled in private schools, with 11 (42.3% in the age bracket) enrolled. Conversely, the age group of 5 to 9 year old has the lowest likelihood of being enrolled in a private school, with 54 (100.0% in the age bracket) attending a public institution.
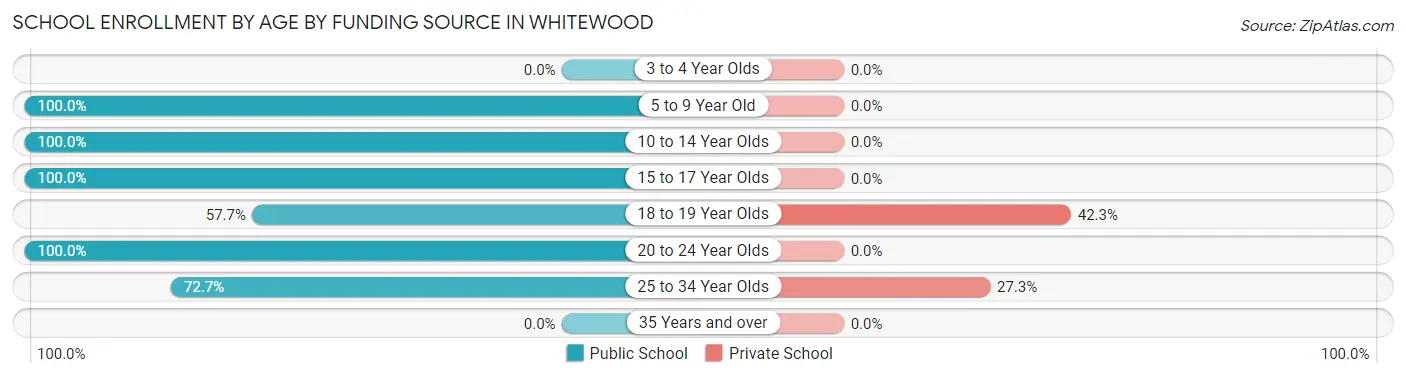
| Age Bracket | Public School | Private School |
| 3 to 4 Year Olds | 0 (0.0%) | 0 (0.0%) |
| 5 to 9 Year Old | 54 (100.0%) | 0 (0.0%) |
| 10 to 14 Year Olds | 33 (100.0%) | 0 (0.0%) |
| 15 to 17 Year Olds | 35 (100.0%) | 0 (0.0%) |
| 18 to 19 Year Olds | 15 (57.7%) | 11 (42.3%) |
| 20 to 24 Year Olds | 11 (100.0%) | 0 (0.0%) |
| 25 to 34 Year Olds | 8 (72.7%) | 3 (27.3%) |
| 35 Years and over | 0 (0.0%) | 0 (0.0%) |
| Total | 156 (91.8%) | 14 (8.2%) |
Educational Attainment by Field of Study in Whitewood
Education (41 | 31.3%), science & technology (35 | 26.7%), arts & humanities (14 | 10.7%), business (11 | 8.4%), and bio, nature & agricultural (10 | 7.6%) are the most common fields of study among 131 individuals in Whitewood who have obtained a bachelor's degree or higher.
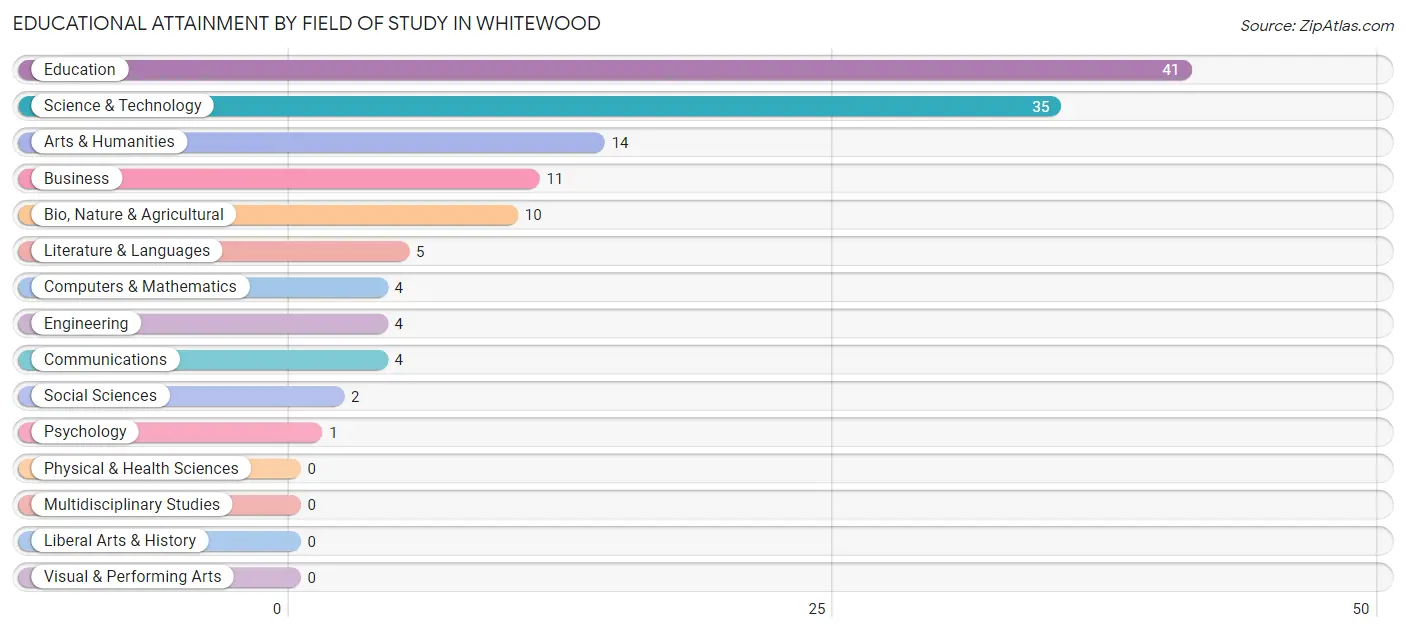
| Field of Study | # Graduates | % Graduates |
| Computers & Mathematics | 4 | 3.0% |
| Bio, Nature & Agricultural | 10 | 7.6% |
| Physical & Health Sciences | 0 | 0.0% |
| Psychology | 1 | 0.8% |
| Social Sciences | 2 | 1.5% |
| Engineering | 4 | 3.0% |
| Multidisciplinary Studies | 0 | 0.0% |
| Science & Technology | 35 | 26.7% |
| Business | 11 | 8.4% |
| Education | 41 | 31.3% |
| Literature & Languages | 5 | 3.8% |
| Liberal Arts & History | 0 | 0.0% |
| Visual & Performing Arts | 0 | 0.0% |
| Communications | 4 | 3.0% |
| Arts & Humanities | 14 | 10.7% |
| Total | 131 | 100.0% |
Transportation & Commute in Whitewood
Vehicle Availability by Sex in Whitewood
The most prevalent vehicle ownership categories in Whitewood are males with 3 vehicles (131, accounting for 54.8%) and females with 3 vehicles (99, making up 48.9%).
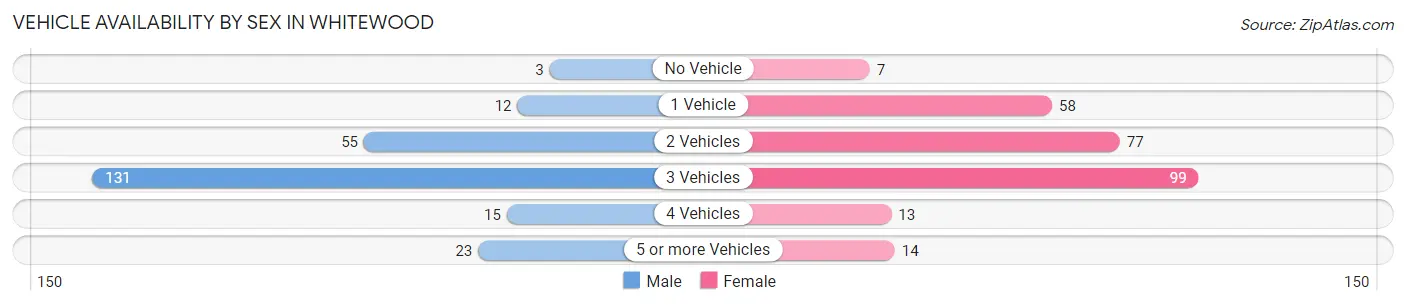
| Vehicles Available | Male | Female |
| No Vehicle | 3 (1.3%) | 7 (2.6%) |
| 1 Vehicle | 12 (5.0%) | 58 (21.6%) |
| 2 Vehicles | 55 (23.0%) | 77 (28.7%) |
| 3 Vehicles | 131 (54.8%) | 99 (36.9%) |
| 4 Vehicles | 15 (6.3%) | 13 (4.9%) |
| 5 or more Vehicles | 23 (9.6%) | 14 (5.2%) |
| Total | 239 (100.0%) | 268 (100.0%) |
Commute Time in Whitewood
The most frequently occuring commute durations in Whitewood are 15 to 19 minutes (142 commuters, 28.6%), 20 to 24 minutes (75 commuters, 15.1%), and less than 5 minutes (64 commuters, 12.9%).
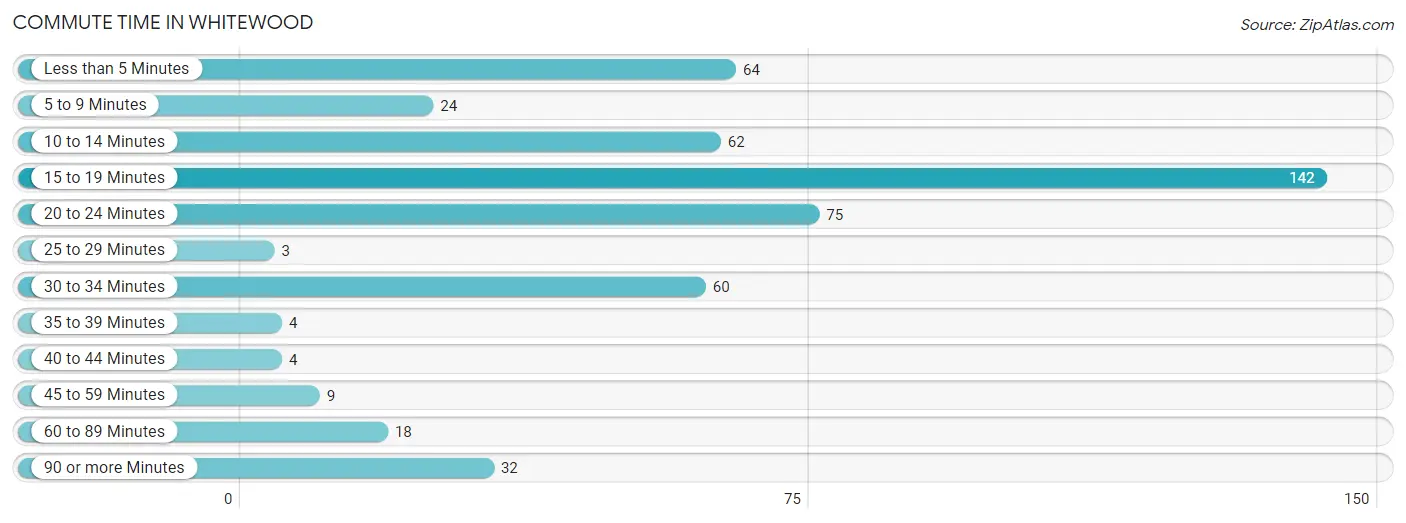
| Commute Time | # Commuters | % Commuters |
| Less than 5 Minutes | 64 | 12.9% |
| 5 to 9 Minutes | 24 | 4.8% |
| 10 to 14 Minutes | 62 | 12.5% |
| 15 to 19 Minutes | 142 | 28.6% |
| 20 to 24 Minutes | 75 | 15.1% |
| 25 to 29 Minutes | 3 | 0.6% |
| 30 to 34 Minutes | 60 | 12.1% |
| 35 to 39 Minutes | 4 | 0.8% |
| 40 to 44 Minutes | 4 | 0.8% |
| 45 to 59 Minutes | 9 | 1.8% |
| 60 to 89 Minutes | 18 | 3.6% |
| 90 or more Minutes | 32 | 6.4% |
Commute Time by Sex in Whitewood
The most common commute times in Whitewood are 20 to 24 minutes (54 commuters, 22.3%) for males and 15 to 19 minutes (96 commuters, 37.7%) for females.
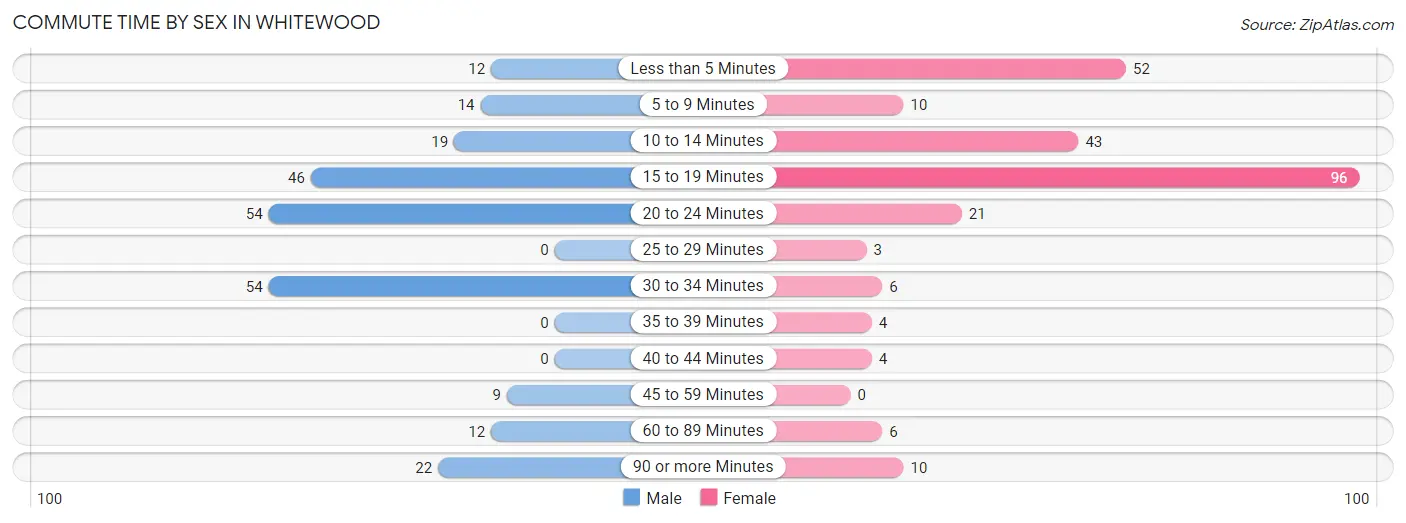
| Commute Time | Male | Female |
| Less than 5 Minutes | 12 (5.0%) | 52 (20.4%) |
| 5 to 9 Minutes | 14 (5.8%) | 10 (3.9%) |
| 10 to 14 Minutes | 19 (7.9%) | 43 (16.9%) |
| 15 to 19 Minutes | 46 (19.0%) | 96 (37.7%) |
| 20 to 24 Minutes | 54 (22.3%) | 21 (8.2%) |
| 25 to 29 Minutes | 0 (0.0%) | 3 (1.2%) |
| 30 to 34 Minutes | 54 (22.3%) | 6 (2.4%) |
| 35 to 39 Minutes | 0 (0.0%) | 4 (1.6%) |
| 40 to 44 Minutes | 0 (0.0%) | 4 (1.6%) |
| 45 to 59 Minutes | 9 (3.7%) | 0 (0.0%) |
| 60 to 89 Minutes | 12 (5.0%) | 6 (2.4%) |
| 90 or more Minutes | 22 (9.1%) | 10 (3.9%) |
Time of Departure to Work by Sex in Whitewood
The most frequent times of departure to work in Whitewood are 12:00 AM to 4:59 AM (62, 25.6%) for males and 7:00 AM to 7:29 AM (62, 24.3%) for females.
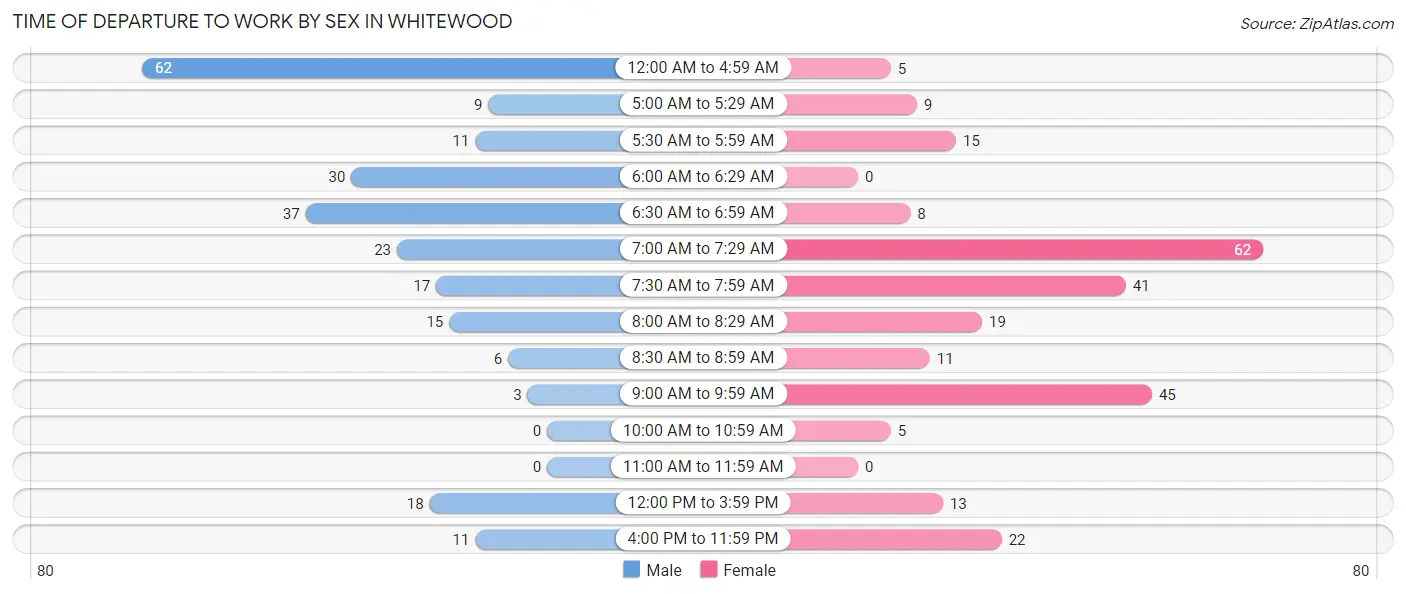
| Time of Departure | Male | Female |
| 12:00 AM to 4:59 AM | 62 (25.6%) | 5 (2.0%) |
| 5:00 AM to 5:29 AM | 9 (3.7%) | 9 (3.5%) |
| 5:30 AM to 5:59 AM | 11 (4.5%) | 15 (5.9%) |
| 6:00 AM to 6:29 AM | 30 (12.4%) | 0 (0.0%) |
| 6:30 AM to 6:59 AM | 37 (15.3%) | 8 (3.1%) |
| 7:00 AM to 7:29 AM | 23 (9.5%) | 62 (24.3%) |
| 7:30 AM to 7:59 AM | 17 (7.0%) | 41 (16.1%) |
| 8:00 AM to 8:29 AM | 15 (6.2%) | 19 (7.4%) |
| 8:30 AM to 8:59 AM | 6 (2.5%) | 11 (4.3%) |
| 9:00 AM to 9:59 AM | 3 (1.2%) | 45 (17.6%) |
| 10:00 AM to 10:59 AM | 0 (0.0%) | 5 (2.0%) |
| 11:00 AM to 11:59 AM | 0 (0.0%) | 0 (0.0%) |
| 12:00 PM to 3:59 PM | 18 (7.4%) | 13 (5.1%) |
| 4:00 PM to 11:59 PM | 11 (4.5%) | 22 (8.6%) |
| Total | 242 (100.0%) | 255 (100.0%) |
Housing Occupancy in Whitewood
Occupancy by Ownership in Whitewood
Of the total 354 dwellings in Whitewood, owner-occupied units account for 286 (80.8%), while renter-occupied units make up 68 (19.2%).
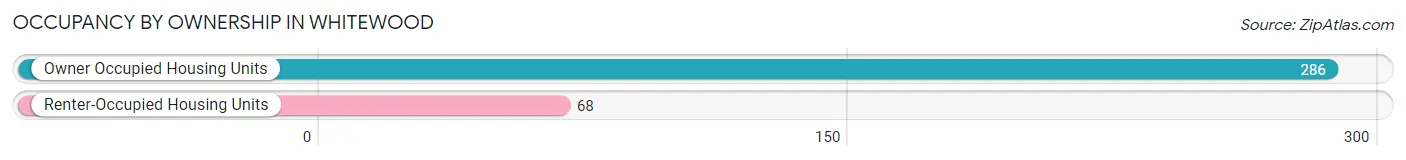
| Occupancy | # Housing Units | % Housing Units |
| Owner Occupied Housing Units | 286 | 80.8% |
| Renter-Occupied Housing Units | 68 | 19.2% |
| Total Occupied Housing Units | 354 | 100.0% |
Occupancy by Household Size in Whitewood
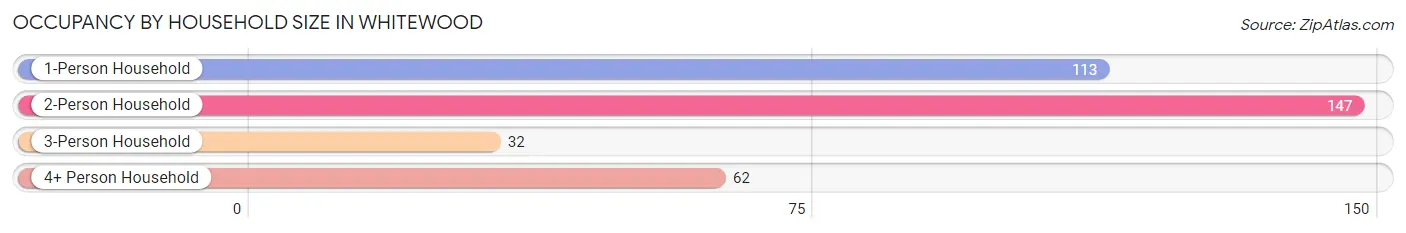
| Household Size | # Housing Units | % Housing Units |
| 1-Person Household | 113 | 31.9% |
| 2-Person Household | 147 | 41.5% |
| 3-Person Household | 32 | 9.0% |
| 4+ Person Household | 62 | 17.5% |
| Total Housing Units | 354 | 100.0% |
Occupancy by Ownership by Household Size in Whitewood
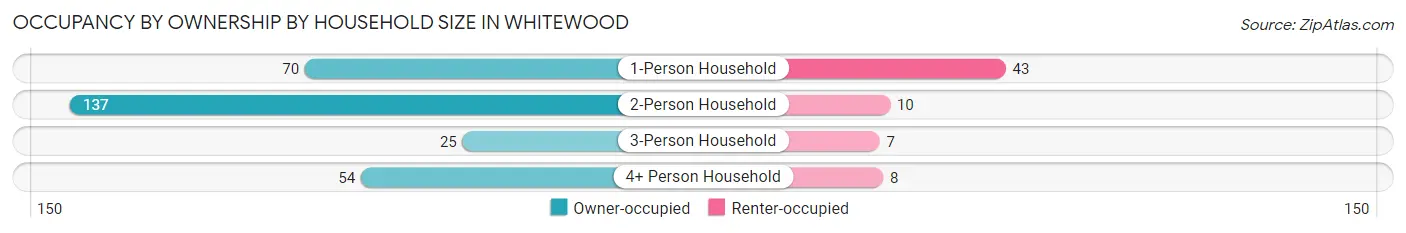
| Household Size | Owner-occupied | Renter-occupied |
| 1-Person Household | 70 (62.0%) | 43 (38.1%) |
| 2-Person Household | 137 (93.2%) | 10 (6.8%) |
| 3-Person Household | 25 (78.1%) | 7 (21.9%) |
| 4+ Person Household | 54 (87.1%) | 8 (12.9%) |
| Total Housing Units | 286 (80.8%) | 68 (19.2%) |
Occupancy by Educational Attainment in Whitewood
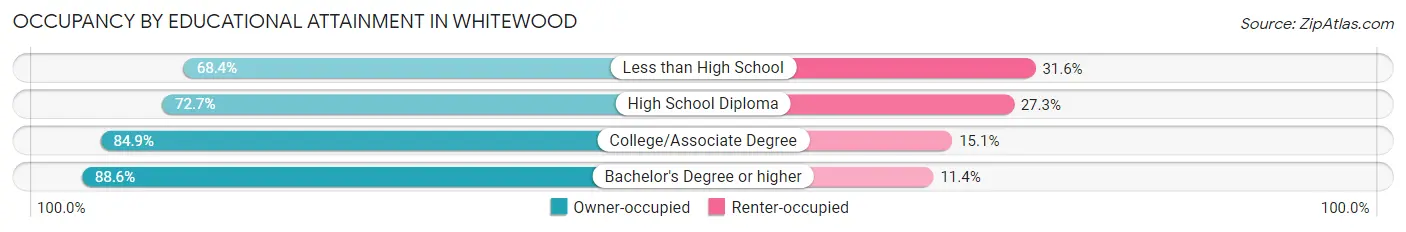
| Household Size | Owner-occupied | Renter-occupied |
| Less than High School | 13 (68.4%) | 6 (31.6%) |
| High School Diploma | 88 (72.7%) | 33 (27.3%) |
| College/Associate Degree | 107 (84.9%) | 19 (15.1%) |
| Bachelor's Degree or higher | 78 (88.6%) | 10 (11.4%) |
Occupancy by Age of Householder in Whitewood
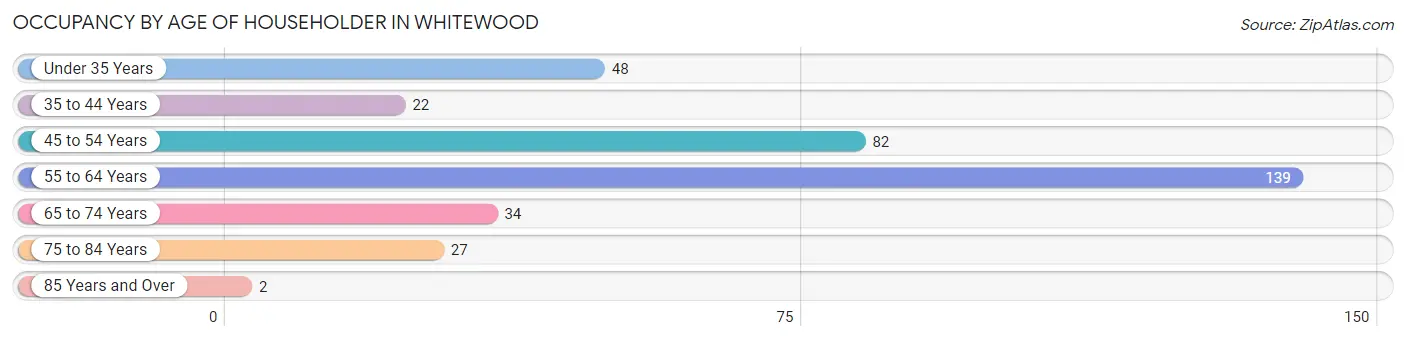
| Age Bracket | # Households | % Households |
| Under 35 Years | 48 | 13.6% |
| 35 to 44 Years | 22 | 6.2% |
| 45 to 54 Years | 82 | 23.2% |
| 55 to 64 Years | 139 | 39.3% |
| 65 to 74 Years | 34 | 9.6% |
| 75 to 84 Years | 27 | 7.6% |
| 85 Years and Over | 2 | 0.6% |
| Total | 354 | 100.0% |
Housing Finances in Whitewood
Median Income by Occupancy in Whitewood
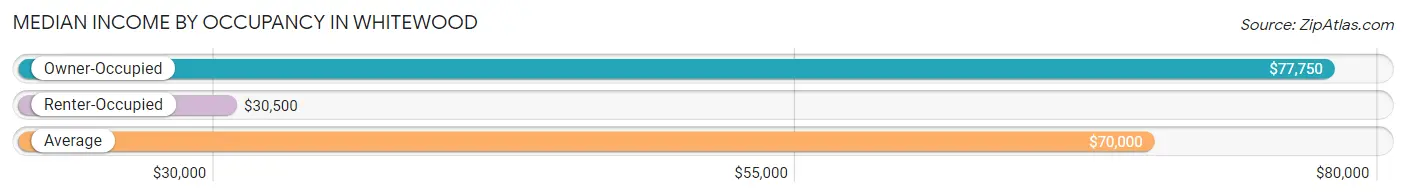
| Occupancy Type | # Households | Median Income |
| Owner-Occupied | 286 (80.8%) | $77,750 |
| Renter-Occupied | 68 (19.2%) | $30,500 |
| Average | 354 (100.0%) | $70,000 |
Occupancy by Householder Income Bracket in Whitewood
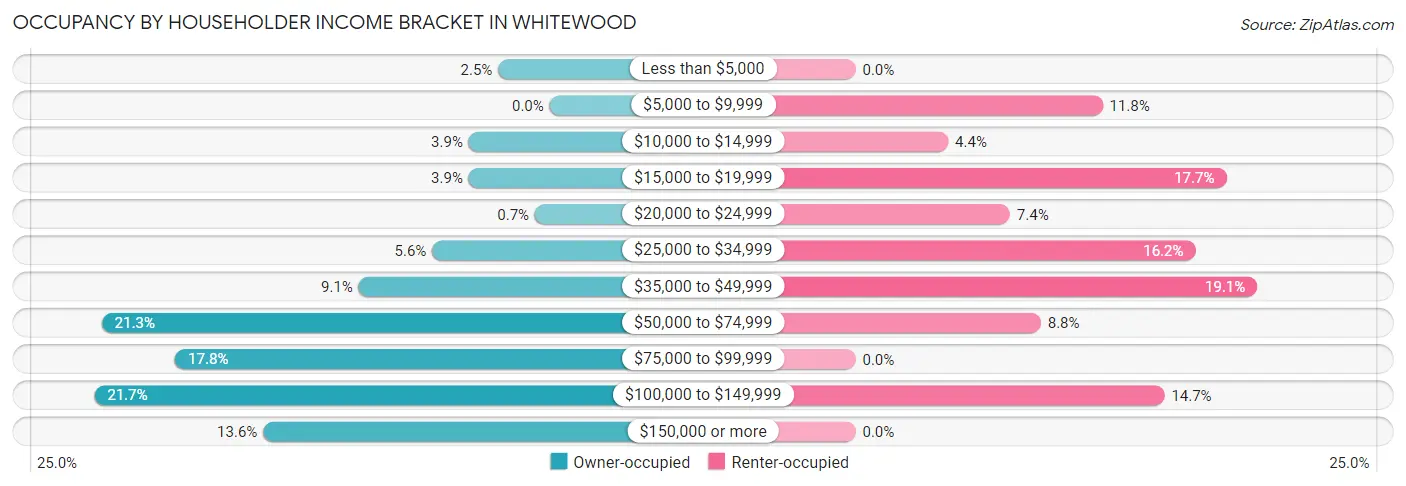
| Income Bracket | Owner-occupied | Renter-occupied |
| Less than $5,000 | 7 (2.5%) | 0 (0.0%) |
| $5,000 to $9,999 | 0 (0.0%) | 8 (11.8%) |
| $10,000 to $14,999 | 11 (3.8%) | 3 (4.4%) |
| $15,000 to $19,999 | 11 (3.8%) | 12 (17.6%) |
| $20,000 to $24,999 | 2 (0.7%) | 5 (7.3%) |
| $25,000 to $34,999 | 16 (5.6%) | 11 (16.2%) |
| $35,000 to $49,999 | 26 (9.1%) | 13 (19.1%) |
| $50,000 to $74,999 | 61 (21.3%) | 6 (8.8%) |
| $75,000 to $99,999 | 51 (17.8%) | 0 (0.0%) |
| $100,000 to $149,999 | 62 (21.7%) | 10 (14.7%) |
| $150,000 or more | 39 (13.6%) | 0 (0.0%) |
| Total | 286 (100.0%) | 68 (100.0%) |
Monthly Housing Cost Tiers in Whitewood
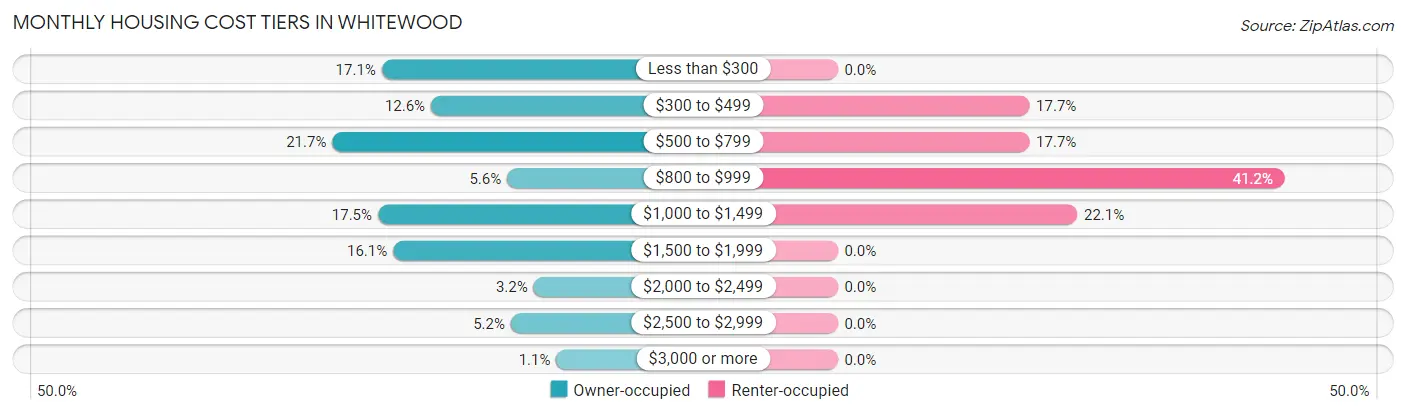
| Monthly Cost | Owner-occupied | Renter-occupied |
| Less than $300 | 49 (17.1%) | 0 (0.0%) |
| $300 to $499 | 36 (12.6%) | 12 (17.6%) |
| $500 to $799 | 62 (21.7%) | 12 (17.6%) |
| $800 to $999 | 16 (5.6%) | 28 (41.2%) |
| $1,000 to $1,499 | 50 (17.5%) | 15 (22.1%) |
| $1,500 to $1,999 | 46 (16.1%) | 0 (0.0%) |
| $2,000 to $2,499 | 9 (3.2%) | 0 (0.0%) |
| $2,500 to $2,999 | 15 (5.2%) | 0 (0.0%) |
| $3,000 or more | 3 (1.1%) | 0 (0.0%) |
| Total | 286 (100.0%) | 68 (100.0%) |
Physical Housing Characteristics in Whitewood
Housing Structures in Whitewood
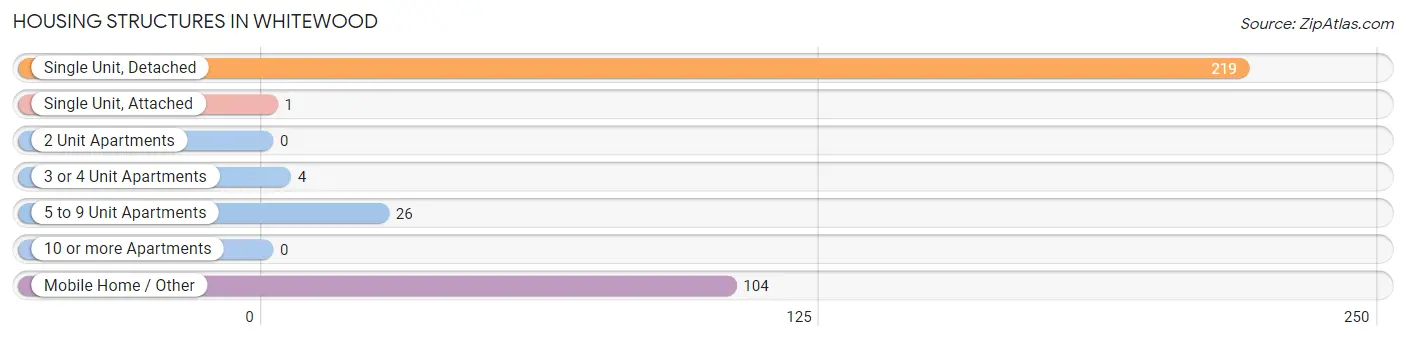
| Structure Type | # Housing Units | % Housing Units |
| Single Unit, Detached | 219 | 61.9% |
| Single Unit, Attached | 1 | 0.3% |
| 2 Unit Apartments | 0 | 0.0% |
| 3 or 4 Unit Apartments | 4 | 1.1% |
| 5 to 9 Unit Apartments | 26 | 7.3% |
| 10 or more Apartments | 0 | 0.0% |
| Mobile Home / Other | 104 | 29.4% |
| Total | 354 | 100.0% |
Housing Structures by Occupancy in Whitewood
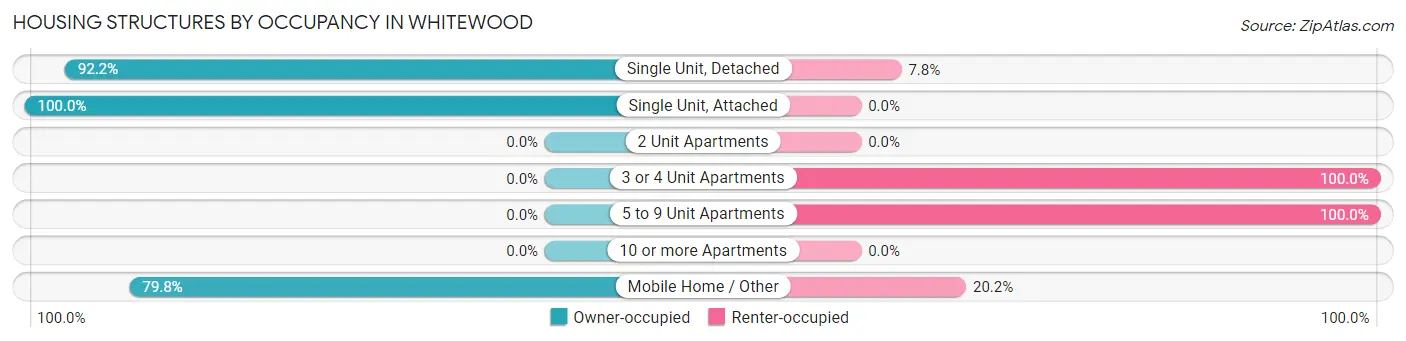
| Structure Type | Owner-occupied | Renter-occupied |
| Single Unit, Detached | 202 (92.2%) | 17 (7.8%) |
| Single Unit, Attached | 1 (100.0%) | 0 (0.0%) |
| 2 Unit Apartments | 0 (0.0%) | 0 (0.0%) |
| 3 or 4 Unit Apartments | 0 (0.0%) | 4 (100.0%) |
| 5 to 9 Unit Apartments | 0 (0.0%) | 26 (100.0%) |
| 10 or more Apartments | 0 (0.0%) | 0 (0.0%) |
| Mobile Home / Other | 83 (79.8%) | 21 (20.2%) |
| Total | 286 (80.8%) | 68 (19.2%) |
Housing Structures by Number of Rooms in Whitewood
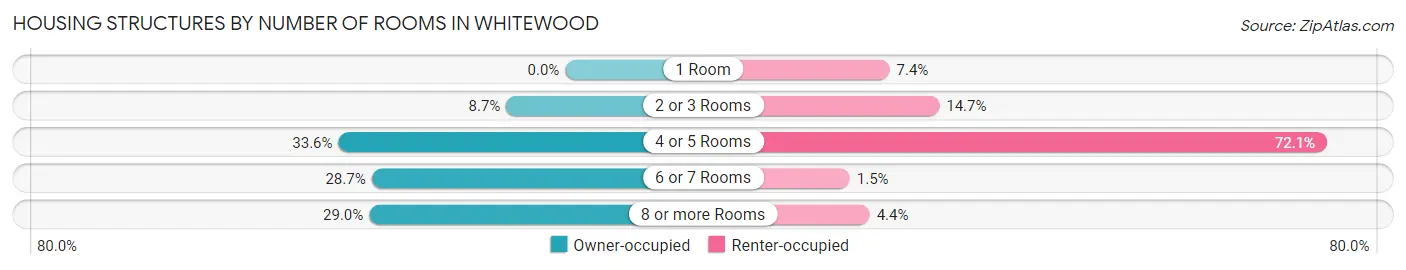
| Number of Rooms | Owner-occupied | Renter-occupied |
| 1 Room | 0 (0.0%) | 5 (7.3%) |
| 2 or 3 Rooms | 25 (8.7%) | 10 (14.7%) |
| 4 or 5 Rooms | 96 (33.6%) | 49 (72.1%) |
| 6 or 7 Rooms | 82 (28.7%) | 1 (1.5%) |
| 8 or more Rooms | 83 (29.0%) | 3 (4.4%) |
| Total | 286 (100.0%) | 68 (100.0%) |
Housing Structure by Heating Type in Whitewood
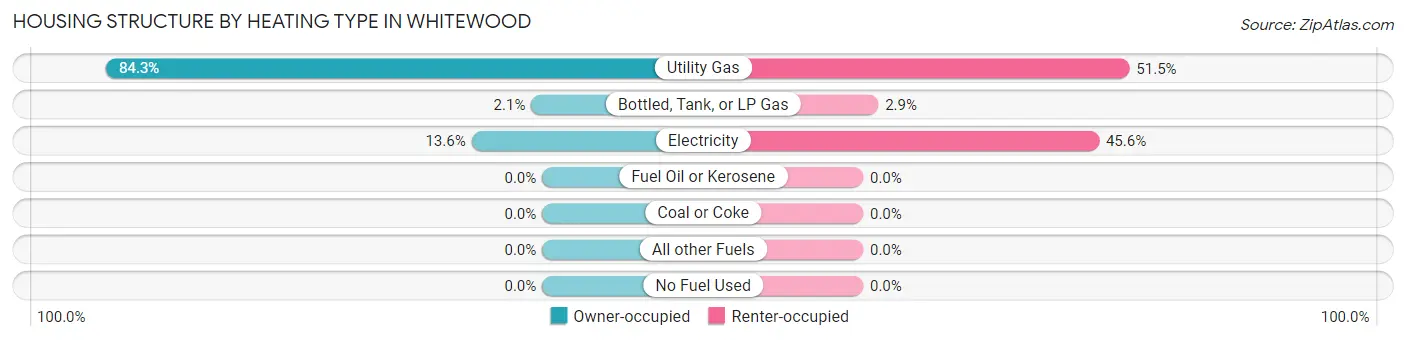
| Heating Type | Owner-occupied | Renter-occupied |
| Utility Gas | 241 (84.3%) | 35 (51.5%) |
| Bottled, Tank, or LP Gas | 6 (2.1%) | 2 (2.9%) |
| Electricity | 39 (13.6%) | 31 (45.6%) |
| Fuel Oil or Kerosene | 0 (0.0%) | 0 (0.0%) |
| Coal or Coke | 0 (0.0%) | 0 (0.0%) |
| All other Fuels | 0 (0.0%) | 0 (0.0%) |
| No Fuel Used | 0 (0.0%) | 0 (0.0%) |
| Total | 286 (100.0%) | 68 (100.0%) |
Household Vehicle Usage in Whitewood
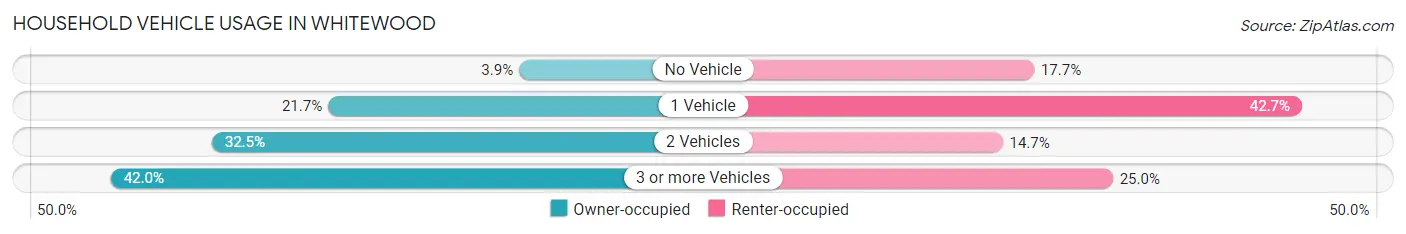
| Vehicles per Household | Owner-occupied | Renter-occupied |
| No Vehicle | 11 (3.8%) | 12 (17.6%) |
| 1 Vehicle | 62 (21.7%) | 29 (42.6%) |
| 2 Vehicles | 93 (32.5%) | 10 (14.7%) |
| 3 or more Vehicles | 120 (42.0%) | 17 (25.0%) |
| Total | 286 (100.0%) | 68 (100.0%) |
Real Estate & Mortgages in Whitewood
Real Estate and Mortgage Overview in Whitewood
| Characteristic | Without Mortgage | With Mortgage |
| Housing Units | 156 | 130 |
| Median Property Value | - | - |
| Median Household Income | $61,500 | $15 |
| Monthly Housing Costs | $456 | $3 |
| Real Estate Taxes | $871 | $0 |
Property Value by Mortgage Status in Whitewood
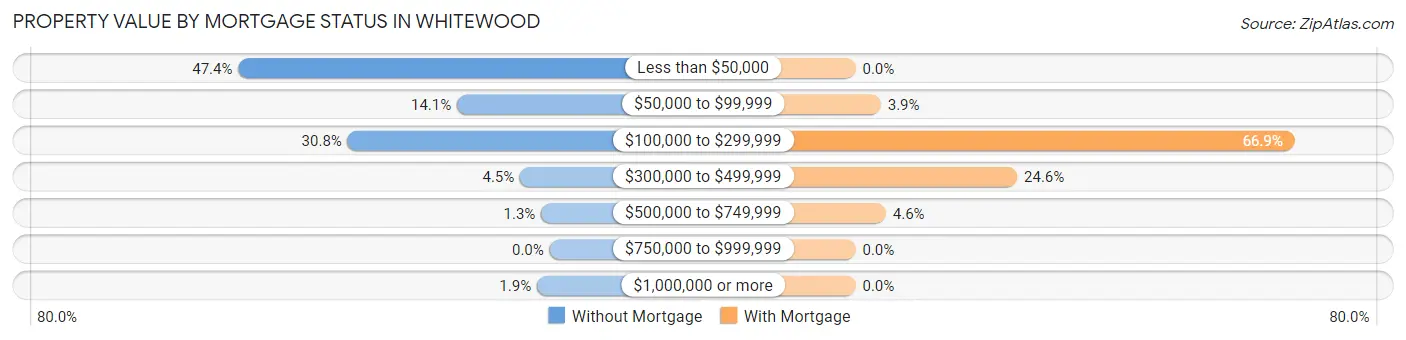
| Property Value | Without Mortgage | With Mortgage |
| Less than $50,000 | 74 (47.4%) | 0 (0.0%) |
| $50,000 to $99,999 | 22 (14.1%) | 5 (3.8%) |
| $100,000 to $299,999 | 48 (30.8%) | 87 (66.9%) |
| $300,000 to $499,999 | 7 (4.5%) | 32 (24.6%) |
| $500,000 to $749,999 | 2 (1.3%) | 6 (4.6%) |
| $750,000 to $999,999 | 0 (0.0%) | 0 (0.0%) |
| $1,000,000 or more | 3 (1.9%) | 0 (0.0%) |
| Total | 156 (100.0%) | 130 (100.0%) |
Household Income by Mortgage Status in Whitewood
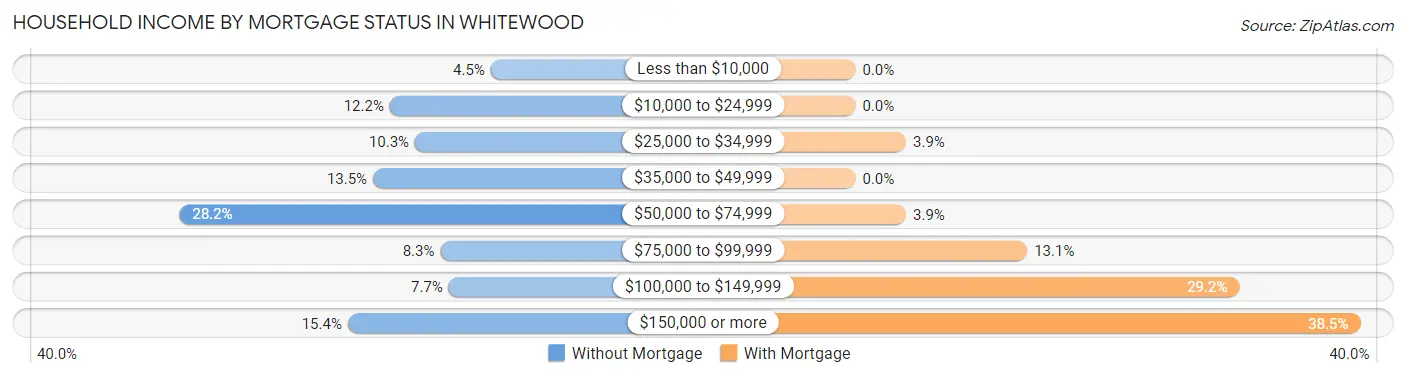
| Household Income | Without Mortgage | With Mortgage |
| Less than $10,000 | 7 (4.5%) | 0 (0.0%) |
| $10,000 to $24,999 | 19 (12.2%) | 0 (0.0%) |
| $25,000 to $34,999 | 16 (10.3%) | 5 (3.8%) |
| $35,000 to $49,999 | 21 (13.5%) | 0 (0.0%) |
| $50,000 to $74,999 | 44 (28.2%) | 5 (3.8%) |
| $75,000 to $99,999 | 13 (8.3%) | 17 (13.1%) |
| $100,000 to $149,999 | 12 (7.7%) | 38 (29.2%) |
| $150,000 or more | 24 (15.4%) | 50 (38.5%) |
| Total | 156 (100.0%) | 130 (100.0%) |
Property Value to Household Income Ratio in Whitewood
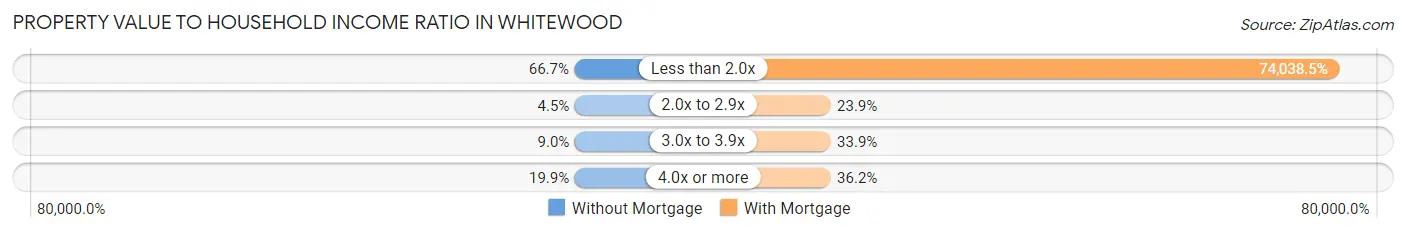
| Value-to-Income Ratio | Without Mortgage | With Mortgage |
| Less than 2.0x | 104 (66.7%) | 96,250 (74,038.5%) |
| 2.0x to 2.9x | 7 (4.5%) | 31 (23.8%) |
| 3.0x to 3.9x | 14 (9.0%) | 44 (33.9%) |
| 4.0x or more | 31 (19.9%) | 47 (36.1%) |
| Total | 156 (100.0%) | 130 (100.0%) |
Real Estate Taxes by Mortgage Status in Whitewood
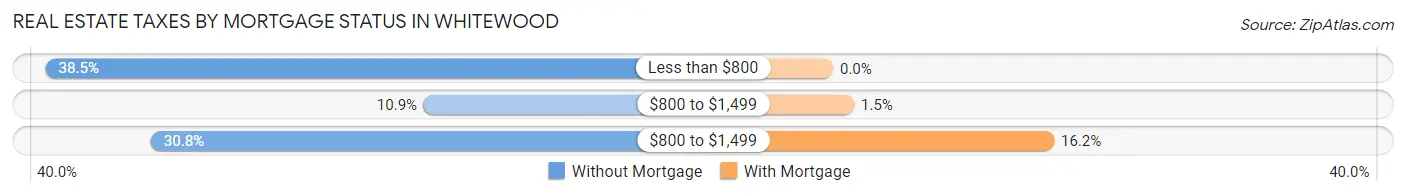
| Property Taxes | Without Mortgage | With Mortgage |
| Less than $800 | 60 (38.5%) | 0 (0.0%) |
| $800 to $1,499 | 17 (10.9%) | 2 (1.5%) |
| $800 to $1,499 | 48 (30.8%) | 21 (16.2%) |
| Total | 156 (100.0%) | 130 (100.0%) |
Health & Disability in Whitewood
Health Insurance Coverage by Age in Whitewood
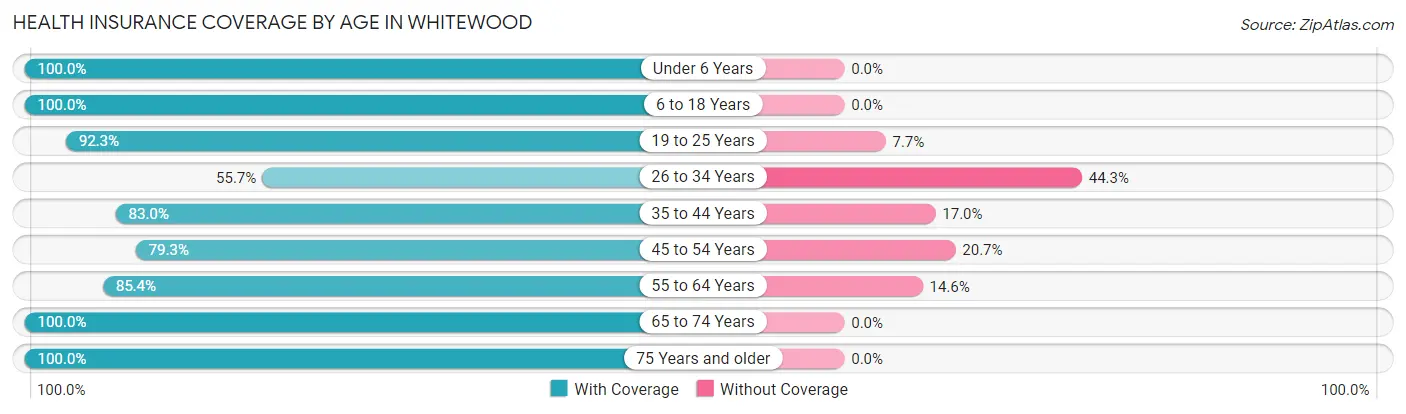
| Age Bracket | With Coverage | Without Coverage |
| Under 6 Years | 58 (100.0%) | 0 (0.0%) |
| 6 to 18 Years | 133 (100.0%) | 0 (0.0%) |
| 19 to 25 Years | 36 (92.3%) | 3 (7.7%) |
| 26 to 34 Years | 39 (55.7%) | 31 (44.3%) |
| 35 to 44 Years | 88 (83.0%) | 18 (17.0%) |
| 45 to 54 Years | 111 (79.3%) | 29 (20.7%) |
| 55 to 64 Years | 199 (85.4%) | 34 (14.6%) |
| 65 to 74 Years | 60 (100.0%) | 0 (0.0%) |
| 75 Years and older | 36 (100.0%) | 0 (0.0%) |
| Total | 760 (86.9%) | 115 (13.1%) |
Health Insurance Coverage by Citizenship Status in Whitewood
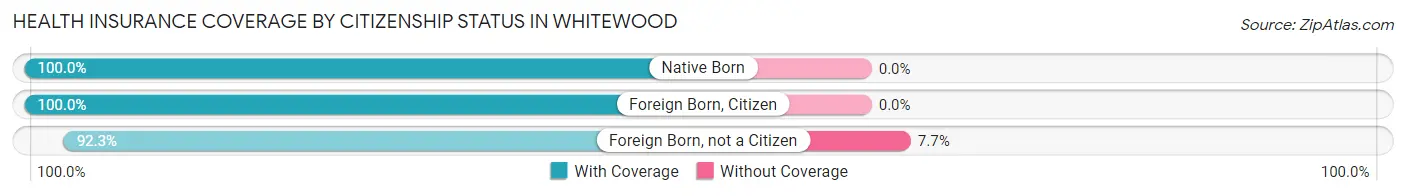
| Citizenship Status | With Coverage | Without Coverage |
| Native Born | 58 (100.0%) | 0 (0.0%) |
| Foreign Born, Citizen | 133 (100.0%) | 0 (0.0%) |
| Foreign Born, not a Citizen | 36 (92.3%) | 3 (7.7%) |
Health Insurance Coverage by Household Income in Whitewood
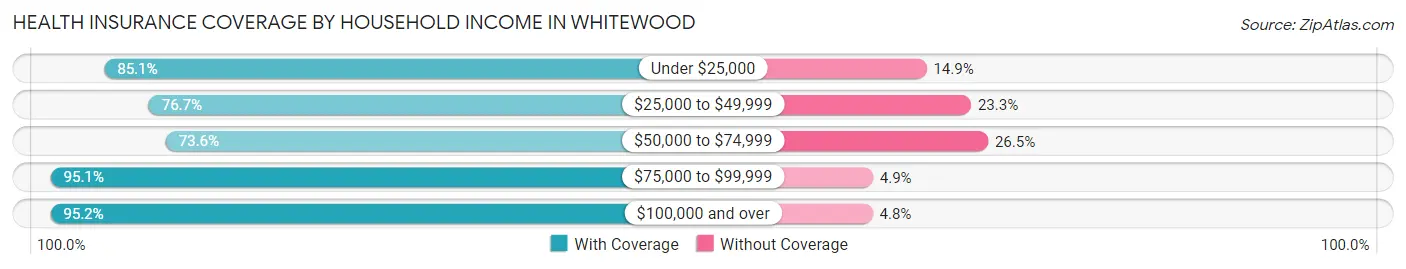
| Household Income | With Coverage | Without Coverage |
| Under $25,000 | 57 (85.1%) | 10 (14.9%) |
| $25,000 to $49,999 | 122 (76.7%) | 37 (23.3%) |
| $50,000 to $74,999 | 114 (73.6%) | 41 (26.5%) |
| $75,000 to $99,999 | 117 (95.1%) | 6 (4.9%) |
| $100,000 and over | 335 (95.2%) | 17 (4.8%) |
Public vs Private Health Insurance Coverage by Age in Whitewood
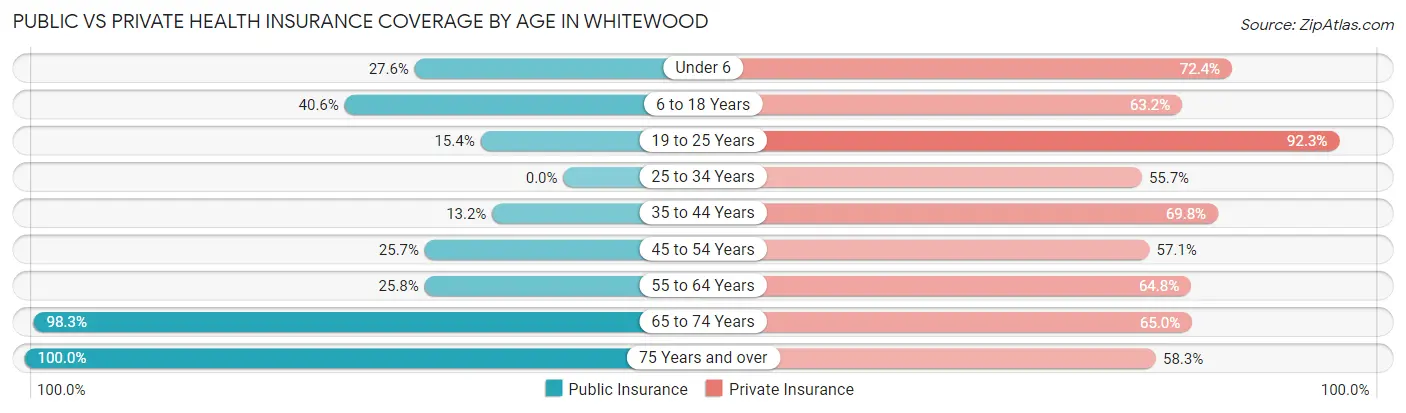
| Age Bracket | Public Insurance | Private Insurance |
| Under 6 | 16 (27.6%) | 42 (72.4%) |
| 6 to 18 Years | 54 (40.6%) | 84 (63.2%) |
| 19 to 25 Years | 6 (15.4%) | 36 (92.3%) |
| 25 to 34 Years | 0 (0.0%) | 39 (55.7%) |
| 35 to 44 Years | 14 (13.2%) | 74 (69.8%) |
| 45 to 54 Years | 36 (25.7%) | 80 (57.1%) |
| 55 to 64 Years | 60 (25.8%) | 151 (64.8%) |
| 65 to 74 Years | 59 (98.3%) | 39 (65.0%) |
| 75 Years and over | 36 (100.0%) | 21 (58.3%) |
| Total | 281 (32.1%) | 566 (64.7%) |
Disability Status by Sex by Age in Whitewood
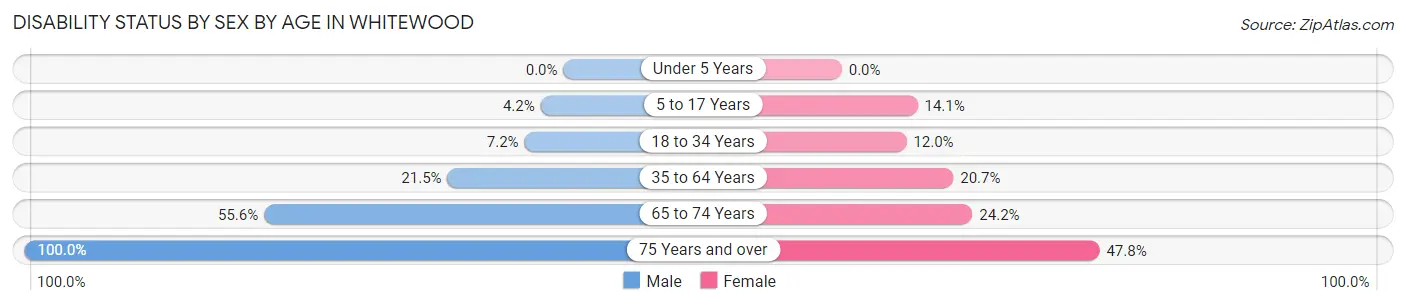
| Age Bracket | Male | Female |
| Under 5 Years | 0 (0.0%) | 0 (0.0%) |
| 5 to 17 Years | 3 (4.2%) | 9 (14.1%) |
| 18 to 34 Years | 6 (7.2%) | 6 (12.0%) |
| 35 to 64 Years | 48 (21.5%) | 53 (20.7%) |
| 65 to 74 Years | 15 (55.6%) | 8 (24.2%) |
| 75 Years and over | 13 (100.0%) | 11 (47.8%) |
Disability Class by Sex by Age in Whitewood
Disability Class: Hearing Difficulty
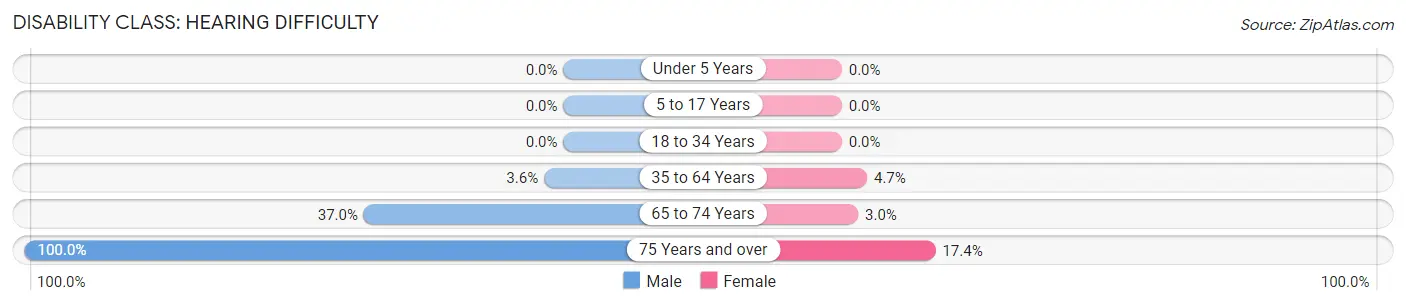
| Age Bracket | Male | Female |
| Under 5 Years | 0 (0.0%) | 0 (0.0%) |
| 5 to 17 Years | 0 (0.0%) | 0 (0.0%) |
| 18 to 34 Years | 0 (0.0%) | 0 (0.0%) |
| 35 to 64 Years | 8 (3.6%) | 12 (4.7%) |
| 65 to 74 Years | 10 (37.0%) | 1 (3.0%) |
| 75 Years and over | 13 (100.0%) | 4 (17.4%) |
Disability Class: Vision Difficulty
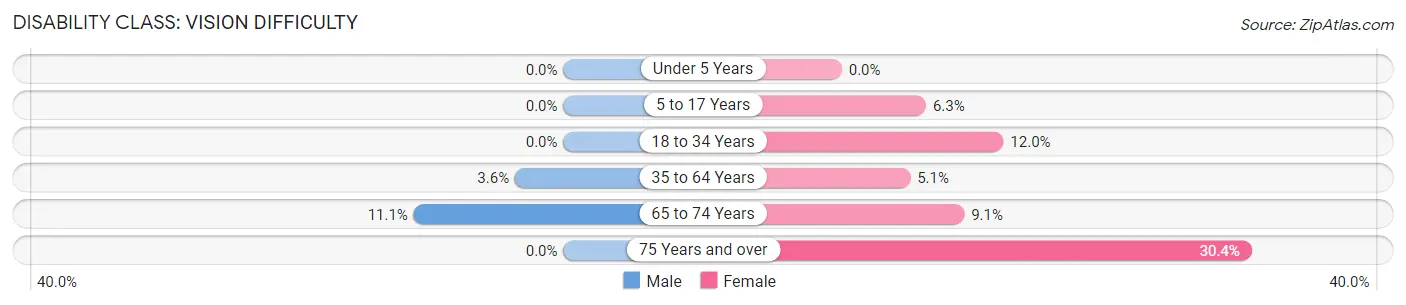
| Age Bracket | Male | Female |
| Under 5 Years | 0 (0.0%) | 0 (0.0%) |
| 5 to 17 Years | 0 (0.0%) | 4 (6.2%) |
| 18 to 34 Years | 0 (0.0%) | 6 (12.0%) |
| 35 to 64 Years | 8 (3.6%) | 13 (5.1%) |
| 65 to 74 Years | 3 (11.1%) | 3 (9.1%) |
| 75 Years and over | 0 (0.0%) | 7 (30.4%) |
Disability Class: Cognitive Difficulty
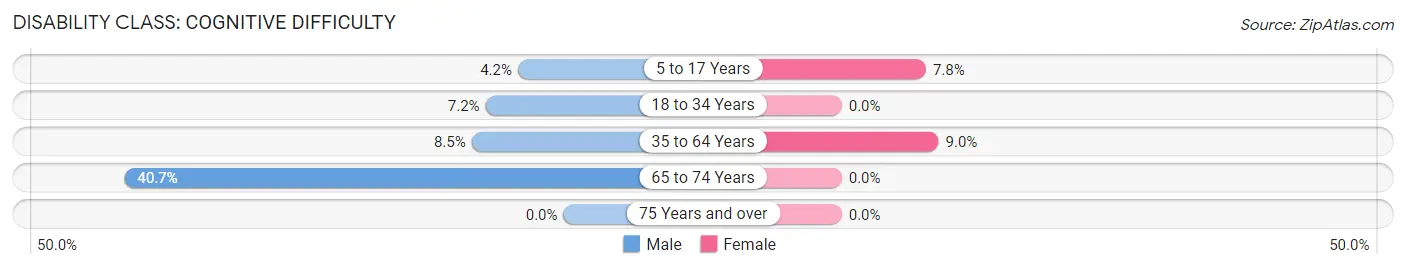
| Age Bracket | Male | Female |
| 5 to 17 Years | 3 (4.2%) | 5 (7.8%) |
| 18 to 34 Years | 6 (7.2%) | 0 (0.0%) |
| 35 to 64 Years | 19 (8.5%) | 23 (9.0%) |
| 65 to 74 Years | 11 (40.7%) | 0 (0.0%) |
| 75 Years and over | 0 (0.0%) | 0 (0.0%) |
Disability Class: Ambulatory Difficulty
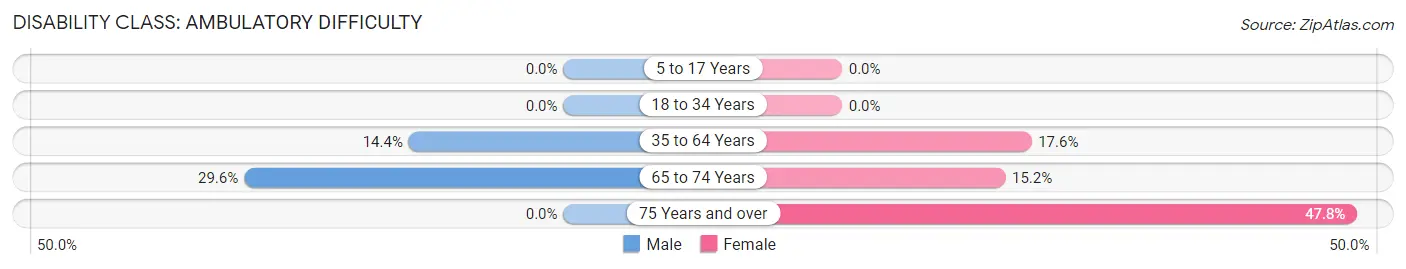
| Age Bracket | Male | Female |
| 5 to 17 Years | 0 (0.0%) | 0 (0.0%) |
| 18 to 34 Years | 0 (0.0%) | 0 (0.0%) |
| 35 to 64 Years | 32 (14.3%) | 45 (17.6%) |
| 65 to 74 Years | 8 (29.6%) | 5 (15.1%) |
| 75 Years and over | 0 (0.0%) | 11 (47.8%) |
Disability Class: Self-Care Difficulty
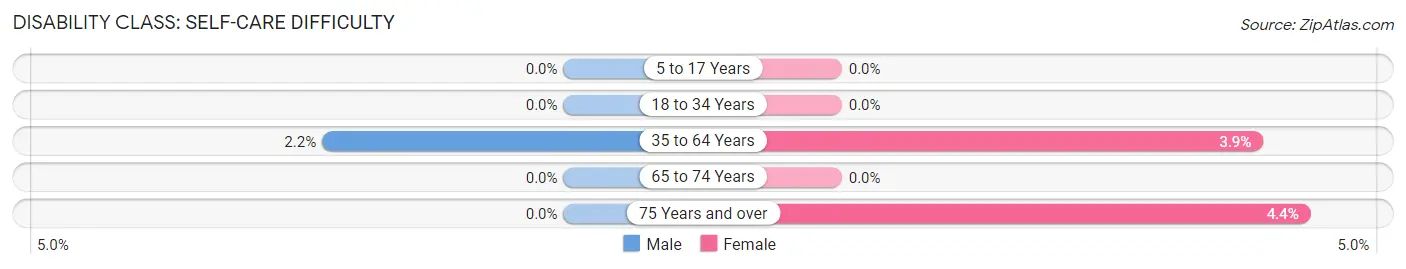
| Age Bracket | Male | Female |
| 5 to 17 Years | 0 (0.0%) | 0 (0.0%) |
| 18 to 34 Years | 0 (0.0%) | 0 (0.0%) |
| 35 to 64 Years | 5 (2.2%) | 10 (3.9%) |
| 65 to 74 Years | 0 (0.0%) | 0 (0.0%) |
| 75 Years and over | 0 (0.0%) | 1 (4.3%) |
Technology Access in Whitewood
Computing Device Access in Whitewood
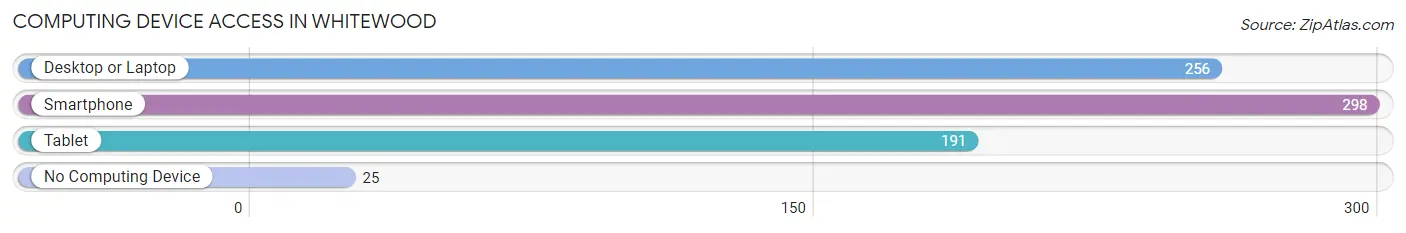
| Device Type | # Households | % Households |
| Desktop or Laptop | 256 | 72.3% |
| Smartphone | 298 | 84.2% |
| Tablet | 191 | 53.9% |
| No Computing Device | 25 | 7.1% |
| Total | 354 | 100.0% |
Internet Access in Whitewood
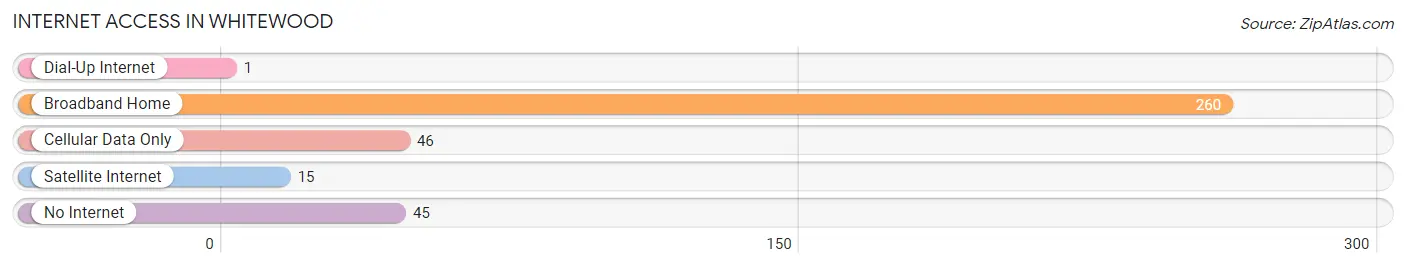
| Internet Type | # Households | % Households |
| Dial-Up Internet | 1 | 0.3% |
| Broadband Home | 260 | 73.5% |
| Cellular Data Only | 46 | 13.0% |
| Satellite Internet | 15 | 4.2% |
| No Internet | 45 | 12.7% |
| Total | 354 | 100.0% |
Whitewood Summary
WhiteWood, South Dakota is a small town located in the southeastern corner of the state. It is situated in the Black Hills region, and is home to a population of just over 1,000 people. The town is known for its rich history, beautiful scenery, and vibrant economy.
History
WhiteWood was founded in 1876 by a group of settlers from the Midwest. The town was named after the white wood that was used to build the first homes in the area. The settlers were attracted to the area due to its abundance of natural resources, including timber, coal, and gold. The town quickly grew and became a hub for the mining industry. In the late 1800s, WhiteWood was home to several large mines, including the WhiteWood Mine, which was the largest gold mine in the state.
The town also became a popular tourist destination due to its proximity to the Black Hills National Forest. In the early 1900s, WhiteWood was home to several resorts, including the WhiteWood Hotel and the WhiteWood Inn. The town also had a thriving business district, with several stores, restaurants, and other businesses.
Geography
WhiteWood is located in the southeastern corner of South Dakota, in the Black Hills region. The town is situated at an elevation of 4,500 feet, and is surrounded by rolling hills and forests. The town is located near several major highways, including Interstate 90 and US Highway 16. The nearest major city is Rapid City, which is located about 40 miles to the west.
The climate in WhiteWood is semi-arid, with hot summers and cold winters. The average annual temperature is around 50 degrees Fahrenheit, and the average annual precipitation is around 18 inches.
Economy
WhiteWood’s economy is largely based on tourism and the mining industry. The town is home to several tourist attractions, including the WhiteWood Mine, which is a popular destination for visitors. The town also has several restaurants, stores, and other businesses that cater to tourists.
The mining industry is also an important part of the local economy. The WhiteWood Mine is still in operation, and is one of the largest gold mines in the state. The town also has several other smaller mines, which produce coal, copper, and other minerals.
Demographics
As of the 2010 census, WhiteWood had a population of 1,072 people. The racial makeup of the town was 97.3% White, 0.7% Native American, 0.3% Asian, 0.2% from other races, and 1.5% from two or more races. The median household income was $37,500, and the median family income was $45,000.
WhiteWood is a small town with a rich history and a vibrant economy. The town is home to several tourist attractions, and is a popular destination for visitors. The town also has a thriving mining industry, which is an important part of the local economy. The town has a diverse population, and is a great place to live and work.
Common Questions
What is Per Capita Income in Whitewood?
Per Capita income in Whitewood is $37,421.
What is the Median Family Income in Whitewood?
Median Family Income in Whitewood is $80,156.
What is the Median Household income in Whitewood?
Median Household Income in Whitewood is $70,000.
What is Income or Wage Gap in Whitewood?
Income or Wage Gap in Whitewood is 14.7%.
Women in Whitewood earn 85.3 cents for every dollar earned by a man.
What is Inequality or Gini Index in Whitewood?
Inequality or Gini Index in Whitewood is 0.45.
What is the Total Population of Whitewood?
Total Population of Whitewood is 875.
What is the Total Male Population of Whitewood?
Total Male Population of Whitewood is 435.
What is the Total Female Population of Whitewood?
Total Female Population of Whitewood is 440.
What is the Ratio of Males per 100 Females in Whitewood?
There are 98.86 Males per 100 Females in Whitewood.
What is the Ratio of Females per 100 Males in Whitewood?
There are 101.15 Females per 100 Males in Whitewood.
What is the Median Population Age in Whitewood?
Median Population Age in Whitewood is 47.2 Years.
What is the Average Family Size in Whitewood
Average Family Size in Whitewood is 3.1 People.
What is the Average Household Size in Whitewood
Average Household Size in Whitewood is 2.4 People.
How Large is the Labor Force in Whitewood?
There are 562 People in the Labor Forcein in Whitewood.
What is the Percentage of People in the Labor Force in Whitewood?
74.9% of People are in the Labor Force in Whitewood.
What is the Unemployment Rate in Whitewood?
Unemployment Rate in Whitewood is 6.6%.