Volga, SD Map & Demographics
Volga Map
Volga Overview
$32,236
PER CAPITA INCOME
$92,188
AVG FAMILY INCOME
$66,285
AVG HOUSEHOLD INCOME
27.9%
WAGE / INCOME GAP [ % ]
72.1¢/ $1
WAGE / INCOME GAP [ $ ]
0.33
INEQUALITY / GINI INDEX
2,043
TOTAL POPULATION
977
MALE POPULATION
1,066
FEMALE POPULATION
91.65
MALES / 100 FEMALES
109.11
FEMALES / 100 MALES
27.9
MEDIAN AGE
3.1
AVG FAMILY SIZE
2.4
AVG HOUSEHOLD SIZE
1,171
LABOR FORCE [ PEOPLE ]
74.7%
PERCENT IN LABOR FORCE
1.1%
UNEMPLOYMENT RATE
Volga Zip Codes
Volga Area Codes
Income in Volga
Income Overview in Volga
Per Capita Income in Volga is $32,236, while median incomes of families and households are $92,188 and $66,285 respectively.
| Characteristic | Number | Measure |
| Per Capita Income | 2,043 | $32,236 |
| Median Family Income | 454 | $92,188 |
| Mean Family Income | 454 | $92,237 |
| Median Household Income | 867 | $66,285 |
| Mean Household Income | 867 | $75,607 |
| Income Deficit | 454 | $0 |
| Wage / Income Gap (%) | 2,043 | 27.88% |
| Wage / Income Gap ($) | 2,043 | 72.12¢ per $1 |
| Gini / Inequality Index | 2,043 | 0.33 |
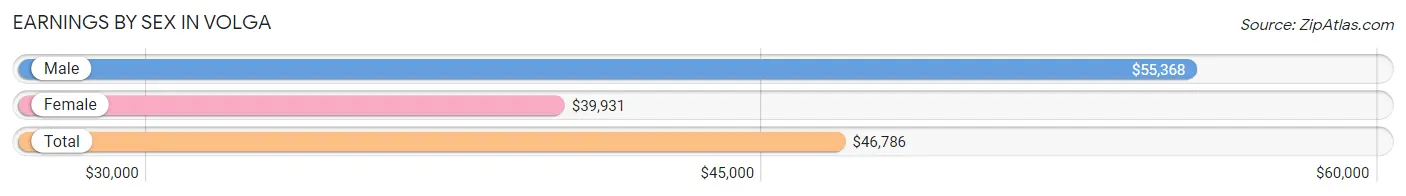
Earnings by Sex in Volga
Average Earnings in Volga are $46,786, $55,368 for men and $39,931 for women, a difference of 27.9%.
| Sex | Number | Average Earnings |
| Male | 603 (49.3%) | $55,368 |
| Female | 621 (50.7%) | $39,931 |
| Total | 1,224 (100.0%) | $46,786 |
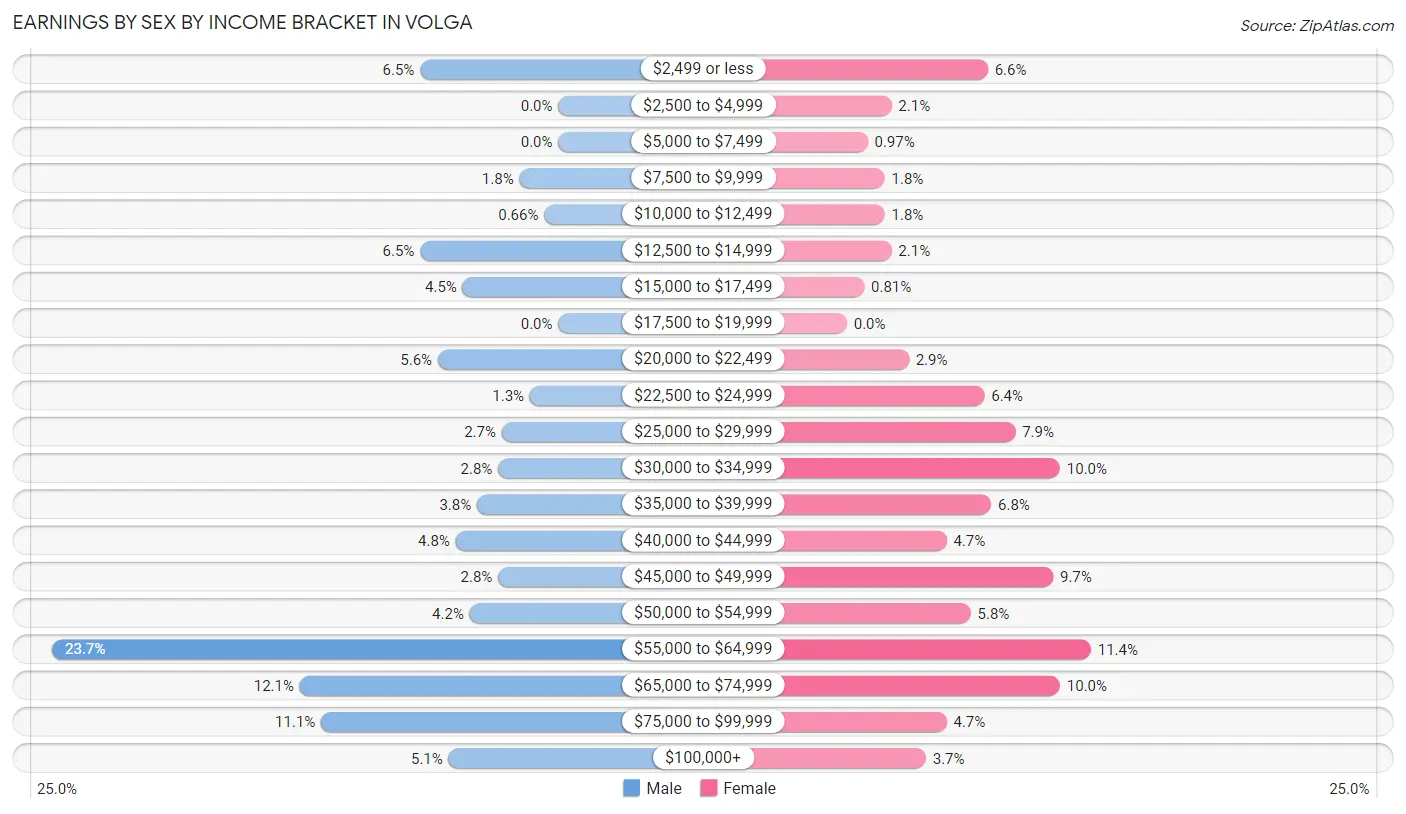
Earnings by Sex by Income Bracket in Volga
The most common earnings brackets in Volga are $55,000 to $64,999 for men (143 | 23.7%) and $55,000 to $64,999 for women (71 | 11.4%).
| Income | Male | Female |
| $2,499 or less | 39 (6.5%) | 41 (6.6%) |
| $2,500 to $4,999 | 0 (0.0%) | 13 (2.1%) |
| $5,000 to $7,499 | 0 (0.0%) | 6 (1.0%) |
| $7,500 to $9,999 | 11 (1.8%) | 11 (1.8%) |
| $10,000 to $12,499 | 4 (0.7%) | 11 (1.8%) |
| $12,500 to $14,999 | 39 (6.5%) | 13 (2.1%) |
| $15,000 to $17,499 | 27 (4.5%) | 5 (0.8%) |
| $17,500 to $19,999 | 0 (0.0%) | 0 (0.0%) |
| $20,000 to $22,499 | 34 (5.6%) | 18 (2.9%) |
| $22,500 to $24,999 | 8 (1.3%) | 40 (6.4%) |
| $25,000 to $29,999 | 16 (2.6%) | 49 (7.9%) |
| $30,000 to $34,999 | 17 (2.8%) | 62 (10.0%) |
| $35,000 to $39,999 | 23 (3.8%) | 42 (6.8%) |
| $40,000 to $44,999 | 29 (4.8%) | 29 (4.7%) |
| $45,000 to $49,999 | 17 (2.8%) | 60 (9.7%) |
| $50,000 to $54,999 | 25 (4.2%) | 36 (5.8%) |
| $55,000 to $64,999 | 143 (23.7%) | 71 (11.4%) |
| $65,000 to $74,999 | 73 (12.1%) | 62 (10.0%) |
| $75,000 to $99,999 | 67 (11.1%) | 29 (4.7%) |
| $100,000+ | 31 (5.1%) | 23 (3.7%) |
| Total | 603 (100.0%) | 621 (100.0%) |
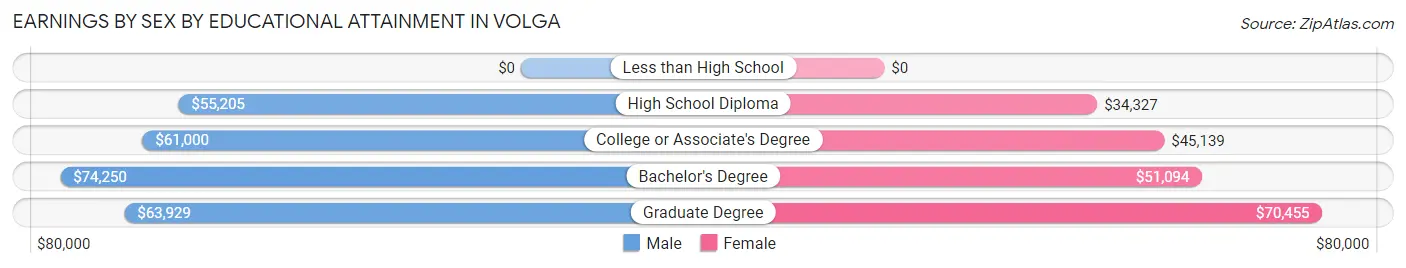
Earnings by Sex by Educational Attainment in Volga
Average earnings in Volga are $57,355 for men and $45,893 for women, a difference of 20.0%. Men with an educational attainment of bachelor's degree enjoy the highest average annual earnings of $74,250, while those with high school diploma education earn the least with $55,205. Women with an educational attainment of graduate degree earn the most with the average annual earnings of $70,455, while those with high school diploma education have the smallest earnings of $34,327.
| Educational Attainment | Male Income | Female Income |
| Less than High School | - | - |
| High School Diploma | $55,205 | $34,327 |
| College or Associate's Degree | $61,000 | $45,139 |
| Bachelor's Degree | $74,250 | $51,094 |
| Graduate Degree | $63,929 | $70,455 |
| Total | $57,355 | $45,893 |
Family Income in Volga
Family Income Brackets in Volga
According to the Volga family income data, there are 133 families falling into the $100,000 to $149,999 income range, which is the most common income bracket and makes up 29.3% of all families.
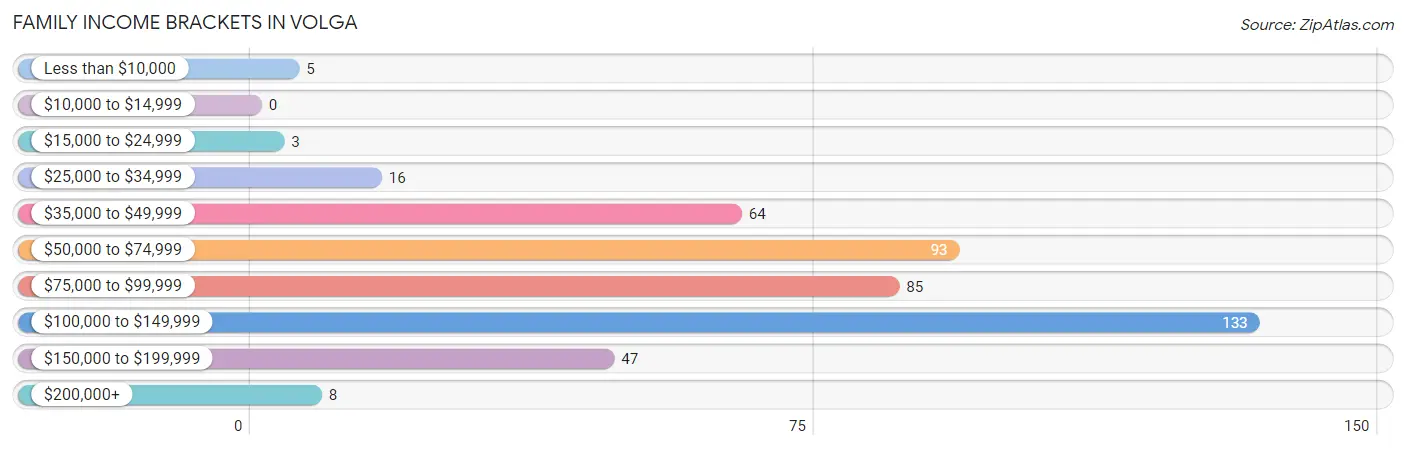
| Income Bracket | # Families | % Families |
| Less than $10,000 | 5 | 1.1% |
| $10,000 to $14,999 | 0 | 0.0% |
| $15,000 to $24,999 | 3 | 0.7% |
| $25,000 to $34,999 | 16 | 3.5% |
| $35,000 to $49,999 | 64 | 14.1% |
| $50,000 to $74,999 | 93 | 20.5% |
| $75,000 to $99,999 | 85 | 18.7% |
| $100,000 to $149,999 | 133 | 29.3% |
| $150,000 to $199,999 | 47 | 10.4% |
| $200,000+ | 8 | 1.8% |
Family Income by Famaliy Size in Volga
4-person families (81 | 17.8%) account for the highest median family income in Volga with $113,854 per family, while 2-person families (255 | 56.2%) have the highest median income of $41,320 per family member.
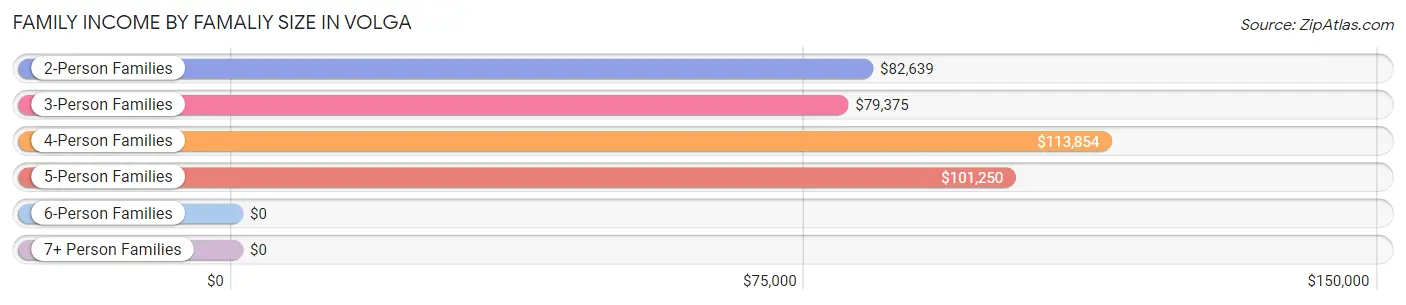
| Income Bracket | # Families | Median Income |
| 2-Person Families | 255 (56.2%) | $82,639 |
| 3-Person Families | 61 (13.4%) | $79,375 |
| 4-Person Families | 81 (17.8%) | $113,854 |
| 5-Person Families | 34 (7.5%) | $101,250 |
| 6-Person Families | 18 (4.0%) | $0 |
| 7+ Person Families | 5 (1.1%) | $0 |
| Total | 454 (100.0%) | $92,188 |
Family Income by Number of Earners in Volga
The median family income in Volga is $92,188, with families comprising 3+ earners (57) having the highest median family income of $120,313, while families with no earners (49) have the lowest median family income of $53,750, accounting for 12.6% and 10.8% of families, respectively.
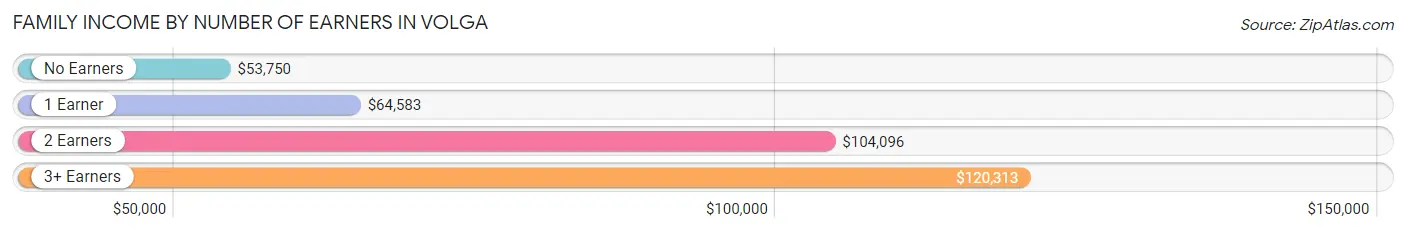
| Number of Earners | # Families | Median Income |
| No Earners | 49 (10.8%) | $53,750 |
| 1 Earner | 122 (26.9%) | $64,583 |
| 2 Earners | 226 (49.8%) | $104,096 |
| 3+ Earners | 57 (12.6%) | $120,313 |
| Total | 454 (100.0%) | $92,188 |
Household Income in Volga
Household Income Brackets in Volga
With 230 households falling in the category, the $50,000 to $74,999 income range is the most frequent in Volga, accounting for 26.5% of all households. In contrast, only 8 households (0.9%) fall into the $200,000+ income bracket, making it the least populous group.
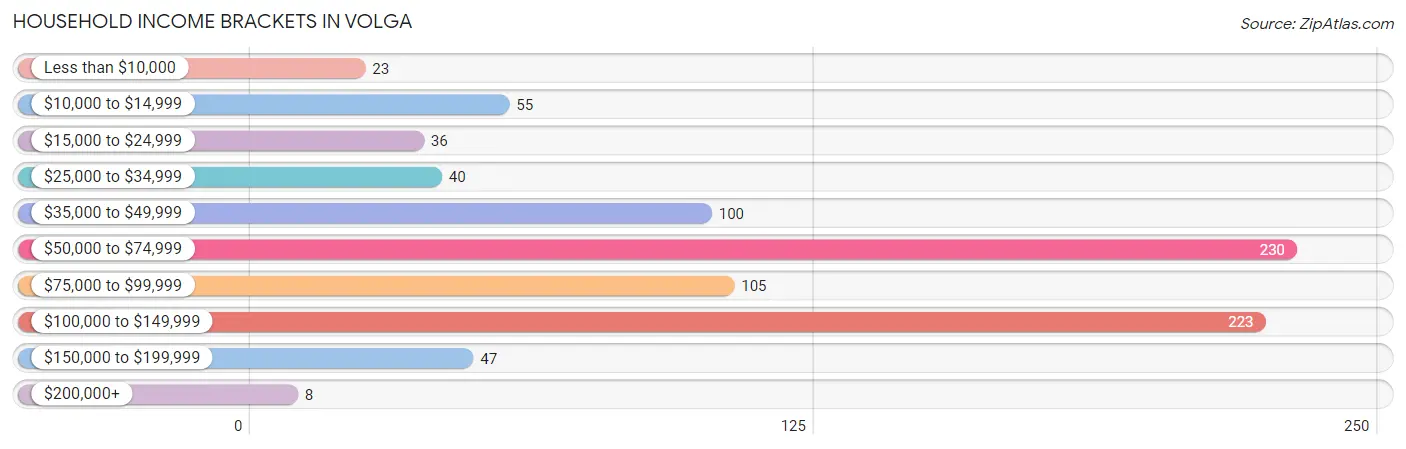
| Income Bracket | # Households | % Households |
| Less than $10,000 | 23 | 2.7% |
| $10,000 to $14,999 | 55 | 6.3% |
| $15,000 to $24,999 | 36 | 4.2% |
| $25,000 to $34,999 | 40 | 4.6% |
| $35,000 to $49,999 | 100 | 11.5% |
| $50,000 to $74,999 | 230 | 26.5% |
| $75,000 to $99,999 | 105 | 12.1% |
| $100,000 to $149,999 | 223 | 25.7% |
| $150,000 to $199,999 | 47 | 5.4% |
| $200,000+ | 8 | 0.9% |
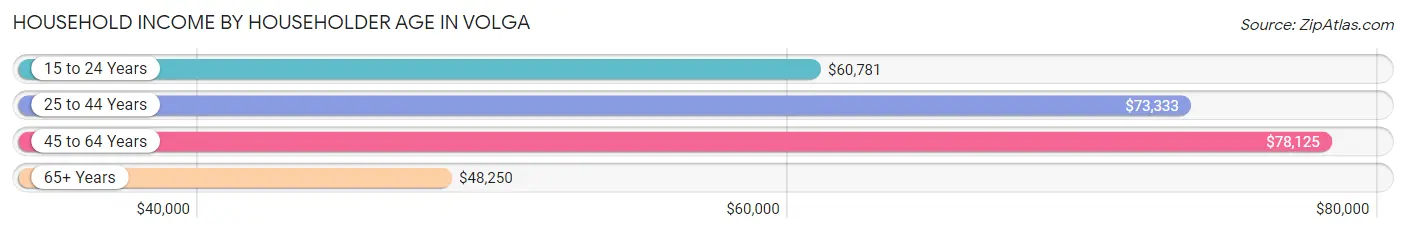
Household Income by Householder Age in Volga
The median household income in Volga is $66,285, with the highest median household income of $78,125 found in the 45 to 64 years age bracket for the primary householder. A total of 185 households (21.3%) fall into this category. Meanwhile, the 65+ years age bracket for the primary householder has the lowest median household income of $48,250, with 173 households (20.0%) in this group.
| Income Bracket | # Households | Median Income |
| 15 to 24 Years | 153 (17.6%) | $60,781 |
| 25 to 44 Years | 356 (41.1%) | $73,333 |
| 45 to 64 Years | 185 (21.3%) | $78,125 |
| 65+ Years | 173 (20.0%) | $48,250 |
| Total | 867 (100.0%) | $66,285 |
Poverty in Volga
Income Below Poverty by Sex and Age in Volga
With 6.7% poverty level for males and 10.7% for females among the residents of Volga, 18 to 24 year old males and 25 to 34 year old females are the most vulnerable to poverty, with 47 males (36.1%) and 79 females (38.7%) in their respective age groups living below the poverty level.
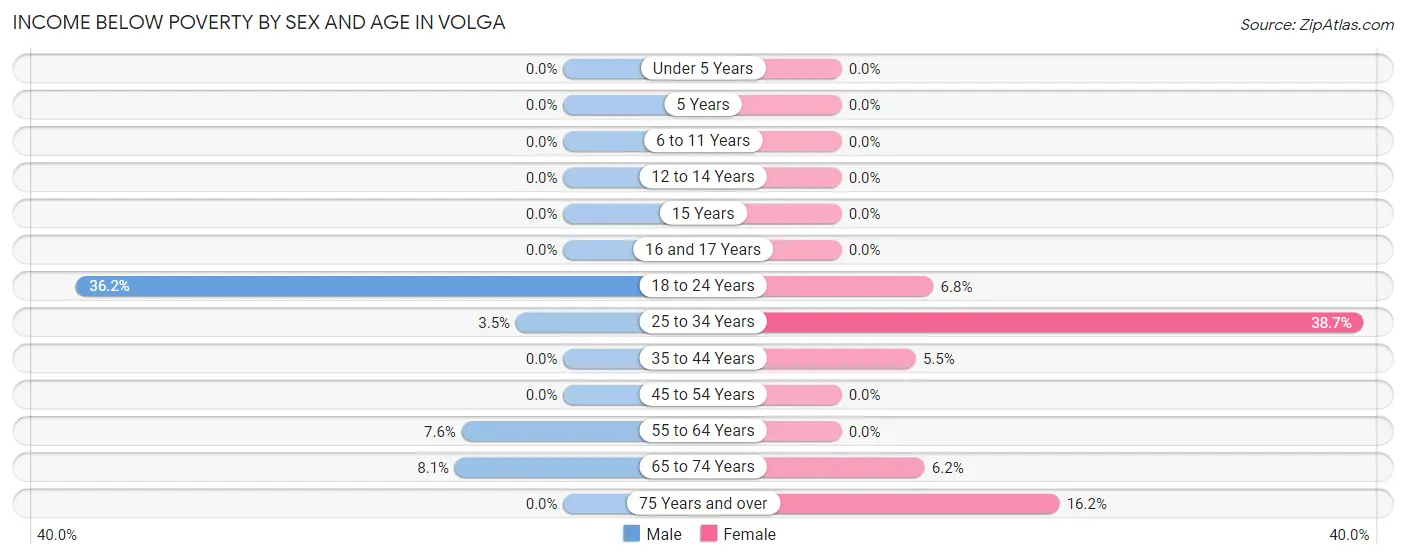
| Age Bracket | Male | Female |
| Under 5 Years | 0 (0.0%) | 0 (0.0%) |
| 5 Years | 0 (0.0%) | 0 (0.0%) |
| 6 to 11 Years | 0 (0.0%) | 0 (0.0%) |
| 12 to 14 Years | 0 (0.0%) | 0 (0.0%) |
| 15 Years | 0 (0.0%) | 0 (0.0%) |
| 16 and 17 Years | 0 (0.0%) | 0 (0.0%) |
| 18 to 24 Years | 47 (36.1%) | 12 (6.8%) |
| 25 to 34 Years | 7 (3.5%) | 79 (38.7%) |
| 35 to 44 Years | 0 (0.0%) | 7 (5.5%) |
| 45 to 54 Years | 0 (0.0%) | 0 (0.0%) |
| 55 to 64 Years | 4 (7.5%) | 0 (0.0%) |
| 65 to 74 Years | 7 (8.1%) | 5 (6.2%) |
| 75 Years and over | 0 (0.0%) | 11 (16.2%) |
| Total | 65 (6.7%) | 114 (10.7%) |
Income Above Poverty by Sex and Age in Volga
According to the poverty statistics in Volga, males aged under 5 years and females aged under 5 years are the age groups that are most secure financially, with 100.0% of males and 100.0% of females in these age groups living above the poverty line.
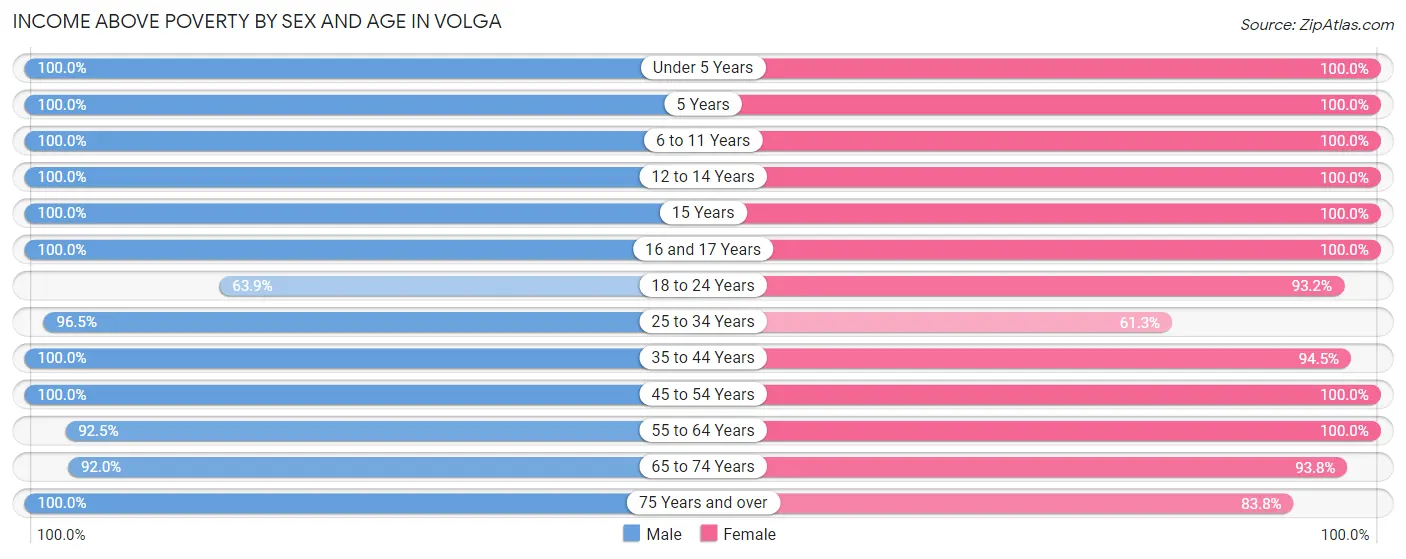
| Age Bracket | Male | Female |
| Under 5 Years | 79 (100.0%) | 74 (100.0%) |
| 5 Years | 25 (100.0%) | 39 (100.0%) |
| 6 to 11 Years | 71 (100.0%) | 67 (100.0%) |
| 12 to 14 Years | 31 (100.0%) | 34 (100.0%) |
| 15 Years | 41 (100.0%) | 6 (100.0%) |
| 16 and 17 Years | 21 (100.0%) | 11 (100.0%) |
| 18 to 24 Years | 83 (63.8%) | 164 (93.2%) |
| 25 to 34 Years | 192 (96.5%) | 125 (61.3%) |
| 35 to 44 Years | 141 (100.0%) | 120 (94.5%) |
| 45 to 54 Years | 60 (100.0%) | 62 (100.0%) |
| 55 to 64 Years | 49 (92.4%) | 117 (100.0%) |
| 65 to 74 Years | 80 (91.9%) | 76 (93.8%) |
| 75 Years and over | 31 (100.0%) | 57 (83.8%) |
| Total | 904 (93.3%) | 952 (89.3%) |
Income Below Poverty Among Married-Couple Families in Volga
The poverty statistics for married-couple families in Volga show that 1.4% or 5 of the total 350 families live below the poverty line. Families with no children have the highest poverty rate of 2.3%, comprising of 5 families. On the other hand, families with 1 or 2 children have the lowest poverty rate of 0.0%, which includes 0 families.
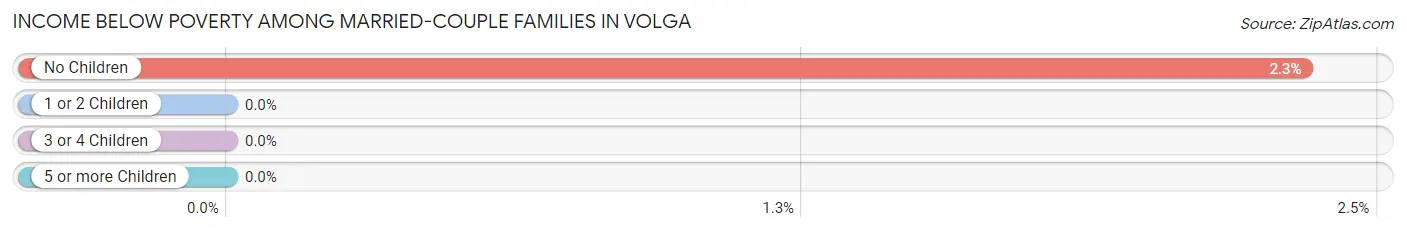
| Children | Above Poverty | Below Poverty |
| No Children | 209 (97.7%) | 5 (2.3%) |
| 1 or 2 Children | 79 (100.0%) | 0 (0.0%) |
| 3 or 4 Children | 57 (100.0%) | 0 (0.0%) |
| 5 or more Children | 0 (0.0%) | 0 (0.0%) |
| Total | 345 (98.6%) | 5 (1.4%) |
Income Below Poverty Among Single-Parent Households in Volga
| Children | Single Father | Single Mother |
| No Children | 0 (0.0%) | 0 (0.0%) |
| 1 or 2 Children | 0 (0.0%) | 0 (0.0%) |
| 3 or 4 Children | 0 (0.0%) | 0 (0.0%) |
| 5 or more Children | 0 (0.0%) | 0 (0.0%) |
| Total | 0 (0.0%) | 0 (0.0%) |
Income Below Poverty Among Married-Couple vs Single-Parent Households in Volga
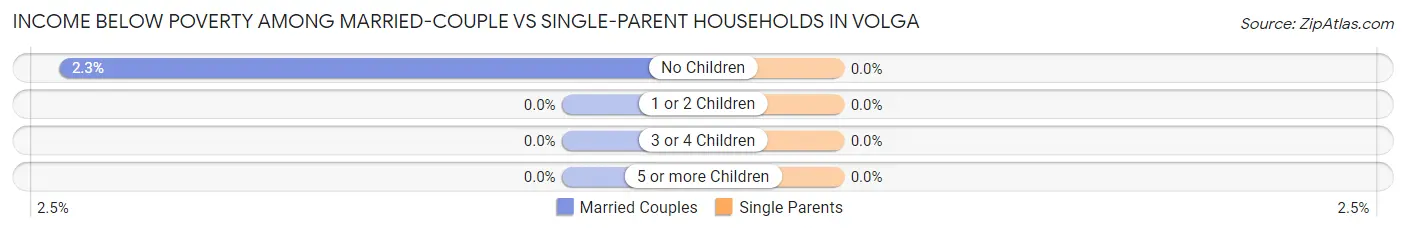
| Children | Married-Couple Families | Single-Parent Households |
| No Children | 5 (2.3%) | 0 (0.0%) |
| 1 or 2 Children | 0 (0.0%) | 0 (0.0%) |
| 3 or 4 Children | 0 (0.0%) | 0 (0.0%) |
| 5 or more Children | 0 (0.0%) | 0 (0.0%) |
| Total | 5 (1.4%) | 0 (0.0%) |
Race in Volga
The most populous races in Volga are White / Caucasian (1,945 | 95.2%), Two or more Races (56 | 2.7%), and Hispanic or Latino (37 | 1.8%).
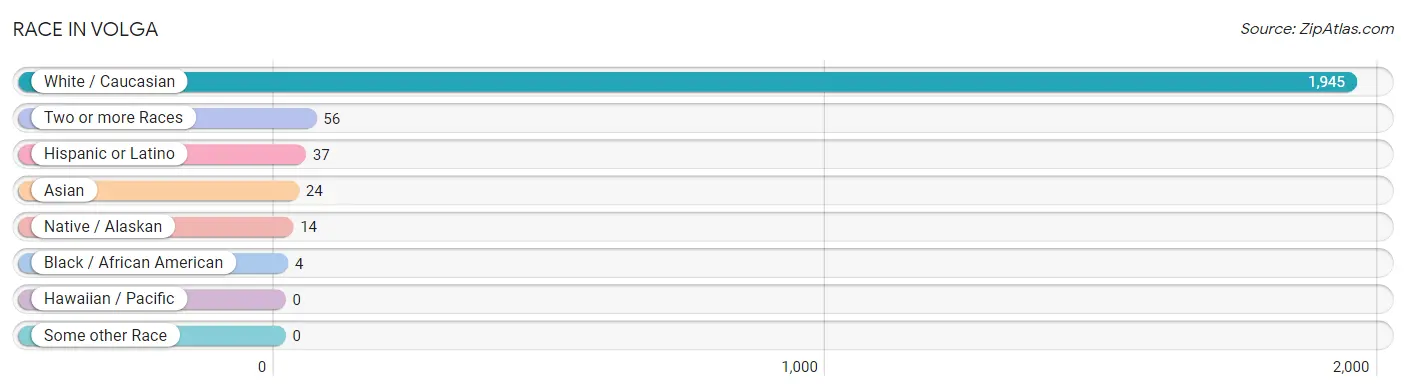
| Race | # Population | % Population |
| Asian | 24 | 1.2% |
| Black / African American | 4 | 0.2% |
| Hawaiian / Pacific | 0 | 0.0% |
| Hispanic or Latino | 37 | 1.8% |
| Native / Alaskan | 14 | 0.7% |
| White / Caucasian | 1,945 | 95.2% |
| Two or more Races | 56 | 2.7% |
| Some other Race | 0 | 0.0% |
| Total | 2,043 | 100.0% |
Ancestry in Volga
The most populous ancestries reported in Volga are German (793 | 38.8%), Norwegian (554 | 27.1%), Irish (272 | 13.3%), Dutch (199 | 9.7%), and American (69 | 3.4%), together accounting for 92.4% of all Volga residents.
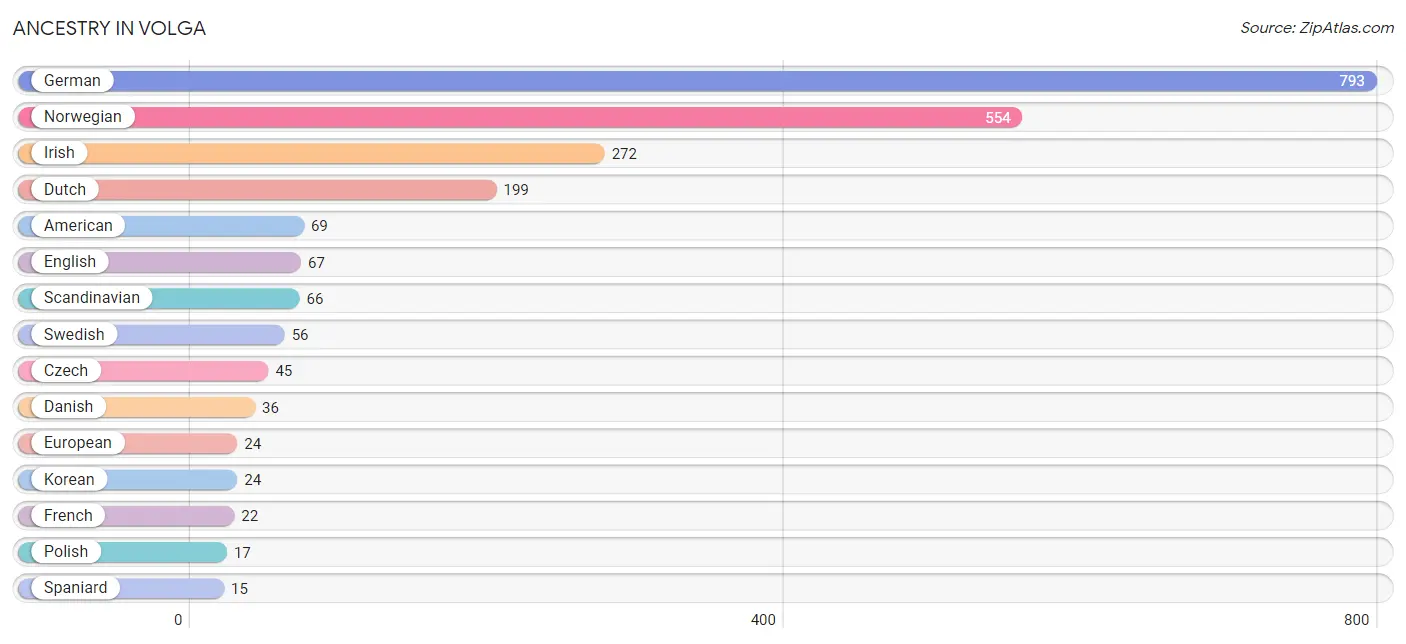
| Ancestry | # Population | % Population |
| African | 4 | 0.2% |
| American | 69 | 3.4% |
| Belgian | 12 | 0.6% |
| British | 8 | 0.4% |
| Czech | 45 | 2.2% |
| Danish | 36 | 1.8% |
| Dutch | 199 | 9.7% |
| Eastern European | 4 | 0.2% |
| English | 67 | 3.3% |
| European | 24 | 1.2% |
| Finnish | 6 | 0.3% |
| French | 22 | 1.1% |
| French Canadian | 5 | 0.2% |
| German | 793 | 38.8% |
| Irish | 272 | 13.3% |
| Korean | 24 | 1.2% |
| Mexican | 4 | 0.2% |
| Norwegian | 554 | 27.1% |
| Polish | 17 | 0.8% |
| Russian | 12 | 0.6% |
| Scandinavian | 66 | 3.2% |
| Scotch-Irish | 12 | 0.6% |
| Scottish | 5 | 0.2% |
| Sioux | 14 | 0.7% |
| Slovene | 3 | 0.2% |
| Spaniard | 15 | 0.7% |
| Subsaharan African | 4 | 0.2% |
| Swedish | 56 | 2.7% |
| Ukrainian | 11 | 0.5% |
| Welsh | 8 | 0.4% | View All 30 Rows |
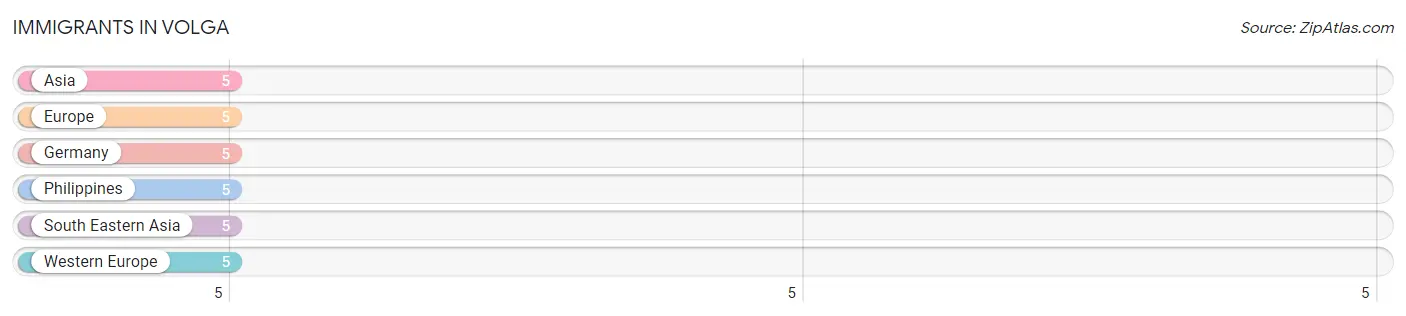
Immigrants in Volga
The most numerous immigrant groups reported in Volga came from Asia (5 | 0.2%), Europe (5 | 0.2%), Germany (5 | 0.2%), Philippines (5 | 0.2%), and South Eastern Asia (5 | 0.2%), together accounting for 1.2% of all Volga residents.
| Immigration Origin | # Population | % Population |
| Asia | 5 | 0.2% |
| Europe | 5 | 0.2% |
| Germany | 5 | 0.2% |
| Philippines | 5 | 0.2% |
| South Eastern Asia | 5 | 0.2% |
| Western Europe | 5 | 0.2% | View All 6 Rows |
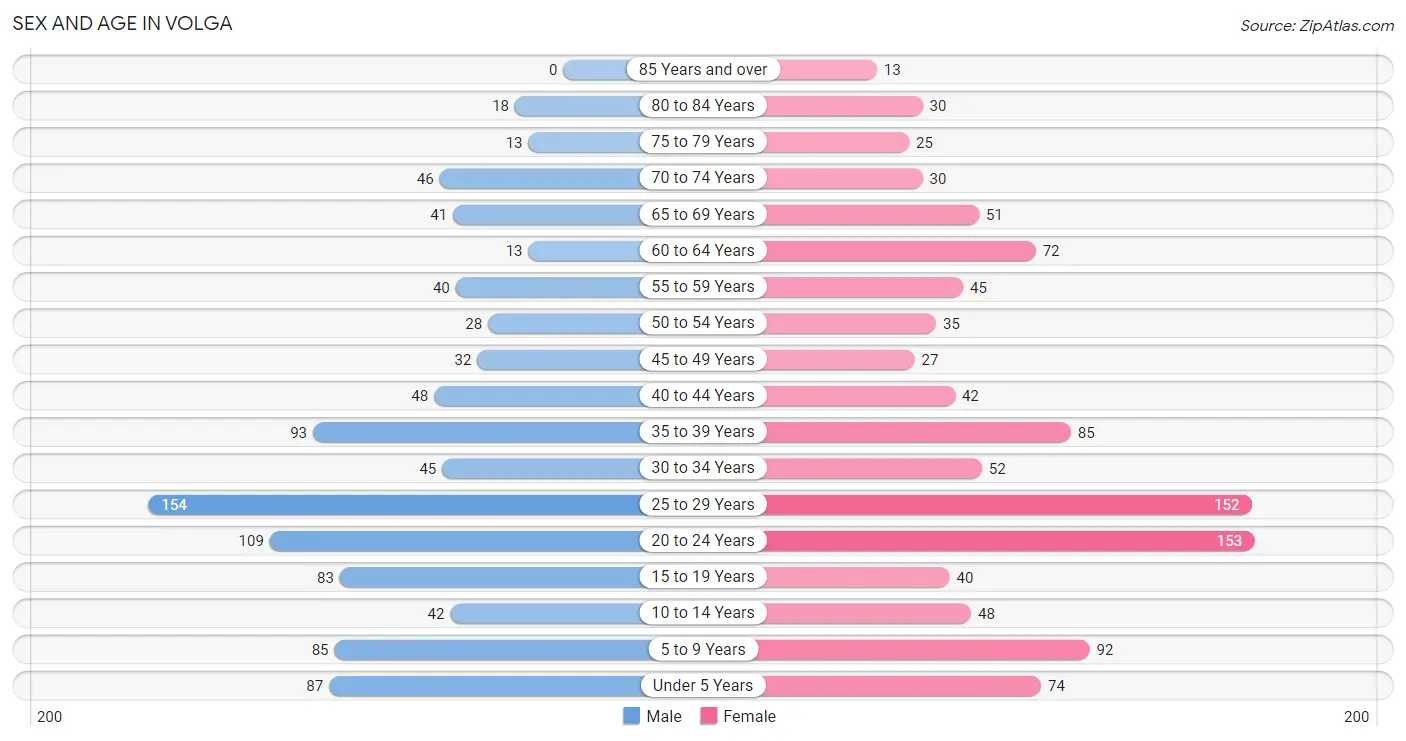
Sex and Age in Volga
Sex and Age in Volga
The most populous age groups in Volga are 25 to 29 Years (154 | 15.8%) for men and 20 to 24 Years (153 | 14.3%) for women.
| Age Bracket | Male | Female |
| Under 5 Years | 87 (8.9%) | 74 (6.9%) |
| 5 to 9 Years | 85 (8.7%) | 92 (8.6%) |
| 10 to 14 Years | 42 (4.3%) | 48 (4.5%) |
| 15 to 19 Years | 83 (8.5%) | 40 (3.7%) |
| 20 to 24 Years | 109 (11.2%) | 153 (14.3%) |
| 25 to 29 Years | 154 (15.8%) | 152 (14.3%) |
| 30 to 34 Years | 45 (4.6%) | 52 (4.9%) |
| 35 to 39 Years | 93 (9.5%) | 85 (8.0%) |
| 40 to 44 Years | 48 (4.9%) | 42 (3.9%) |
| 45 to 49 Years | 32 (3.3%) | 27 (2.5%) |
| 50 to 54 Years | 28 (2.9%) | 35 (3.3%) |
| 55 to 59 Years | 40 (4.1%) | 45 (4.2%) |
| 60 to 64 Years | 13 (1.3%) | 72 (6.8%) |
| 65 to 69 Years | 41 (4.2%) | 51 (4.8%) |
| 70 to 74 Years | 46 (4.7%) | 30 (2.8%) |
| 75 to 79 Years | 13 (1.3%) | 25 (2.4%) |
| 80 to 84 Years | 18 (1.8%) | 30 (2.8%) |
| 85 Years and over | 0 (0.0%) | 13 (1.2%) |
| Total | 977 (100.0%) | 1,066 (100.0%) |
Families and Households in Volga
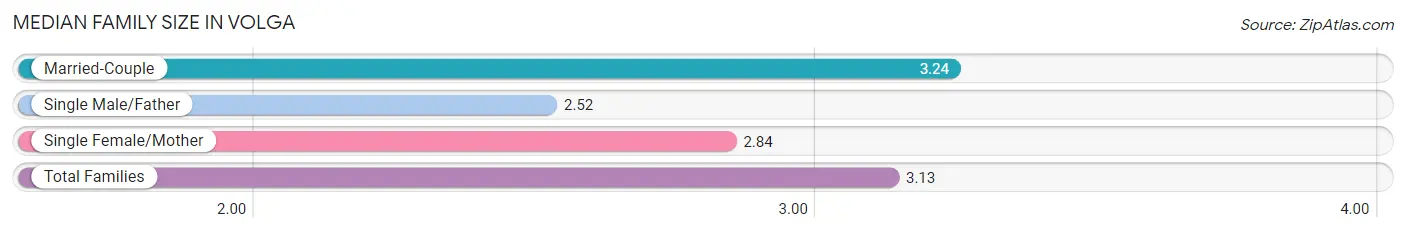
Median Family Size in Volga
The median family size in Volga is 3.13 persons per family, with married-couple families (350 | 77.1%) accounting for the largest median family size of 3.24 persons per family. On the other hand, single male/father families (23 | 5.1%) represent the smallest median family size with 2.52 persons per family.
| Family Type | # Families | Family Size |
| Married-Couple | 350 (77.1%) | 3.24 |
| Single Male/Father | 23 (5.1%) | 2.52 |
| Single Female/Mother | 81 (17.8%) | 2.84 |
| Total Families | 454 (100.0%) | 3.13 |
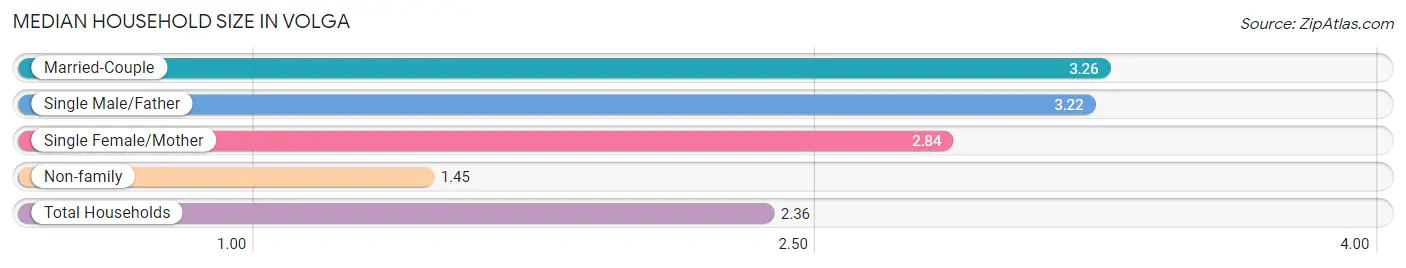
Median Household Size in Volga
The median household size in Volga is 2.36 persons per household, with married-couple households (350 | 40.4%) accounting for the largest median household size of 3.26 persons per household. non-family households (413 | 47.6%) represent the smallest median household size with 1.45 persons per household.
| Household Type | # Households | Household Size |
| Married-Couple | 350 (40.4%) | 3.26 |
| Single Male/Father | 23 (2.6%) | 3.22 |
| Single Female/Mother | 81 (9.3%) | 2.84 |
| Non-family | 413 (47.6%) | 1.45 |
| Total Households | 867 (100.0%) | 2.36 |
Household Size by Marriage Status in Volga
Out of a total of 867 households in Volga, 454 (52.4%) are family households, while 413 (47.6%) are nonfamily households. The most numerous type of family households are 2-person households, comprising 254, and the most common type of nonfamily households are 1-person households, comprising 276.
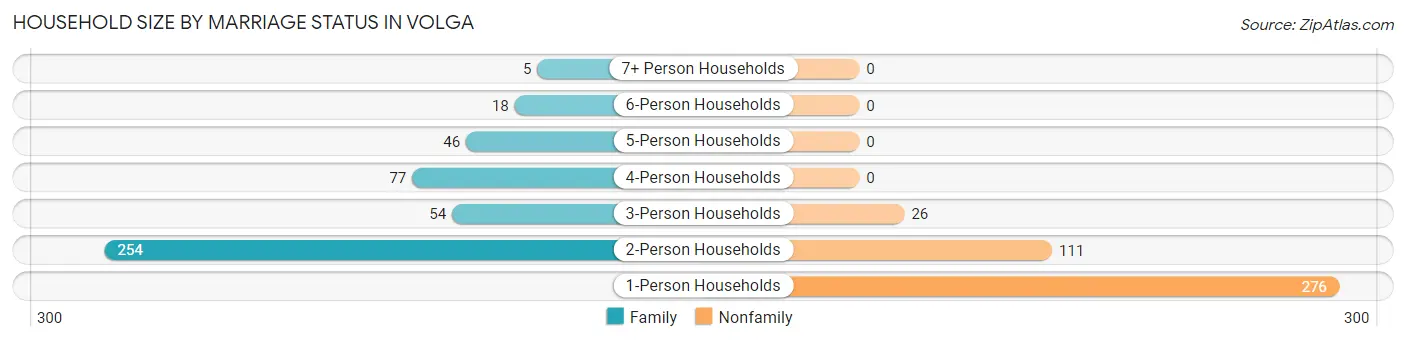
| Household Size | Family Households | Nonfamily Households |
| 1-Person Households | - | 276 (31.8%) |
| 2-Person Households | 254 (29.3%) | 111 (12.8%) |
| 3-Person Households | 54 (6.2%) | 26 (3.0%) |
| 4-Person Households | 77 (8.9%) | 0 (0.0%) |
| 5-Person Households | 46 (5.3%) | 0 (0.0%) |
| 6-Person Households | 18 (2.1%) | 0 (0.0%) |
| 7+ Person Households | 5 (0.6%) | 0 (0.0%) |
| Total | 454 (52.4%) | 413 (47.6%) |
Female Fertility in Volga
Fertility by Age in Volga
Average fertility rate in Volga is 25.0 births per 1,000 women. Women in the age bracket of 35 to 50 years have the highest fertility rate with 31.0 births per 1,000 women. Women in the age bracket of 20 to 34 years acount for 64.3% of all women with births.
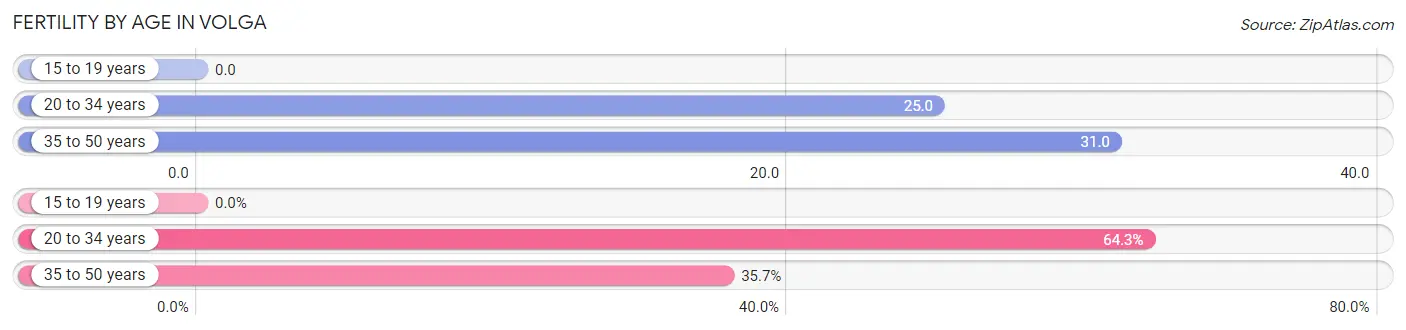
| Age Bracket | Women with Births | Births / 1,000 Women |
| 15 to 19 years | 0 (0.0%) | 0.0 |
| 20 to 34 years | 9 (64.3%) | 25.0 |
| 35 to 50 years | 5 (35.7%) | 31.0 |
| Total | 14 (100.0%) | 25.0 |
Fertility by Age by Marriage Status in Volga
85.7% of women with births (14) in Volga are married. The highest percentage of unmarried women with births falls into 20 to 34 years age bracket with 22.2% of them unmarried at the time of birth, while the lowest percentage of unmarried women with births belong to 35 to 50 years age bracket with 0.0% of them unmarried.
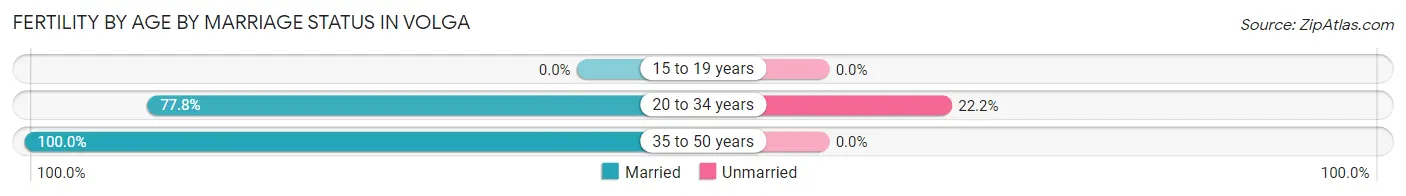
| Age Bracket | Married | Unmarried |
| 15 to 19 years | 0 (0.0%) | 0 (0.0%) |
| 20 to 34 years | 7 (77.8%) | 2 (22.2%) |
| 35 to 50 years | 5 (100.0%) | 0 (0.0%) |
| Total | 12 (85.7%) | 2 (14.3%) |
Fertility by Education in Volga
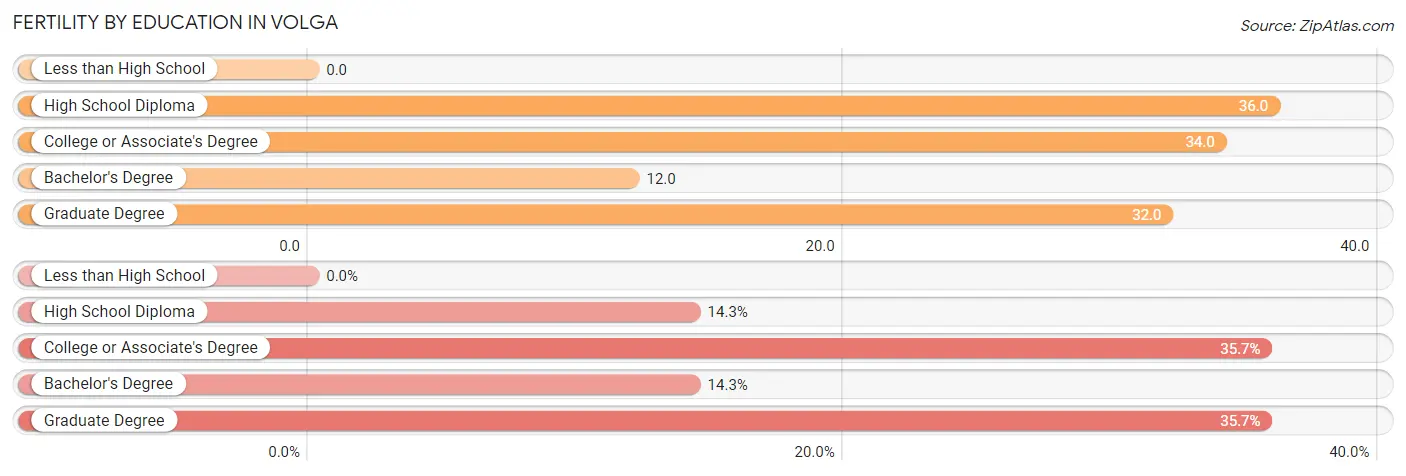
| Educational Attainment | Women with Births | Births / 1,000 Women |
| Less than High School | 0 (0.0%) | 0.0 |
| High School Diploma | 2 (14.3%) | 36.0 |
| College or Associate's Degree | 5 (35.7%) | 34.0 |
| Bachelor's Degree | 2 (14.3%) | 12.0 |
| Graduate Degree | 5 (35.7%) | 32.0 |
| Total | 14 (100.0%) | 25.0 |
Fertility by Education by Marriage Status in Volga
14.3% of women with births in Volga are unmarried. Women with the educational attainment of college or associate's degree are most likely to be married with 100.0% of them married at childbirth, while women with the educational attainment of high school diploma are least likely to be married with 100.0% of them unmarried at childbirth.
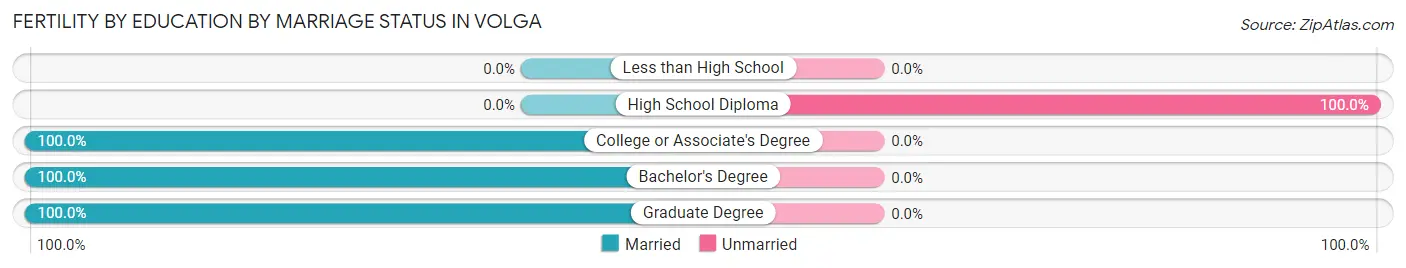
| Educational Attainment | Married | Unmarried |
| Less than High School | 0 (0.0%) | 0 (0.0%) |
| High School Diploma | 0 (0.0%) | 2 (100.0%) |
| College or Associate's Degree | 5 (100.0%) | 0 (0.0%) |
| Bachelor's Degree | 2 (100.0%) | 0 (0.0%) |
| Graduate Degree | 5 (100.0%) | 0 (0.0%) |
| Total | 12 (85.7%) | 2 (14.3%) |
Employment Characteristics in Volga
Employment by Class of Employer in Volga
Among the 1,156 employed individuals in Volga, private company employees (887 | 76.7%), local government employees (91 | 7.9%), and state government employees (73 | 6.3%) make up the most common classes of employment.
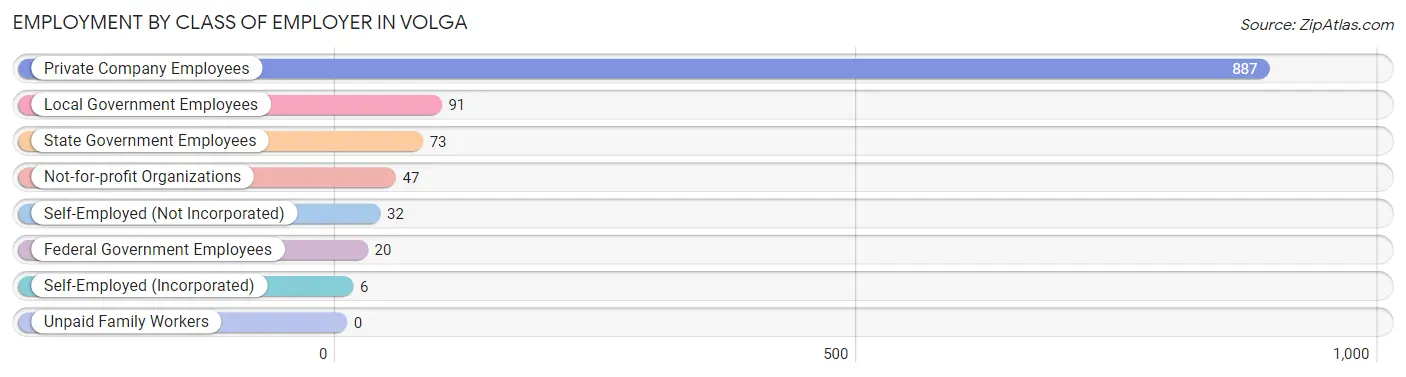
| Employer Class | # Employees | % Employees |
| Private Company Employees | 887 | 76.7% |
| Self-Employed (Incorporated) | 6 | 0.5% |
| Self-Employed (Not Incorporated) | 32 | 2.8% |
| Not-for-profit Organizations | 47 | 4.1% |
| Local Government Employees | 91 | 7.9% |
| State Government Employees | 73 | 6.3% |
| Federal Government Employees | 20 | 1.7% |
| Unpaid Family Workers | 0 | 0.0% |
| Total | 1,156 | 100.0% |
Employment Status by Age in Volga
According to the labor force statistics for Volga, out of the total population over 16 years of age (1,568), 74.7% or 1,171 individuals are in the labor force, with 1.1% or 13 of them unemployed. The age group with the highest labor force participation rate is 45 to 54 years, with 95.1% or 116 individuals in the labor force. Within the labor force, the 45 to 54 years age range has the highest percentage of unemployed individuals, with 5.2% or 6 of them being unemployed.
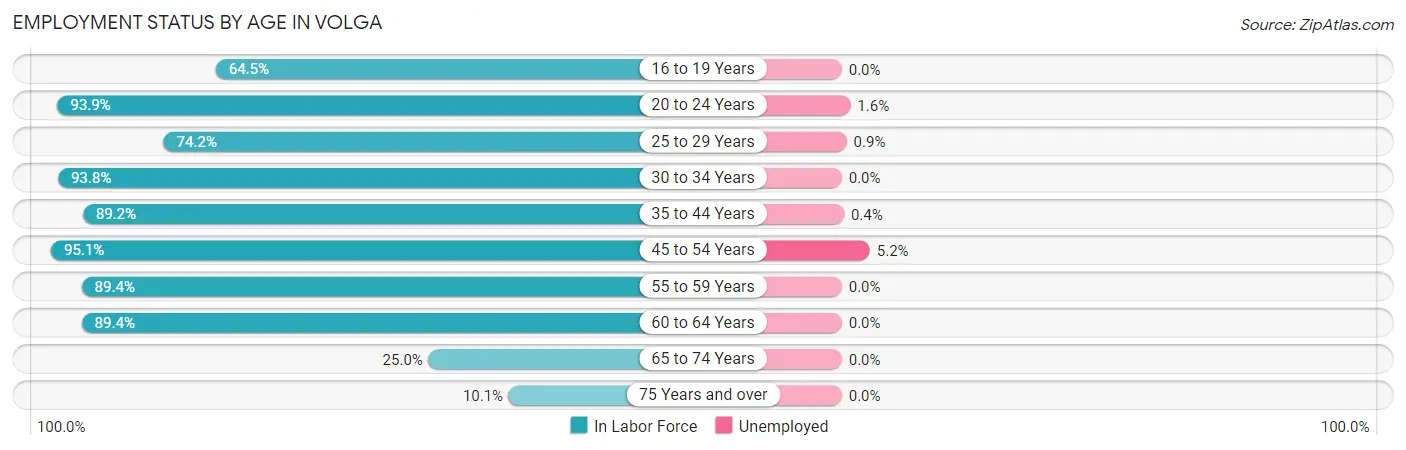
| Age Bracket | In Labor Force | Unemployed |
| 16 to 19 Years | 49 (64.5%) | 0 (0.0%) |
| 20 to 24 Years | 246 (93.9%) | 4 (1.6%) |
| 25 to 29 Years | 227 (74.2%) | 2 (0.9%) |
| 30 to 34 Years | 91 (93.8%) | 0 (0.0%) |
| 35 to 44 Years | 239 (89.2%) | 1 (0.4%) |
| 45 to 54 Years | 116 (95.1%) | 6 (5.2%) |
| 55 to 59 Years | 76 (89.4%) | 0 (0.0%) |
| 60 to 64 Years | 76 (89.4%) | 0 (0.0%) |
| 65 to 74 Years | 42 (25.0%) | 0 (0.0%) |
| 75 Years and over | 10 (10.1%) | 0 (0.0%) |
| Total | 1,171 (74.7%) | 13 (1.1%) |
Employment Status by Educational Attainment in Volga
According to labor force statistics for Volga, 85.7% of individuals (825) out of the total population between 25 and 64 years of age (963) are in the labor force, with 1.1% or 9 of them being unemployed. The group with the highest labor force participation rate are those with the educational attainment of college / associate degree, with 94.0% or 311 individuals in the labor force. Within the labor force, individuals with high school diploma education have the highest percentage of unemployment, with 5.0% or 9 of them being unemployed.
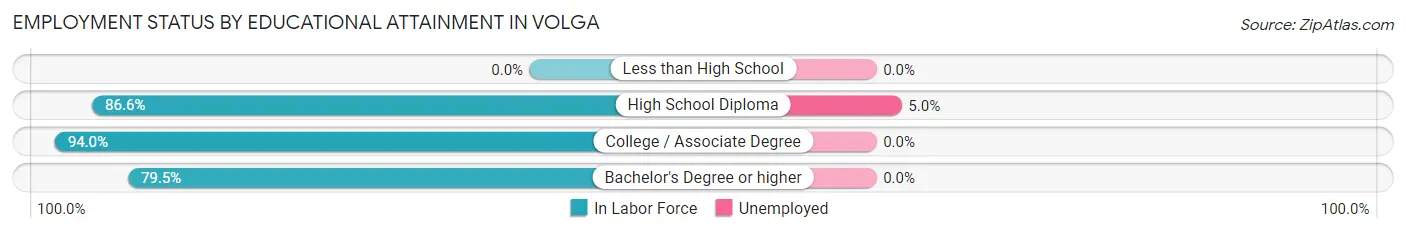
| Educational Attainment | In Labor Force | Unemployed |
| Less than High School | 0 (0.0%) | 0 (0.0%) |
| High School Diploma | 181 (86.6%) | 10 (5.0%) |
| College / Associate Degree | 311 (94.0%) | 0 (0.0%) |
| Bachelor's Degree or higher | 333 (79.5%) | 0 (0.0%) |
| Total | 825 (85.7%) | 11 (1.1%) |
Employment Occupations by Sex in Volga
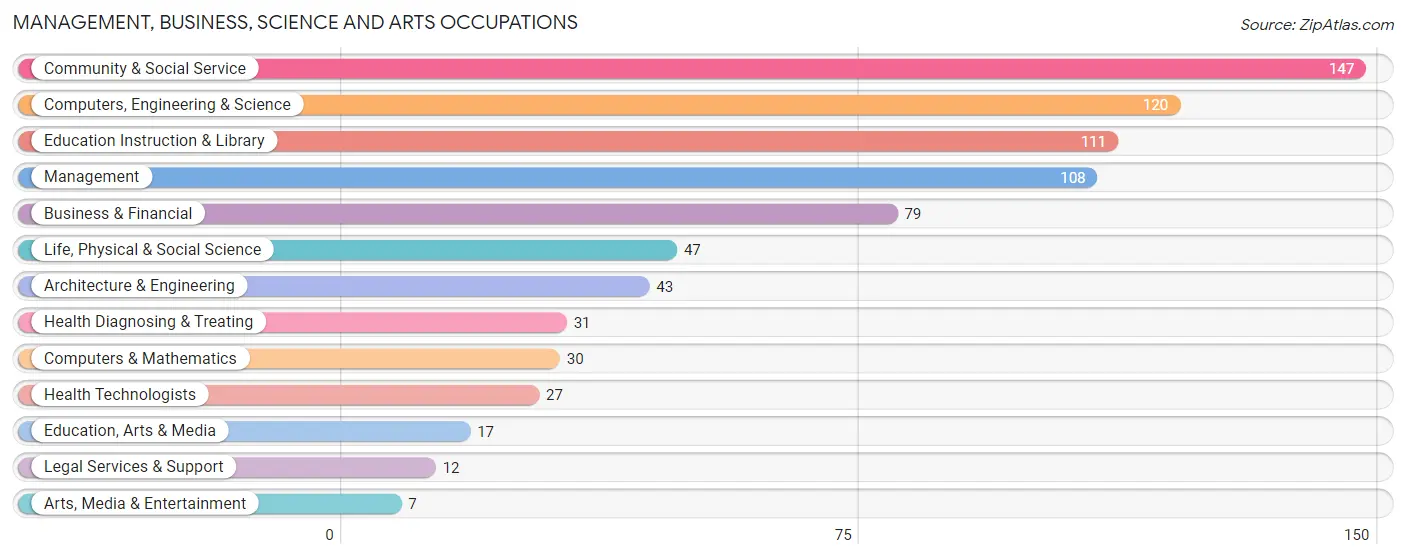
Management, Business, Science and Arts Occupations
The most common Management, Business, Science and Arts occupations in Volga are Community & Social Service (147 | 12.7%), Computers, Engineering & Science (120 | 10.3%), Education Instruction & Library (111 | 9.6%), Management (108 | 9.3%), and Business & Financial (79 | 6.8%).
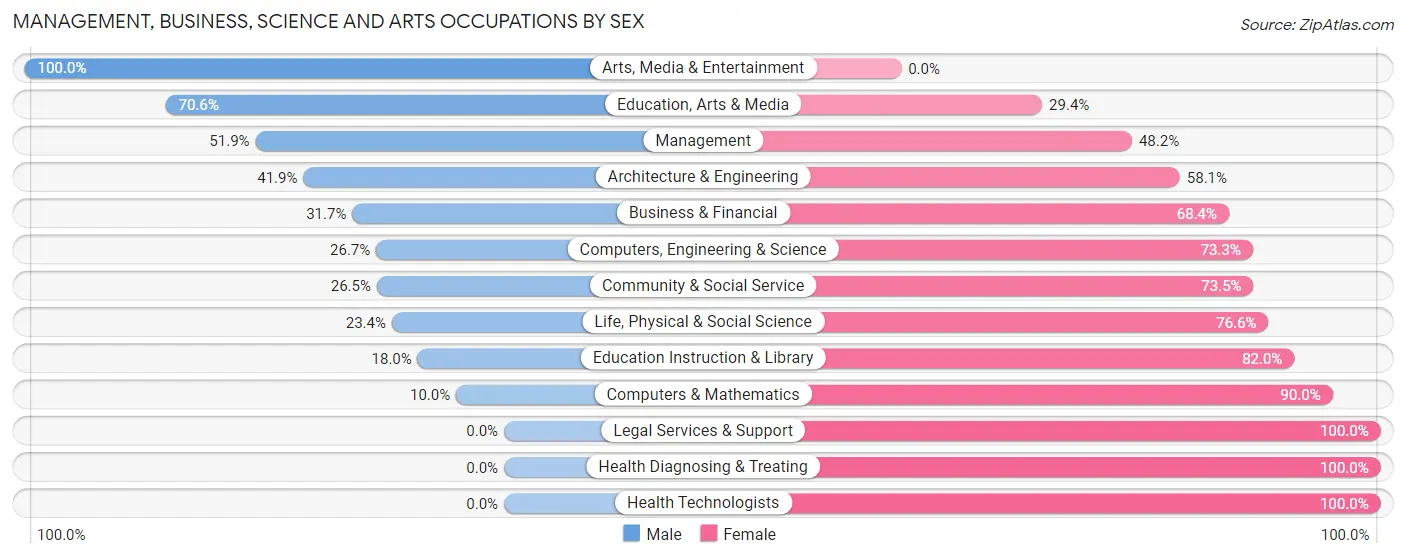
Management, Business, Science and Arts Occupations by Sex
Within the Management, Business, Science and Arts occupations in Volga, the most male-oriented occupations are Arts, Media & Entertainment (100.0%), Education, Arts & Media (70.6%), and Management (51.8%), while the most female-oriented occupations are Legal Services & Support (100.0%), Health Diagnosing & Treating (100.0%), and Health Technologists (100.0%).
| Occupation | Male | Female |
| Management | 56 (51.8%) | 52 (48.1%) |
| Business & Financial | 25 (31.7%) | 54 (68.3%) |
| Computers, Engineering & Science | 32 (26.7%) | 88 (73.3%) |
| Computers & Mathematics | 3 (10.0%) | 27 (90.0%) |
| Architecture & Engineering | 18 (41.9%) | 25 (58.1%) |
| Life, Physical & Social Science | 11 (23.4%) | 36 (76.6%) |
| Community & Social Service | 39 (26.5%) | 108 (73.5%) |
| Education, Arts & Media | 12 (70.6%) | 5 (29.4%) |
| Legal Services & Support | 0 (0.0%) | 12 (100.0%) |
| Education Instruction & Library | 20 (18.0%) | 91 (82.0%) |
| Arts, Media & Entertainment | 7 (100.0%) | 0 (0.0%) |
| Health Diagnosing & Treating | 0 (0.0%) | 31 (100.0%) |
| Health Technologists | 0 (0.0%) | 27 (100.0%) |
| Total (Category) | 152 (31.3%) | 333 (68.7%) |
| Total (Overall) | 566 (48.8%) | 593 (51.2%) |
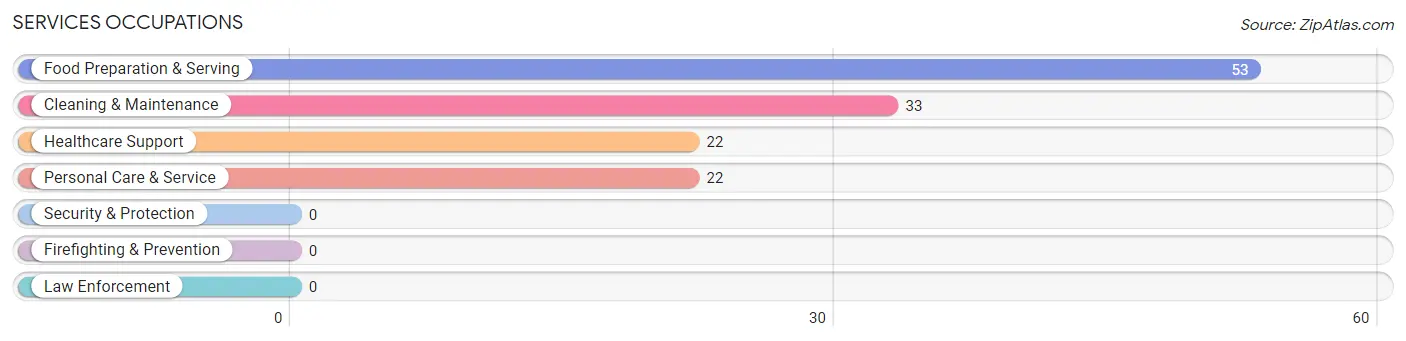
Services Occupations
The most common Services occupations in Volga are Food Preparation & Serving (53 | 4.6%), Cleaning & Maintenance (33 | 2.9%), Healthcare Support (22 | 1.9%), and Personal Care & Service (22 | 1.9%).
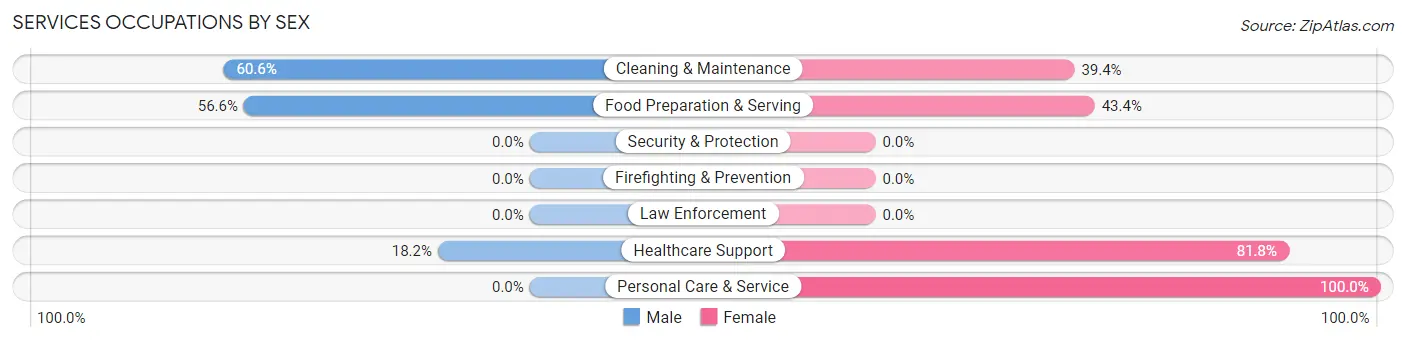
Services Occupations by Sex
Within the Services occupations in Volga, the most male-oriented occupations are Cleaning & Maintenance (60.6%), Food Preparation & Serving (56.6%), and Healthcare Support (18.2%), while the most female-oriented occupations are Personal Care & Service (100.0%), Healthcare Support (81.8%), and Food Preparation & Serving (43.4%).
| Occupation | Male | Female |
| Healthcare Support | 4 (18.2%) | 18 (81.8%) |
| Security & Protection | 0 (0.0%) | 0 (0.0%) |
| Firefighting & Prevention | 0 (0.0%) | 0 (0.0%) |
| Law Enforcement | 0 (0.0%) | 0 (0.0%) |
| Food Preparation & Serving | 30 (56.6%) | 23 (43.4%) |
| Cleaning & Maintenance | 20 (60.6%) | 13 (39.4%) |
| Personal Care & Service | 0 (0.0%) | 22 (100.0%) |
| Total (Category) | 54 (41.5%) | 76 (58.5%) |
| Total (Overall) | 566 (48.8%) | 593 (51.2%) |
Sales and Office Occupations
The most common Sales and Office occupations in Volga are Office & Administration (143 | 12.3%), and Sales & Related (71 | 6.1%).

Sales and Office Occupations by Sex

| Occupation | Male | Female |
| Sales & Related | 49 (69.0%) | 22 (31.0%) |
| Office & Administration | 8 (5.6%) | 135 (94.4%) |
| Total (Category) | 57 (26.6%) | 157 (73.4%) |
| Total (Overall) | 566 (48.8%) | 593 (51.2%) |
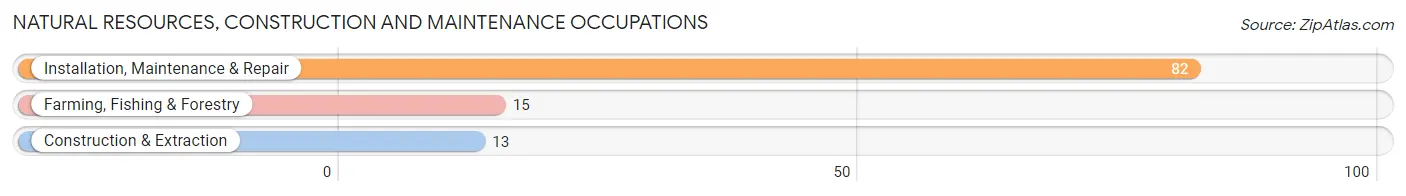
Natural Resources, Construction and Maintenance Occupations
The most common Natural Resources, Construction and Maintenance occupations in Volga are Installation, Maintenance & Repair (82 | 7.1%), Farming, Fishing & Forestry (15 | 1.3%), and Construction & Extraction (13 | 1.1%).
Natural Resources, Construction and Maintenance Occupations by Sex
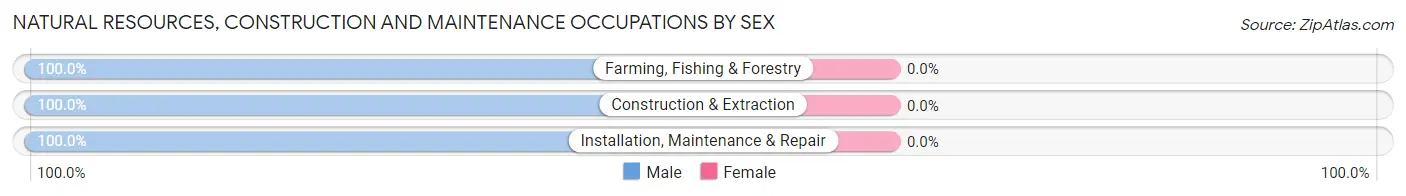
| Occupation | Male | Female |
| Farming, Fishing & Forestry | 15 (100.0%) | 0 (0.0%) |
| Construction & Extraction | 13 (100.0%) | 0 (0.0%) |
| Installation, Maintenance & Repair | 82 (100.0%) | 0 (0.0%) |
| Total (Category) | 110 (100.0%) | 0 (0.0%) |
| Total (Overall) | 566 (48.8%) | 593 (51.2%) |
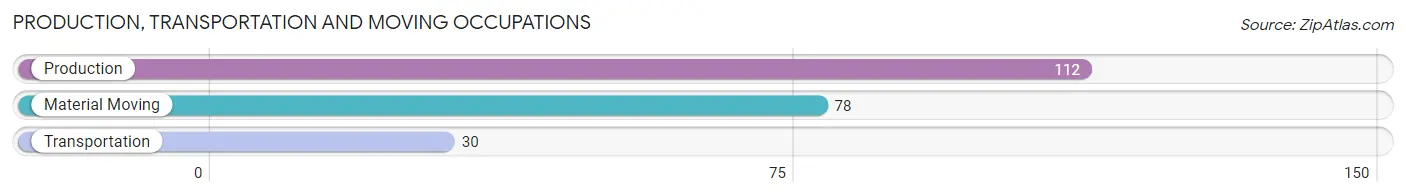
Production, Transportation and Moving Occupations
The most common Production, Transportation and Moving occupations in Volga are Production (112 | 9.7%), Material Moving (78 | 6.7%), and Transportation (30 | 2.6%).
Production, Transportation and Moving Occupations by Sex
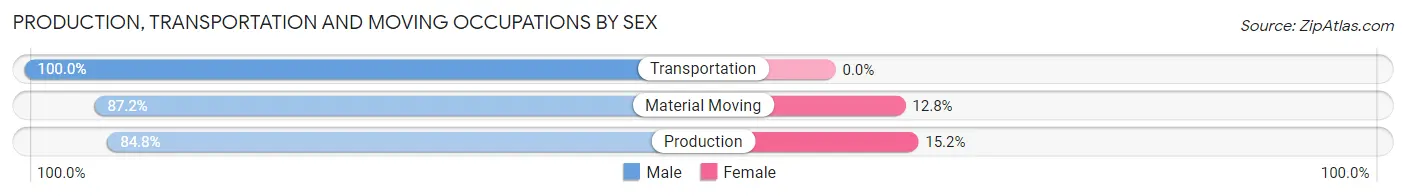
| Occupation | Male | Female |
| Production | 95 (84.8%) | 17 (15.2%) |
| Transportation | 30 (100.0%) | 0 (0.0%) |
| Material Moving | 68 (87.2%) | 10 (12.8%) |
| Total (Category) | 193 (87.7%) | 27 (12.3%) |
| Total (Overall) | 566 (48.8%) | 593 (51.2%) |
Employment Industries by Sex in Volga
Employment Industries in Volga
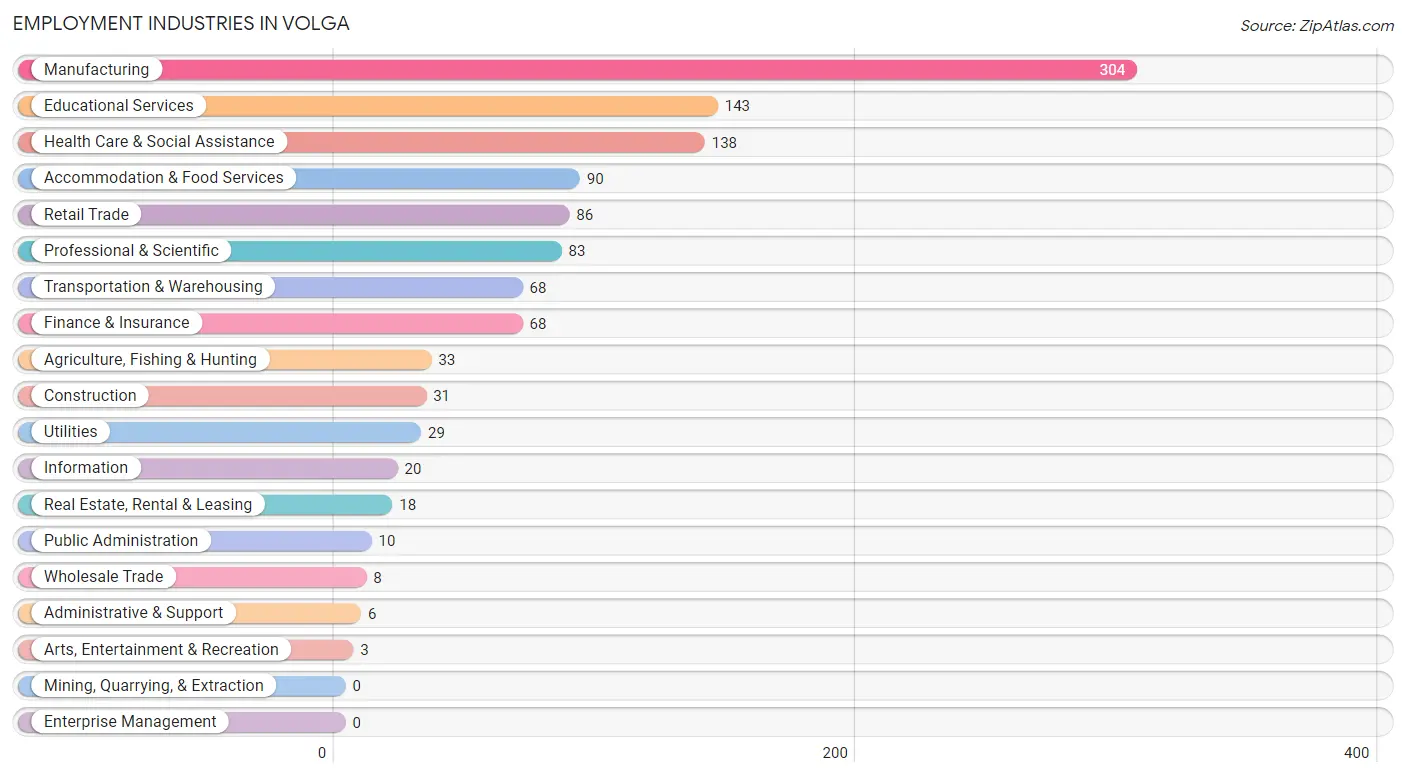
The major employment industries in Volga include Manufacturing (304 | 26.2%), Educational Services (143 | 12.3%), Health Care & Social Assistance (138 | 11.9%), Accommodation & Food Services (90 | 7.8%), and Retail Trade (86 | 7.4%).
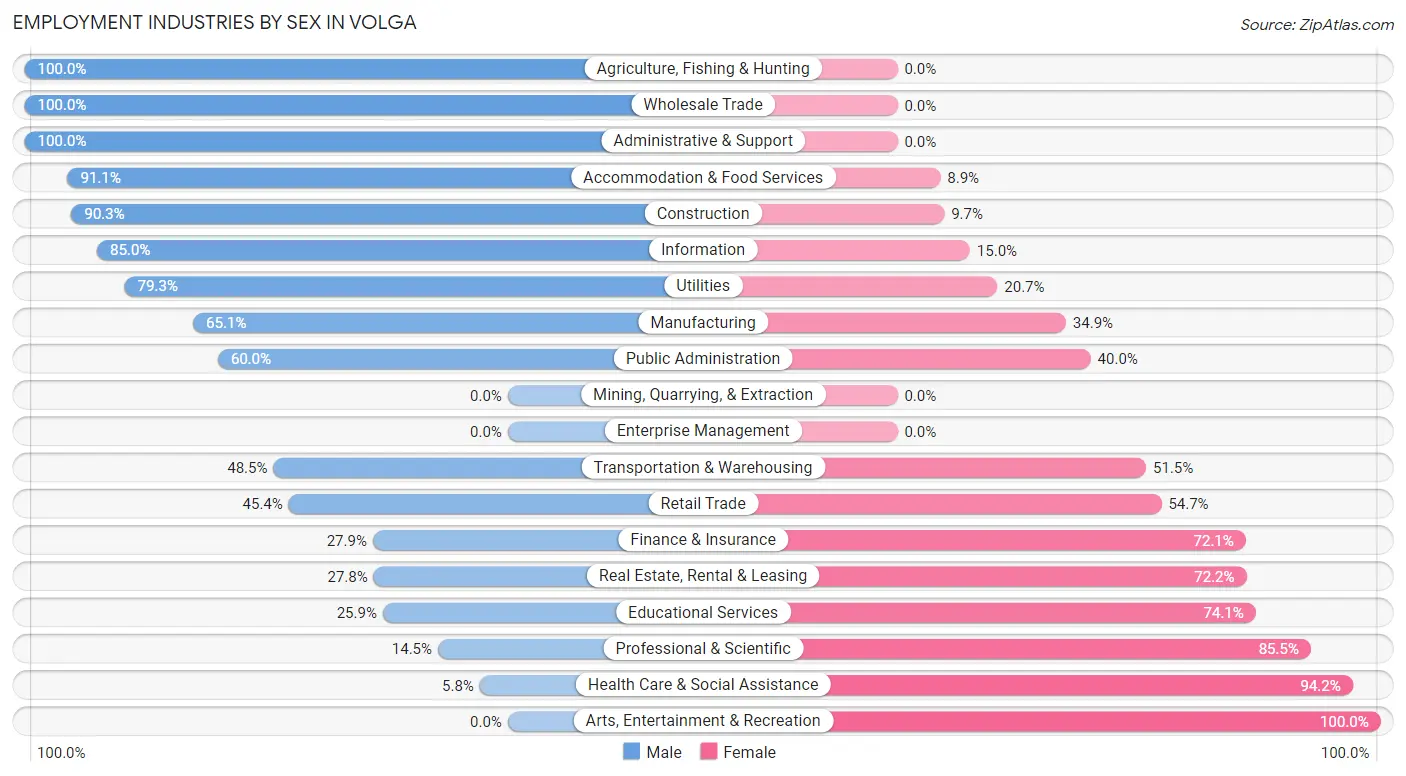
Employment Industries by Sex in Volga
The Volga industries that see more men than women are Agriculture, Fishing & Hunting (100.0%), Wholesale Trade (100.0%), and Administrative & Support (100.0%), whereas the industries that tend to have a higher number of women are Arts, Entertainment & Recreation (100.0%), Health Care & Social Assistance (94.2%), and Professional & Scientific (85.5%).
| Industry | Male | Female |
| Agriculture, Fishing & Hunting | 33 (100.0%) | 0 (0.0%) |
| Mining, Quarrying, & Extraction | 0 (0.0%) | 0 (0.0%) |
| Construction | 28 (90.3%) | 3 (9.7%) |
| Manufacturing | 198 (65.1%) | 106 (34.9%) |
| Wholesale Trade | 8 (100.0%) | 0 (0.0%) |
| Retail Trade | 39 (45.4%) | 47 (54.6%) |
| Transportation & Warehousing | 33 (48.5%) | 35 (51.5%) |
| Utilities | 23 (79.3%) | 6 (20.7%) |
| Information | 17 (85.0%) | 3 (15.0%) |
| Finance & Insurance | 19 (27.9%) | 49 (72.1%) |
| Real Estate, Rental & Leasing | 5 (27.8%) | 13 (72.2%) |
| Professional & Scientific | 12 (14.5%) | 71 (85.5%) |
| Enterprise Management | 0 (0.0%) | 0 (0.0%) |
| Administrative & Support | 6 (100.0%) | 0 (0.0%) |
| Educational Services | 37 (25.9%) | 106 (74.1%) |
| Health Care & Social Assistance | 8 (5.8%) | 130 (94.2%) |
| Arts, Entertainment & Recreation | 0 (0.0%) | 3 (100.0%) |
| Accommodation & Food Services | 82 (91.1%) | 8 (8.9%) |
| Public Administration | 6 (60.0%) | 4 (40.0%) |
| Total | 566 (48.8%) | 593 (51.2%) |
Education in Volga
School Enrollment in Volga
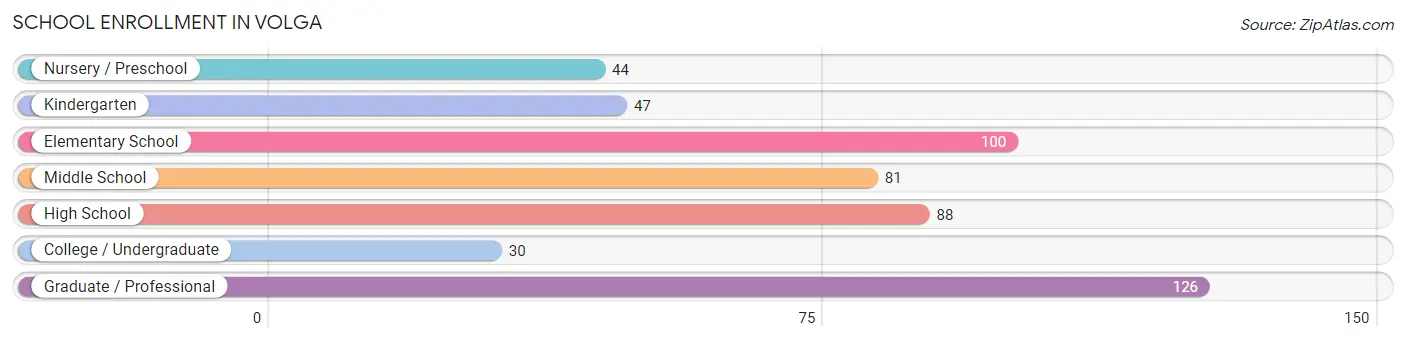
The most common levels of schooling among the 516 students in Volga are graduate / professional (126 | 24.4%), elementary school (100 | 19.4%), and high school (88 | 17.1%).
| School Level | # Students | % Students |
| Nursery / Preschool | 44 | 8.5% |
| Kindergarten | 47 | 9.1% |
| Elementary School | 100 | 19.4% |
| Middle School | 81 | 15.7% |
| High School | 88 | 17.1% |
| College / Undergraduate | 30 | 5.8% |
| Graduate / Professional | 126 | 24.4% |
| Total | 516 | 100.0% |
School Enrollment by Age by Funding Source in Volga
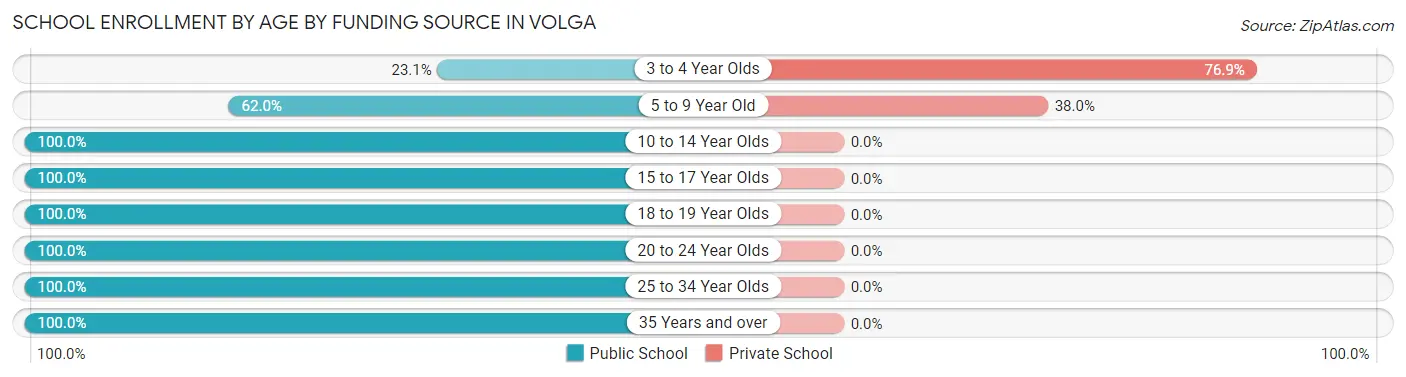
Out of a total of 516 students who are enrolled in schools in Volga, 75 (14.5%) attend a private institution, while the remaining 441 (85.5%) are enrolled in public schools. The age group of 3 to 4 year olds has the highest likelihood of being enrolled in private schools, with 10 (76.9% in the age bracket) enrolled. Conversely, the age group of 10 to 14 year olds has the lowest likelihood of being enrolled in a private school, with 90 (100.0% in the age bracket) attending a public institution.
| Age Bracket | Public School | Private School |
| 3 to 4 Year Olds | 3 (23.1%) | 10 (76.9%) |
| 5 to 9 Year Old | 106 (62.0%) | 65 (38.0%) |
| 10 to 14 Year Olds | 90 (100.0%) | 0 (0.0%) |
| 15 to 17 Year Olds | 75 (100.0%) | 0 (0.0%) |
| 18 to 19 Year Olds | 15 (100.0%) | 0 (0.0%) |
| 20 to 24 Year Olds | 64 (100.0%) | 0 (0.0%) |
| 25 to 34 Year Olds | 85 (100.0%) | 0 (0.0%) |
| 35 Years and over | 3 (100.0%) | 0 (0.0%) |
| Total | 441 (85.5%) | 75 (14.5%) |
Educational Attainment by Field of Study in Volga
Education (169 | 32.4%), bio, nature & agricultural (81 | 15.5%), business (53 | 10.2%), arts & humanities (53 | 10.2%), and science & technology (37 | 7.1%) are the most common fields of study among 522 individuals in Volga who have obtained a bachelor's degree or higher.
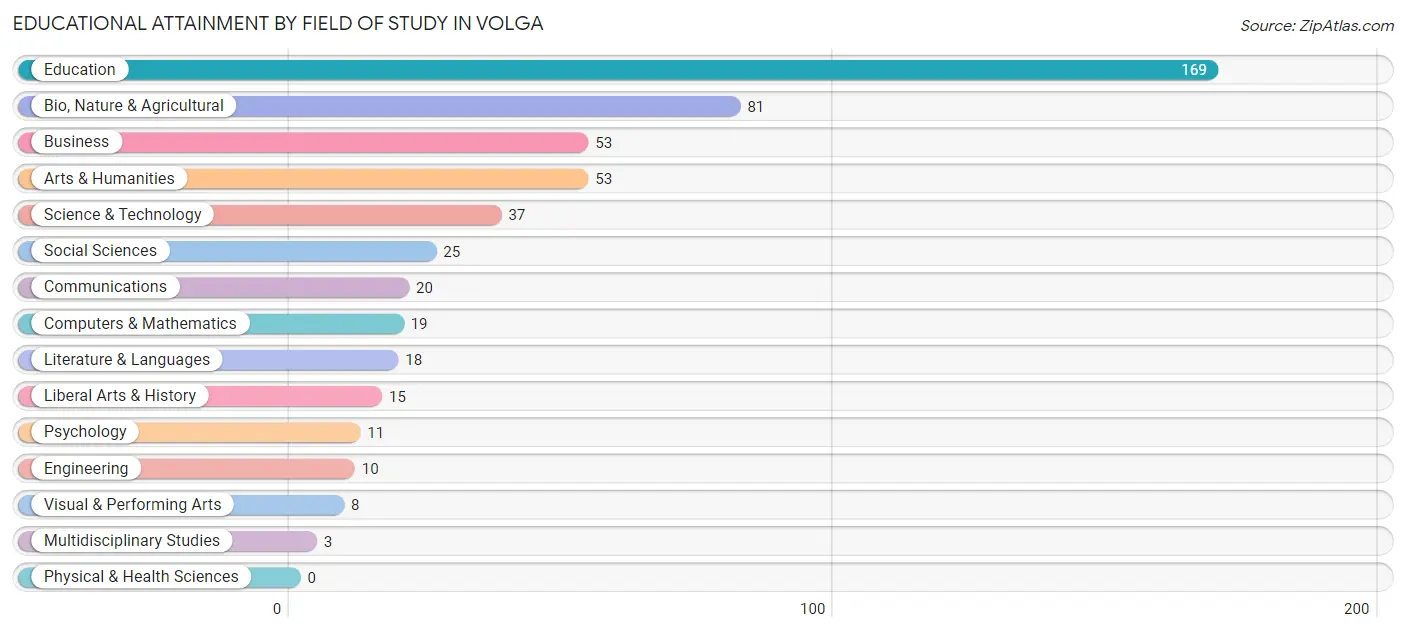
| Field of Study | # Graduates | % Graduates |
| Computers & Mathematics | 19 | 3.6% |
| Bio, Nature & Agricultural | 81 | 15.5% |
| Physical & Health Sciences | 0 | 0.0% |
| Psychology | 11 | 2.1% |
| Social Sciences | 25 | 4.8% |
| Engineering | 10 | 1.9% |
| Multidisciplinary Studies | 3 | 0.6% |
| Science & Technology | 37 | 7.1% |
| Business | 53 | 10.2% |
| Education | 169 | 32.4% |
| Literature & Languages | 18 | 3.5% |
| Liberal Arts & History | 15 | 2.9% |
| Visual & Performing Arts | 8 | 1.5% |
| Communications | 20 | 3.8% |
| Arts & Humanities | 53 | 10.2% |
| Total | 522 | 100.0% |
Transportation & Commute in Volga
Vehicle Availability by Sex in Volga
The most prevalent vehicle ownership categories in Volga are males with 2 vehicles (318, accounting for 56.2%) and females with 2 vehicles (239, making up 53.9%).
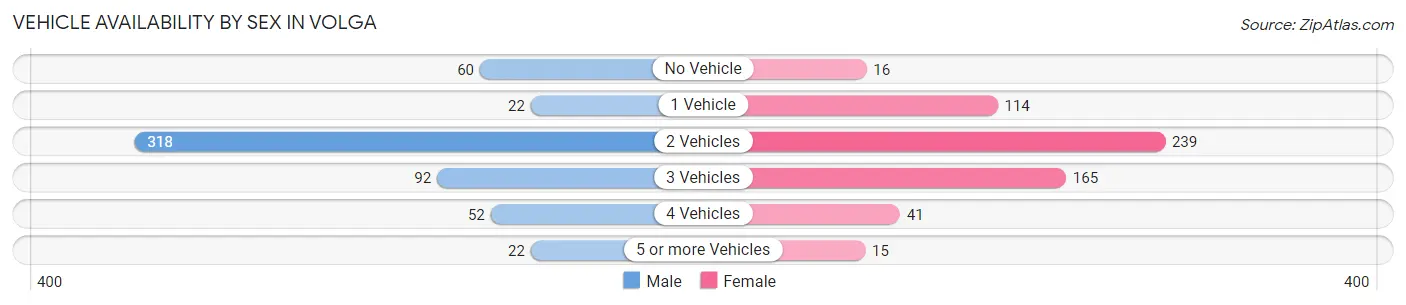
| Vehicles Available | Male | Female |
| No Vehicle | 60 (10.6%) | 16 (2.7%) |
| 1 Vehicle | 22 (3.9%) | 114 (19.3%) |
| 2 Vehicles | 318 (56.2%) | 239 (40.5%) |
| 3 Vehicles | 92 (16.3%) | 165 (28.0%) |
| 4 Vehicles | 52 (9.2%) | 41 (7.0%) |
| 5 or more Vehicles | 22 (3.9%) | 15 (2.5%) |
| Total | 566 (100.0%) | 590 (100.0%) |
Commute Time in Volga
The most frequently occuring commute durations in Volga are 10 to 14 minutes (298 commuters, 28.4%), 15 to 19 minutes (241 commuters, 23.0%), and 5 to 9 minutes (121 commuters, 11.6%).
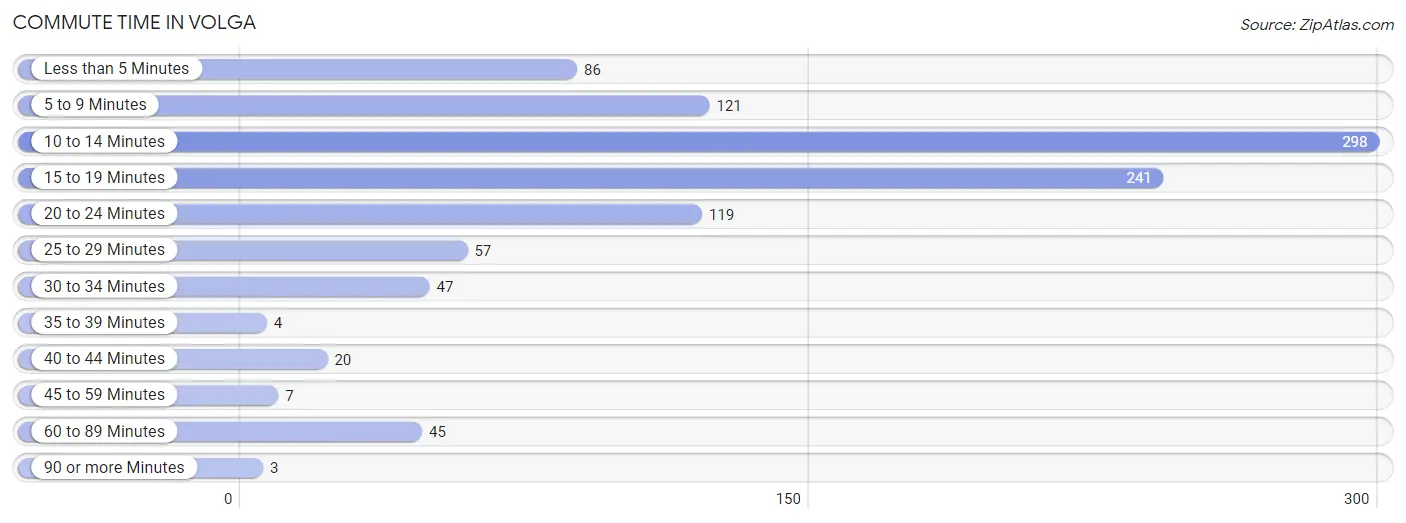
| Commute Time | # Commuters | % Commuters |
| Less than 5 Minutes | 86 | 8.2% |
| 5 to 9 Minutes | 121 | 11.6% |
| 10 to 14 Minutes | 298 | 28.4% |
| 15 to 19 Minutes | 241 | 23.0% |
| 20 to 24 Minutes | 119 | 11.4% |
| 25 to 29 Minutes | 57 | 5.4% |
| 30 to 34 Minutes | 47 | 4.5% |
| 35 to 39 Minutes | 4 | 0.4% |
| 40 to 44 Minutes | 20 | 1.9% |
| 45 to 59 Minutes | 7 | 0.7% |
| 60 to 89 Minutes | 45 | 4.3% |
| 90 or more Minutes | 3 | 0.3% |
Commute Time by Sex in Volga
The most common commute times in Volga are 15 to 19 minutes (158 commuters, 29.4%) for males and 10 to 14 minutes (175 commuters, 34.3%) for females.
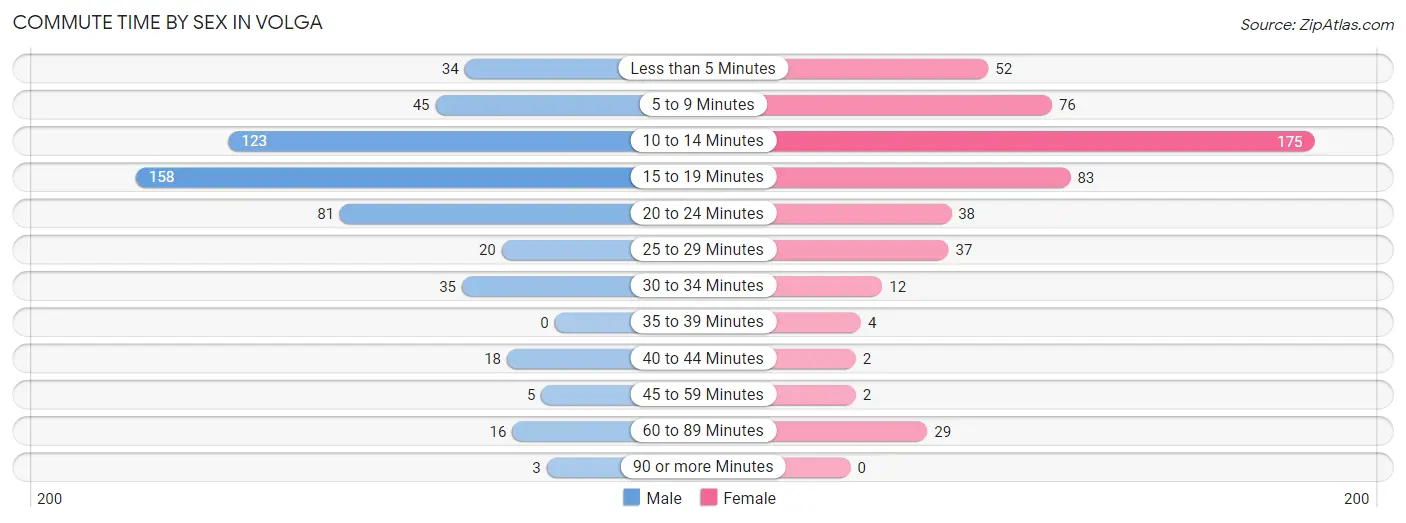
| Commute Time | Male | Female |
| Less than 5 Minutes | 34 (6.3%) | 52 (10.2%) |
| 5 to 9 Minutes | 45 (8.4%) | 76 (14.9%) |
| 10 to 14 Minutes | 123 (22.9%) | 175 (34.3%) |
| 15 to 19 Minutes | 158 (29.4%) | 83 (16.3%) |
| 20 to 24 Minutes | 81 (15.1%) | 38 (7.4%) |
| 25 to 29 Minutes | 20 (3.7%) | 37 (7.2%) |
| 30 to 34 Minutes | 35 (6.5%) | 12 (2.4%) |
| 35 to 39 Minutes | 0 (0.0%) | 4 (0.8%) |
| 40 to 44 Minutes | 18 (3.4%) | 2 (0.4%) |
| 45 to 59 Minutes | 5 (0.9%) | 2 (0.4%) |
| 60 to 89 Minutes | 16 (3.0%) | 29 (5.7%) |
| 90 or more Minutes | 3 (0.6%) | 0 (0.0%) |
Time of Departure to Work by Sex in Volga
The most frequent times of departure to work in Volga are 6:30 AM to 6:59 AM (114, 21.2%) for males and 7:30 AM to 7:59 AM (197, 38.6%) for females.
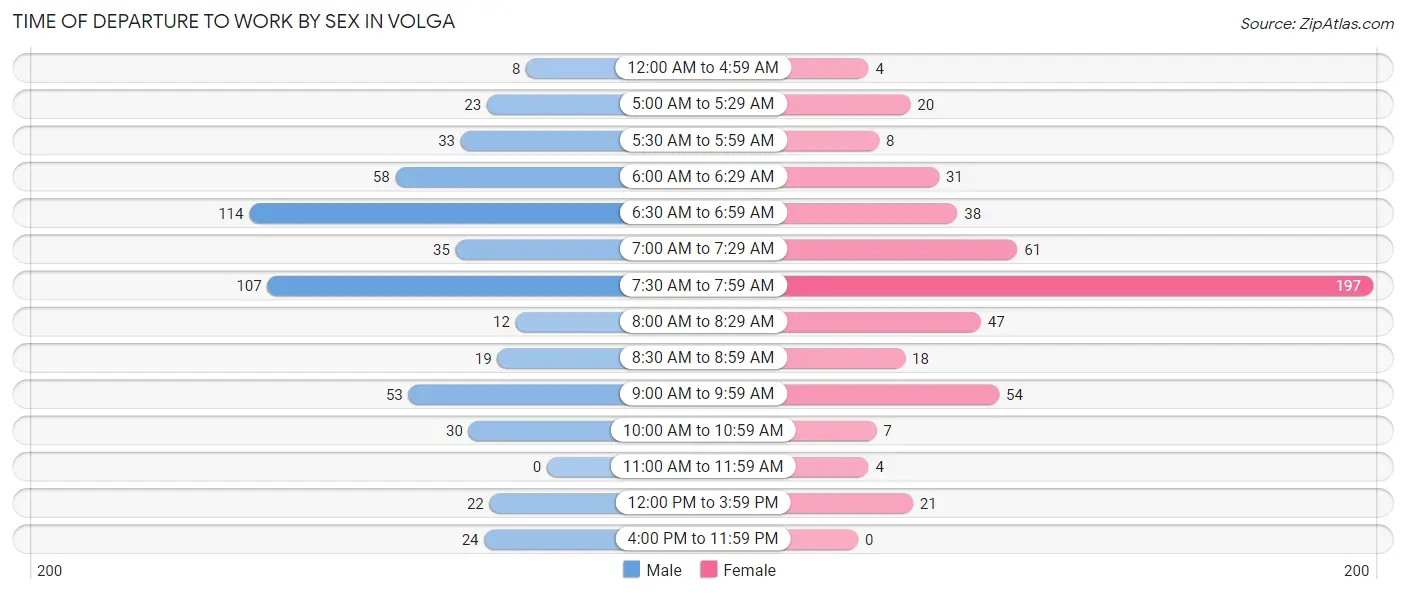
| Time of Departure | Male | Female |
| 12:00 AM to 4:59 AM | 8 (1.5%) | 4 (0.8%) |
| 5:00 AM to 5:29 AM | 23 (4.3%) | 20 (3.9%) |
| 5:30 AM to 5:59 AM | 33 (6.1%) | 8 (1.6%) |
| 6:00 AM to 6:29 AM | 58 (10.8%) | 31 (6.1%) |
| 6:30 AM to 6:59 AM | 114 (21.2%) | 38 (7.4%) |
| 7:00 AM to 7:29 AM | 35 (6.5%) | 61 (12.0%) |
| 7:30 AM to 7:59 AM | 107 (19.9%) | 197 (38.6%) |
| 8:00 AM to 8:29 AM | 12 (2.2%) | 47 (9.2%) |
| 8:30 AM to 8:59 AM | 19 (3.5%) | 18 (3.5%) |
| 9:00 AM to 9:59 AM | 53 (9.9%) | 54 (10.6%) |
| 10:00 AM to 10:59 AM | 30 (5.6%) | 7 (1.4%) |
| 11:00 AM to 11:59 AM | 0 (0.0%) | 4 (0.8%) |
| 12:00 PM to 3:59 PM | 22 (4.1%) | 21 (4.1%) |
| 4:00 PM to 11:59 PM | 24 (4.5%) | 0 (0.0%) |
| Total | 538 (100.0%) | 510 (100.0%) |
Housing Occupancy in Volga
Occupancy by Ownership in Volga
Of the total 867 dwellings in Volga, owner-occupied units account for 468 (54.0%), while renter-occupied units make up 399 (46.0%).
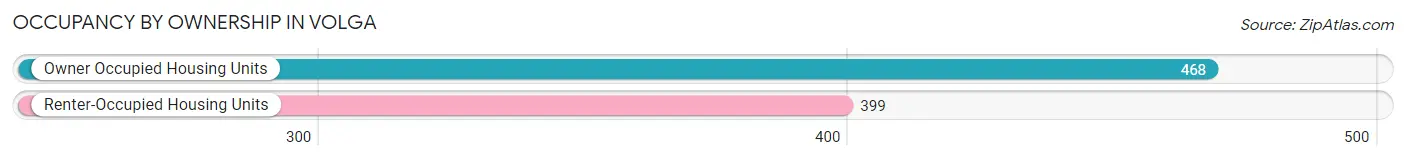
| Occupancy | # Housing Units | % Housing Units |
| Owner Occupied Housing Units | 468 | 54.0% |
| Renter-Occupied Housing Units | 399 | 46.0% |
| Total Occupied Housing Units | 867 | 100.0% |
Occupancy by Household Size in Volga
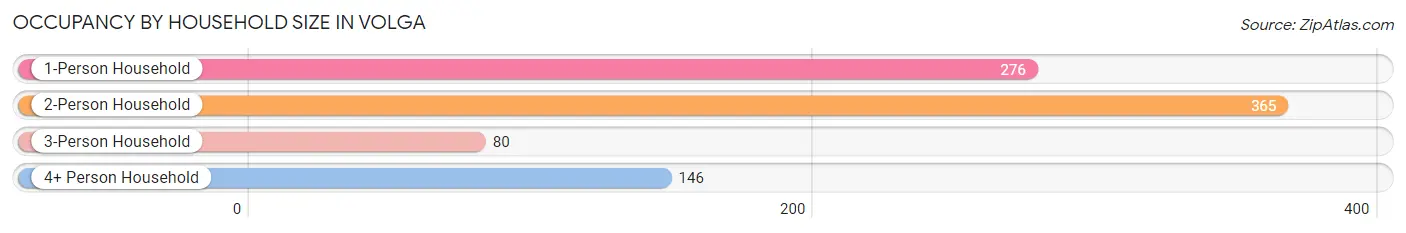
| Household Size | # Housing Units | % Housing Units |
| 1-Person Household | 276 | 31.8% |
| 2-Person Household | 365 | 42.1% |
| 3-Person Household | 80 | 9.2% |
| 4+ Person Household | 146 | 16.8% |
| Total Housing Units | 867 | 100.0% |
Occupancy by Ownership by Household Size in Volga
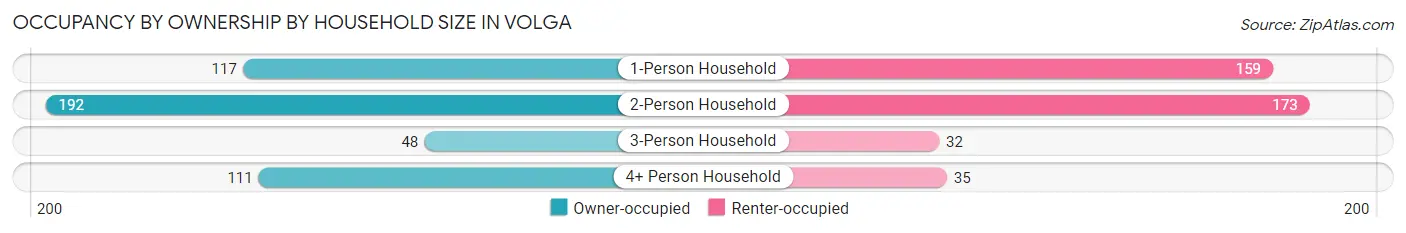
| Household Size | Owner-occupied | Renter-occupied |
| 1-Person Household | 117 (42.4%) | 159 (57.6%) |
| 2-Person Household | 192 (52.6%) | 173 (47.4%) |
| 3-Person Household | 48 (60.0%) | 32 (40.0%) |
| 4+ Person Household | 111 (76.0%) | 35 (24.0%) |
| Total Housing Units | 468 (54.0%) | 399 (46.0%) |
Occupancy by Educational Attainment in Volga
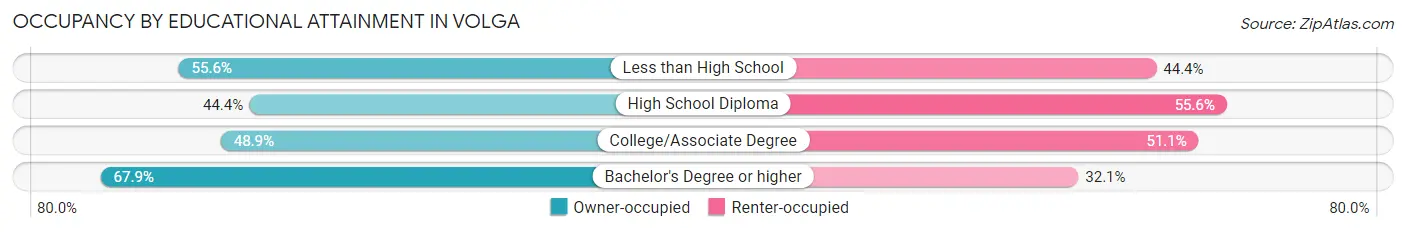
| Household Size | Owner-occupied | Renter-occupied |
| Less than High School | 5 (55.6%) | 4 (44.4%) |
| High School Diploma | 115 (44.4%) | 144 (55.6%) |
| College/Associate Degree | 151 (48.9%) | 158 (51.1%) |
| Bachelor's Degree or higher | 197 (67.9%) | 93 (32.1%) |
Occupancy by Age of Householder in Volga
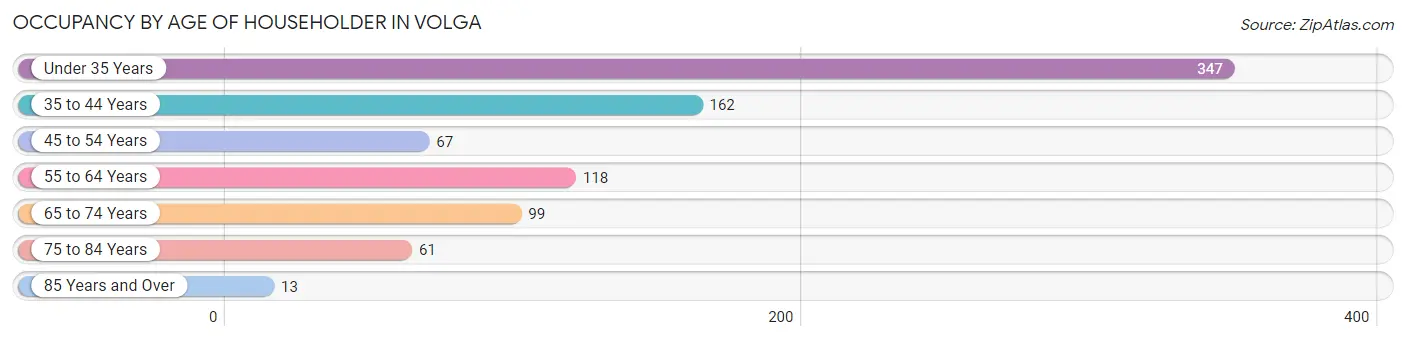
| Age Bracket | # Households | % Households |
| Under 35 Years | 347 | 40.0% |
| 35 to 44 Years | 162 | 18.7% |
| 45 to 54 Years | 67 | 7.7% |
| 55 to 64 Years | 118 | 13.6% |
| 65 to 74 Years | 99 | 11.4% |
| 75 to 84 Years | 61 | 7.0% |
| 85 Years and Over | 13 | 1.5% |
| Total | 867 | 100.0% |
Housing Finances in Volga
Median Income by Occupancy in Volga
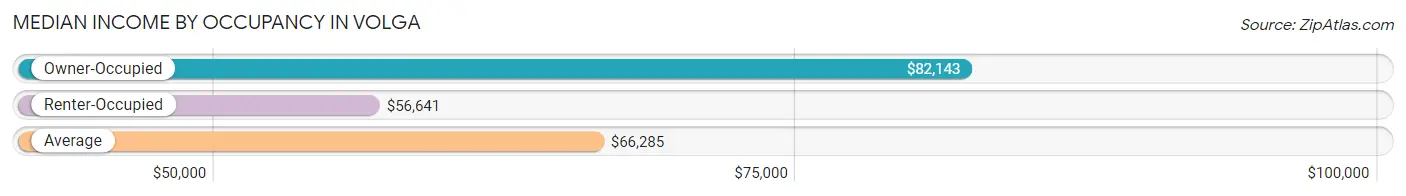
| Occupancy Type | # Households | Median Income |
| Owner-Occupied | 468 (54.0%) | $82,143 |
| Renter-Occupied | 399 (46.0%) | $56,641 |
| Average | 867 (100.0%) | $66,285 |
Occupancy by Householder Income Bracket in Volga
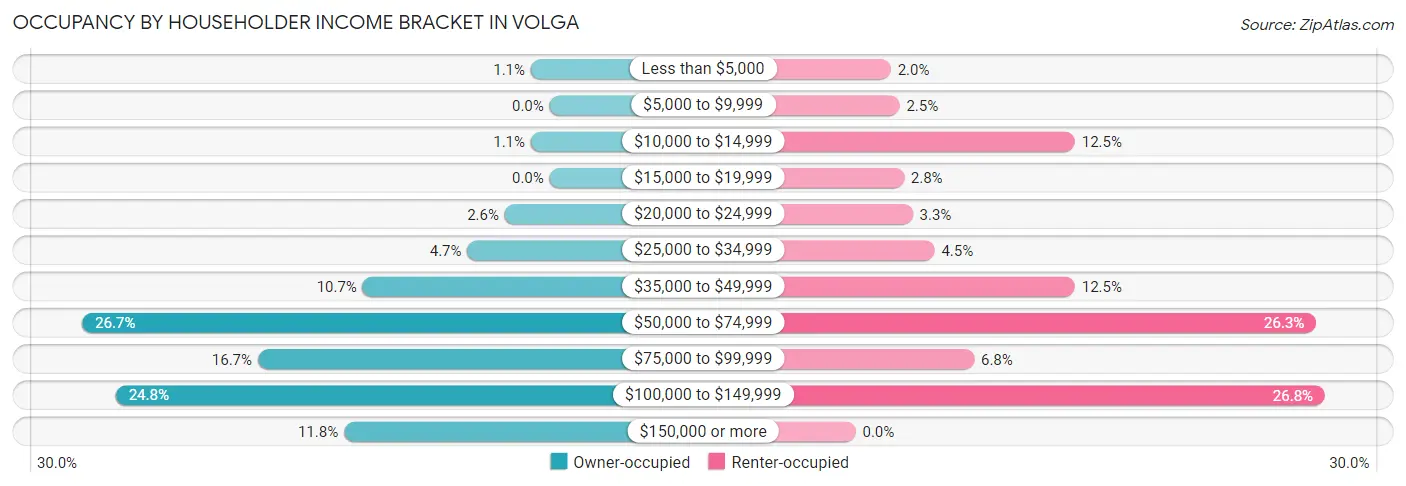
| Income Bracket | Owner-occupied | Renter-occupied |
| Less than $5,000 | 5 (1.1%) | 8 (2.0%) |
| $5,000 to $9,999 | 0 (0.0%) | 10 (2.5%) |
| $10,000 to $14,999 | 5 (1.1%) | 50 (12.5%) |
| $15,000 to $19,999 | 0 (0.0%) | 11 (2.8%) |
| $20,000 to $24,999 | 12 (2.6%) | 13 (3.3%) |
| $25,000 to $34,999 | 22 (4.7%) | 18 (4.5%) |
| $35,000 to $49,999 | 50 (10.7%) | 50 (12.5%) |
| $50,000 to $74,999 | 125 (26.7%) | 105 (26.3%) |
| $75,000 to $99,999 | 78 (16.7%) | 27 (6.8%) |
| $100,000 to $149,999 | 116 (24.8%) | 107 (26.8%) |
| $150,000 or more | 55 (11.7%) | 0 (0.0%) |
| Total | 468 (100.0%) | 399 (100.0%) |
Monthly Housing Cost Tiers in Volga
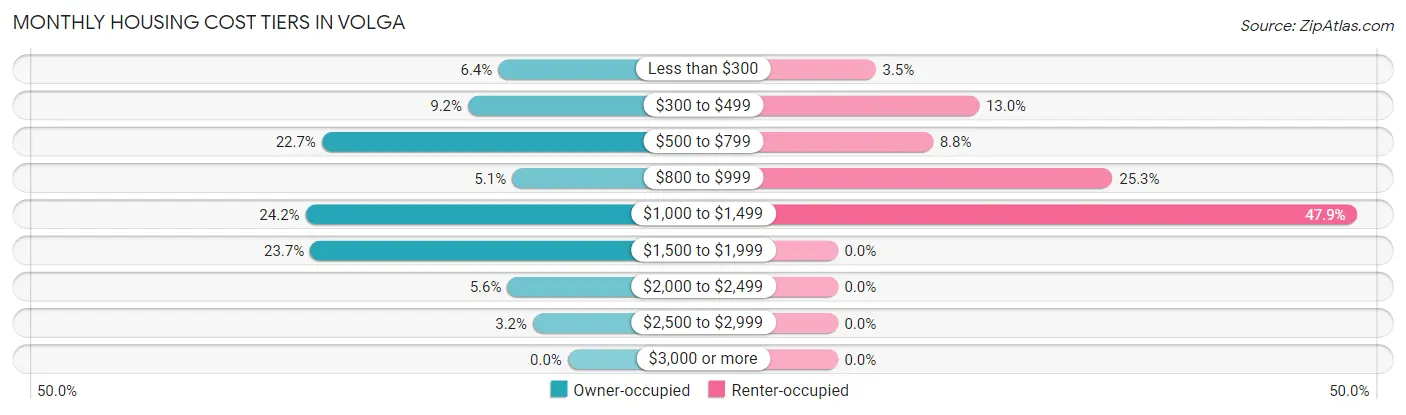
| Monthly Cost | Owner-occupied | Renter-occupied |
| Less than $300 | 30 (6.4%) | 14 (3.5%) |
| $300 to $499 | 43 (9.2%) | 52 (13.0%) |
| $500 to $799 | 106 (22.7%) | 35 (8.8%) |
| $800 to $999 | 24 (5.1%) | 101 (25.3%) |
| $1,000 to $1,499 | 113 (24.1%) | 191 (47.9%) |
| $1,500 to $1,999 | 111 (23.7%) | 0 (0.0%) |
| $2,000 to $2,499 | 26 (5.6%) | 0 (0.0%) |
| $2,500 to $2,999 | 15 (3.2%) | 0 (0.0%) |
| $3,000 or more | 0 (0.0%) | 0 (0.0%) |
| Total | 468 (100.0%) | 399 (100.0%) |
Physical Housing Characteristics in Volga
Housing Structures in Volga
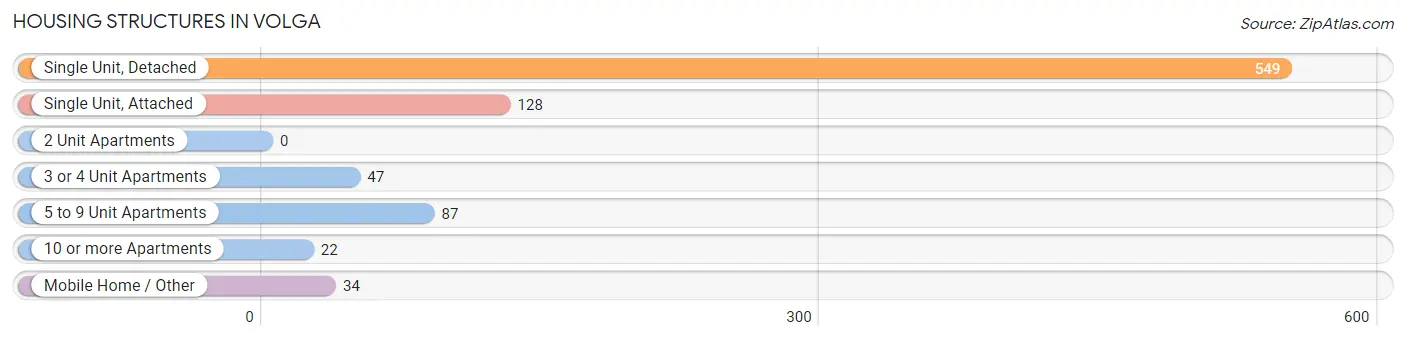
| Structure Type | # Housing Units | % Housing Units |
| Single Unit, Detached | 549 | 63.3% |
| Single Unit, Attached | 128 | 14.8% |
| 2 Unit Apartments | 0 | 0.0% |
| 3 or 4 Unit Apartments | 47 | 5.4% |
| 5 to 9 Unit Apartments | 87 | 10.0% |
| 10 or more Apartments | 22 | 2.5% |
| Mobile Home / Other | 34 | 3.9% |
| Total | 867 | 100.0% |
Housing Structures by Occupancy in Volga
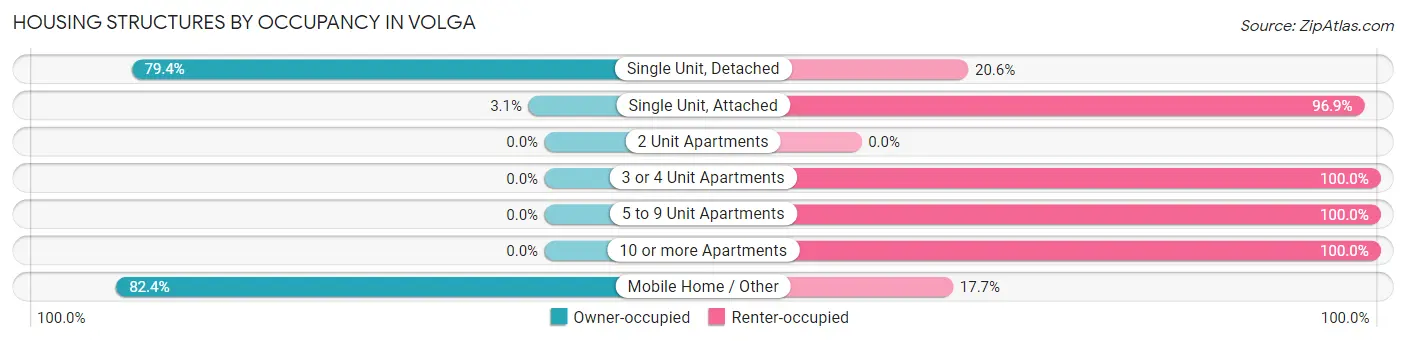
| Structure Type | Owner-occupied | Renter-occupied |
| Single Unit, Detached | 436 (79.4%) | 113 (20.6%) |
| Single Unit, Attached | 4 (3.1%) | 124 (96.9%) |
| 2 Unit Apartments | 0 (0.0%) | 0 (0.0%) |
| 3 or 4 Unit Apartments | 0 (0.0%) | 47 (100.0%) |
| 5 to 9 Unit Apartments | 0 (0.0%) | 87 (100.0%) |
| 10 or more Apartments | 0 (0.0%) | 22 (100.0%) |
| Mobile Home / Other | 28 (82.4%) | 6 (17.6%) |
| Total | 468 (54.0%) | 399 (46.0%) |
Housing Structures by Number of Rooms in Volga
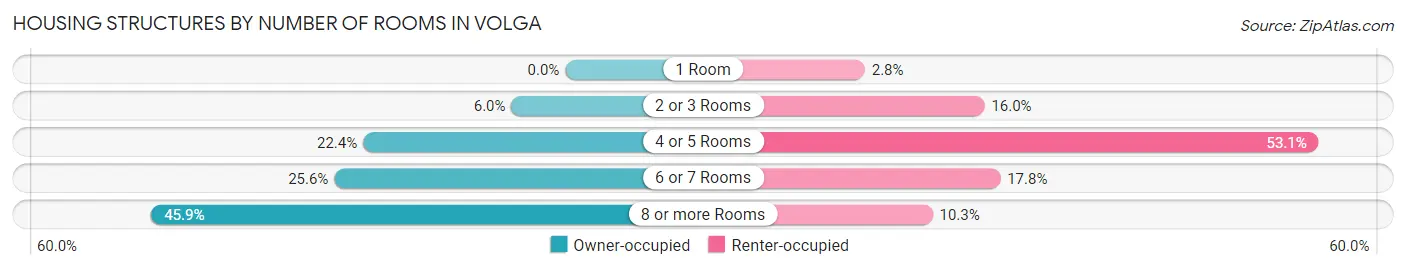
| Number of Rooms | Owner-occupied | Renter-occupied |
| 1 Room | 0 (0.0%) | 11 (2.8%) |
| 2 or 3 Rooms | 28 (6.0%) | 64 (16.0%) |
| 4 or 5 Rooms | 105 (22.4%) | 212 (53.1%) |
| 6 or 7 Rooms | 120 (25.6%) | 71 (17.8%) |
| 8 or more Rooms | 215 (45.9%) | 41 (10.3%) |
| Total | 468 (100.0%) | 399 (100.0%) |
Housing Structure by Heating Type in Volga
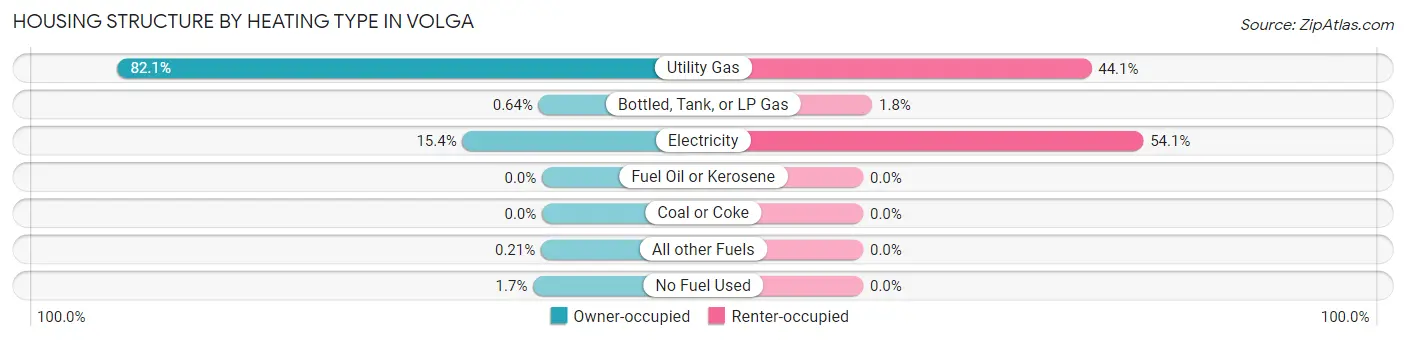
| Heating Type | Owner-occupied | Renter-occupied |
| Utility Gas | 384 (82.1%) | 176 (44.1%) |
| Bottled, Tank, or LP Gas | 3 (0.6%) | 7 (1.8%) |
| Electricity | 72 (15.4%) | 216 (54.1%) |
| Fuel Oil or Kerosene | 0 (0.0%) | 0 (0.0%) |
| Coal or Coke | 0 (0.0%) | 0 (0.0%) |
| All other Fuels | 1 (0.2%) | 0 (0.0%) |
| No Fuel Used | 8 (1.7%) | 0 (0.0%) |
| Total | 468 (100.0%) | 399 (100.0%) |
Household Vehicle Usage in Volga
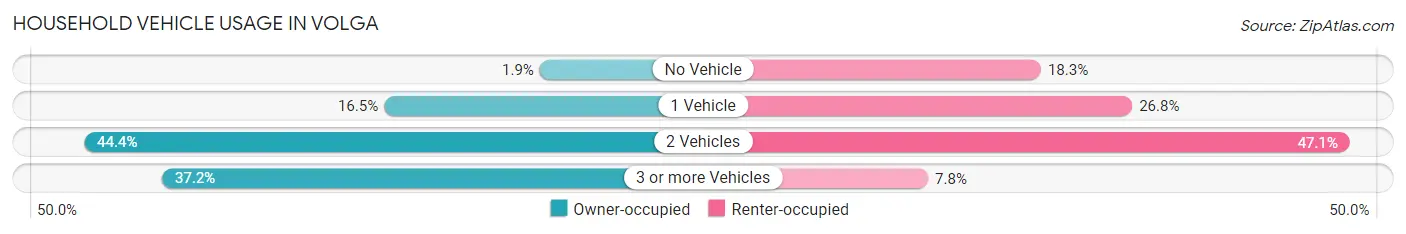
| Vehicles per Household | Owner-occupied | Renter-occupied |
| No Vehicle | 9 (1.9%) | 73 (18.3%) |
| 1 Vehicle | 77 (16.5%) | 107 (26.8%) |
| 2 Vehicles | 208 (44.4%) | 188 (47.1%) |
| 3 or more Vehicles | 174 (37.2%) | 31 (7.8%) |
| Total | 468 (100.0%) | 399 (100.0%) |
Real Estate & Mortgages in Volga
Real Estate and Mortgage Overview in Volga
| Characteristic | Without Mortgage | With Mortgage |
| Housing Units | 163 | 305 |
| Median Property Value | $207,800 | $222,700 |
| Median Household Income | $58,594 | $48 |
| Monthly Housing Costs | $540 | $0 |
| Real Estate Taxes | $2,710 | $8 |
Property Value by Mortgage Status in Volga
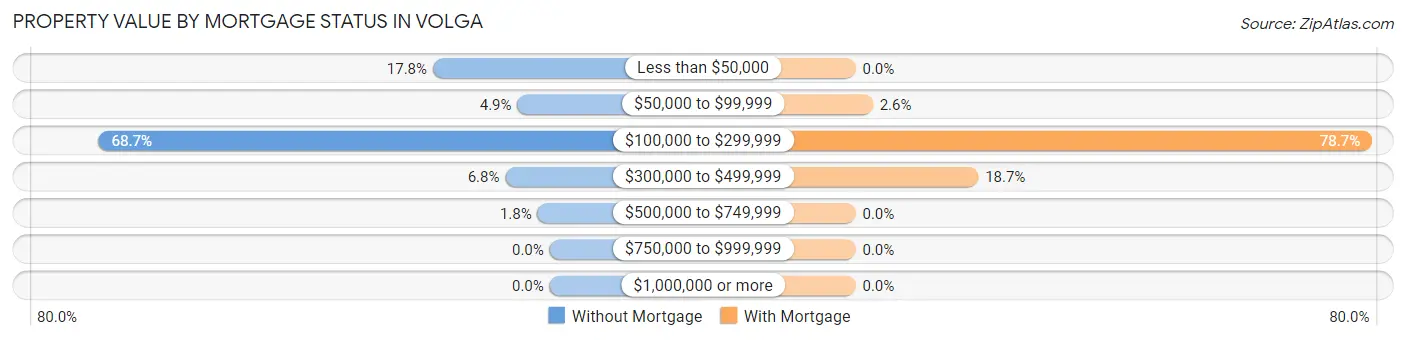
| Property Value | Without Mortgage | With Mortgage |
| Less than $50,000 | 29 (17.8%) | 0 (0.0%) |
| $50,000 to $99,999 | 8 (4.9%) | 8 (2.6%) |
| $100,000 to $299,999 | 112 (68.7%) | 240 (78.7%) |
| $300,000 to $499,999 | 11 (6.8%) | 57 (18.7%) |
| $500,000 to $749,999 | 3 (1.8%) | 0 (0.0%) |
| $750,000 to $999,999 | 0 (0.0%) | 0 (0.0%) |
| $1,000,000 or more | 0 (0.0%) | 0 (0.0%) |
| Total | 163 (100.0%) | 305 (100.0%) |
Household Income by Mortgage Status in Volga
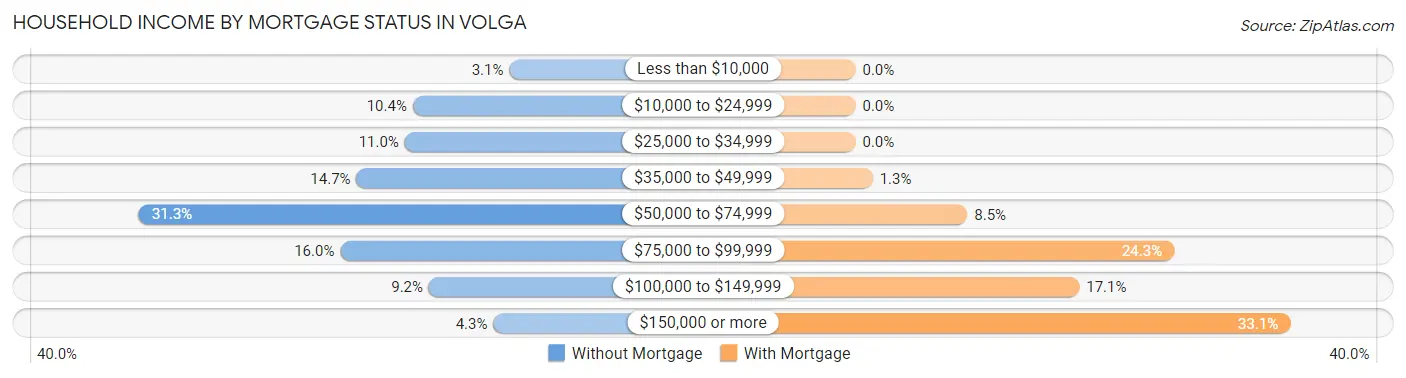
| Household Income | Without Mortgage | With Mortgage |
| Less than $10,000 | 5 (3.1%) | 0 (0.0%) |
| $10,000 to $24,999 | 17 (10.4%) | 0 (0.0%) |
| $25,000 to $34,999 | 18 (11.0%) | 0 (0.0%) |
| $35,000 to $49,999 | 24 (14.7%) | 4 (1.3%) |
| $50,000 to $74,999 | 51 (31.3%) | 26 (8.5%) |
| $75,000 to $99,999 | 26 (16.0%) | 74 (24.3%) |
| $100,000 to $149,999 | 15 (9.2%) | 52 (17.1%) |
| $150,000 or more | 7 (4.3%) | 101 (33.1%) |
| Total | 163 (100.0%) | 305 (100.0%) |
Property Value to Household Income Ratio in Volga
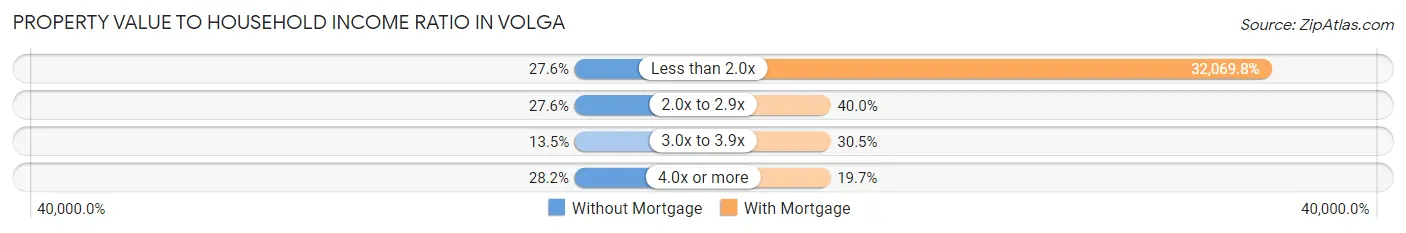
| Value-to-Income Ratio | Without Mortgage | With Mortgage |
| Less than 2.0x | 45 (27.6%) | 97,813 (32,069.8%) |
| 2.0x to 2.9x | 45 (27.6%) | 122 (40.0%) |
| 3.0x to 3.9x | 22 (13.5%) | 93 (30.5%) |
| 4.0x or more | 46 (28.2%) | 60 (19.7%) |
| Total | 163 (100.0%) | 305 (100.0%) |
Real Estate Taxes by Mortgage Status in Volga
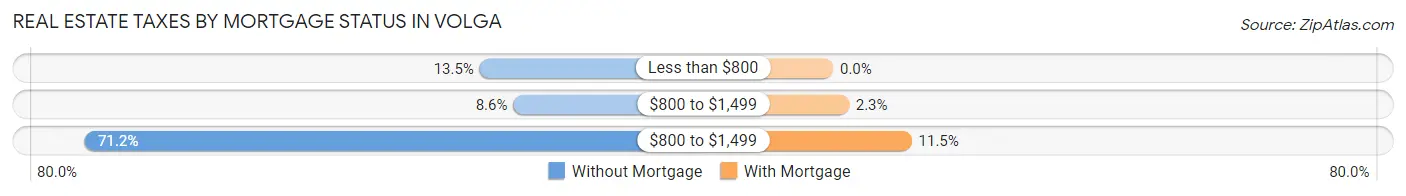
| Property Taxes | Without Mortgage | With Mortgage |
| Less than $800 | 22 (13.5%) | 0 (0.0%) |
| $800 to $1,499 | 14 (8.6%) | 7 (2.3%) |
| $800 to $1,499 | 116 (71.2%) | 35 (11.5%) |
| Total | 163 (100.0%) | 305 (100.0%) |
Health & Disability in Volga
Health Insurance Coverage by Age in Volga
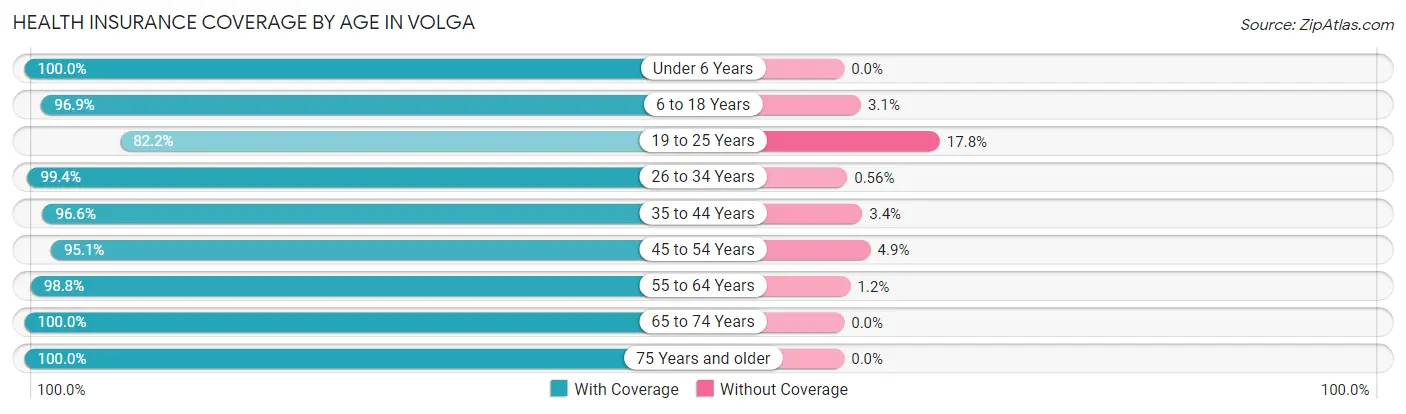
| Age Bracket | With Coverage | Without Coverage |
| Under 6 Years | 225 (100.0%) | 0 (0.0%) |
| 6 to 18 Years | 308 (96.9%) | 10 (3.1%) |
| 19 to 25 Years | 258 (82.2%) | 56 (17.8%) |
| 26 to 34 Years | 357 (99.4%) | 2 (0.6%) |
| 35 to 44 Years | 259 (96.6%) | 9 (3.4%) |
| 45 to 54 Years | 116 (95.1%) | 6 (4.9%) |
| 55 to 64 Years | 168 (98.8%) | 2 (1.2%) |
| 65 to 74 Years | 168 (100.0%) | 0 (0.0%) |
| 75 Years and older | 99 (100.0%) | 0 (0.0%) |
| Total | 1,958 (95.8%) | 85 (4.2%) |
Health Insurance Coverage by Citizenship Status in Volga
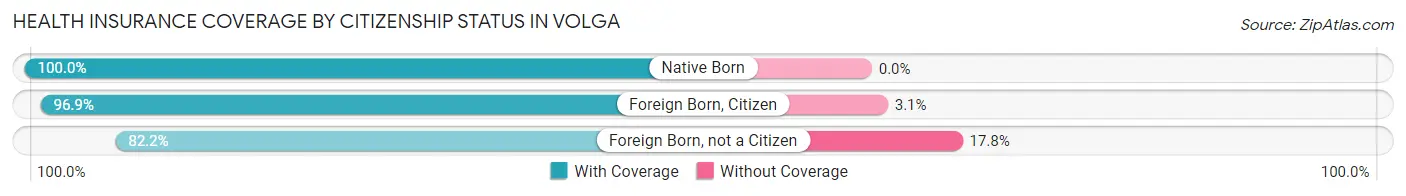
| Citizenship Status | With Coverage | Without Coverage |
| Native Born | 225 (100.0%) | 0 (0.0%) |
| Foreign Born, Citizen | 308 (96.9%) | 10 (3.1%) |
| Foreign Born, not a Citizen | 258 (82.2%) | 56 (17.8%) |
Health Insurance Coverage by Household Income in Volga
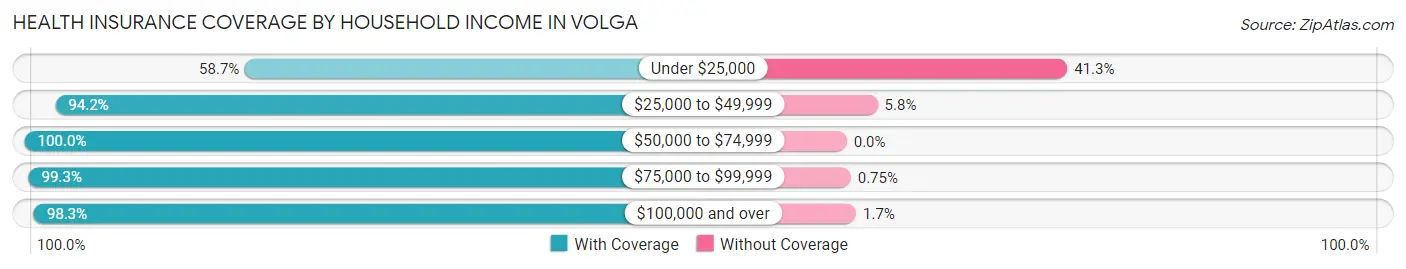
| Household Income | With Coverage | Without Coverage |
| Under $25,000 | 71 (58.7%) | 50 (41.3%) |
| $25,000 to $49,999 | 310 (94.2%) | 19 (5.8%) |
| $50,000 to $74,999 | 521 (100.0%) | 0 (0.0%) |
| $75,000 to $99,999 | 266 (99.3%) | 2 (0.7%) |
| $100,000 and over | 790 (98.3%) | 14 (1.7%) |
Public vs Private Health Insurance Coverage by Age in Volga
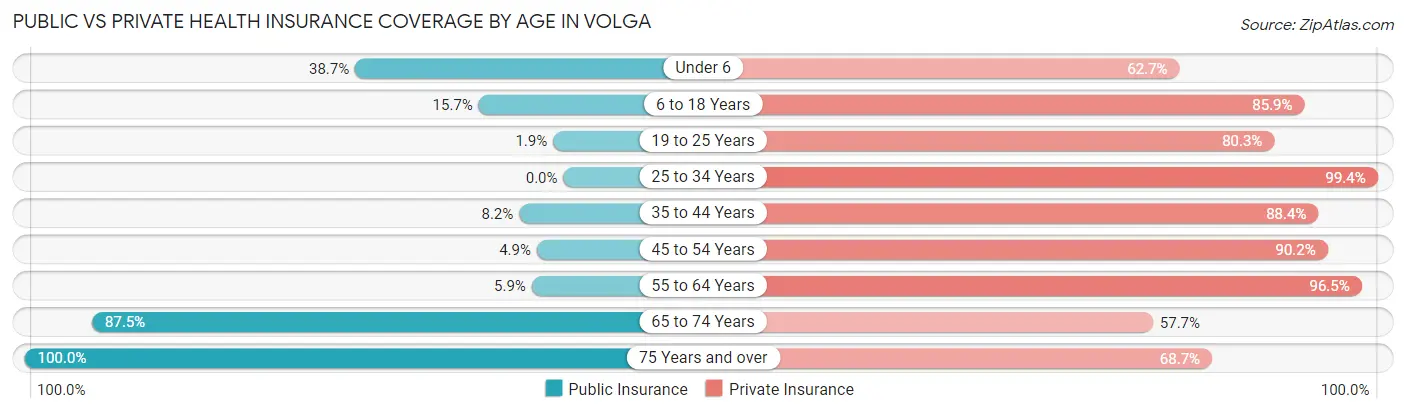
| Age Bracket | Public Insurance | Private Insurance |
| Under 6 | 87 (38.7%) | 141 (62.7%) |
| 6 to 18 Years | 50 (15.7%) | 273 (85.9%) |
| 19 to 25 Years | 6 (1.9%) | 252 (80.2%) |
| 25 to 34 Years | 0 (0.0%) | 357 (99.4%) |
| 35 to 44 Years | 22 (8.2%) | 237 (88.4%) |
| 45 to 54 Years | 6 (4.9%) | 110 (90.2%) |
| 55 to 64 Years | 10 (5.9%) | 164 (96.5%) |
| 65 to 74 Years | 147 (87.5%) | 97 (57.7%) |
| 75 Years and over | 99 (100.0%) | 68 (68.7%) |
| Total | 427 (20.9%) | 1,699 (83.2%) |
Disability Status by Sex by Age in Volga
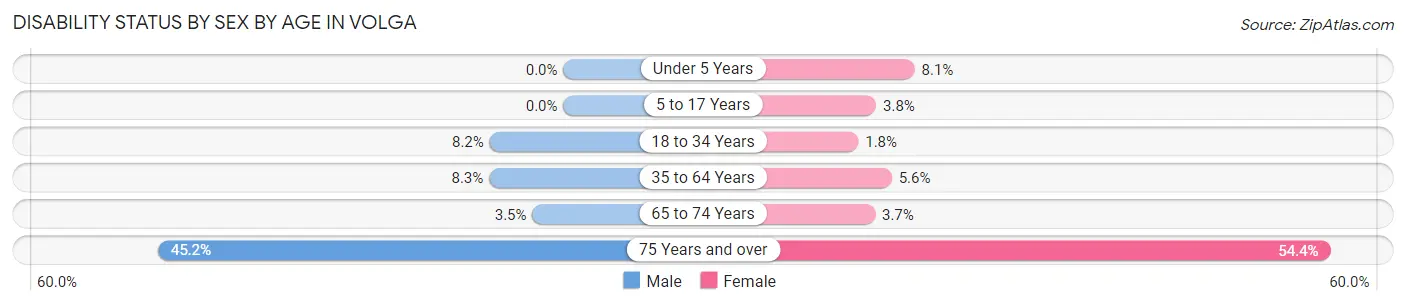
| Age Bracket | Male | Female |
| Under 5 Years | 0 (0.0%) | 6 (8.1%) |
| 5 to 17 Years | 0 (0.0%) | 6 (3.8%) |
| 18 to 34 Years | 27 (8.2%) | 7 (1.8%) |
| 35 to 64 Years | 21 (8.3%) | 17 (5.6%) |
| 65 to 74 Years | 3 (3.5%) | 3 (3.7%) |
| 75 Years and over | 14 (45.2%) | 37 (54.4%) |
Disability Class by Sex by Age in Volga
Disability Class: Hearing Difficulty
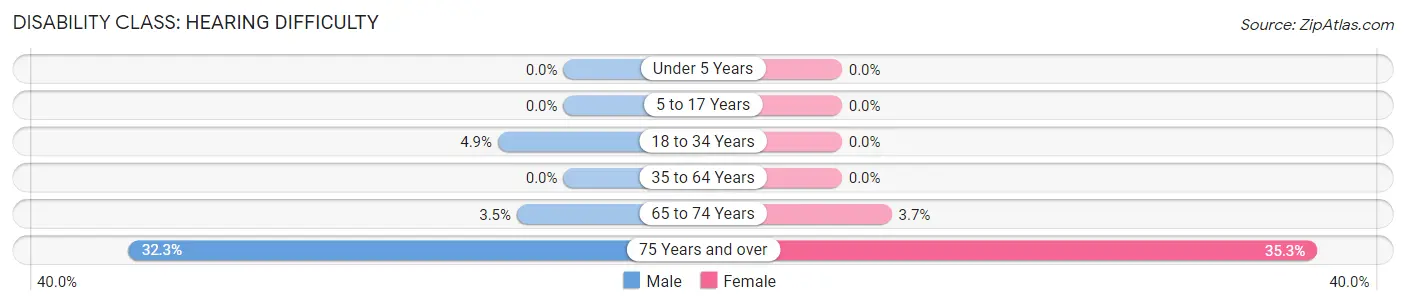
| Age Bracket | Male | Female |
| Under 5 Years | 0 (0.0%) | 0 (0.0%) |
| 5 to 17 Years | 0 (0.0%) | 0 (0.0%) |
| 18 to 34 Years | 16 (4.9%) | 0 (0.0%) |
| 35 to 64 Years | 0 (0.0%) | 0 (0.0%) |
| 65 to 74 Years | 3 (3.5%) | 3 (3.7%) |
| 75 Years and over | 10 (32.3%) | 24 (35.3%) |
Disability Class: Vision Difficulty
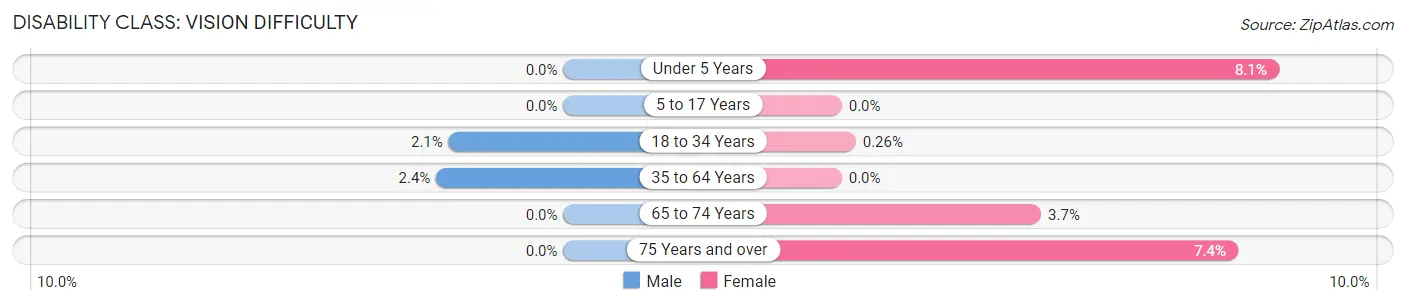
| Age Bracket | Male | Female |
| Under 5 Years | 0 (0.0%) | 6 (8.1%) |
| 5 to 17 Years | 0 (0.0%) | 0 (0.0%) |
| 18 to 34 Years | 7 (2.1%) | 1 (0.3%) |
| 35 to 64 Years | 6 (2.4%) | 0 (0.0%) |
| 65 to 74 Years | 0 (0.0%) | 3 (3.7%) |
| 75 Years and over | 0 (0.0%) | 5 (7.3%) |
Disability Class: Cognitive Difficulty
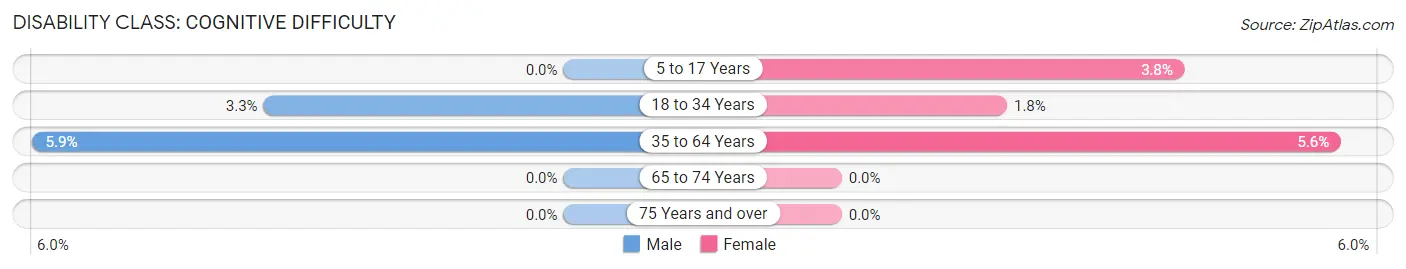
| Age Bracket | Male | Female |
| 5 to 17 Years | 0 (0.0%) | 6 (3.8%) |
| 18 to 34 Years | 11 (3.3%) | 7 (1.8%) |
| 35 to 64 Years | 15 (5.9%) | 17 (5.6%) |
| 65 to 74 Years | 0 (0.0%) | 0 (0.0%) |
| 75 Years and over | 0 (0.0%) | 0 (0.0%) |
Disability Class: Ambulatory Difficulty
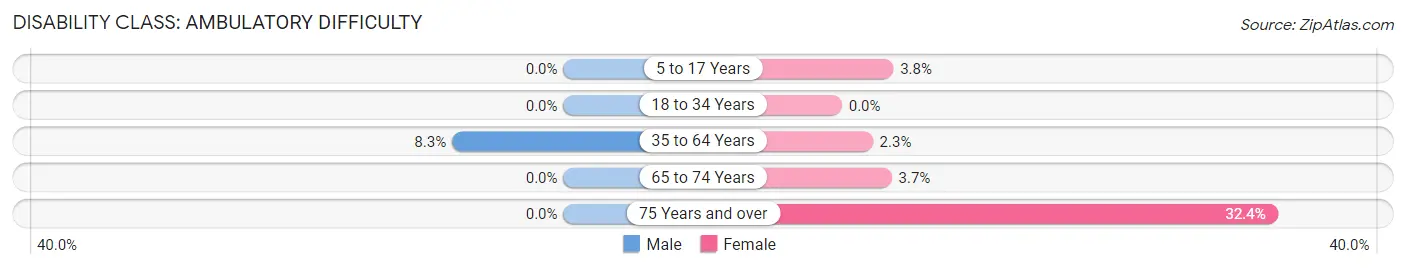
| Age Bracket | Male | Female |
| 5 to 17 Years | 0 (0.0%) | 6 (3.8%) |
| 18 to 34 Years | 0 (0.0%) | 0 (0.0%) |
| 35 to 64 Years | 21 (8.3%) | 7 (2.3%) |
| 65 to 74 Years | 0 (0.0%) | 3 (3.7%) |
| 75 Years and over | 0 (0.0%) | 22 (32.4%) |
Disability Class: Self-Care Difficulty
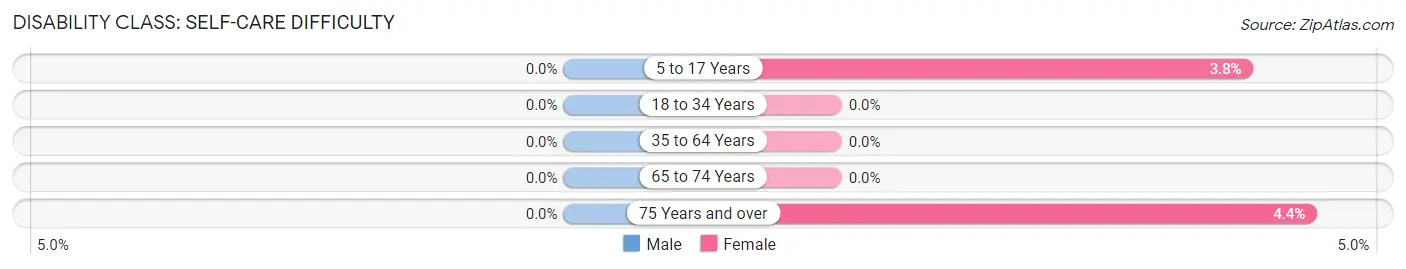
| Age Bracket | Male | Female |
| 5 to 17 Years | 0 (0.0%) | 6 (3.8%) |
| 18 to 34 Years | 0 (0.0%) | 0 (0.0%) |
| 35 to 64 Years | 0 (0.0%) | 0 (0.0%) |
| 65 to 74 Years | 0 (0.0%) | 0 (0.0%) |
| 75 Years and over | 0 (0.0%) | 3 (4.4%) |
Technology Access in Volga
Computing Device Access in Volga
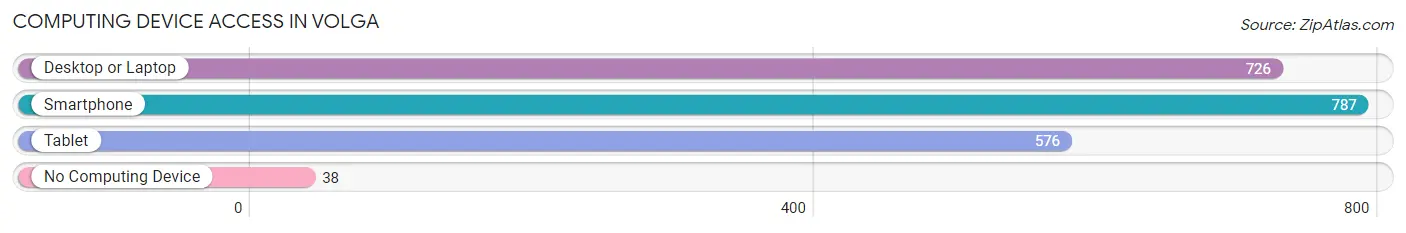
| Device Type | # Households | % Households |
| Desktop or Laptop | 726 | 83.7% |
| Smartphone | 787 | 90.8% |
| Tablet | 576 | 66.4% |
| No Computing Device | 38 | 4.4% |
| Total | 867 | 100.0% |
Internet Access in Volga
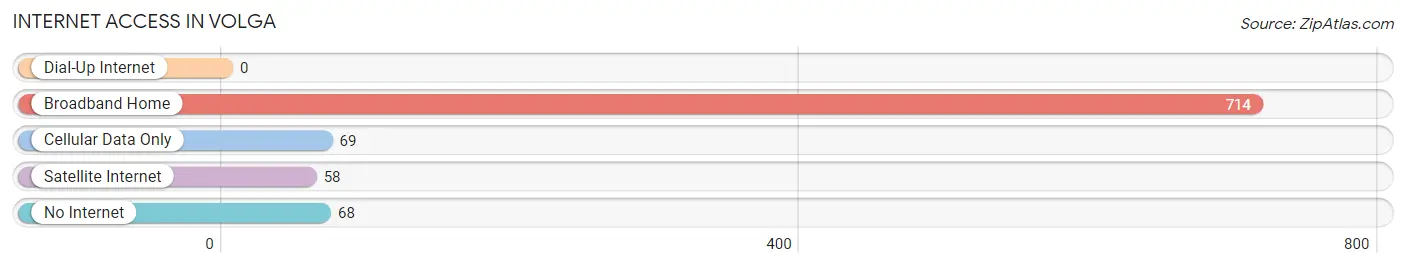
| Internet Type | # Households | % Households |
| Dial-Up Internet | 0 | 0.0% |
| Broadband Home | 714 | 82.4% |
| Cellular Data Only | 69 | 8.0% |
| Satellite Internet | 58 | 6.7% |
| No Internet | 68 | 7.8% |
| Total | 867 | 100.0% |
Volga Summary
Volga, South Dakota is a small town located in Brookings County, in the southeastern corner of the state. It is situated on the banks of the Big Sioux River, and is home to a population of just over 1,000 people. The town was founded in 1881 by a group of Norwegian immigrants, and has since become a thriving agricultural community.
Geography
Volga is located in the southeastern corner of South Dakota, in Brookings County. It is situated on the banks of the Big Sioux River, and is surrounded by rolling hills and prairies. The town is located approximately 25 miles east of Brookings, the county seat, and is about an hour and a half drive from Sioux Falls, the state’s largest city.
The town is located at an elevation of 1,400 feet, and has a total area of 0.8 square miles. The climate in Volga is characterized by hot summers and cold winters, with an average annual temperature of 48 degrees Fahrenheit.
Economy
The economy of Volga is largely based on agriculture. The town is home to several large farms, which produce a variety of crops, including corn, soybeans, wheat, and hay. The town also has a number of small businesses, including a grocery store, a hardware store, and a few restaurants.
The town is also home to a number of manufacturing companies, including a furniture factory, a plastics factory, and a metal fabrication plant. The town is also home to a number of small businesses, including a gas station, a barber shop, and a beauty salon.
Demographics
As of the 2010 census, the population of Volga was 1,039. The racial makeup of the town was 97.3% White, 0.3% African American, 0.2% Native American, 0.2% Asian, 0.1% Pacific Islander, 0.7% from other races, and 1.3% from two or more races. Hispanic or Latino of any race were 1.7% of the population.
The median income for a household in Volga was $41,250, and the median income for a family was $50,000. The per capita income for the town was $19,945. About 8.3% of families and 10.2% of the population were below the poverty line, including 11.3% of those under age 18 and 8.3% of those age 65 or over.
Conclusion
Volga, South Dakota is a small town located in Brookings County, in the southeastern corner of the state. It is situated on the banks of the Big Sioux River, and is home to a population of just over 1,000 people. The town was founded in 1881 by a group of Norwegian immigrants, and has since become a thriving agricultural community. The economy of Volga is largely based on agriculture, and the town is also home to a number of manufacturing companies and small businesses. The population of Volga is predominantly white, with a small percentage of African American, Native American, Asian, and Pacific Islander residents. The median income for a household in Volga is $41,250, and the per capita income for the town is $19,945.
Common Questions
What is Per Capita Income in Volga?
Per Capita income in Volga is $32,236.
What is the Median Family Income in Volga?
Median Family Income in Volga is $92,188.
What is the Median Household income in Volga?
Median Household Income in Volga is $66,285.
What is Income or Wage Gap in Volga?
Income or Wage Gap in Volga is 27.9%.
Women in Volga earn 72.1 cents for every dollar earned by a man.
What is Inequality or Gini Index in Volga?
Inequality or Gini Index in Volga is 0.33.
What is the Total Population of Volga?
Total Population of Volga is 2,043.
What is the Total Male Population of Volga?
Total Male Population of Volga is 977.
What is the Total Female Population of Volga?
Total Female Population of Volga is 1,066.
What is the Ratio of Males per 100 Females in Volga?
There are 91.65 Males per 100 Females in Volga.
What is the Ratio of Females per 100 Males in Volga?
There are 109.11 Females per 100 Males in Volga.
What is the Median Population Age in Volga?
Median Population Age in Volga is 27.9 Years.
What is the Average Family Size in Volga
Average Family Size in Volga is 3.1 People.
What is the Average Household Size in Volga
Average Household Size in Volga is 2.4 People.
How Large is the Labor Force in Volga?
There are 1,171 People in the Labor Forcein in Volga.
What is the Percentage of People in the Labor Force in Volga?
74.7% of People are in the Labor Force in Volga.
What is the Unemployment Rate in Volga?
Unemployment Rate in Volga is 1.1%.