Alexandria, SD Map & Demographics
Alexandria Map
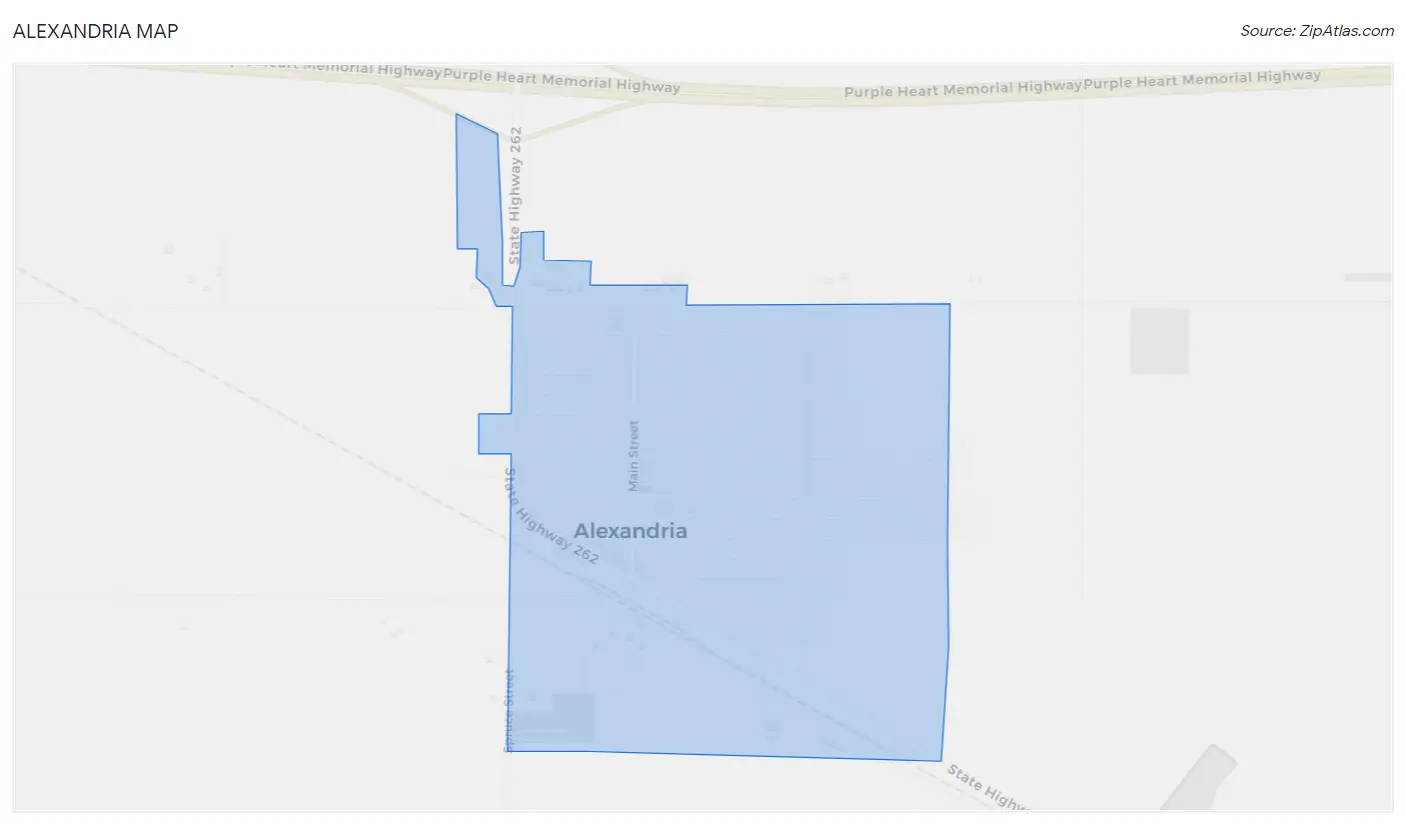
Alexandria Overview
$31,177
PER CAPITA INCOME
$97,426
AVG FAMILY INCOME
$89,750
AVG HOUSEHOLD INCOME
18.8%
WAGE / INCOME GAP [ % ]
81.2¢/ $1
WAGE / INCOME GAP [ $ ]
0.28
INEQUALITY / GINI INDEX
839
TOTAL POPULATION
415
MALE POPULATION
424
FEMALE POPULATION
97.88
MALES / 100 FEMALES
102.17
FEMALES / 100 MALES
33.5
MEDIAN AGE
3.7
AVG FAMILY SIZE
3.1
AVG HOUSEHOLD SIZE
463
LABOR FORCE [ PEOPLE ]
77.6%
PERCENT IN LABOR FORCE
Alexandria Zip Codes
Alexandria Area Codes
Income in Alexandria
Income Overview in Alexandria
Per Capita Income in Alexandria is $31,177, while median incomes of families and households are $97,426 and $89,750 respectively.
| Characteristic | Number | Measure |
| Per Capita Income | 839 | $31,177 |
| Median Family Income | 207 | $97,426 |
| Mean Family Income | 207 | $103,222 |
| Median Household Income | 273 | $89,750 |
| Mean Household Income | 273 | $91,588 |
| Income Deficit | 207 | $0 |
| Wage / Income Gap (%) | 839 | 18.79% |
| Wage / Income Gap ($) | 839 | 81.21¢ per $1 |
| Gini / Inequality Index | 839 | 0.28 |
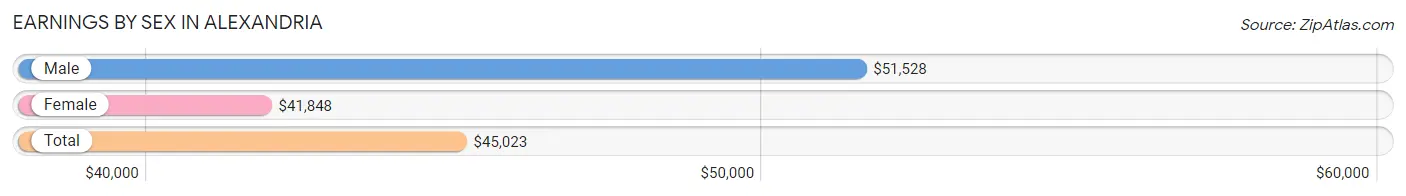
Earnings by Sex in Alexandria
Average Earnings in Alexandria are $45,023, $51,528 for men and $41,848 for women, a difference of 18.8%.
| Sex | Number | Average Earnings |
| Male | 261 (51.1%) | $51,528 |
| Female | 250 (48.9%) | $41,848 |
| Total | 511 (100.0%) | $45,023 |
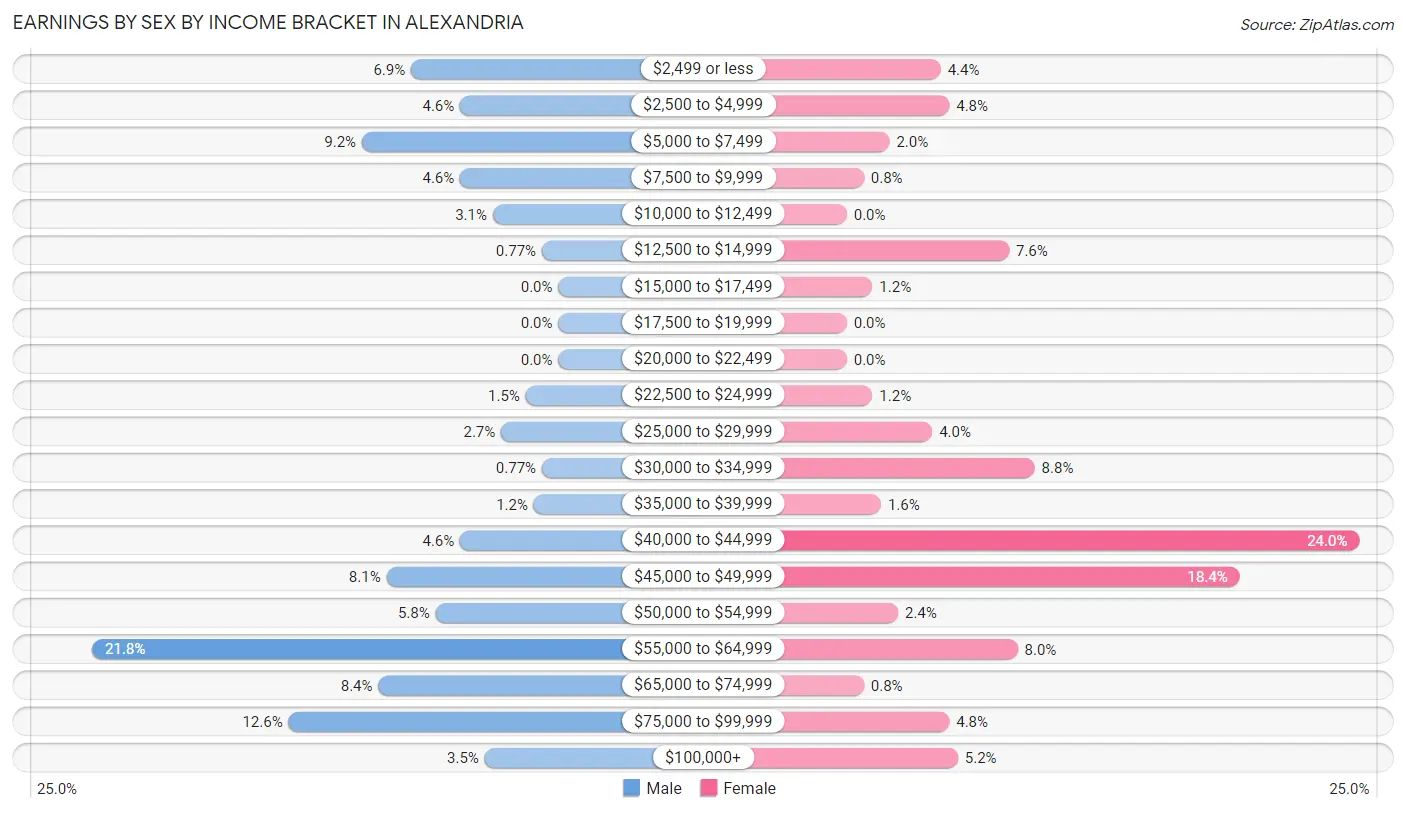
Earnings by Sex by Income Bracket in Alexandria
The most common earnings brackets in Alexandria are $55,000 to $64,999 for men (57 | 21.8%) and $40,000 to $44,999 for women (60 | 24.0%).
| Income | Male | Female |
| $2,499 or less | 18 (6.9%) | 11 (4.4%) |
| $2,500 to $4,999 | 12 (4.6%) | 12 (4.8%) |
| $5,000 to $7,499 | 24 (9.2%) | 5 (2.0%) |
| $7,500 to $9,999 | 12 (4.6%) | 2 (0.8%) |
| $10,000 to $12,499 | 8 (3.1%) | 0 (0.0%) |
| $12,500 to $14,999 | 2 (0.8%) | 19 (7.6%) |
| $15,000 to $17,499 | 0 (0.0%) | 3 (1.2%) |
| $17,500 to $19,999 | 0 (0.0%) | 0 (0.0%) |
| $20,000 to $22,499 | 0 (0.0%) | 0 (0.0%) |
| $22,500 to $24,999 | 4 (1.5%) | 3 (1.2%) |
| $25,000 to $29,999 | 7 (2.7%) | 10 (4.0%) |
| $30,000 to $34,999 | 2 (0.8%) | 22 (8.8%) |
| $35,000 to $39,999 | 3 (1.1%) | 4 (1.6%) |
| $40,000 to $44,999 | 12 (4.6%) | 60 (24.0%) |
| $45,000 to $49,999 | 21 (8.1%) | 46 (18.4%) |
| $50,000 to $54,999 | 15 (5.8%) | 6 (2.4%) |
| $55,000 to $64,999 | 57 (21.8%) | 20 (8.0%) |
| $65,000 to $74,999 | 22 (8.4%) | 2 (0.8%) |
| $75,000 to $99,999 | 33 (12.6%) | 12 (4.8%) |
| $100,000+ | 9 (3.5%) | 13 (5.2%) |
| Total | 261 (100.0%) | 250 (100.0%) |
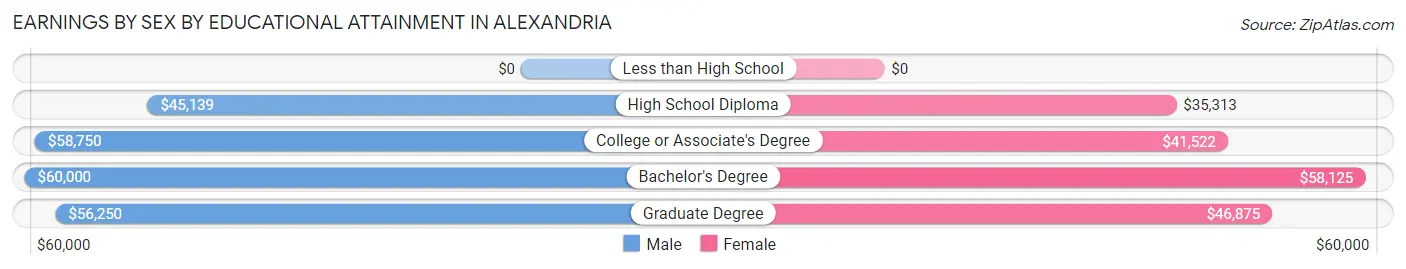
Earnings by Sex by Educational Attainment in Alexandria
Average earnings in Alexandria are $56,520 for men and $42,201 for women, a difference of 25.3%. Men with an educational attainment of bachelor's degree enjoy the highest average annual earnings of $60,000, while those with high school diploma education earn the least with $45,139. Women with an educational attainment of bachelor's degree earn the most with the average annual earnings of $58,125, while those with high school diploma education have the smallest earnings of $35,313.
| Educational Attainment | Male Income | Female Income |
| Less than High School | - | - |
| High School Diploma | $45,139 | $35,313 |
| College or Associate's Degree | $58,750 | $41,522 |
| Bachelor's Degree | $60,000 | $58,125 |
| Graduate Degree | $56,250 | $46,875 |
| Total | $56,520 | $42,201 |
Family Income in Alexandria
Family Income Brackets in Alexandria
According to the Alexandria family income data, there are 84 families falling into the $100,000 to $149,999 income range, which is the most common income bracket and makes up 40.6% of all families.
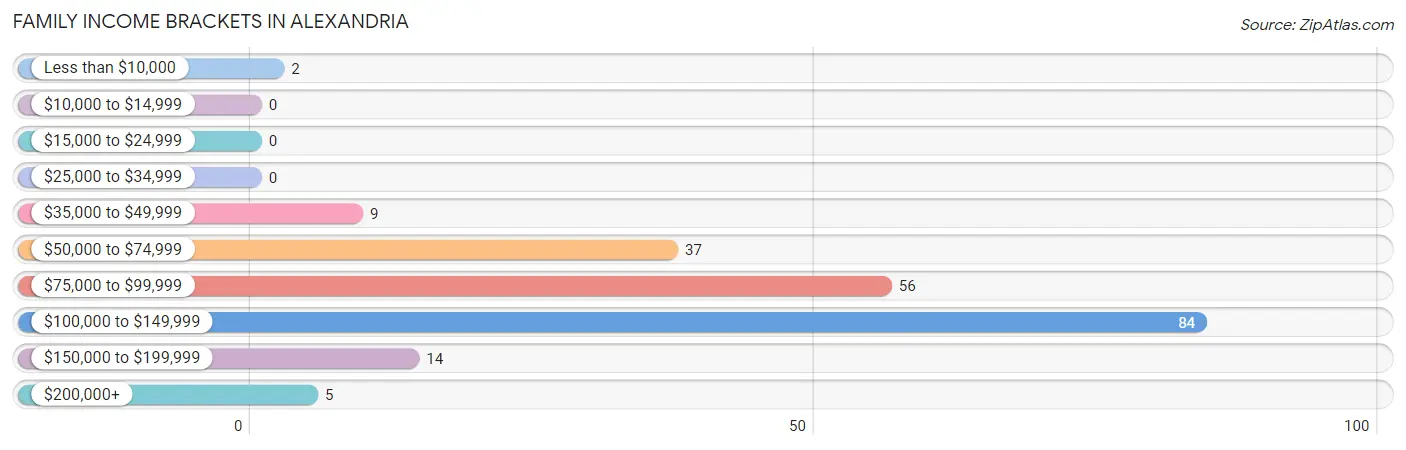
| Income Bracket | # Families | % Families |
| Less than $10,000 | 2 | 1.0% |
| $10,000 to $14,999 | 0 | 0.0% |
| $15,000 to $24,999 | 0 | 0.0% |
| $25,000 to $34,999 | 0 | 0.0% |
| $35,000 to $49,999 | 9 | 4.3% |
| $50,000 to $74,999 | 37 | 17.9% |
| $75,000 to $99,999 | 56 | 27.1% |
| $100,000 to $149,999 | 84 | 40.6% |
| $150,000 to $199,999 | 14 | 6.8% |
| $200,000+ | 5 | 2.4% |
Family Income by Famaliy Size in Alexandria
5-person families (16 | 7.7%) account for the highest median family income in Alexandria with $131,875 per family, while 2-person families (91 | 44.0%) have the highest median income of $44,375 per family member.
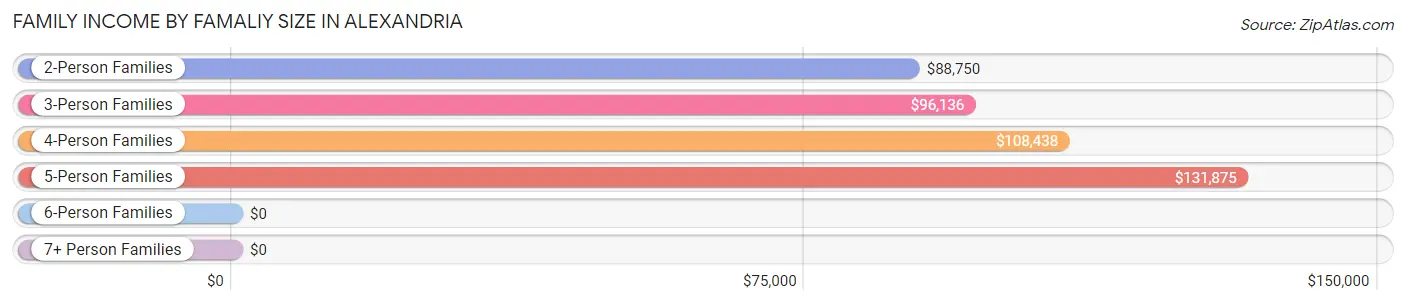
| Income Bracket | # Families | Median Income |
| 2-Person Families | 91 (44.0%) | $88,750 |
| 3-Person Families | 36 (17.4%) | $96,136 |
| 4-Person Families | 60 (29.0%) | $108,438 |
| 5-Person Families | 16 (7.7%) | $131,875 |
| 6-Person Families | 4 (1.9%) | $0 |
| 7+ Person Families | 0 (0.0%) | $0 |
| Total | 207 (100.0%) | $97,426 |
Family Income by Number of Earners in Alexandria
The median family income in Alexandria is $97,426, with families comprising 2 earners (117) having the highest median family income of $114,688, while families with no earners (23) have the lowest median family income of $56,806, accounting for 56.5% and 11.1% of families, respectively.
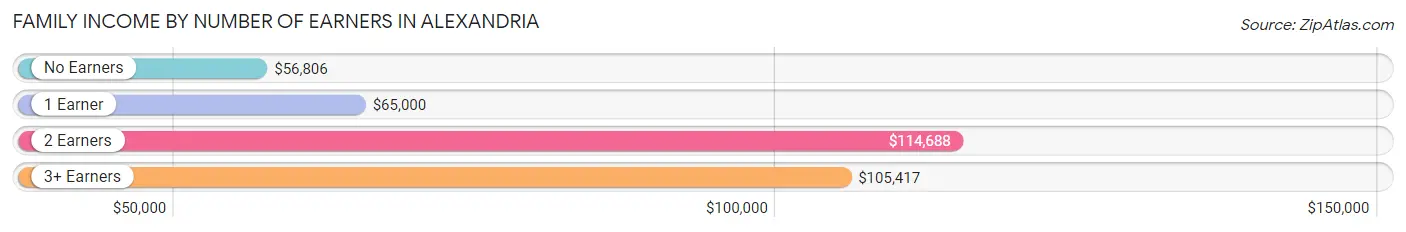
| Number of Earners | # Families | Median Income |
| No Earners | 23 (11.1%) | $56,806 |
| 1 Earner | 36 (17.4%) | $65,000 |
| 2 Earners | 117 (56.5%) | $114,688 |
| 3+ Earners | 31 (15.0%) | $105,417 |
| Total | 207 (100.0%) | $97,426 |
Household Income in Alexandria
Household Income Brackets in Alexandria
With 84 households falling in the category, the $100,000 to $149,999 income range is the most frequent in Alexandria, accounting for 30.8% of all households. In contrast, only 2 households (0.7%) fall into the $10,000 to $14,999 income bracket, making it the least populous group.
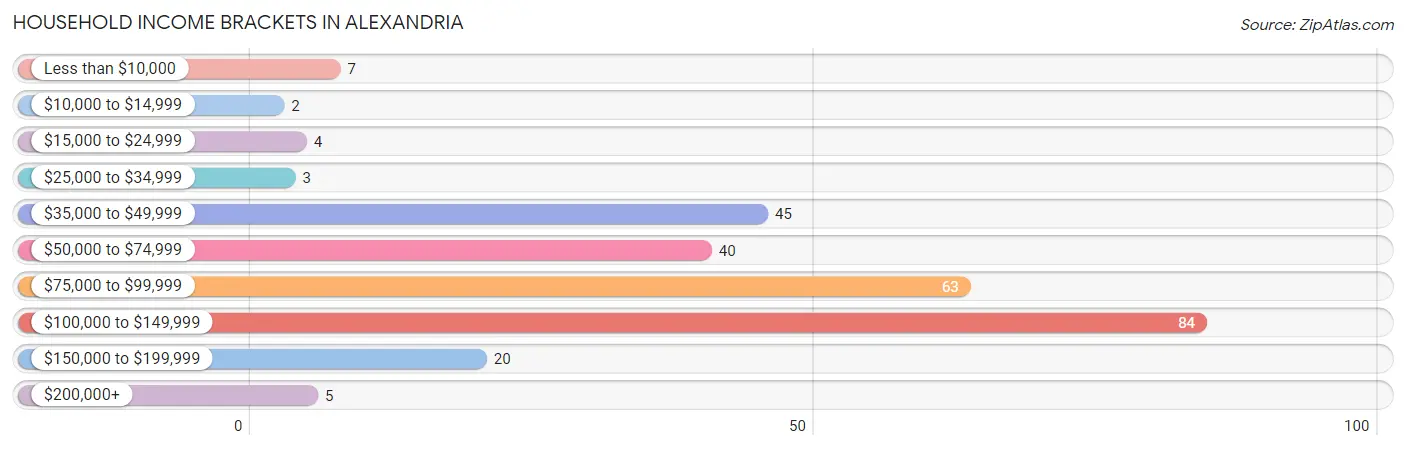
| Income Bracket | # Households | % Households |
| Less than $10,000 | 7 | 2.6% |
| $10,000 to $14,999 | 2 | 0.7% |
| $15,000 to $24,999 | 4 | 1.5% |
| $25,000 to $34,999 | 3 | 1.1% |
| $35,000 to $49,999 | 45 | 16.5% |
| $50,000 to $74,999 | 40 | 14.7% |
| $75,000 to $99,999 | 63 | 23.1% |
| $100,000 to $149,999 | 84 | 30.8% |
| $150,000 to $199,999 | 20 | 7.3% |
| $200,000+ | 5 | 1.8% |
Household Income by Householder Age in Alexandria
The median household income in Alexandria is $89,750, with the highest median household income of $106,000 found in the 25 to 44 years age bracket for the primary householder. A total of 96 households (35.2%) fall into this category. Meanwhile, the 15 to 24 years age bracket for the primary householder has the lowest median household income of $46,750, with 7 households (2.6%) in this group.
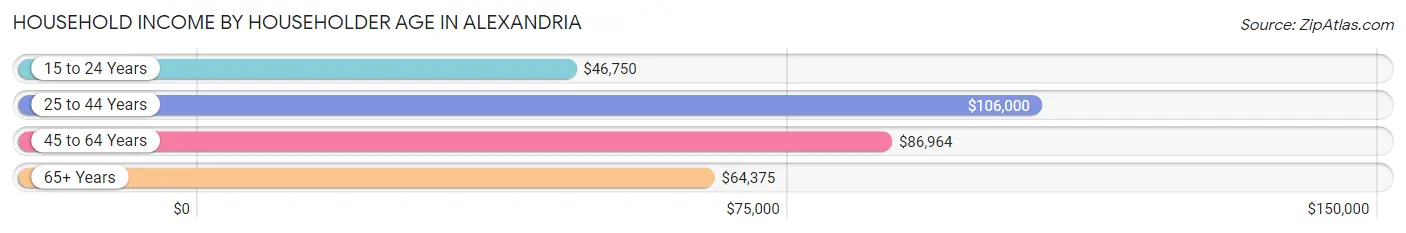
| Income Bracket | # Households | Median Income |
| 15 to 24 Years | 7 (2.6%) | $46,750 |
| 25 to 44 Years | 96 (35.2%) | $106,000 |
| 45 to 64 Years | 99 (36.3%) | $86,964 |
| 65+ Years | 71 (26.0%) | $64,375 |
| Total | 273 (100.0%) | $89,750 |
Poverty in Alexandria
Income Below Poverty by Sex and Age in Alexandria
With 1.0% poverty level for males and 1.7% for females among the residents of Alexandria, 75 year old and over males and 75 year old and over females are the most vulnerable to poverty, with 2 males (14.3%) and 5 females (50.0%) in their respective age groups living below the poverty level.
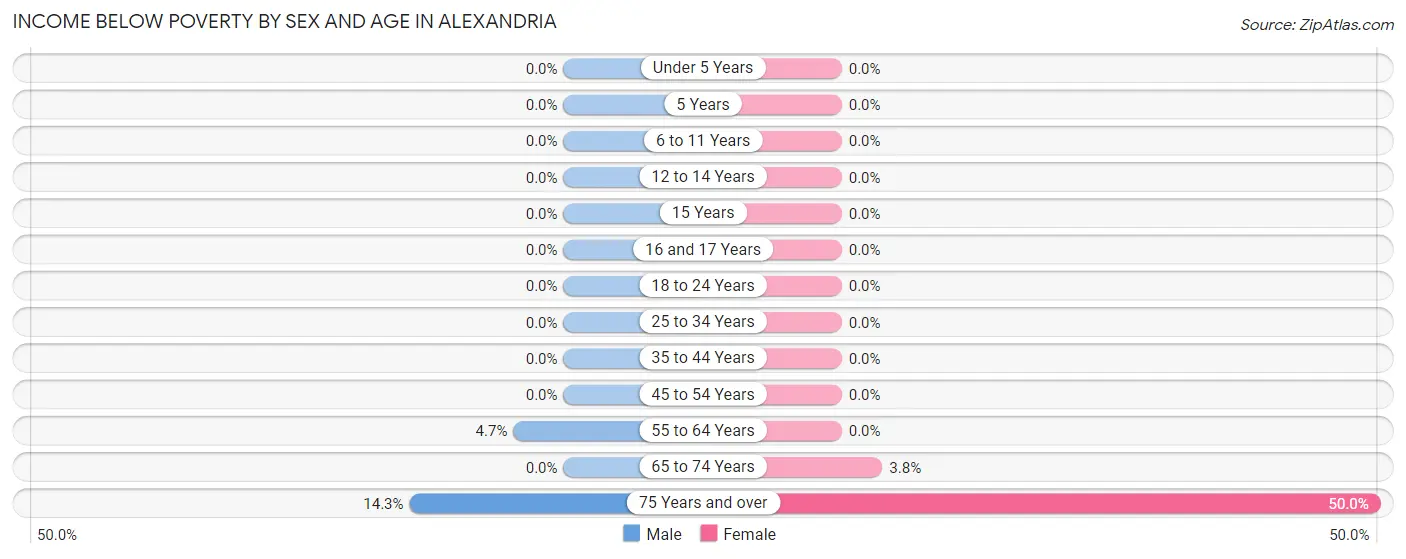
| Age Bracket | Male | Female |
| Under 5 Years | 0 (0.0%) | 0 (0.0%) |
| 5 Years | 0 (0.0%) | 0 (0.0%) |
| 6 to 11 Years | 0 (0.0%) | 0 (0.0%) |
| 12 to 14 Years | 0 (0.0%) | 0 (0.0%) |
| 15 Years | 0 (0.0%) | 0 (0.0%) |
| 16 and 17 Years | 0 (0.0%) | 0 (0.0%) |
| 18 to 24 Years | 0 (0.0%) | 0 (0.0%) |
| 25 to 34 Years | 0 (0.0%) | 0 (0.0%) |
| 35 to 44 Years | 0 (0.0%) | 0 (0.0%) |
| 45 to 54 Years | 0 (0.0%) | 0 (0.0%) |
| 55 to 64 Years | 2 (4.6%) | 0 (0.0%) |
| 65 to 74 Years | 0 (0.0%) | 2 (3.8%) |
| 75 Years and over | 2 (14.3%) | 5 (50.0%) |
| Total | 4 (1.0%) | 7 (1.7%) |
Income Above Poverty by Sex and Age in Alexandria
According to the poverty statistics in Alexandria, males aged under 5 years and females aged under 5 years are the age groups that are most secure financially, with 100.0% of males and 100.0% of females in these age groups living above the poverty line.
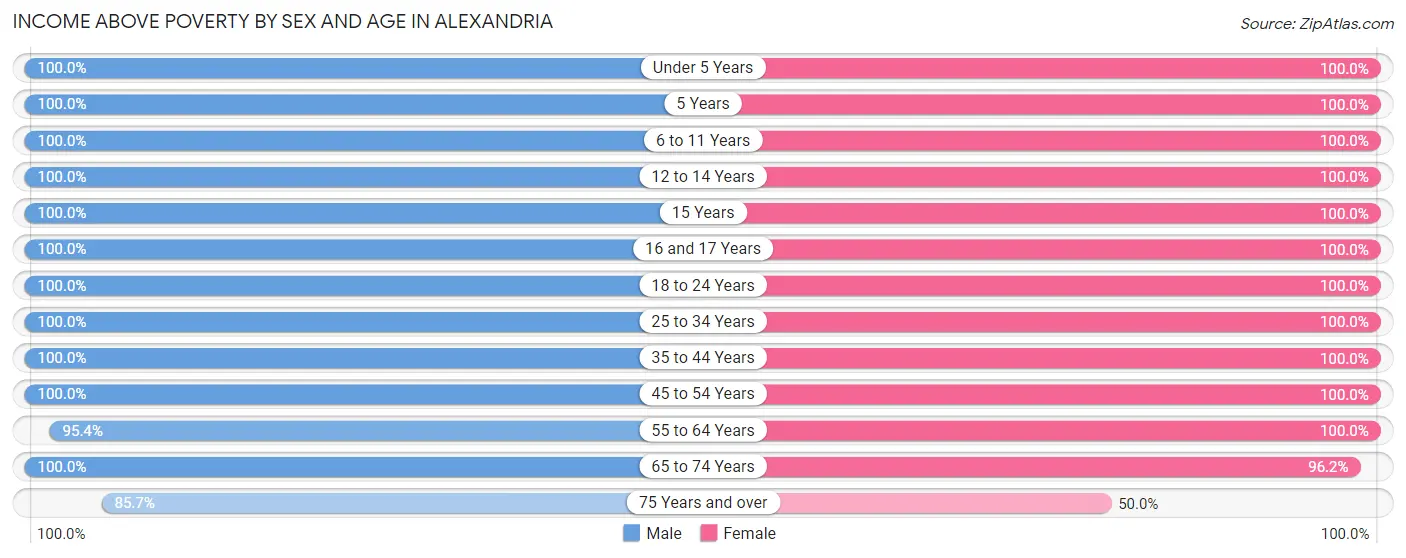
| Age Bracket | Male | Female |
| Under 5 Years | 26 (100.0%) | 50 (100.0%) |
| 5 Years | 2 (100.0%) | 4 (100.0%) |
| 6 to 11 Years | 31 (100.0%) | 21 (100.0%) |
| 12 to 14 Years | 26 (100.0%) | 47 (100.0%) |
| 15 Years | 33 (100.0%) | 2 (100.0%) |
| 16 and 17 Years | 30 (100.0%) | 6 (100.0%) |
| 18 to 24 Years | 40 (100.0%) | 12 (100.0%) |
| 25 to 34 Years | 40 (100.0%) | 92 (100.0%) |
| 35 to 44 Years | 51 (100.0%) | 44 (100.0%) |
| 45 to 54 Years | 30 (100.0%) | 27 (100.0%) |
| 55 to 64 Years | 41 (95.4%) | 56 (100.0%) |
| 65 to 74 Years | 49 (100.0%) | 51 (96.2%) |
| 75 Years and over | 12 (85.7%) | 5 (50.0%) |
| Total | 411 (99.0%) | 417 (98.4%) |
Income Below Poverty Among Married-Couple Families in Alexandria
The poverty statistics for married-couple families in Alexandria show that 1.1% or 2 of the total 183 families live below the poverty line. Families with no children have the highest poverty rate of 1.9%, comprising of 2 families. On the other hand, families with 1 or 2 children have the lowest poverty rate of 0.0%, which includes 0 families.
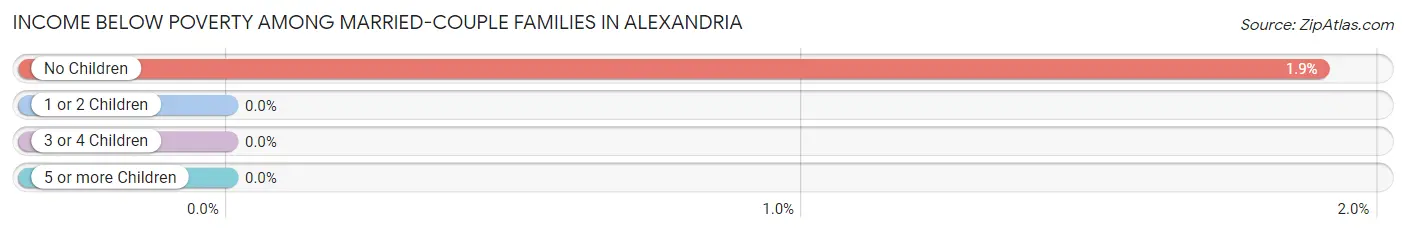
| Children | Above Poverty | Below Poverty |
| No Children | 103 (98.1%) | 2 (1.9%) |
| 1 or 2 Children | 63 (100.0%) | 0 (0.0%) |
| 3 or 4 Children | 15 (100.0%) | 0 (0.0%) |
| 5 or more Children | 0 (0.0%) | 0 (0.0%) |
| Total | 181 (98.9%) | 2 (1.1%) |
Income Below Poverty Among Single-Parent Households in Alexandria
| Children | Single Father | Single Mother |
| No Children | 0 (0.0%) | 0 (0.0%) |
| 1 or 2 Children | 0 (0.0%) | 0 (0.0%) |
| 3 or 4 Children | 0 (0.0%) | 0 (0.0%) |
| 5 or more Children | 0 (0.0%) | 0 (0.0%) |
| Total | 0 (0.0%) | 0 (0.0%) |
Income Below Poverty Among Married-Couple vs Single-Parent Households in Alexandria
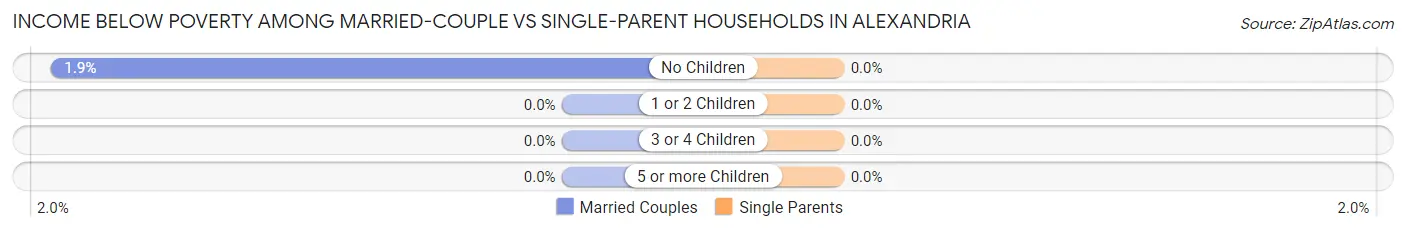
| Children | Married-Couple Families | Single-Parent Households |
| No Children | 2 (1.9%) | 0 (0.0%) |
| 1 or 2 Children | 0 (0.0%) | 0 (0.0%) |
| 3 or 4 Children | 0 (0.0%) | 0 (0.0%) |
| 5 or more Children | 0 (0.0%) | 0 (0.0%) |
| Total | 2 (1.1%) | 0 (0.0%) |
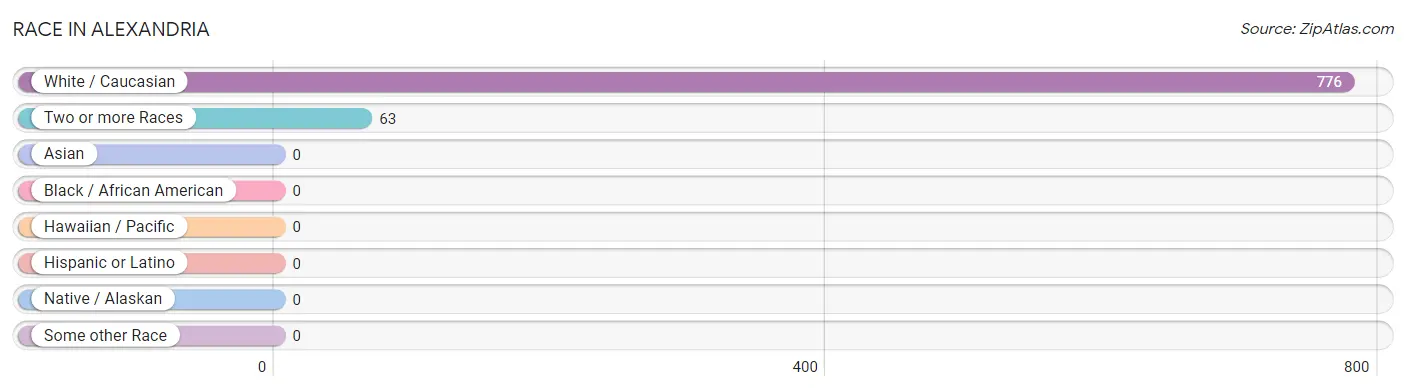
Race in Alexandria
The most populous races in Alexandria are White / Caucasian (776 | 92.5%), and Two or more Races (63 | 7.5%).
| Race | # Population | % Population |
| Asian | 0 | 0.0% |
| Black / African American | 0 | 0.0% |
| Hawaiian / Pacific | 0 | 0.0% |
| Hispanic or Latino | 0 | 0.0% |
| Native / Alaskan | 0 | 0.0% |
| White / Caucasian | 776 | 92.5% |
| Two or more Races | 63 | 7.5% |
| Some other Race | 0 | 0.0% |
| Total | 839 | 100.0% |
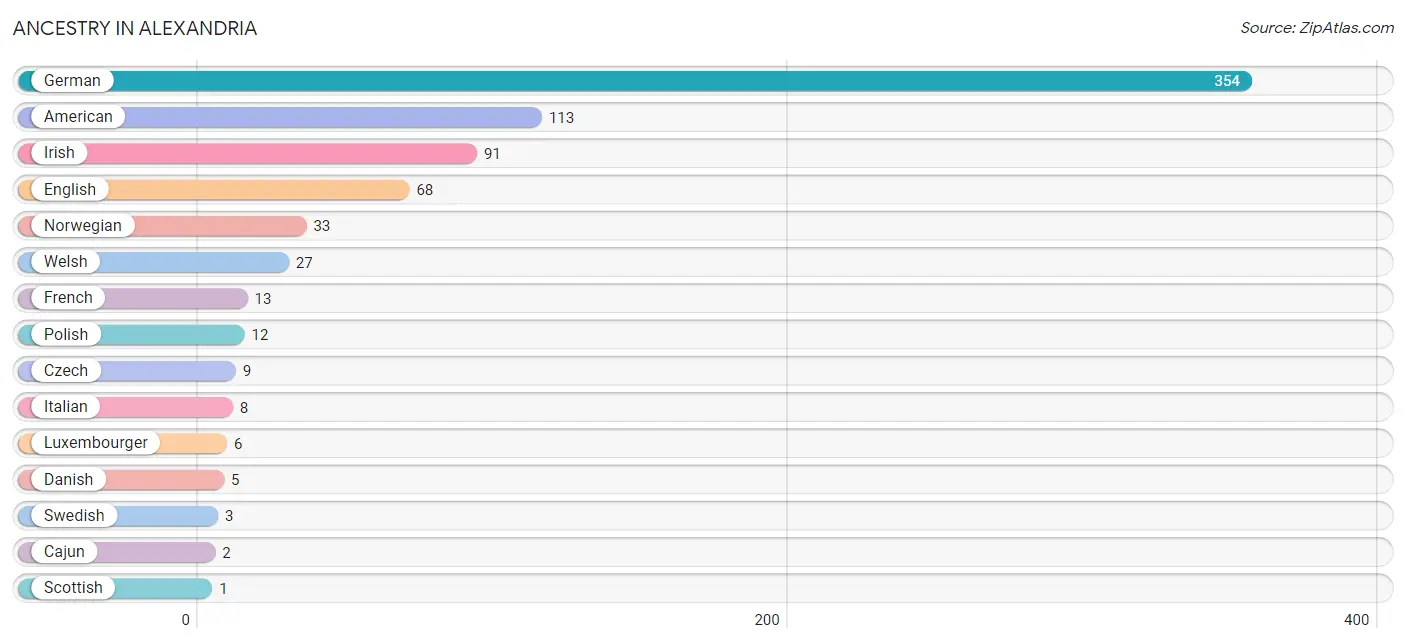
Ancestry in Alexandria
The most populous ancestries reported in Alexandria are German (354 | 42.2%), American (113 | 13.5%), Irish (91 | 10.8%), English (68 | 8.1%), and Norwegian (33 | 3.9%), together accounting for 78.5% of all Alexandria residents.
| Ancestry | # Population | % Population |
| American | 113 | 13.5% |
| Cajun | 2 | 0.2% |
| Czech | 9 | 1.1% |
| Danish | 5 | 0.6% |
| English | 68 | 8.1% |
| French | 13 | 1.5% |
| German | 354 | 42.2% |
| Irish | 91 | 10.8% |
| Italian | 8 | 0.9% |
| Luxembourger | 6 | 0.7% |
| Norwegian | 33 | 3.9% |
| Polish | 12 | 1.4% |
| Scottish | 1 | 0.1% |
| Swedish | 3 | 0.4% |
| Welsh | 27 | 3.2% | View All 15 Rows |
Immigrants in Alexandria

| Immigration Origin | # Population | % Population | View All 0 Rows |
Sex and Age in Alexandria
Sex and Age in Alexandria
The most populous age groups in Alexandria are 15 to 19 Years (78 | 18.8%) for men and 30 to 34 Years (66 | 15.6%) for women.
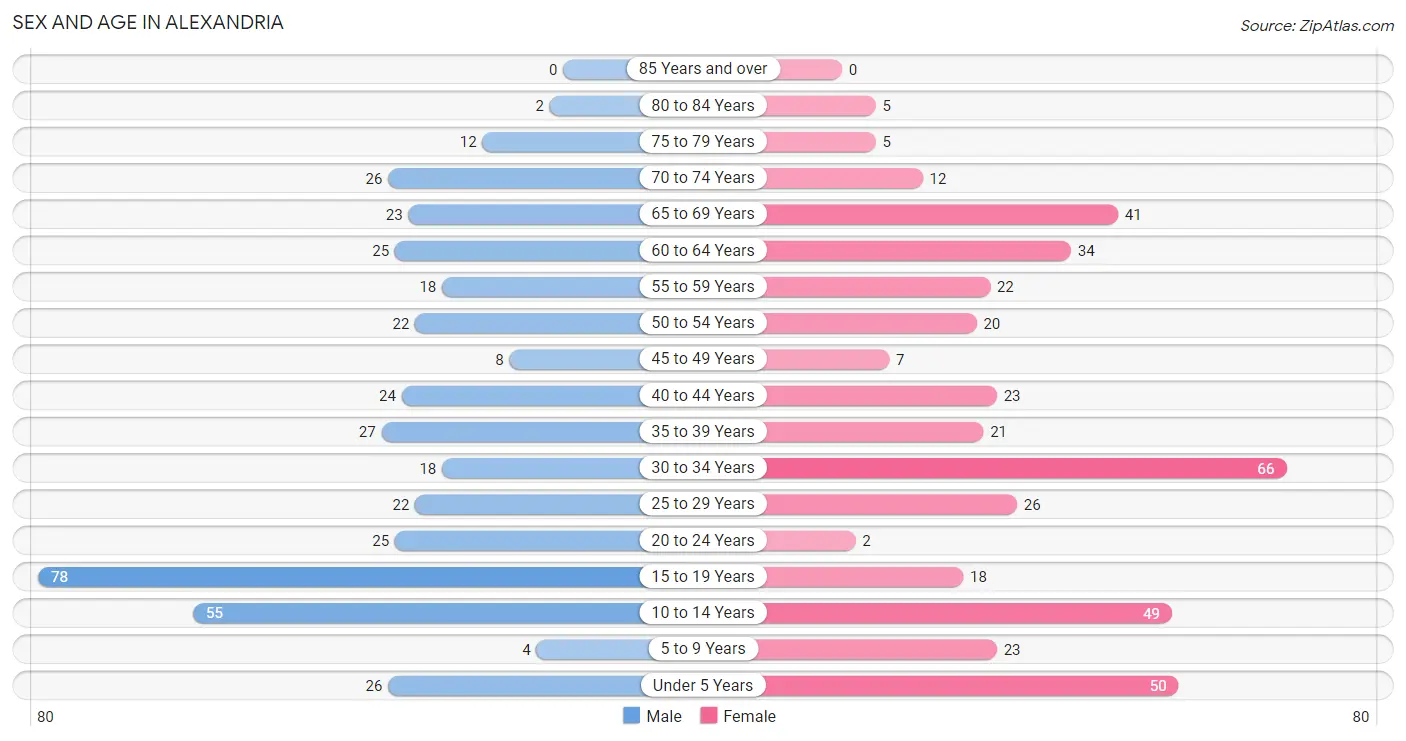
| Age Bracket | Male | Female |
| Under 5 Years | 26 (6.3%) | 50 (11.8%) |
| 5 to 9 Years | 4 (1.0%) | 23 (5.4%) |
| 10 to 14 Years | 55 (13.3%) | 49 (11.6%) |
| 15 to 19 Years | 78 (18.8%) | 18 (4.3%) |
| 20 to 24 Years | 25 (6.0%) | 2 (0.5%) |
| 25 to 29 Years | 22 (5.3%) | 26 (6.1%) |
| 30 to 34 Years | 18 (4.3%) | 66 (15.6%) |
| 35 to 39 Years | 27 (6.5%) | 21 (5.0%) |
| 40 to 44 Years | 24 (5.8%) | 23 (5.4%) |
| 45 to 49 Years | 8 (1.9%) | 7 (1.7%) |
| 50 to 54 Years | 22 (5.3%) | 20 (4.7%) |
| 55 to 59 Years | 18 (4.3%) | 22 (5.2%) |
| 60 to 64 Years | 25 (6.0%) | 34 (8.0%) |
| 65 to 69 Years | 23 (5.5%) | 41 (9.7%) |
| 70 to 74 Years | 26 (6.3%) | 12 (2.8%) |
| 75 to 79 Years | 12 (2.9%) | 5 (1.2%) |
| 80 to 84 Years | 2 (0.5%) | 5 (1.2%) |
| 85 Years and over | 0 (0.0%) | 0 (0.0%) |
| Total | 415 (100.0%) | 424 (100.0%) |
Families and Households in Alexandria
Median Family Size in Alexandria
The median family size in Alexandria is 3.68 persons per family, with single female/mother families (18 | 8.7%) accounting for the largest median family size of 6.06 persons per family. On the other hand, married-couple families (183 | 88.4%) represent the smallest median family size with 3.45 persons per family.
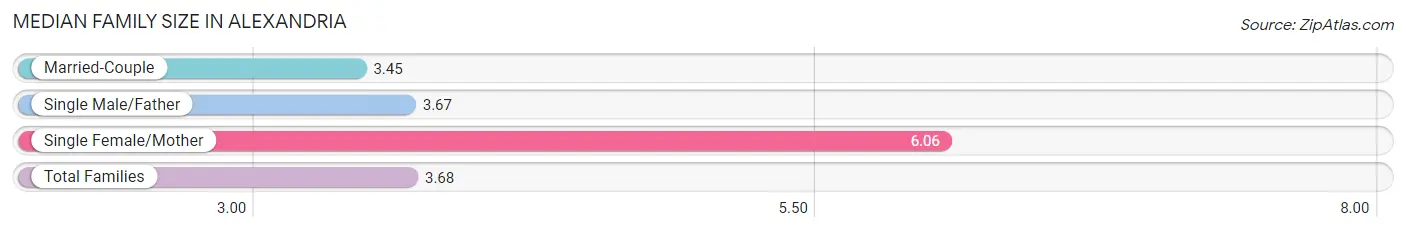
| Family Type | # Families | Family Size |
| Married-Couple | 183 (88.4%) | 3.45 |
| Single Male/Father | 6 (2.9%) | 3.67 |
| Single Female/Mother | 18 (8.7%) | 6.06 |
| Total Families | 207 (100.0%) | 3.68 |
Median Household Size in Alexandria
The median household size in Alexandria is 3.07 persons per household, with single female/mother households (18 | 6.6%) accounting for the largest median household size of 6.06 persons per household. non-family households (66 | 24.2%) represent the smallest median household size with 1.11 persons per household.
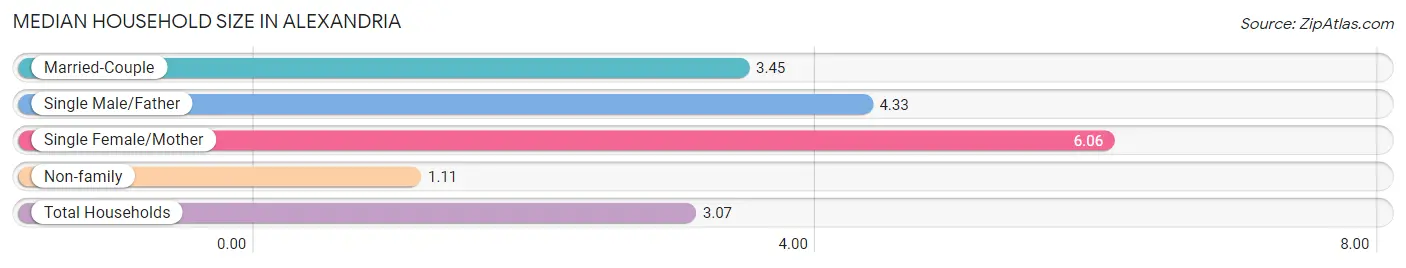
| Household Type | # Households | Household Size |
| Married-Couple | 183 (67.0%) | 3.45 |
| Single Male/Father | 6 (2.2%) | 4.33 |
| Single Female/Mother | 18 (6.6%) | 6.06 |
| Non-family | 66 (24.2%) | 1.11 |
| Total Households | 273 (100.0%) | 3.07 |
Household Size by Marriage Status in Alexandria
Out of a total of 273 households in Alexandria, 207 (75.8%) are family households, while 66 (24.2%) are nonfamily households. The most numerous type of family households are 2-person households, comprising 91, and the most common type of nonfamily households are 1-person households, comprising 60.
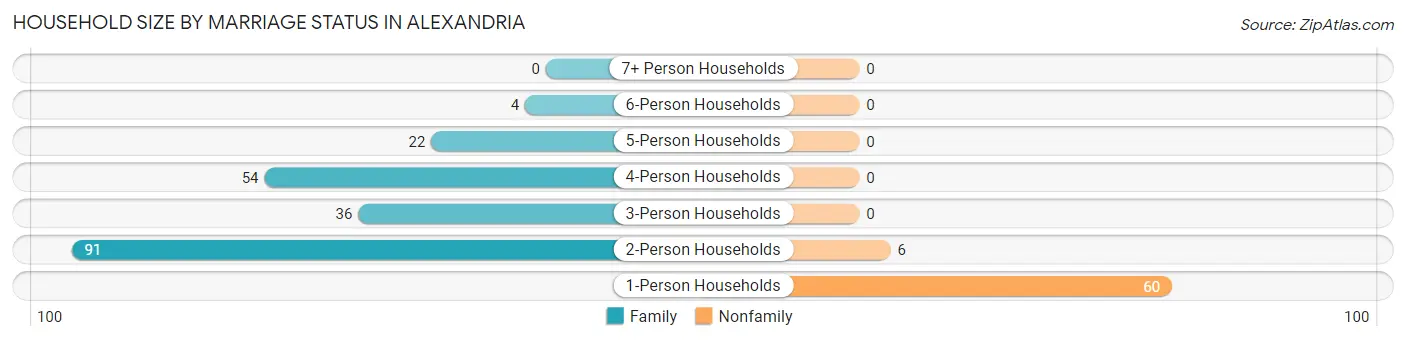
| Household Size | Family Households | Nonfamily Households |
| 1-Person Households | - | 60 (22.0%) |
| 2-Person Households | 91 (33.3%) | 6 (2.2%) |
| 3-Person Households | 36 (13.2%) | 0 (0.0%) |
| 4-Person Households | 54 (19.8%) | 0 (0.0%) |
| 5-Person Households | 22 (8.1%) | 0 (0.0%) |
| 6-Person Households | 4 (1.5%) | 0 (0.0%) |
| 7+ Person Households | 0 (0.0%) | 0 (0.0%) |
| Total | 207 (75.8%) | 66 (24.2%) |
Female Fertility in Alexandria
Fertility by Age in Alexandria
Average fertility rate in Alexandria is 67.0 births per 1,000 women. Women in the age bracket of 20 to 34 years have the highest fertility rate with 117.0 births per 1,000 women. Women in the age bracket of 20 to 34 years acount for 100.0% of all women with births.
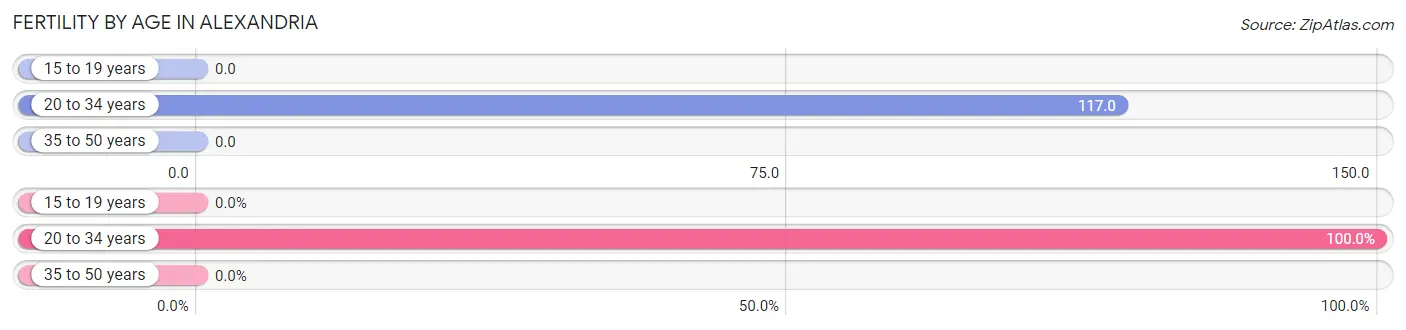
| Age Bracket | Women with Births | Births / 1,000 Women |
| 15 to 19 years | 0 (0.0%) | 0.0 |
| 20 to 34 years | 11 (100.0%) | 117.0 |
| 35 to 50 years | 0 (0.0%) | 0.0 |
| Total | 11 (100.0%) | 67.0 |
Fertility by Age by Marriage Status in Alexandria
63.6% of women with births (11) in Alexandria are married. The highest percentage of unmarried women with births falls into 20 to 34 years age bracket with 36.4% of them unmarried at the time of birth, while the lowest percentage of unmarried women with births belong to 20 to 34 years age bracket with 36.4% of them unmarried.
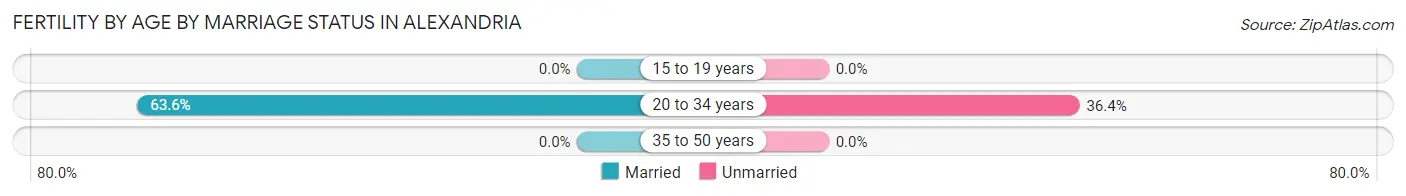
| Age Bracket | Married | Unmarried |
| 15 to 19 years | 0 (0.0%) | 0 (0.0%) |
| 20 to 34 years | 7 (63.6%) | 4 (36.4%) |
| 35 to 50 years | 0 (0.0%) | 0 (0.0%) |
| Total | 7 (63.6%) | 4 (36.4%) |
Fertility by Education in Alexandria
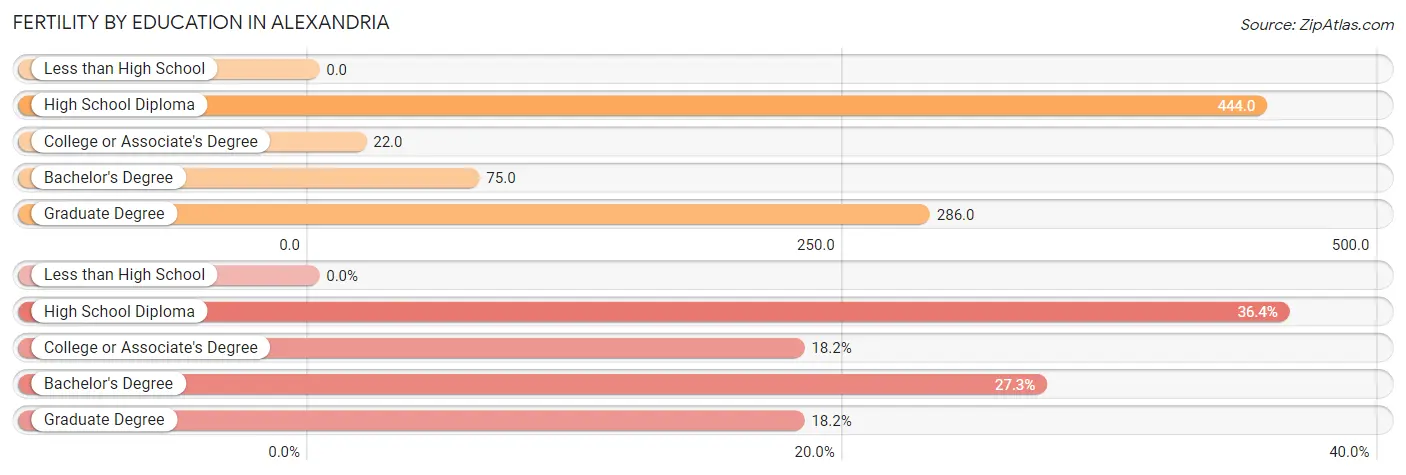
| Educational Attainment | Women with Births | Births / 1,000 Women |
| Less than High School | 0 (0.0%) | 0.0 |
| High School Diploma | 4 (36.4%) | 444.0 |
| College or Associate's Degree | 2 (18.2%) | 22.0 |
| Bachelor's Degree | 3 (27.3%) | 75.0 |
| Graduate Degree | 2 (18.2%) | 286.0 |
| Total | 11 (100.0%) | 67.0 |
Fertility by Education by Marriage Status in Alexandria
36.4% of women with births in Alexandria are unmarried. Women with the educational attainment of college or associate's degree are most likely to be married with 100.0% of them married at childbirth, while women with the educational attainment of high school diploma are least likely to be married with 100.0% of them unmarried at childbirth.
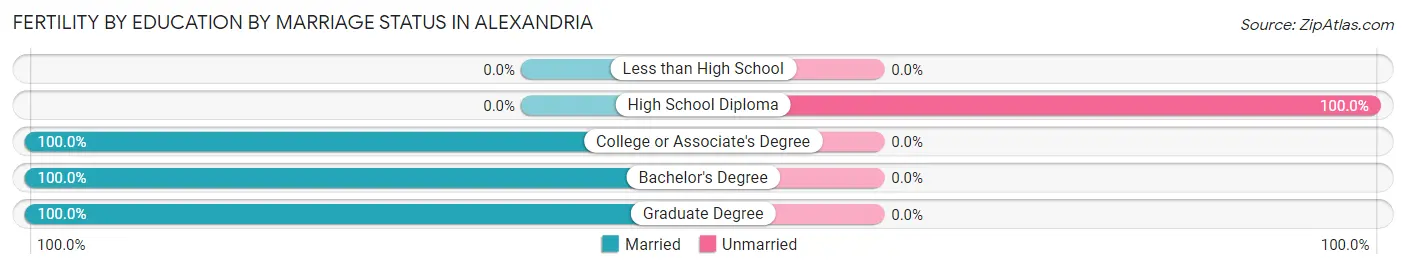
| Educational Attainment | Married | Unmarried |
| Less than High School | 0 (0.0%) | 0 (0.0%) |
| High School Diploma | 0 (0.0%) | 4 (100.0%) |
| College or Associate's Degree | 2 (100.0%) | 0 (0.0%) |
| Bachelor's Degree | 3 (100.0%) | 0 (0.0%) |
| Graduate Degree | 2 (100.0%) | 0 (0.0%) |
| Total | 7 (63.6%) | 4 (36.4%) |
Employment Characteristics in Alexandria
Employment by Class of Employer in Alexandria
Among the 453 employed individuals in Alexandria, private company employees (278 | 61.4%), local government employees (100 | 22.1%), and state government employees (28 | 6.2%) make up the most common classes of employment.
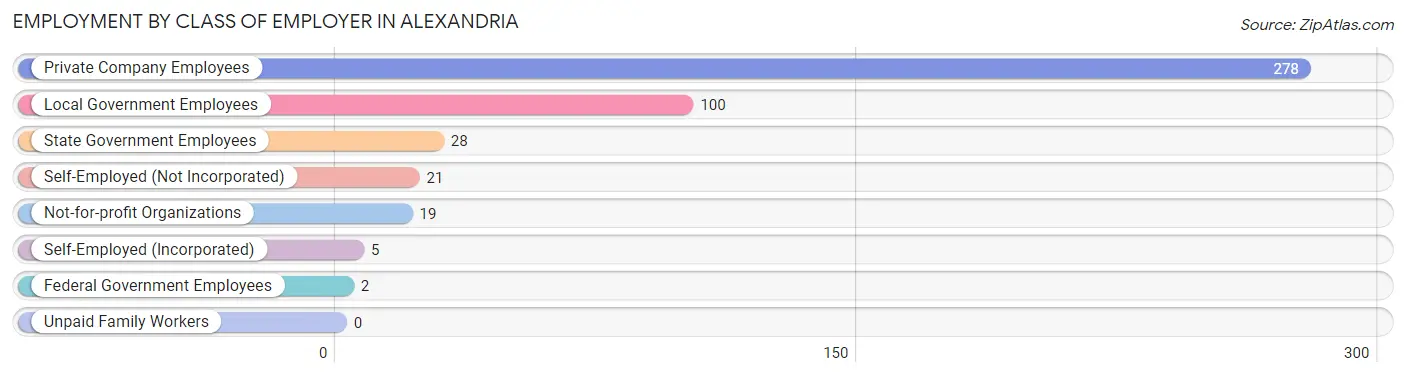
| Employer Class | # Employees | % Employees |
| Private Company Employees | 278 | 61.4% |
| Self-Employed (Incorporated) | 5 | 1.1% |
| Self-Employed (Not Incorporated) | 21 | 4.6% |
| Not-for-profit Organizations | 19 | 4.2% |
| Local Government Employees | 100 | 22.1% |
| State Government Employees | 28 | 6.2% |
| Federal Government Employees | 2 | 0.4% |
| Unpaid Family Workers | 0 | 0.0% |
| Total | 453 | 100.0% |
Employment Status by Age in Alexandria
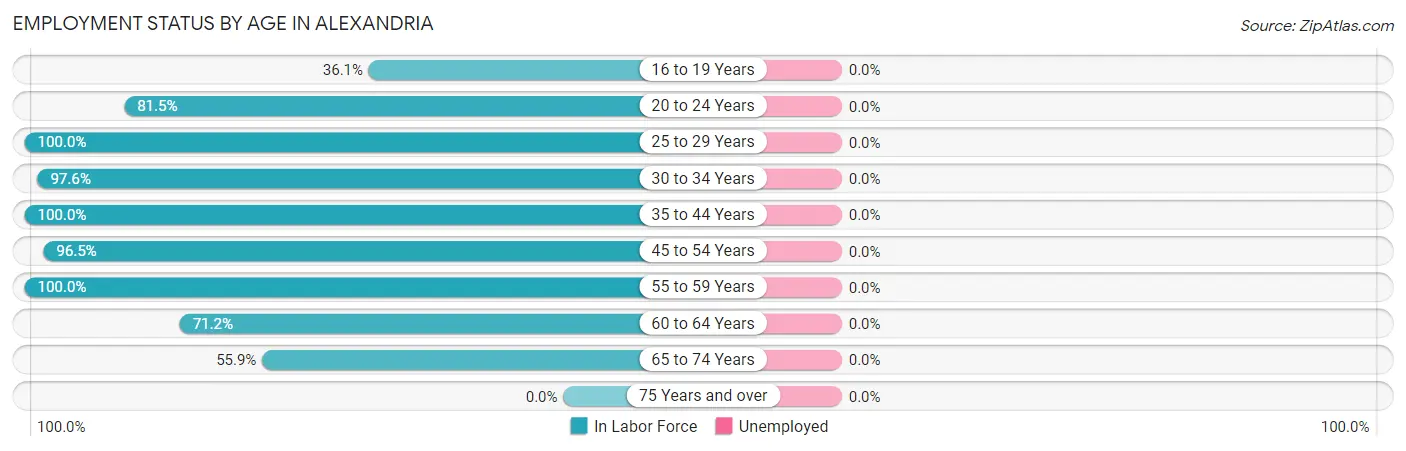
| Age Bracket | In Labor Force | Unemployed |
| 16 to 19 Years | 22 (36.1%) | 0 (0.0%) |
| 20 to 24 Years | 22 (81.5%) | 0 (0.0%) |
| 25 to 29 Years | 48 (100.0%) | 0 (0.0%) |
| 30 to 34 Years | 82 (97.6%) | 0 (0.0%) |
| 35 to 44 Years | 95 (100.0%) | 0 (0.0%) |
| 45 to 54 Years | 55 (96.5%) | 0 (0.0%) |
| 55 to 59 Years | 40 (100.0%) | 0 (0.0%) |
| 60 to 64 Years | 42 (71.2%) | 0 (0.0%) |
| 65 to 74 Years | 57 (55.9%) | 0 (0.0%) |
| 75 Years and over | 0 (0.0%) | 0 (0.0%) |
| Total | 463 (77.6%) | 0 (0.0%) |
Employment Status by Educational Attainment in Alexandria
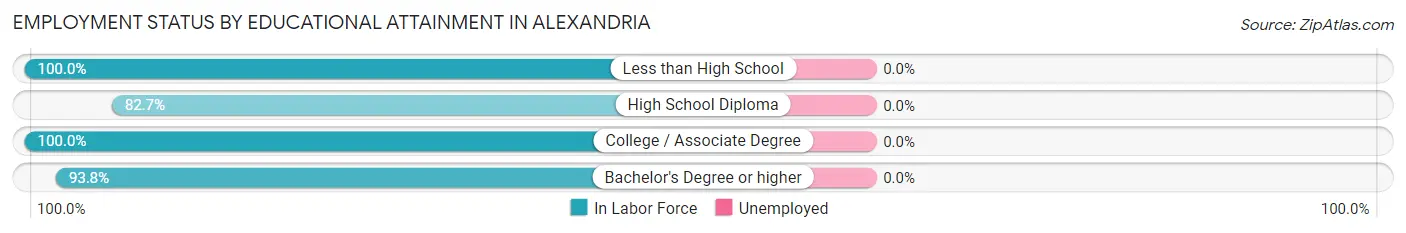
| Educational Attainment | In Labor Force | Unemployed |
| Less than High School | 5 (100.0%) | 0 (0.0%) |
| High School Diploma | 67 (82.7%) | 0 (0.0%) |
| College / Associate Degree | 184 (100.0%) | 0 (0.0%) |
| Bachelor's Degree or higher | 106 (93.8%) | 0 (0.0%) |
| Total | 362 (94.5%) | 0 (0.0%) |
Employment Occupations by Sex in Alexandria
Management, Business, Science and Arts Occupations
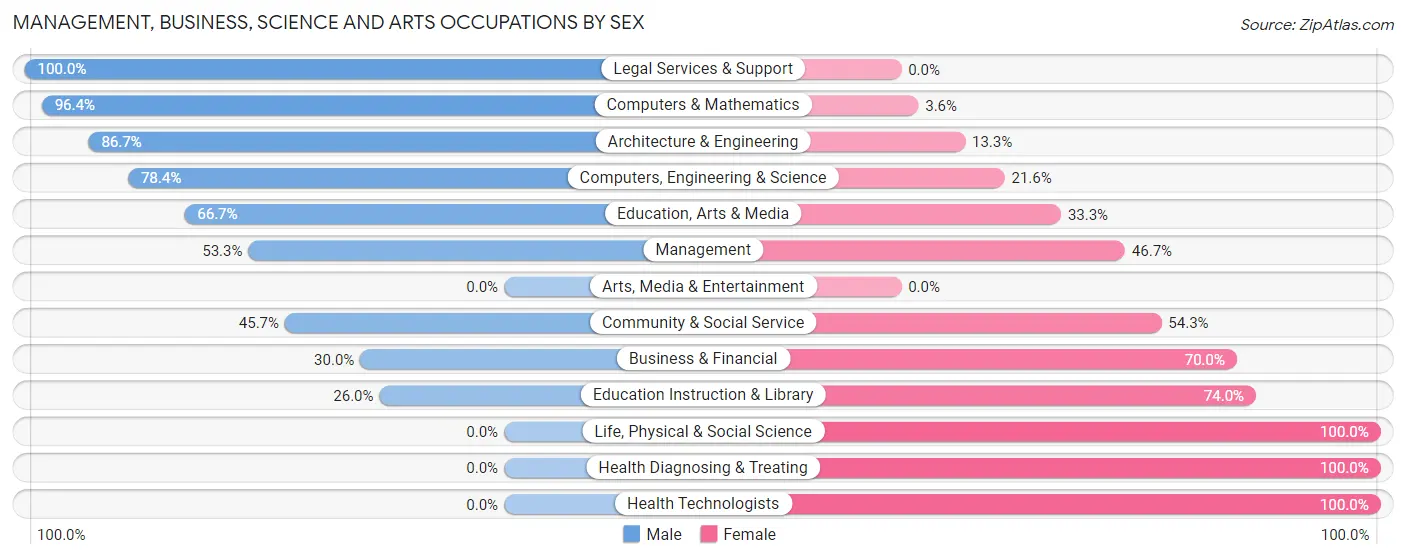
The most common Management, Business, Science and Arts occupations in Alexandria are Community & Social Service (70 | 15.1%), Computers, Engineering & Science (51 | 11.0%), Education Instruction & Library (50 | 10.8%), Health Diagnosing & Treating (32 | 6.9%), and Management (30 | 6.5%).
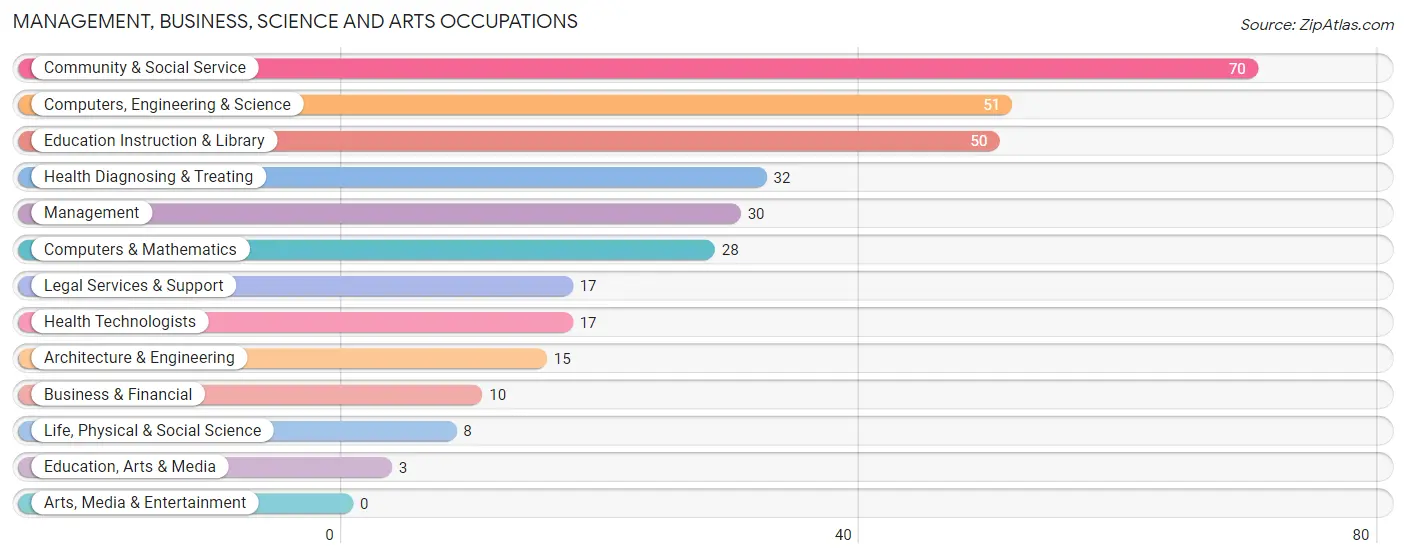
Management, Business, Science and Arts Occupations by Sex
Within the Management, Business, Science and Arts occupations in Alexandria, the most male-oriented occupations are Legal Services & Support (100.0%), Computers & Mathematics (96.4%), and Architecture & Engineering (86.7%), while the most female-oriented occupations are Life, Physical & Social Science (100.0%), Health Diagnosing & Treating (100.0%), and Health Technologists (100.0%).
| Occupation | Male | Female |
| Management | 16 (53.3%) | 14 (46.7%) |
| Business & Financial | 3 (30.0%) | 7 (70.0%) |
| Computers, Engineering & Science | 40 (78.4%) | 11 (21.6%) |
| Computers & Mathematics | 27 (96.4%) | 1 (3.6%) |
| Architecture & Engineering | 13 (86.7%) | 2 (13.3%) |
| Life, Physical & Social Science | 0 (0.0%) | 8 (100.0%) |
| Community & Social Service | 32 (45.7%) | 38 (54.3%) |
| Education, Arts & Media | 2 (66.7%) | 1 (33.3%) |
| Legal Services & Support | 17 (100.0%) | 0 (0.0%) |
| Education Instruction & Library | 13 (26.0%) | 37 (74.0%) |
| Arts, Media & Entertainment | 0 (0.0%) | 0 (0.0%) |
| Health Diagnosing & Treating | 0 (0.0%) | 32 (100.0%) |
| Health Technologists | 0 (0.0%) | 17 (100.0%) |
| Total (Category) | 91 (47.1%) | 102 (52.8%) |
| Total (Overall) | 235 (50.8%) | 228 (49.2%) |
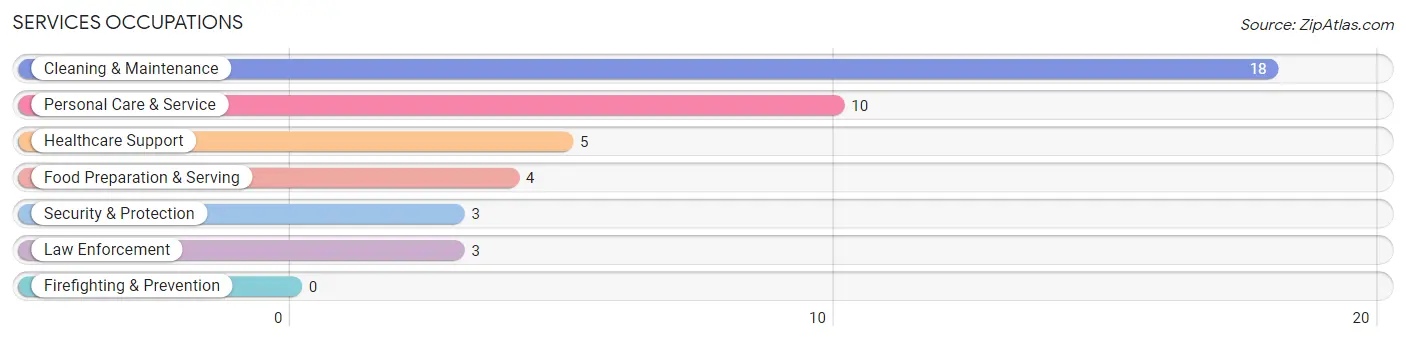
Services Occupations
The most common Services occupations in Alexandria are Cleaning & Maintenance (18 | 3.9%), Personal Care & Service (10 | 2.2%), Healthcare Support (5 | 1.1%), Food Preparation & Serving (4 | 0.9%), and Security & Protection (3 | 0.6%).
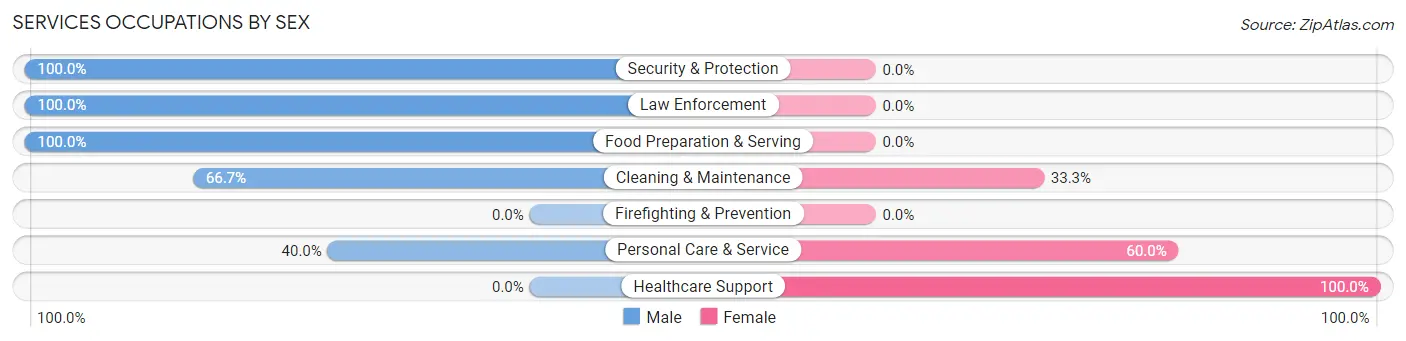
Services Occupations by Sex
Within the Services occupations in Alexandria, the most male-oriented occupations are Security & Protection (100.0%), Law Enforcement (100.0%), and Food Preparation & Serving (100.0%), while the most female-oriented occupations are Healthcare Support (100.0%), Personal Care & Service (60.0%), and Cleaning & Maintenance (33.3%).
| Occupation | Male | Female |
| Healthcare Support | 0 (0.0%) | 5 (100.0%) |
| Security & Protection | 3 (100.0%) | 0 (0.0%) |
| Firefighting & Prevention | 0 (0.0%) | 0 (0.0%) |
| Law Enforcement | 3 (100.0%) | 0 (0.0%) |
| Food Preparation & Serving | 4 (100.0%) | 0 (0.0%) |
| Cleaning & Maintenance | 12 (66.7%) | 6 (33.3%) |
| Personal Care & Service | 4 (40.0%) | 6 (60.0%) |
| Total (Category) | 23 (57.5%) | 17 (42.5%) |
| Total (Overall) | 235 (50.8%) | 228 (49.2%) |
Sales and Office Occupations
The most common Sales and Office occupations in Alexandria are Office & Administration (81 | 17.5%), and Sales & Related (35 | 7.6%).
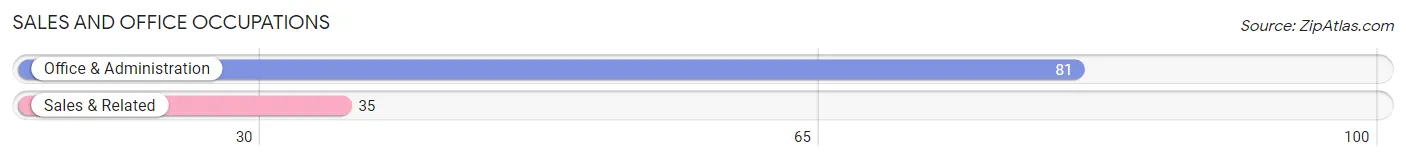
Sales and Office Occupations by Sex
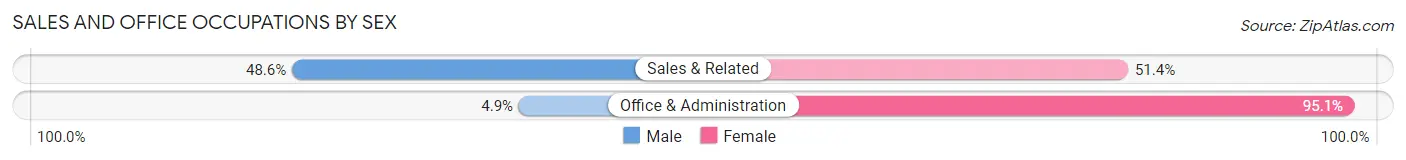
| Occupation | Male | Female |
| Sales & Related | 17 (48.6%) | 18 (51.4%) |
| Office & Administration | 4 (4.9%) | 77 (95.1%) |
| Total (Category) | 21 (18.1%) | 95 (81.9%) |
| Total (Overall) | 235 (50.8%) | 228 (49.2%) |
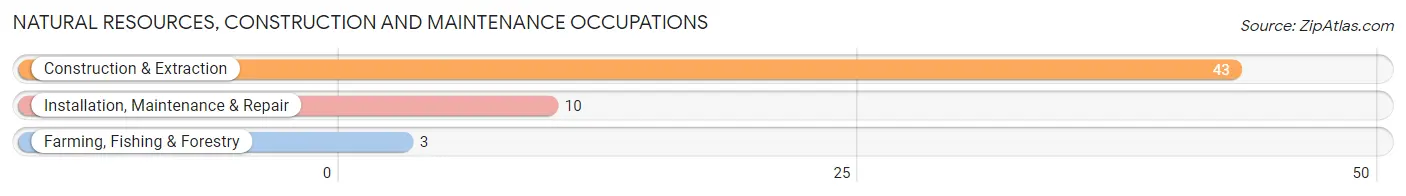
Natural Resources, Construction and Maintenance Occupations
The most common Natural Resources, Construction and Maintenance occupations in Alexandria are Construction & Extraction (43 | 9.3%), Installation, Maintenance & Repair (10 | 2.2%), and Farming, Fishing & Forestry (3 | 0.6%).
Natural Resources, Construction and Maintenance Occupations by Sex
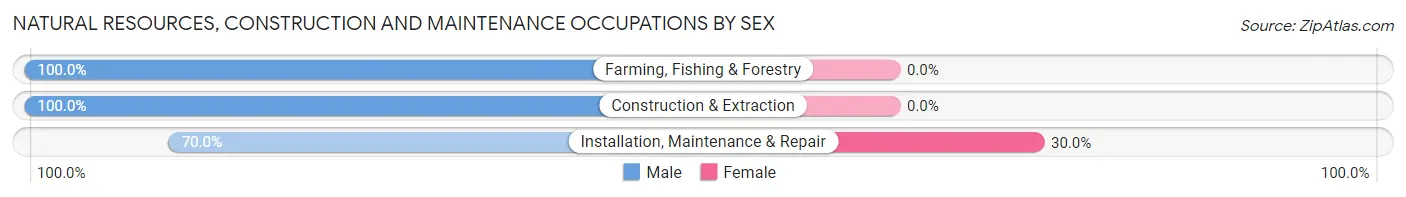
| Occupation | Male | Female |
| Farming, Fishing & Forestry | 3 (100.0%) | 0 (0.0%) |
| Construction & Extraction | 43 (100.0%) | 0 (0.0%) |
| Installation, Maintenance & Repair | 7 (70.0%) | 3 (30.0%) |
| Total (Category) | 53 (94.6%) | 3 (5.4%) |
| Total (Overall) | 235 (50.8%) | 228 (49.2%) |
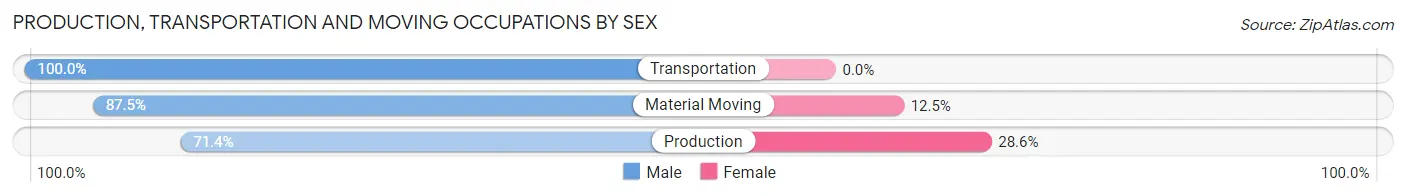
Production, Transportation and Moving Occupations
The most common Production, Transportation and Moving occupations in Alexandria are Production (35 | 7.6%), Transportation (15 | 3.2%), and Material Moving (8 | 1.7%).
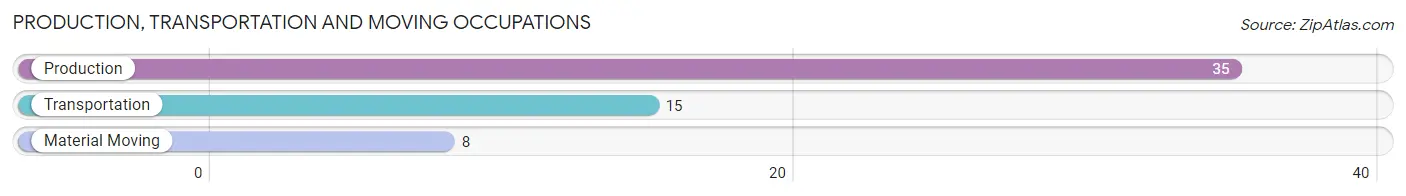
Production, Transportation and Moving Occupations by Sex
| Occupation | Male | Female |
| Production | 25 (71.4%) | 10 (28.6%) |
| Transportation | 15 (100.0%) | 0 (0.0%) |
| Material Moving | 7 (87.5%) | 1 (12.5%) |
| Total (Category) | 47 (81.0%) | 11 (19.0%) |
| Total (Overall) | 235 (50.8%) | 228 (49.2%) |
Employment Industries by Sex in Alexandria
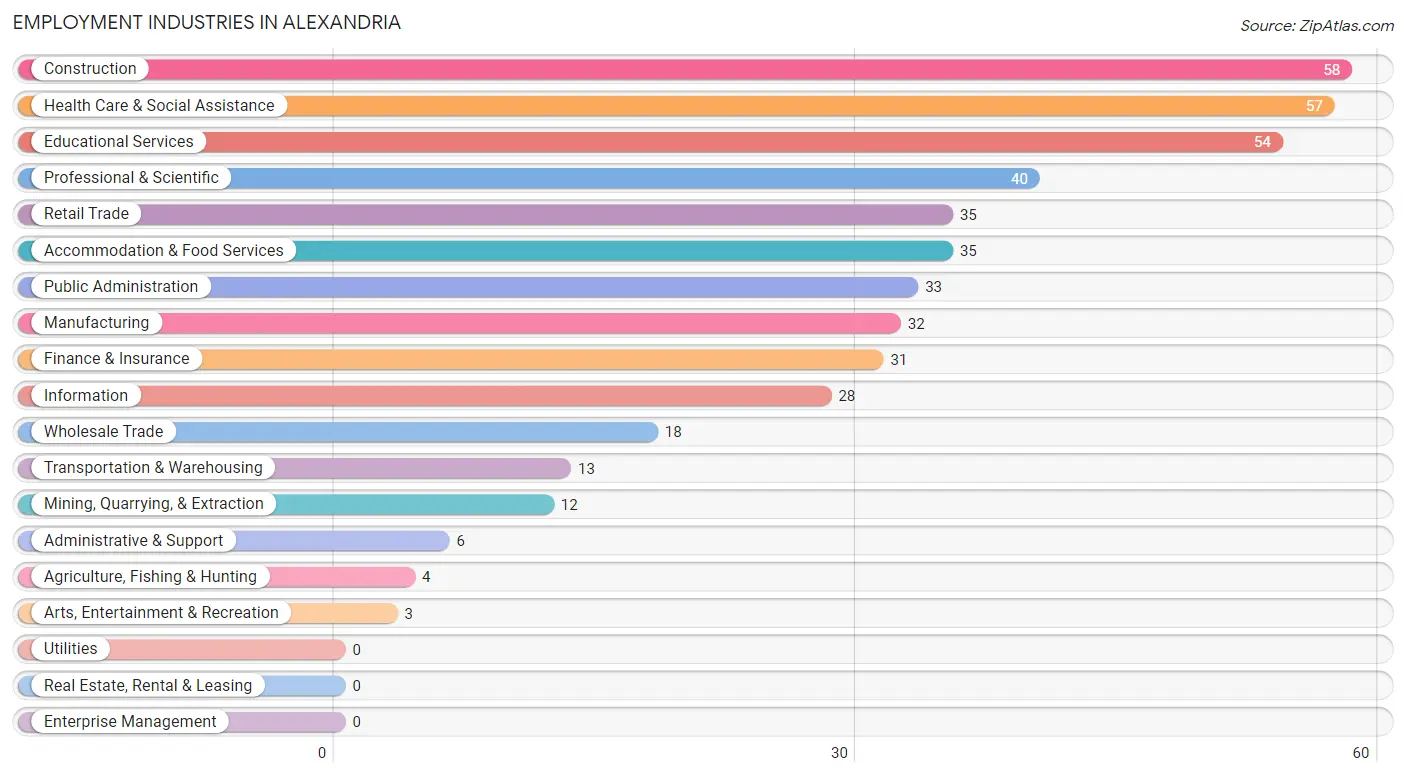
Employment Industries in Alexandria
The major employment industries in Alexandria include Construction (58 | 12.5%), Health Care & Social Assistance (57 | 12.3%), Educational Services (54 | 11.7%), Professional & Scientific (40 | 8.6%), and Retail Trade (35 | 7.6%).
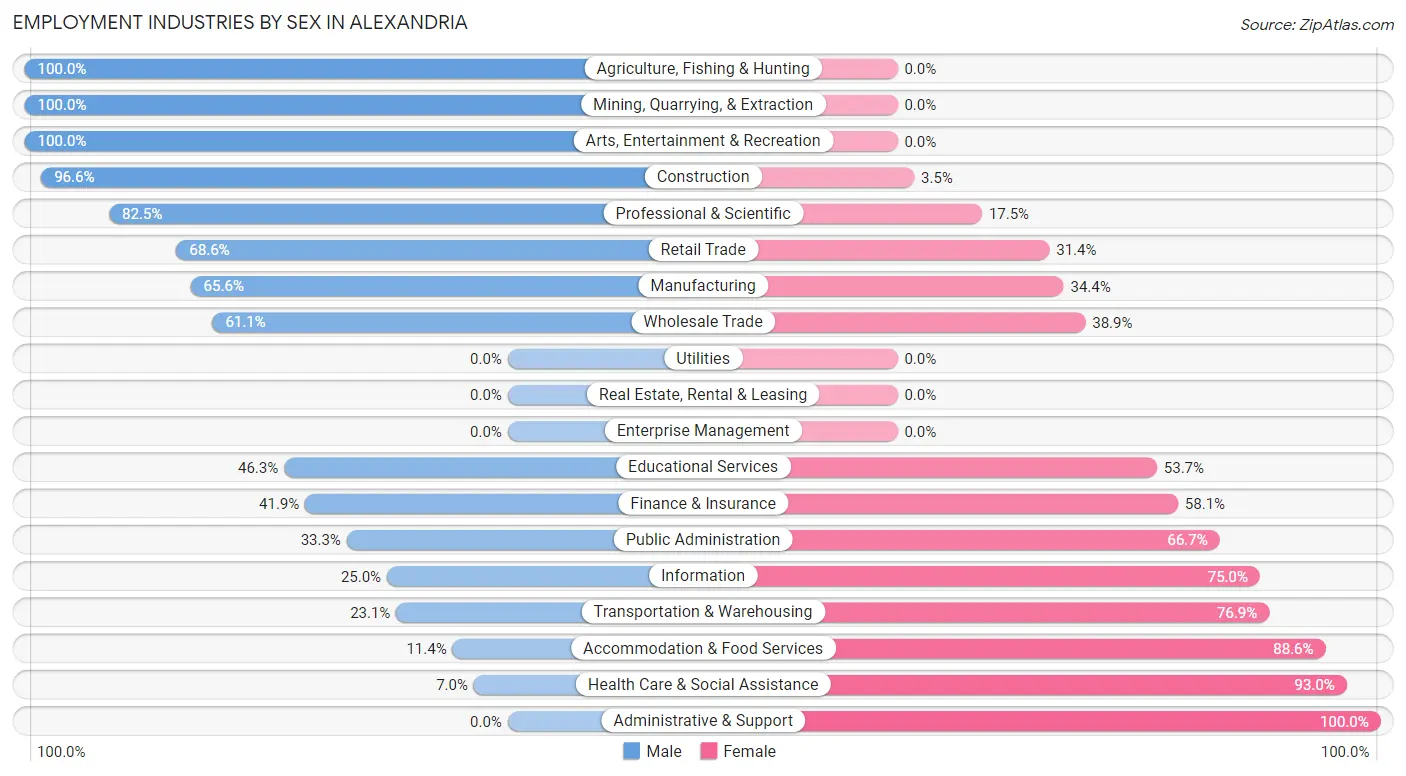
Employment Industries by Sex in Alexandria
The Alexandria industries that see more men than women are Agriculture, Fishing & Hunting (100.0%), Mining, Quarrying, & Extraction (100.0%), and Arts, Entertainment & Recreation (100.0%), whereas the industries that tend to have a higher number of women are Administrative & Support (100.0%), Health Care & Social Assistance (93.0%), and Accommodation & Food Services (88.6%).
| Industry | Male | Female |
| Agriculture, Fishing & Hunting | 4 (100.0%) | 0 (0.0%) |
| Mining, Quarrying, & Extraction | 12 (100.0%) | 0 (0.0%) |
| Construction | 56 (96.6%) | 2 (3.5%) |
| Manufacturing | 21 (65.6%) | 11 (34.4%) |
| Wholesale Trade | 11 (61.1%) | 7 (38.9%) |
| Retail Trade | 24 (68.6%) | 11 (31.4%) |
| Transportation & Warehousing | 3 (23.1%) | 10 (76.9%) |
| Utilities | 0 (0.0%) | 0 (0.0%) |
| Information | 7 (25.0%) | 21 (75.0%) |
| Finance & Insurance | 13 (41.9%) | 18 (58.1%) |
| Real Estate, Rental & Leasing | 0 (0.0%) | 0 (0.0%) |
| Professional & Scientific | 33 (82.5%) | 7 (17.5%) |
| Enterprise Management | 0 (0.0%) | 0 (0.0%) |
| Administrative & Support | 0 (0.0%) | 6 (100.0%) |
| Educational Services | 25 (46.3%) | 29 (53.7%) |
| Health Care & Social Assistance | 4 (7.0%) | 53 (93.0%) |
| Arts, Entertainment & Recreation | 3 (100.0%) | 0 (0.0%) |
| Accommodation & Food Services | 4 (11.4%) | 31 (88.6%) |
| Public Administration | 11 (33.3%) | 22 (66.7%) |
| Total | 235 (50.8%) | 228 (49.2%) |
Education in Alexandria
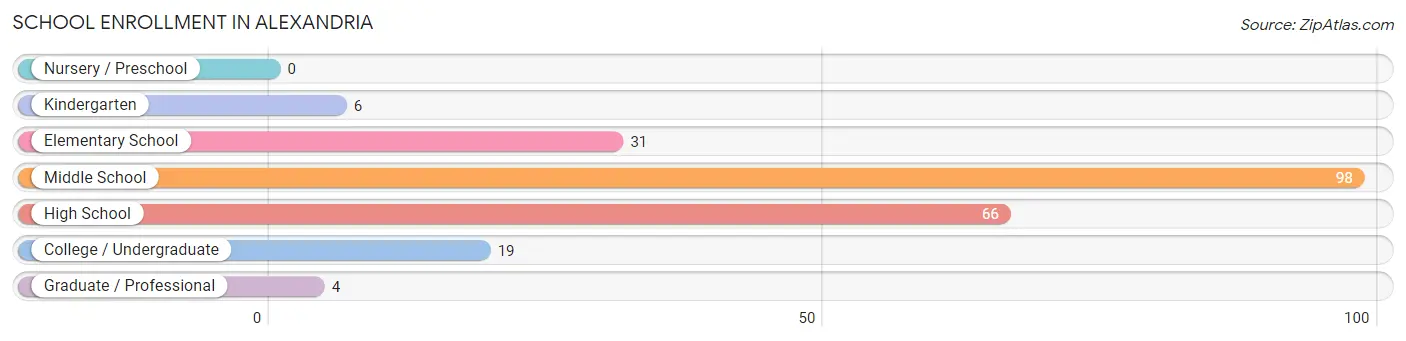
School Enrollment in Alexandria
The most common levels of schooling among the 224 students in Alexandria are middle school (98 | 43.8%), high school (66 | 29.5%), and elementary school (31 | 13.8%).
| School Level | # Students | % Students |
| Nursery / Preschool | 0 | 0.0% |
| Kindergarten | 6 | 2.7% |
| Elementary School | 31 | 13.8% |
| Middle School | 98 | 43.8% |
| High School | 66 | 29.5% |
| College / Undergraduate | 19 | 8.5% |
| Graduate / Professional | 4 | 1.8% |
| Total | 224 | 100.0% |
School Enrollment by Age by Funding Source in Alexandria
Out of a total of 224 students who are enrolled in schools in Alexandria, 13 (5.8%) attend a private institution, while the remaining 211 (94.2%) are enrolled in public schools. The age group of 18 to 19 year olds has the highest likelihood of being enrolled in private schools, with 12 (48.0% in the age bracket) enrolled. Conversely, the age group of 5 to 9 year old has the lowest likelihood of being enrolled in a private school, with 27 (100.0% in the age bracket) attending a public institution.
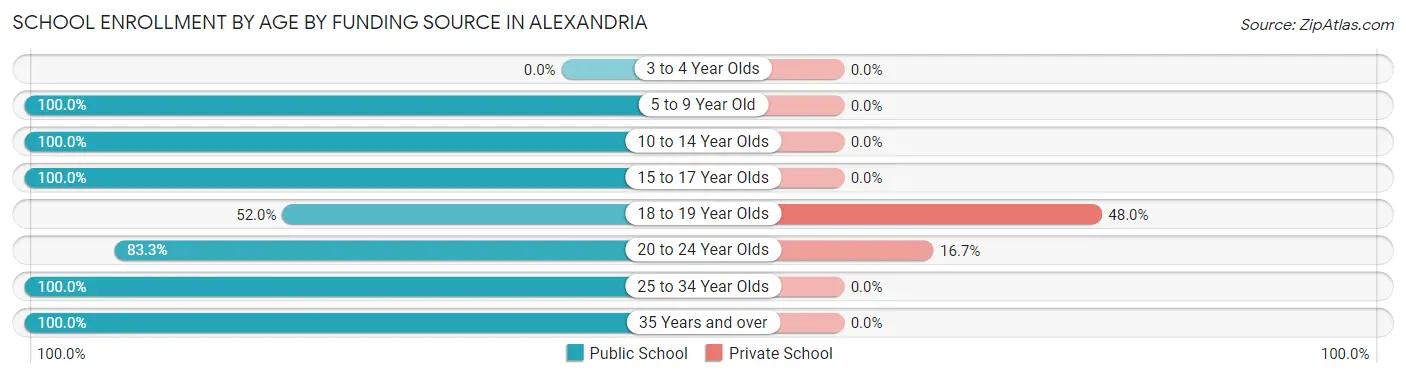
| Age Bracket | Public School | Private School |
| 3 to 4 Year Olds | 0 (0.0%) | 0 (0.0%) |
| 5 to 9 Year Old | 27 (100.0%) | 0 (0.0%) |
| 10 to 14 Year Olds | 101 (100.0%) | 0 (0.0%) |
| 15 to 17 Year Olds | 60 (100.0%) | 0 (0.0%) |
| 18 to 19 Year Olds | 13 (52.0%) | 12 (48.0%) |
| 20 to 24 Year Olds | 5 (83.3%) | 1 (16.7%) |
| 25 to 34 Year Olds | 2 (100.0%) | 0 (0.0%) |
| 35 Years and over | 3 (100.0%) | 0 (0.0%) |
| Total | 211 (94.2%) | 13 (5.8%) |
Educational Attainment by Field of Study in Alexandria
Education (48 | 33.6%), liberal arts & history (28 | 19.6%), business (18 | 12.6%), science & technology (16 | 11.2%), and computers & mathematics (10 | 7.0%) are the most common fields of study among 143 individuals in Alexandria who have obtained a bachelor's degree or higher.
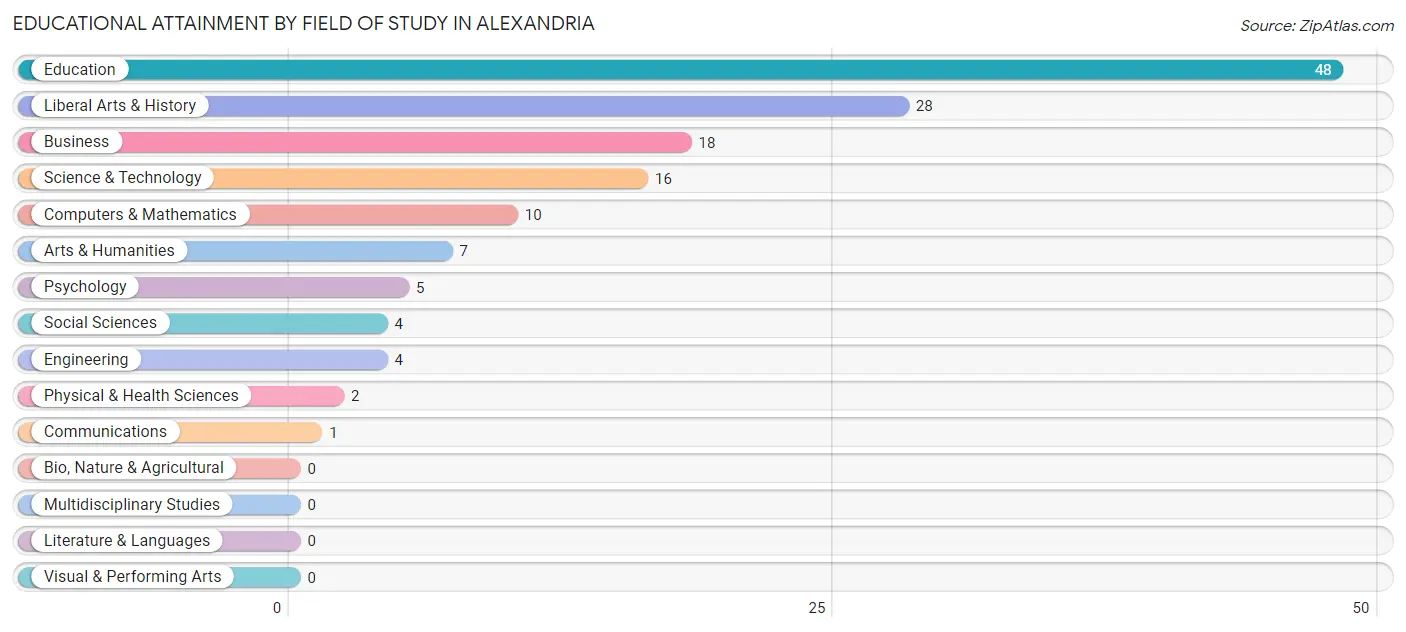
| Field of Study | # Graduates | % Graduates |
| Computers & Mathematics | 10 | 7.0% |
| Bio, Nature & Agricultural | 0 | 0.0% |
| Physical & Health Sciences | 2 | 1.4% |
| Psychology | 5 | 3.5% |
| Social Sciences | 4 | 2.8% |
| Engineering | 4 | 2.8% |
| Multidisciplinary Studies | 0 | 0.0% |
| Science & Technology | 16 | 11.2% |
| Business | 18 | 12.6% |
| Education | 48 | 33.6% |
| Literature & Languages | 0 | 0.0% |
| Liberal Arts & History | 28 | 19.6% |
| Visual & Performing Arts | 0 | 0.0% |
| Communications | 1 | 0.7% |
| Arts & Humanities | 7 | 4.9% |
| Total | 143 | 100.0% |
Transportation & Commute in Alexandria
Vehicle Availability by Sex in Alexandria
The most prevalent vehicle ownership categories in Alexandria are males with 2 vehicles (69, accounting for 30.1%) and females with 2 vehicles (63, making up 30.8%).
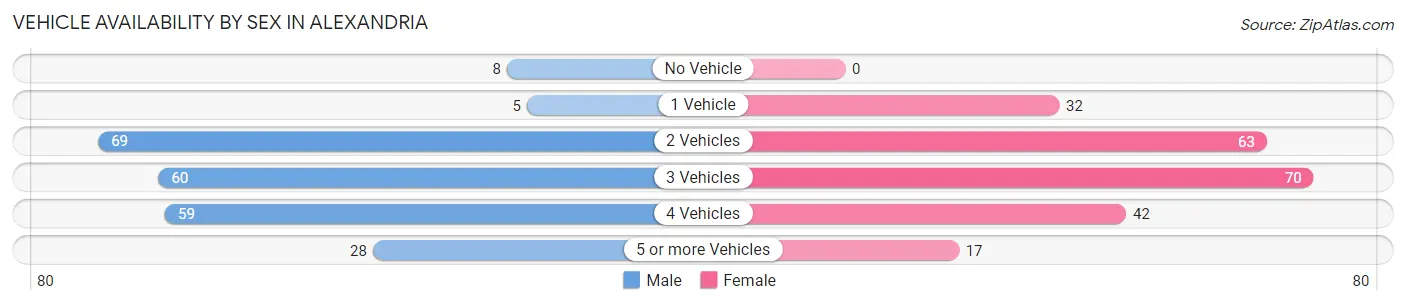
| Vehicles Available | Male | Female |
| No Vehicle | 8 (3.5%) | 0 (0.0%) |
| 1 Vehicle | 5 (2.2%) | 32 (14.3%) |
| 2 Vehicles | 69 (30.1%) | 63 (28.1%) |
| 3 Vehicles | 60 (26.2%) | 70 (31.2%) |
| 4 Vehicles | 59 (25.8%) | 42 (18.8%) |
| 5 or more Vehicles | 28 (12.2%) | 17 (7.6%) |
| Total | 229 (100.0%) | 224 (100.0%) |
Commute Time in Alexandria
The most frequently occuring commute durations in Alexandria are 20 to 24 minutes (99 commuters, 23.9%), 15 to 19 minutes (81 commuters, 19.6%), and 5 to 9 minutes (71 commuters, 17.2%).
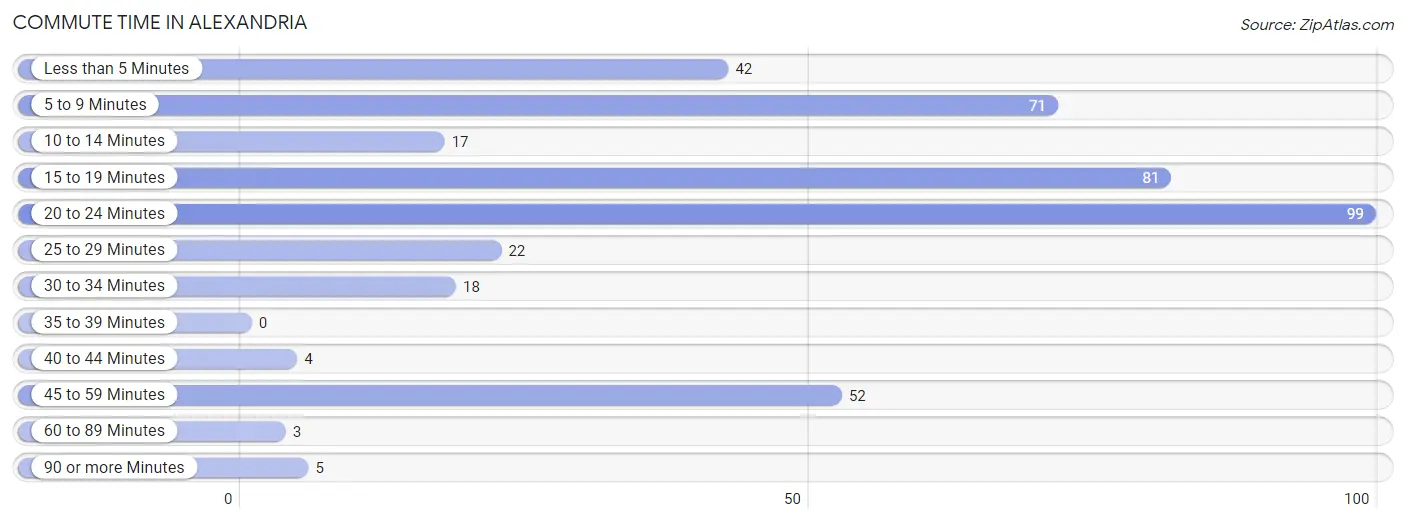
| Commute Time | # Commuters | % Commuters |
| Less than 5 Minutes | 42 | 10.1% |
| 5 to 9 Minutes | 71 | 17.2% |
| 10 to 14 Minutes | 17 | 4.1% |
| 15 to 19 Minutes | 81 | 19.6% |
| 20 to 24 Minutes | 99 | 23.9% |
| 25 to 29 Minutes | 22 | 5.3% |
| 30 to 34 Minutes | 18 | 4.3% |
| 35 to 39 Minutes | 0 | 0.0% |
| 40 to 44 Minutes | 4 | 1.0% |
| 45 to 59 Minutes | 52 | 12.6% |
| 60 to 89 Minutes | 3 | 0.7% |
| 90 or more Minutes | 5 | 1.2% |
Commute Time by Sex in Alexandria
The most common commute times in Alexandria are 15 to 19 minutes (60 commuters, 26.2%) for males and 20 to 24 minutes (58 commuters, 31.4%) for females.
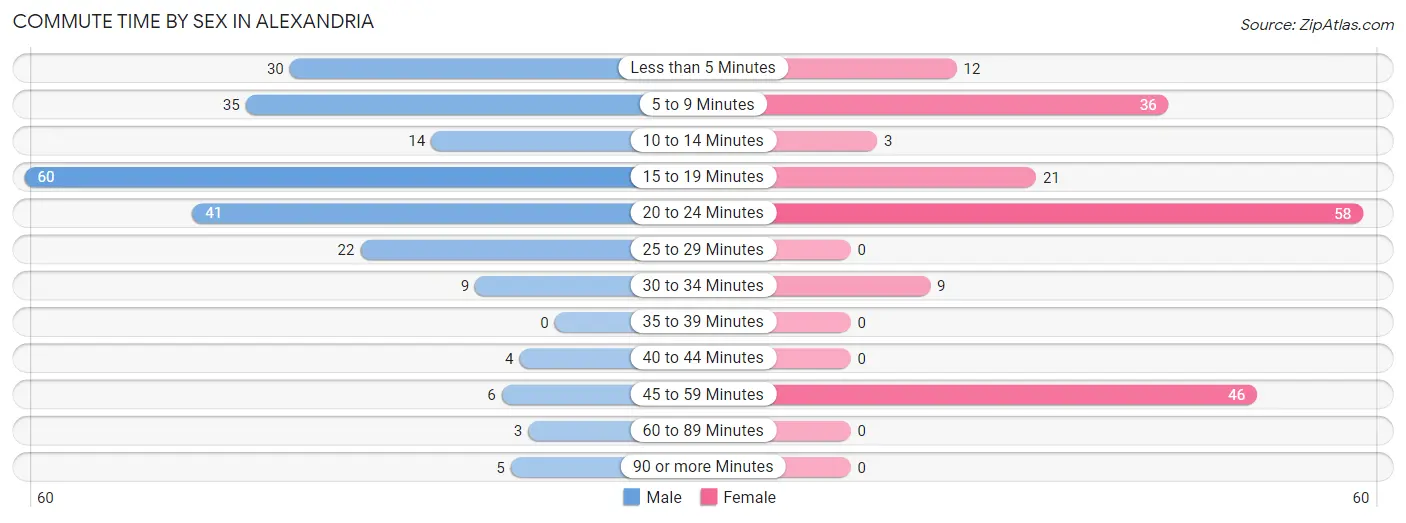
| Commute Time | Male | Female |
| Less than 5 Minutes | 30 (13.1%) | 12 (6.5%) |
| 5 to 9 Minutes | 35 (15.3%) | 36 (19.5%) |
| 10 to 14 Minutes | 14 (6.1%) | 3 (1.6%) |
| 15 to 19 Minutes | 60 (26.2%) | 21 (11.4%) |
| 20 to 24 Minutes | 41 (17.9%) | 58 (31.4%) |
| 25 to 29 Minutes | 22 (9.6%) | 0 (0.0%) |
| 30 to 34 Minutes | 9 (3.9%) | 9 (4.9%) |
| 35 to 39 Minutes | 0 (0.0%) | 0 (0.0%) |
| 40 to 44 Minutes | 4 (1.8%) | 0 (0.0%) |
| 45 to 59 Minutes | 6 (2.6%) | 46 (24.9%) |
| 60 to 89 Minutes | 3 (1.3%) | 0 (0.0%) |
| 90 or more Minutes | 5 (2.2%) | 0 (0.0%) |
Time of Departure to Work by Sex in Alexandria
The most frequent times of departure to work in Alexandria are 7:00 AM to 7:29 AM (49, 21.4%) for males and 7:30 AM to 7:59 AM (50, 27.0%) for females.
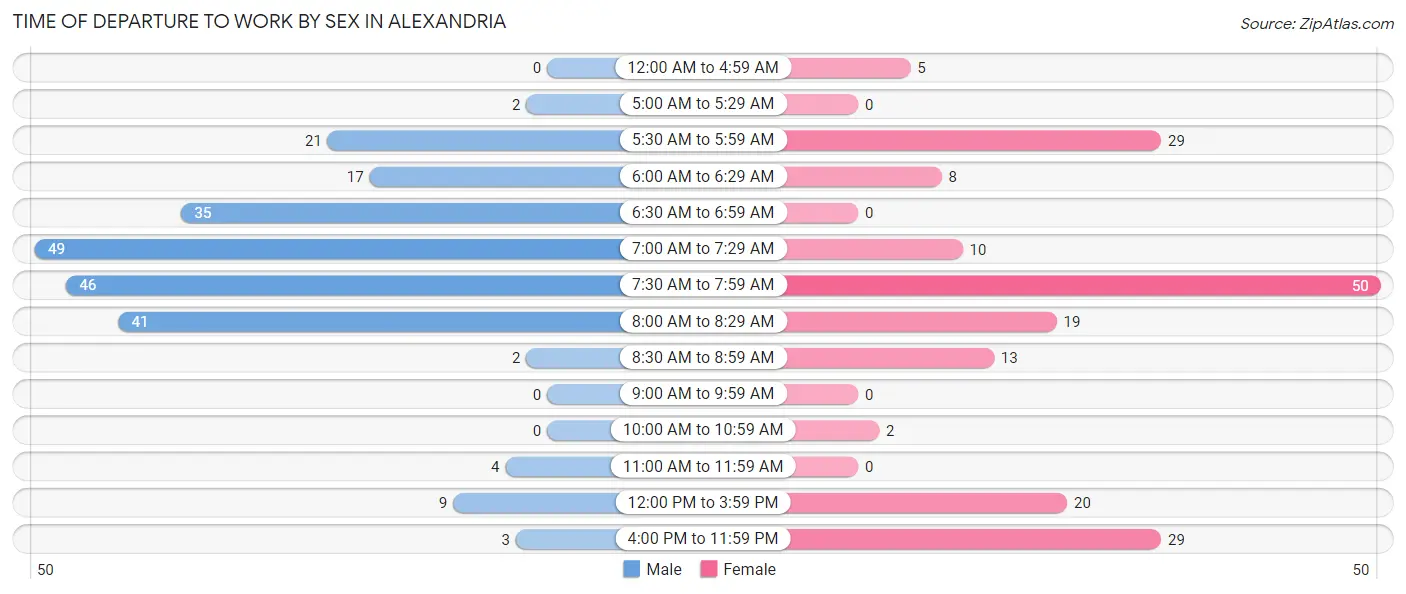
| Time of Departure | Male | Female |
| 12:00 AM to 4:59 AM | 0 (0.0%) | 5 (2.7%) |
| 5:00 AM to 5:29 AM | 2 (0.9%) | 0 (0.0%) |
| 5:30 AM to 5:59 AM | 21 (9.2%) | 29 (15.7%) |
| 6:00 AM to 6:29 AM | 17 (7.4%) | 8 (4.3%) |
| 6:30 AM to 6:59 AM | 35 (15.3%) | 0 (0.0%) |
| 7:00 AM to 7:29 AM | 49 (21.4%) | 10 (5.4%) |
| 7:30 AM to 7:59 AM | 46 (20.1%) | 50 (27.0%) |
| 8:00 AM to 8:29 AM | 41 (17.9%) | 19 (10.3%) |
| 8:30 AM to 8:59 AM | 2 (0.9%) | 13 (7.0%) |
| 9:00 AM to 9:59 AM | 0 (0.0%) | 0 (0.0%) |
| 10:00 AM to 10:59 AM | 0 (0.0%) | 2 (1.1%) |
| 11:00 AM to 11:59 AM | 4 (1.8%) | 0 (0.0%) |
| 12:00 PM to 3:59 PM | 9 (3.9%) | 20 (10.8%) |
| 4:00 PM to 11:59 PM | 3 (1.3%) | 29 (15.7%) |
| Total | 229 (100.0%) | 185 (100.0%) |
Housing Occupancy in Alexandria
Occupancy by Ownership in Alexandria
Of the total 273 dwellings in Alexandria, owner-occupied units account for 225 (82.4%), while renter-occupied units make up 48 (17.6%).
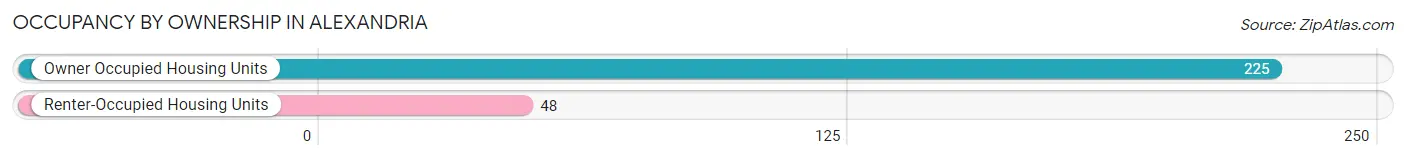
| Occupancy | # Housing Units | % Housing Units |
| Owner Occupied Housing Units | 225 | 82.4% |
| Renter-Occupied Housing Units | 48 | 17.6% |
| Total Occupied Housing Units | 273 | 100.0% |
Occupancy by Household Size in Alexandria
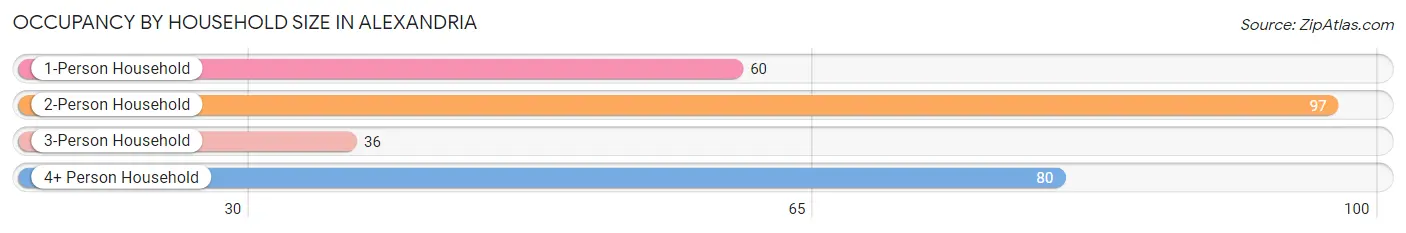
| Household Size | # Housing Units | % Housing Units |
| 1-Person Household | 60 | 22.0% |
| 2-Person Household | 97 | 35.5% |
| 3-Person Household | 36 | 13.2% |
| 4+ Person Household | 80 | 29.3% |
| Total Housing Units | 273 | 100.0% |
Occupancy by Ownership by Household Size in Alexandria
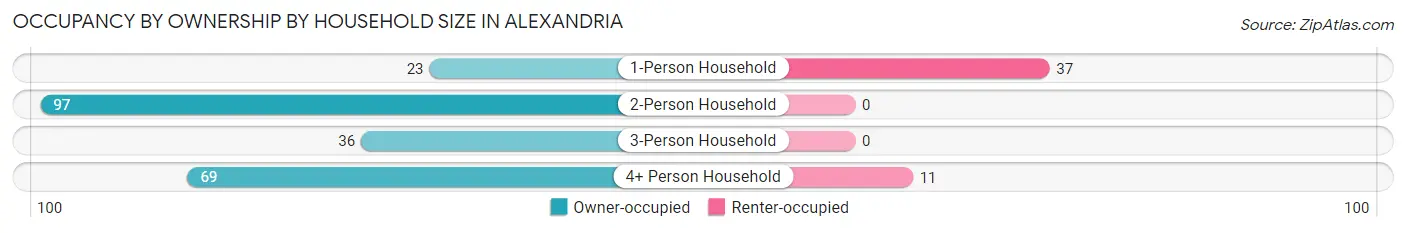
| Household Size | Owner-occupied | Renter-occupied |
| 1-Person Household | 23 (38.3%) | 37 (61.7%) |
| 2-Person Household | 97 (100.0%) | 0 (0.0%) |
| 3-Person Household | 36 (100.0%) | 0 (0.0%) |
| 4+ Person Household | 69 (86.3%) | 11 (13.8%) |
| Total Housing Units | 225 (82.4%) | 48 (17.6%) |
Occupancy by Educational Attainment in Alexandria
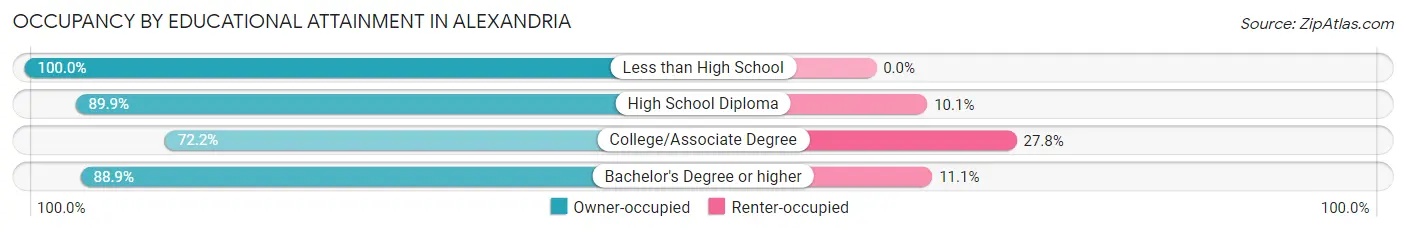
| Household Size | Owner-occupied | Renter-occupied |
| Less than High School | 7 (100.0%) | 0 (0.0%) |
| High School Diploma | 71 (89.9%) | 8 (10.1%) |
| College/Associate Degree | 83 (72.2%) | 32 (27.8%) |
| Bachelor's Degree or higher | 64 (88.9%) | 8 (11.1%) |
Occupancy by Age of Householder in Alexandria
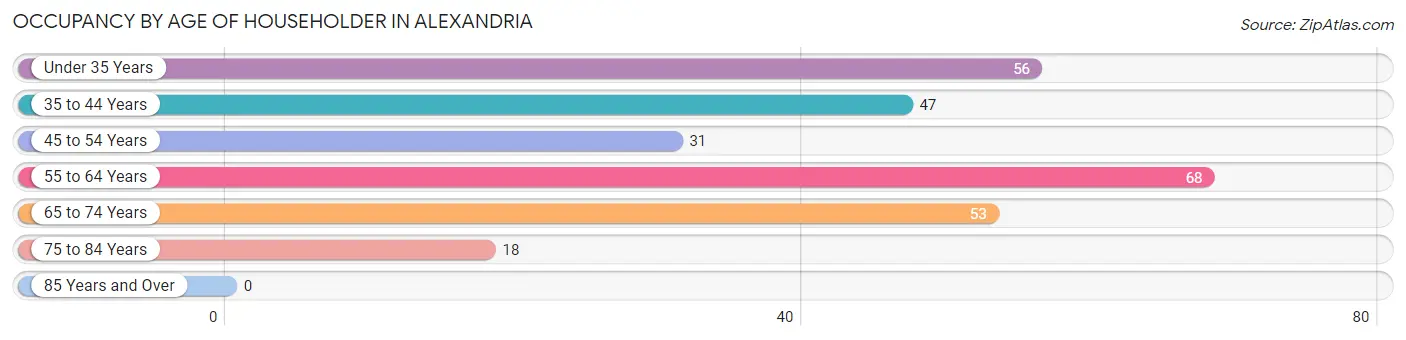
| Age Bracket | # Households | % Households |
| Under 35 Years | 56 | 20.5% |
| 35 to 44 Years | 47 | 17.2% |
| 45 to 54 Years | 31 | 11.4% |
| 55 to 64 Years | 68 | 24.9% |
| 65 to 74 Years | 53 | 19.4% |
| 75 to 84 Years | 18 | 6.6% |
| 85 Years and Over | 0 | 0.0% |
| Total | 273 | 100.0% |
Housing Finances in Alexandria
Median Income by Occupancy in Alexandria
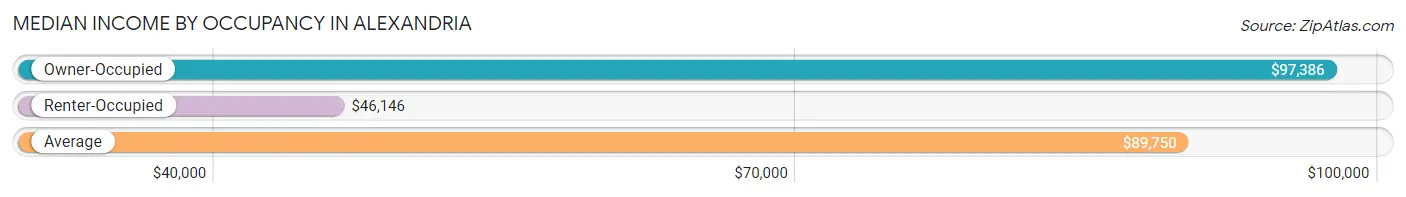
| Occupancy Type | # Households | Median Income |
| Owner-Occupied | 225 (82.4%) | $97,386 |
| Renter-Occupied | 48 (17.6%) | $46,146 |
| Average | 273 (100.0%) | $89,750 |
Occupancy by Householder Income Bracket in Alexandria
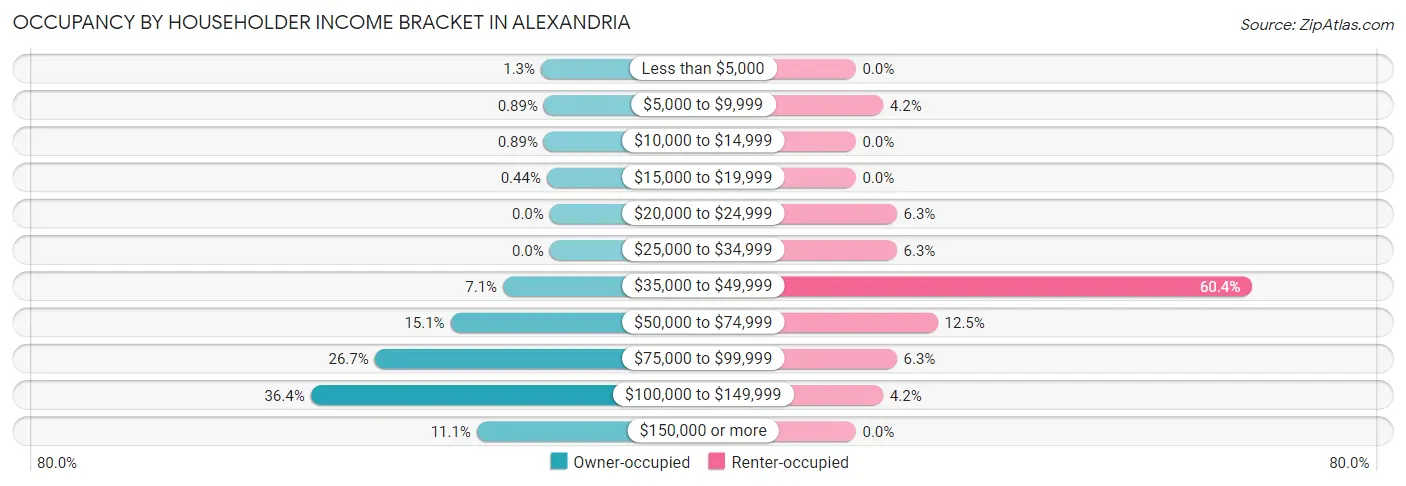
| Income Bracket | Owner-occupied | Renter-occupied |
| Less than $5,000 | 3 (1.3%) | 0 (0.0%) |
| $5,000 to $9,999 | 2 (0.9%) | 2 (4.2%) |
| $10,000 to $14,999 | 2 (0.9%) | 0 (0.0%) |
| $15,000 to $19,999 | 1 (0.4%) | 0 (0.0%) |
| $20,000 to $24,999 | 0 (0.0%) | 3 (6.2%) |
| $25,000 to $34,999 | 0 (0.0%) | 3 (6.2%) |
| $35,000 to $49,999 | 16 (7.1%) | 29 (60.4%) |
| $50,000 to $74,999 | 34 (15.1%) | 6 (12.5%) |
| $75,000 to $99,999 | 60 (26.7%) | 3 (6.2%) |
| $100,000 to $149,999 | 82 (36.4%) | 2 (4.2%) |
| $150,000 or more | 25 (11.1%) | 0 (0.0%) |
| Total | 225 (100.0%) | 48 (100.0%) |
Monthly Housing Cost Tiers in Alexandria
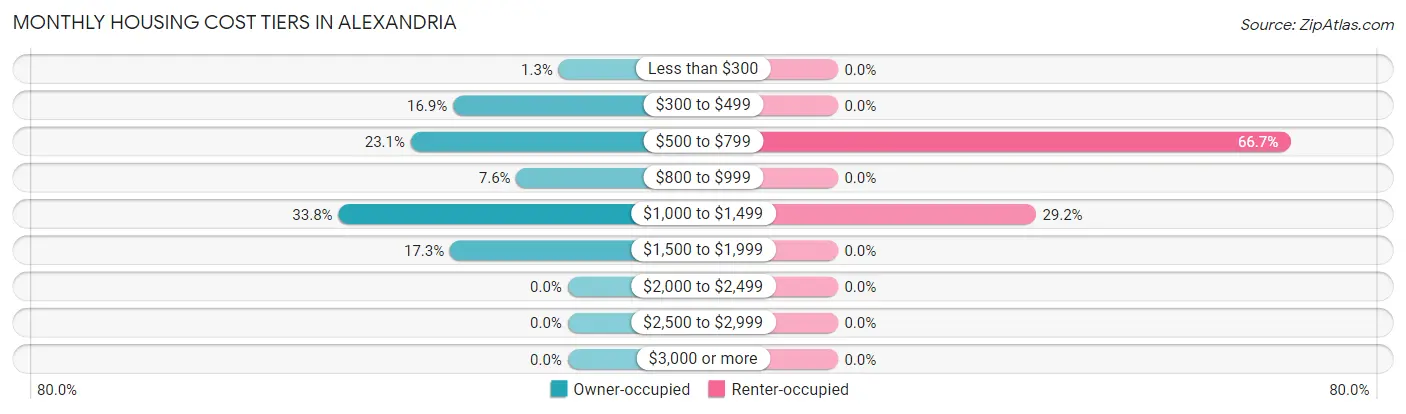
| Monthly Cost | Owner-occupied | Renter-occupied |
| Less than $300 | 3 (1.3%) | 0 (0.0%) |
| $300 to $499 | 38 (16.9%) | 0 (0.0%) |
| $500 to $799 | 52 (23.1%) | 32 (66.7%) |
| $800 to $999 | 17 (7.6%) | 0 (0.0%) |
| $1,000 to $1,499 | 76 (33.8%) | 14 (29.2%) |
| $1,500 to $1,999 | 39 (17.3%) | 0 (0.0%) |
| $2,000 to $2,499 | 0 (0.0%) | 0 (0.0%) |
| $2,500 to $2,999 | 0 (0.0%) | 0 (0.0%) |
| $3,000 or more | 0 (0.0%) | 0 (0.0%) |
| Total | 225 (100.0%) | 48 (100.0%) |
Physical Housing Characteristics in Alexandria
Housing Structures in Alexandria
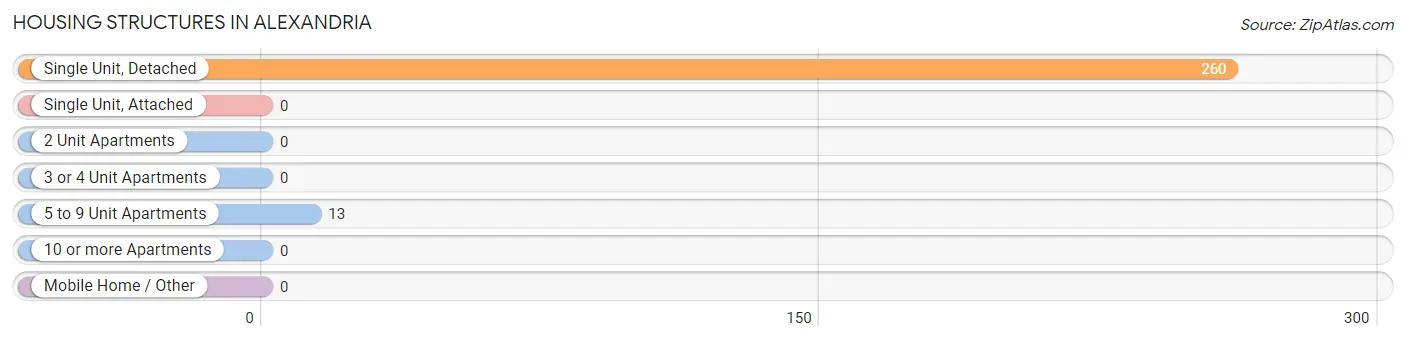
| Structure Type | # Housing Units | % Housing Units |
| Single Unit, Detached | 260 | 95.2% |
| Single Unit, Attached | 0 | 0.0% |
| 2 Unit Apartments | 0 | 0.0% |
| 3 or 4 Unit Apartments | 0 | 0.0% |
| 5 to 9 Unit Apartments | 13 | 4.8% |
| 10 or more Apartments | 0 | 0.0% |
| Mobile Home / Other | 0 | 0.0% |
| Total | 273 | 100.0% |
Housing Structures by Occupancy in Alexandria
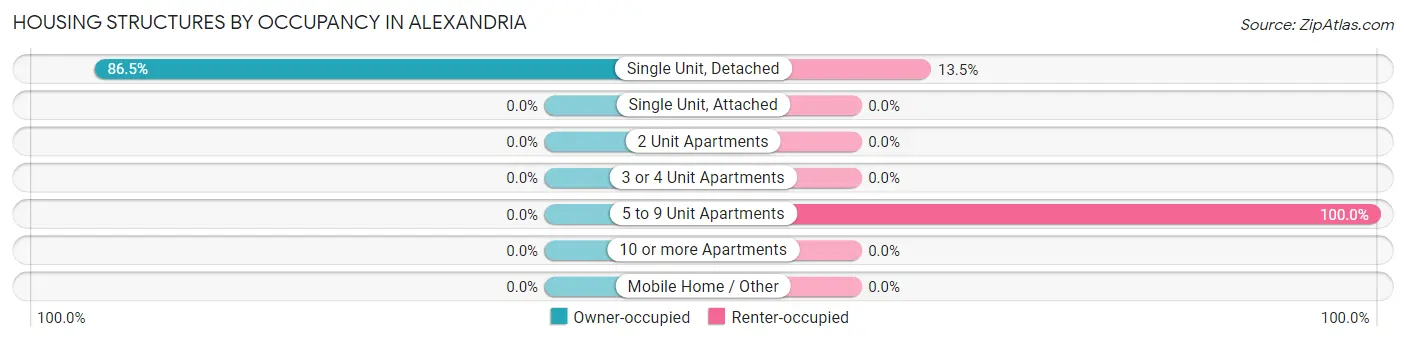
| Structure Type | Owner-occupied | Renter-occupied |
| Single Unit, Detached | 225 (86.5%) | 35 (13.5%) |
| Single Unit, Attached | 0 (0.0%) | 0 (0.0%) |
| 2 Unit Apartments | 0 (0.0%) | 0 (0.0%) |
| 3 or 4 Unit Apartments | 0 (0.0%) | 0 (0.0%) |
| 5 to 9 Unit Apartments | 0 (0.0%) | 13 (100.0%) |
| 10 or more Apartments | 0 (0.0%) | 0 (0.0%) |
| Mobile Home / Other | 0 (0.0%) | 0 (0.0%) |
| Total | 225 (82.4%) | 48 (17.6%) |
Housing Structures by Number of Rooms in Alexandria
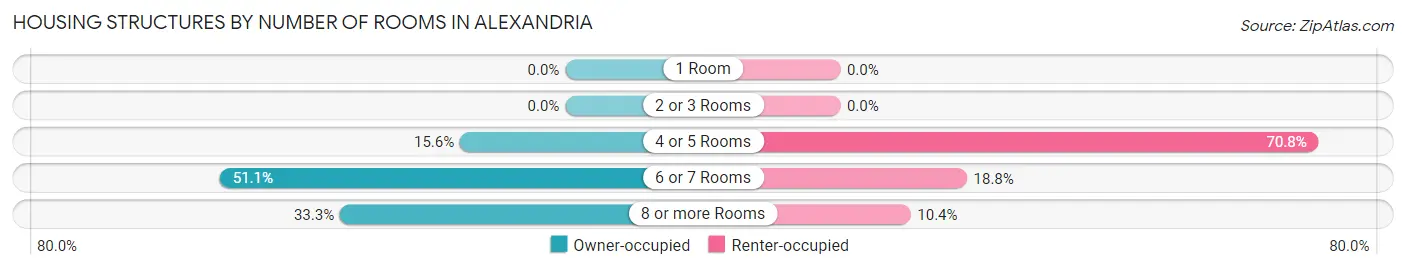
| Number of Rooms | Owner-occupied | Renter-occupied |
| 1 Room | 0 (0.0%) | 0 (0.0%) |
| 2 or 3 Rooms | 0 (0.0%) | 0 (0.0%) |
| 4 or 5 Rooms | 35 (15.6%) | 34 (70.8%) |
| 6 or 7 Rooms | 115 (51.1%) | 9 (18.8%) |
| 8 or more Rooms | 75 (33.3%) | 5 (10.4%) |
| Total | 225 (100.0%) | 48 (100.0%) |
Housing Structure by Heating Type in Alexandria
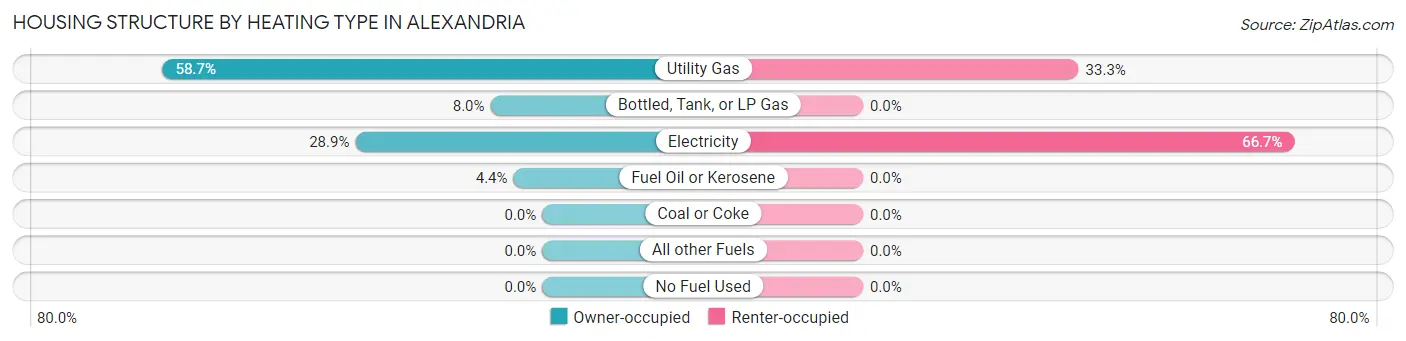
| Heating Type | Owner-occupied | Renter-occupied |
| Utility Gas | 132 (58.7%) | 16 (33.3%) |
| Bottled, Tank, or LP Gas | 18 (8.0%) | 0 (0.0%) |
| Electricity | 65 (28.9%) | 32 (66.7%) |
| Fuel Oil or Kerosene | 10 (4.4%) | 0 (0.0%) |
| Coal or Coke | 0 (0.0%) | 0 (0.0%) |
| All other Fuels | 0 (0.0%) | 0 (0.0%) |
| No Fuel Used | 0 (0.0%) | 0 (0.0%) |
| Total | 225 (100.0%) | 48 (100.0%) |
Household Vehicle Usage in Alexandria
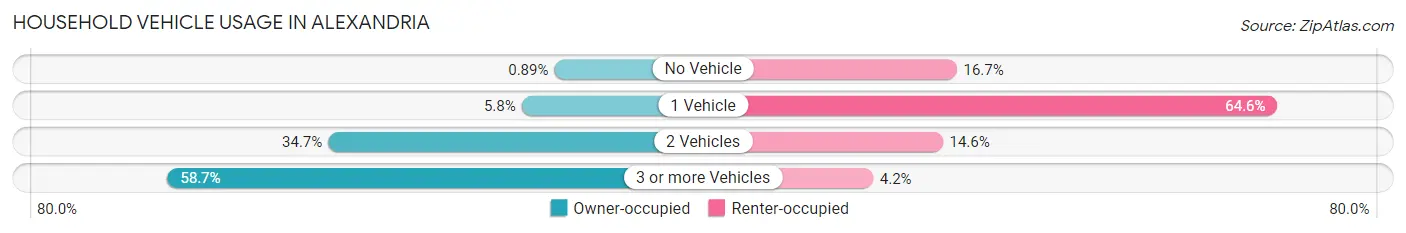
| Vehicles per Household | Owner-occupied | Renter-occupied |
| No Vehicle | 2 (0.9%) | 8 (16.7%) |
| 1 Vehicle | 13 (5.8%) | 31 (64.6%) |
| 2 Vehicles | 78 (34.7%) | 7 (14.6%) |
| 3 or more Vehicles | 132 (58.7%) | 2 (4.2%) |
| Total | 225 (100.0%) | 48 (100.0%) |
Real Estate & Mortgages in Alexandria
Real Estate and Mortgage Overview in Alexandria
| Characteristic | Without Mortgage | With Mortgage |
| Housing Units | 96 | 129 |
| Median Property Value | $128,600 | $159,000 |
| Median Household Income | $85,833 | $20 |
| Monthly Housing Costs | $530 | $0 |
| Real Estate Taxes | $2,177 | $0 |
Property Value by Mortgage Status in Alexandria
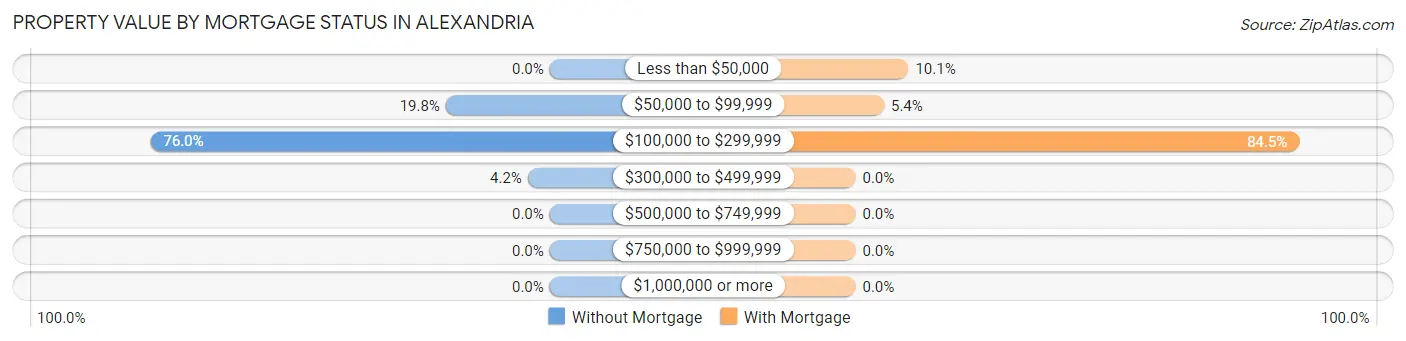
| Property Value | Without Mortgage | With Mortgage |
| Less than $50,000 | 0 (0.0%) | 13 (10.1%) |
| $50,000 to $99,999 | 19 (19.8%) | 7 (5.4%) |
| $100,000 to $299,999 | 73 (76.0%) | 109 (84.5%) |
| $300,000 to $499,999 | 4 (4.2%) | 0 (0.0%) |
| $500,000 to $749,999 | 0 (0.0%) | 0 (0.0%) |
| $750,000 to $999,999 | 0 (0.0%) | 0 (0.0%) |
| $1,000,000 or more | 0 (0.0%) | 0 (0.0%) |
| Total | 96 (100.0%) | 129 (100.0%) |
Household Income by Mortgage Status in Alexandria
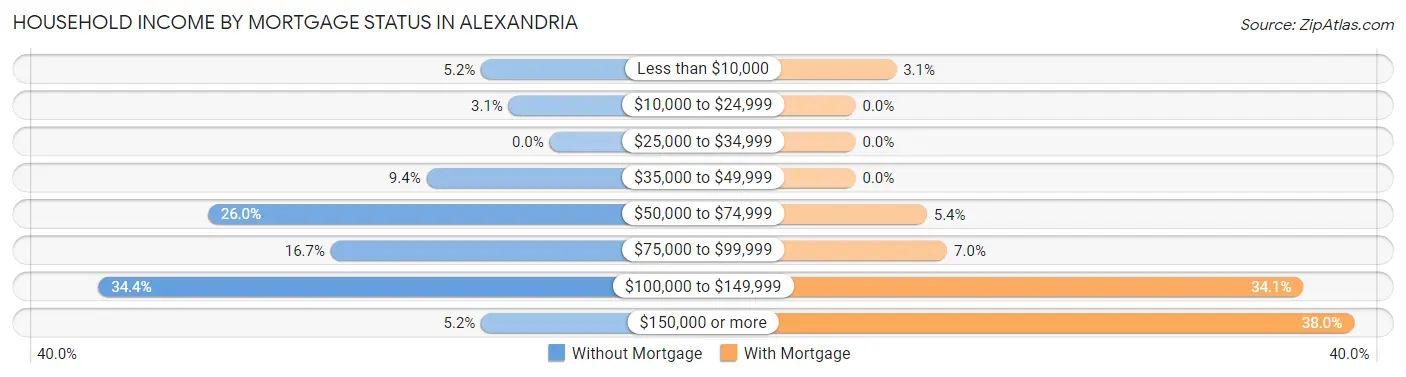
| Household Income | Without Mortgage | With Mortgage |
| Less than $10,000 | 5 (5.2%) | 4 (3.1%) |
| $10,000 to $24,999 | 3 (3.1%) | 0 (0.0%) |
| $25,000 to $34,999 | 0 (0.0%) | 0 (0.0%) |
| $35,000 to $49,999 | 9 (9.4%) | 0 (0.0%) |
| $50,000 to $74,999 | 25 (26.0%) | 7 (5.4%) |
| $75,000 to $99,999 | 16 (16.7%) | 9 (7.0%) |
| $100,000 to $149,999 | 33 (34.4%) | 44 (34.1%) |
| $150,000 or more | 5 (5.2%) | 49 (38.0%) |
| Total | 96 (100.0%) | 129 (100.0%) |
Property Value to Household Income Ratio in Alexandria
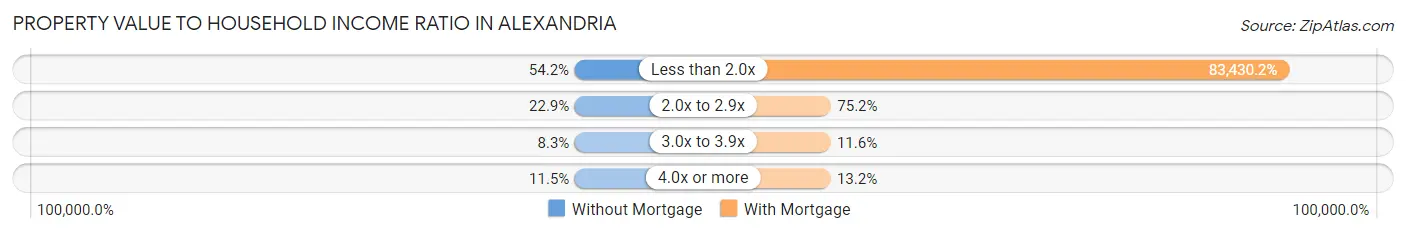
| Value-to-Income Ratio | Without Mortgage | With Mortgage |
| Less than 2.0x | 52 (54.2%) | 107,625 (83,430.2%) |
| 2.0x to 2.9x | 22 (22.9%) | 97 (75.2%) |
| 3.0x to 3.9x | 8 (8.3%) | 15 (11.6%) |
| 4.0x or more | 11 (11.5%) | 17 (13.2%) |
| Total | 96 (100.0%) | 129 (100.0%) |
Real Estate Taxes by Mortgage Status in Alexandria
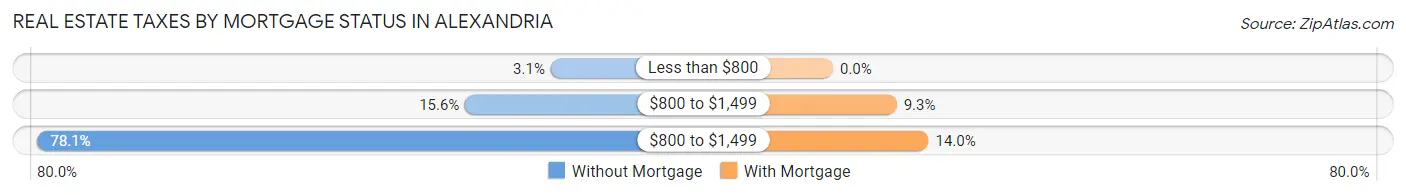
| Property Taxes | Without Mortgage | With Mortgage |
| Less than $800 | 3 (3.1%) | 0 (0.0%) |
| $800 to $1,499 | 15 (15.6%) | 12 (9.3%) |
| $800 to $1,499 | 75 (78.1%) | 18 (14.0%) |
| Total | 96 (100.0%) | 129 (100.0%) |
Health & Disability in Alexandria
Health Insurance Coverage by Age in Alexandria
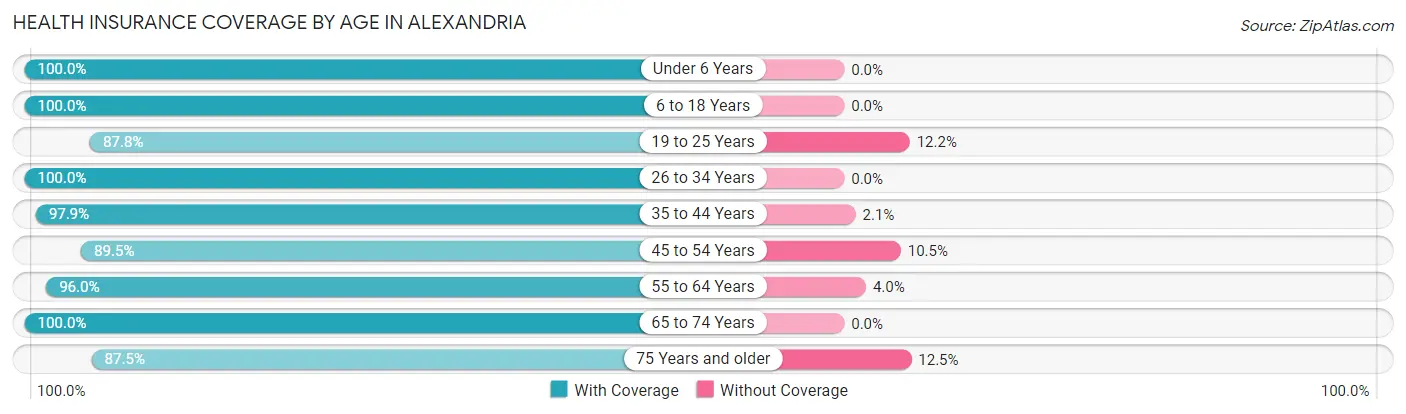
| Age Bracket | With Coverage | Without Coverage |
| Under 6 Years | 82 (100.0%) | 0 (0.0%) |
| 6 to 18 Years | 209 (100.0%) | 0 (0.0%) |
| 19 to 25 Years | 36 (87.8%) | 5 (12.2%) |
| 26 to 34 Years | 130 (100.0%) | 0 (0.0%) |
| 35 to 44 Years | 93 (97.9%) | 2 (2.1%) |
| 45 to 54 Years | 51 (89.5%) | 6 (10.5%) |
| 55 to 64 Years | 95 (96.0%) | 4 (4.0%) |
| 65 to 74 Years | 102 (100.0%) | 0 (0.0%) |
| 75 Years and older | 21 (87.5%) | 3 (12.5%) |
| Total | 819 (97.6%) | 20 (2.4%) |
Health Insurance Coverage by Citizenship Status in Alexandria
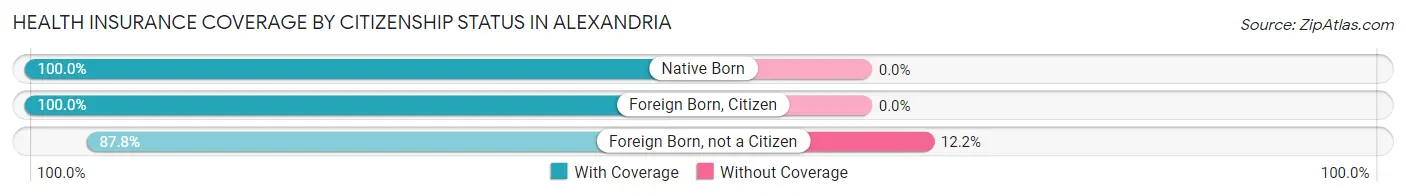
| Citizenship Status | With Coverage | Without Coverage |
| Native Born | 82 (100.0%) | 0 (0.0%) |
| Foreign Born, Citizen | 209 (100.0%) | 0 (0.0%) |
| Foreign Born, not a Citizen | 36 (87.8%) | 5 (12.2%) |
Health Insurance Coverage by Household Income in Alexandria
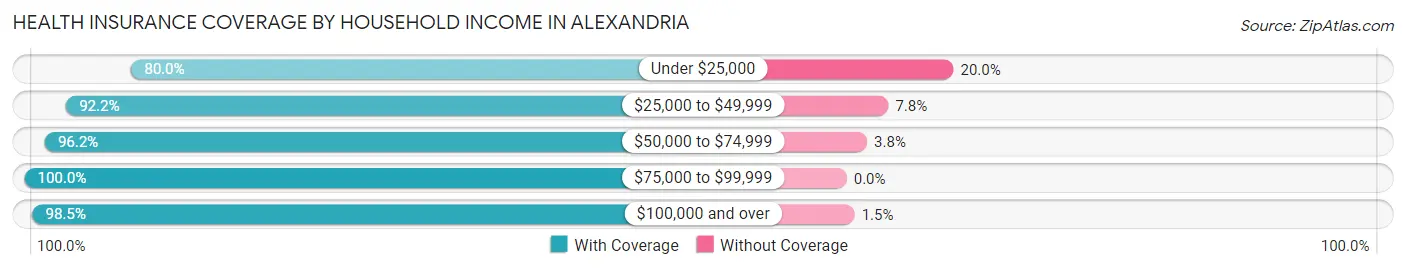
| Household Income | With Coverage | Without Coverage |
| Under $25,000 | 12 (80.0%) | 3 (20.0%) |
| $25,000 to $49,999 | 59 (92.2%) | 5 (7.8%) |
| $50,000 to $74,999 | 151 (96.2%) | 6 (3.8%) |
| $75,000 to $99,999 | 200 (100.0%) | 0 (0.0%) |
| $100,000 and over | 397 (98.5%) | 6 (1.5%) |
Public vs Private Health Insurance Coverage by Age in Alexandria
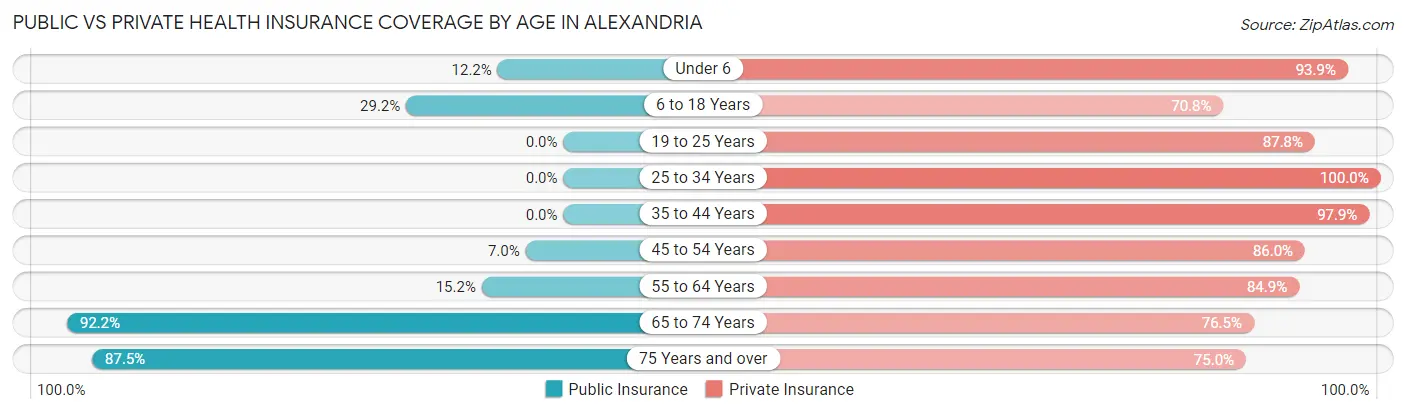
| Age Bracket | Public Insurance | Private Insurance |
| Under 6 | 10 (12.2%) | 77 (93.9%) |
| 6 to 18 Years | 61 (29.2%) | 148 (70.8%) |
| 19 to 25 Years | 0 (0.0%) | 36 (87.8%) |
| 25 to 34 Years | 0 (0.0%) | 130 (100.0%) |
| 35 to 44 Years | 0 (0.0%) | 93 (97.9%) |
| 45 to 54 Years | 4 (7.0%) | 49 (86.0%) |
| 55 to 64 Years | 15 (15.1%) | 84 (84.9%) |
| 65 to 74 Years | 94 (92.2%) | 78 (76.5%) |
| 75 Years and over | 21 (87.5%) | 18 (75.0%) |
| Total | 205 (24.4%) | 713 (85.0%) |
Disability Status by Sex by Age in Alexandria
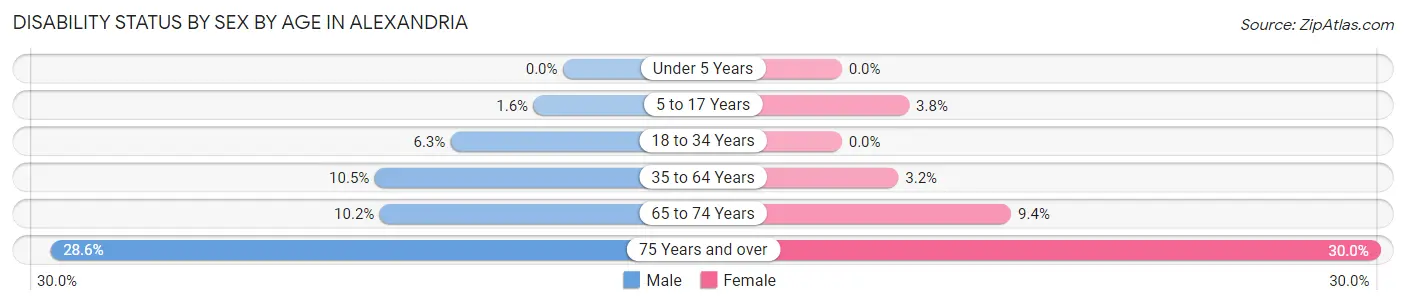
| Age Bracket | Male | Female |
| Under 5 Years | 0 (0.0%) | 0 (0.0%) |
| 5 to 17 Years | 2 (1.6%) | 3 (3.7%) |
| 18 to 34 Years | 5 (6.2%) | 0 (0.0%) |
| 35 to 64 Years | 13 (10.5%) | 4 (3.2%) |
| 65 to 74 Years | 5 (10.2%) | 5 (9.4%) |
| 75 Years and over | 4 (28.6%) | 3 (30.0%) |
Disability Class by Sex by Age in Alexandria
Disability Class: Hearing Difficulty
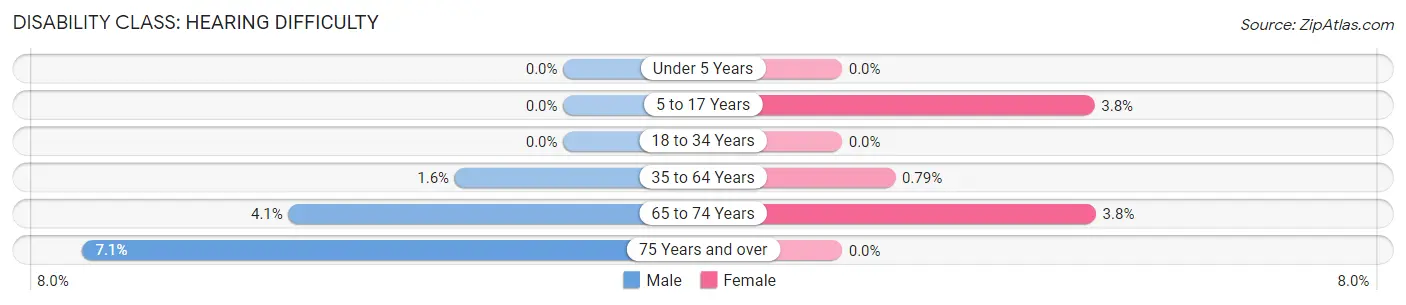
| Age Bracket | Male | Female |
| Under 5 Years | 0 (0.0%) | 0 (0.0%) |
| 5 to 17 Years | 0 (0.0%) | 3 (3.7%) |
| 18 to 34 Years | 0 (0.0%) | 0 (0.0%) |
| 35 to 64 Years | 2 (1.6%) | 1 (0.8%) |
| 65 to 74 Years | 2 (4.1%) | 2 (3.8%) |
| 75 Years and over | 1 (7.1%) | 0 (0.0%) |
Disability Class: Vision Difficulty
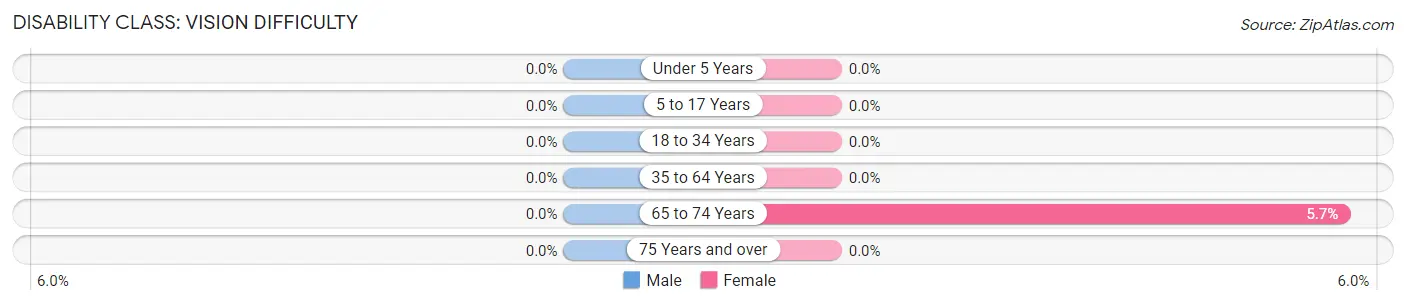
| Age Bracket | Male | Female |
| Under 5 Years | 0 (0.0%) | 0 (0.0%) |
| 5 to 17 Years | 0 (0.0%) | 0 (0.0%) |
| 18 to 34 Years | 0 (0.0%) | 0 (0.0%) |
| 35 to 64 Years | 0 (0.0%) | 0 (0.0%) |
| 65 to 74 Years | 0 (0.0%) | 3 (5.7%) |
| 75 Years and over | 0 (0.0%) | 0 (0.0%) |
Disability Class: Cognitive Difficulty
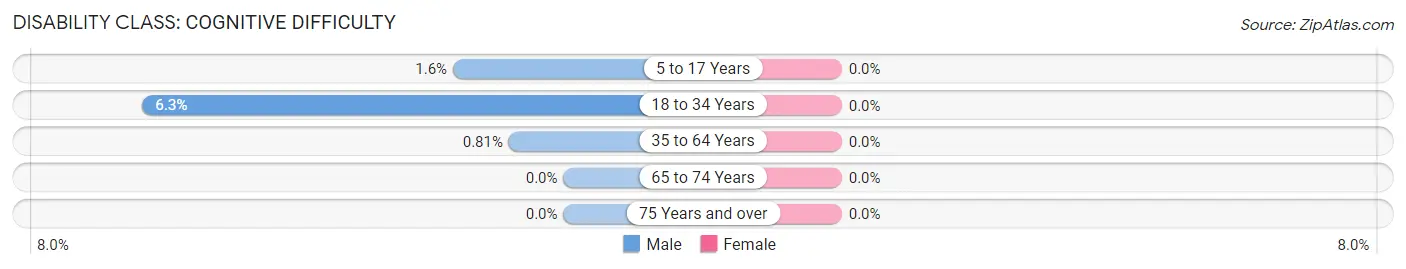
| Age Bracket | Male | Female |
| 5 to 17 Years | 2 (1.6%) | 0 (0.0%) |
| 18 to 34 Years | 5 (6.2%) | 0 (0.0%) |
| 35 to 64 Years | 1 (0.8%) | 0 (0.0%) |
| 65 to 74 Years | 0 (0.0%) | 0 (0.0%) |
| 75 Years and over | 0 (0.0%) | 0 (0.0%) |
Disability Class: Ambulatory Difficulty
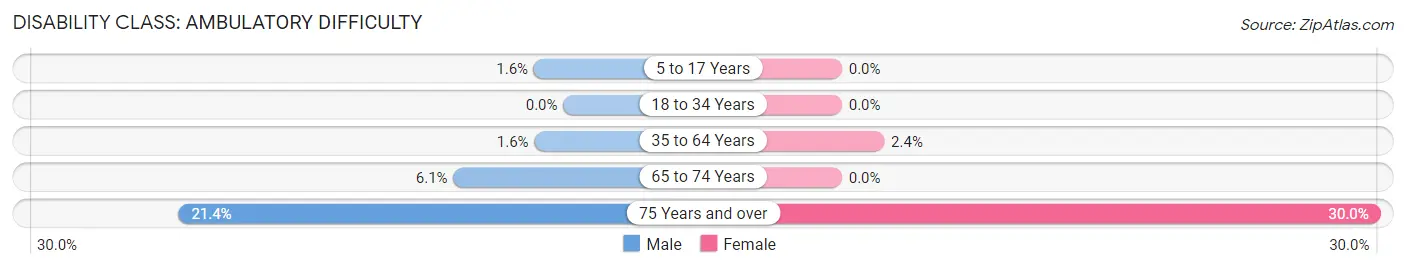
| Age Bracket | Male | Female |
| 5 to 17 Years | 2 (1.6%) | 0 (0.0%) |
| 18 to 34 Years | 0 (0.0%) | 0 (0.0%) |
| 35 to 64 Years | 2 (1.6%) | 3 (2.4%) |
| 65 to 74 Years | 3 (6.1%) | 0 (0.0%) |
| 75 Years and over | 3 (21.4%) | 3 (30.0%) |
Disability Class: Self-Care Difficulty
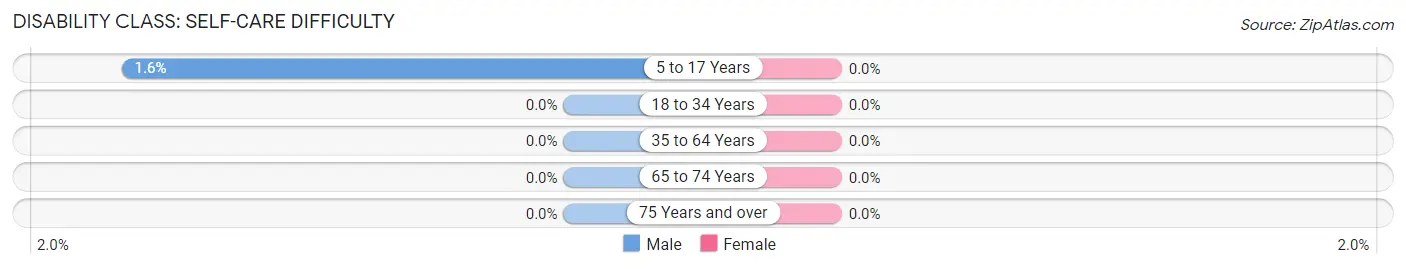
| Age Bracket | Male | Female |
| 5 to 17 Years | 2 (1.6%) | 0 (0.0%) |
| 18 to 34 Years | 0 (0.0%) | 0 (0.0%) |
| 35 to 64 Years | 0 (0.0%) | 0 (0.0%) |
| 65 to 74 Years | 0 (0.0%) | 0 (0.0%) |
| 75 Years and over | 0 (0.0%) | 0 (0.0%) |
Technology Access in Alexandria
Computing Device Access in Alexandria
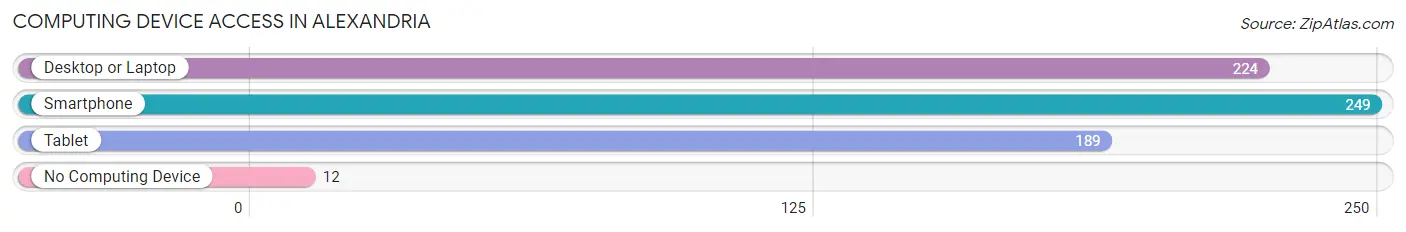
| Device Type | # Households | % Households |
| Desktop or Laptop | 224 | 82.1% |
| Smartphone | 249 | 91.2% |
| Tablet | 189 | 69.2% |
| No Computing Device | 12 | 4.4% |
| Total | 273 | 100.0% |
Internet Access in Alexandria
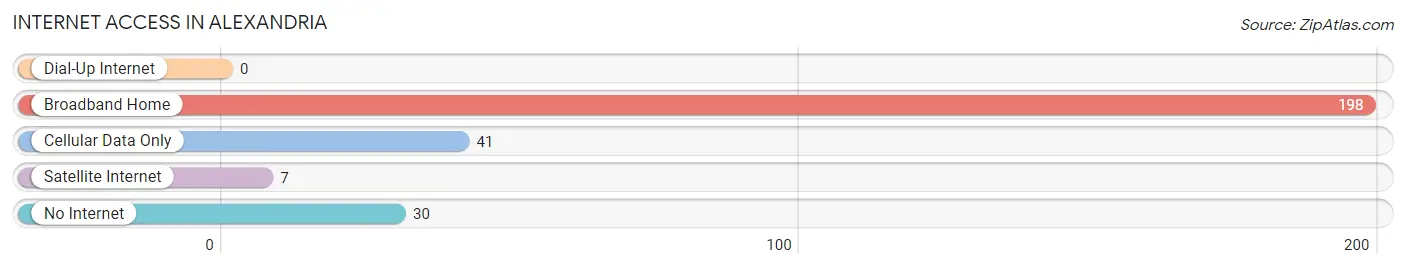
| Internet Type | # Households | % Households |
| Dial-Up Internet | 0 | 0.0% |
| Broadband Home | 198 | 72.5% |
| Cellular Data Only | 41 | 15.0% |
| Satellite Internet | 7 | 2.6% |
| No Internet | 30 | 11.0% |
| Total | 273 | 100.0% |
Alexandria Summary
Alexandria, South Dakota is a small town located in the southeastern corner of the state. It is situated in the rolling hills of the Missouri River Valley, and is surrounded by the scenic beauty of the Black Hills. The town was founded in 1883 and has a population of approximately 1,000 people.
History
Alexandria was founded in 1883 by a group of settlers from the nearby town of Yankton. The settlers were looking for a place to settle and start a new life, and they chose the area around Alexandria because of its fertile soil and abundant natural resources. The town was named after Alexander Mitchell, a prominent local businessman and politician.
The town quickly grew and prospered, and by the early 1900s it had become a thriving agricultural and commercial center. The town was home to several businesses, including a flour mill, a creamery, a lumber yard, and a general store. The town also had a school, a post office, and a bank.
In the early 1900s, the town was also home to a large number of German immigrants. These immigrants brought with them their culture and traditions, and they helped to shape the town’s identity.
Geography
Alexandria is located in the southeastern corner of South Dakota, in the rolling hills of the Missouri River Valley. The town is surrounded by the scenic beauty of the Black Hills, and is located just a few miles from the Missouri River.
The town is located at an elevation of 1,845 feet, and has a total area of 0.7 square miles. The town is located in the Central Time Zone, and has a humid continental climate with hot summers and cold winters.
Economy
The economy of Alexandria is largely based on agriculture and tourism. The town is home to several farms, and the surrounding area is known for its production of corn, soybeans, and wheat. The town is also home to several small businesses, including a grocery store, a hardware store, and a restaurant.
The town is also a popular tourist destination, and is home to several attractions, including the Alexandria State Recreation Area, the Alexandria Museum, and the Alexandria Aquarium. The town is also home to several festivals and events throughout the year, including the Alexandria Summer Festival and the Alexandria Fall Festival.
Demographics
As of the 2010 census, the population of Alexandria was 1,000 people. The town is predominantly white, with a small percentage of African Americans, Native Americans, and Hispanics. The median household income in the town is $37,000, and the median age is 40 years.
The town is served by the Alexandria School District, which includes two elementary schools, one middle school, and one high school. The town is also home to several churches, including the First Presbyterian Church, the First Baptist Church, and the United Methodist Church.
Conclusion
Alexandria, South Dakota is a small town located in the southeastern corner of the state. It was founded in 1883 and has a population of approximately 1,000 people. The town is known for its agricultural and tourism industries, and is home to several attractions, including the Alexandria State Recreation Area, the Alexandria Museum, and the Alexandria Aquarium. The town is predominantly white, with a small percentage of African Americans, Native Americans, and Hispanics. The median household income in the town is $37,000, and the median age is 40 years.
Common Questions
What is Per Capita Income in Alexandria?
Per Capita income in Alexandria is $31,177.
What is the Median Family Income in Alexandria?
Median Family Income in Alexandria is $97,426.
What is the Median Household income in Alexandria?
Median Household Income in Alexandria is $89,750.
What is Income or Wage Gap in Alexandria?
Income or Wage Gap in Alexandria is 18.8%.
Women in Alexandria earn 81.2 cents for every dollar earned by a man.
What is Inequality or Gini Index in Alexandria?
Inequality or Gini Index in Alexandria is 0.28.
What is the Total Population of Alexandria?
Total Population of Alexandria is 839.
What is the Total Male Population of Alexandria?
Total Male Population of Alexandria is 415.
What is the Total Female Population of Alexandria?
Total Female Population of Alexandria is 424.
What is the Ratio of Males per 100 Females in Alexandria?
There are 97.88 Males per 100 Females in Alexandria.
What is the Ratio of Females per 100 Males in Alexandria?
There are 102.17 Females per 100 Males in Alexandria.
What is the Median Population Age in Alexandria?
Median Population Age in Alexandria is 33.5 Years.
What is the Average Family Size in Alexandria
Average Family Size in Alexandria is 3.7 People.
What is the Average Household Size in Alexandria
Average Household Size in Alexandria is 3.1 People.
How Large is the Labor Force in Alexandria?
There are 463 People in the Labor Forcein in Alexandria.
What is the Percentage of People in the Labor Force in Alexandria?
77.6% of People are in the Labor Force in Alexandria.