Johnson Siding, SD Map & Demographics
Johnson Siding Map
Johnson Siding Overview
$38,867
PER CAPITA INCOME
$106,827
AVG FAMILY INCOME
$94,886
AVG HOUSEHOLD INCOME
0.34
INEQUALITY / GINI INDEX
658
TOTAL POPULATION
317
MALE POPULATION
341
FEMALE POPULATION
92.96
MALES / 100 FEMALES
107.57
FEMALES / 100 MALES
47.6
MEDIAN AGE
2.8
AVG FAMILY SIZE
2.5
AVG HOUSEHOLD SIZE
350
LABOR FORCE [ PEOPLE ]
60.6%
PERCENT IN LABOR FORCE
Income in Johnson Siding
Income Overview in Johnson Siding
Per Capita Income in Johnson Siding is $38,867, while median incomes of families and households are $106,827 and $94,886 respectively.
| Characteristic | Number | Measure |
| Per Capita Income | 658 | $38,867 |
| Median Family Income | 207 | $106,827 |
| Mean Family Income | 207 | $106,710 |
| Median Household Income | 265 | $94,886 |
| Mean Household Income | 265 | $93,797 |
| Income Deficit | 207 | $0 |
| Wage / Income Gap (%) | 658 | 0.00% |
| Wage / Income Gap ($) | 658 | 100.00¢ per $1 |
| Gini / Inequality Index | 658 | 0.34 |
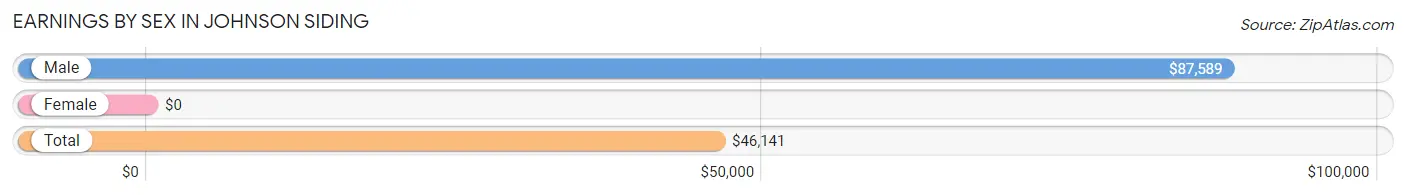
Earnings by Sex in Johnson Siding
| Sex | Number | Average Earnings |
| Male | 185 (51.8%) | $87,589 |
| Female | 172 (48.2%) | $0 |
| Total | 357 (100.0%) | $46,141 |
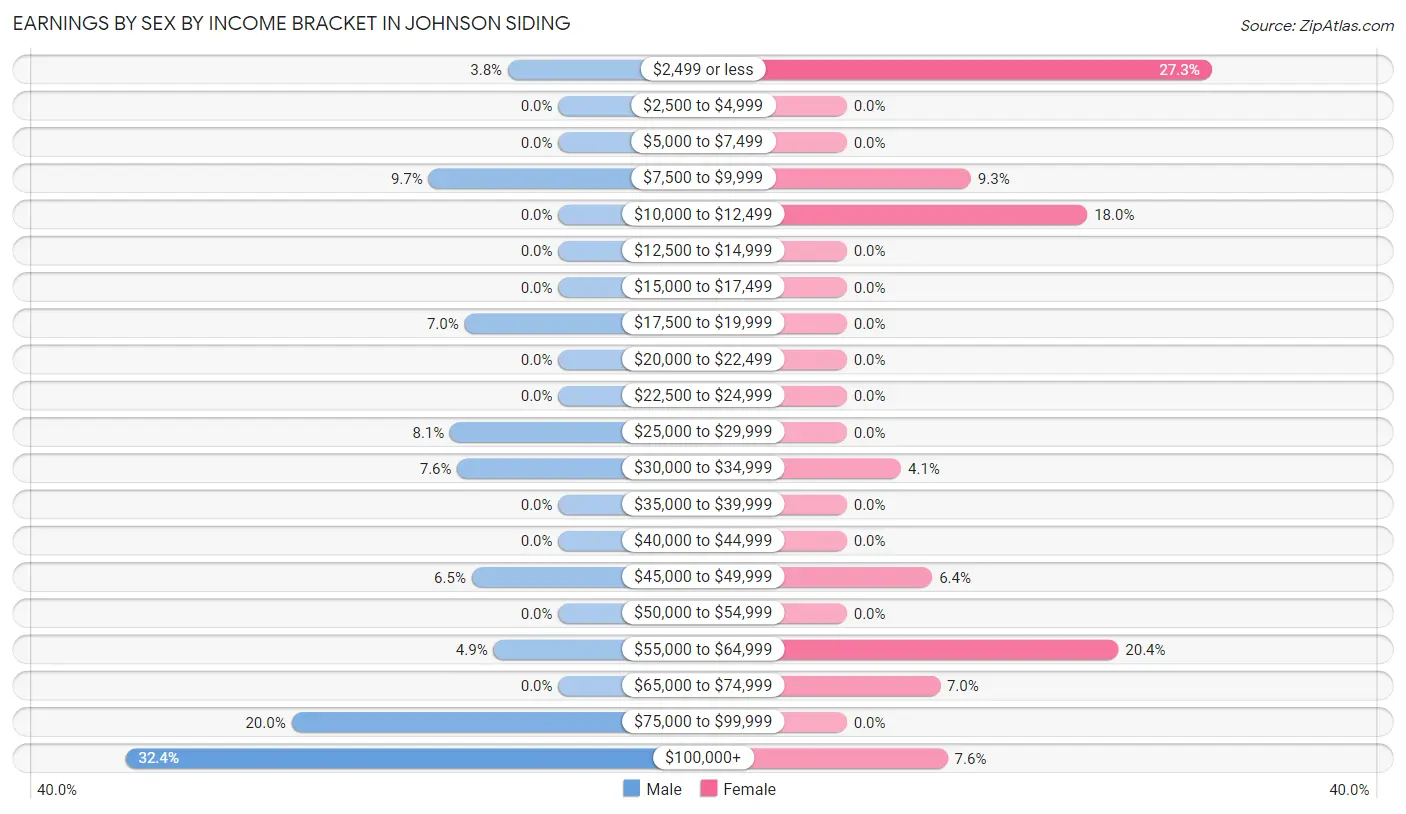
Earnings by Sex by Income Bracket in Johnson Siding
The most common earnings brackets in Johnson Siding are $100,000+ for men (60 | 32.4%) and $2,499 or less for women (47 | 27.3%).
| Income | Male | Female |
| $2,499 or less | 7 (3.8%) | 47 (27.3%) |
| $2,500 to $4,999 | 0 (0.0%) | 0 (0.0%) |
| $5,000 to $7,499 | 0 (0.0%) | 0 (0.0%) |
| $7,500 to $9,999 | 18 (9.7%) | 16 (9.3%) |
| $10,000 to $12,499 | 0 (0.0%) | 31 (18.0%) |
| $12,500 to $14,999 | 0 (0.0%) | 0 (0.0%) |
| $15,000 to $17,499 | 0 (0.0%) | 0 (0.0%) |
| $17,500 to $19,999 | 13 (7.0%) | 0 (0.0%) |
| $20,000 to $22,499 | 0 (0.0%) | 0 (0.0%) |
| $22,500 to $24,999 | 0 (0.0%) | 0 (0.0%) |
| $25,000 to $29,999 | 15 (8.1%) | 0 (0.0%) |
| $30,000 to $34,999 | 14 (7.6%) | 7 (4.1%) |
| $35,000 to $39,999 | 0 (0.0%) | 0 (0.0%) |
| $40,000 to $44,999 | 0 (0.0%) | 0 (0.0%) |
| $45,000 to $49,999 | 12 (6.5%) | 11 (6.4%) |
| $50,000 to $54,999 | 0 (0.0%) | 0 (0.0%) |
| $55,000 to $64,999 | 9 (4.9%) | 35 (20.3%) |
| $65,000 to $74,999 | 0 (0.0%) | 12 (7.0%) |
| $75,000 to $99,999 | 37 (20.0%) | 0 (0.0%) |
| $100,000+ | 60 (32.4%) | 13 (7.6%) |
| Total | 185 (100.0%) | 172 (100.0%) |
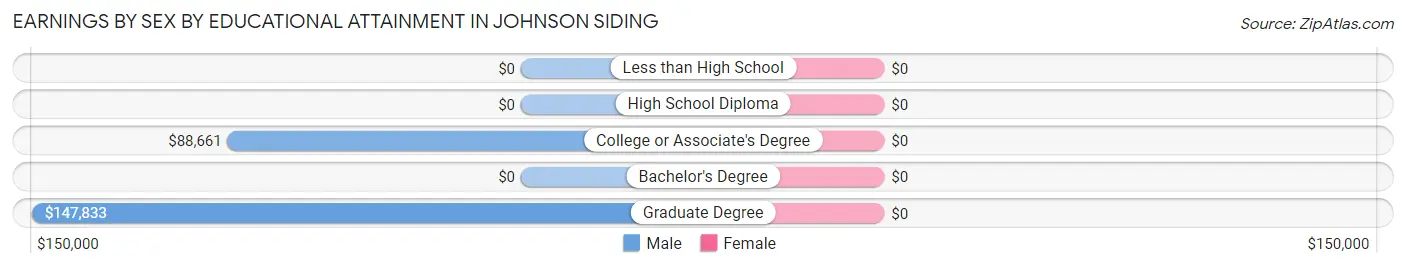
Earnings by Sex by Educational Attainment in Johnson Siding
| Educational Attainment | Male Income | Female Income |
| Less than High School | - | - |
| High School Diploma | - | - |
| College or Associate's Degree | $88,661 | $0 |
| Bachelor's Degree | - | - |
| Graduate Degree | $147,833 | $0 |
| Total | $95,197 | $0 |
Family Income in Johnson Siding
Family Income Brackets in Johnson Siding
According to the Johnson Siding family income data, there are 82 families falling into the $150,000 to $199,999 income range, which is the most common income bracket and makes up 39.6% of all families.
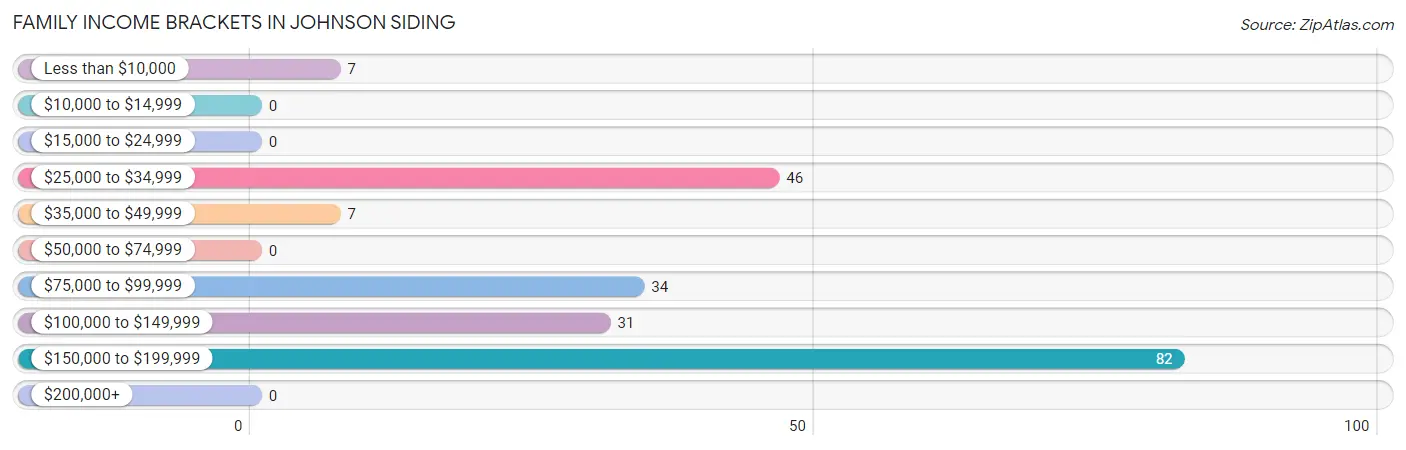
| Income Bracket | # Families | % Families |
| Less than $10,000 | 7 | 3.4% |
| $10,000 to $14,999 | 0 | 0.0% |
| $15,000 to $24,999 | 0 | 0.0% |
| $25,000 to $34,999 | 46 | 22.2% |
| $35,000 to $49,999 | 7 | 3.4% |
| $50,000 to $74,999 | 0 | 0.0% |
| $75,000 to $99,999 | 34 | 16.4% |
| $100,000 to $149,999 | 31 | 15.0% |
| $150,000 to $199,999 | 82 | 39.6% |
| $200,000+ | 0 | 0.0% |
Family Income by Famaliy Size in Johnson Siding
3-person families (42 | 20.3%) account for the highest median family income in Johnson Siding with $178,333 per family, while 3-person families (42 | 20.3%) have the highest median income of $59,444 per family member.
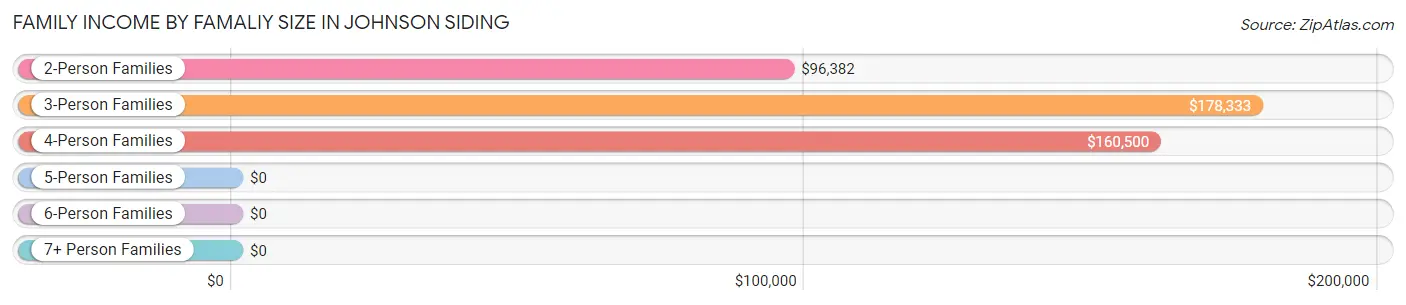
| Income Bracket | # Families | Median Income |
| 2-Person Families | 117 (56.5%) | $96,382 |
| 3-Person Families | 42 (20.3%) | $178,333 |
| 4-Person Families | 48 (23.2%) | $160,500 |
| 5-Person Families | 0 (0.0%) | $0 |
| 6-Person Families | 0 (0.0%) | $0 |
| 7+ Person Families | 0 (0.0%) | $0 |
| Total | 207 (100.0%) | $106,827 |
Family Income by Number of Earners in Johnson Siding
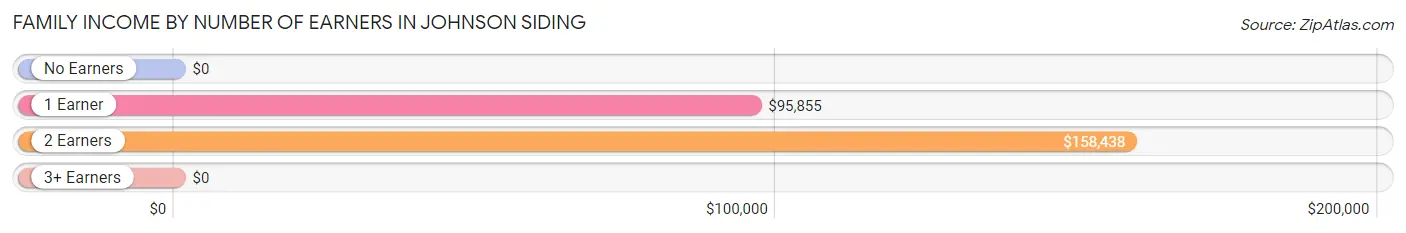
| Number of Earners | # Families | Median Income |
| No Earners | 57 (27.5%) | $0 |
| 1 Earner | 51 (24.6%) | $95,855 |
| 2 Earners | 63 (30.4%) | $158,438 |
| 3+ Earners | 36 (17.4%) | $0 |
| Total | 207 (100.0%) | $106,827 |
Household Income in Johnson Siding
Household Income Brackets in Johnson Siding
With 82 households falling in the category, the $150,000 to $199,999 income range is the most frequent in Johnson Siding, accounting for 30.9% of all households.
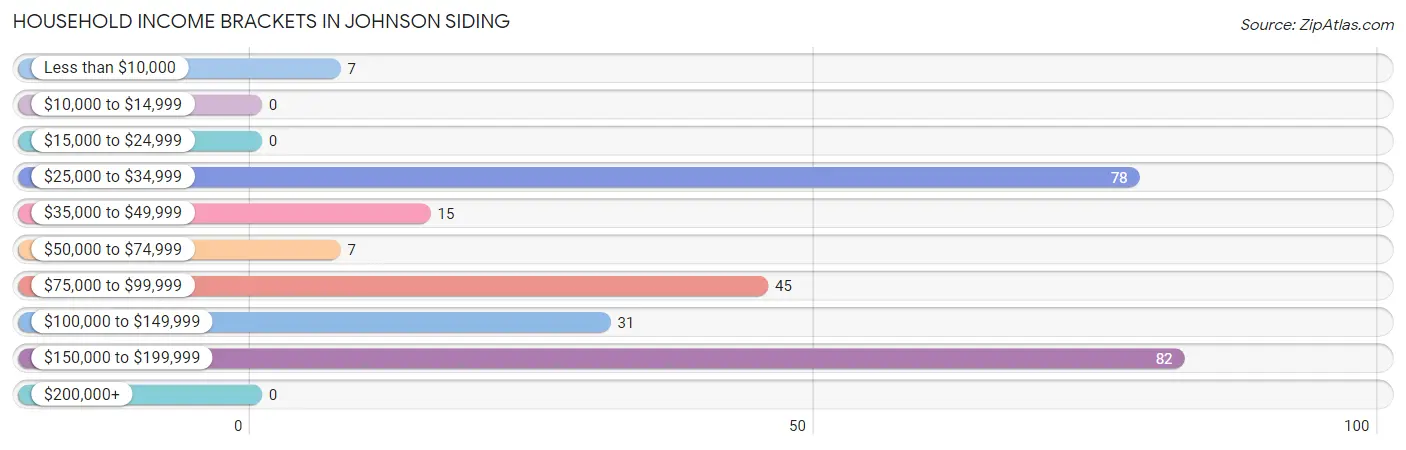
| Income Bracket | # Households | % Households |
| Less than $10,000 | 7 | 2.6% |
| $10,000 to $14,999 | 0 | 0.0% |
| $15,000 to $24,999 | 0 | 0.0% |
| $25,000 to $34,999 | 78 | 29.4% |
| $35,000 to $49,999 | 15 | 5.7% |
| $50,000 to $74,999 | 7 | 2.6% |
| $75,000 to $99,999 | 45 | 17.0% |
| $100,000 to $149,999 | 31 | 11.7% |
| $150,000 to $199,999 | 82 | 30.9% |
| $200,000+ | 0 | 0.0% |
Household Income by Householder Age in Johnson Siding
The median household income in Johnson Siding is $94,886, with the highest median household income of $160,458 found in the 45 to 64 years age bracket for the primary householder. A total of 79 households (29.8%) fall into this category. Meanwhile, the 15 to 24 years age bracket for the primary householder has the lowest median household income of $0, with 11 households (4.2%) in this group.
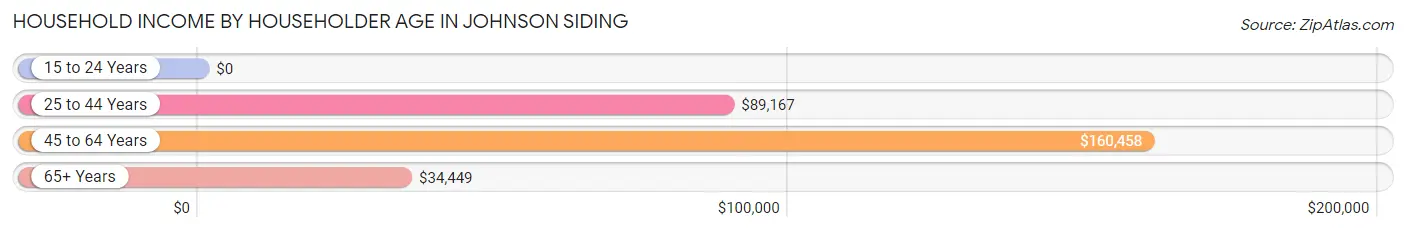
| Income Bracket | # Households | Median Income |
| 15 to 24 Years | 11 (4.2%) | $0 |
| 25 to 44 Years | 46 (17.4%) | $89,167 |
| 45 to 64 Years | 79 (29.8%) | $160,458 |
| 65+ Years | 129 (48.7%) | $34,449 |
| Total | 265 (100.0%) | $94,886 |
Poverty in Johnson Siding
Income Below Poverty by Sex and Age in Johnson Siding
With 12.9% poverty level for males and 9.7% for females among the residents of Johnson Siding, under 5 year old males and 25 to 34 year old females are the most vulnerable to poverty, with 21 males (67.7%) and 14 females (51.8%) in their respective age groups living below the poverty level.
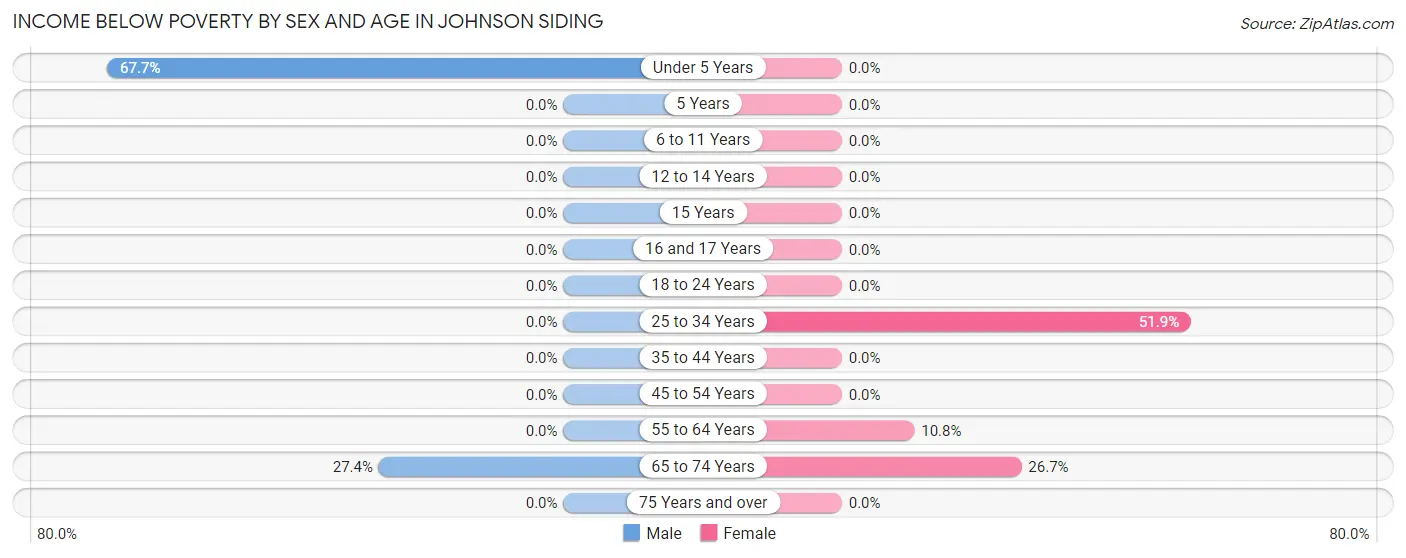
| Age Bracket | Male | Female |
| Under 5 Years | 21 (67.7%) | 0 (0.0%) |
| 5 Years | 0 (0.0%) | 0 (0.0%) |
| 6 to 11 Years | 0 (0.0%) | 0 (0.0%) |
| 12 to 14 Years | 0 (0.0%) | 0 (0.0%) |
| 15 Years | 0 (0.0%) | 0 (0.0%) |
| 16 and 17 Years | 0 (0.0%) | 0 (0.0%) |
| 18 to 24 Years | 0 (0.0%) | 0 (0.0%) |
| 25 to 34 Years | 0 (0.0%) | 14 (51.8%) |
| 35 to 44 Years | 0 (0.0%) | 0 (0.0%) |
| 45 to 54 Years | 0 (0.0%) | 0 (0.0%) |
| 55 to 64 Years | 0 (0.0%) | 7 (10.8%) |
| 65 to 74 Years | 20 (27.4%) | 12 (26.7%) |
| 75 Years and over | 0 (0.0%) | 0 (0.0%) |
| Total | 41 (12.9%) | 33 (9.7%) |
Income Above Poverty by Sex and Age in Johnson Siding
According to the poverty statistics in Johnson Siding, males aged 6 to 11 years and females aged 12 to 14 years are the age groups that are most secure financially, with 100.0% of males and 100.0% of females in these age groups living above the poverty line.
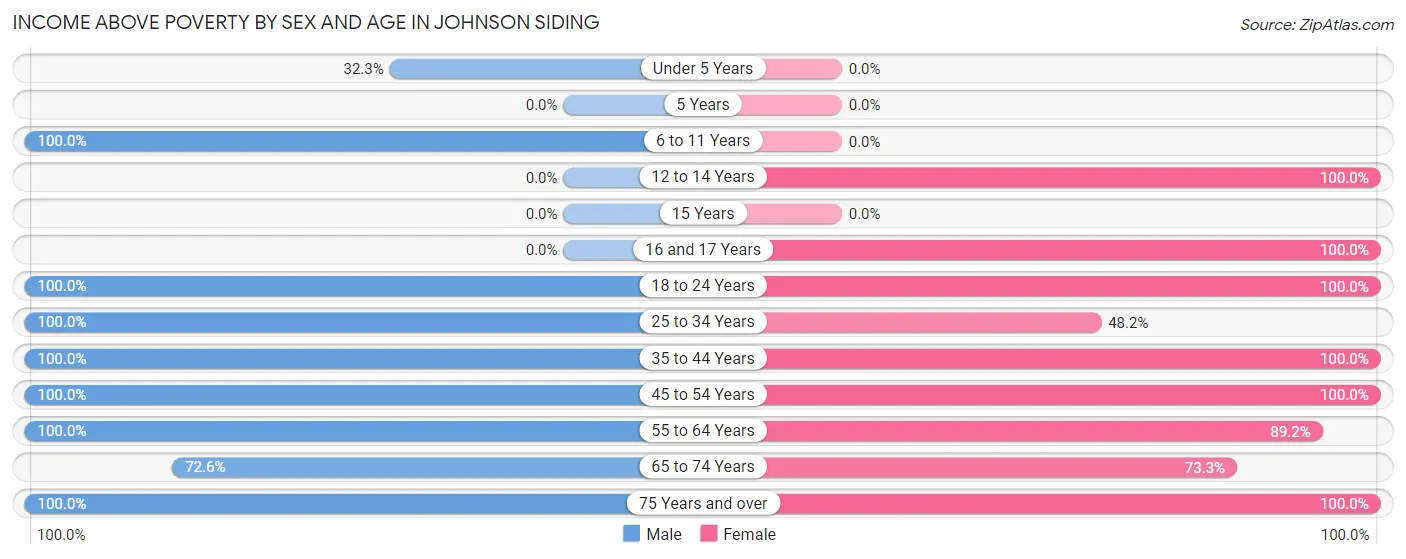
| Age Bracket | Male | Female |
| Under 5 Years | 10 (32.3%) | 0 (0.0%) |
| 5 Years | 0 (0.0%) | 0 (0.0%) |
| 6 to 11 Years | 13 (100.0%) | 0 (0.0%) |
| 12 to 14 Years | 0 (0.0%) | 36 (100.0%) |
| 15 Years | 0 (0.0%) | 0 (0.0%) |
| 16 and 17 Years | 0 (0.0%) | 35 (100.0%) |
| 18 to 24 Years | 30 (100.0%) | 27 (100.0%) |
| 25 to 34 Years | 32 (100.0%) | 13 (48.1%) |
| 35 to 44 Years | 28 (100.0%) | 23 (100.0%) |
| 45 to 54 Years | 36 (100.0%) | 40 (100.0%) |
| 55 to 64 Years | 46 (100.0%) | 58 (89.2%) |
| 65 to 74 Years | 53 (72.6%) | 33 (73.3%) |
| 75 Years and over | 28 (100.0%) | 43 (100.0%) |
| Total | 276 (87.1%) | 308 (90.3%) |
Income Below Poverty Among Married-Couple Families in Johnson Siding
The poverty statistics for married-couple families in Johnson Siding show that 9.2% or 19 of the total 207 families live below the poverty line. Families with 1 or 2 children have the highest poverty rate of 18.2%, comprising of 12 families. On the other hand, families with no children have the lowest poverty rate of 5.0%, which includes 7 families.
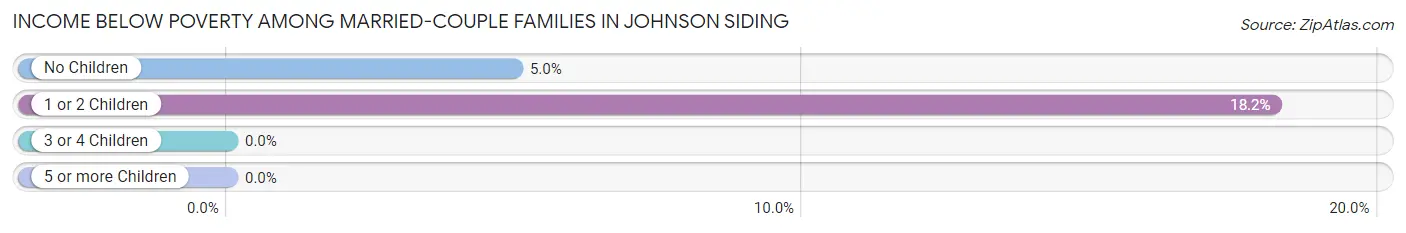
| Children | Above Poverty | Below Poverty |
| No Children | 134 (95.0%) | 7 (5.0%) |
| 1 or 2 Children | 54 (81.8%) | 12 (18.2%) |
| 3 or 4 Children | 0 (0.0%) | 0 (0.0%) |
| 5 or more Children | 0 (0.0%) | 0 (0.0%) |
| Total | 188 (90.8%) | 19 (9.2%) |
Income Below Poverty Among Single-Parent Households in Johnson Siding
| Children | Single Father | Single Mother |
| No Children | 0 (0.0%) | 0 (0.0%) |
| 1 or 2 Children | 0 (0.0%) | 0 (0.0%) |
| 3 or 4 Children | 0 (0.0%) | 0 (0.0%) |
| 5 or more Children | 0 (0.0%) | 0 (0.0%) |
| Total | 0 (0.0%) | 0 (0.0%) |
Income Below Poverty Among Married-Couple vs Single-Parent Households in Johnson Siding
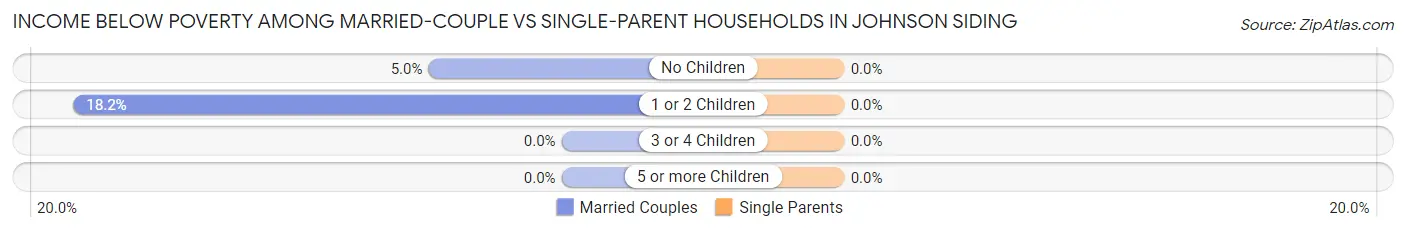
| Children | Married-Couple Families | Single-Parent Households |
| No Children | 7 (5.0%) | 0 (0.0%) |
| 1 or 2 Children | 12 (18.2%) | 0 (0.0%) |
| 3 or 4 Children | 0 (0.0%) | 0 (0.0%) |
| 5 or more Children | 0 (0.0%) | 0 (0.0%) |
| Total | 19 (9.2%) | 0 (0.0%) |
Race in Johnson Siding
The most populous races in Johnson Siding are White / Caucasian (584 | 88.7%), Some other Race (53 | 8.1%), and Two or more Races (21 | 3.2%).
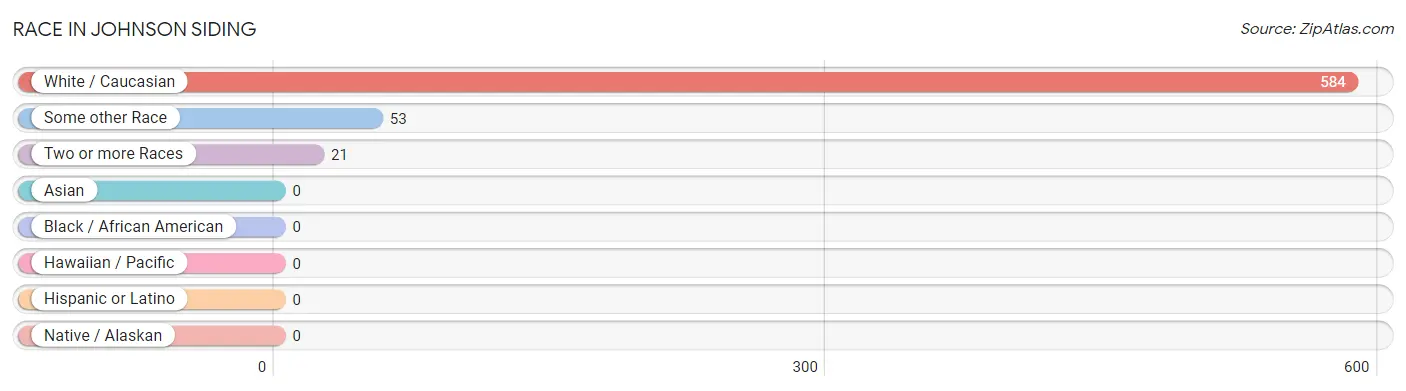
| Race | # Population | % Population |
| Asian | 0 | 0.0% |
| Black / African American | 0 | 0.0% |
| Hawaiian / Pacific | 0 | 0.0% |
| Hispanic or Latino | 0 | 0.0% |
| Native / Alaskan | 0 | 0.0% |
| White / Caucasian | 584 | 88.7% |
| Two or more Races | 21 | 3.2% |
| Some other Race | 53 | 8.1% |
| Total | 658 | 100.0% |
Ancestry in Johnson Siding
The most populous ancestries reported in Johnson Siding are German (325 | 49.4%), Irish (112 | 17.0%), Italian (86 | 13.1%), Norwegian (75 | 11.4%), and English (48 | 7.3%), together accounting for 98.2% of all Johnson Siding residents.
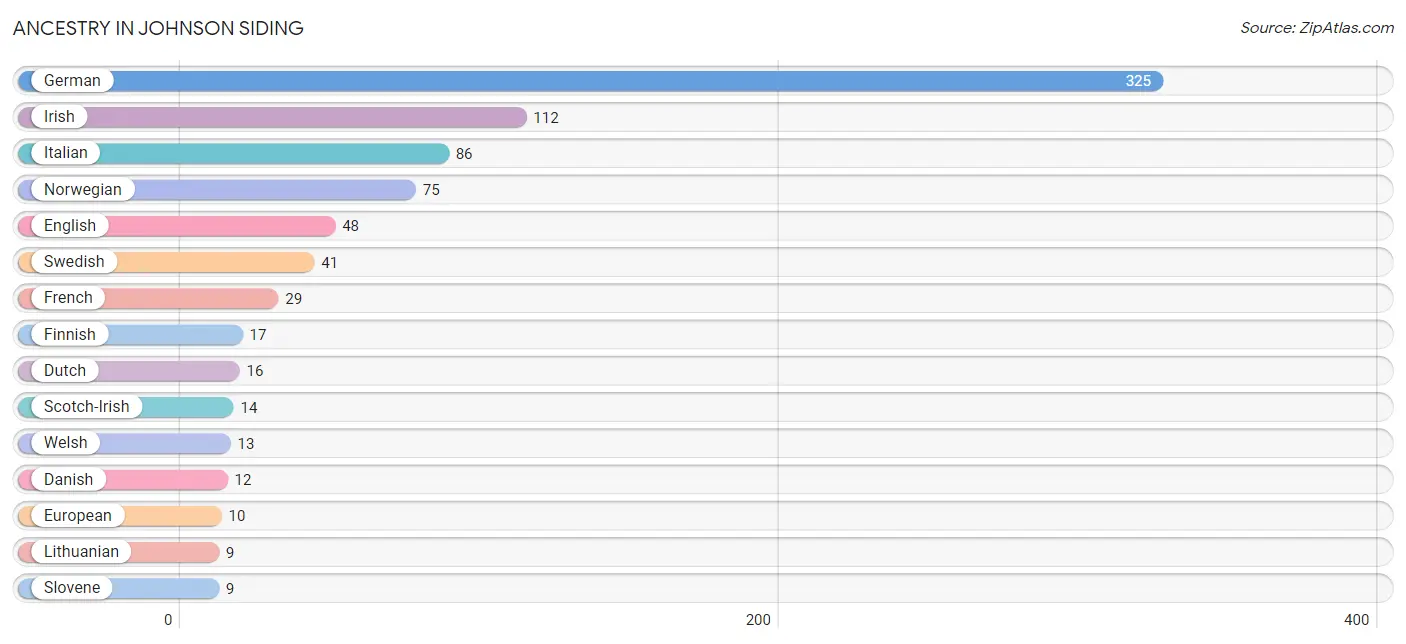
| Ancestry | # Population | % Population |
| Danish | 12 | 1.8% |
| Dutch | 16 | 2.4% |
| Eastern European | 8 | 1.2% |
| English | 48 | 7.3% |
| European | 10 | 1.5% |
| Finnish | 17 | 2.6% |
| French | 29 | 4.4% |
| German | 325 | 49.4% |
| Irish | 112 | 17.0% |
| Italian | 86 | 13.1% |
| Lithuanian | 9 | 1.4% |
| Norwegian | 75 | 11.4% |
| Scotch-Irish | 14 | 2.1% |
| Slovene | 9 | 1.4% |
| Swedish | 41 | 6.2% |
| Welsh | 13 | 2.0% | View All 16 Rows |
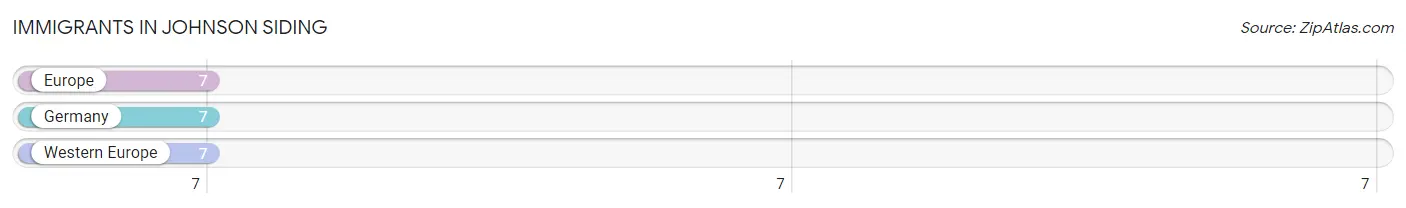
Immigrants in Johnson Siding
The most numerous immigrant groups reported in Johnson Siding came from Europe (7 | 1.1%), Germany (7 | 1.1%), and Western Europe (7 | 1.1%), together accounting for 3.2% of all Johnson Siding residents.
| Immigration Origin | # Population | % Population |
| Europe | 7 | 1.1% |
| Germany | 7 | 1.1% |
| Western Europe | 7 | 1.1% | View All 3 Rows |
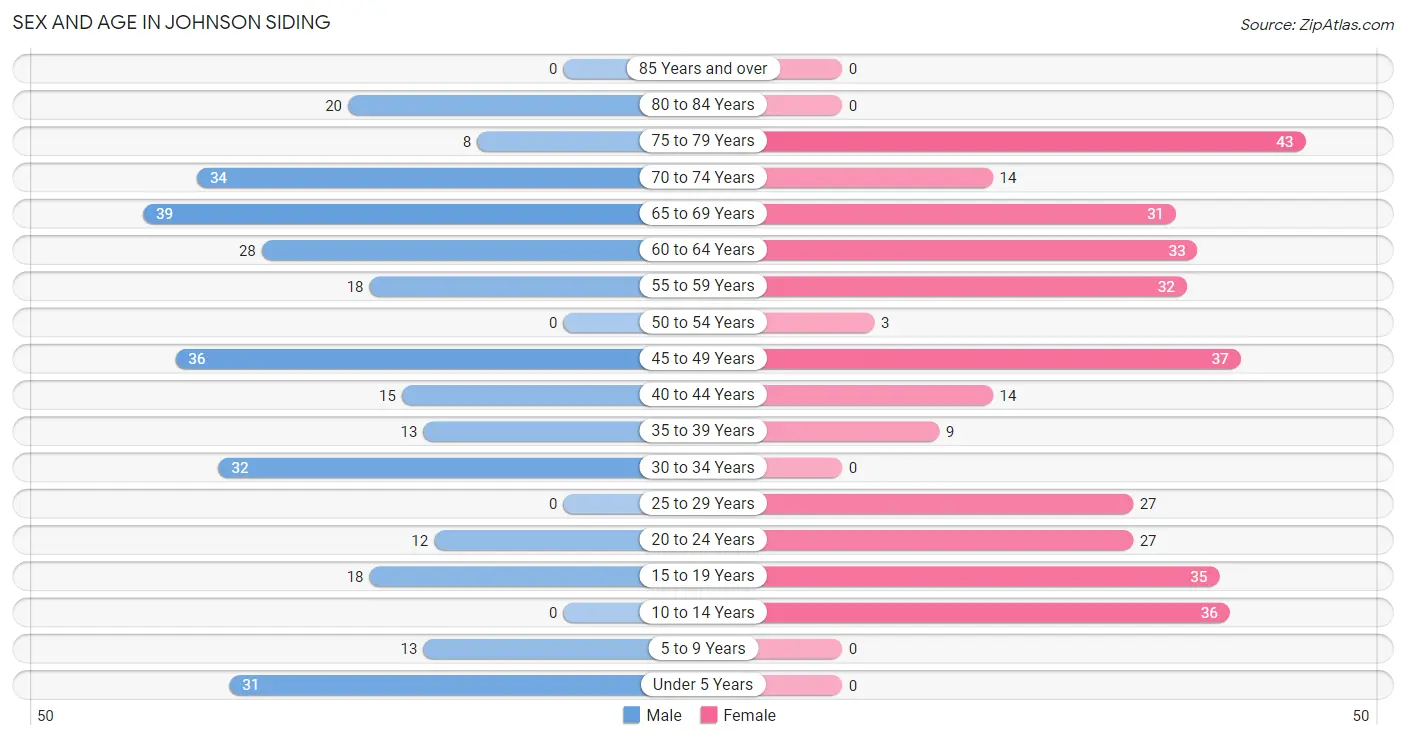
Sex and Age in Johnson Siding
Sex and Age in Johnson Siding
The most populous age groups in Johnson Siding are 65 to 69 Years (39 | 12.3%) for men and 75 to 79 Years (43 | 12.6%) for women.
| Age Bracket | Male | Female |
| Under 5 Years | 31 (9.8%) | 0 (0.0%) |
| 5 to 9 Years | 13 (4.1%) | 0 (0.0%) |
| 10 to 14 Years | 0 (0.0%) | 36 (10.6%) |
| 15 to 19 Years | 18 (5.7%) | 35 (10.3%) |
| 20 to 24 Years | 12 (3.8%) | 27 (7.9%) |
| 25 to 29 Years | 0 (0.0%) | 27 (7.9%) |
| 30 to 34 Years | 32 (10.1%) | 0 (0.0%) |
| 35 to 39 Years | 13 (4.1%) | 9 (2.6%) |
| 40 to 44 Years | 15 (4.7%) | 14 (4.1%) |
| 45 to 49 Years | 36 (11.4%) | 37 (10.8%) |
| 50 to 54 Years | 0 (0.0%) | 3 (0.9%) |
| 55 to 59 Years | 18 (5.7%) | 32 (9.4%) |
| 60 to 64 Years | 28 (8.8%) | 33 (9.7%) |
| 65 to 69 Years | 39 (12.3%) | 31 (9.1%) |
| 70 to 74 Years | 34 (10.7%) | 14 (4.1%) |
| 75 to 79 Years | 8 (2.5%) | 43 (12.6%) |
| 80 to 84 Years | 20 (6.3%) | 0 (0.0%) |
| 85 Years and over | 0 (0.0%) | 0 (0.0%) |
| Total | 317 (100.0%) | 341 (100.0%) |
Families and Households in Johnson Siding
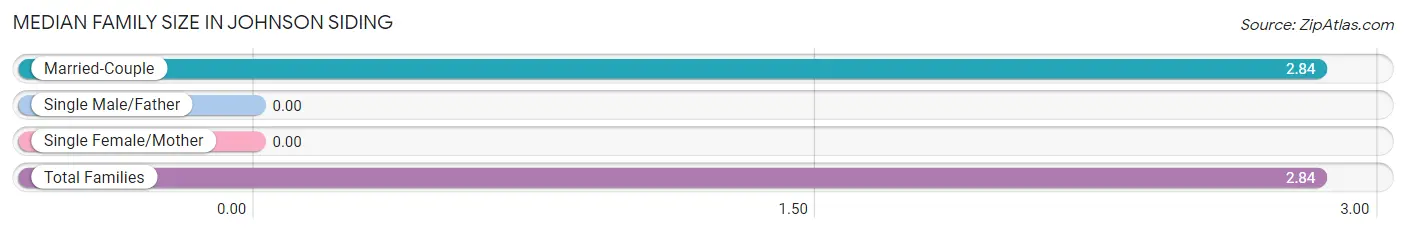
Median Family Size in Johnson Siding
| Family Type | # Families | Family Size |
| Married-Couple | 207 (100.0%) | 2.84 |
| Single Male/Father | 0 (0.0%) | - |
| Single Female/Mother | 0 (0.0%) | - |
| Total Families | 207 (100.0%) | 2.84 |
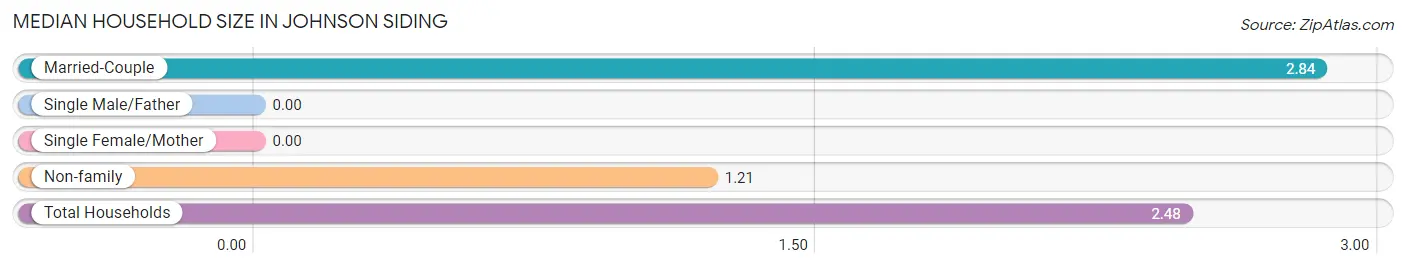
Median Household Size in Johnson Siding
| Household Type | # Households | Household Size |
| Married-Couple | 207 (78.1%) | 2.84 |
| Single Male/Father | 0 (0.0%) | - |
| Single Female/Mother | 0 (0.0%) | - |
| Non-family | 58 (21.9%) | 1.21 |
| Total Households | 265 (100.0%) | 2.48 |
Household Size by Marriage Status in Johnson Siding
Out of a total of 265 households in Johnson Siding, 207 (78.1%) are family households, while 58 (21.9%) are nonfamily households. The most numerous type of family households are 2-person households, comprising 117, and the most common type of nonfamily households are 1-person households, comprising 47.
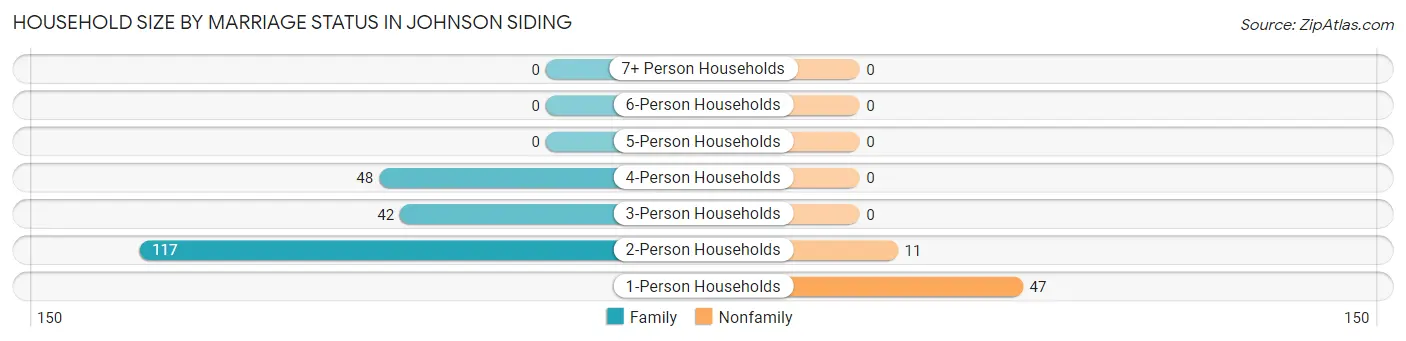
| Household Size | Family Households | Nonfamily Households |
| 1-Person Households | - | 47 (17.7%) |
| 2-Person Households | 117 (44.2%) | 11 (4.2%) |
| 3-Person Households | 42 (15.9%) | 0 (0.0%) |
| 4-Person Households | 48 (18.1%) | 0 (0.0%) |
| 5-Person Households | 0 (0.0%) | 0 (0.0%) |
| 6-Person Households | 0 (0.0%) | 0 (0.0%) |
| 7+ Person Households | 0 (0.0%) | 0 (0.0%) |
| Total | 207 (78.1%) | 58 (21.9%) |
Female Fertility in Johnson Siding
Fertility by Age in Johnson Siding
| Age Bracket | Women with Births | Births / 1,000 Women |
| 15 to 19 years | 0 (0.0%) | 0.0 |
| 20 to 34 years | 0 (0.0%) | 0.0 |
| 35 to 50 years | 0 (0.0%) | 0.0 |
| Total | 0 (0.0%) | 0.0 |
Fertility by Age by Marriage Status in Johnson Siding
| Age Bracket | Married | Unmarried |
| 15 to 19 years | 0 (0.0%) | 0 (0.0%) |
| 20 to 34 years | 0 (0.0%) | 0 (0.0%) |
| 35 to 50 years | 0 (0.0%) | 0 (0.0%) |
| Total | 0 (0.0%) | 0 (0.0%) |
Fertility by Education in Johnson Siding
| Educational Attainment | Women with Births | Births / 1,000 Women |
| Less than High School | 0 (0.0%) | 0.0 |
| High School Diploma | 0 (0.0%) | 0.0 |
| College or Associate's Degree | 0 (0.0%) | 0.0 |
| Bachelor's Degree | 0 (0.0%) | 0.0 |
| Graduate Degree | 0 (0.0%) | 0.0 |
| Total | 0 (0.0%) | 0.0 |
Fertility by Education by Marriage Status in Johnson Siding
| Educational Attainment | Married | Unmarried |
| Less than High School | 0 (0.0%) | 0 (0.0%) |
| High School Diploma | 0 (0.0%) | 0 (0.0%) |
| College or Associate's Degree | 0 (0.0%) | 0 (0.0%) |
| Bachelor's Degree | 0 (0.0%) | 0 (0.0%) |
| Graduate Degree | 0 (0.0%) | 0 (0.0%) |
| Total | 0 (0.0%) | 0 (0.0%) |
Employment Characteristics in Johnson Siding
Employment by Class of Employer in Johnson Siding
Among the 350 employed individuals in Johnson Siding, private company employees (209 | 59.7%), not-for-profit organizations (70 | 20.0%), and federal government employees (42 | 12.0%) make up the most common classes of employment.
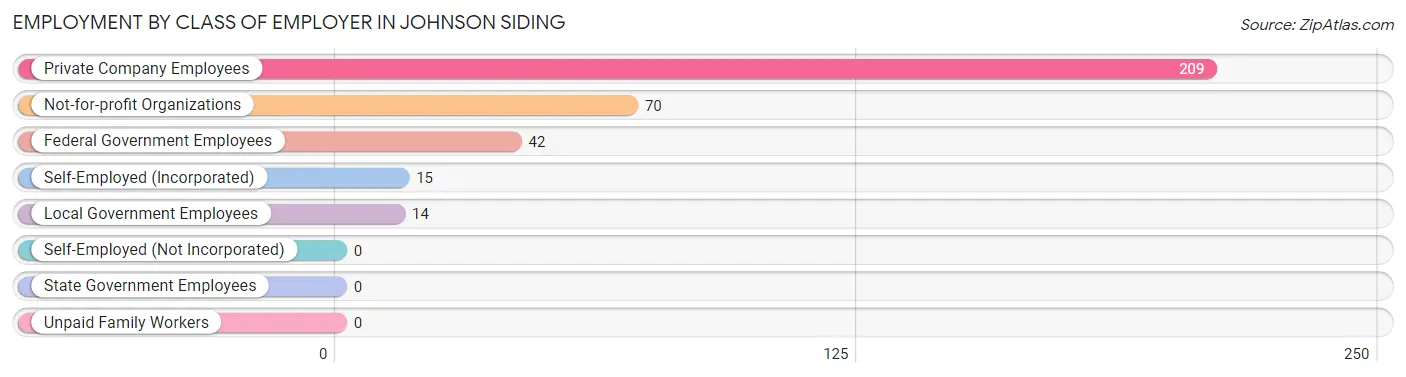
| Employer Class | # Employees | % Employees |
| Private Company Employees | 209 | 59.7% |
| Self-Employed (Incorporated) | 15 | 4.3% |
| Self-Employed (Not Incorporated) | 0 | 0.0% |
| Not-for-profit Organizations | 70 | 20.0% |
| Local Government Employees | 14 | 4.0% |
| State Government Employees | 0 | 0.0% |
| Federal Government Employees | 42 | 12.0% |
| Unpaid Family Workers | 0 | 0.0% |
| Total | 350 | 100.0% |
Employment Status by Age in Johnson Siding
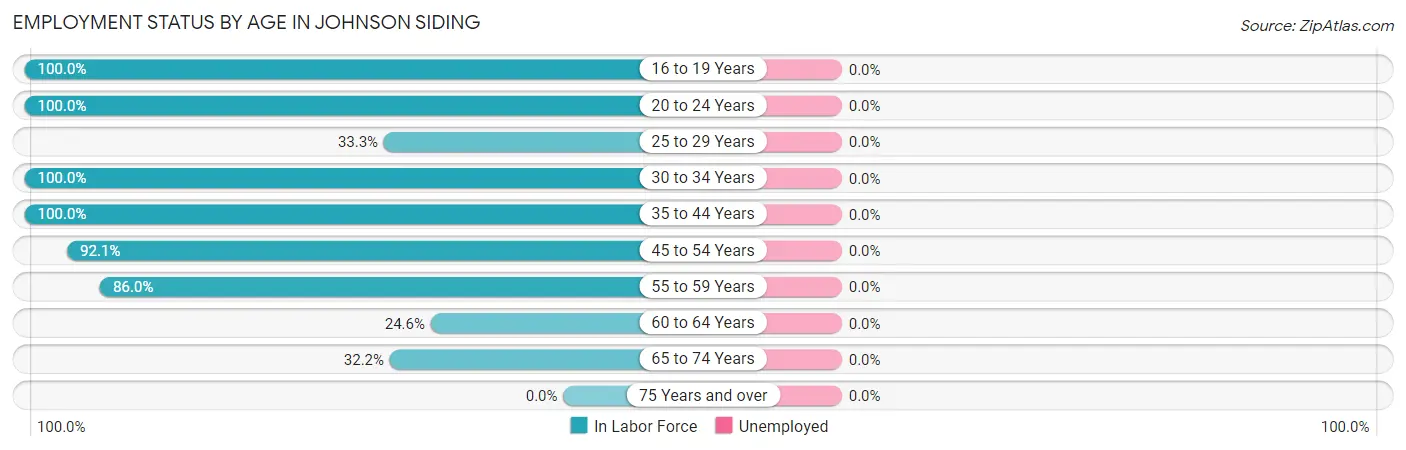
| Age Bracket | In Labor Force | Unemployed |
| 16 to 19 Years | 53 (100.0%) | 0 (0.0%) |
| 20 to 24 Years | 39 (100.0%) | 0 (0.0%) |
| 25 to 29 Years | 9 (33.3%) | 0 (0.0%) |
| 30 to 34 Years | 32 (100.0%) | 0 (0.0%) |
| 35 to 44 Years | 51 (100.0%) | 0 (0.0%) |
| 45 to 54 Years | 70 (92.1%) | 0 (0.0%) |
| 55 to 59 Years | 43 (86.0%) | 0 (0.0%) |
| 60 to 64 Years | 15 (24.6%) | 0 (0.0%) |
| 65 to 74 Years | 38 (32.2%) | 0 (0.0%) |
| 75 Years and over | 0 (0.0%) | 0 (0.0%) |
| Total | 350 (60.6%) | 0 (0.0%) |
Employment Status by Educational Attainment in Johnson Siding
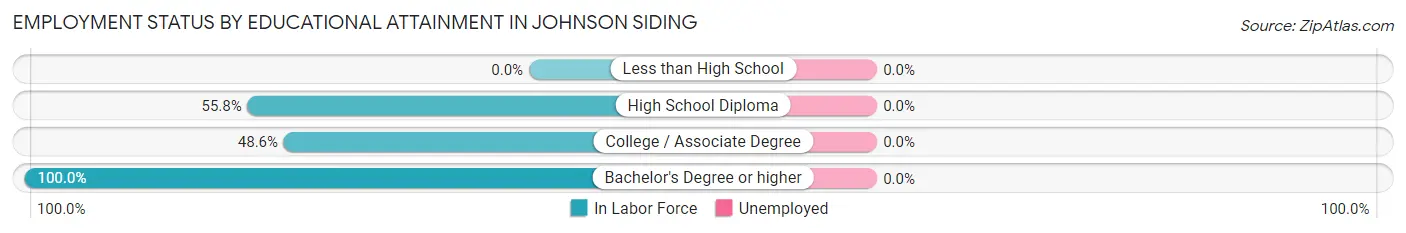
| Educational Attainment | In Labor Force | Unemployed |
| Less than High School | 0 (0.0%) | 0 (0.0%) |
| High School Diploma | 29 (55.8%) | 0 (0.0%) |
| College / Associate Degree | 51 (48.6%) | 0 (0.0%) |
| Bachelor's Degree or higher | 140 (100.0%) | 0 (0.0%) |
| Total | 220 (74.1%) | 0 (0.0%) |
Employment Occupations by Sex in Johnson Siding
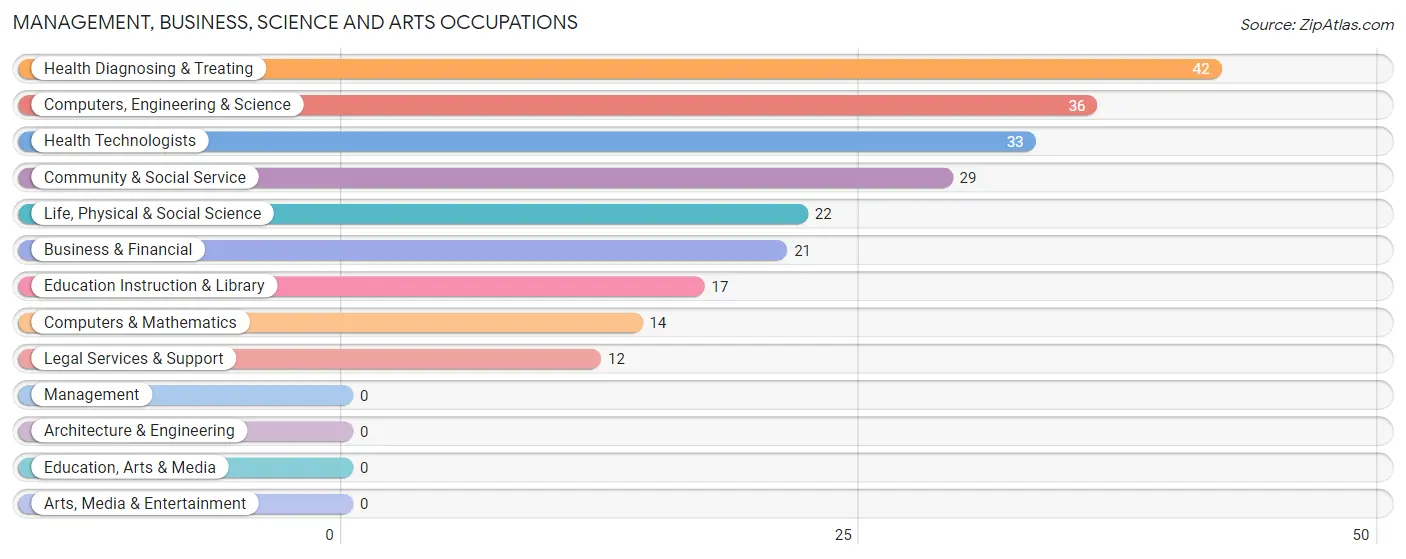
Management, Business, Science and Arts Occupations
The most common Management, Business, Science and Arts occupations in Johnson Siding are Health Diagnosing & Treating (42 | 13.1%), Computers, Engineering & Science (36 | 11.3%), Health Technologists (33 | 10.3%), Community & Social Service (29 | 9.1%), and Life, Physical & Social Science (22 | 6.9%).
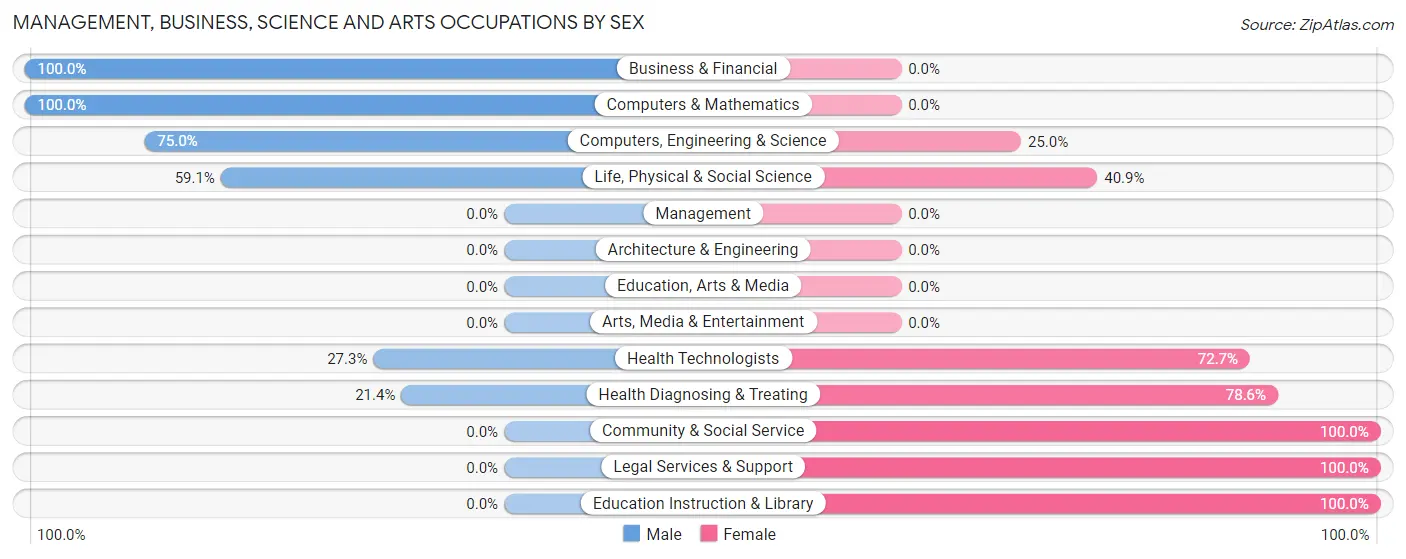
Management, Business, Science and Arts Occupations by Sex
Within the Management, Business, Science and Arts occupations in Johnson Siding, the most male-oriented occupations are Business & Financial (100.0%), Computers & Mathematics (100.0%), and Computers, Engineering & Science (75.0%), while the most female-oriented occupations are Community & Social Service (100.0%), Legal Services & Support (100.0%), and Education Instruction & Library (100.0%).
| Occupation | Male | Female |
| Management | 0 (0.0%) | 0 (0.0%) |
| Business & Financial | 21 (100.0%) | 0 (0.0%) |
| Computers, Engineering & Science | 27 (75.0%) | 9 (25.0%) |
| Computers & Mathematics | 14 (100.0%) | 0 (0.0%) |
| Architecture & Engineering | 0 (0.0%) | 0 (0.0%) |
| Life, Physical & Social Science | 13 (59.1%) | 9 (40.9%) |
| Community & Social Service | 0 (0.0%) | 29 (100.0%) |
| Education, Arts & Media | 0 (0.0%) | 0 (0.0%) |
| Legal Services & Support | 0 (0.0%) | 12 (100.0%) |
| Education Instruction & Library | 0 (0.0%) | 17 (100.0%) |
| Arts, Media & Entertainment | 0 (0.0%) | 0 (0.0%) |
| Health Diagnosing & Treating | 9 (21.4%) | 33 (78.6%) |
| Health Technologists | 9 (27.3%) | 24 (72.7%) |
| Total (Category) | 57 (44.5%) | 71 (55.5%) |
| Total (Overall) | 148 (46.3%) | 172 (53.7%) |
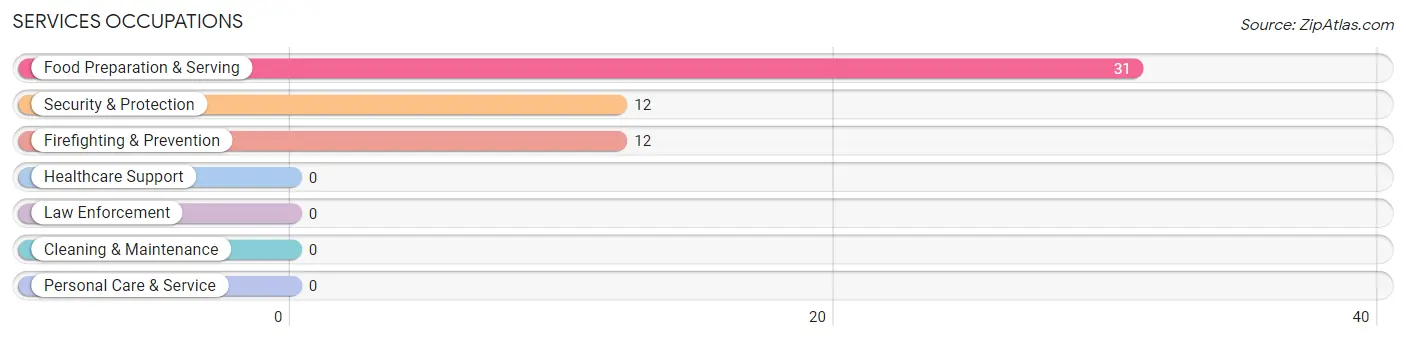
Services Occupations
The most common Services occupations in Johnson Siding are Food Preparation & Serving (31 | 9.7%), Security & Protection (12 | 3.7%), and Firefighting & Prevention (12 | 3.7%).
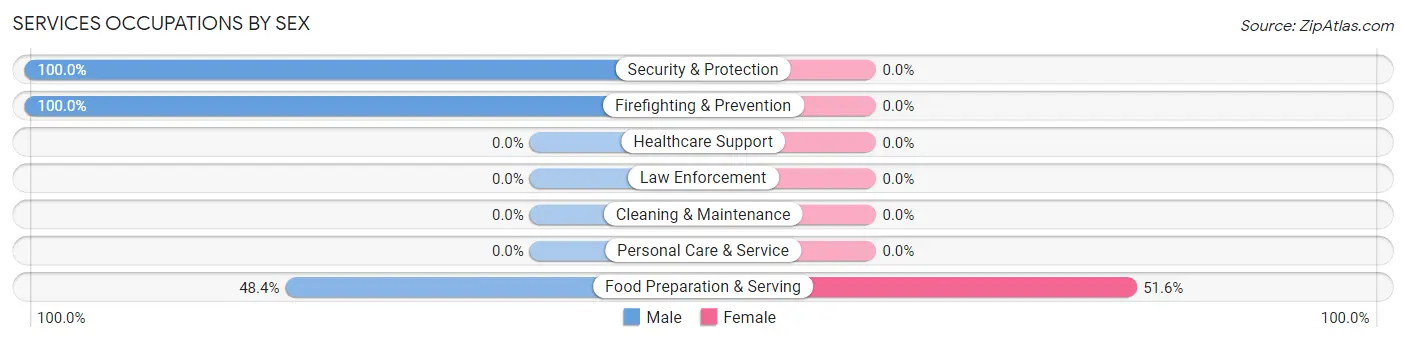
Services Occupations by Sex
| Occupation | Male | Female |
| Healthcare Support | 0 (0.0%) | 0 (0.0%) |
| Security & Protection | 12 (100.0%) | 0 (0.0%) |
| Firefighting & Prevention | 12 (100.0%) | 0 (0.0%) |
| Law Enforcement | 0 (0.0%) | 0 (0.0%) |
| Food Preparation & Serving | 15 (48.4%) | 16 (51.6%) |
| Cleaning & Maintenance | 0 (0.0%) | 0 (0.0%) |
| Personal Care & Service | 0 (0.0%) | 0 (0.0%) |
| Total (Category) | 27 (62.8%) | 16 (37.2%) |
| Total (Overall) | 148 (46.3%) | 172 (53.7%) |
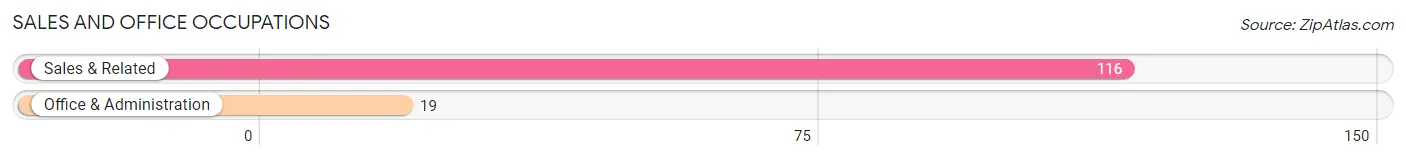
Sales and Office Occupations
The most common Sales and Office occupations in Johnson Siding are Sales & Related (116 | 36.2%), and Office & Administration (19 | 5.9%).
Sales and Office Occupations by Sex
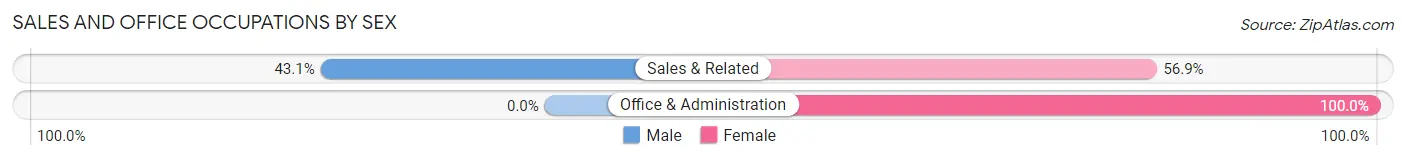
| Occupation | Male | Female |
| Sales & Related | 50 (43.1%) | 66 (56.9%) |
| Office & Administration | 0 (0.0%) | 19 (100.0%) |
| Total (Category) | 50 (37.0%) | 85 (63.0%) |
| Total (Overall) | 148 (46.3%) | 172 (53.7%) |
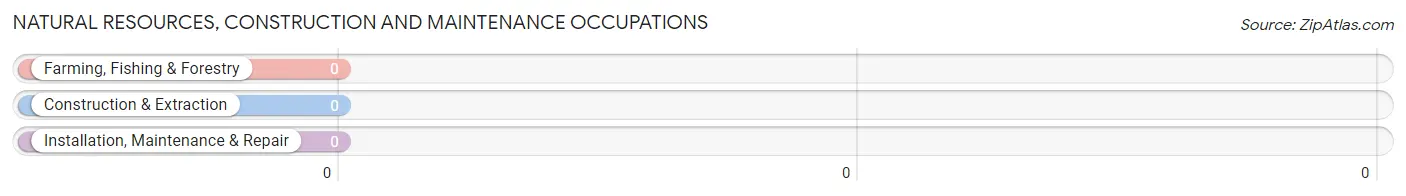
Natural Resources, Construction and Maintenance Occupations
Natural Resources, Construction and Maintenance Occupations by Sex
| Occupation | Male | Female |
| Farming, Fishing & Forestry | 0 (0.0%) | 0 (0.0%) |
| Construction & Extraction | 0 (0.0%) | 0 (0.0%) |
| Installation, Maintenance & Repair | 0 (0.0%) | 0 (0.0%) |
| Total (Category) | 0 (0.0%) | 0 (0.0%) |
| Total (Overall) | 148 (46.3%) | 172 (53.7%) |
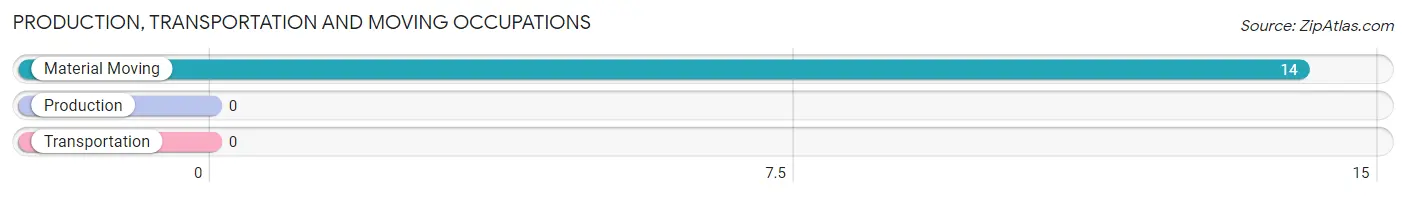
Production, Transportation and Moving Occupations
The most common Production, Transportation and Moving occupations in Johnson Siding are , and Material Moving (14 | 4.4%).
Production, Transportation and Moving Occupations by Sex
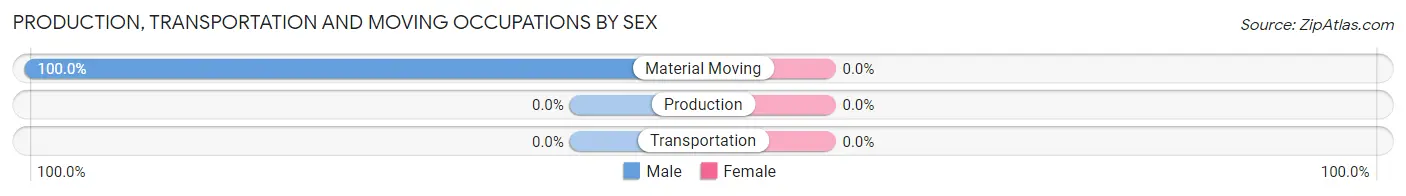
| Occupation | Male | Female |
| Production | 0 (0.0%) | 0 (0.0%) |
| Transportation | 0 (0.0%) | 0 (0.0%) |
| Material Moving | 14 (100.0%) | 0 (0.0%) |
| Total (Category) | 14 (100.0%) | 0 (0.0%) |
| Total (Overall) | 148 (46.3%) | 172 (53.7%) |
Employment Industries by Sex in Johnson Siding
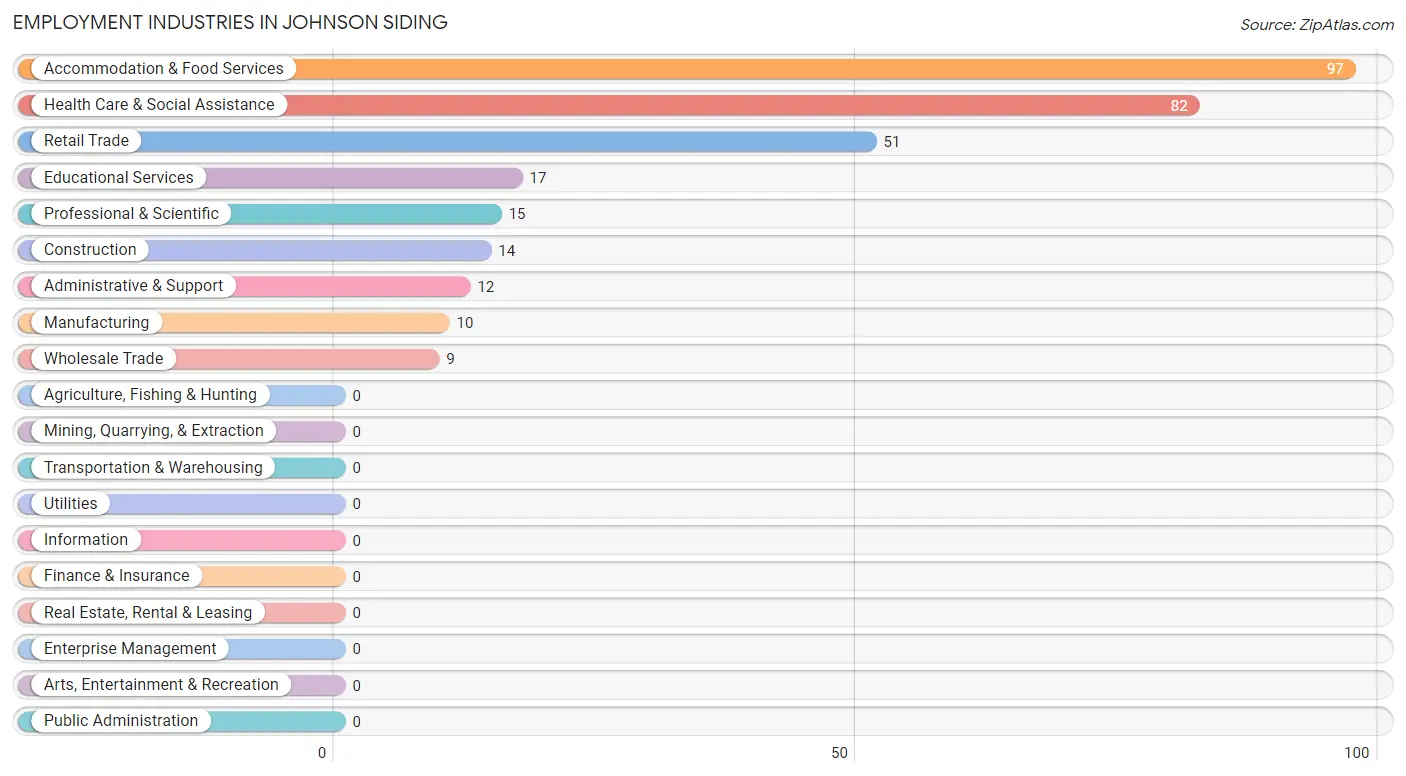
Employment Industries in Johnson Siding
The major employment industries in Johnson Siding include Accommodation & Food Services (97 | 30.3%), Health Care & Social Assistance (82 | 25.6%), Retail Trade (51 | 15.9%), Educational Services (17 | 5.3%), and Professional & Scientific (15 | 4.7%).
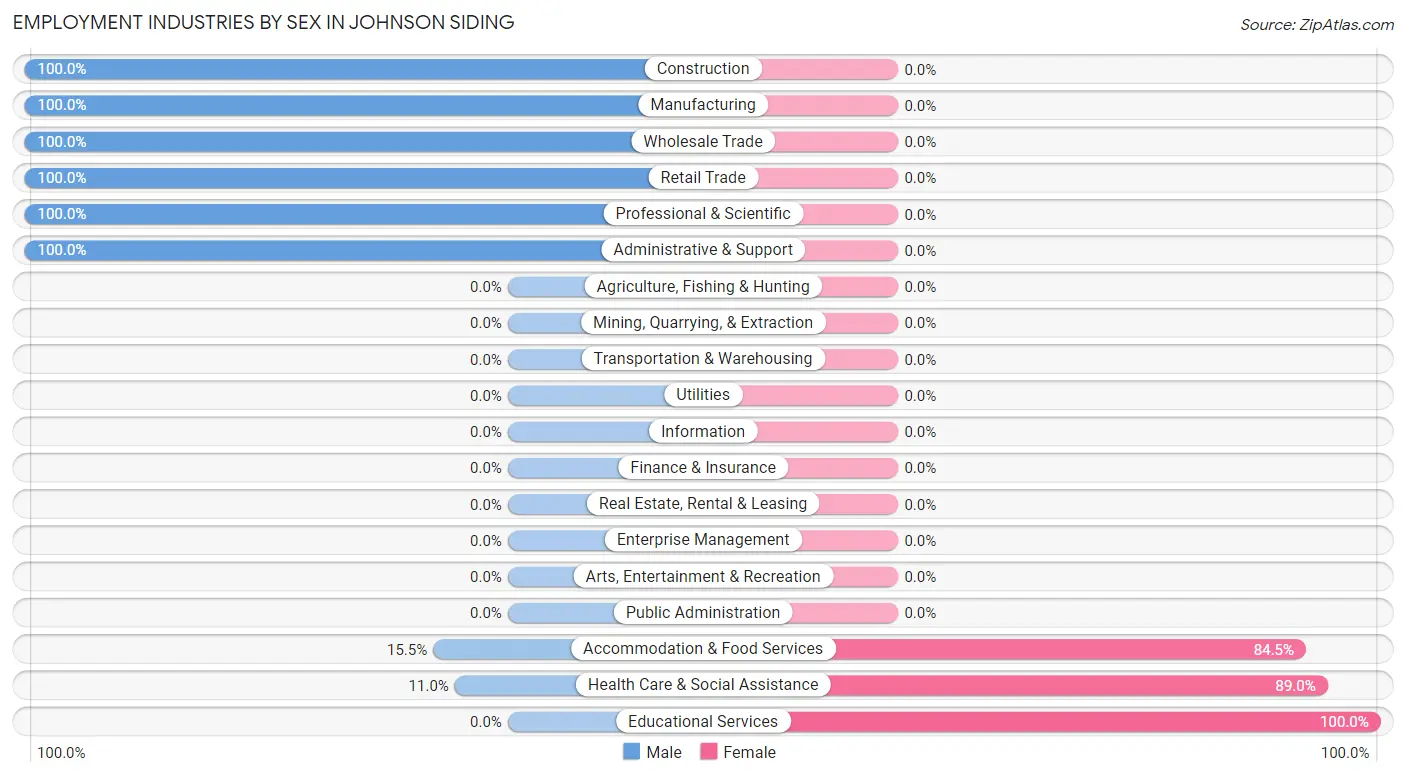
Employment Industries by Sex in Johnson Siding
The Johnson Siding industries that see more men than women are Construction (100.0%), Manufacturing (100.0%), and Wholesale Trade (100.0%), whereas the industries that tend to have a higher number of women are Educational Services (100.0%), Health Care & Social Assistance (89.0%), and Accommodation & Food Services (84.5%).
| Industry | Male | Female |
| Agriculture, Fishing & Hunting | 0 (0.0%) | 0 (0.0%) |
| Mining, Quarrying, & Extraction | 0 (0.0%) | 0 (0.0%) |
| Construction | 14 (100.0%) | 0 (0.0%) |
| Manufacturing | 10 (100.0%) | 0 (0.0%) |
| Wholesale Trade | 9 (100.0%) | 0 (0.0%) |
| Retail Trade | 51 (100.0%) | 0 (0.0%) |
| Transportation & Warehousing | 0 (0.0%) | 0 (0.0%) |
| Utilities | 0 (0.0%) | 0 (0.0%) |
| Information | 0 (0.0%) | 0 (0.0%) |
| Finance & Insurance | 0 (0.0%) | 0 (0.0%) |
| Real Estate, Rental & Leasing | 0 (0.0%) | 0 (0.0%) |
| Professional & Scientific | 15 (100.0%) | 0 (0.0%) |
| Enterprise Management | 0 (0.0%) | 0 (0.0%) |
| Administrative & Support | 12 (100.0%) | 0 (0.0%) |
| Educational Services | 0 (0.0%) | 17 (100.0%) |
| Health Care & Social Assistance | 9 (11.0%) | 73 (89.0%) |
| Arts, Entertainment & Recreation | 0 (0.0%) | 0 (0.0%) |
| Accommodation & Food Services | 15 (15.5%) | 82 (84.5%) |
| Public Administration | 0 (0.0%) | 0 (0.0%) |
| Total | 148 (46.3%) | 172 (53.7%) |
Education in Johnson Siding
School Enrollment in Johnson Siding
The most common levels of schooling among the 120 students in Johnson Siding are college / undergraduate (49 | 40.8%), middle school (36 | 30.0%), and high school (35 | 29.2%).
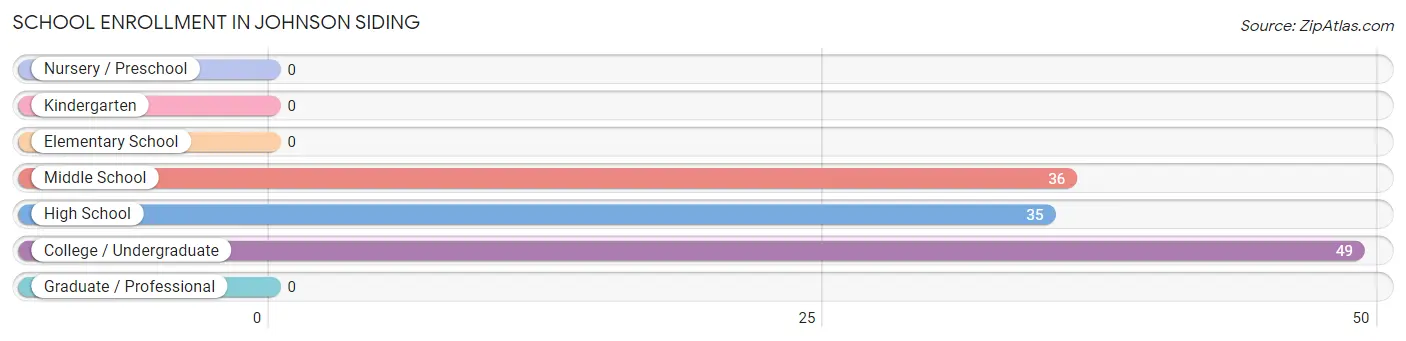
| School Level | # Students | % Students |
| Nursery / Preschool | 0 | 0.0% |
| Kindergarten | 0 | 0.0% |
| Elementary School | 0 | 0.0% |
| Middle School | 36 | 30.0% |
| High School | 35 | 29.2% |
| College / Undergraduate | 49 | 40.8% |
| Graduate / Professional | 0 | 0.0% |
| Total | 120 | 100.0% |
School Enrollment by Age by Funding Source in Johnson Siding
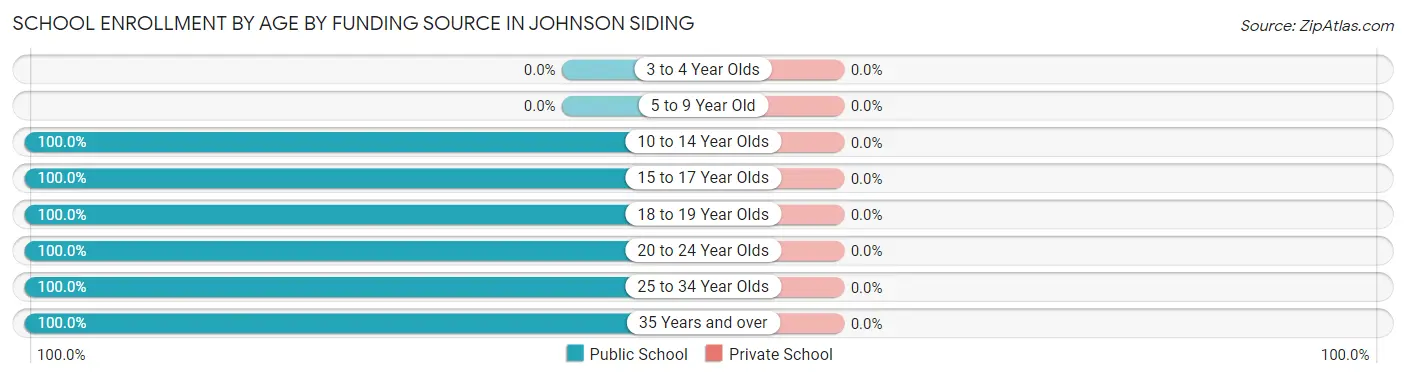
| Age Bracket | Public School | Private School |
| 3 to 4 Year Olds | 0 (0.0%) | 0 (0.0%) |
| 5 to 9 Year Old | 0 (0.0%) | 0 (0.0%) |
| 10 to 14 Year Olds | 36 (100.0%) | 0 (0.0%) |
| 15 to 17 Year Olds | 35 (100.0%) | 0 (0.0%) |
| 18 to 19 Year Olds | 18 (100.0%) | 0 (0.0%) |
| 20 to 24 Year Olds | 16 (100.0%) | 0 (0.0%) |
| 25 to 34 Year Olds | 9 (100.0%) | 0 (0.0%) |
| 35 Years and over | 6 (100.0%) | 0 (0.0%) |
| Total | 120 (100.0%) | 0 (0.0%) |
Educational Attainment by Field of Study in Johnson Siding
Social sciences (44 | 29.9%), computers & mathematics (39 | 26.5%), education (24 | 16.3%), science & technology (18 | 12.2%), and business (16 | 10.9%) are the most common fields of study among 147 individuals in Johnson Siding who have obtained a bachelor's degree or higher.
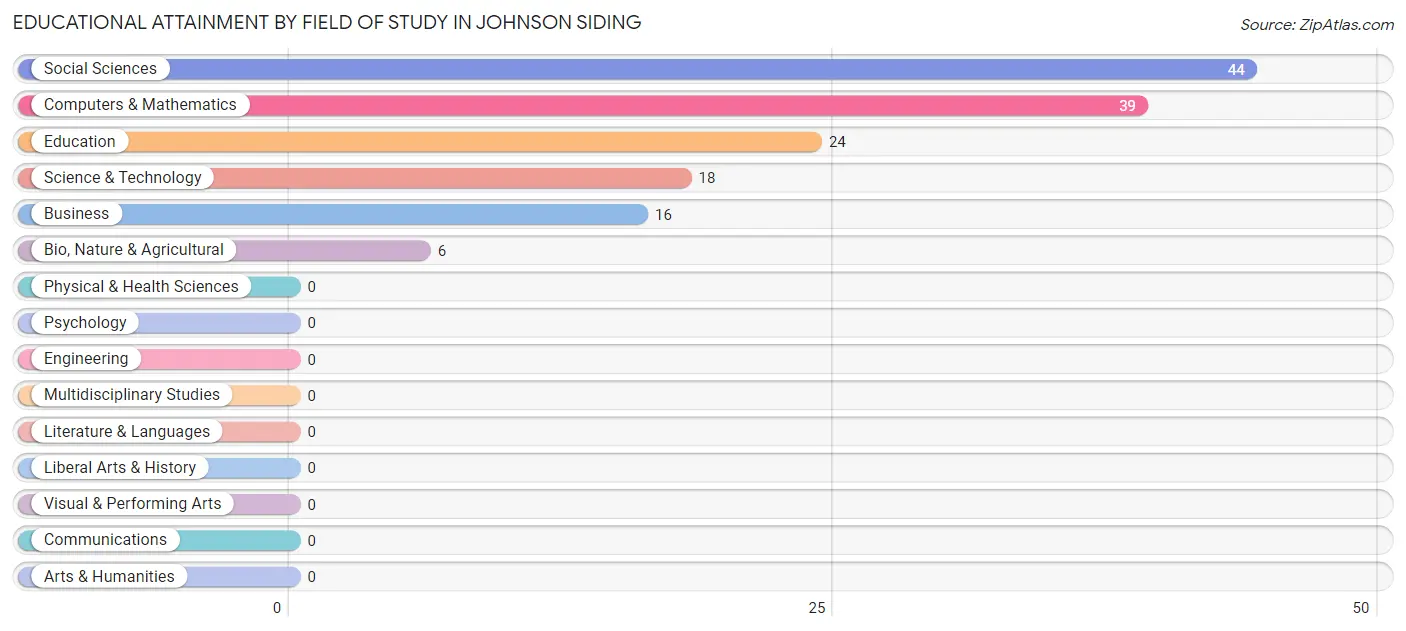
| Field of Study | # Graduates | % Graduates |
| Computers & Mathematics | 39 | 26.5% |
| Bio, Nature & Agricultural | 6 | 4.1% |
| Physical & Health Sciences | 0 | 0.0% |
| Psychology | 0 | 0.0% |
| Social Sciences | 44 | 29.9% |
| Engineering | 0 | 0.0% |
| Multidisciplinary Studies | 0 | 0.0% |
| Science & Technology | 18 | 12.2% |
| Business | 16 | 10.9% |
| Education | 24 | 16.3% |
| Literature & Languages | 0 | 0.0% |
| Liberal Arts & History | 0 | 0.0% |
| Visual & Performing Arts | 0 | 0.0% |
| Communications | 0 | 0.0% |
| Arts & Humanities | 0 | 0.0% |
| Total | 147 | 100.0% |
Transportation & Commute in Johnson Siding
Vehicle Availability by Sex in Johnson Siding
The most prevalent vehicle ownership categories in Johnson Siding are males with 5 or more vehicles (83, accounting for 46.6%) and females with 5 or more vehicles (82, making up 48.3%).
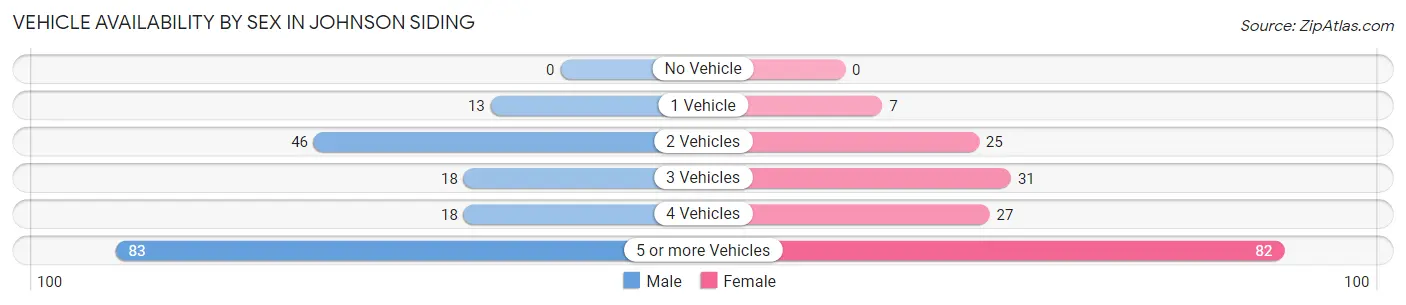
| Vehicles Available | Male | Female |
| No Vehicle | 0 (0.0%) | 0 (0.0%) |
| 1 Vehicle | 13 (7.3%) | 7 (4.1%) |
| 2 Vehicles | 46 (25.8%) | 25 (14.5%) |
| 3 Vehicles | 18 (10.1%) | 31 (18.0%) |
| 4 Vehicles | 18 (10.1%) | 27 (15.7%) |
| 5 or more Vehicles | 83 (46.6%) | 82 (47.7%) |
| Total | 178 (100.0%) | 172 (100.0%) |
Commute Time in Johnson Siding
The most frequently occuring commute durations in Johnson Siding are 30 to 34 minutes (147 commuters, 45.2%), 35 to 39 minutes (59 commuters, 18.1%), and 25 to 29 minutes (45 commuters, 13.9%).
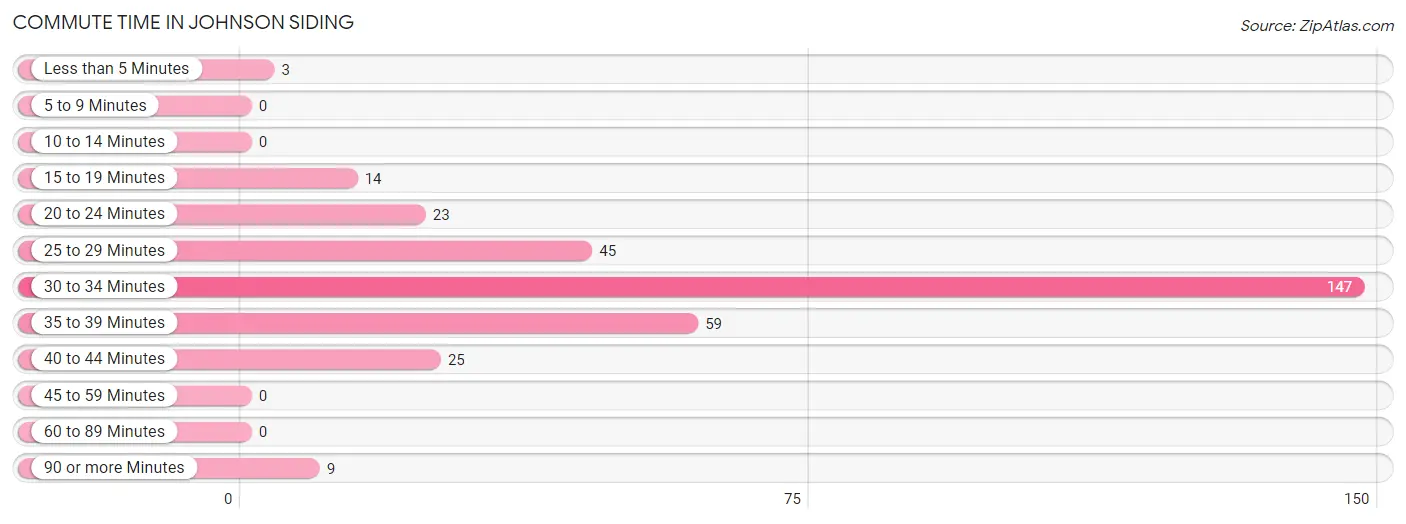
| Commute Time | # Commuters | % Commuters |
| Less than 5 Minutes | 3 | 0.9% |
| 5 to 9 Minutes | 0 | 0.0% |
| 10 to 14 Minutes | 0 | 0.0% |
| 15 to 19 Minutes | 14 | 4.3% |
| 20 to 24 Minutes | 23 | 7.1% |
| 25 to 29 Minutes | 45 | 13.9% |
| 30 to 34 Minutes | 147 | 45.2% |
| 35 to 39 Minutes | 59 | 18.1% |
| 40 to 44 Minutes | 25 | 7.7% |
| 45 to 59 Minutes | 0 | 0.0% |
| 60 to 89 Minutes | 0 | 0.0% |
| 90 or more Minutes | 9 | 2.8% |
Commute Time by Sex in Johnson Siding
The most common commute times in Johnson Siding are 35 to 39 minutes (59 commuters, 34.3%) for males and 30 to 34 minutes (109 commuters, 71.2%) for females.
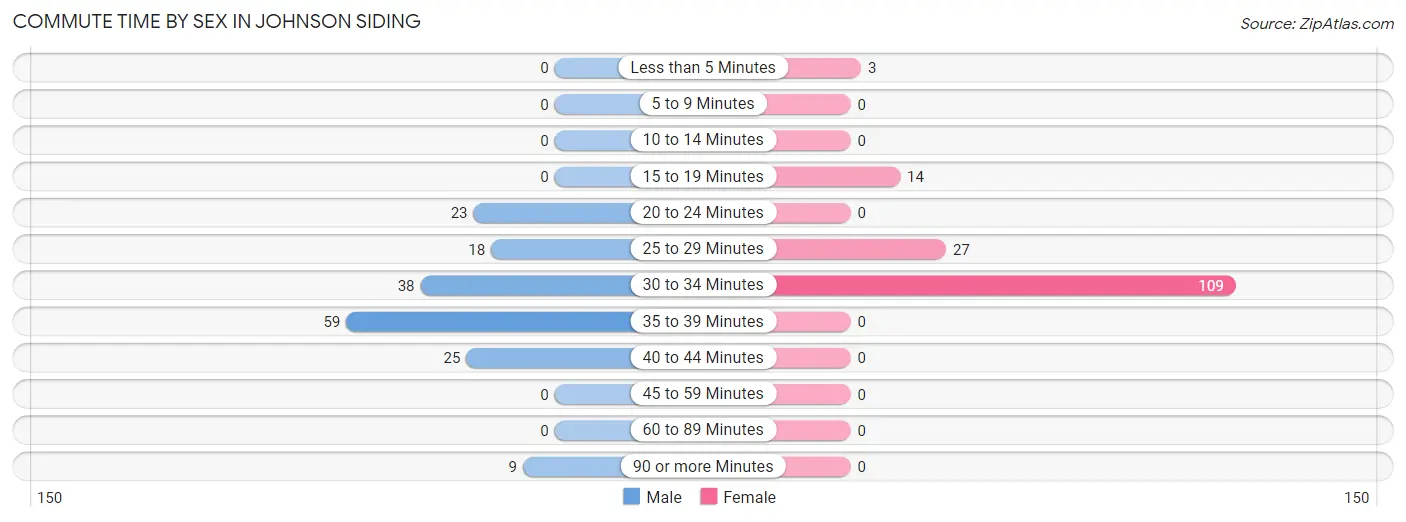
| Commute Time | Male | Female |
| Less than 5 Minutes | 0 (0.0%) | 3 (2.0%) |
| 5 to 9 Minutes | 0 (0.0%) | 0 (0.0%) |
| 10 to 14 Minutes | 0 (0.0%) | 0 (0.0%) |
| 15 to 19 Minutes | 0 (0.0%) | 14 (9.1%) |
| 20 to 24 Minutes | 23 (13.4%) | 0 (0.0%) |
| 25 to 29 Minutes | 18 (10.5%) | 27 (17.6%) |
| 30 to 34 Minutes | 38 (22.1%) | 109 (71.2%) |
| 35 to 39 Minutes | 59 (34.3%) | 0 (0.0%) |
| 40 to 44 Minutes | 25 (14.5%) | 0 (0.0%) |
| 45 to 59 Minutes | 0 (0.0%) | 0 (0.0%) |
| 60 to 89 Minutes | 0 (0.0%) | 0 (0.0%) |
| 90 or more Minutes | 9 (5.2%) | 0 (0.0%) |
Time of Departure to Work by Sex in Johnson Siding
The most frequent times of departure to work in Johnson Siding are 6:30 AM to 6:59 AM (62, 36.0%) for males and 5:30 AM to 5:59 AM (35, 22.9%) for females.
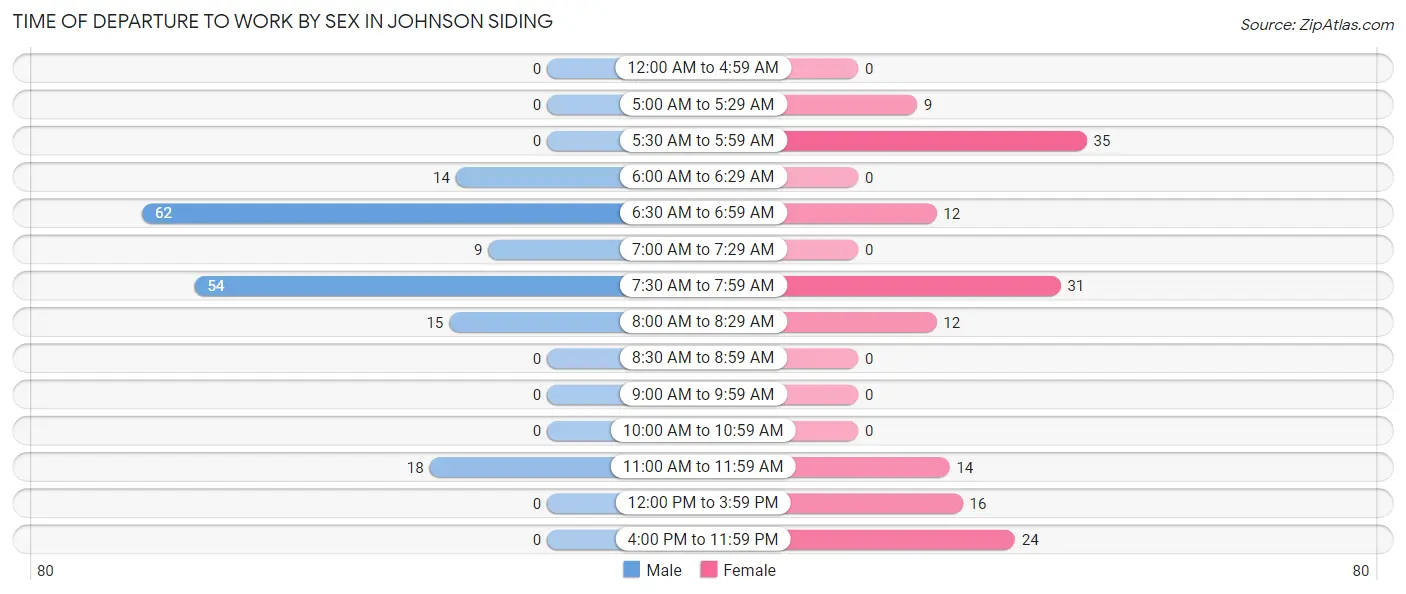
| Time of Departure | Male | Female |
| 12:00 AM to 4:59 AM | 0 (0.0%) | 0 (0.0%) |
| 5:00 AM to 5:29 AM | 0 (0.0%) | 9 (5.9%) |
| 5:30 AM to 5:59 AM | 0 (0.0%) | 35 (22.9%) |
| 6:00 AM to 6:29 AM | 14 (8.1%) | 0 (0.0%) |
| 6:30 AM to 6:59 AM | 62 (36.0%) | 12 (7.8%) |
| 7:00 AM to 7:29 AM | 9 (5.2%) | 0 (0.0%) |
| 7:30 AM to 7:59 AM | 54 (31.4%) | 31 (20.3%) |
| 8:00 AM to 8:29 AM | 15 (8.7%) | 12 (7.8%) |
| 8:30 AM to 8:59 AM | 0 (0.0%) | 0 (0.0%) |
| 9:00 AM to 9:59 AM | 0 (0.0%) | 0 (0.0%) |
| 10:00 AM to 10:59 AM | 0 (0.0%) | 0 (0.0%) |
| 11:00 AM to 11:59 AM | 18 (10.5%) | 14 (9.1%) |
| 12:00 PM to 3:59 PM | 0 (0.0%) | 16 (10.5%) |
| 4:00 PM to 11:59 PM | 0 (0.0%) | 24 (15.7%) |
| Total | 172 (100.0%) | 153 (100.0%) |
Housing Occupancy in Johnson Siding
Occupancy by Ownership in Johnson Siding
Of the total 265 dwellings in Johnson Siding, owner-occupied units account for 241 (90.9%), while renter-occupied units make up 24 (9.1%).
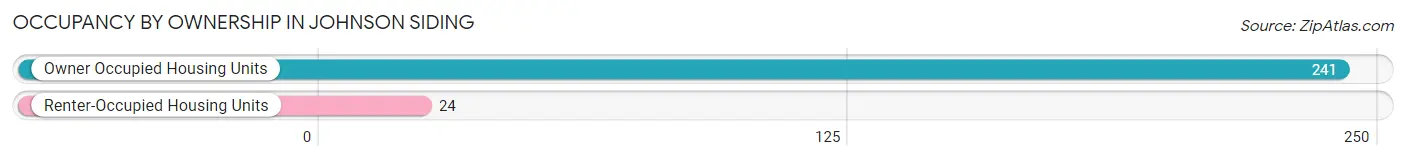
| Occupancy | # Housing Units | % Housing Units |
| Owner Occupied Housing Units | 241 | 90.9% |
| Renter-Occupied Housing Units | 24 | 9.1% |
| Total Occupied Housing Units | 265 | 100.0% |
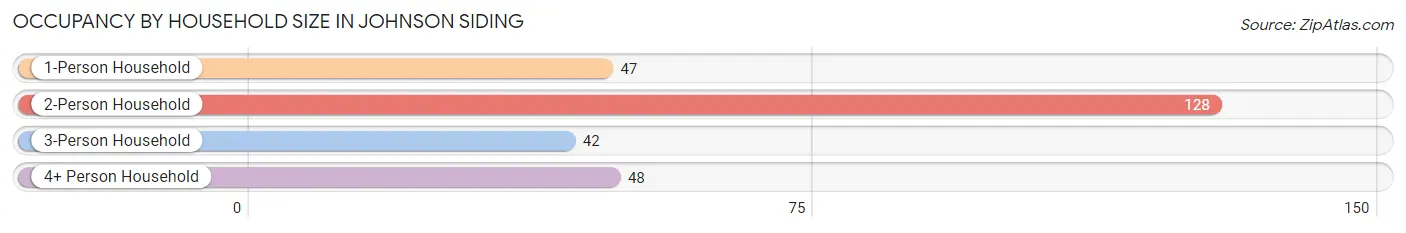
Occupancy by Household Size in Johnson Siding
| Household Size | # Housing Units | % Housing Units |
| 1-Person Household | 47 | 17.7% |
| 2-Person Household | 128 | 48.3% |
| 3-Person Household | 42 | 15.9% |
| 4+ Person Household | 48 | 18.1% |
| Total Housing Units | 265 | 100.0% |
Occupancy by Ownership by Household Size in Johnson Siding
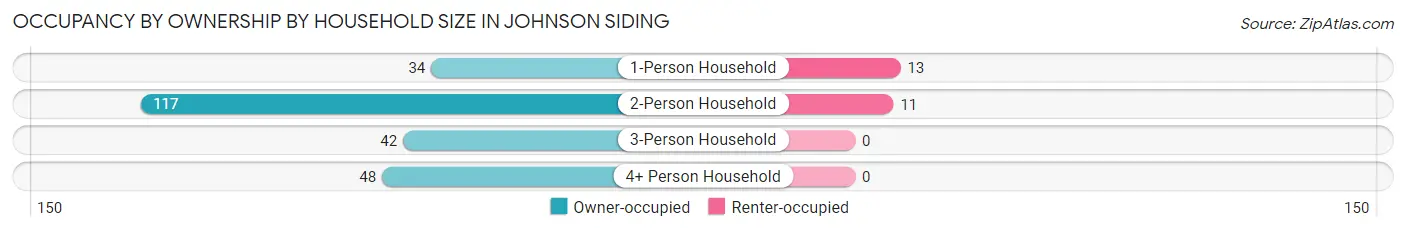
| Household Size | Owner-occupied | Renter-occupied |
| 1-Person Household | 34 (72.3%) | 13 (27.7%) |
| 2-Person Household | 117 (91.4%) | 11 (8.6%) |
| 3-Person Household | 42 (100.0%) | 0 (0.0%) |
| 4+ Person Household | 48 (100.0%) | 0 (0.0%) |
| Total Housing Units | 241 (90.9%) | 24 (9.1%) |
Occupancy by Educational Attainment in Johnson Siding
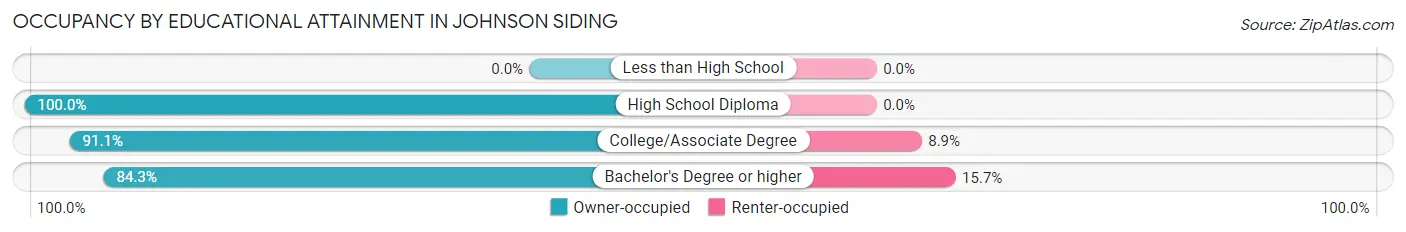
| Household Size | Owner-occupied | Renter-occupied |
| Less than High School | 0 (0.0%) | 0 (0.0%) |
| High School Diploma | 59 (100.0%) | 0 (0.0%) |
| College/Associate Degree | 112 (91.1%) | 11 (8.9%) |
| Bachelor's Degree or higher | 70 (84.3%) | 13 (15.7%) |
Occupancy by Age of Householder in Johnson Siding
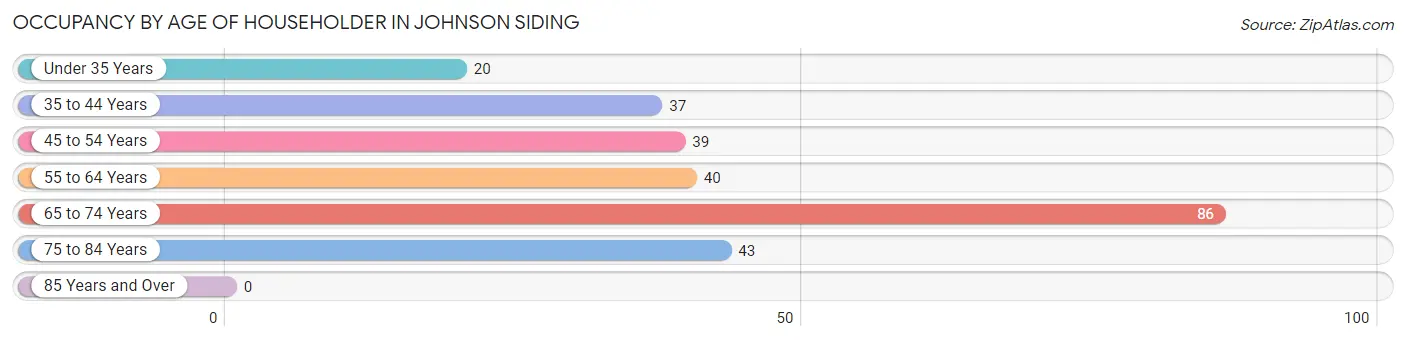
| Age Bracket | # Households | % Households |
| Under 35 Years | 20 | 7.5% |
| 35 to 44 Years | 37 | 14.0% |
| 45 to 54 Years | 39 | 14.7% |
| 55 to 64 Years | 40 | 15.1% |
| 65 to 74 Years | 86 | 32.5% |
| 75 to 84 Years | 43 | 16.2% |
| 85 Years and Over | 0 | 0.0% |
| Total | 265 | 100.0% |
Housing Finances in Johnson Siding
Median Income by Occupancy in Johnson Siding
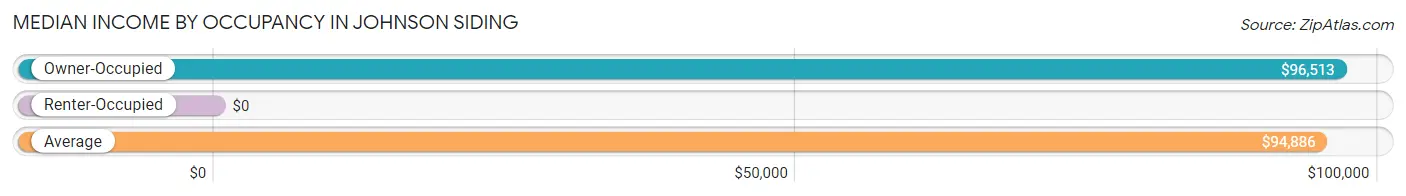
| Occupancy Type | # Households | Median Income |
| Owner-Occupied | 241 (90.9%) | $96,513 |
| Renter-Occupied | 24 (9.1%) | $0 |
| Average | 265 (100.0%) | $94,886 |
Occupancy by Householder Income Bracket in Johnson Siding
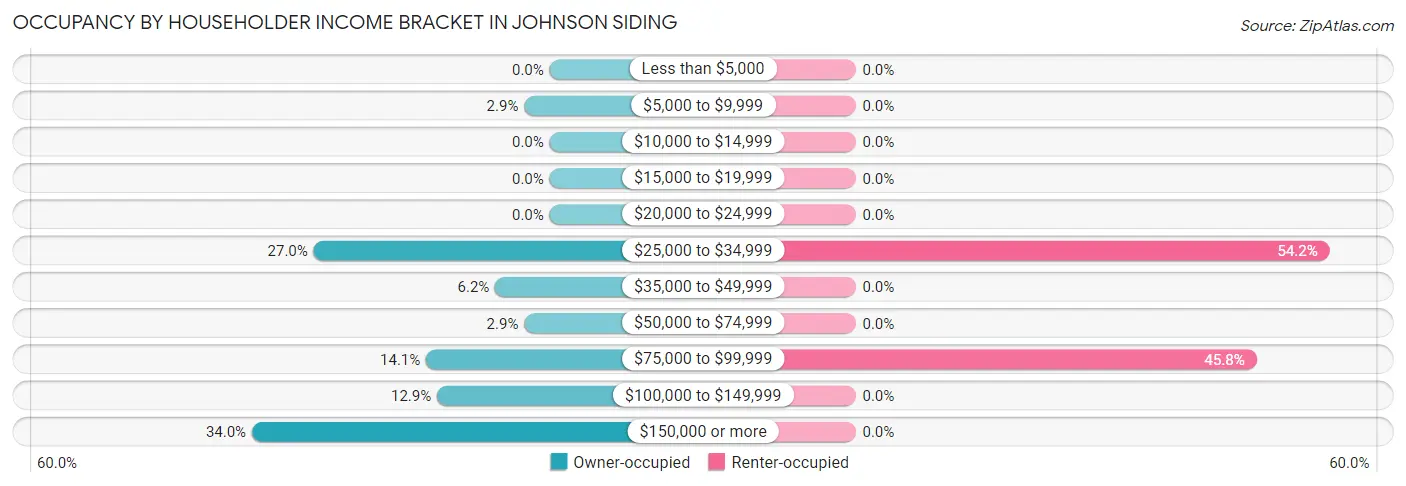
| Income Bracket | Owner-occupied | Renter-occupied |
| Less than $5,000 | 0 (0.0%) | 0 (0.0%) |
| $5,000 to $9,999 | 7 (2.9%) | 0 (0.0%) |
| $10,000 to $14,999 | 0 (0.0%) | 0 (0.0%) |
| $15,000 to $19,999 | 0 (0.0%) | 0 (0.0%) |
| $20,000 to $24,999 | 0 (0.0%) | 0 (0.0%) |
| $25,000 to $34,999 | 65 (27.0%) | 13 (54.2%) |
| $35,000 to $49,999 | 15 (6.2%) | 0 (0.0%) |
| $50,000 to $74,999 | 7 (2.9%) | 0 (0.0%) |
| $75,000 to $99,999 | 34 (14.1%) | 11 (45.8%) |
| $100,000 to $149,999 | 31 (12.9%) | 0 (0.0%) |
| $150,000 or more | 82 (34.0%) | 0 (0.0%) |
| Total | 241 (100.0%) | 24 (100.0%) |
Monthly Housing Cost Tiers in Johnson Siding
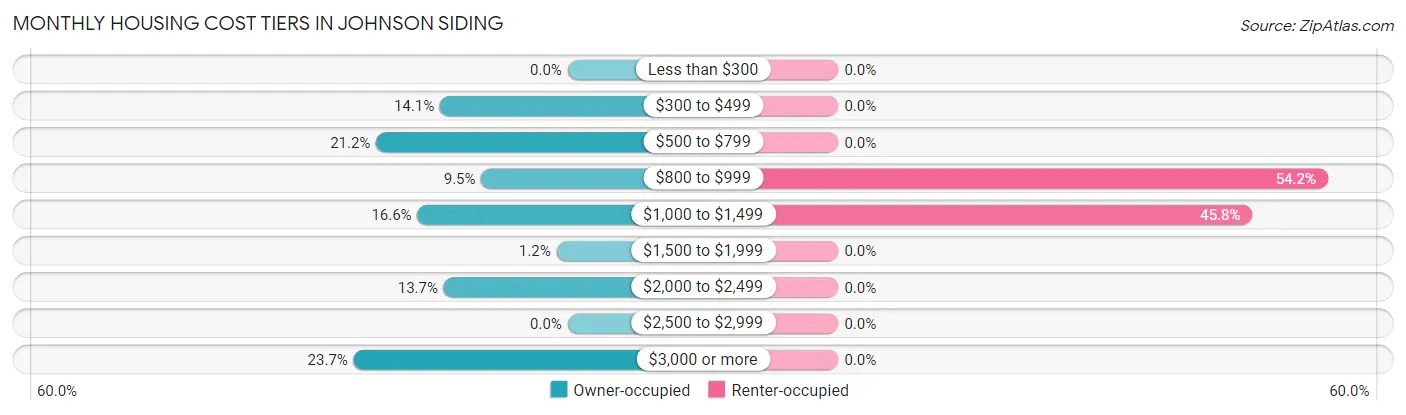
| Monthly Cost | Owner-occupied | Renter-occupied |
| Less than $300 | 0 (0.0%) | 0 (0.0%) |
| $300 to $499 | 34 (14.1%) | 0 (0.0%) |
| $500 to $799 | 51 (21.2%) | 0 (0.0%) |
| $800 to $999 | 23 (9.5%) | 13 (54.2%) |
| $1,000 to $1,499 | 40 (16.6%) | 11 (45.8%) |
| $1,500 to $1,999 | 3 (1.2%) | 0 (0.0%) |
| $2,000 to $2,499 | 33 (13.7%) | 0 (0.0%) |
| $2,500 to $2,999 | 0 (0.0%) | 0 (0.0%) |
| $3,000 or more | 57 (23.6%) | 0 (0.0%) |
| Total | 241 (100.0%) | 24 (100.0%) |
Physical Housing Characteristics in Johnson Siding
Housing Structures in Johnson Siding
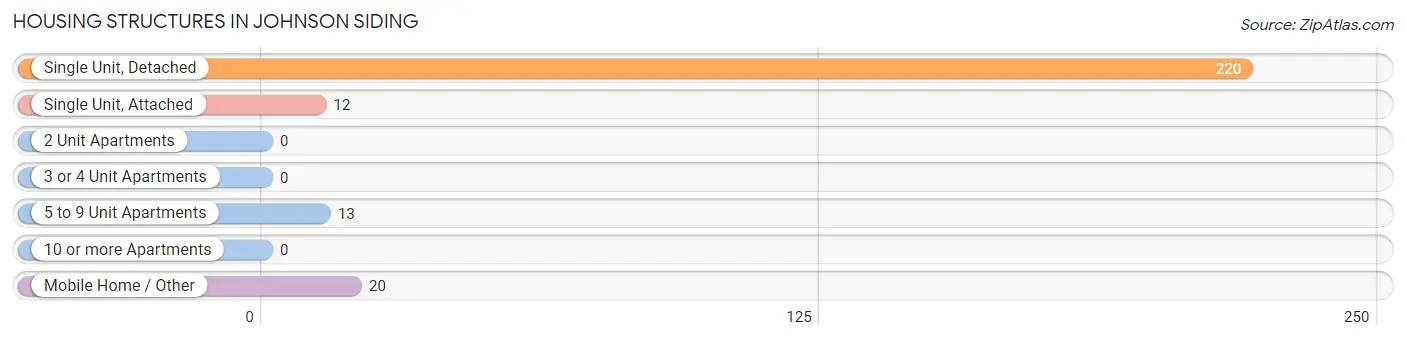
| Structure Type | # Housing Units | % Housing Units |
| Single Unit, Detached | 220 | 83.0% |
| Single Unit, Attached | 12 | 4.5% |
| 2 Unit Apartments | 0 | 0.0% |
| 3 or 4 Unit Apartments | 0 | 0.0% |
| 5 to 9 Unit Apartments | 13 | 4.9% |
| 10 or more Apartments | 0 | 0.0% |
| Mobile Home / Other | 20 | 7.5% |
| Total | 265 | 100.0% |
Housing Structures by Occupancy in Johnson Siding
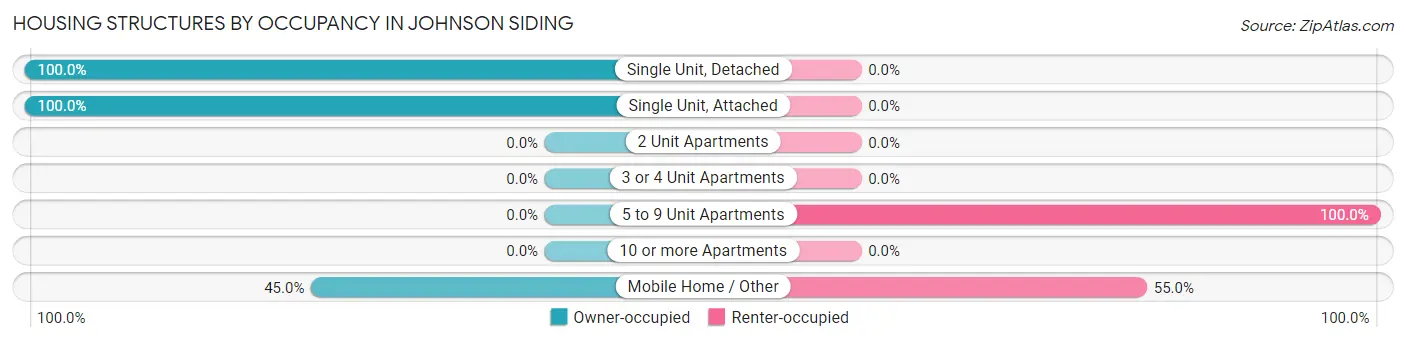
| Structure Type | Owner-occupied | Renter-occupied |
| Single Unit, Detached | 220 (100.0%) | 0 (0.0%) |
| Single Unit, Attached | 12 (100.0%) | 0 (0.0%) |
| 2 Unit Apartments | 0 (0.0%) | 0 (0.0%) |
| 3 or 4 Unit Apartments | 0 (0.0%) | 0 (0.0%) |
| 5 to 9 Unit Apartments | 0 (0.0%) | 13 (100.0%) |
| 10 or more Apartments | 0 (0.0%) | 0 (0.0%) |
| Mobile Home / Other | 9 (45.0%) | 11 (55.0%) |
| Total | 241 (90.9%) | 24 (9.1%) |
Housing Structures by Number of Rooms in Johnson Siding
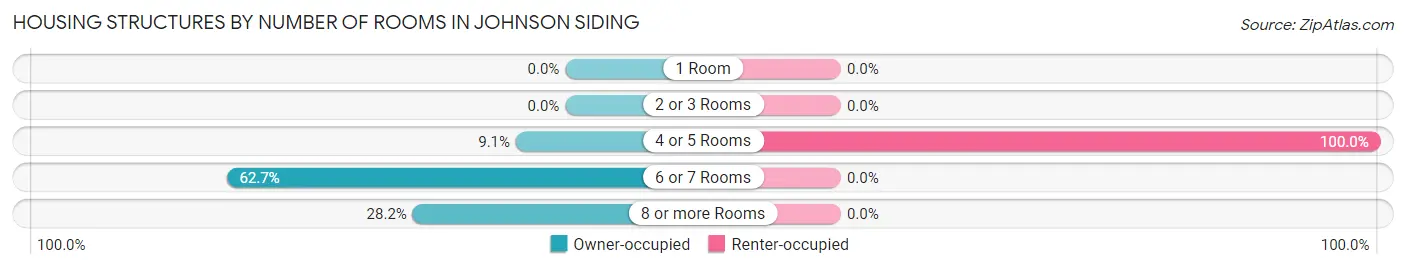
| Number of Rooms | Owner-occupied | Renter-occupied |
| 1 Room | 0 (0.0%) | 0 (0.0%) |
| 2 or 3 Rooms | 0 (0.0%) | 0 (0.0%) |
| 4 or 5 Rooms | 22 (9.1%) | 24 (100.0%) |
| 6 or 7 Rooms | 151 (62.7%) | 0 (0.0%) |
| 8 or more Rooms | 68 (28.2%) | 0 (0.0%) |
| Total | 241 (100.0%) | 24 (100.0%) |
Housing Structure by Heating Type in Johnson Siding
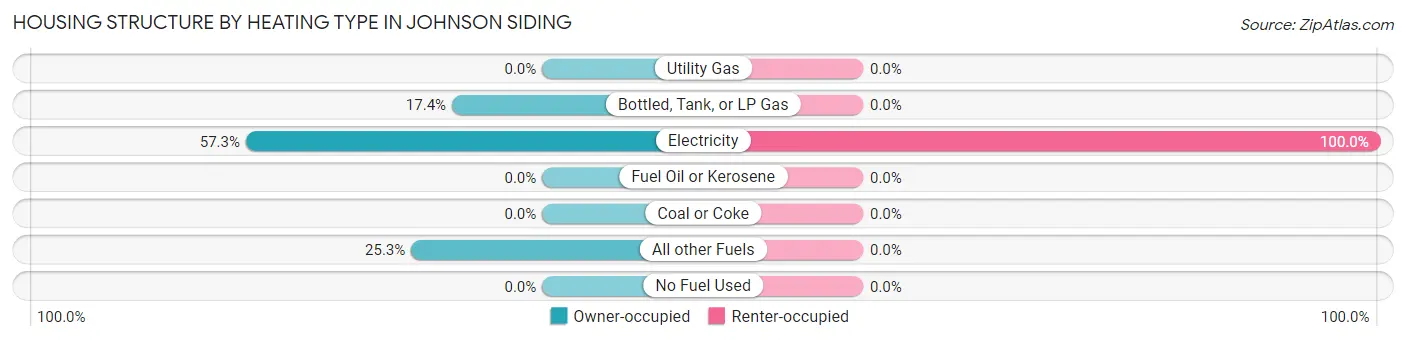
| Heating Type | Owner-occupied | Renter-occupied |
| Utility Gas | 0 (0.0%) | 0 (0.0%) |
| Bottled, Tank, or LP Gas | 42 (17.4%) | 0 (0.0%) |
| Electricity | 138 (57.3%) | 24 (100.0%) |
| Fuel Oil or Kerosene | 0 (0.0%) | 0 (0.0%) |
| Coal or Coke | 0 (0.0%) | 0 (0.0%) |
| All other Fuels | 61 (25.3%) | 0 (0.0%) |
| No Fuel Used | 0 (0.0%) | 0 (0.0%) |
| Total | 241 (100.0%) | 24 (100.0%) |
Household Vehicle Usage in Johnson Siding
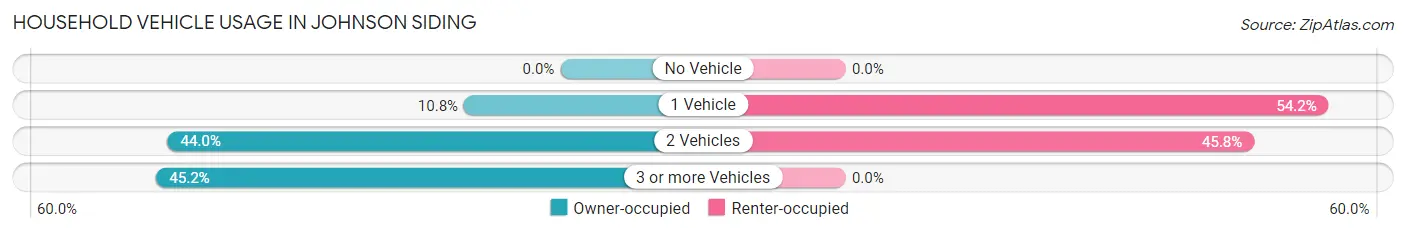
| Vehicles per Household | Owner-occupied | Renter-occupied |
| No Vehicle | 0 (0.0%) | 0 (0.0%) |
| 1 Vehicle | 26 (10.8%) | 13 (54.2%) |
| 2 Vehicles | 106 (44.0%) | 11 (45.8%) |
| 3 or more Vehicles | 109 (45.2%) | 0 (0.0%) |
| Total | 241 (100.0%) | 24 (100.0%) |
Real Estate & Mortgages in Johnson Siding
Real Estate and Mortgage Overview in Johnson Siding
| Characteristic | Without Mortgage | With Mortgage |
| Housing Units | 129 | 112 |
| Median Property Value | $192,700 | $756,000 |
| Median Household Income | $34,449 | $66 |
| Monthly Housing Costs | $590 | $57 |
| Real Estate Taxes | $3,472 | $0 |
Property Value by Mortgage Status in Johnson Siding
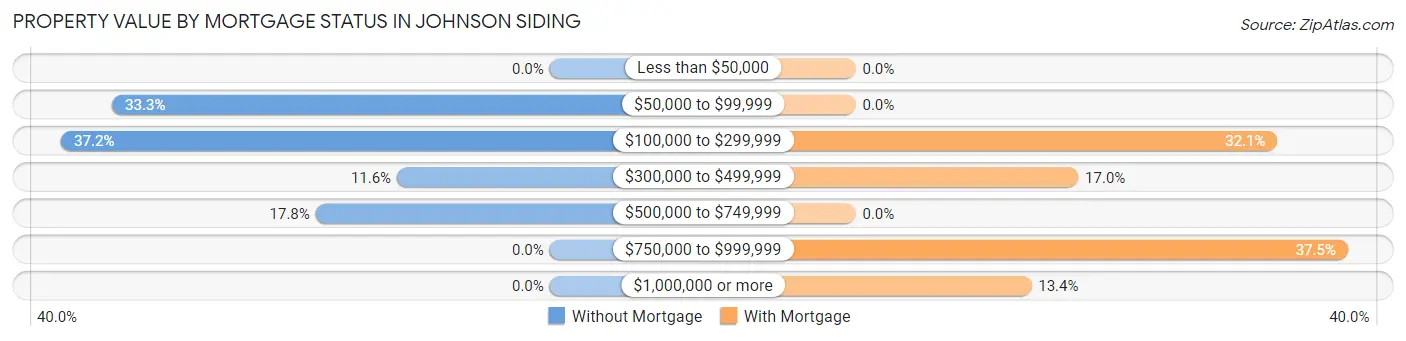
| Property Value | Without Mortgage | With Mortgage |
| Less than $50,000 | 0 (0.0%) | 0 (0.0%) |
| $50,000 to $99,999 | 43 (33.3%) | 0 (0.0%) |
| $100,000 to $299,999 | 48 (37.2%) | 36 (32.1%) |
| $300,000 to $499,999 | 15 (11.6%) | 19 (17.0%) |
| $500,000 to $749,999 | 23 (17.8%) | 0 (0.0%) |
| $750,000 to $999,999 | 0 (0.0%) | 42 (37.5%) |
| $1,000,000 or more | 0 (0.0%) | 15 (13.4%) |
| Total | 129 (100.0%) | 112 (100.0%) |
Household Income by Mortgage Status in Johnson Siding
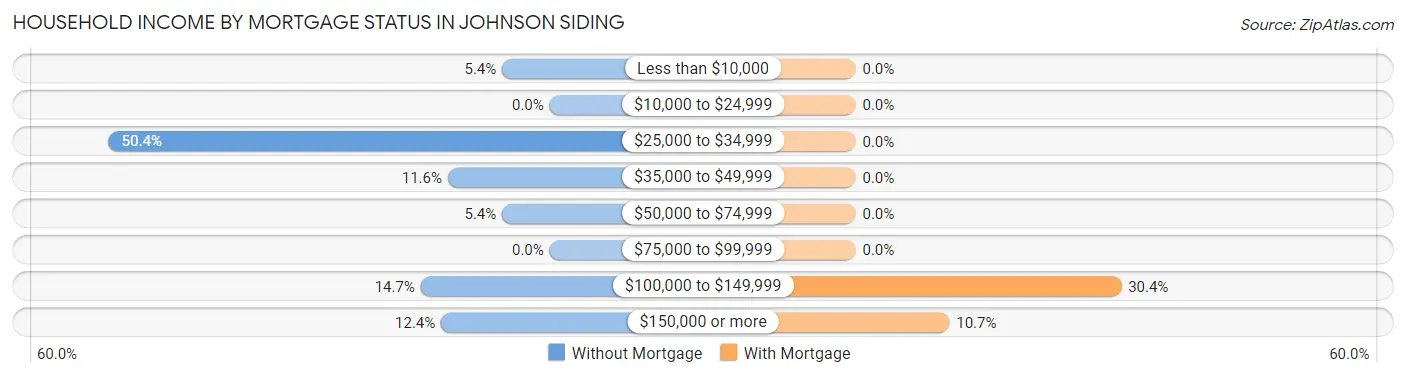
| Household Income | Without Mortgage | With Mortgage |
| Less than $10,000 | 7 (5.4%) | 0 (0.0%) |
| $10,000 to $24,999 | 0 (0.0%) | 0 (0.0%) |
| $25,000 to $34,999 | 65 (50.4%) | 0 (0.0%) |
| $35,000 to $49,999 | 15 (11.6%) | 0 (0.0%) |
| $50,000 to $74,999 | 7 (5.4%) | 0 (0.0%) |
| $75,000 to $99,999 | 0 (0.0%) | 0 (0.0%) |
| $100,000 to $149,999 | 19 (14.7%) | 34 (30.4%) |
| $150,000 or more | 16 (12.4%) | 12 (10.7%) |
| Total | 129 (100.0%) | 112 (100.0%) |
Property Value to Household Income Ratio in Johnson Siding
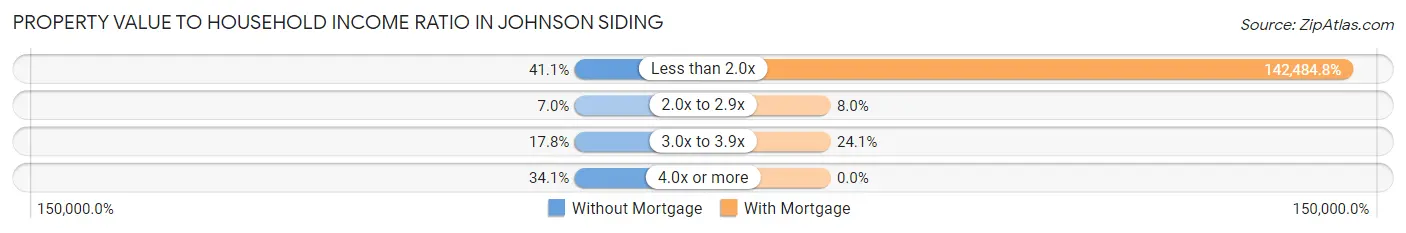
| Value-to-Income Ratio | Without Mortgage | With Mortgage |
| Less than 2.0x | 53 (41.1%) | 159,583 (142,484.8%) |
| 2.0x to 2.9x | 9 (7.0%) | 9 (8.0%) |
| 3.0x to 3.9x | 23 (17.8%) | 27 (24.1%) |
| 4.0x or more | 44 (34.1%) | 0 (0.0%) |
| Total | 129 (100.0%) | 112 (100.0%) |
Real Estate Taxes by Mortgage Status in Johnson Siding
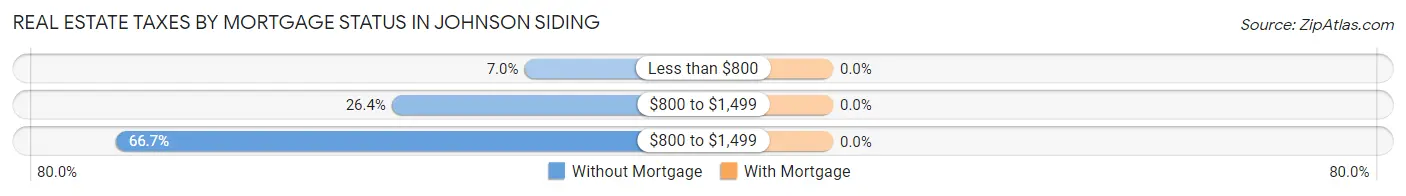
| Property Taxes | Without Mortgage | With Mortgage |
| Less than $800 | 9 (7.0%) | 0 (0.0%) |
| $800 to $1,499 | 34 (26.4%) | 0 (0.0%) |
| $800 to $1,499 | 86 (66.7%) | 0 (0.0%) |
| Total | 129 (100.0%) | 112 (100.0%) |
Health & Disability in Johnson Siding
Health Insurance Coverage by Age in Johnson Siding
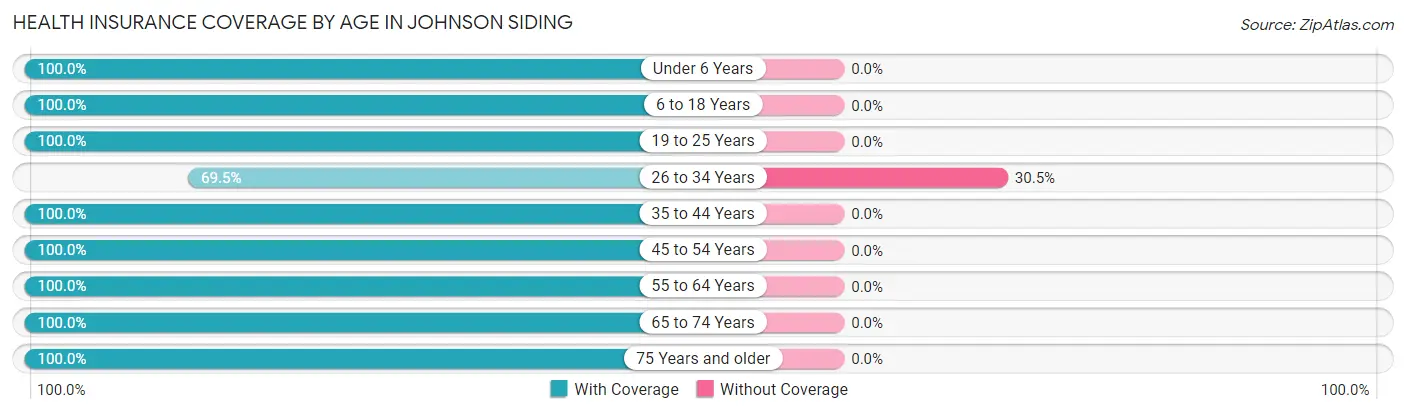
| Age Bracket | With Coverage | Without Coverage |
| Under 6 Years | 31 (100.0%) | 0 (0.0%) |
| 6 to 18 Years | 84 (100.0%) | 0 (0.0%) |
| 19 to 25 Years | 57 (100.0%) | 0 (0.0%) |
| 26 to 34 Years | 41 (69.5%) | 18 (30.5%) |
| 35 to 44 Years | 51 (100.0%) | 0 (0.0%) |
| 45 to 54 Years | 46 (100.0%) | 0 (0.0%) |
| 55 to 64 Years | 111 (100.0%) | 0 (0.0%) |
| 65 to 74 Years | 118 (100.0%) | 0 (0.0%) |
| 75 Years and older | 71 (100.0%) | 0 (0.0%) |
| Total | 610 (97.1%) | 18 (2.9%) |
Health Insurance Coverage by Citizenship Status in Johnson Siding
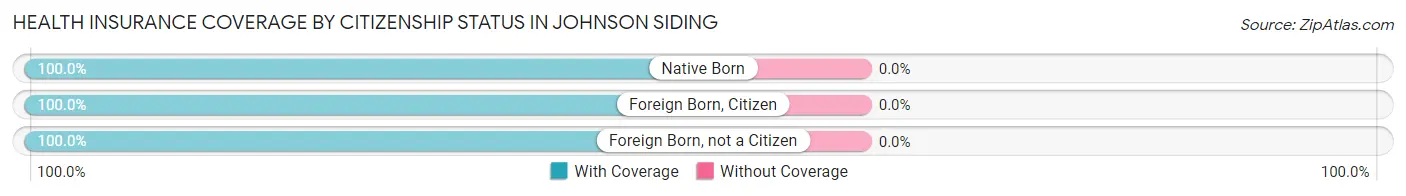
| Citizenship Status | With Coverage | Without Coverage |
| Native Born | 31 (100.0%) | 0 (0.0%) |
| Foreign Born, Citizen | 84 (100.0%) | 0 (0.0%) |
| Foreign Born, not a Citizen | 57 (100.0%) | 0 (0.0%) |
Health Insurance Coverage by Household Income in Johnson Siding
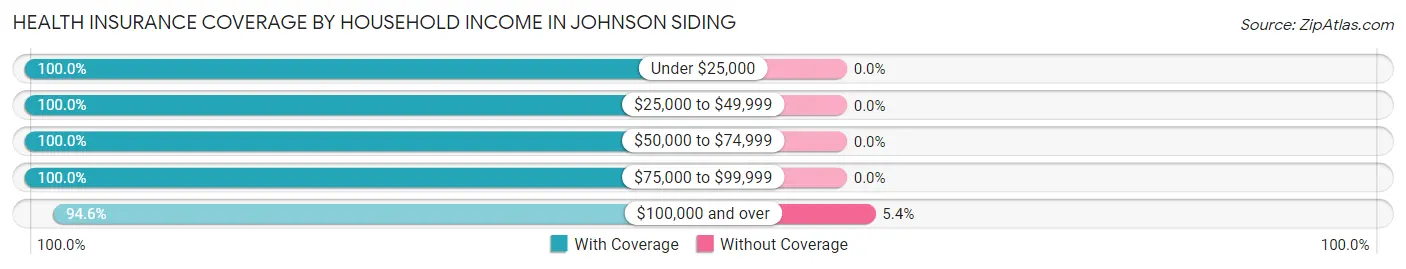
| Household Income | With Coverage | Without Coverage |
| Under $25,000 | 14 (100.0%) | 0 (0.0%) |
| $25,000 to $49,999 | 168 (100.0%) | 0 (0.0%) |
| $50,000 to $74,999 | 7 (100.0%) | 0 (0.0%) |
| $75,000 to $99,999 | 103 (100.0%) | 0 (0.0%) |
| $100,000 and over | 318 (94.6%) | 18 (5.4%) |
Public vs Private Health Insurance Coverage by Age in Johnson Siding
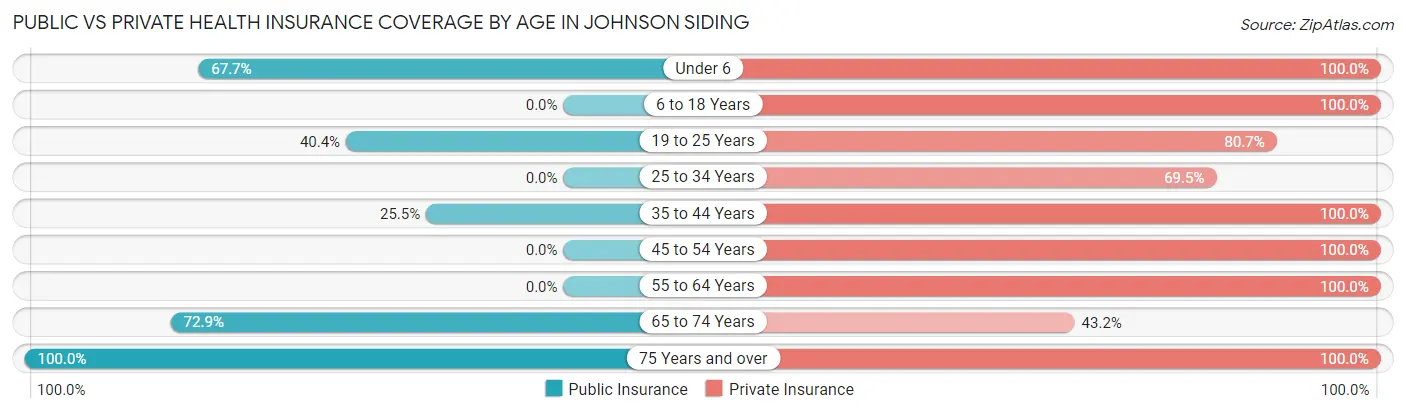
| Age Bracket | Public Insurance | Private Insurance |
| Under 6 | 21 (67.7%) | 31 (100.0%) |
| 6 to 18 Years | 0 (0.0%) | 84 (100.0%) |
| 19 to 25 Years | 23 (40.4%) | 46 (80.7%) |
| 25 to 34 Years | 0 (0.0%) | 41 (69.5%) |
| 35 to 44 Years | 13 (25.5%) | 51 (100.0%) |
| 45 to 54 Years | 0 (0.0%) | 46 (100.0%) |
| 55 to 64 Years | 0 (0.0%) | 111 (100.0%) |
| 65 to 74 Years | 86 (72.9%) | 51 (43.2%) |
| 75 Years and over | 71 (100.0%) | 71 (100.0%) |
| Total | 214 (34.1%) | 532 (84.7%) |
Disability Status by Sex by Age in Johnson Siding
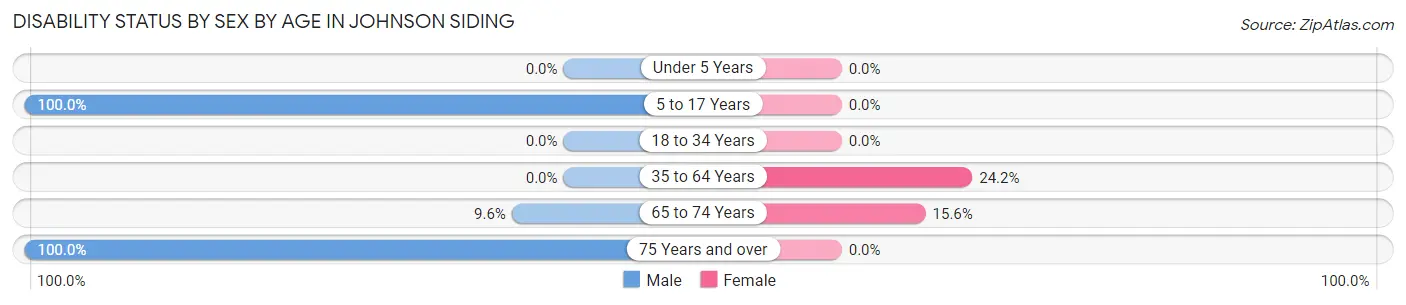
| Age Bracket | Male | Female |
| Under 5 Years | 0 (0.0%) | 0 (0.0%) |
| 5 to 17 Years | 13 (100.0%) | 0 (0.0%) |
| 18 to 34 Years | 0 (0.0%) | 0 (0.0%) |
| 35 to 64 Years | 0 (0.0%) | 31 (24.2%) |
| 65 to 74 Years | 7 (9.6%) | 7 (15.6%) |
| 75 Years and over | 28 (100.0%) | 0 (0.0%) |
Disability Class by Sex by Age in Johnson Siding
Disability Class: Hearing Difficulty
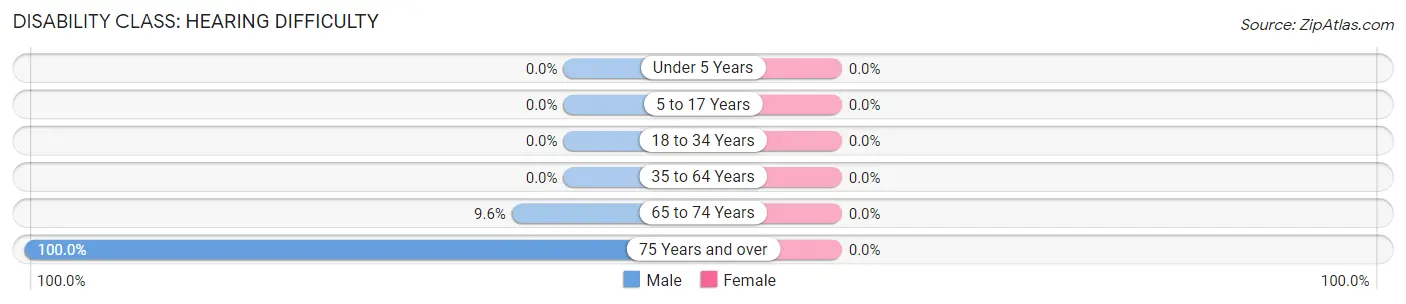
| Age Bracket | Male | Female |
| Under 5 Years | 0 (0.0%) | 0 (0.0%) |
| 5 to 17 Years | 0 (0.0%) | 0 (0.0%) |
| 18 to 34 Years | 0 (0.0%) | 0 (0.0%) |
| 35 to 64 Years | 0 (0.0%) | 0 (0.0%) |
| 65 to 74 Years | 7 (9.6%) | 0 (0.0%) |
| 75 Years and over | 28 (100.0%) | 0 (0.0%) |
Disability Class: Vision Difficulty
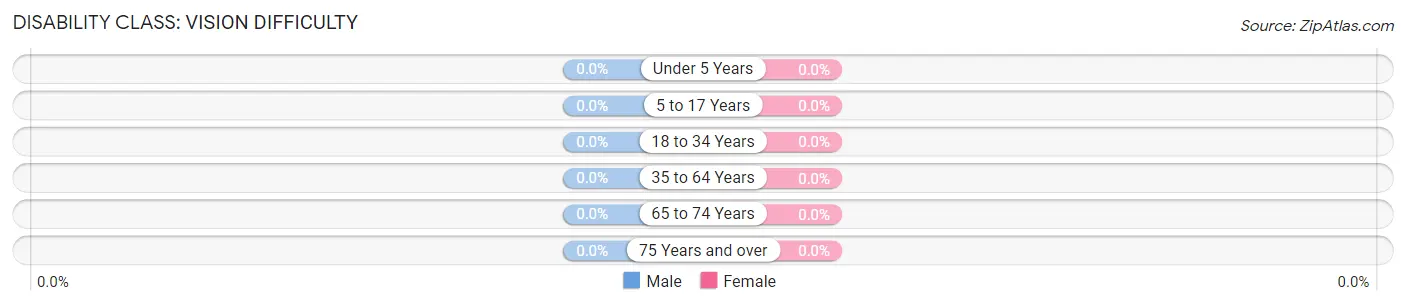
| Age Bracket | Male | Female |
| Under 5 Years | 0 (0.0%) | 0 (0.0%) |
| 5 to 17 Years | 0 (0.0%) | 0 (0.0%) |
| 18 to 34 Years | 0 (0.0%) | 0 (0.0%) |
| 35 to 64 Years | 0 (0.0%) | 0 (0.0%) |
| 65 to 74 Years | 0 (0.0%) | 0 (0.0%) |
| 75 Years and over | 0 (0.0%) | 0 (0.0%) |
Disability Class: Cognitive Difficulty
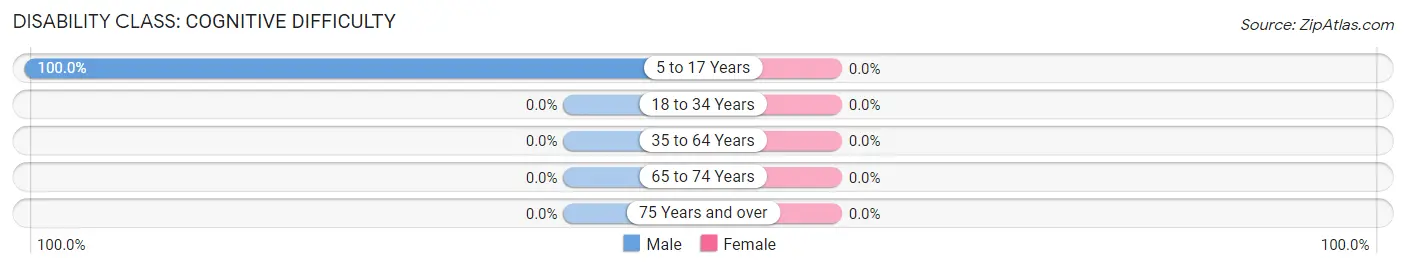
| Age Bracket | Male | Female |
| 5 to 17 Years | 13 (100.0%) | 0 (0.0%) |
| 18 to 34 Years | 0 (0.0%) | 0 (0.0%) |
| 35 to 64 Years | 0 (0.0%) | 0 (0.0%) |
| 65 to 74 Years | 0 (0.0%) | 0 (0.0%) |
| 75 Years and over | 0 (0.0%) | 0 (0.0%) |
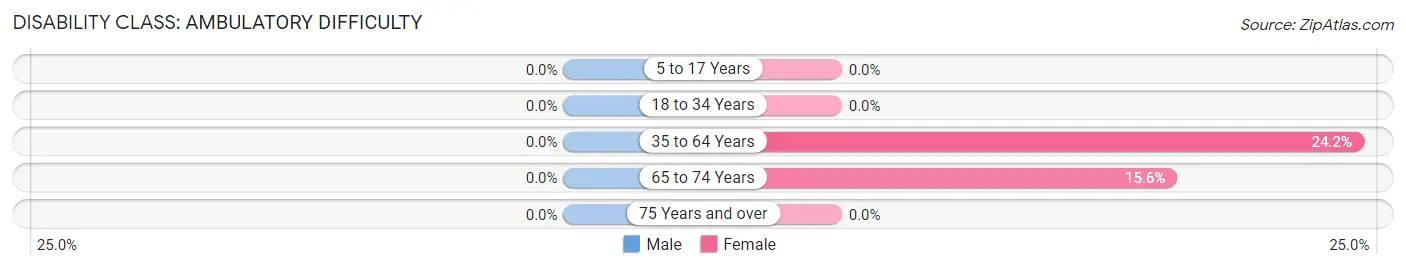
Disability Class: Ambulatory Difficulty
| Age Bracket | Male | Female |
| 5 to 17 Years | 0 (0.0%) | 0 (0.0%) |
| 18 to 34 Years | 0 (0.0%) | 0 (0.0%) |
| 35 to 64 Years | 0 (0.0%) | 31 (24.2%) |
| 65 to 74 Years | 0 (0.0%) | 7 (15.6%) |
| 75 Years and over | 0 (0.0%) | 0 (0.0%) |
Disability Class: Self-Care Difficulty
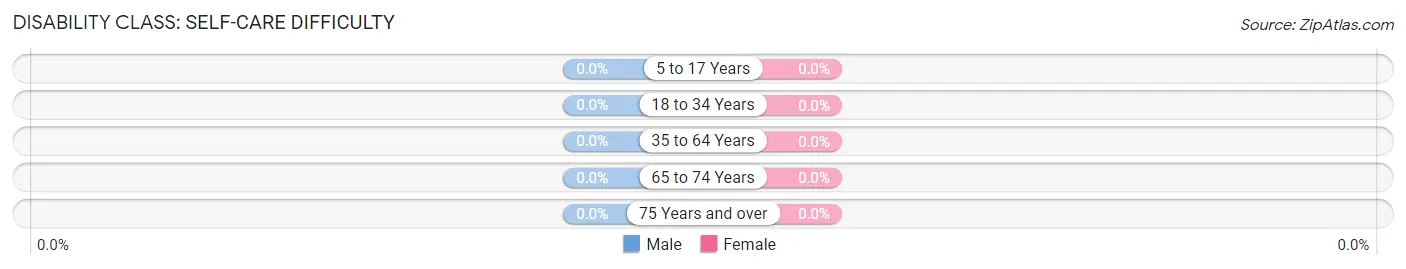
| Age Bracket | Male | Female |
| 5 to 17 Years | 0 (0.0%) | 0 (0.0%) |
| 18 to 34 Years | 0 (0.0%) | 0 (0.0%) |
| 35 to 64 Years | 0 (0.0%) | 0 (0.0%) |
| 65 to 74 Years | 0 (0.0%) | 0 (0.0%) |
| 75 Years and over | 0 (0.0%) | 0 (0.0%) |
Technology Access in Johnson Siding
Computing Device Access in Johnson Siding
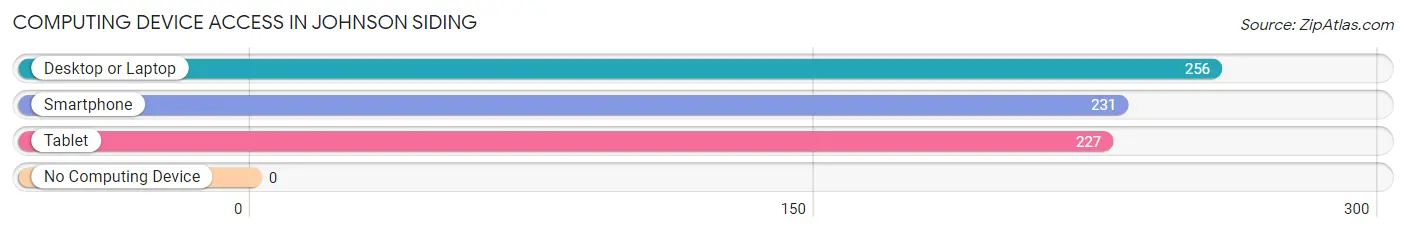
| Device Type | # Households | % Households |
| Desktop or Laptop | 256 | 96.6% |
| Smartphone | 231 | 87.2% |
| Tablet | 227 | 85.7% |
| No Computing Device | 0 | 0.0% |
| Total | 265 | 100.0% |
Internet Access in Johnson Siding
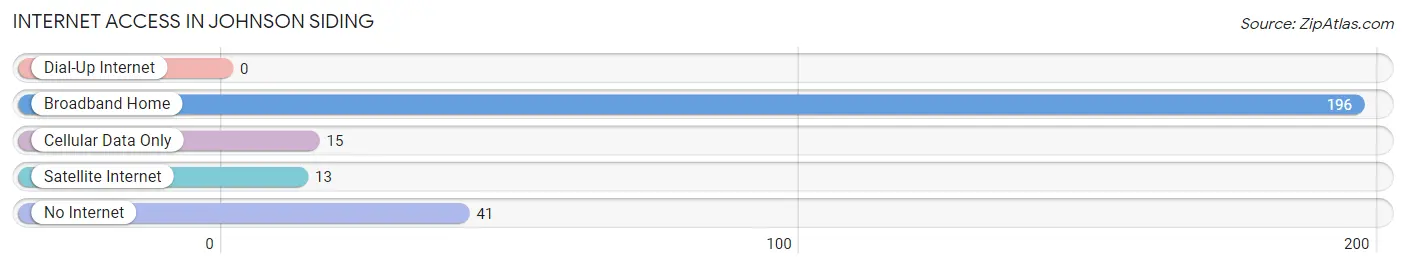
| Internet Type | # Households | % Households |
| Dial-Up Internet | 0 | 0.0% |
| Broadband Home | 196 | 74.0% |
| Cellular Data Only | 15 | 5.7% |
| Satellite Internet | 13 | 4.9% |
| No Internet | 41 | 15.5% |
| Total | 265 | 100.0% |
Johnson Siding Summary
Johnson Siding is a small unincorporated community located in the southeastern corner of South Dakota, in the United States. It is situated in the extreme southeastern corner of the state, in the extreme southeastern corner of Minnehaha County, and is part of the Sioux Falls Metropolitan Statistical Area. The population of Johnson Siding was estimated to be around 200 in 2020.
History
Johnson Siding was founded in 1883 by a group of settlers from Minnesota. The settlers were led by John Johnson, who had purchased the land from the Sioux Indians. The town was originally named Johnsonville, but the name was changed to Johnson Siding in 1885. The name was chosen to reflect the fact that the town was located on the side of the railroad tracks.
The town grew slowly but steadily over the years, and by the early 1900s it had become a thriving community. It was home to a variety of businesses, including a general store, a blacksmith shop, a hotel, a bank, and a post office. The town also had a school, a church, and a cemetery.
Geography
Johnson Siding is located in the extreme southeastern corner of South Dakota, in the extreme southeastern corner of Minnehaha County. It is situated at an elevation of 1,717 feet (524 meters) above sea level. The town is located on the Big Sioux River, which flows through the area.
The town is surrounded by rolling hills and prairies, and is located in the heart of the Great Plains. The climate in the area is generally mild, with hot summers and cold winters.
Economy
The economy of Johnson Siding is largely based on agriculture. The town is home to several farms, which produce a variety of crops, including corn, soybeans, wheat, and hay. The town also has a few small businesses, including a general store, a gas station, and a restaurant.
Demographics
The population of Johnson Siding was estimated to be around 200 in 2020. The town is predominantly white, with a small minority population. The median household income in the town is around $45,000, and the median home value is around $150,000. The town has a low unemployment rate, and the majority of the population is employed in the agricultural sector.
Common Questions
What is Per Capita Income in Johnson Siding?
Per Capita income in Johnson Siding is $38,867.
What is the Median Family Income in Johnson Siding?
Median Family Income in Johnson Siding is $106,827.
What is the Median Household income in Johnson Siding?
Median Household Income in Johnson Siding is $94,886.
What is Inequality or Gini Index in Johnson Siding?
Inequality or Gini Index in Johnson Siding is 0.34.
What is the Total Population of Johnson Siding?
Total Population of Johnson Siding is 658.
What is the Total Male Population of Johnson Siding?
Total Male Population of Johnson Siding is 317.
What is the Total Female Population of Johnson Siding?
Total Female Population of Johnson Siding is 341.
What is the Ratio of Males per 100 Females in Johnson Siding?
There are 92.96 Males per 100 Females in Johnson Siding.
What is the Ratio of Females per 100 Males in Johnson Siding?
There are 107.57 Females per 100 Males in Johnson Siding.
What is the Median Population Age in Johnson Siding?
Median Population Age in Johnson Siding is 47.6 Years.
What is the Average Family Size in Johnson Siding
Average Family Size in Johnson Siding is 2.8 People.
What is the Average Household Size in Johnson Siding
Average Household Size in Johnson Siding is 2.5 People.
How Large is the Labor Force in Johnson Siding?
There are 350 People in the Labor Forcein in Johnson Siding.
What is the Percentage of People in the Labor Force in Johnson Siding?
60.6% of People are in the Labor Force in Johnson Siding.