Northville, SD Map & Demographics
Northville Map
Northville Overview
$36,462
PER CAPITA INCOME
$158,333
AVG FAMILY INCOME
$113,750
AVG HOUSEHOLD INCOME
24.5%
WAGE / INCOME GAP [ % ]
75.5¢/ $1
WAGE / INCOME GAP [ $ ]
0.32
INEQUALITY / GINI INDEX
159
TOTAL POPULATION
69
MALE POPULATION
90
FEMALE POPULATION
76.67
MALES / 100 FEMALES
130.43
FEMALES / 100 MALES
35.5
MEDIAN AGE
3.7
AVG FAMILY SIZE
3.1
AVG HOUSEHOLD SIZE
79
LABOR FORCE [ PEOPLE ]
84.0%
PERCENT IN LABOR FORCE
Northville Zip Codes
Northville Area Codes
Income in Northville
Income Overview in Northville
Per Capita Income in Northville is $36,462, while median incomes of families and households are $158,333 and $113,750 respectively.
| Characteristic | Number | Measure |
| Per Capita Income | 159 | $36,462 |
| Median Family Income | 38 | $158,333 |
| Mean Family Income | 38 | $138,824 |
| Median Household Income | 52 | $113,750 |
| Mean Household Income | 52 | $113,063 |
| Income Deficit | 38 | $0 |
| Wage / Income Gap (%) | 159 | 24.51% |
| Wage / Income Gap ($) | 159 | 75.49¢ per $1 |
| Gini / Inequality Index | 159 | 0.32 |
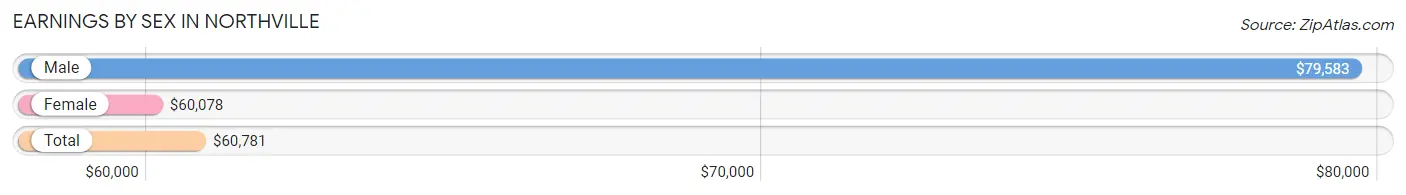
Earnings by Sex in Northville
Average Earnings in Northville are $60,781, $79,583 for men and $60,078 for women, a difference of 24.5%.
| Sex | Number | Average Earnings |
| Male | 43 (52.4%) | $79,583 |
| Female | 39 (47.6%) | $60,078 |
| Total | 82 (100.0%) | $60,781 |
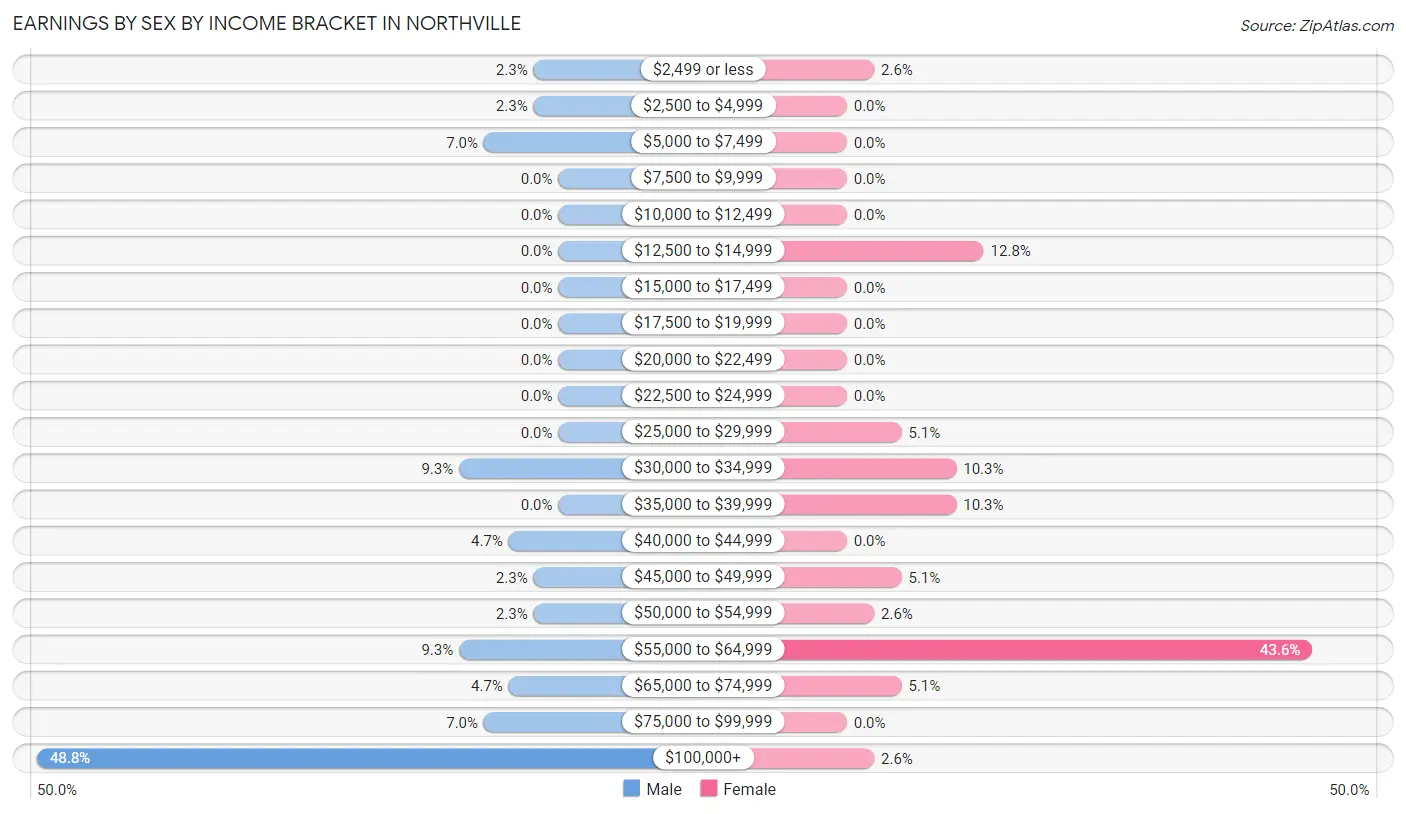
Earnings by Sex by Income Bracket in Northville
The most common earnings brackets in Northville are $100,000+ for men (21 | 48.8%) and $55,000 to $64,999 for women (17 | 43.6%).
| Income | Male | Female |
| $2,499 or less | 1 (2.3%) | 1 (2.6%) |
| $2,500 to $4,999 | 1 (2.3%) | 0 (0.0%) |
| $5,000 to $7,499 | 3 (7.0%) | 0 (0.0%) |
| $7,500 to $9,999 | 0 (0.0%) | 0 (0.0%) |
| $10,000 to $12,499 | 0 (0.0%) | 0 (0.0%) |
| $12,500 to $14,999 | 0 (0.0%) | 5 (12.8%) |
| $15,000 to $17,499 | 0 (0.0%) | 0 (0.0%) |
| $17,500 to $19,999 | 0 (0.0%) | 0 (0.0%) |
| $20,000 to $22,499 | 0 (0.0%) | 0 (0.0%) |
| $22,500 to $24,999 | 0 (0.0%) | 0 (0.0%) |
| $25,000 to $29,999 | 0 (0.0%) | 2 (5.1%) |
| $30,000 to $34,999 | 4 (9.3%) | 4 (10.3%) |
| $35,000 to $39,999 | 0 (0.0%) | 4 (10.3%) |
| $40,000 to $44,999 | 2 (4.6%) | 0 (0.0%) |
| $45,000 to $49,999 | 1 (2.3%) | 2 (5.1%) |
| $50,000 to $54,999 | 1 (2.3%) | 1 (2.6%) |
| $55,000 to $64,999 | 4 (9.3%) | 17 (43.6%) |
| $65,000 to $74,999 | 2 (4.6%) | 2 (5.1%) |
| $75,000 to $99,999 | 3 (7.0%) | 0 (0.0%) |
| $100,000+ | 21 (48.8%) | 1 (2.6%) |
| Total | 43 (100.0%) | 39 (100.0%) |
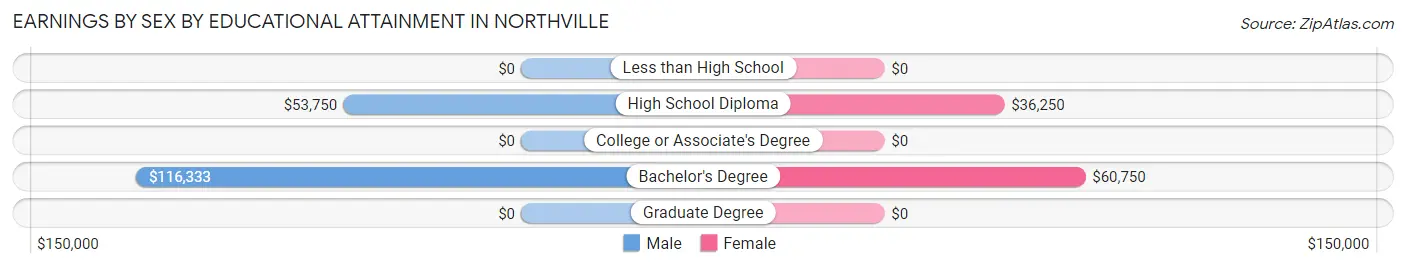
Earnings by Sex by Educational Attainment in Northville
Average earnings in Northville are $105,833 for men and $60,078 for women, a difference of 43.2%. Men with an educational attainment of bachelor's degree enjoy the highest average annual earnings of $116,333, while those with high school diploma education earn the least with $53,750. Women with an educational attainment of bachelor's degree earn the most with the average annual earnings of $60,750, while those with high school diploma education have the smallest earnings of $36,250.
| Educational Attainment | Male Income | Female Income |
| Less than High School | - | - |
| High School Diploma | $53,750 | $36,250 |
| College or Associate's Degree | - | - |
| Bachelor's Degree | $116,333 | $60,750 |
| Graduate Degree | - | - |
| Total | $105,833 | $60,078 |
Family Income in Northville
Family Income Brackets in Northville
According to the Northville family income data, there are 21 families falling into the $150,000 to $199,999 income range, which is the most common income bracket and makes up 55.3% of all families.
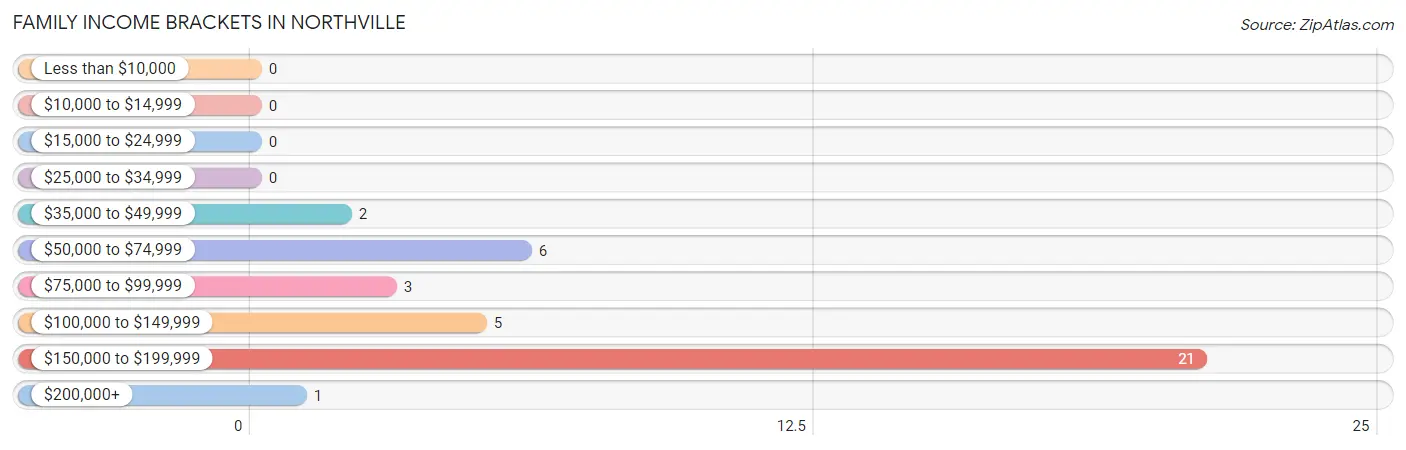
| Income Bracket | # Families | % Families |
| Less than $10,000 | 0 | 0.0% |
| $10,000 to $14,999 | 0 | 0.0% |
| $15,000 to $24,999 | 0 | 0.0% |
| $25,000 to $34,999 | 0 | 0.0% |
| $35,000 to $49,999 | 2 | 5.3% |
| $50,000 to $74,999 | 6 | 15.8% |
| $75,000 to $99,999 | 3 | 7.9% |
| $100,000 to $149,999 | 5 | 13.2% |
| $150,000 to $199,999 | 21 | 55.3% |
| $200,000+ | 1 | 2.6% |
Family Income by Famaliy Size in Northville
4-person families (22 | 57.9%) account for the highest median family income in Northville with $175,714 per family, while 2-person families (11 | 28.9%) have the highest median income of $45,938 per family member.
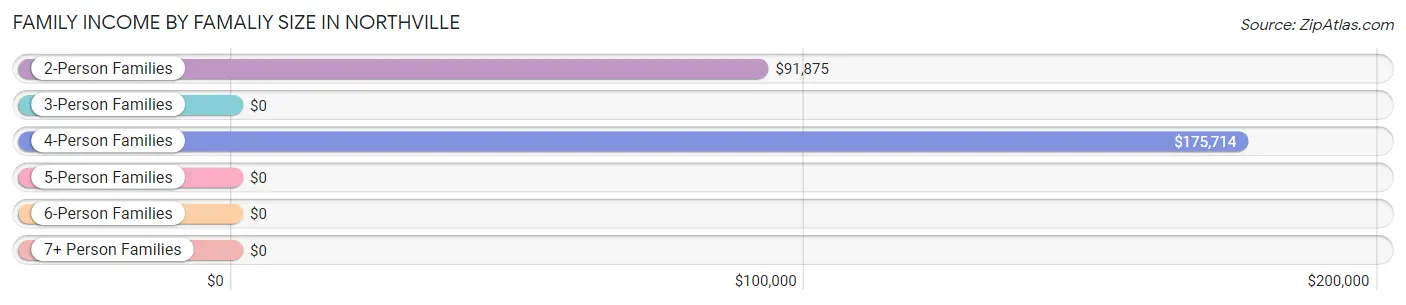
| Income Bracket | # Families | Median Income |
| 2-Person Families | 11 (28.9%) | $91,875 |
| 3-Person Families | 2 (5.3%) | $0 |
| 4-Person Families | 22 (57.9%) | $175,714 |
| 5-Person Families | 1 (2.6%) | $0 |
| 6-Person Families | 2 (5.3%) | $0 |
| 7+ Person Families | 0 (0.0%) | $0 |
| Total | 38 (100.0%) | $158,333 |
Family Income by Number of Earners in Northville
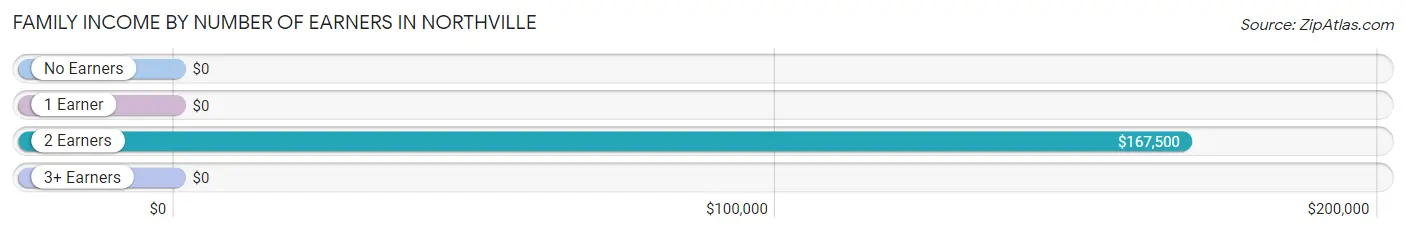
| Number of Earners | # Families | Median Income |
| No Earners | 0 (0.0%) | $0 |
| 1 Earner | 4 (10.5%) | $0 |
| 2 Earners | 30 (78.9%) | $167,500 |
| 3+ Earners | 4 (10.5%) | $0 |
| Total | 38 (100.0%) | $158,333 |
Household Income in Northville
Household Income Brackets in Northville
With 21 households falling in the category, the $150,000 to $199,999 income range is the most frequent in Northville, accounting for 40.4% of all households.
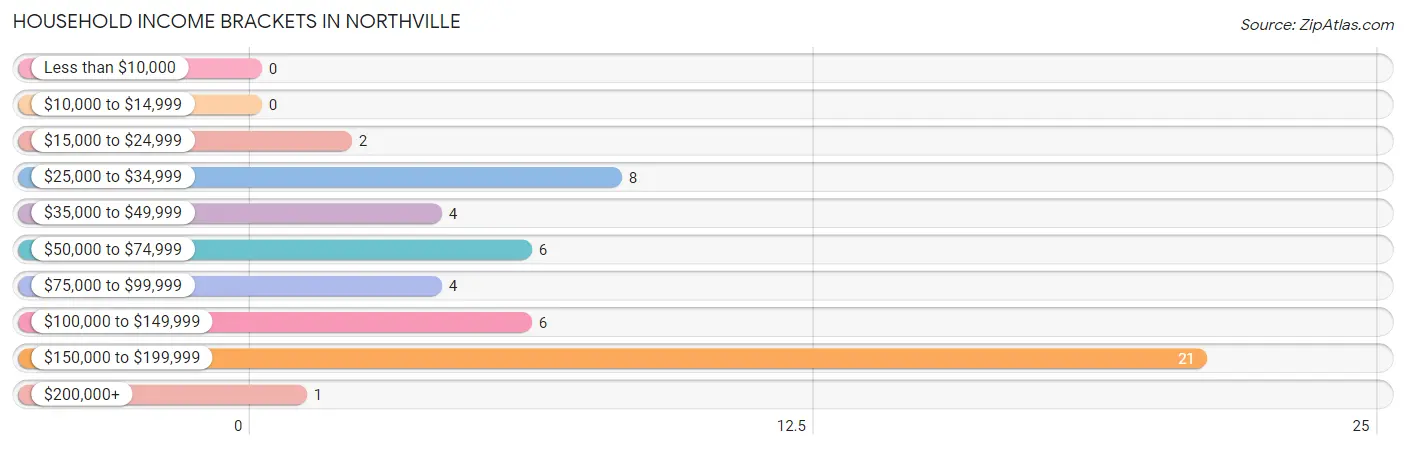
| Income Bracket | # Households | % Households |
| Less than $10,000 | 0 | 0.0% |
| $10,000 to $14,999 | 0 | 0.0% |
| $15,000 to $24,999 | 2 | 3.8% |
| $25,000 to $34,999 | 8 | 15.4% |
| $35,000 to $49,999 | 4 | 7.7% |
| $50,000 to $74,999 | 6 | 11.5% |
| $75,000 to $99,999 | 4 | 7.7% |
| $100,000 to $149,999 | 6 | 11.5% |
| $150,000 to $199,999 | 21 | 40.4% |
| $200,000+ | 1 | 1.9% |
Household Income by Householder Age in Northville
The median household income in Northville is $113,750, with the highest median household income of $175,536 found in the 45 to 64 years age bracket for the primary householder. A total of 24 households (46.2%) fall into this category.
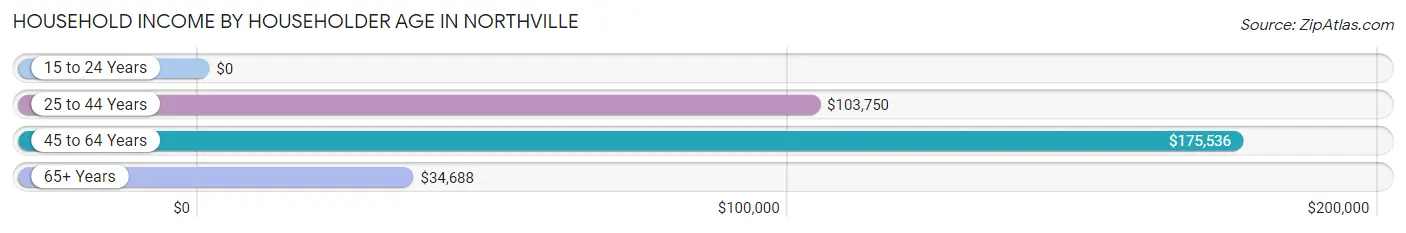
| Income Bracket | # Households | Median Income |
| 15 to 24 Years | 0 (0.0%) | $0 |
| 25 to 44 Years | 17 (32.7%) | $103,750 |
| 45 to 64 Years | 24 (46.2%) | $175,536 |
| 65+ Years | 11 (21.1%) | $34,688 |
| Total | 52 (100.0%) | $113,750 |
Poverty in Northville
Income Below Poverty by Sex and Age in Northville
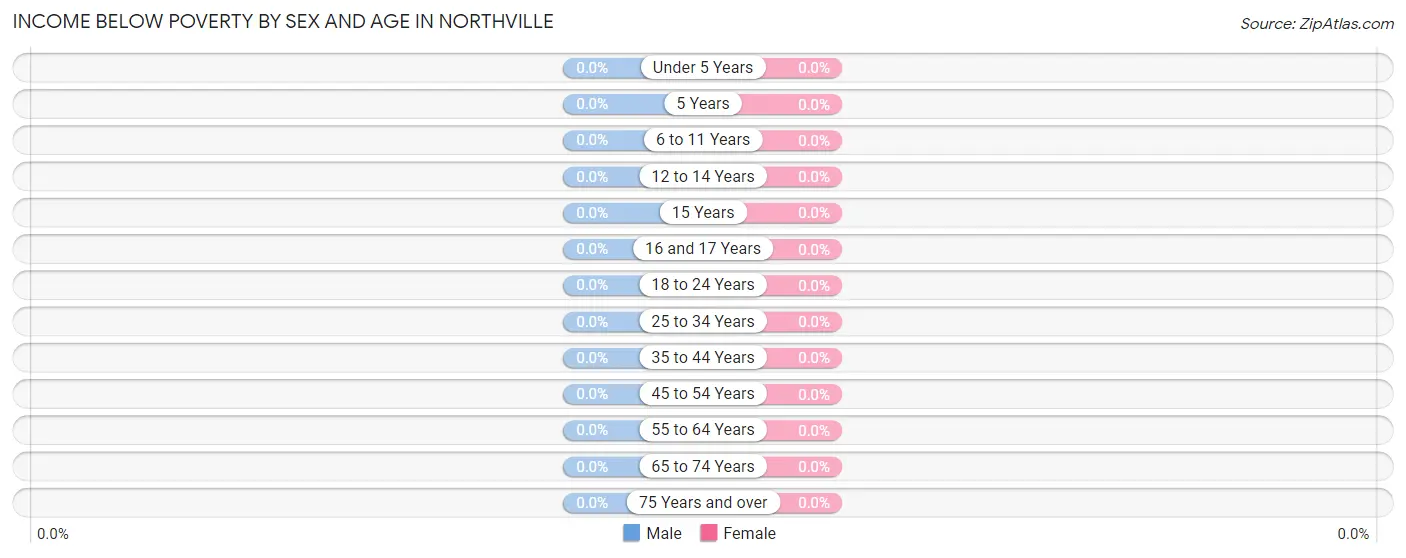
| Age Bracket | Male | Female |
| Under 5 Years | 0 (0.0%) | 0 (0.0%) |
| 5 Years | 0 (0.0%) | 0 (0.0%) |
| 6 to 11 Years | 0 (0.0%) | 0 (0.0%) |
| 12 to 14 Years | 0 (0.0%) | 0 (0.0%) |
| 15 Years | 0 (0.0%) | 0 (0.0%) |
| 16 and 17 Years | 0 (0.0%) | 0 (0.0%) |
| 18 to 24 Years | 0 (0.0%) | 0 (0.0%) |
| 25 to 34 Years | 0 (0.0%) | 0 (0.0%) |
| 35 to 44 Years | 0 (0.0%) | 0 (0.0%) |
| 45 to 54 Years | 0 (0.0%) | 0 (0.0%) |
| 55 to 64 Years | 0 (0.0%) | 0 (0.0%) |
| 65 to 74 Years | 0 (0.0%) | 0 (0.0%) |
| 75 Years and over | 0 (0.0%) | 0 (0.0%) |
| Total | 0 (0.0%) | 0 (0.0%) |
Income Above Poverty by Sex and Age in Northville
According to the poverty statistics in Northville, males aged under 5 years and females aged under 5 years are the age groups that are most secure financially, with 100.0% of males and 100.0% of females in these age groups living above the poverty line.
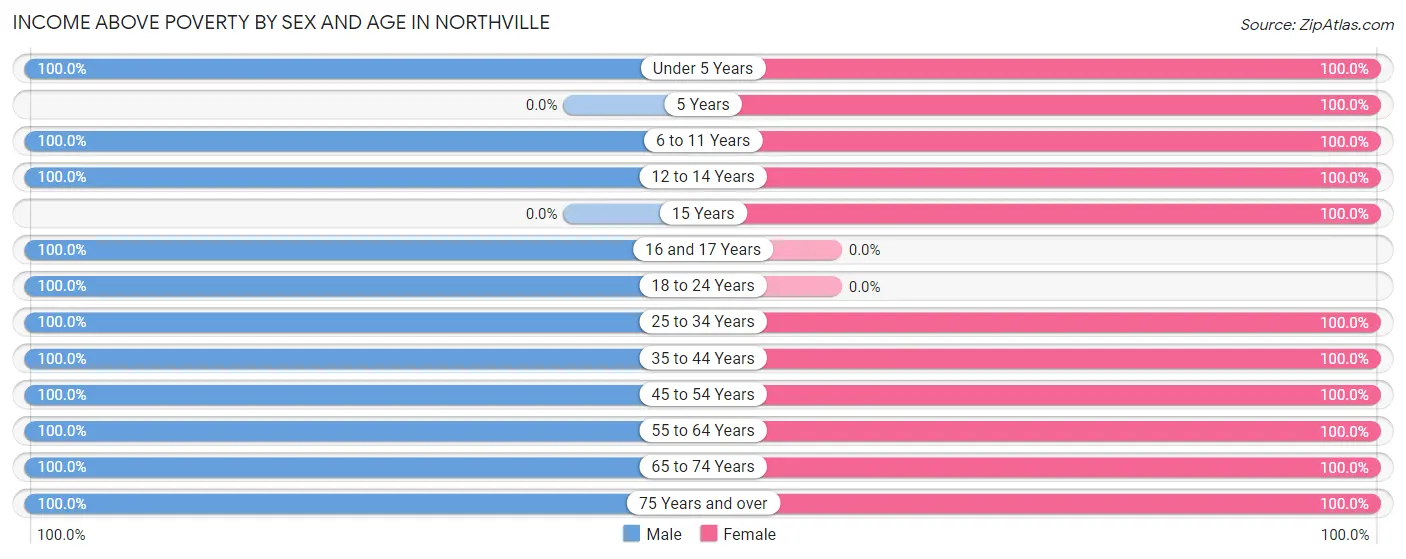
| Age Bracket | Male | Female |
| Under 5 Years | 5 (100.0%) | 2 (100.0%) |
| 5 Years | 0 (0.0%) | 2 (100.0%) |
| 6 to 11 Years | 2 (100.0%) | 25 (100.0%) |
| 12 to 14 Years | 15 (100.0%) | 8 (100.0%) |
| 15 Years | 0 (0.0%) | 2 (100.0%) |
| 16 and 17 Years | 3 (100.0%) | 0 (0.0%) |
| 18 to 24 Years | 2 (100.0%) | 0 (0.0%) |
| 25 to 34 Years | 2 (100.0%) | 7 (100.0%) |
| 35 to 44 Years | 11 (100.0%) | 10 (100.0%) |
| 45 to 54 Years | 20 (100.0%) | 19 (100.0%) |
| 55 to 64 Years | 5 (100.0%) | 3 (100.0%) |
| 65 to 74 Years | 1 (100.0%) | 2 (100.0%) |
| 75 Years and over | 3 (100.0%) | 6 (100.0%) |
| Total | 69 (100.0%) | 86 (100.0%) |
Income Below Poverty Among Married-Couple Families in Northville
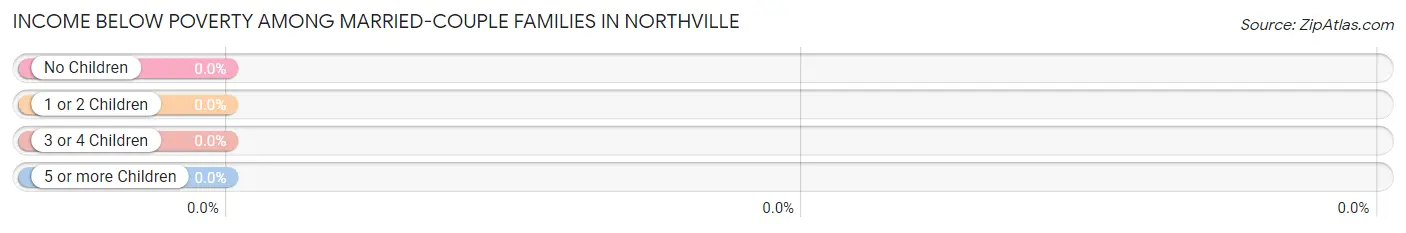
| Children | Above Poverty | Below Poverty |
| No Children | 11 (100.0%) | 0 (0.0%) |
| 1 or 2 Children | 22 (100.0%) | 0 (0.0%) |
| 3 or 4 Children | 3 (100.0%) | 0 (0.0%) |
| 5 or more Children | 0 (0.0%) | 0 (0.0%) |
| Total | 36 (100.0%) | 0 (0.0%) |
Income Below Poverty Among Single-Parent Households in Northville
| Children | Single Father | Single Mother |
| No Children | 0 (0.0%) | 0 (0.0%) |
| 1 or 2 Children | 0 (0.0%) | 0 (0.0%) |
| 3 or 4 Children | 0 (0.0%) | 0 (0.0%) |
| 5 or more Children | 0 (0.0%) | 0 (0.0%) |
| Total | 0 (0.0%) | 0 (0.0%) |
Income Below Poverty Among Married-Couple vs Single-Parent Households in Northville
| Children | Married-Couple Families | Single-Parent Households |
| No Children | 0 (0.0%) | 0 (0.0%) |
| 1 or 2 Children | 0 (0.0%) | 0 (0.0%) |
| 3 or 4 Children | 0 (0.0%) | 0 (0.0%) |
| 5 or more Children | 0 (0.0%) | 0 (0.0%) |
| Total | 0 (0.0%) | 0 (0.0%) |
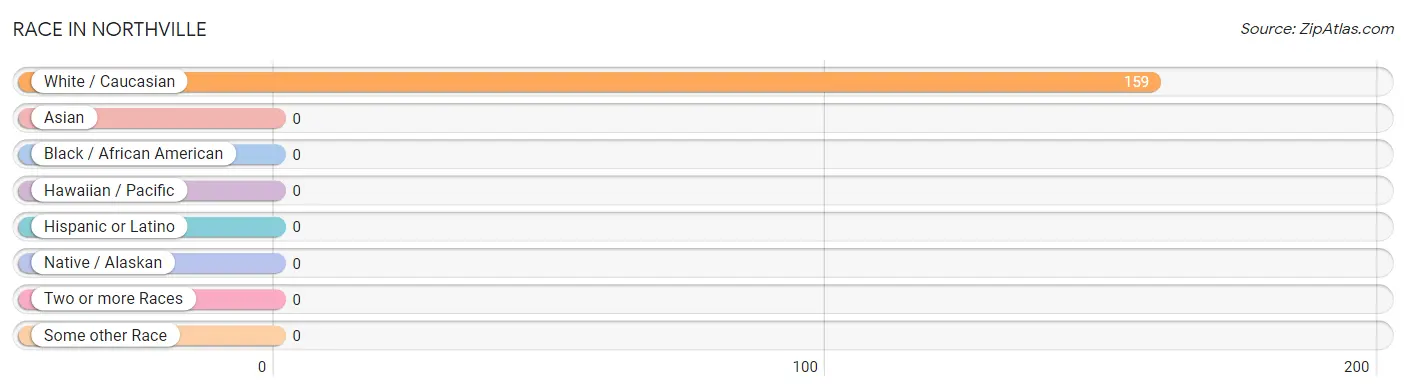
Race in Northville
The most populous races in Northville are , and White / Caucasian (159 | 100.0%).
| Race | # Population | % Population |
| Asian | 0 | 0.0% |
| Black / African American | 0 | 0.0% |
| Hawaiian / Pacific | 0 | 0.0% |
| Hispanic or Latino | 0 | 0.0% |
| Native / Alaskan | 0 | 0.0% |
| White / Caucasian | 159 | 100.0% |
| Two or more Races | 0 | 0.0% |
| Some other Race | 0 | 0.0% |
| Total | 159 | 100.0% |
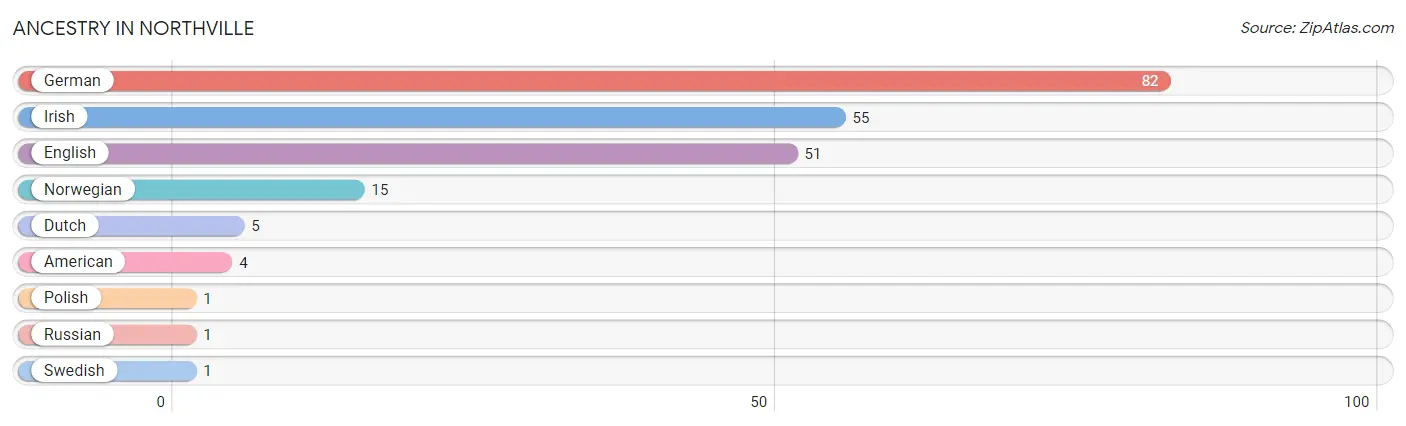
Ancestry in Northville
The most populous ancestries reported in Northville are German (82 | 51.6%), Irish (55 | 34.6%), English (51 | 32.1%), Norwegian (15 | 9.4%), and Dutch (5 | 3.1%), together accounting for 130.8% of all Northville residents.
| Ancestry | # Population | % Population |
| American | 4 | 2.5% |
| Dutch | 5 | 3.1% |
| English | 51 | 32.1% |
| German | 82 | 51.6% |
| Irish | 55 | 34.6% |
| Norwegian | 15 | 9.4% |
| Polish | 1 | 0.6% |
| Russian | 1 | 0.6% |
| Swedish | 1 | 0.6% | View All 9 Rows |
Immigrants in Northville

| Immigration Origin | # Population | % Population | View All 0 Rows |
Sex and Age in Northville
Sex and Age in Northville
The most populous age groups in Northville are 10 to 14 Years (17 | 24.6%) for men and 10 to 14 Years (32 | 35.6%) for women.
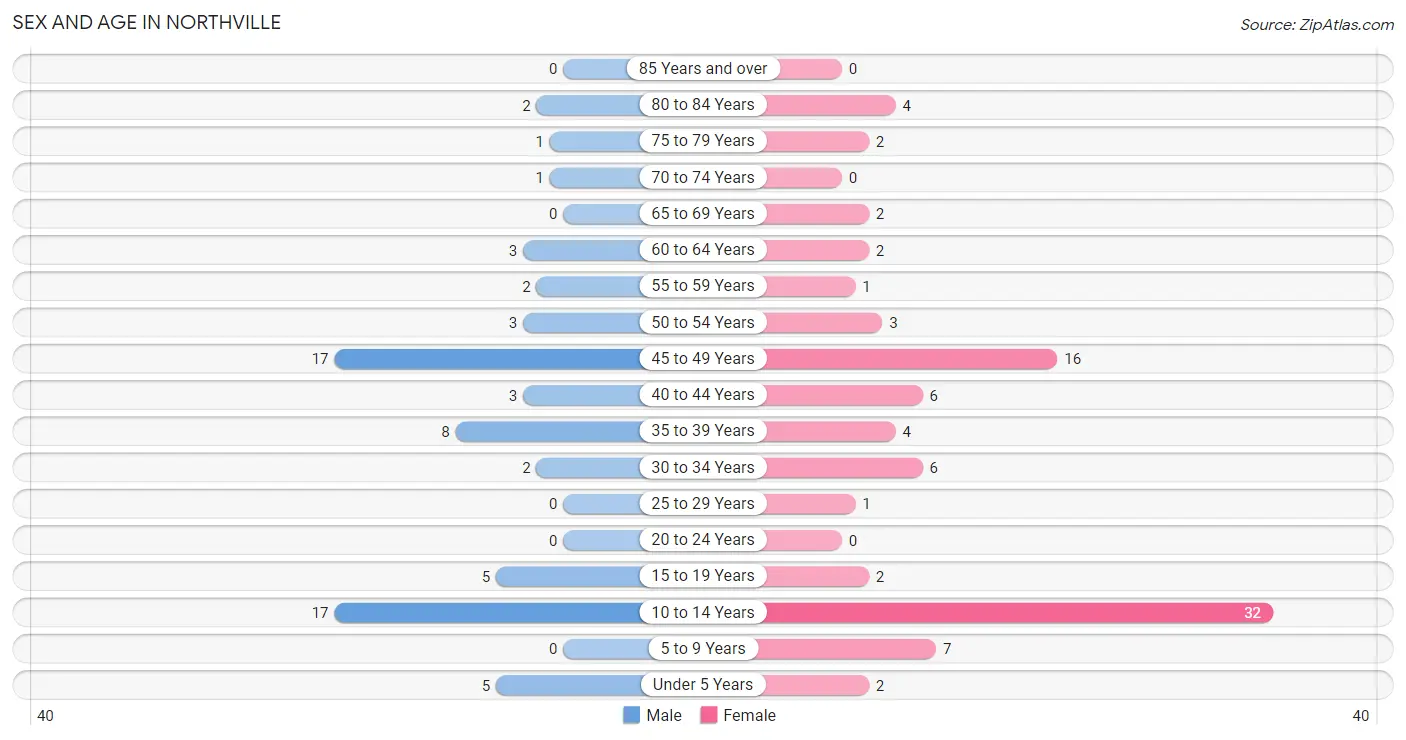
| Age Bracket | Male | Female |
| Under 5 Years | 5 (7.2%) | 2 (2.2%) |
| 5 to 9 Years | 0 (0.0%) | 7 (7.8%) |
| 10 to 14 Years | 17 (24.6%) | 32 (35.6%) |
| 15 to 19 Years | 5 (7.2%) | 2 (2.2%) |
| 20 to 24 Years | 0 (0.0%) | 0 (0.0%) |
| 25 to 29 Years | 0 (0.0%) | 1 (1.1%) |
| 30 to 34 Years | 2 (2.9%) | 6 (6.7%) |
| 35 to 39 Years | 8 (11.6%) | 4 (4.4%) |
| 40 to 44 Years | 3 (4.3%) | 6 (6.7%) |
| 45 to 49 Years | 17 (24.6%) | 16 (17.8%) |
| 50 to 54 Years | 3 (4.3%) | 3 (3.3%) |
| 55 to 59 Years | 2 (2.9%) | 1 (1.1%) |
| 60 to 64 Years | 3 (4.3%) | 2 (2.2%) |
| 65 to 69 Years | 0 (0.0%) | 2 (2.2%) |
| 70 to 74 Years | 1 (1.5%) | 0 (0.0%) |
| 75 to 79 Years | 1 (1.5%) | 2 (2.2%) |
| 80 to 84 Years | 2 (2.9%) | 4 (4.4%) |
| 85 Years and over | 0 (0.0%) | 0 (0.0%) |
| Total | 69 (100.0%) | 90 (100.0%) |
Families and Households in Northville
Median Family Size in Northville
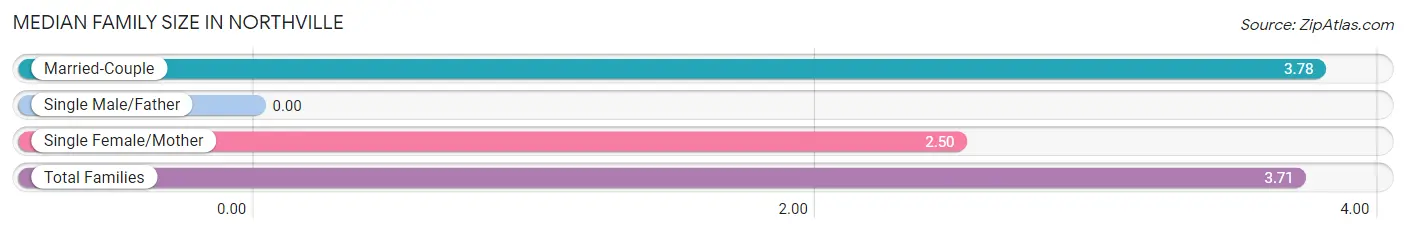
| Family Type | # Families | Family Size |
| Married-Couple | 36 (94.7%) | 3.78 |
| Single Male/Father | 0 (0.0%) | - |
| Single Female/Mother | 2 (5.3%) | 2.50 |
| Total Families | 38 (100.0%) | 3.71 |
Median Household Size in Northville
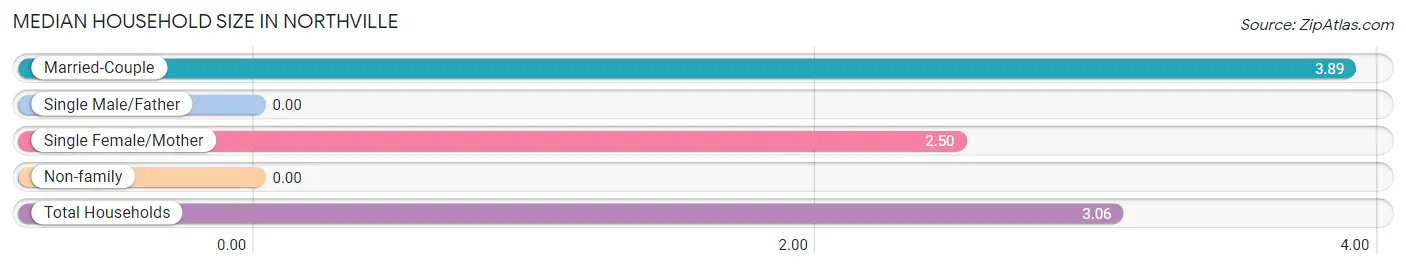
| Household Type | # Households | Household Size |
| Married-Couple | 36 (69.2%) | 3.89 |
| Single Male/Father | 0 (0.0%) | - |
| Single Female/Mother | 2 (3.8%) | 2.50 |
| Non-family | 14 (26.9%) | - |
| Total Households | 52 (100.0%) | 3.06 |
Household Size by Marriage Status in Northville
Out of a total of 52 households in Northville, 38 (73.1%) are family households, while 14 (26.9%) are nonfamily households. The most numerous type of family households are 4-person households, comprising 23, and the most common type of nonfamily households are 1-person households, comprising 14.
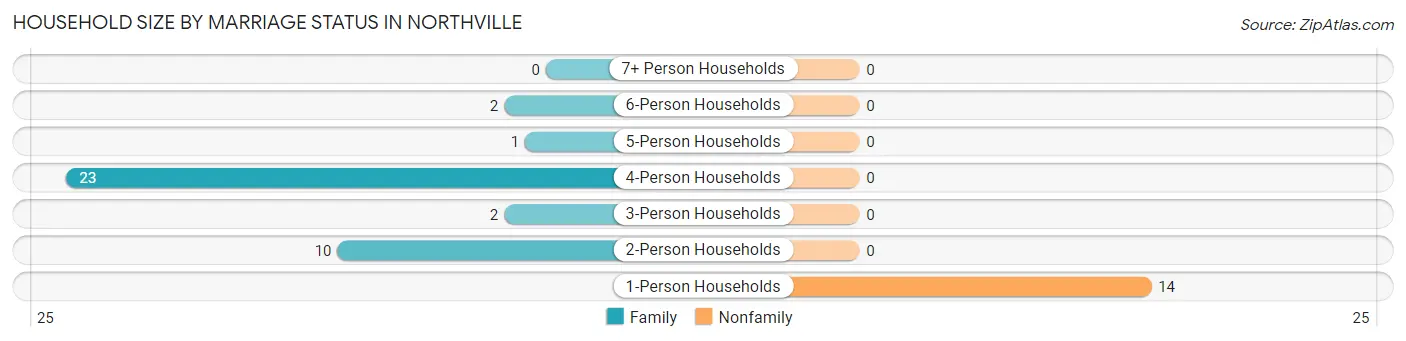
| Household Size | Family Households | Nonfamily Households |
| 1-Person Households | - | 14 (26.9%) |
| 2-Person Households | 10 (19.2%) | 0 (0.0%) |
| 3-Person Households | 2 (3.8%) | 0 (0.0%) |
| 4-Person Households | 23 (44.2%) | 0 (0.0%) |
| 5-Person Households | 1 (1.9%) | 0 (0.0%) |
| 6-Person Households | 2 (3.8%) | 0 (0.0%) |
| 7+ Person Households | 0 (0.0%) | 0 (0.0%) |
| Total | 38 (73.1%) | 14 (26.9%) |
Female Fertility in Northville
Fertility by Age in Northville
Average fertility rate in Northville is 29.0 births per 1,000 women. Women in the age bracket of 35 to 50 years have the highest fertility rate with 38.0 births per 1,000 women. Women in the age bracket of 35 to 50 years acount for 100.0% of all women with births.
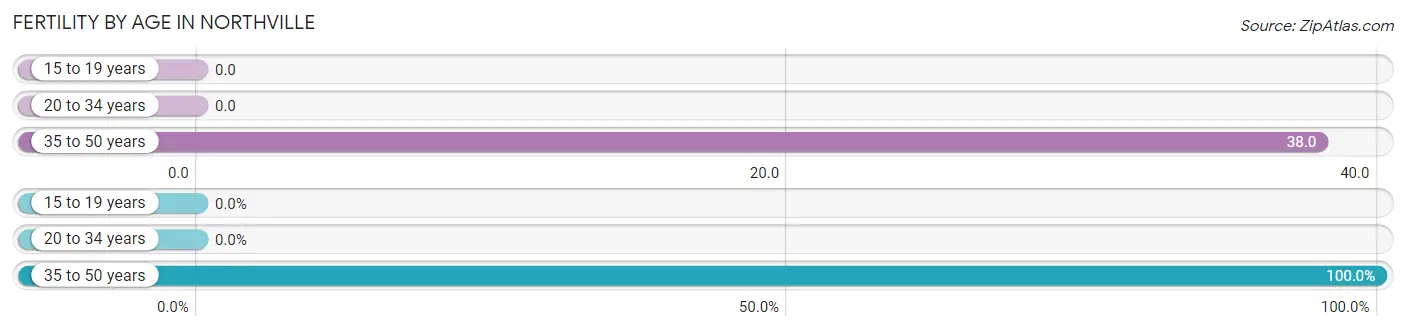
| Age Bracket | Women with Births | Births / 1,000 Women |
| 15 to 19 years | 0 (0.0%) | 0.0 |
| 20 to 34 years | 0 (0.0%) | 0.0 |
| 35 to 50 years | 1 (100.0%) | 38.0 |
| Total | 1 (100.0%) | 29.0 |
Fertility by Age by Marriage Status in Northville
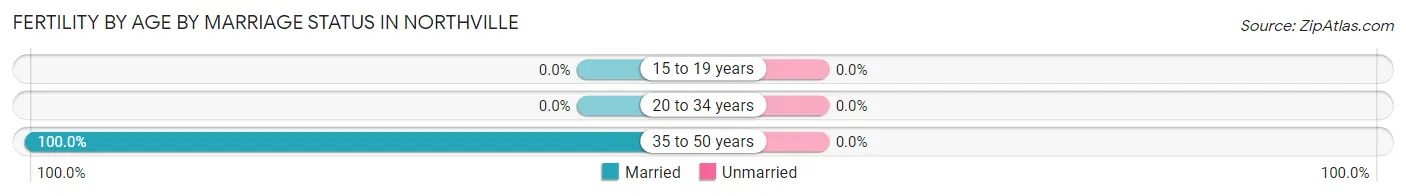
| Age Bracket | Married | Unmarried |
| 15 to 19 years | 0 (0.0%) | 0 (0.0%) |
| 20 to 34 years | 0 (0.0%) | 0 (0.0%) |
| 35 to 50 years | 1 (100.0%) | 0 (0.0%) |
| Total | 1 (100.0%) | 0 (0.0%) |
Fertility by Education in Northville
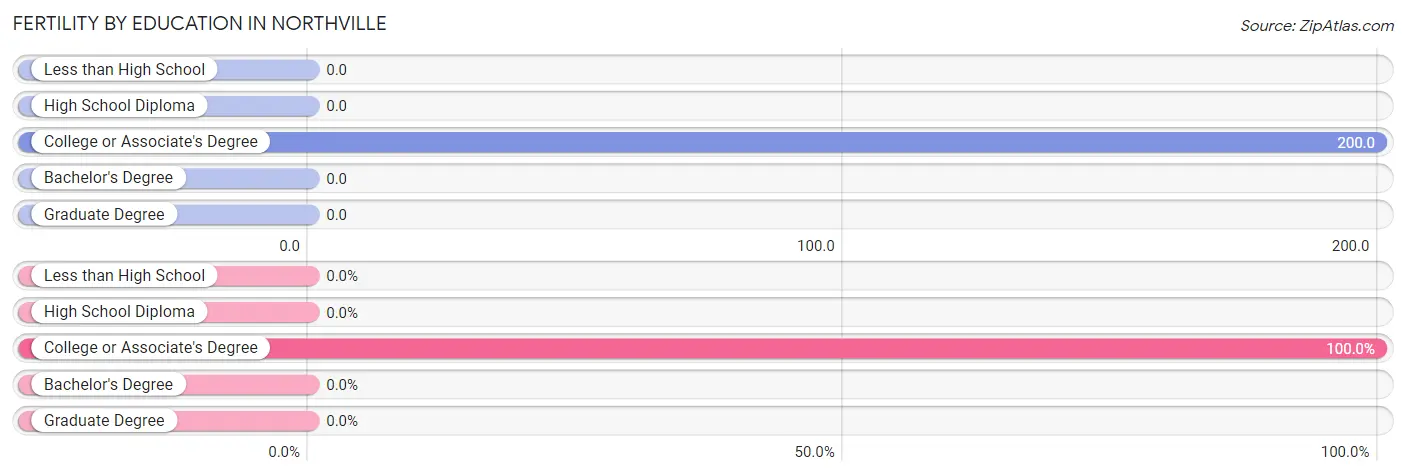
| Educational Attainment | Women with Births | Births / 1,000 Women |
| Less than High School | 0 (0.0%) | 0.0 |
| High School Diploma | 0 (0.0%) | 0.0 |
| College or Associate's Degree | 1 (100.0%) | 200.0 |
| Bachelor's Degree | 0 (0.0%) | 0.0 |
| Graduate Degree | 0 (0.0%) | 0.0 |
| Total | 1 (100.0%) | 29.0 |
Fertility by Education by Marriage Status in Northville
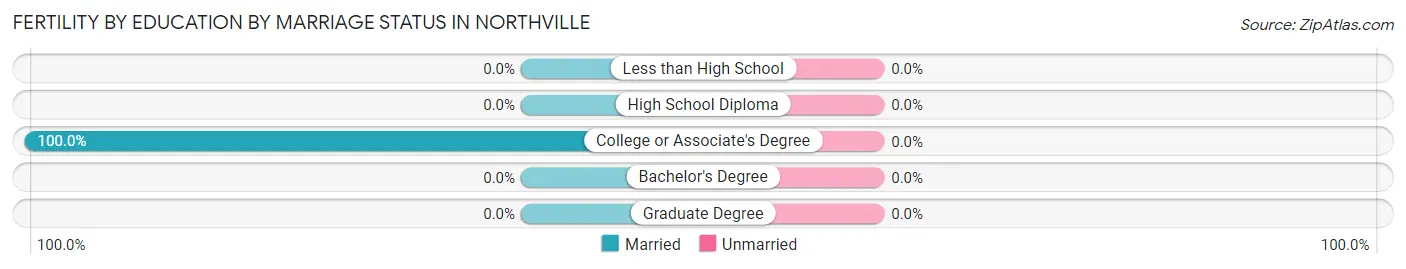
| Educational Attainment | Married | Unmarried |
| Less than High School | 0 (0.0%) | 0 (0.0%) |
| High School Diploma | 0 (0.0%) | 0 (0.0%) |
| College or Associate's Degree | 1 (100.0%) | 0 (0.0%) |
| Bachelor's Degree | 0 (0.0%) | 0 (0.0%) |
| Graduate Degree | 0 (0.0%) | 0 (0.0%) |
| Total | 1 (100.0%) | 0 (0.0%) |
Employment Characteristics in Northville
Employment by Class of Employer in Northville
Among the 79 employed individuals in Northville, private company employees (51 | 64.6%), self-employed (not incorporated) (14 | 17.7%), and local government employees (5 | 6.3%) make up the most common classes of employment.
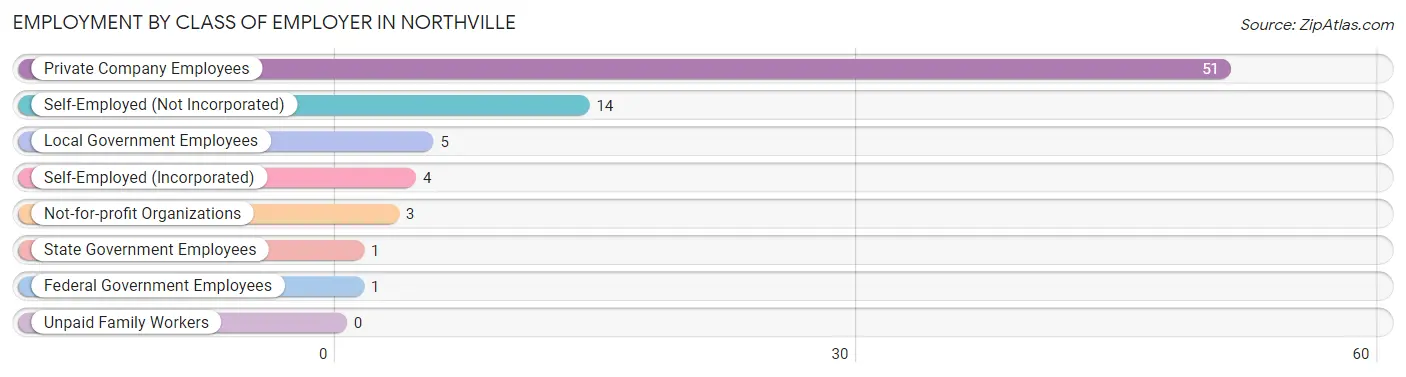
| Employer Class | # Employees | % Employees |
| Private Company Employees | 51 | 64.6% |
| Self-Employed (Incorporated) | 4 | 5.1% |
| Self-Employed (Not Incorporated) | 14 | 17.7% |
| Not-for-profit Organizations | 3 | 3.8% |
| Local Government Employees | 5 | 6.3% |
| State Government Employees | 1 | 1.3% |
| Federal Government Employees | 1 | 1.3% |
| Unpaid Family Workers | 0 | 0.0% |
| Total | 79 | 100.0% |
Employment Status by Age in Northville
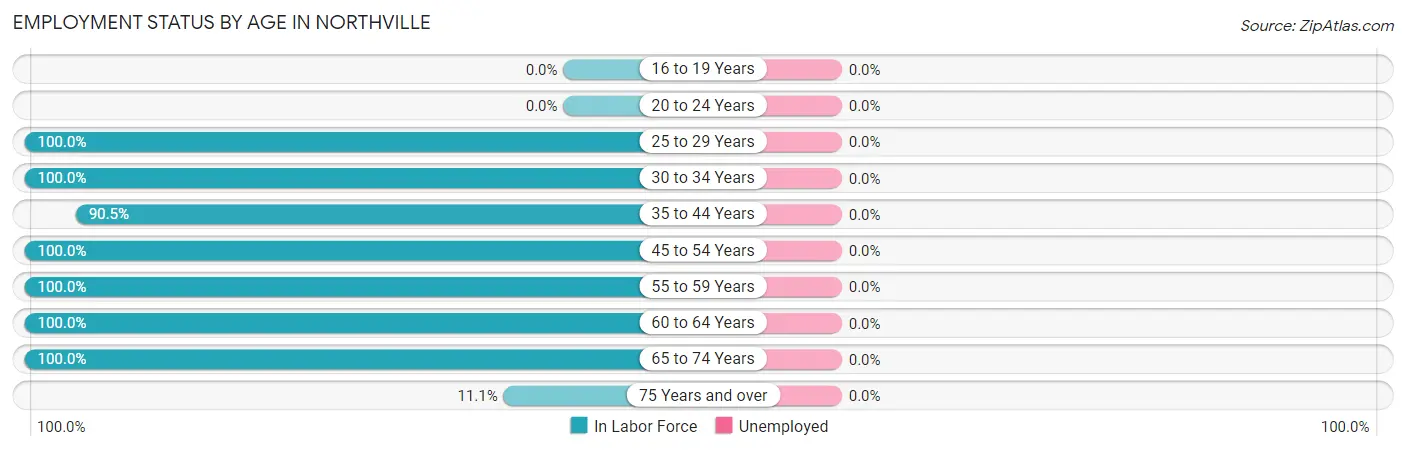
| Age Bracket | In Labor Force | Unemployed |
| 16 to 19 Years | 0 (0.0%) | 0 (0.0%) |
| 20 to 24 Years | 0 (0.0%) | 0 (0.0%) |
| 25 to 29 Years | 1 (100.0%) | 0 (0.0%) |
| 30 to 34 Years | 8 (100.0%) | 0 (0.0%) |
| 35 to 44 Years | 19 (90.5%) | 0 (0.0%) |
| 45 to 54 Years | 39 (100.0%) | 0 (0.0%) |
| 55 to 59 Years | 3 (100.0%) | 0 (0.0%) |
| 60 to 64 Years | 5 (100.0%) | 0 (0.0%) |
| 65 to 74 Years | 3 (100.0%) | 0 (0.0%) |
| 75 Years and over | 1 (11.1%) | 0 (0.0%) |
| Total | 79 (84.0%) | 0 (0.0%) |
Employment Status by Educational Attainment in Northville
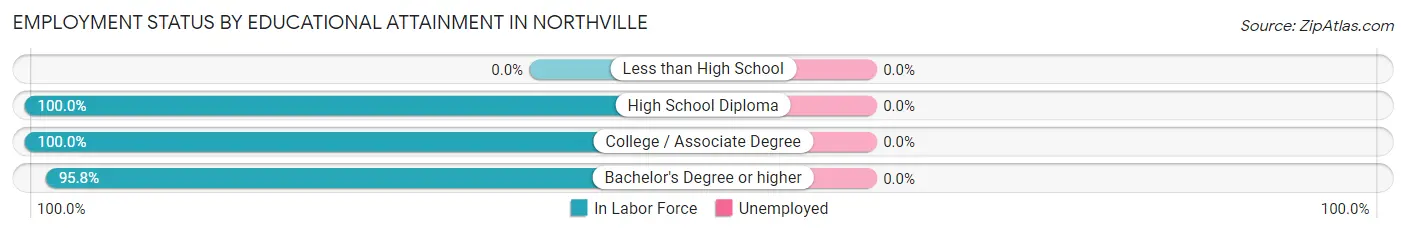
| Educational Attainment | In Labor Force | Unemployed |
| Less than High School | 0 (0.0%) | 0 (0.0%) |
| High School Diploma | 12 (100.0%) | 0 (0.0%) |
| College / Associate Degree | 17 (100.0%) | 0 (0.0%) |
| Bachelor's Degree or higher | 46 (95.8%) | 0 (0.0%) |
| Total | 75 (97.4%) | 0 (0.0%) |
Employment Occupations by Sex in Northville
Management, Business, Science and Arts Occupations
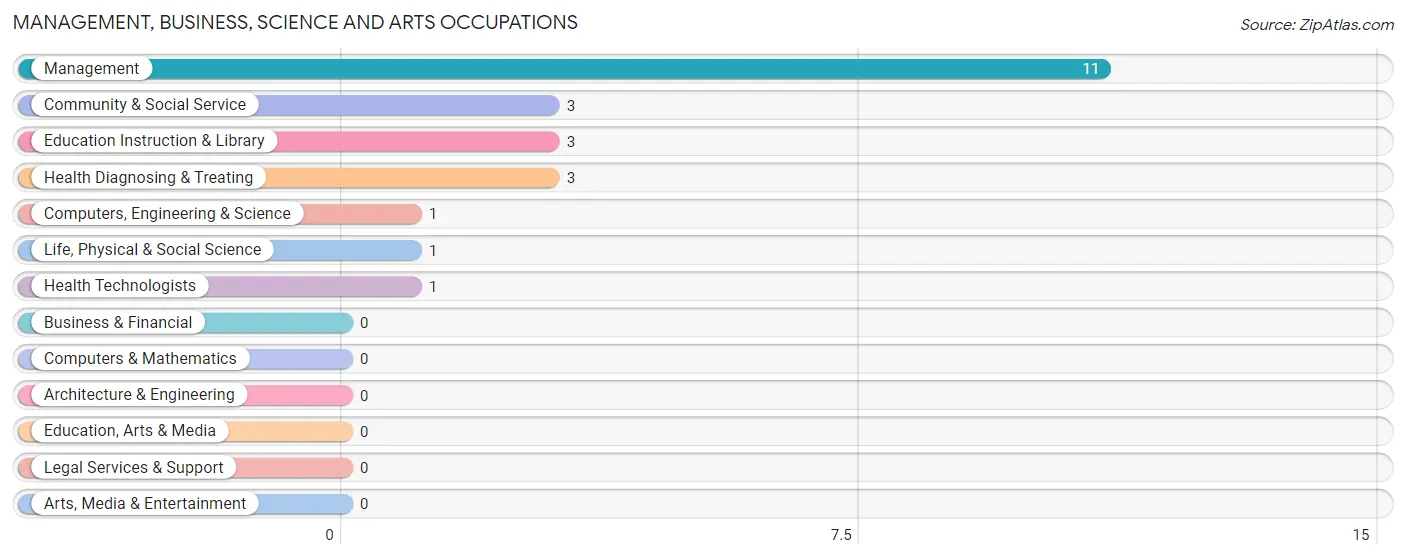
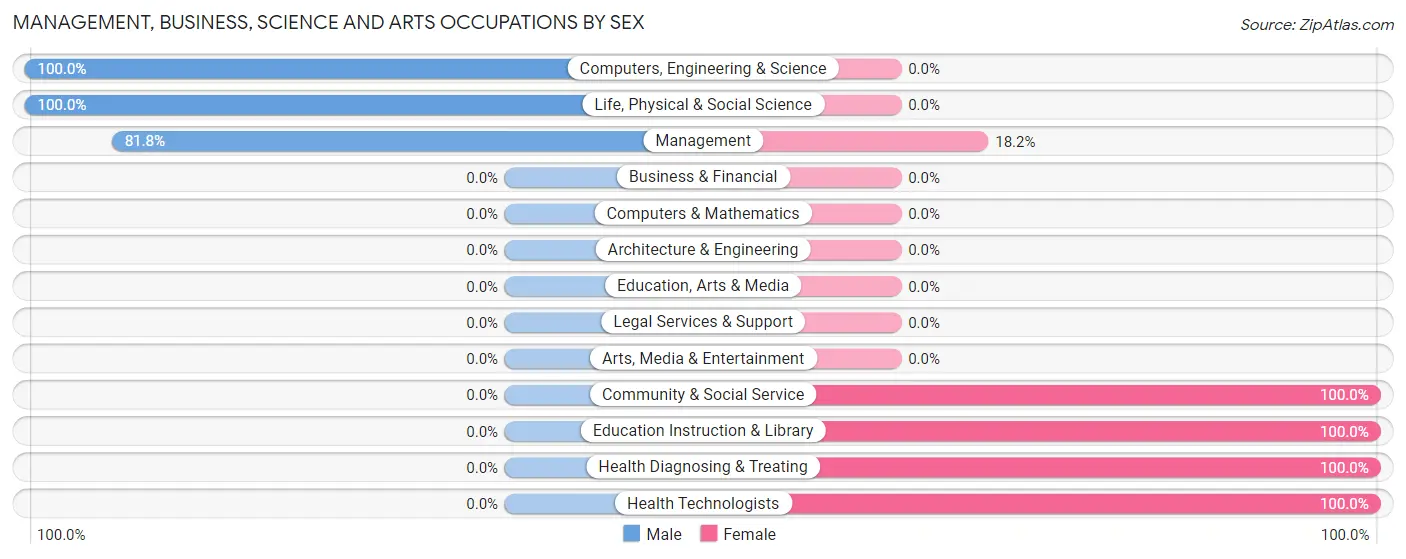
The most common Management, Business, Science and Arts occupations in Northville are Management (11 | 13.9%), Community & Social Service (3 | 3.8%), Education Instruction & Library (3 | 3.8%), Health Diagnosing & Treating (3 | 3.8%), and Computers, Engineering & Science (1 | 1.3%).
Management, Business, Science and Arts Occupations by Sex
Within the Management, Business, Science and Arts occupations in Northville, the most male-oriented occupations are Computers, Engineering & Science (100.0%), Life, Physical & Social Science (100.0%), and Management (81.8%), while the most female-oriented occupations are Community & Social Service (100.0%), Education Instruction & Library (100.0%), and Health Diagnosing & Treating (100.0%).
| Occupation | Male | Female |
| Management | 9 (81.8%) | 2 (18.2%) |
| Business & Financial | 0 (0.0%) | 0 (0.0%) |
| Computers, Engineering & Science | 1 (100.0%) | 0 (0.0%) |
| Computers & Mathematics | 0 (0.0%) | 0 (0.0%) |
| Architecture & Engineering | 0 (0.0%) | 0 (0.0%) |
| Life, Physical & Social Science | 1 (100.0%) | 0 (0.0%) |
| Community & Social Service | 0 (0.0%) | 3 (100.0%) |
| Education, Arts & Media | 0 (0.0%) | 0 (0.0%) |
| Legal Services & Support | 0 (0.0%) | 0 (0.0%) |
| Education Instruction & Library | 0 (0.0%) | 3 (100.0%) |
| Arts, Media & Entertainment | 0 (0.0%) | 0 (0.0%) |
| Health Diagnosing & Treating | 0 (0.0%) | 3 (100.0%) |
| Health Technologists | 0 (0.0%) | 1 (100.0%) |
| Total (Category) | 10 (55.6%) | 8 (44.4%) |
| Total (Overall) | 40 (50.6%) | 39 (49.4%) |
Services Occupations
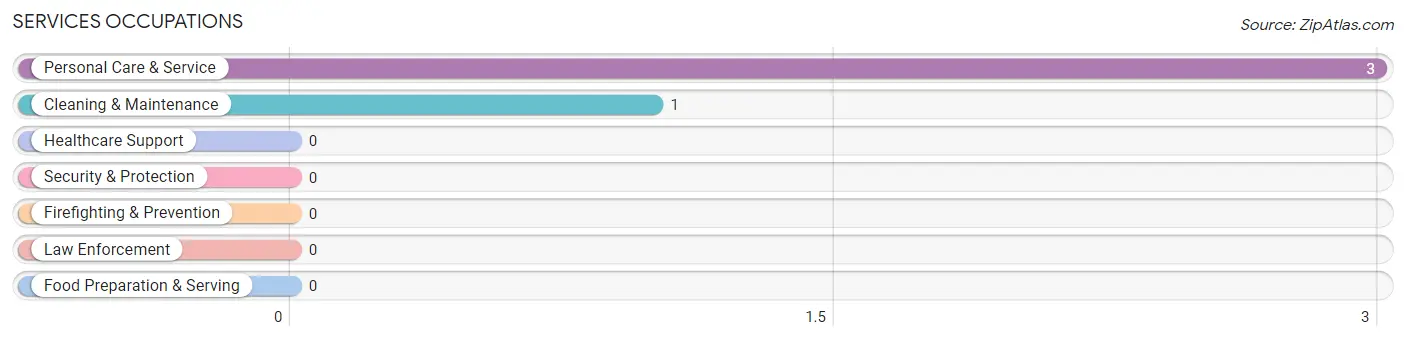
The most common Services occupations in Northville are Personal Care & Service (3 | 3.8%), and Cleaning & Maintenance (1 | 1.3%).
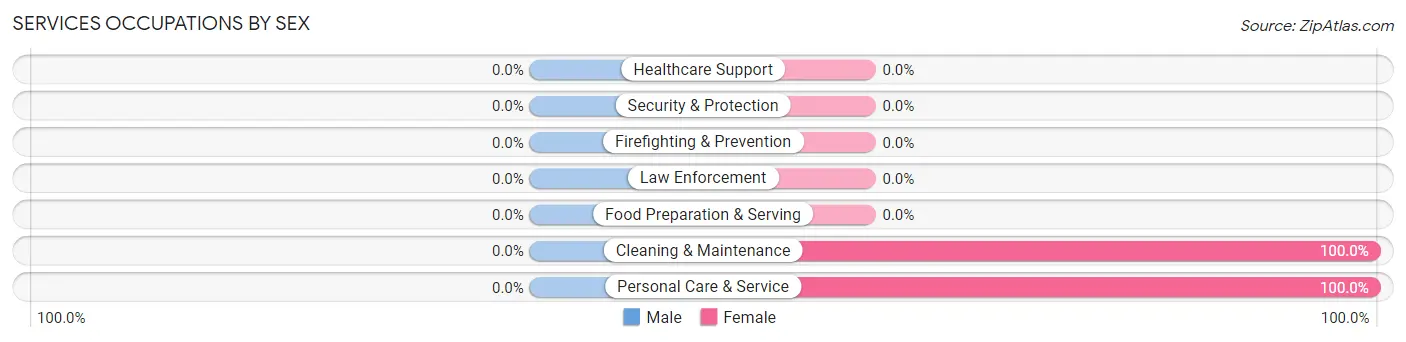
Services Occupations by Sex
| Occupation | Male | Female |
| Healthcare Support | 0 (0.0%) | 0 (0.0%) |
| Security & Protection | 0 (0.0%) | 0 (0.0%) |
| Firefighting & Prevention | 0 (0.0%) | 0 (0.0%) |
| Law Enforcement | 0 (0.0%) | 0 (0.0%) |
| Food Preparation & Serving | 0 (0.0%) | 0 (0.0%) |
| Cleaning & Maintenance | 0 (0.0%) | 1 (100.0%) |
| Personal Care & Service | 0 (0.0%) | 3 (100.0%) |
| Total (Category) | 0 (0.0%) | 4 (100.0%) |
| Total (Overall) | 40 (50.6%) | 39 (49.4%) |
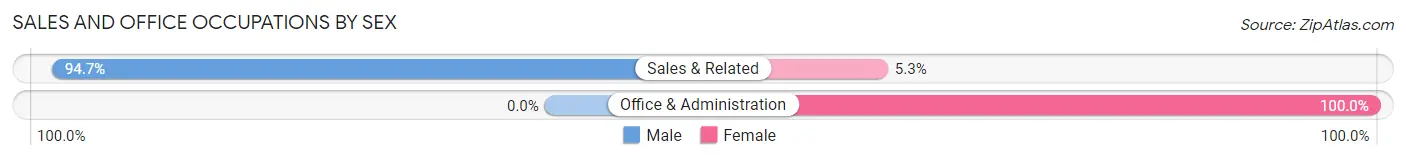
Sales and Office Occupations
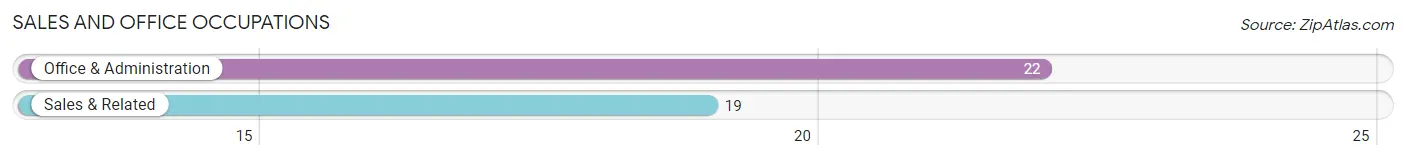
The most common Sales and Office occupations in Northville are Office & Administration (22 | 27.9%), and Sales & Related (19 | 24.0%).
Sales and Office Occupations by Sex
| Occupation | Male | Female |
| Sales & Related | 18 (94.7%) | 1 (5.3%) |
| Office & Administration | 0 (0.0%) | 22 (100.0%) |
| Total (Category) | 18 (43.9%) | 23 (56.1%) |
| Total (Overall) | 40 (50.6%) | 39 (49.4%) |
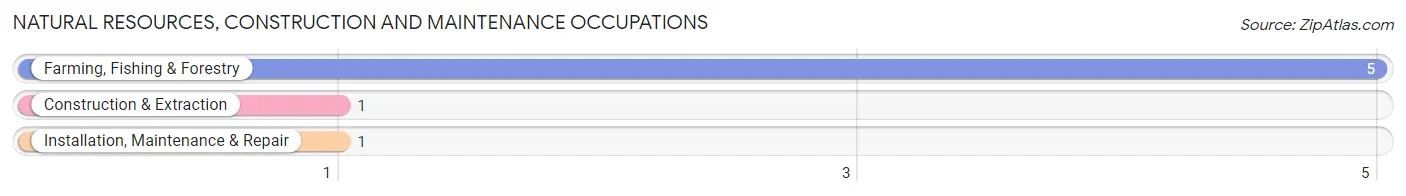
Natural Resources, Construction and Maintenance Occupations
The most common Natural Resources, Construction and Maintenance occupations in Northville are Farming, Fishing & Forestry (5 | 6.3%), Construction & Extraction (1 | 1.3%), and Installation, Maintenance & Repair (1 | 1.3%).
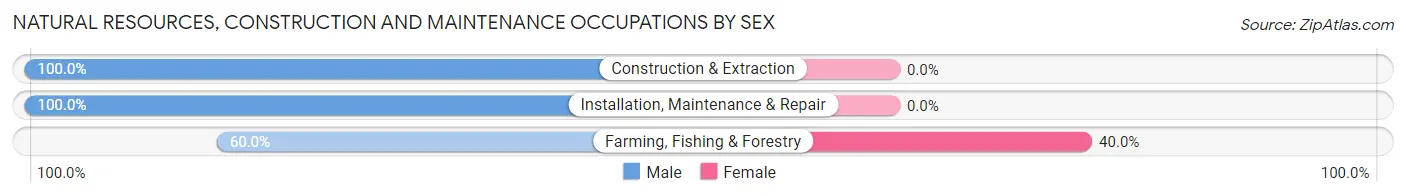
Natural Resources, Construction and Maintenance Occupations by Sex
| Occupation | Male | Female |
| Farming, Fishing & Forestry | 3 (60.0%) | 2 (40.0%) |
| Construction & Extraction | 1 (100.0%) | 0 (0.0%) |
| Installation, Maintenance & Repair | 1 (100.0%) | 0 (0.0%) |
| Total (Category) | 5 (71.4%) | 2 (28.6%) |
| Total (Overall) | 40 (50.6%) | 39 (49.4%) |
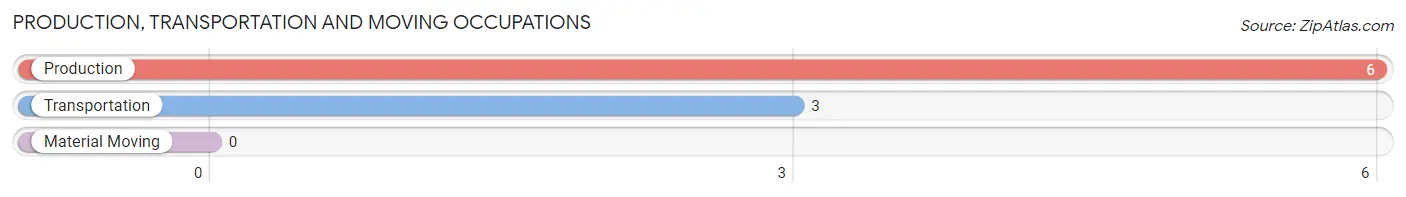
Production, Transportation and Moving Occupations
The most common Production, Transportation and Moving occupations in Northville are Production (6 | 7.6%), and Transportation (3 | 3.8%).
Production, Transportation and Moving Occupations by Sex
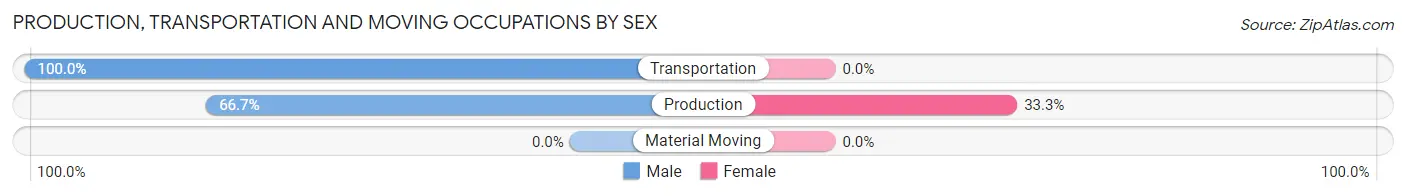
| Occupation | Male | Female |
| Production | 4 (66.7%) | 2 (33.3%) |
| Transportation | 3 (100.0%) | 0 (0.0%) |
| Material Moving | 0 (0.0%) | 0 (0.0%) |
| Total (Category) | 7 (77.8%) | 2 (22.2%) |
| Total (Overall) | 40 (50.6%) | 39 (49.4%) |
Employment Industries by Sex in Northville
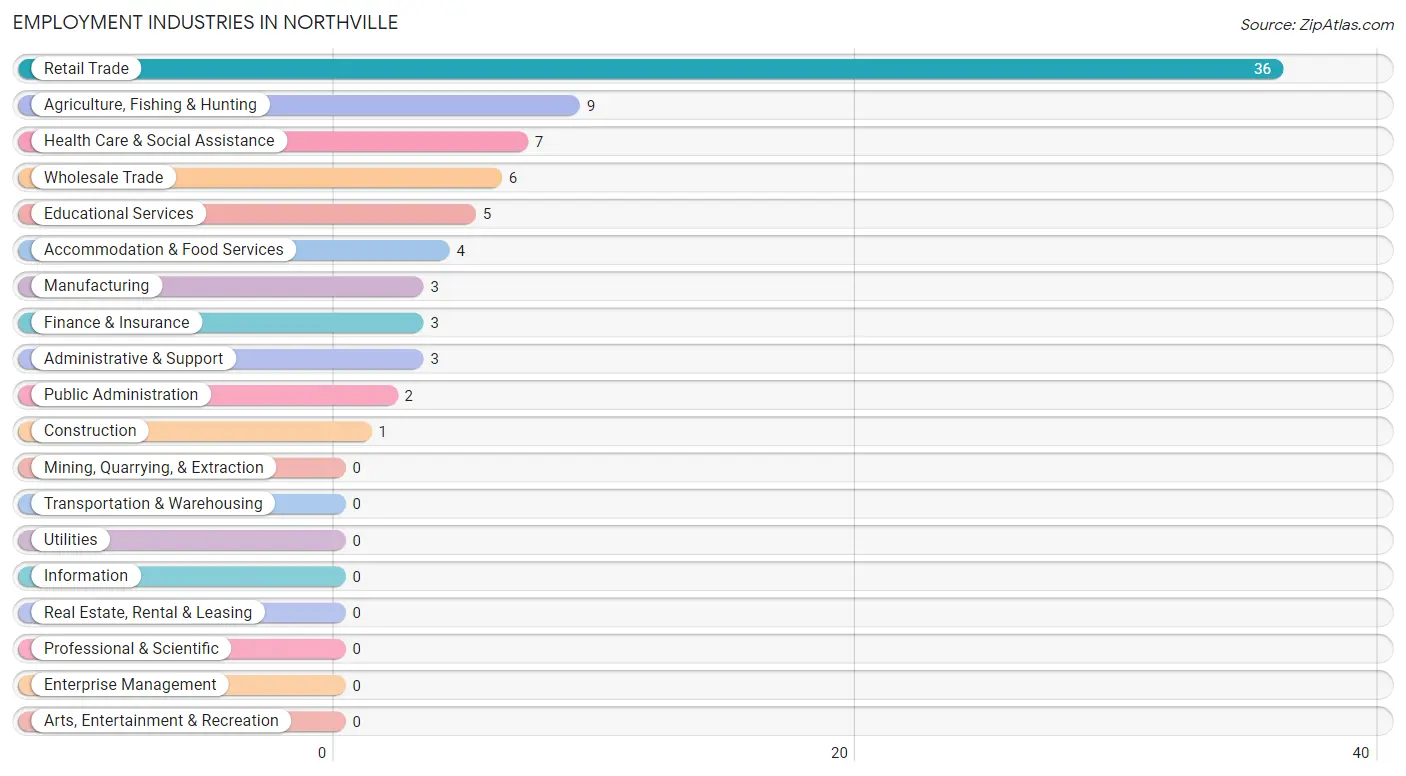
Employment Industries in Northville
The major employment industries in Northville include Retail Trade (36 | 45.6%), Agriculture, Fishing & Hunting (9 | 11.4%), Health Care & Social Assistance (7 | 8.9%), Wholesale Trade (6 | 7.6%), and Educational Services (5 | 6.3%).
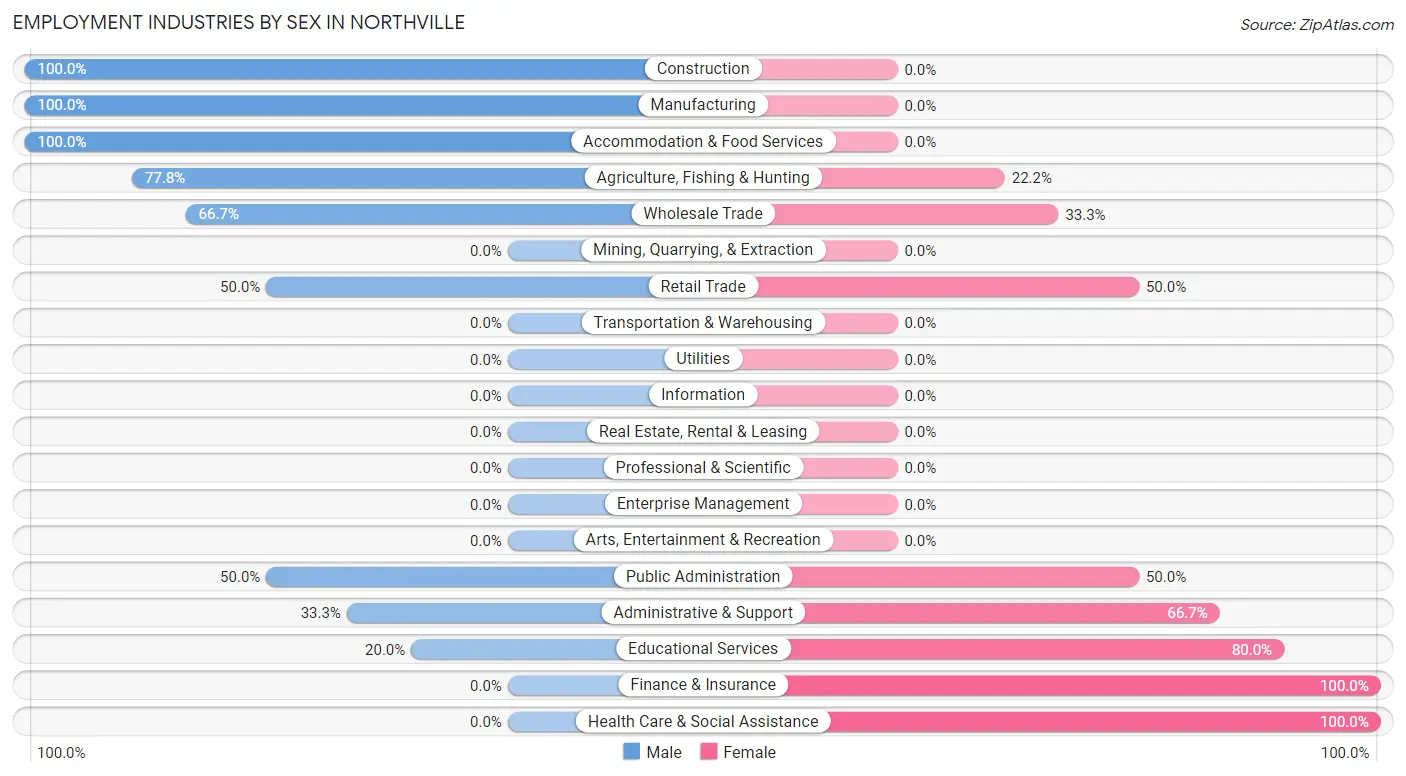
Employment Industries by Sex in Northville
The Northville industries that see more men than women are Construction (100.0%), Manufacturing (100.0%), and Accommodation & Food Services (100.0%), whereas the industries that tend to have a higher number of women are Finance & Insurance (100.0%), Health Care & Social Assistance (100.0%), and Educational Services (80.0%).
| Industry | Male | Female |
| Agriculture, Fishing & Hunting | 7 (77.8%) | 2 (22.2%) |
| Mining, Quarrying, & Extraction | 0 (0.0%) | 0 (0.0%) |
| Construction | 1 (100.0%) | 0 (0.0%) |
| Manufacturing | 3 (100.0%) | 0 (0.0%) |
| Wholesale Trade | 4 (66.7%) | 2 (33.3%) |
| Retail Trade | 18 (50.0%) | 18 (50.0%) |
| Transportation & Warehousing | 0 (0.0%) | 0 (0.0%) |
| Utilities | 0 (0.0%) | 0 (0.0%) |
| Information | 0 (0.0%) | 0 (0.0%) |
| Finance & Insurance | 0 (0.0%) | 3 (100.0%) |
| Real Estate, Rental & Leasing | 0 (0.0%) | 0 (0.0%) |
| Professional & Scientific | 0 (0.0%) | 0 (0.0%) |
| Enterprise Management | 0 (0.0%) | 0 (0.0%) |
| Administrative & Support | 1 (33.3%) | 2 (66.7%) |
| Educational Services | 1 (20.0%) | 4 (80.0%) |
| Health Care & Social Assistance | 0 (0.0%) | 7 (100.0%) |
| Arts, Entertainment & Recreation | 0 (0.0%) | 0 (0.0%) |
| Accommodation & Food Services | 4 (100.0%) | 0 (0.0%) |
| Public Administration | 1 (50.0%) | 1 (50.0%) |
| Total | 40 (50.6%) | 39 (49.4%) |
Education in Northville
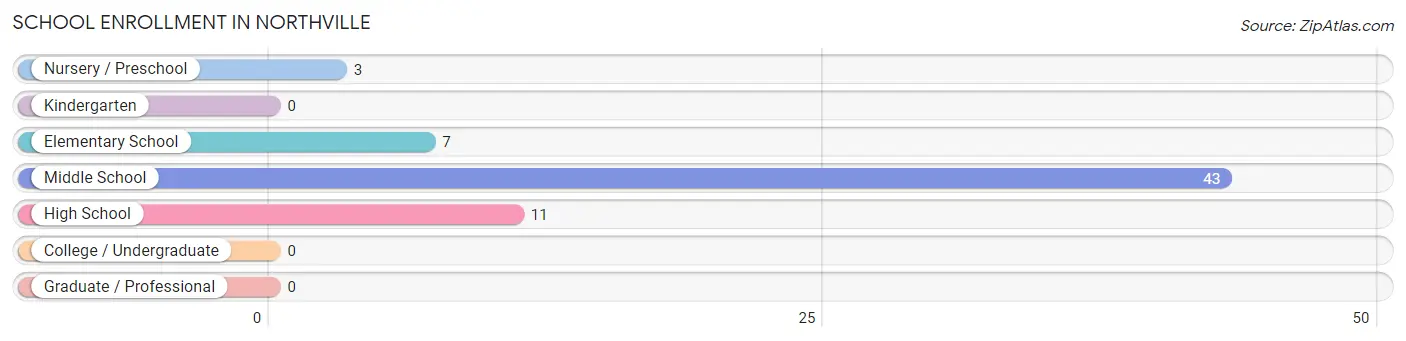
School Enrollment in Northville
The most common levels of schooling among the 64 students in Northville are middle school (43 | 67.2%), high school (11 | 17.2%), and elementary school (7 | 10.9%).
| School Level | # Students | % Students |
| Nursery / Preschool | 3 | 4.7% |
| Kindergarten | 0 | 0.0% |
| Elementary School | 7 | 10.9% |
| Middle School | 43 | 67.2% |
| High School | 11 | 17.2% |
| College / Undergraduate | 0 | 0.0% |
| Graduate / Professional | 0 | 0.0% |
| Total | 64 | 100.0% |
School Enrollment by Age by Funding Source in Northville
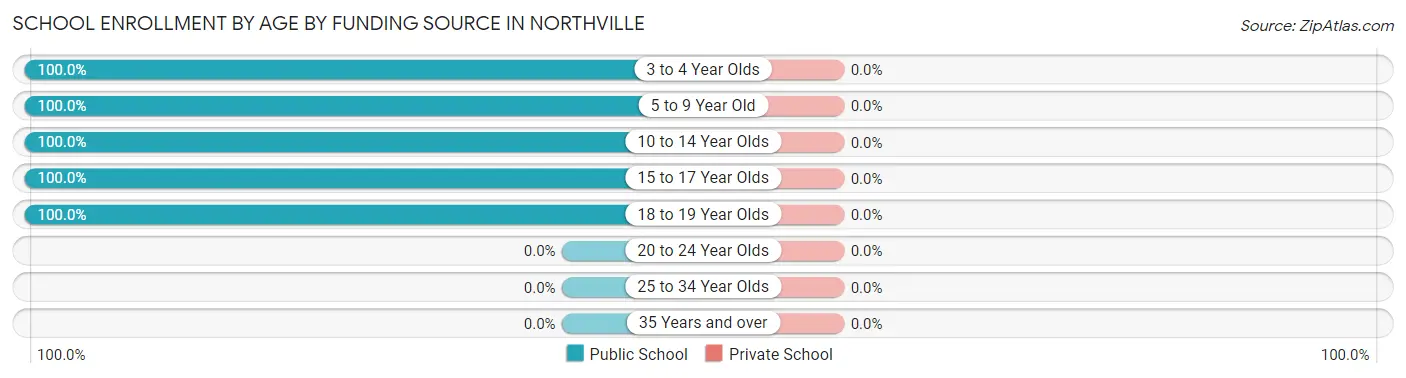
| Age Bracket | Public School | Private School |
| 3 to 4 Year Olds | 1 (100.0%) | 0 (0.0%) |
| 5 to 9 Year Old | 7 (100.0%) | 0 (0.0%) |
| 10 to 14 Year Olds | 49 (100.0%) | 0 (0.0%) |
| 15 to 17 Year Olds | 5 (100.0%) | 0 (0.0%) |
| 18 to 19 Year Olds | 2 (100.0%) | 0 (0.0%) |
| 20 to 24 Year Olds | 0 (0.0%) | 0 (0.0%) |
| 25 to 34 Year Olds | 0 (0.0%) | 0 (0.0%) |
| 35 Years and over | 0 (0.0%) | 0 (0.0%) |
| Total | 64 (100.0%) | 0 (0.0%) |
Educational Attainment by Field of Study in Northville
Bio, nature & agricultural (18 | 37.5%), business (16 | 33.3%), science & technology (3 | 6.2%), education (3 | 6.2%), and psychology (2 | 4.2%) are the most common fields of study among 48 individuals in Northville who have obtained a bachelor's degree or higher.
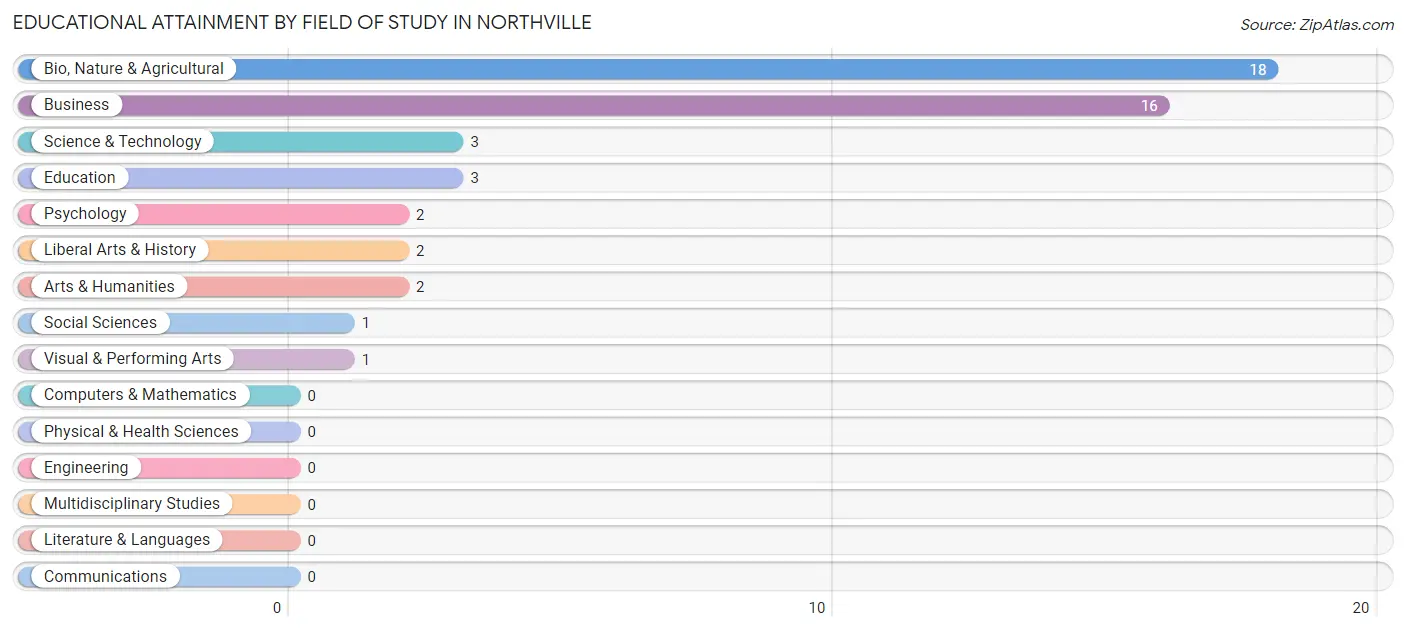
| Field of Study | # Graduates | % Graduates |
| Computers & Mathematics | 0 | 0.0% |
| Bio, Nature & Agricultural | 18 | 37.5% |
| Physical & Health Sciences | 0 | 0.0% |
| Psychology | 2 | 4.2% |
| Social Sciences | 1 | 2.1% |
| Engineering | 0 | 0.0% |
| Multidisciplinary Studies | 0 | 0.0% |
| Science & Technology | 3 | 6.2% |
| Business | 16 | 33.3% |
| Education | 3 | 6.2% |
| Literature & Languages | 0 | 0.0% |
| Liberal Arts & History | 2 | 4.2% |
| Visual & Performing Arts | 1 | 2.1% |
| Communications | 0 | 0.0% |
| Arts & Humanities | 2 | 4.2% |
| Total | 48 | 100.0% |
Transportation & Commute in Northville
Vehicle Availability by Sex in Northville
The most prevalent vehicle ownership categories in Northville are males with 3 vehicles (21, accounting for 52.5%) and females with 3 vehicles (23, making up 53.8%).
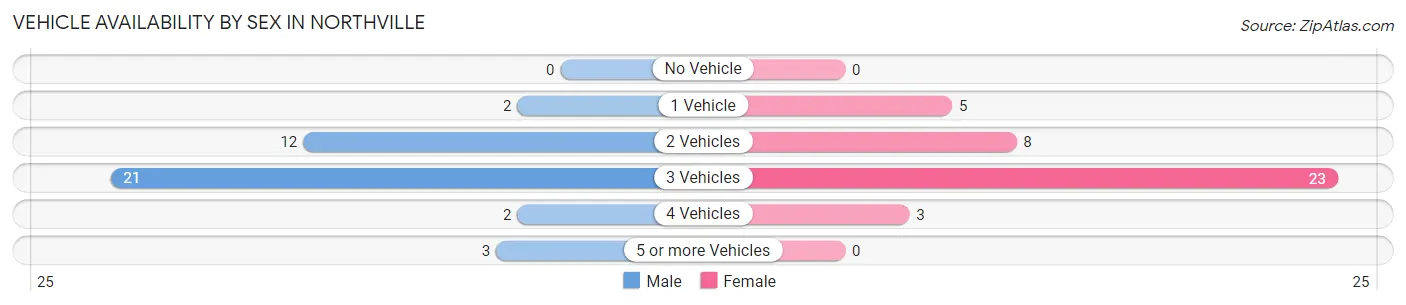
| Vehicles Available | Male | Female |
| No Vehicle | 0 (0.0%) | 0 (0.0%) |
| 1 Vehicle | 2 (5.0%) | 5 (12.8%) |
| 2 Vehicles | 12 (30.0%) | 8 (20.5%) |
| 3 Vehicles | 21 (52.5%) | 23 (59.0%) |
| 4 Vehicles | 2 (5.0%) | 3 (7.7%) |
| 5 or more Vehicles | 3 (7.5%) | 0 (0.0%) |
| Total | 40 (100.0%) | 39 (100.0%) |
Commute Time in Northville
The most frequently occuring commute durations in Northville are less than 5 minutes (21 commuters, 28.8%), 35 to 39 minutes (17 commuters, 23.3%), and 10 to 14 minutes (15 commuters, 20.5%).
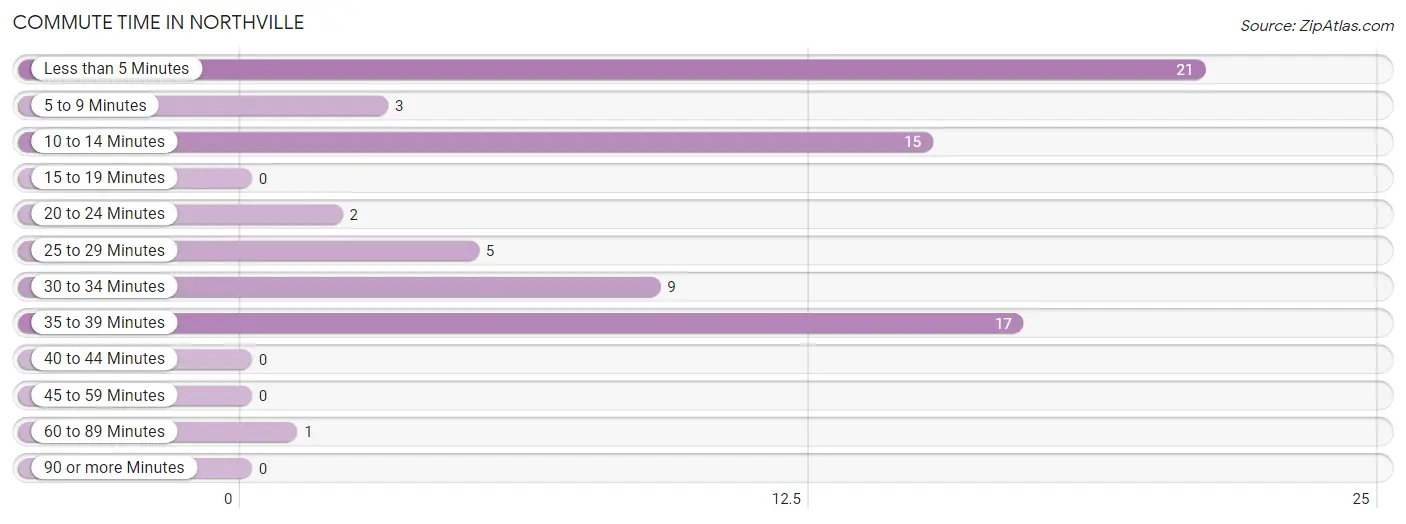
| Commute Time | # Commuters | % Commuters |
| Less than 5 Minutes | 21 | 28.8% |
| 5 to 9 Minutes | 3 | 4.1% |
| 10 to 14 Minutes | 15 | 20.5% |
| 15 to 19 Minutes | 0 | 0.0% |
| 20 to 24 Minutes | 2 | 2.7% |
| 25 to 29 Minutes | 5 | 6.9% |
| 30 to 34 Minutes | 9 | 12.3% |
| 35 to 39 Minutes | 17 | 23.3% |
| 40 to 44 Minutes | 0 | 0.0% |
| 45 to 59 Minutes | 0 | 0.0% |
| 60 to 89 Minutes | 1 | 1.4% |
| 90 or more Minutes | 0 | 0.0% |
Commute Time by Sex in Northville
The most common commute times in Northville are less than 5 minutes (18 commuters, 47.4%) for males and 35 to 39 minutes (17 commuters, 48.6%) for females.
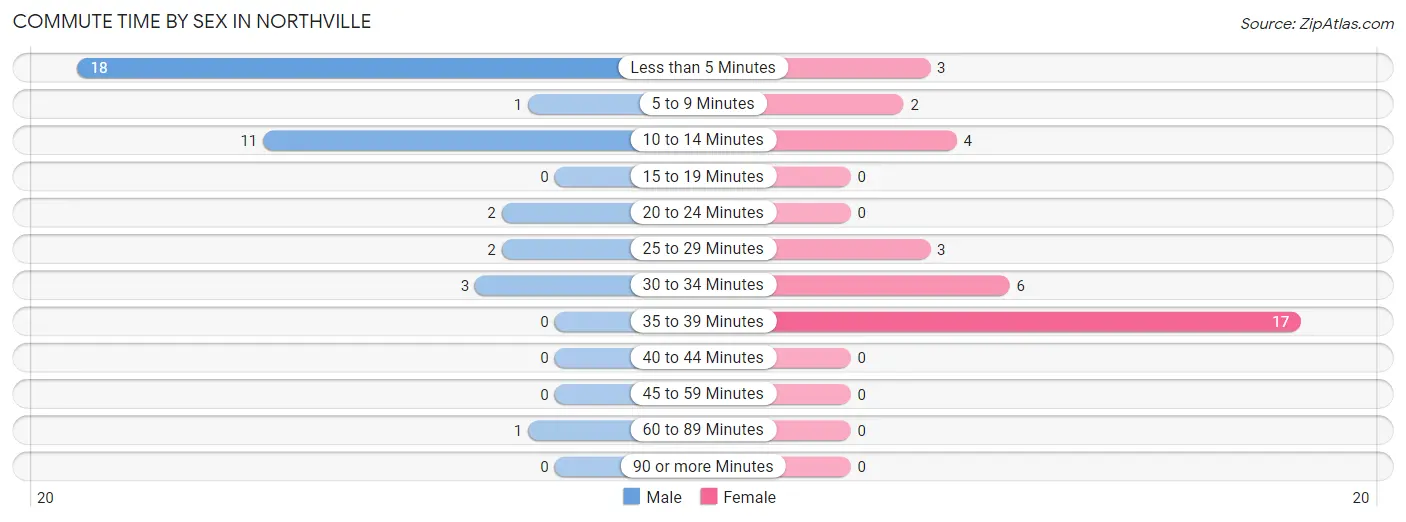
| Commute Time | Male | Female |
| Less than 5 Minutes | 18 (47.4%) | 3 (8.6%) |
| 5 to 9 Minutes | 1 (2.6%) | 2 (5.7%) |
| 10 to 14 Minutes | 11 (28.9%) | 4 (11.4%) |
| 15 to 19 Minutes | 0 (0.0%) | 0 (0.0%) |
| 20 to 24 Minutes | 2 (5.3%) | 0 (0.0%) |
| 25 to 29 Minutes | 2 (5.3%) | 3 (8.6%) |
| 30 to 34 Minutes | 3 (7.9%) | 6 (17.1%) |
| 35 to 39 Minutes | 0 (0.0%) | 17 (48.6%) |
| 40 to 44 Minutes | 0 (0.0%) | 0 (0.0%) |
| 45 to 59 Minutes | 0 (0.0%) | 0 (0.0%) |
| 60 to 89 Minutes | 1 (2.6%) | 0 (0.0%) |
| 90 or more Minutes | 0 (0.0%) | 0 (0.0%) |
Time of Departure to Work by Sex in Northville
The most frequent times of departure to work in Northville are 7:30 AM to 7:59 AM (18, 47.4%) for males and 7:00 AM to 7:29 AM (17, 48.6%) for females.
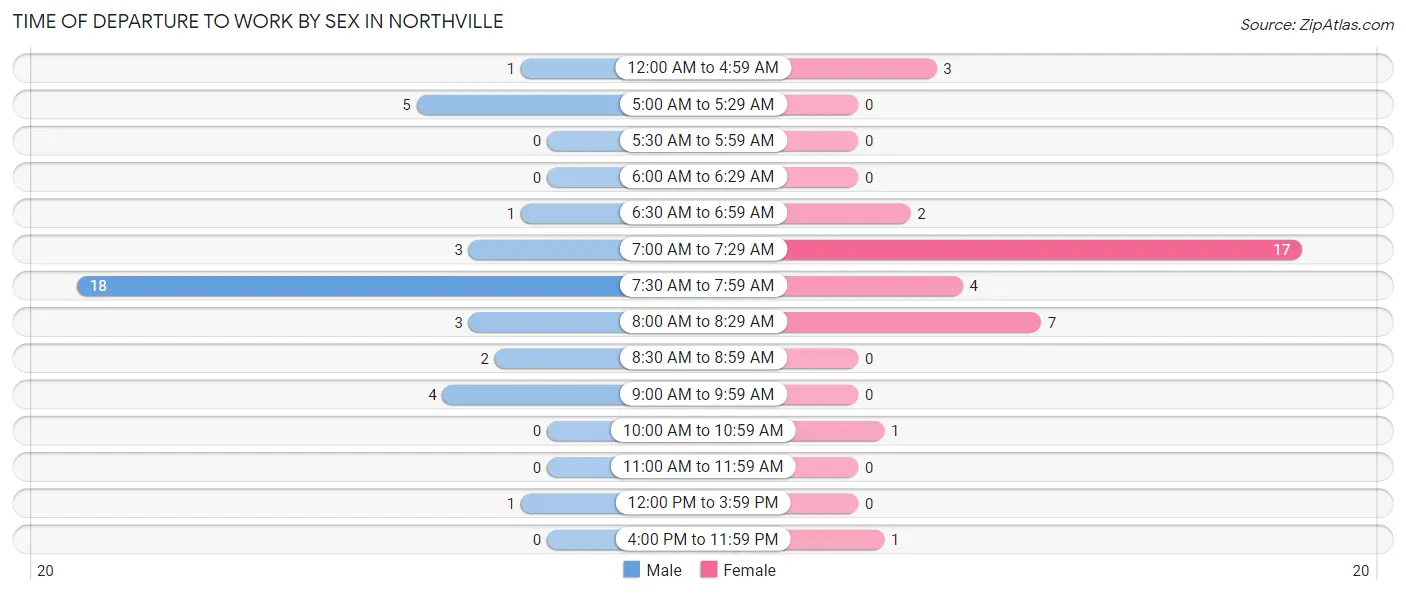
| Time of Departure | Male | Female |
| 12:00 AM to 4:59 AM | 1 (2.6%) | 3 (8.6%) |
| 5:00 AM to 5:29 AM | 5 (13.2%) | 0 (0.0%) |
| 5:30 AM to 5:59 AM | 0 (0.0%) | 0 (0.0%) |
| 6:00 AM to 6:29 AM | 0 (0.0%) | 0 (0.0%) |
| 6:30 AM to 6:59 AM | 1 (2.6%) | 2 (5.7%) |
| 7:00 AM to 7:29 AM | 3 (7.9%) | 17 (48.6%) |
| 7:30 AM to 7:59 AM | 18 (47.4%) | 4 (11.4%) |
| 8:00 AM to 8:29 AM | 3 (7.9%) | 7 (20.0%) |
| 8:30 AM to 8:59 AM | 2 (5.3%) | 0 (0.0%) |
| 9:00 AM to 9:59 AM | 4 (10.5%) | 0 (0.0%) |
| 10:00 AM to 10:59 AM | 0 (0.0%) | 1 (2.9%) |
| 11:00 AM to 11:59 AM | 0 (0.0%) | 0 (0.0%) |
| 12:00 PM to 3:59 PM | 1 (2.6%) | 0 (0.0%) |
| 4:00 PM to 11:59 PM | 0 (0.0%) | 1 (2.9%) |
| Total | 38 (100.0%) | 35 (100.0%) |
Housing Occupancy in Northville
Occupancy by Ownership in Northville
Of the total 52 dwellings in Northville, owner-occupied units account for 52 (100.0%), while renter-occupied units make up 0 (0.0%).
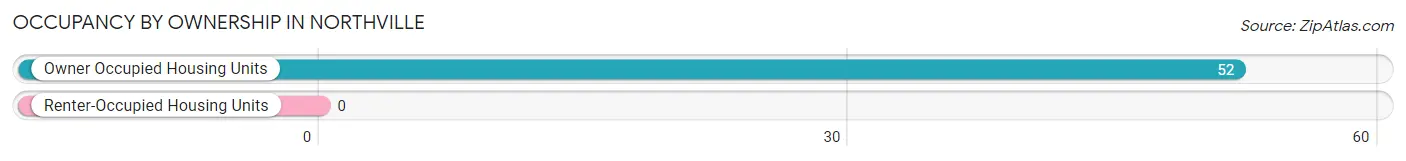
| Occupancy | # Housing Units | % Housing Units |
| Owner Occupied Housing Units | 52 | 100.0% |
| Renter-Occupied Housing Units | 0 | 0.0% |
| Total Occupied Housing Units | 52 | 100.0% |
Occupancy by Household Size in Northville
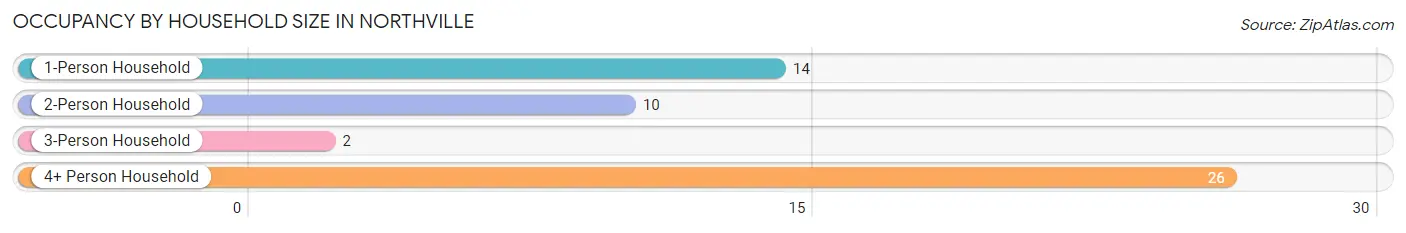
| Household Size | # Housing Units | % Housing Units |
| 1-Person Household | 14 | 26.9% |
| 2-Person Household | 10 | 19.2% |
| 3-Person Household | 2 | 3.8% |
| 4+ Person Household | 26 | 50.0% |
| Total Housing Units | 52 | 100.0% |
Occupancy by Ownership by Household Size in Northville
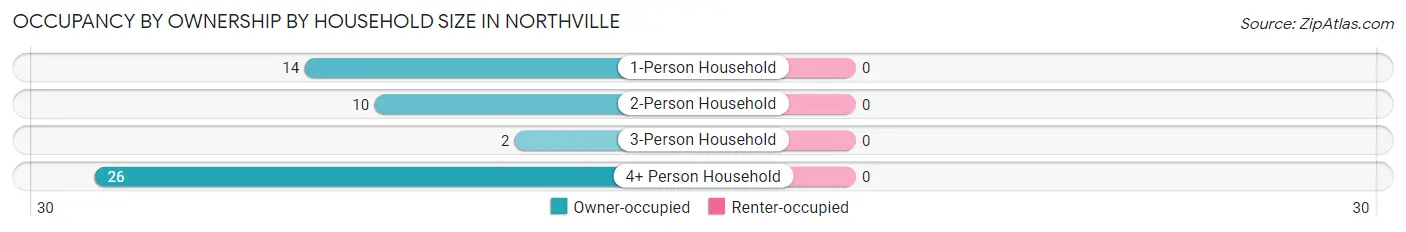
| Household Size | Owner-occupied | Renter-occupied |
| 1-Person Household | 14 (100.0%) | 0 (0.0%) |
| 2-Person Household | 10 (100.0%) | 0 (0.0%) |
| 3-Person Household | 2 (100.0%) | 0 (0.0%) |
| 4+ Person Household | 26 (100.0%) | 0 (0.0%) |
| Total Housing Units | 52 (100.0%) | 0 (0.0%) |
Occupancy by Educational Attainment in Northville
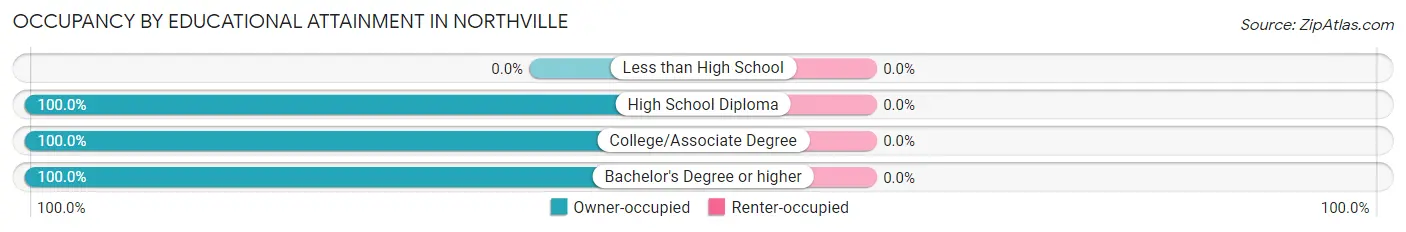
| Household Size | Owner-occupied | Renter-occupied |
| Less than High School | 0 (0.0%) | 0 (0.0%) |
| High School Diploma | 12 (100.0%) | 0 (0.0%) |
| College/Associate Degree | 14 (100.0%) | 0 (0.0%) |
| Bachelor's Degree or higher | 26 (100.0%) | 0 (0.0%) |
Occupancy by Age of Householder in Northville
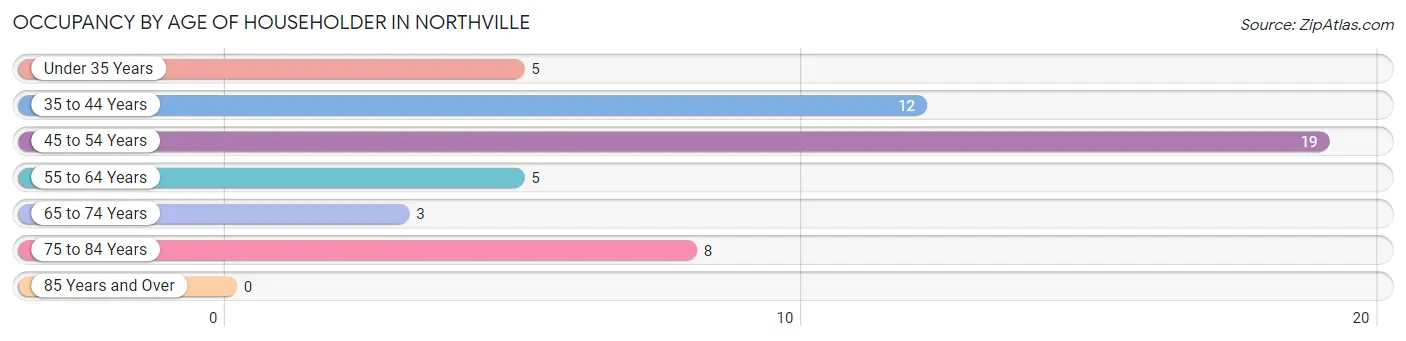
| Age Bracket | # Households | % Households |
| Under 35 Years | 5 | 9.6% |
| 35 to 44 Years | 12 | 23.1% |
| 45 to 54 Years | 19 | 36.5% |
| 55 to 64 Years | 5 | 9.6% |
| 65 to 74 Years | 3 | 5.8% |
| 75 to 84 Years | 8 | 15.4% |
| 85 Years and Over | 0 | 0.0% |
| Total | 52 | 100.0% |
Housing Finances in Northville
Median Income by Occupancy in Northville
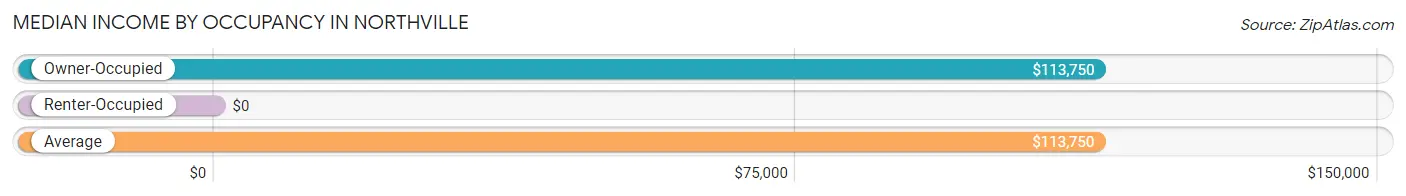
| Occupancy Type | # Households | Median Income |
| Owner-Occupied | 52 (100.0%) | $113,750 |
| Renter-Occupied | 0 (0.0%) | $0 |
| Average | 52 (100.0%) | $113,750 |
Occupancy by Householder Income Bracket in Northville
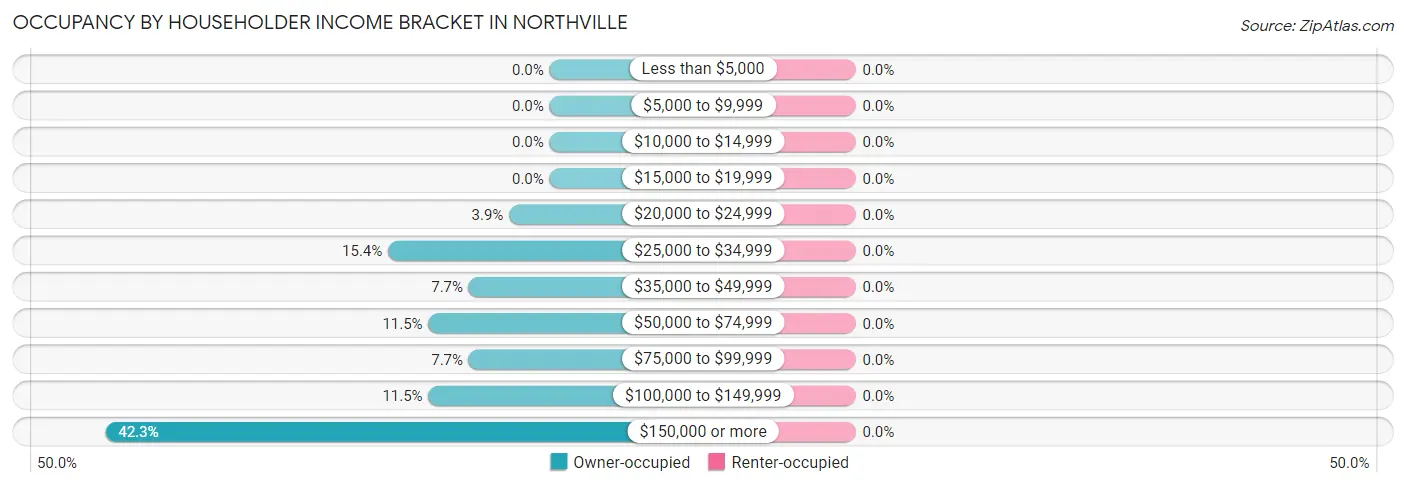
| Income Bracket | Owner-occupied | Renter-occupied |
| Less than $5,000 | 0 (0.0%) | 0 (0.0%) |
| $5,000 to $9,999 | 0 (0.0%) | 0 (0.0%) |
| $10,000 to $14,999 | 0 (0.0%) | 0 (0.0%) |
| $15,000 to $19,999 | 0 (0.0%) | 0 (0.0%) |
| $20,000 to $24,999 | 2 (3.8%) | 0 (0.0%) |
| $25,000 to $34,999 | 8 (15.4%) | 0 (0.0%) |
| $35,000 to $49,999 | 4 (7.7%) | 0 (0.0%) |
| $50,000 to $74,999 | 6 (11.5%) | 0 (0.0%) |
| $75,000 to $99,999 | 4 (7.7%) | 0 (0.0%) |
| $100,000 to $149,999 | 6 (11.5%) | 0 (0.0%) |
| $150,000 or more | 22 (42.3%) | 0 (0.0%) |
| Total | 52 (100.0%) | 0 (0.0%) |
Monthly Housing Cost Tiers in Northville
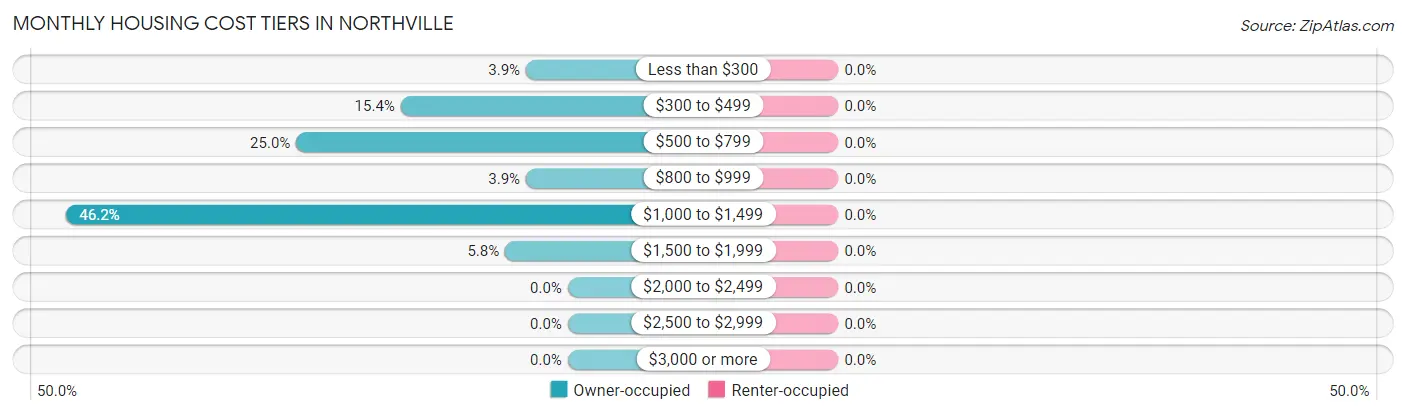
| Monthly Cost | Owner-occupied | Renter-occupied |
| Less than $300 | 2 (3.8%) | 0 (0.0%) |
| $300 to $499 | 8 (15.4%) | 0 (0.0%) |
| $500 to $799 | 13 (25.0%) | 0 (0.0%) |
| $800 to $999 | 2 (3.8%) | 0 (0.0%) |
| $1,000 to $1,499 | 24 (46.2%) | 0 (0.0%) |
| $1,500 to $1,999 | 3 (5.8%) | 0 (0.0%) |
| $2,000 to $2,499 | 0 (0.0%) | 0 (0.0%) |
| $2,500 to $2,999 | 0 (0.0%) | 0 (0.0%) |
| $3,000 or more | 0 (0.0%) | 0 (0.0%) |
| Total | 52 (100.0%) | 0 (0.0%) |
Physical Housing Characteristics in Northville
Housing Structures in Northville
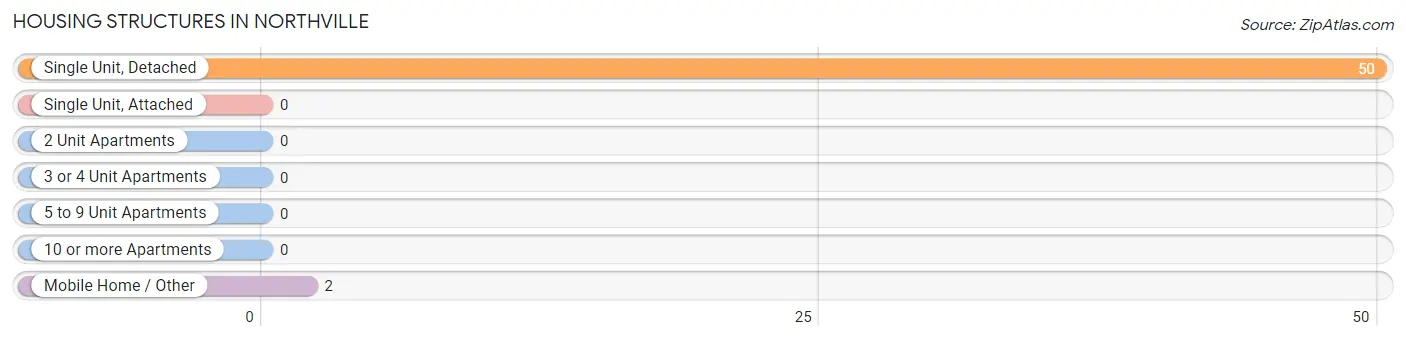
| Structure Type | # Housing Units | % Housing Units |
| Single Unit, Detached | 50 | 96.2% |
| Single Unit, Attached | 0 | 0.0% |
| 2 Unit Apartments | 0 | 0.0% |
| 3 or 4 Unit Apartments | 0 | 0.0% |
| 5 to 9 Unit Apartments | 0 | 0.0% |
| 10 or more Apartments | 0 | 0.0% |
| Mobile Home / Other | 2 | 3.8% |
| Total | 52 | 100.0% |
Housing Structures by Occupancy in Northville
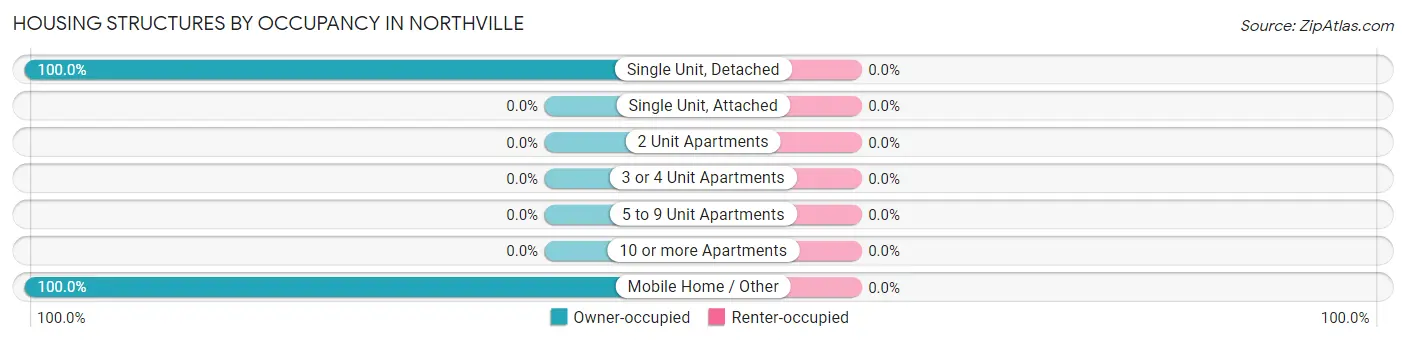
| Structure Type | Owner-occupied | Renter-occupied |
| Single Unit, Detached | 50 (100.0%) | 0 (0.0%) |
| Single Unit, Attached | 0 (0.0%) | 0 (0.0%) |
| 2 Unit Apartments | 0 (0.0%) | 0 (0.0%) |
| 3 or 4 Unit Apartments | 0 (0.0%) | 0 (0.0%) |
| 5 to 9 Unit Apartments | 0 (0.0%) | 0 (0.0%) |
| 10 or more Apartments | 0 (0.0%) | 0 (0.0%) |
| Mobile Home / Other | 2 (100.0%) | 0 (0.0%) |
| Total | 52 (100.0%) | 0 (0.0%) |
Housing Structures by Number of Rooms in Northville
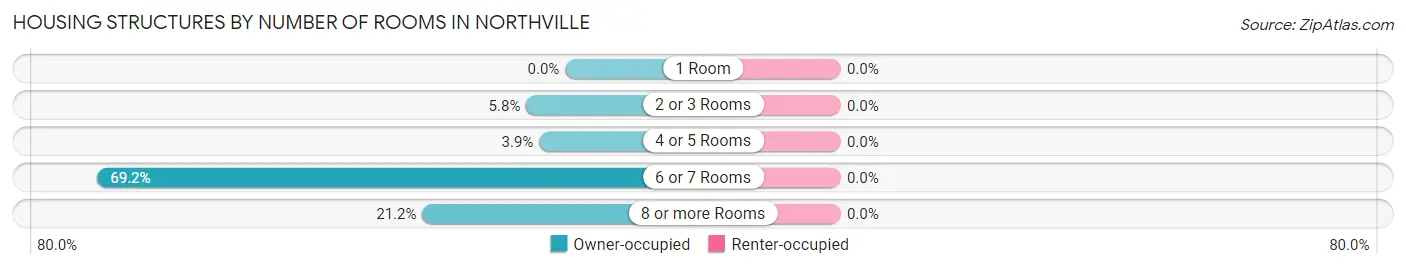
| Number of Rooms | Owner-occupied | Renter-occupied |
| 1 Room | 0 (0.0%) | 0 (0.0%) |
| 2 or 3 Rooms | 3 (5.8%) | 0 (0.0%) |
| 4 or 5 Rooms | 2 (3.8%) | 0 (0.0%) |
| 6 or 7 Rooms | 36 (69.2%) | 0 (0.0%) |
| 8 or more Rooms | 11 (21.1%) | 0 (0.0%) |
| Total | 52 (100.0%) | 0 (0.0%) |
Housing Structure by Heating Type in Northville
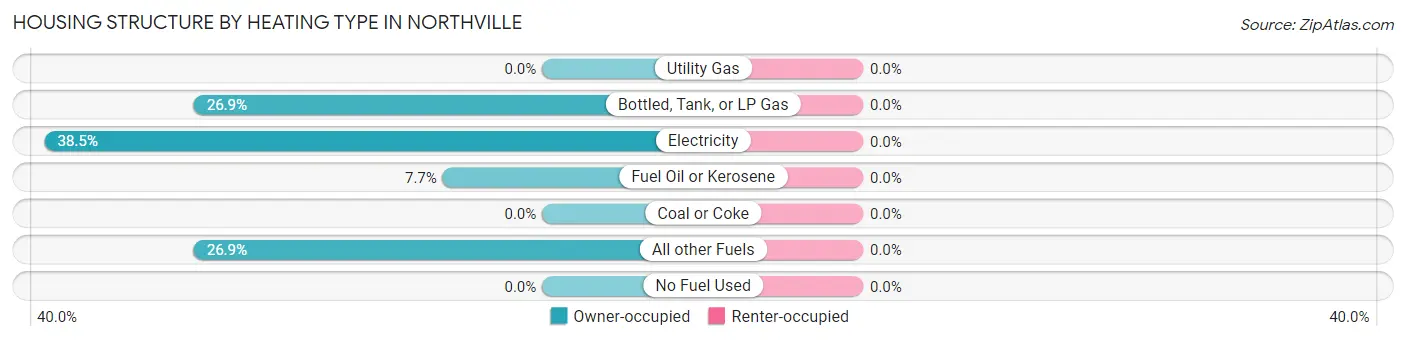
| Heating Type | Owner-occupied | Renter-occupied |
| Utility Gas | 0 (0.0%) | 0 (0.0%) |
| Bottled, Tank, or LP Gas | 14 (26.9%) | 0 (0.0%) |
| Electricity | 20 (38.5%) | 0 (0.0%) |
| Fuel Oil or Kerosene | 4 (7.7%) | 0 (0.0%) |
| Coal or Coke | 0 (0.0%) | 0 (0.0%) |
| All other Fuels | 14 (26.9%) | 0 (0.0%) |
| No Fuel Used | 0 (0.0%) | 0 (0.0%) |
| Total | 52 (100.0%) | 0 (0.0%) |
Household Vehicle Usage in Northville
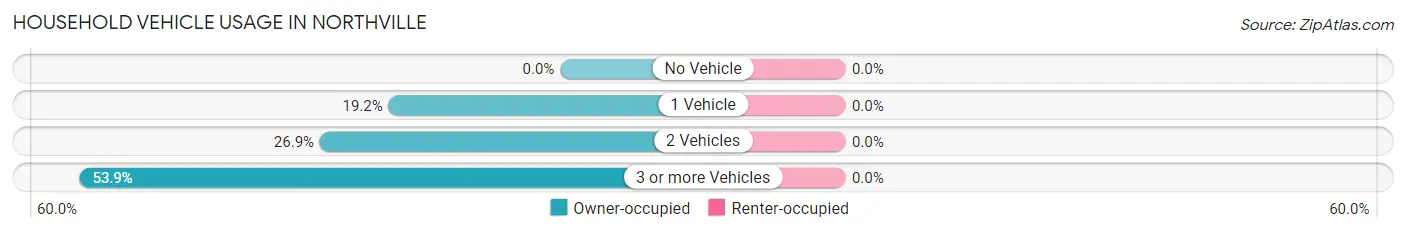
| Vehicles per Household | Owner-occupied | Renter-occupied |
| No Vehicle | 0 (0.0%) | 0 (0.0%) |
| 1 Vehicle | 10 (19.2%) | 0 (0.0%) |
| 2 Vehicles | 14 (26.9%) | 0 (0.0%) |
| 3 or more Vehicles | 28 (53.8%) | 0 (0.0%) |
| Total | 52 (100.0%) | 0 (0.0%) |
Real Estate & Mortgages in Northville
Real Estate and Mortgage Overview in Northville
| Characteristic | Without Mortgage | With Mortgage |
| Housing Units | 22 | 30 |
| Median Property Value | $57,500 | $153,600 |
| Median Household Income | $66,250 | $16 |
| Monthly Housing Costs | $525 | $0 |
| Real Estate Taxes | $720 | $1 |
Property Value by Mortgage Status in Northville
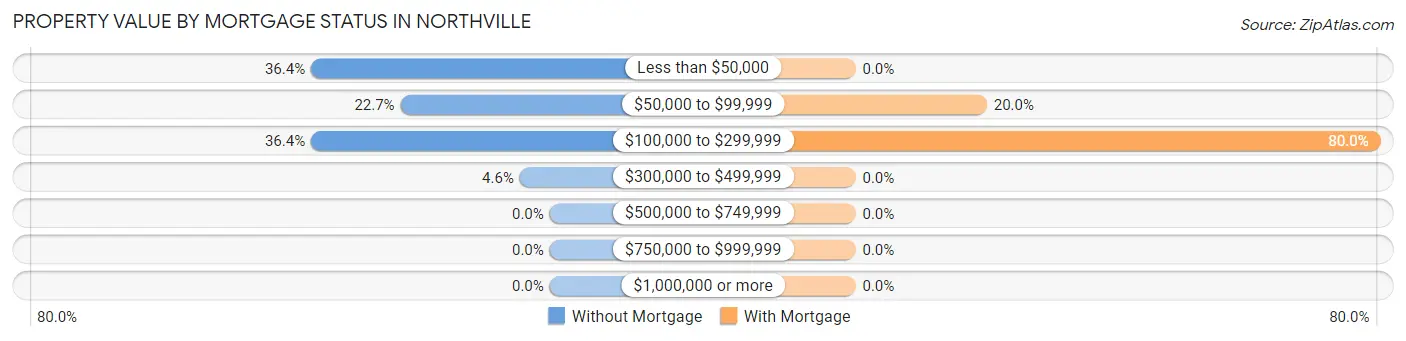
| Property Value | Without Mortgage | With Mortgage |
| Less than $50,000 | 8 (36.4%) | 0 (0.0%) |
| $50,000 to $99,999 | 5 (22.7%) | 6 (20.0%) |
| $100,000 to $299,999 | 8 (36.4%) | 24 (80.0%) |
| $300,000 to $499,999 | 1 (4.5%) | 0 (0.0%) |
| $500,000 to $749,999 | 0 (0.0%) | 0 (0.0%) |
| $750,000 to $999,999 | 0 (0.0%) | 0 (0.0%) |
| $1,000,000 or more | 0 (0.0%) | 0 (0.0%) |
| Total | 22 (100.0%) | 30 (100.0%) |
Household Income by Mortgage Status in Northville
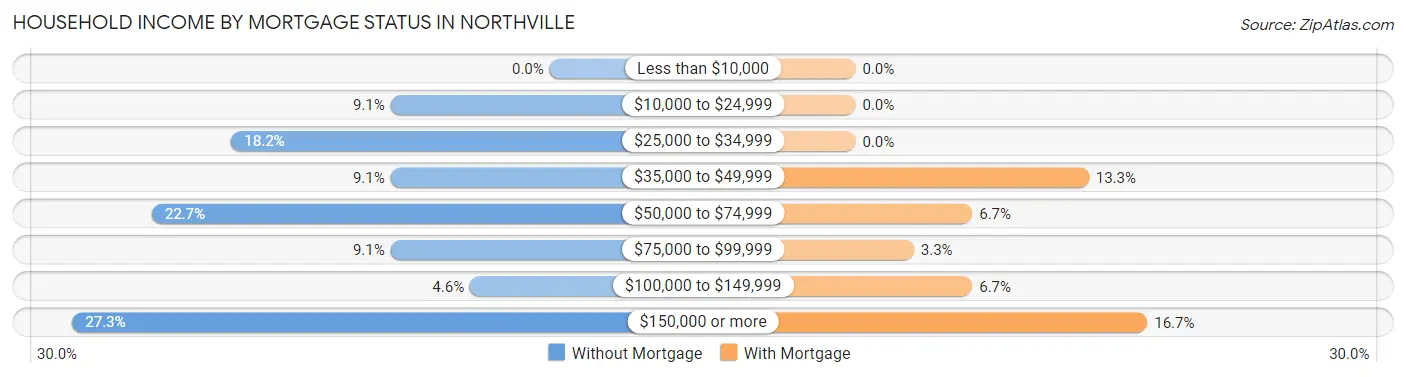
| Household Income | Without Mortgage | With Mortgage |
| Less than $10,000 | 0 (0.0%) | 0 (0.0%) |
| $10,000 to $24,999 | 2 (9.1%) | 0 (0.0%) |
| $25,000 to $34,999 | 4 (18.2%) | 0 (0.0%) |
| $35,000 to $49,999 | 2 (9.1%) | 4 (13.3%) |
| $50,000 to $74,999 | 5 (22.7%) | 2 (6.7%) |
| $75,000 to $99,999 | 2 (9.1%) | 1 (3.3%) |
| $100,000 to $149,999 | 1 (4.5%) | 2 (6.7%) |
| $150,000 or more | 6 (27.3%) | 5 (16.7%) |
| Total | 22 (100.0%) | 30 (100.0%) |
Property Value to Household Income Ratio in Northville
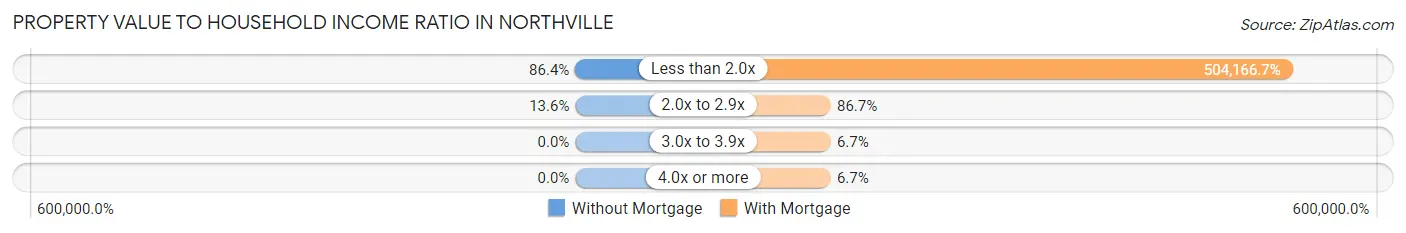
| Value-to-Income Ratio | Without Mortgage | With Mortgage |
| Less than 2.0x | 19 (86.4%) | 151,250 (504,166.7%) |
| 2.0x to 2.9x | 3 (13.6%) | 26 (86.7%) |
| 3.0x to 3.9x | 0 (0.0%) | 2 (6.7%) |
| 4.0x or more | 0 (0.0%) | 2 (6.7%) |
| Total | 22 (100.0%) | 30 (100.0%) |
Real Estate Taxes by Mortgage Status in Northville
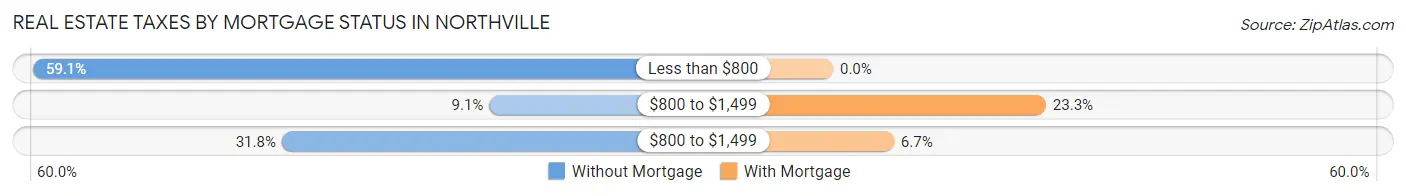
| Property Taxes | Without Mortgage | With Mortgage |
| Less than $800 | 13 (59.1%) | 0 (0.0%) |
| $800 to $1,499 | 2 (9.1%) | 7 (23.3%) |
| $800 to $1,499 | 7 (31.8%) | 2 (6.7%) |
| Total | 22 (100.0%) | 30 (100.0%) |
Health & Disability in Northville
Health Insurance Coverage by Age in Northville
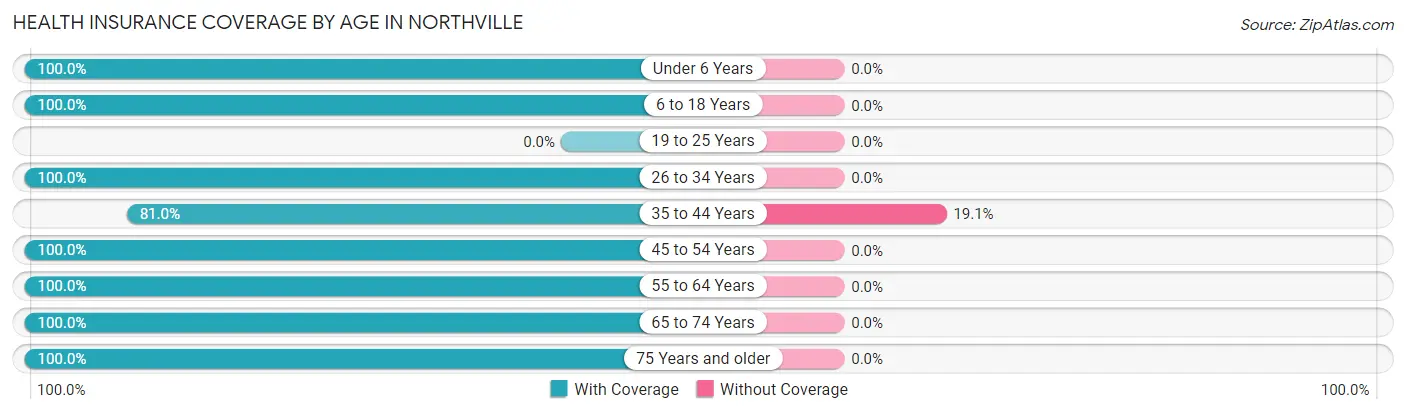
| Age Bracket | With Coverage | Without Coverage |
| Under 6 Years | 9 (100.0%) | 0 (0.0%) |
| 6 to 18 Years | 61 (100.0%) | 0 (0.0%) |
| 19 to 25 Years | 0 (0.0%) | 0 (0.0%) |
| 26 to 34 Years | 9 (100.0%) | 0 (0.0%) |
| 35 to 44 Years | 17 (80.9%) | 4 (19.1%) |
| 45 to 54 Years | 39 (100.0%) | 0 (0.0%) |
| 55 to 64 Years | 8 (100.0%) | 0 (0.0%) |
| 65 to 74 Years | 3 (100.0%) | 0 (0.0%) |
| 75 Years and older | 9 (100.0%) | 0 (0.0%) |
| Total | 155 (97.5%) | 4 (2.5%) |
Health Insurance Coverage by Citizenship Status in Northville
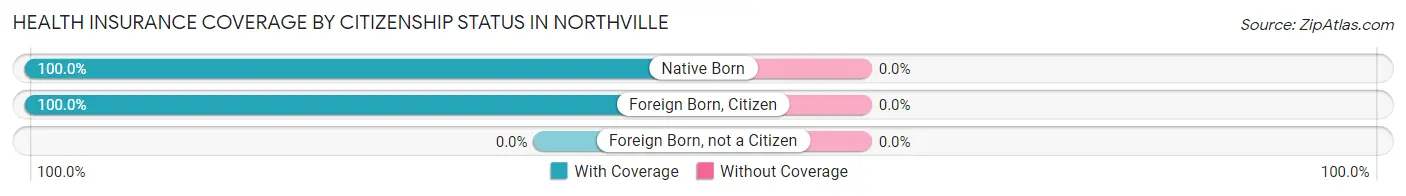
| Citizenship Status | With Coverage | Without Coverage |
| Native Born | 9 (100.0%) | 0 (0.0%) |
| Foreign Born, Citizen | 61 (100.0%) | 0 (0.0%) |
| Foreign Born, not a Citizen | 0 (0.0%) | 0 (0.0%) |
Health Insurance Coverage by Household Income in Northville
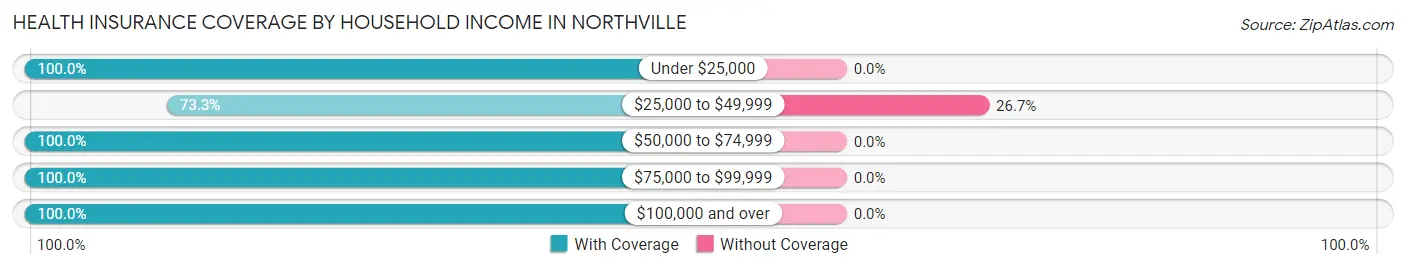
| Household Income | With Coverage | Without Coverage |
| Under $25,000 | 2 (100.0%) | 0 (0.0%) |
| $25,000 to $49,999 | 11 (73.3%) | 4 (26.7%) |
| $50,000 to $74,999 | 19 (100.0%) | 0 (0.0%) |
| $75,000 to $99,999 | 10 (100.0%) | 0 (0.0%) |
| $100,000 and over | 113 (100.0%) | 0 (0.0%) |
Public vs Private Health Insurance Coverage by Age in Northville
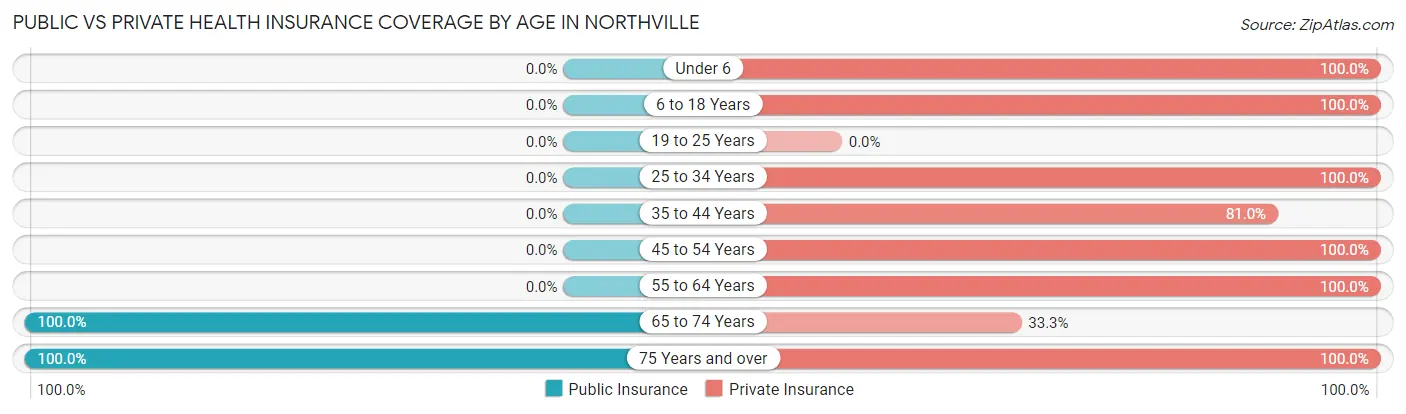
| Age Bracket | Public Insurance | Private Insurance |
| Under 6 | 0 (0.0%) | 9 (100.0%) |
| 6 to 18 Years | 0 (0.0%) | 61 (100.0%) |
| 19 to 25 Years | 0 (0.0%) | 0 (0.0%) |
| 25 to 34 Years | 0 (0.0%) | 9 (100.0%) |
| 35 to 44 Years | 0 (0.0%) | 17 (80.9%) |
| 45 to 54 Years | 0 (0.0%) | 39 (100.0%) |
| 55 to 64 Years | 0 (0.0%) | 8 (100.0%) |
| 65 to 74 Years | 3 (100.0%) | 1 (33.3%) |
| 75 Years and over | 9 (100.0%) | 9 (100.0%) |
| Total | 12 (7.5%) | 153 (96.2%) |
Disability Status by Sex by Age in Northville
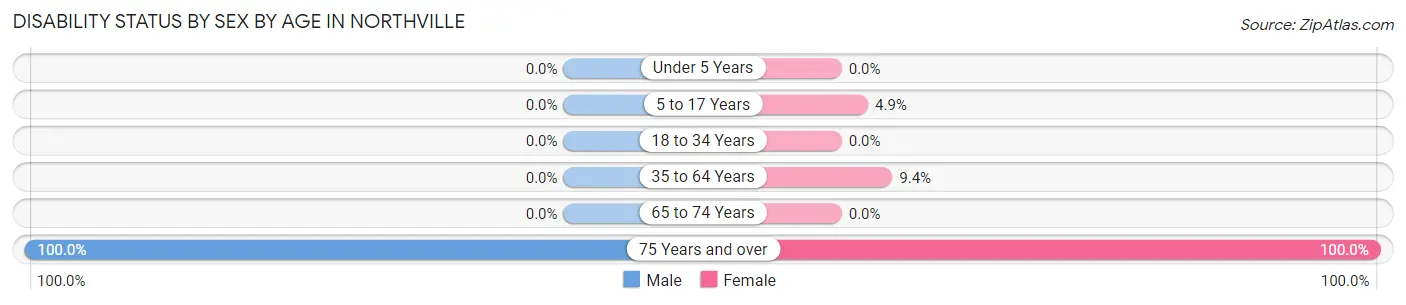
| Age Bracket | Male | Female |
| Under 5 Years | 0 (0.0%) | 0 (0.0%) |
| 5 to 17 Years | 0 (0.0%) | 2 (4.9%) |
| 18 to 34 Years | 0 (0.0%) | 0 (0.0%) |
| 35 to 64 Years | 0 (0.0%) | 3 (9.4%) |
| 65 to 74 Years | 0 (0.0%) | 0 (0.0%) |
| 75 Years and over | 3 (100.0%) | 6 (100.0%) |
Disability Class by Sex by Age in Northville
Disability Class: Hearing Difficulty
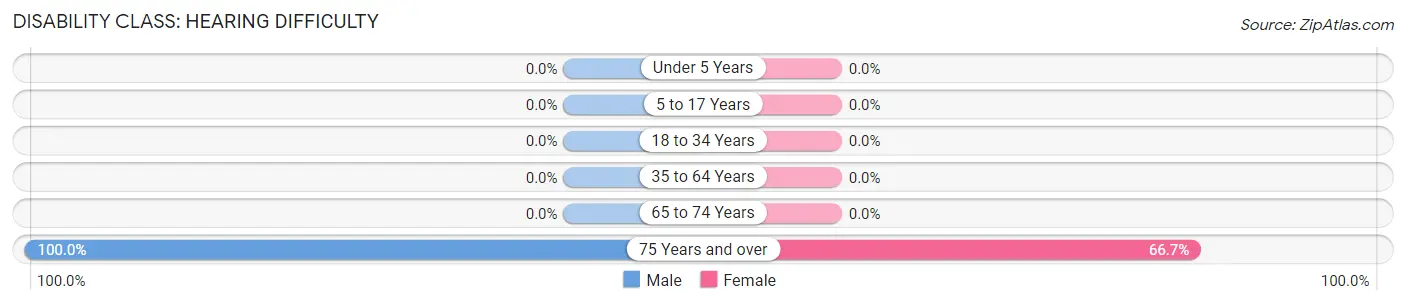
| Age Bracket | Male | Female |
| Under 5 Years | 0 (0.0%) | 0 (0.0%) |
| 5 to 17 Years | 0 (0.0%) | 0 (0.0%) |
| 18 to 34 Years | 0 (0.0%) | 0 (0.0%) |
| 35 to 64 Years | 0 (0.0%) | 0 (0.0%) |
| 65 to 74 Years | 0 (0.0%) | 0 (0.0%) |
| 75 Years and over | 3 (100.0%) | 4 (66.7%) |
Disability Class: Vision Difficulty
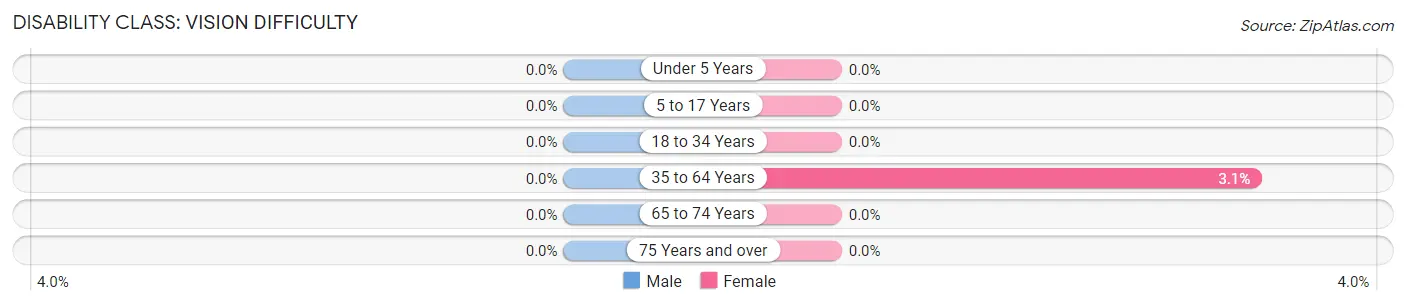
| Age Bracket | Male | Female |
| Under 5 Years | 0 (0.0%) | 0 (0.0%) |
| 5 to 17 Years | 0 (0.0%) | 0 (0.0%) |
| 18 to 34 Years | 0 (0.0%) | 0 (0.0%) |
| 35 to 64 Years | 0 (0.0%) | 1 (3.1%) |
| 65 to 74 Years | 0 (0.0%) | 0 (0.0%) |
| 75 Years and over | 0 (0.0%) | 0 (0.0%) |
Disability Class: Cognitive Difficulty
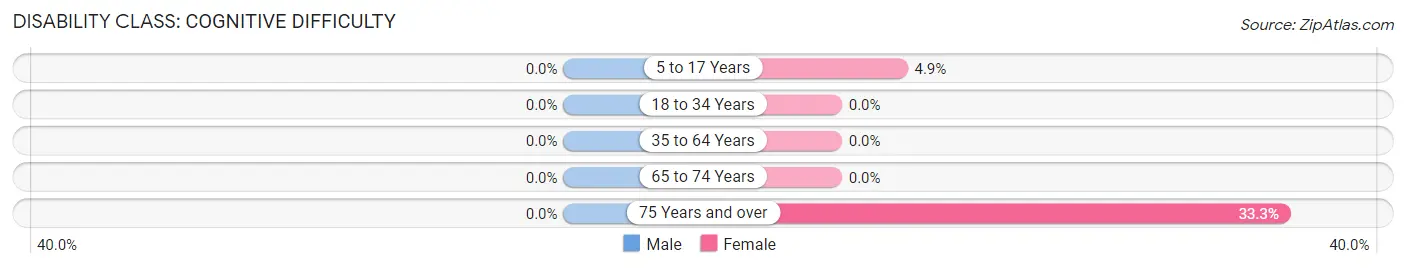
| Age Bracket | Male | Female |
| 5 to 17 Years | 0 (0.0%) | 2 (4.9%) |
| 18 to 34 Years | 0 (0.0%) | 0 (0.0%) |
| 35 to 64 Years | 0 (0.0%) | 0 (0.0%) |
| 65 to 74 Years | 0 (0.0%) | 0 (0.0%) |
| 75 Years and over | 0 (0.0%) | 2 (33.3%) |
Disability Class: Ambulatory Difficulty
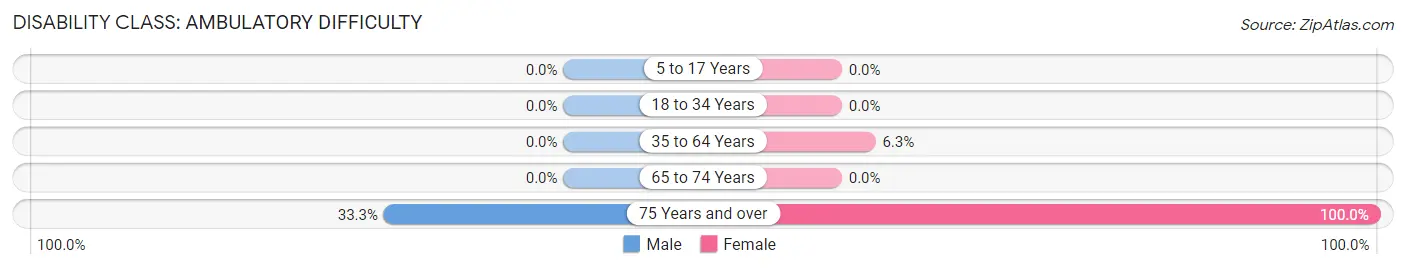
| Age Bracket | Male | Female |
| 5 to 17 Years | 0 (0.0%) | 0 (0.0%) |
| 18 to 34 Years | 0 (0.0%) | 0 (0.0%) |
| 35 to 64 Years | 0 (0.0%) | 2 (6.2%) |
| 65 to 74 Years | 0 (0.0%) | 0 (0.0%) |
| 75 Years and over | 1 (33.3%) | 6 (100.0%) |
Disability Class: Self-Care Difficulty
| Age Bracket | Male | Female |
| 5 to 17 Years | 0 (0.0%) | 0 (0.0%) |
| 18 to 34 Years | 0 (0.0%) | 0 (0.0%) |
| 35 to 64 Years | 0 (0.0%) | 0 (0.0%) |
| 65 to 74 Years | 0 (0.0%) | 0 (0.0%) |
| 75 Years and over | 0 (0.0%) | 0 (0.0%) |
Technology Access in Northville
Computing Device Access in Northville
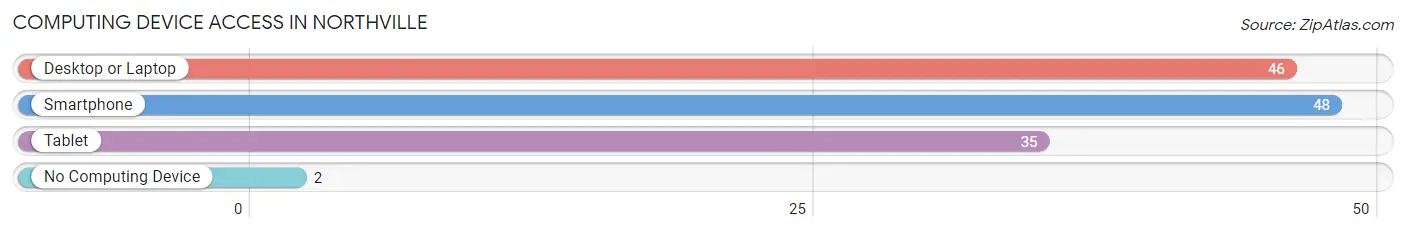
| Device Type | # Households | % Households |
| Desktop or Laptop | 46 | 88.5% |
| Smartphone | 48 | 92.3% |
| Tablet | 35 | 67.3% |
| No Computing Device | 2 | 3.8% |
| Total | 52 | 100.0% |
Internet Access in Northville
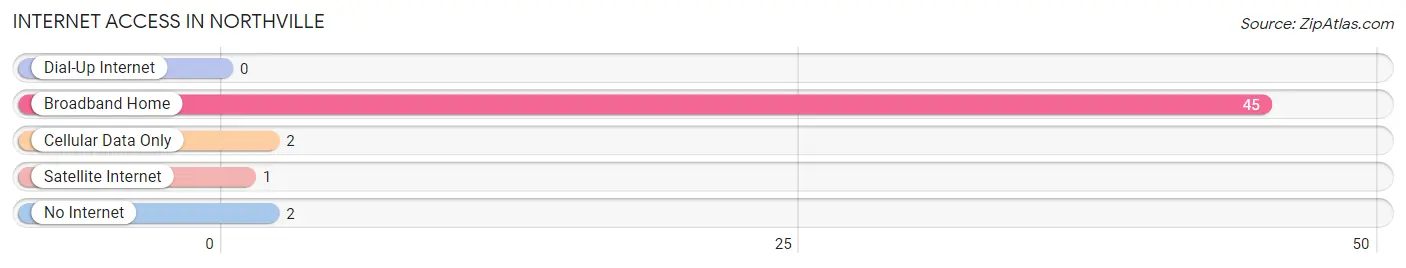
| Internet Type | # Households | % Households |
| Dial-Up Internet | 0 | 0.0% |
| Broadband Home | 45 | 86.5% |
| Cellular Data Only | 2 | 3.8% |
| Satellite Internet | 1 | 1.9% |
| No Internet | 2 | 3.8% |
| Total | 52 | 100.0% |
Northville Summary
History
The town of Northville, South Dakota is located in the southeastern corner of the state, just north of the Missouri River. It was founded in 1883 by a group of settlers from the nearby town of Yankton. The town was named after the nearby Northville Creek, which was named after the nearby Northville Indian Reservation. The town was originally a farming community, but it soon became a trading center for the surrounding area.
The town was incorporated in 1887 and the first mayor was elected in 1888. The town grew rapidly in the late 19th century, and by 1900 it had a population of over 1,000. The town was home to several businesses, including a bank, a hotel, a general store, a blacksmith shop, and a lumberyard.
In the early 20th century, Northville became a popular tourist destination. The town was home to several resorts, including the Northville Hotel, which was built in 1910. The hotel was a popular destination for visitors from all over the country.
In the 1950s, the town began to decline as the railroad industry declined and the population began to move away. The town was hit hard by the Great Depression and the Dust Bowl, and many of the businesses in town closed. The population of Northville dropped to just over 500 by the 1970s.
In the 1980s, the town began to experience a resurgence. The population began to grow again, and new businesses began to open. The town was also home to several festivals, including the Northville Days Festival, which is held every summer.
Geography
Northville is located in the southeastern corner of South Dakota, just north of the Missouri River. The town is situated on the banks of the Northville Creek, which is a tributary of the Missouri River. The town is surrounded by rolling hills and prairies, and is located in the heart of the Great Plains.
The climate in Northville is generally mild, with hot summers and cold winters. The average temperature in the summer is around 80 degrees Fahrenheit, and the average temperature in the winter is around 20 degrees Fahrenheit. The town receives an average of 25 inches of precipitation per year.
Economy
The economy of Northville is largely based on agriculture and tourism. The town is home to several farms, which produce a variety of crops, including corn, soybeans, wheat, and hay. The town is also home to several tourist attractions, including the Northville Days Festival, which is held every summer.
The town is also home to several businesses, including a bank, a hotel, a general store, a blacksmith shop, and a lumberyard. The town is also home to several restaurants, bars, and other businesses.
Demographics
As of the 2010 census, the population of Northville was 845. The racial makeup of the town was 97.3% White, 0.6% African American, 0.2% Native American, 0.2% Asian, 0.2% from other races, and 1.7% from two or more races. Hispanic or Latino of any race were 0.7% of the population.
The median income for a household in the town was $37,500, and the median income for a family was $45,000. The per capita income for the town was $18,000. About 10.3% of families and 13.2% of the population were below the poverty line, including 16.7% of those under age 18 and 8.3% of those age 65 or over.
Common Questions
What is Per Capita Income in Northville?
Per Capita income in Northville is $36,462.
What is the Median Family Income in Northville?
Median Family Income in Northville is $158,333.
What is the Median Household income in Northville?
Median Household Income in Northville is $113,750.
What is Income or Wage Gap in Northville?
Income or Wage Gap in Northville is 24.5%.
Women in Northville earn 75.5 cents for every dollar earned by a man.
What is Inequality or Gini Index in Northville?
Inequality or Gini Index in Northville is 0.32.
What is the Total Population of Northville?
Total Population of Northville is 159.
What is the Total Male Population of Northville?
Total Male Population of Northville is 69.
What is the Total Female Population of Northville?
Total Female Population of Northville is 90.
What is the Ratio of Males per 100 Females in Northville?
There are 76.67 Males per 100 Females in Northville.
What is the Ratio of Females per 100 Males in Northville?
There are 130.43 Females per 100 Males in Northville.
What is the Median Population Age in Northville?
Median Population Age in Northville is 35.5 Years.
What is the Average Family Size in Northville
Average Family Size in Northville is 3.7 People.
What is the Average Household Size in Northville
Average Household Size in Northville is 3.1 People.
How Large is the Labor Force in Northville?
There are 79 People in the Labor Forcein in Northville.
What is the Percentage of People in the Labor Force in Northville?
84.0% of People are in the Labor Force in Northville.