Zip Codes with the Highest Percentage of Population Employed in Office & Administration in District Of Columbia
RELATED REPORTS & OPTIONS
Office & Administration
District Of Columbia
Compare Zip Codes
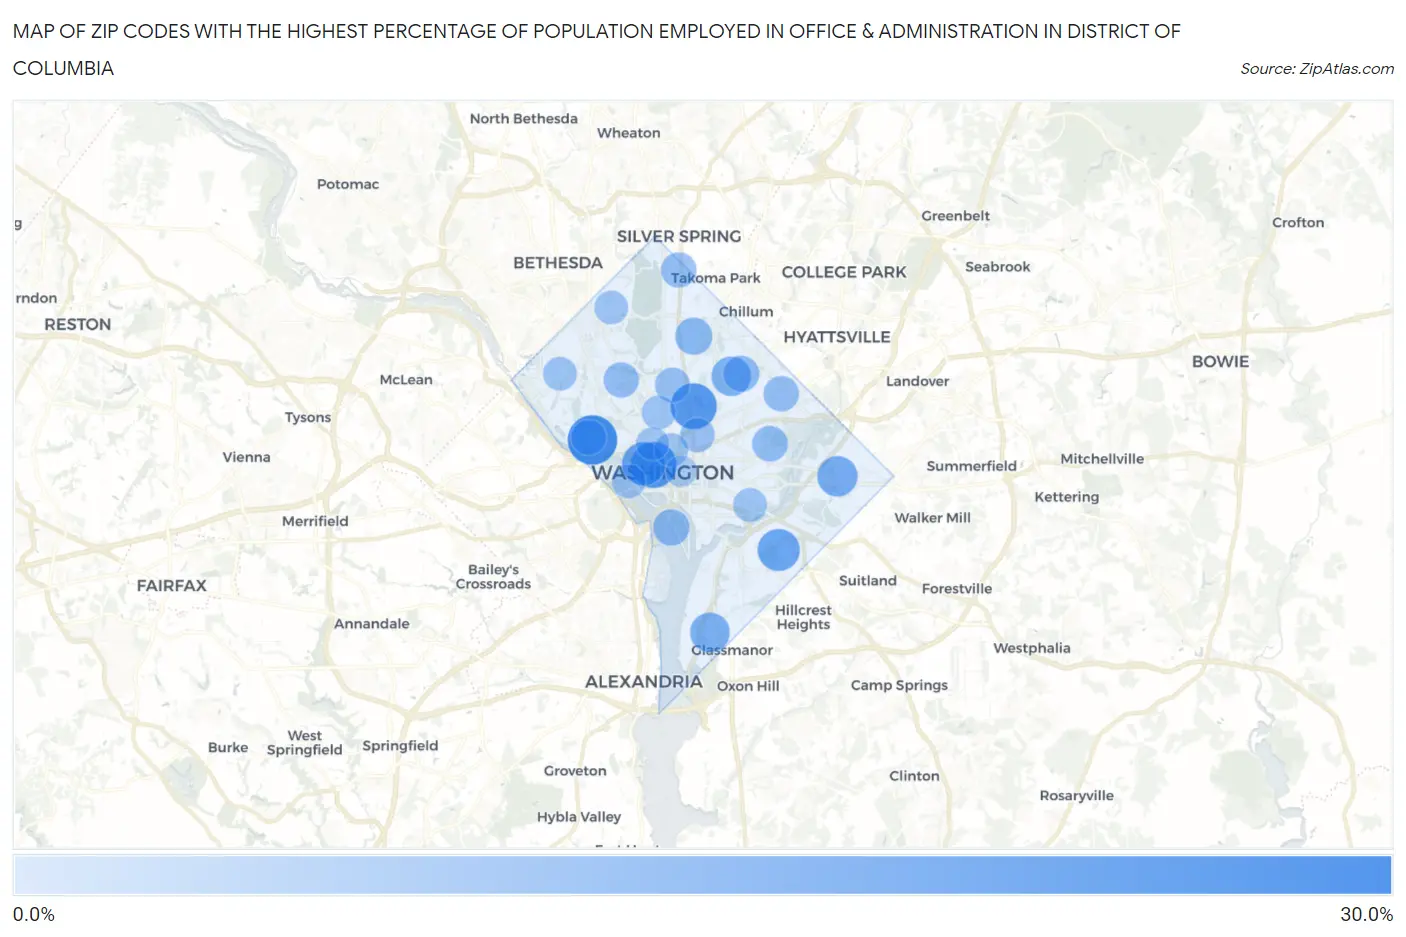
Map of Zip Codes with the Highest Percentage of Population Employed in Office & Administration in District Of Columbia
0.0%
30.0%
Zip Codes with the Highest Percentage of Population Employed in Office & Administration in District Of Columbia
| Zip Code | % Employed | vs State | vs National | |
| 1. | 20057 | 25.9% | 7.6%(+18.3)#1 | 10.9%(+15.0)#844 |
| 2. | 20059 | 21.1% | 7.6%(+13.5)#2 | 10.9%(+10.3)#1,459 |
| 3. | 20006 | 20.8% | 7.6%(+13.2)#3 | 10.9%(+9.98)#1,511 |
| 4. | 20052 | 17.6% | 7.6%(+9.98)#4 | 10.9%(+6.71)#2,551 |
| 5. | 20020 | 15.9% | 7.6%(+8.26)#5 | 10.9%(+5.00)#3,690 |
| 6. | 20019 | 13.5% | 7.6%(+5.88)#6 | 10.9%(+2.61)#6,987 |
| 7. | 20032 | 12.5% | 7.6%(+4.87)#7 | 10.9%(+1.60)#9,417 |
| 8. | 20064 | 12.3% | 7.6%(+4.68)#8 | 10.9%(+1.41)#9,936 |
| 9. | 20011 | 9.0% | 7.6%(+1.45)#9 | 10.9%(-1.81)#20,137 |
| 10. | 20024 | 8.0% | 7.6%(+0.374)#10 | 10.9%(-2.89)#23,107 |
| 11. | 20017 | 7.8% | 7.6%(+0.187)#11 | 10.9%(-3.08)#23,531 |
| 12. | 20002 | 7.1% | 7.6%(-0.485)#12 | 10.9%(-3.75)#25,023 |
| 13. | 20018 | 6.8% | 7.6%(-0.816)#13 | 10.9%(-4.09)#25,628 |
| 14. | 20012 | 6.7% | 7.6%(-0.903)#14 | 10.9%(-4.17)#25,782 |
| 15. | 20008 | 6.7% | 7.6%(-0.920)#15 | 10.9%(-4.19)#25,803 |
| 16. | 20007 | 6.6% | 7.6%(-0.985)#16 | 10.9%(-4.25)#25,914 |
| 17. | 20010 | 6.2% | 7.6%(-1.42)#17 | 10.9%(-4.69)#26,610 |
| 18. | 20001 | 5.5% | 7.6%(-2.12)#18 | 10.9%(-5.38)#27,582 |
| 19. | 20009 | 4.8% | 7.6%(-2.80)#19 | 10.9%(-6.07)#28,274 |
| 20. | 20037 | 4.7% | 7.6%(-2.85)#20 | 10.9%(-6.12)#28,332 |
| 21. | 20005 | 4.7% | 7.6%(-2.93)#21 | 10.9%(-6.20)#28,400 |
| 22. | 20003 | 4.6% | 7.6%(-2.94)#22 | 10.9%(-6.21)#28,421 |
| 23. | 20016 | 4.6% | 7.6%(-2.94)#23 | 10.9%(-6.21)#28,424 |
| 24. | 20015 | 4.3% | 7.6%(-3.30)#24 | 10.9%(-6.57)#28,771 |
| 25. | 20036 | 3.6% | 7.6%(-3.97)#25 | 10.9%(-7.24)#29,291 |
| 26. | 20004 | 1.3% | 7.6%(-6.32)#26 | 10.9%(-9.59)#30,311 |
1
Common Questions
What are the Top 10 Zip Codes with the Highest Percentage of Population Employed in Office & Administration in District Of Columbia?
Top 10 Zip Codes with the Highest Percentage of Population Employed in Office & Administration in District Of Columbia are:
What zip code has the Highest Percentage of Population Employed in Office & Administration in District Of Columbia?
20057 has the Highest Percentage of Population Employed in Office & Administration in District Of Columbia with 25.9%.
What is the Percentage of Population Employed in Office & Administration in the State of District Of Columbia?
Percentage of Population Employed in Office & Administration in District Of Columbia is 7.6%.
What is the Percentage of Population Employed in Office & Administration in the United States?
Percentage of Population Employed in Office & Administration in the United States is 10.9%.