Zip Codes with the Highest Percentage of Population Employed in Office & Administration in Genesee, PA
RELATED REPORTS & OPTIONS
Office & Administration
Genesee
Compare Zip Codes
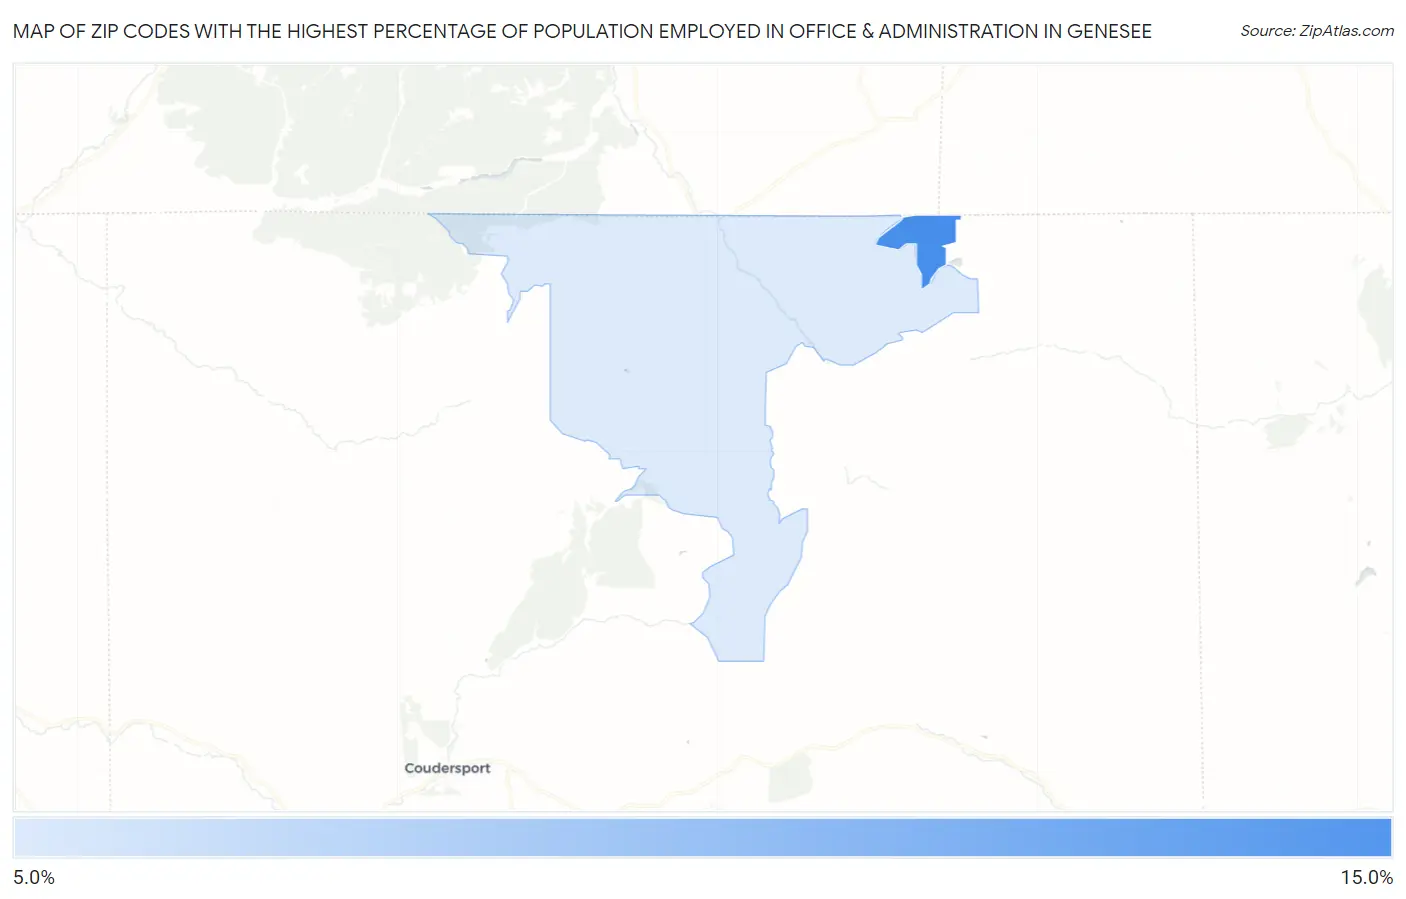
Map of Zip Codes with the Highest Percentage of Population Employed in Office & Administration in Genesee
9.6%
11.8%
Zip Codes with the Highest Percentage of Population Employed in Office & Administration in Genesee, PA
| Zip Code | % Employed | vs State | vs National | |
| 1. | 16941 | 11.8% | 10.9%(+0.877)#682 | 10.9%(+0.908)#11,451 |
| 2. | 16923 | 9.6% | 10.9%(-1.29)#1,071 | 10.9%(-1.26)#18,417 |
1
Common Questions
What are the Top Zip Codes with the Highest Percentage of Population Employed in Office & Administration in Genesee, PA?
Top Zip Codes with the Highest Percentage of Population Employed in Office & Administration in Genesee, PA are:
What zip code has the Highest Percentage of Population Employed in Office & Administration in Genesee, PA?
16941 has the Highest Percentage of Population Employed in Office & Administration in Genesee, PA with 11.8%.
What is the Percentage of Population Employed in Office & Administration in Pennsylvania?
Percentage of Population Employed in Office & Administration in Pennsylvania is 10.9%.
What is the Percentage of Population Employed in Office & Administration in the United States?
Percentage of Population Employed in Office & Administration in the United States is 10.9%.