Zip Codes with the Highest Percentage of Population Employed in Office & Administration in Edinboro, PA
RELATED REPORTS & OPTIONS
Office & Administration
Edinboro
Compare Zip Codes
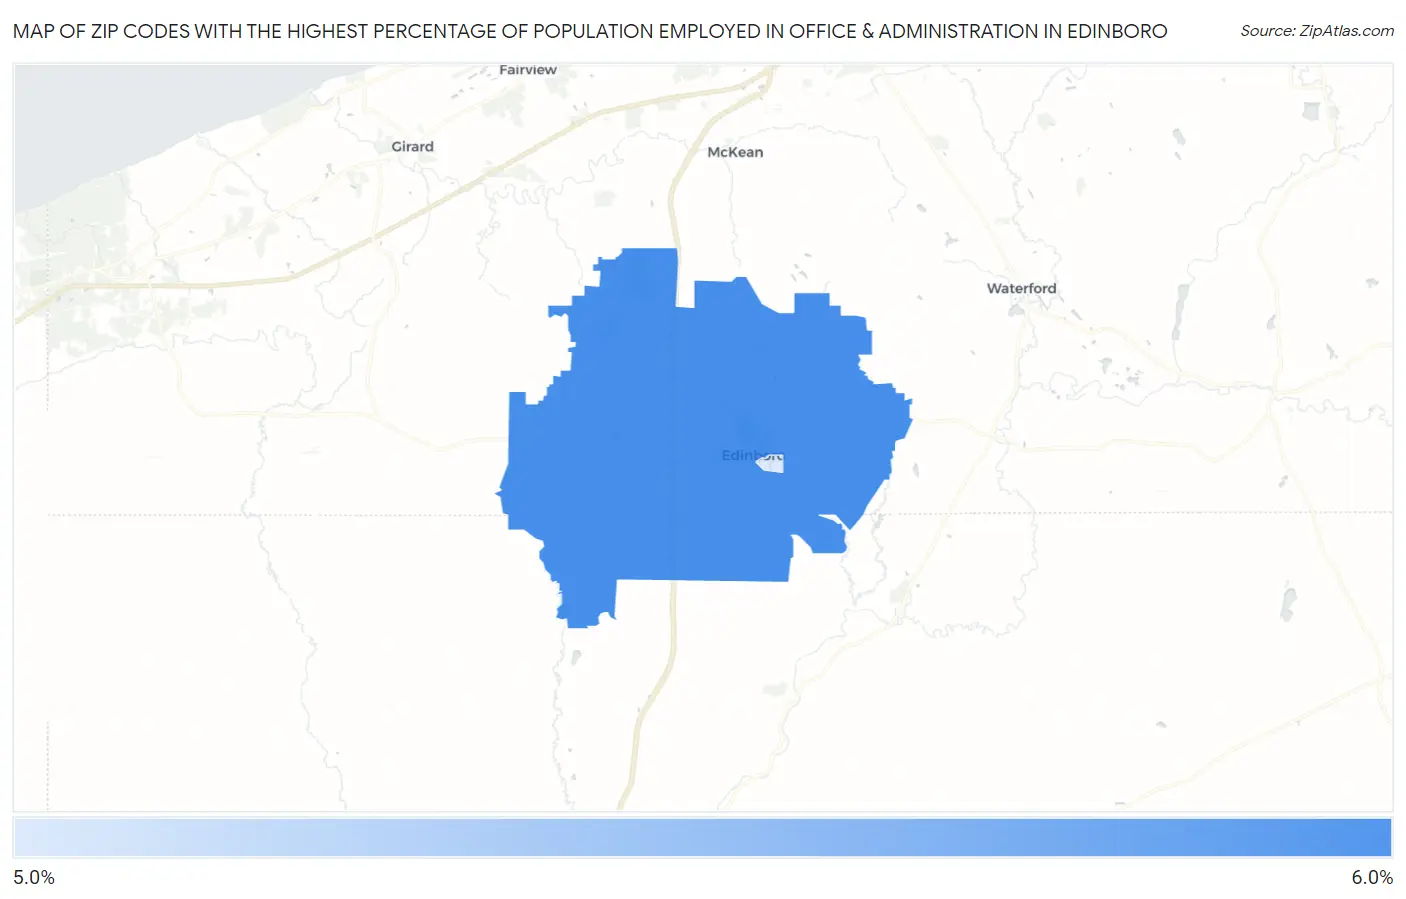
Map of Zip Codes with the Highest Percentage of Population Employed in Office & Administration in Edinboro
5.6%
5.6%
Zip Codes with the Highest Percentage of Population Employed in Office & Administration in Edinboro, PA
| Zip Code | % Employed | vs State | vs National | |
| 1. | 16412 | 5.6% | 10.9%(-5.24)#1,516 | 10.9%(-5.21)#27,344 |
| 2. | 16444 | 5.6% | 10.9%(-5.31)#1,521 | 10.9%(-5.28)#27,431 |
1
Common Questions
What are the Top Zip Codes with the Highest Percentage of Population Employed in Office & Administration in Edinboro, PA?
Top Zip Codes with the Highest Percentage of Population Employed in Office & Administration in Edinboro, PA are:
What zip code has the Highest Percentage of Population Employed in Office & Administration in Edinboro, PA?
16412 has the Highest Percentage of Population Employed in Office & Administration in Edinboro, PA with 5.6%.
What is the Percentage of Population Employed in Office & Administration in Pennsylvania?
Percentage of Population Employed in Office & Administration in Pennsylvania is 10.9%.
What is the Percentage of Population Employed in Office & Administration in the United States?
Percentage of Population Employed in Office & Administration in the United States is 10.9%.