Zip Codes with the Highest Percentage of Population Employed in Office & Administration in Lancaster, PA
RELATED REPORTS & OPTIONS
Office & Administration
Lancaster
Compare Zip Codes
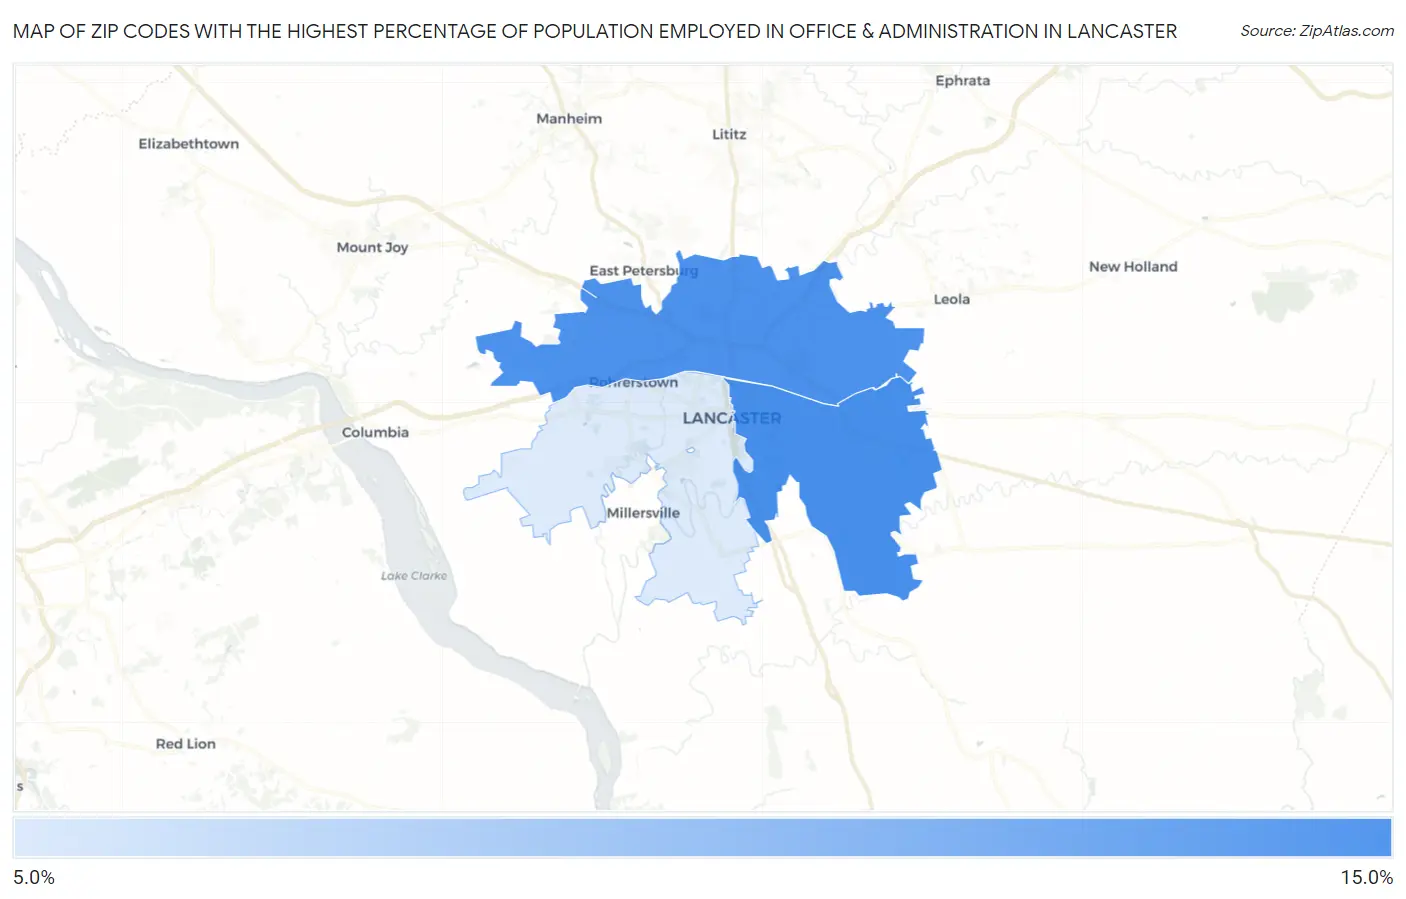
Map of Zip Codes with the Highest Percentage of Population Employed in Office & Administration in Lancaster
10.5%
11.0%
Zip Codes with the Highest Percentage of Population Employed in Office & Administration in Lancaster, PA
| Zip Code | % Employed | vs State | vs National | |
| 1. | 17602 | 11.0% | 10.9%(+0.082)#818 | 10.9%(+0.113)#13,926 |
| 2. | 17601 | 11.0% | 10.9%(+0.070)#821 | 10.9%(+0.102)#13,973 |
| 3. | 17603 | 10.5% | 10.9%(-0.415)#924 | 10.9%(-0.384)#15,578 |
1
Common Questions
What are the Top Zip Codes with the Highest Percentage of Population Employed in Office & Administration in Lancaster, PA?
Top Zip Codes with the Highest Percentage of Population Employed in Office & Administration in Lancaster, PA are:
What zip code has the Highest Percentage of Population Employed in Office & Administration in Lancaster, PA?
17602 has the Highest Percentage of Population Employed in Office & Administration in Lancaster, PA with 11.0%.
What is the Percentage of Population Employed in Office & Administration in Lancaster, PA?
Percentage of Population Employed in Office & Administration in Lancaster is 9.7%.
What is the Percentage of Population Employed in Office & Administration in Pennsylvania?
Percentage of Population Employed in Office & Administration in Pennsylvania is 10.9%.
What is the Percentage of Population Employed in Office & Administration in the United States?
Percentage of Population Employed in Office & Administration in the United States is 10.9%.