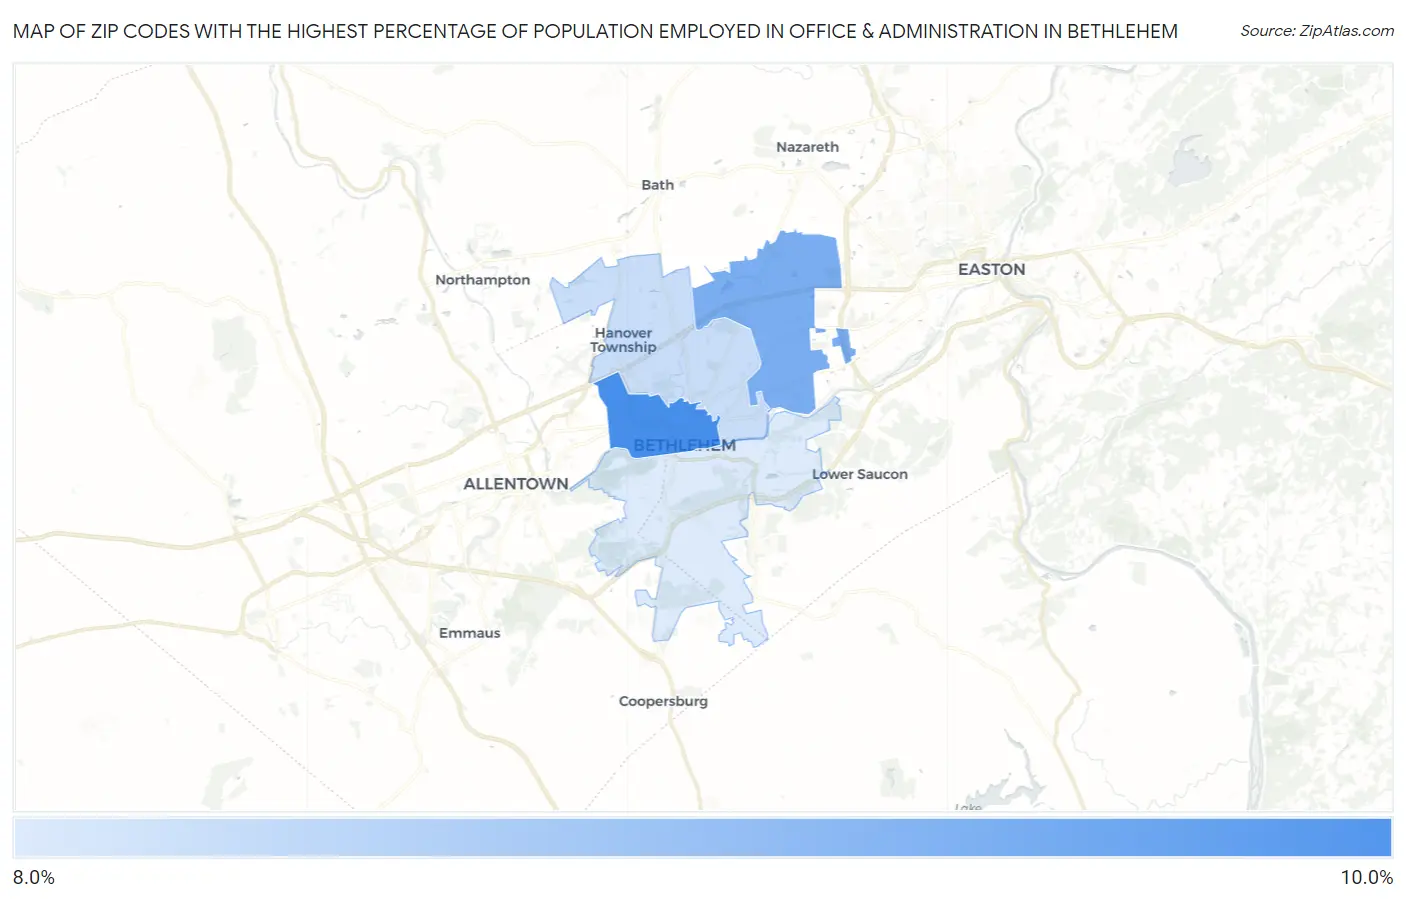
Zip Codes with the Highest Percentage of Population Employed in Office & Administration in Bethlehem, PA
RELATED REPORTS & OPTIONS
Office & Administration
Bethlehem
Compare Zip Codes
Map of Zip Codes with the Highest Percentage of Population Employed in Office & Administration in Bethlehem
8.4%
9.9%
Zip Codes with the Highest Percentage of Population Employed in Office & Administration in Bethlehem, PA
| Zip Code | % Employed | vs State | vs National | |
| 1. | 18018 | 9.9% | 10.9%(-1.01)#1,028 | 10.9%(-0.982)#17,539 |
| 2. | 18020 | 9.4% | 10.9%(-1.51)#1,107 | 10.9%(-1.48)#19,145 |
| 3. | 18017 | 8.6% | 10.9%(-2.25)#1,229 | 10.9%(-2.22)#21,312 |
| 4. | 18015 | 8.4% | 10.9%(-2.45)#1,266 | 10.9%(-2.42)#21,874 |
1
Common Questions
What are the Top 3 Zip Codes with the Highest Percentage of Population Employed in Office & Administration in Bethlehem, PA?
Top 3 Zip Codes with the Highest Percentage of Population Employed in Office & Administration in Bethlehem, PA are:
What zip code has the Highest Percentage of Population Employed in Office & Administration in Bethlehem, PA?
18018 has the Highest Percentage of Population Employed in Office & Administration in Bethlehem, PA with 9.9%.
What is the Percentage of Population Employed in Office & Administration in Bethlehem, PA?
Percentage of Population Employed in Office & Administration in Bethlehem is 8.9%.
What is the Percentage of Population Employed in Office & Administration in Pennsylvania?
Percentage of Population Employed in Office & Administration in Pennsylvania is 10.9%.
What is the Percentage of Population Employed in Office & Administration in the United States?
Percentage of Population Employed in Office & Administration in the United States is 10.9%.