Zip Codes with the Highest Percentage of Households with Income Above $100,000 in Springfield, OR
RELATED REPORTS & OPTIONS
Household Income | $100k+
Springfield
Compare Zip Codes
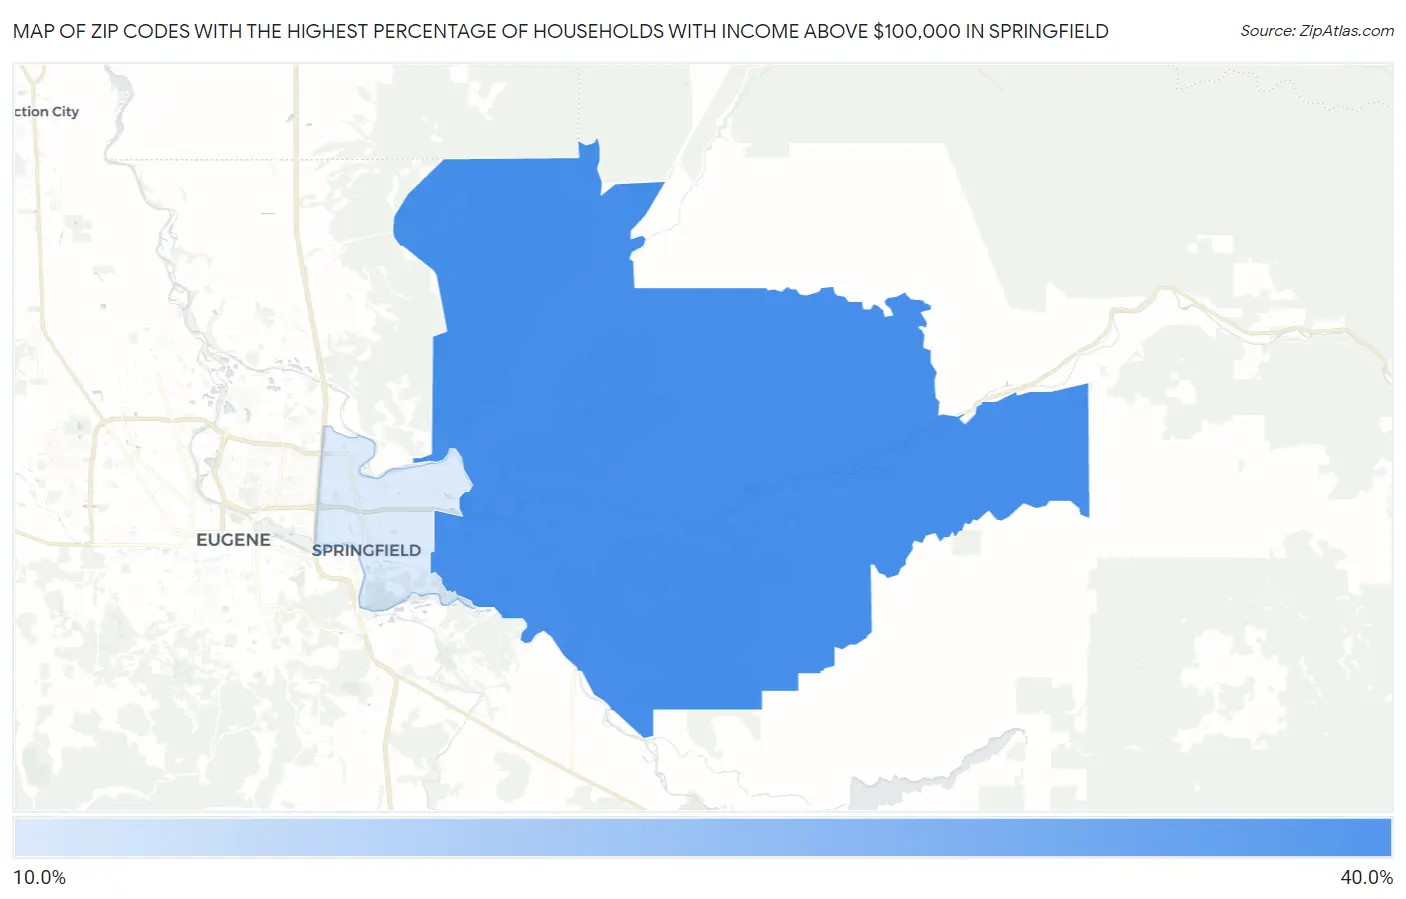
Map of Zip Codes with the Highest Percentage of Households with Income Above $100,000 in Springfield
20.0%
33.0%
Zip Codes with the Highest Percentage of Households with Income Above $100,000 in Springfield, OR
| Zip Code | Households with Income > $100k | vs State | vs National | |
| 1. | 97478 | 33.0% | 37.6%(-4.60)#178 | 37.3%(-4.30)#13,097 |
| 2. | 97477 | 20.0% | 37.6%(-17.6)#324 | 37.3%(-17.3)#24,014 |
1
Common Questions
What are the Top Zip Codes with the Highest Percentage of Households with Income Above $100,000 in Springfield, OR?
Top Zip Codes with the Highest Percentage of Households with Income Above $100,000 in Springfield, OR are:
What zip code has the Highest Percentage of Households with Income Above $100,000 in Springfield, OR?
97478 has the Highest Percentage of Households with Income Above $100,000 in Springfield, OR with 33.0%.
What is the Percentage of Households with Income Above $100,000 in Springfield, OR?
Percentage of Households with Income Above $100,000 in Springfield is 21.4%.
What is the Percentage of Households with Income Above $100,000 in Oregon?
Percentage of Households with Income Above $100,000 in Oregon is 37.6%.
What is the Percentage of Households with Income Above $100,000 in the United States?
Percentage of Households with Income Above $100,000 in the United States is 37.3%.