Zip Codes with the Highest Percentage of Households with Income Above $100,000 in Grants Pass, OR
RELATED REPORTS & OPTIONS
Household Income | $100k+
Grants Pass
Compare Zip Codes
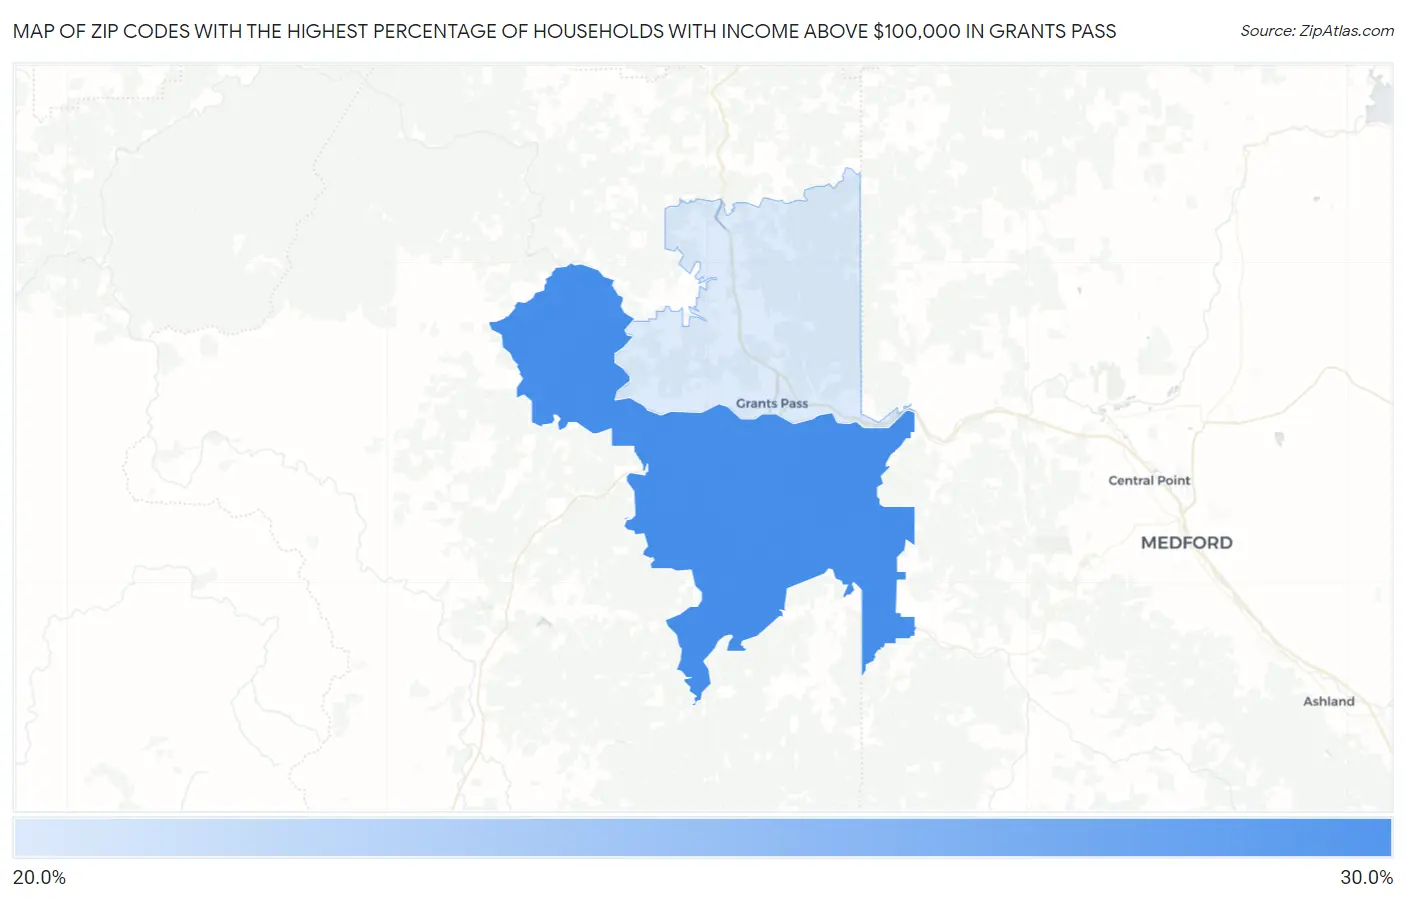
Map of Zip Codes with the Highest Percentage of Households with Income Above $100,000 in Grants Pass
25.0%
25.5%
Zip Codes with the Highest Percentage of Households with Income Above $100,000 in Grants Pass, OR
| Zip Code | Households with Income > $100k | vs State | vs National | |
| 1. | 97527 | 25.5% | 37.6%(-12.1)#266 | 37.3%(-11.8)#19,319 |
| 2. | 97526 | 25.0% | 37.6%(-12.6)#274 | 37.3%(-12.3)#19,739 |
1
Common Questions
What are the Top Zip Codes with the Highest Percentage of Households with Income Above $100,000 in Grants Pass, OR?
Top Zip Codes with the Highest Percentage of Households with Income Above $100,000 in Grants Pass, OR are:
What zip code has the Highest Percentage of Households with Income Above $100,000 in Grants Pass, OR?
97527 has the Highest Percentage of Households with Income Above $100,000 in Grants Pass, OR with 25.5%.
What is the Percentage of Households with Income Above $100,000 in Grants Pass, OR?
Percentage of Households with Income Above $100,000 in Grants Pass is 23.2%.
What is the Percentage of Households with Income Above $100,000 in Oregon?
Percentage of Households with Income Above $100,000 in Oregon is 37.6%.
What is the Percentage of Households with Income Above $100,000 in the United States?
Percentage of Households with Income Above $100,000 in the United States is 37.3%.