Tangent, OR Map & Demographics
Tangent Map
Tangent Overview
$33,358
PER CAPITA INCOME
$88,393
AVG FAMILY INCOME
$83,500
AVG HOUSEHOLD INCOME
34.8%
WAGE / INCOME GAP [ % ]
65.2¢/ $1
WAGE / INCOME GAP [ $ ]
0.40
INEQUALITY / GINI INDEX
1,299
TOTAL POPULATION
710
MALE POPULATION
589
FEMALE POPULATION
120.54
MALES / 100 FEMALES
82.96
FEMALES / 100 MALES
40.1
MEDIAN AGE
2.9
AVG FAMILY SIZE
2.8
AVG HOUSEHOLD SIZE
691
LABOR FORCE [ PEOPLE ]
64.8%
PERCENT IN LABOR FORCE
5.8%
UNEMPLOYMENT RATE
Tangent Zip Codes
Tangent Area Codes
Income in Tangent
Income Overview in Tangent
Per Capita Income in Tangent is $33,358, while median incomes of families and households are $88,393 and $83,500 respectively.
| Characteristic | Number | Measure |
| Per Capita Income | 1,299 | $33,358 |
| Median Family Income | 367 | $88,393 |
| Mean Family Income | 367 | $98,434 |
| Median Household Income | 464 | $83,500 |
| Mean Household Income | 464 | $92,666 |
| Income Deficit | 367 | $0 |
| Wage / Income Gap (%) | 1,299 | 34.82% |
| Wage / Income Gap ($) | 1,299 | 65.18¢ per $1 |
| Gini / Inequality Index | 1,299 | 0.40 |
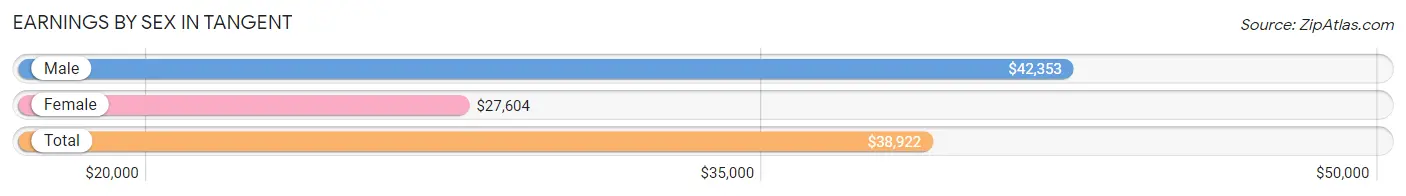
Earnings by Sex in Tangent
Average Earnings in Tangent are $38,922, $42,353 for men and $27,604 for women, a difference of 34.8%.
| Sex | Number | Average Earnings |
| Male | 424 (57.8%) | $42,353 |
| Female | 309 (42.2%) | $27,604 |
| Total | 733 (100.0%) | $38,922 |
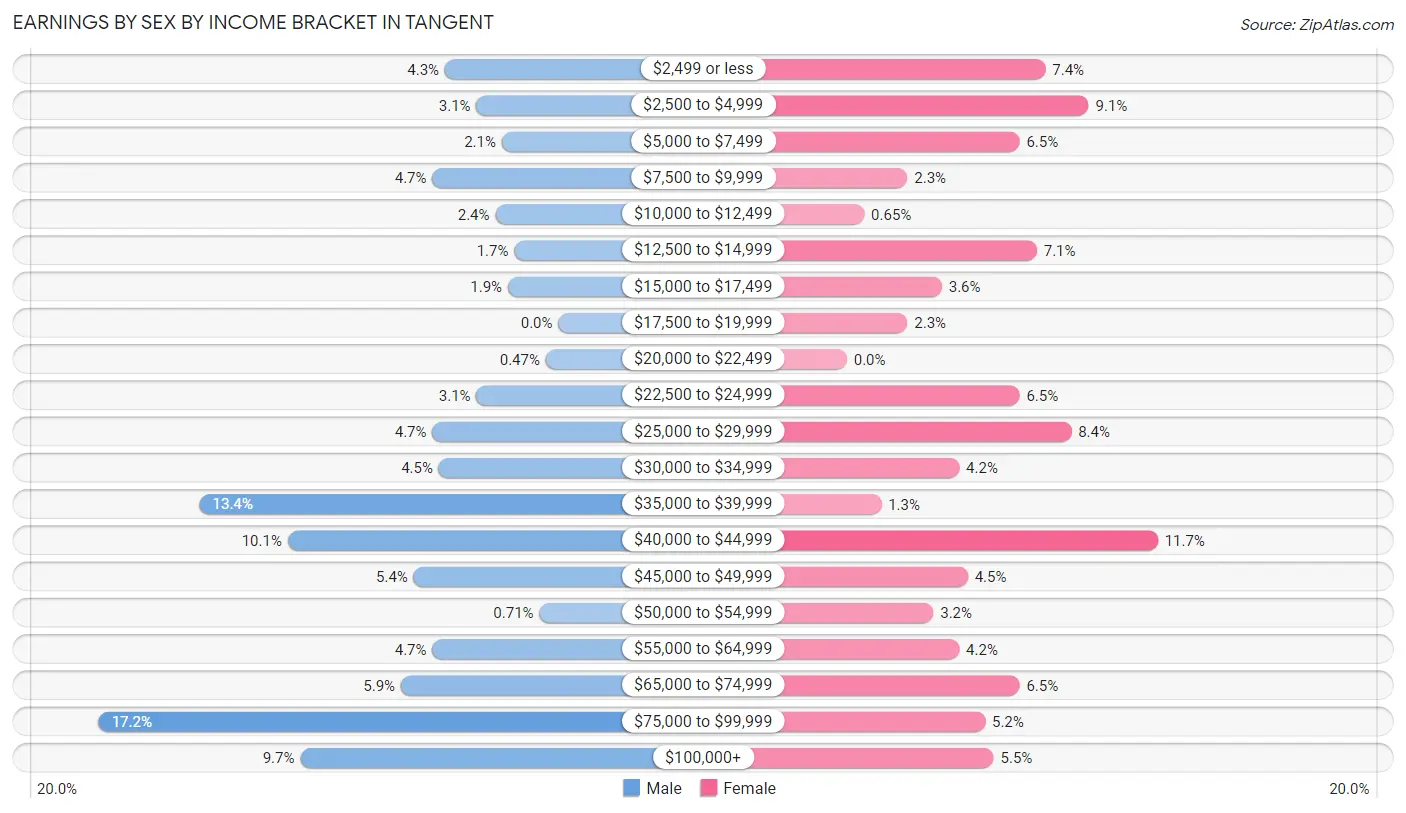
Earnings by Sex by Income Bracket in Tangent
The most common earnings brackets in Tangent are $75,000 to $99,999 for men (73 | 17.2%) and $40,000 to $44,999 for women (36 | 11.7%).
| Income | Male | Female |
| $2,499 or less | 18 (4.3%) | 23 (7.4%) |
| $2,500 to $4,999 | 13 (3.1%) | 28 (9.1%) |
| $5,000 to $7,499 | 9 (2.1%) | 20 (6.5%) |
| $7,500 to $9,999 | 20 (4.7%) | 7 (2.3%) |
| $10,000 to $12,499 | 10 (2.4%) | 2 (0.6%) |
| $12,500 to $14,999 | 7 (1.7%) | 22 (7.1%) |
| $15,000 to $17,499 | 8 (1.9%) | 11 (3.6%) |
| $17,500 to $19,999 | 0 (0.0%) | 7 (2.3%) |
| $20,000 to $22,499 | 2 (0.5%) | 0 (0.0%) |
| $22,500 to $24,999 | 13 (3.1%) | 20 (6.5%) |
| $25,000 to $29,999 | 20 (4.7%) | 26 (8.4%) |
| $30,000 to $34,999 | 19 (4.5%) | 13 (4.2%) |
| $35,000 to $39,999 | 57 (13.4%) | 4 (1.3%) |
| $40,000 to $44,999 | 43 (10.1%) | 36 (11.7%) |
| $45,000 to $49,999 | 23 (5.4%) | 14 (4.5%) |
| $50,000 to $54,999 | 3 (0.7%) | 10 (3.2%) |
| $55,000 to $64,999 | 20 (4.7%) | 13 (4.2%) |
| $65,000 to $74,999 | 25 (5.9%) | 20 (6.5%) |
| $75,000 to $99,999 | 73 (17.2%) | 16 (5.2%) |
| $100,000+ | 41 (9.7%) | 17 (5.5%) |
| Total | 424 (100.0%) | 309 (100.0%) |
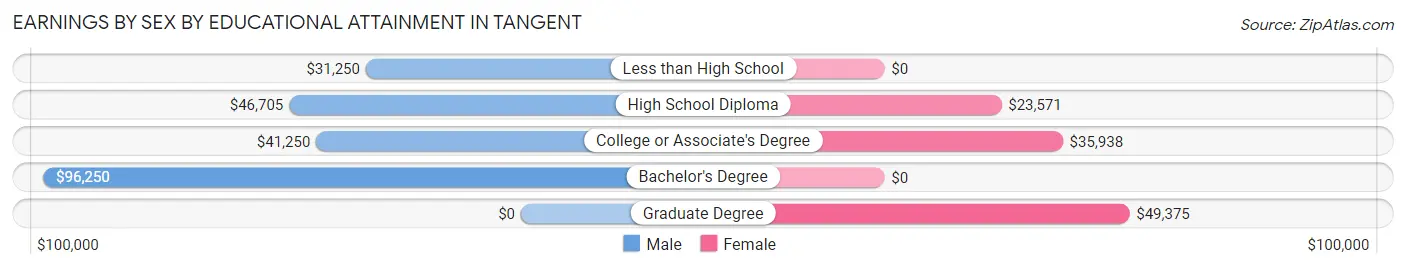
Earnings by Sex by Educational Attainment in Tangent
Average earnings in Tangent are $45,119 for men and $30,000 for women, a difference of 33.5%. Men with an educational attainment of bachelor's degree enjoy the highest average annual earnings of $96,250, while those with less than high school education earn the least with $31,250. Women with an educational attainment of graduate degree earn the most with the average annual earnings of $49,375, while those with high school diploma education have the smallest earnings of $23,571.
| Educational Attainment | Male Income | Female Income |
| Less than High School | $31,250 | $0 |
| High School Diploma | $46,705 | $23,571 |
| College or Associate's Degree | $41,250 | $35,938 |
| Bachelor's Degree | $96,250 | $0 |
| Graduate Degree | - | - |
| Total | $45,119 | $30,000 |
Family Income in Tangent
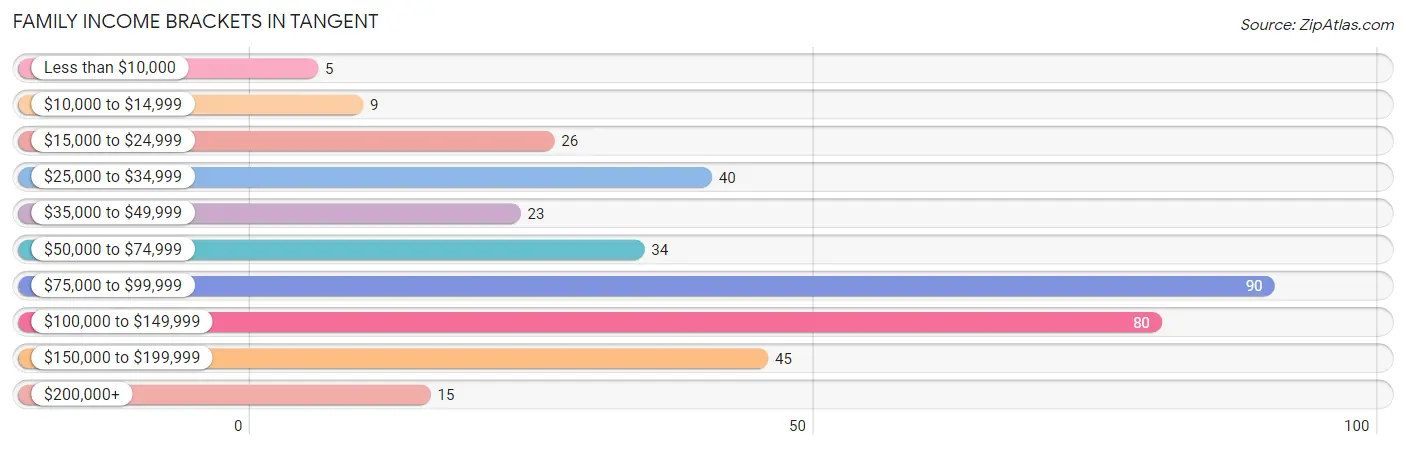
Family Income Brackets in Tangent
According to the Tangent family income data, there are 90 families falling into the $75,000 to $99,999 income range, which is the most common income bracket and makes up 24.5% of all families. Conversely, the less than $10,000 income bracket is the least frequent group with only 5 families (1.4%) belonging to this category.
| Income Bracket | # Families | % Families |
| Less than $10,000 | 5 | 1.4% |
| $10,000 to $14,999 | 9 | 2.5% |
| $15,000 to $24,999 | 26 | 7.1% |
| $25,000 to $34,999 | 40 | 10.9% |
| $35,000 to $49,999 | 23 | 6.3% |
| $50,000 to $74,999 | 34 | 9.3% |
| $75,000 to $99,999 | 90 | 24.5% |
| $100,000 to $149,999 | 80 | 21.8% |
| $150,000 to $199,999 | 45 | 12.3% |
| $200,000+ | 15 | 4.1% |
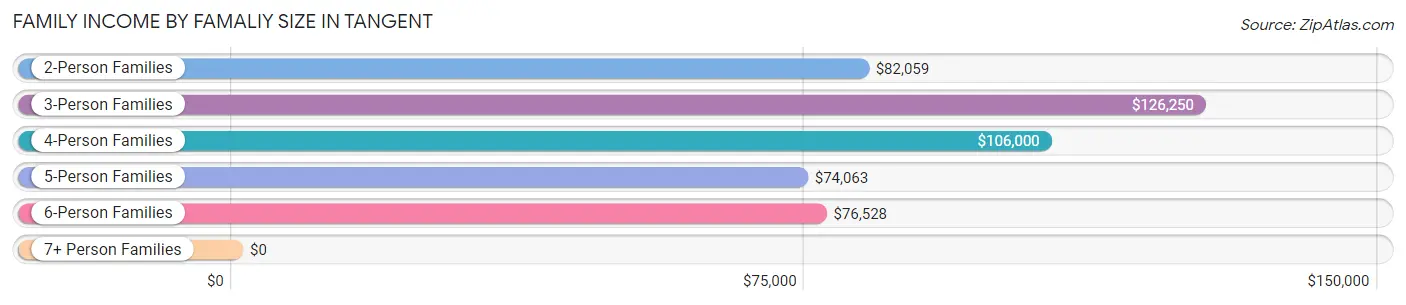
Family Income by Famaliy Size in Tangent
3-person families (83 | 22.6%) account for the highest median family income in Tangent with $126,250 per family, while 3-person families (83 | 22.6%) have the highest median income of $42,083 per family member.
| Income Bracket | # Families | Median Income |
| 2-Person Families | 192 (52.3%) | $82,059 |
| 3-Person Families | 83 (22.6%) | $126,250 |
| 4-Person Families | 56 (15.3%) | $106,000 |
| 5-Person Families | 15 (4.1%) | $74,063 |
| 6-Person Families | 21 (5.7%) | $76,528 |
| 7+ Person Families | 0 (0.0%) | $0 |
| Total | 367 (100.0%) | $88,393 |
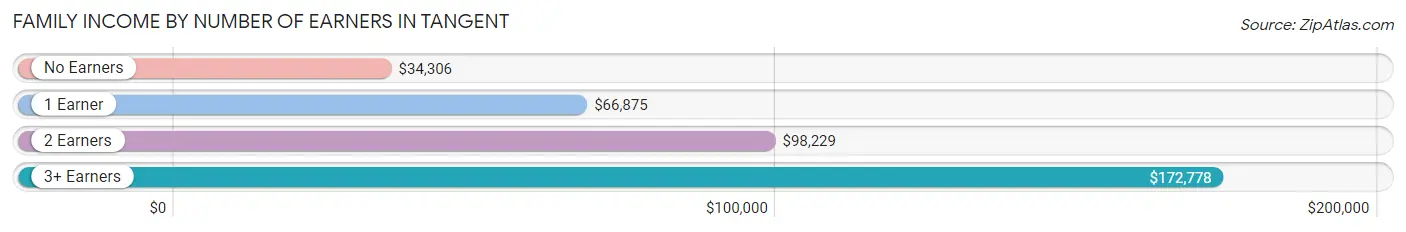
Family Income by Number of Earners in Tangent
The median family income in Tangent is $88,393, with families comprising 3+ earners (60) having the highest median family income of $172,778, while families with no earners (49) have the lowest median family income of $34,306, accounting for 16.4% and 13.4% of families, respectively.
| Number of Earners | # Families | Median Income |
| No Earners | 49 (13.4%) | $34,306 |
| 1 Earner | 119 (32.4%) | $66,875 |
| 2 Earners | 139 (37.9%) | $98,229 |
| 3+ Earners | 60 (16.4%) | $172,778 |
| Total | 367 (100.0%) | $88,393 |
Household Income in Tangent
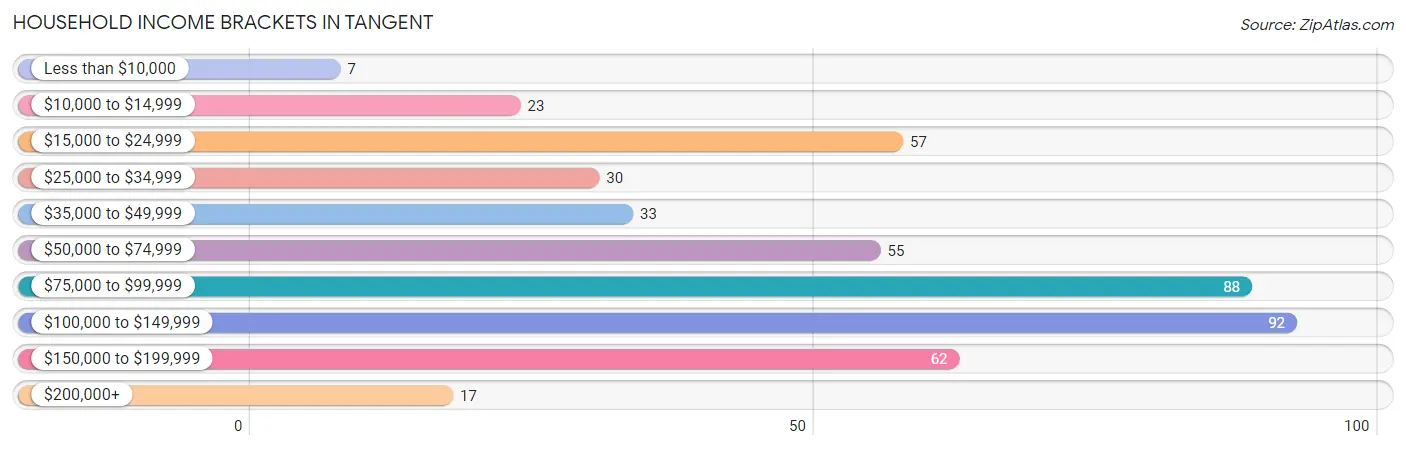
Household Income Brackets in Tangent
With 92 households falling in the category, the $100,000 to $149,999 income range is the most frequent in Tangent, accounting for 19.8% of all households. In contrast, only 7 households (1.5%) fall into the less than $10,000 income bracket, making it the least populous group.
| Income Bracket | # Households | % Households |
| Less than $10,000 | 7 | 1.5% |
| $10,000 to $14,999 | 23 | 5.0% |
| $15,000 to $24,999 | 57 | 12.3% |
| $25,000 to $34,999 | 30 | 6.5% |
| $35,000 to $49,999 | 33 | 7.1% |
| $50,000 to $74,999 | 55 | 11.9% |
| $75,000 to $99,999 | 88 | 19.0% |
| $100,000 to $149,999 | 92 | 19.8% |
| $150,000 to $199,999 | 62 | 13.4% |
| $200,000+ | 17 | 3.7% |
Household Income by Householder Age in Tangent
The median household income in Tangent is $83,500, with the highest median household income of $108,281 found in the 45 to 64 years age bracket for the primary householder. A total of 201 households (43.3%) fall into this category. Meanwhile, the 65+ years age bracket for the primary householder has the lowest median household income of $44,583, with 109 households (23.5%) in this group.
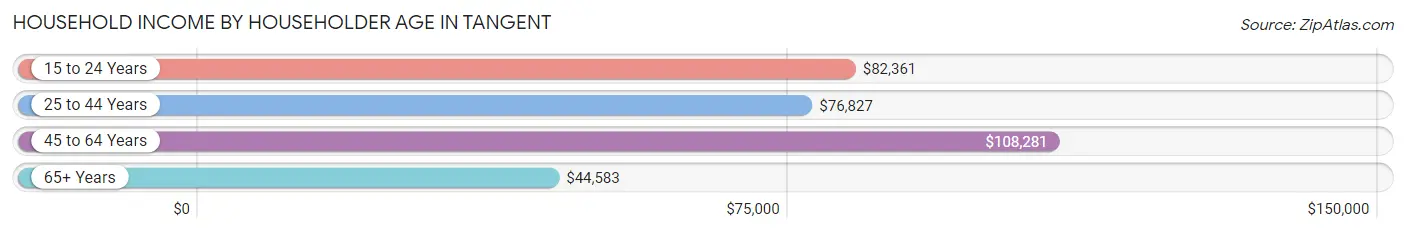
| Income Bracket | # Households | Median Income |
| 15 to 24 Years | 23 (5.0%) | $82,361 |
| 25 to 44 Years | 131 (28.2%) | $76,827 |
| 45 to 64 Years | 201 (43.3%) | $108,281 |
| 65+ Years | 109 (23.5%) | $44,583 |
| Total | 464 (100.0%) | $83,500 |
Poverty in Tangent
Income Below Poverty by Sex and Age in Tangent
With 16.8% poverty level for males and 15.1% for females among the residents of Tangent, 15 year old males and 35 to 44 year old females are the most vulnerable to poverty, with 12 males (100.0%) and 18 females (26.5%) in their respective age groups living below the poverty level.
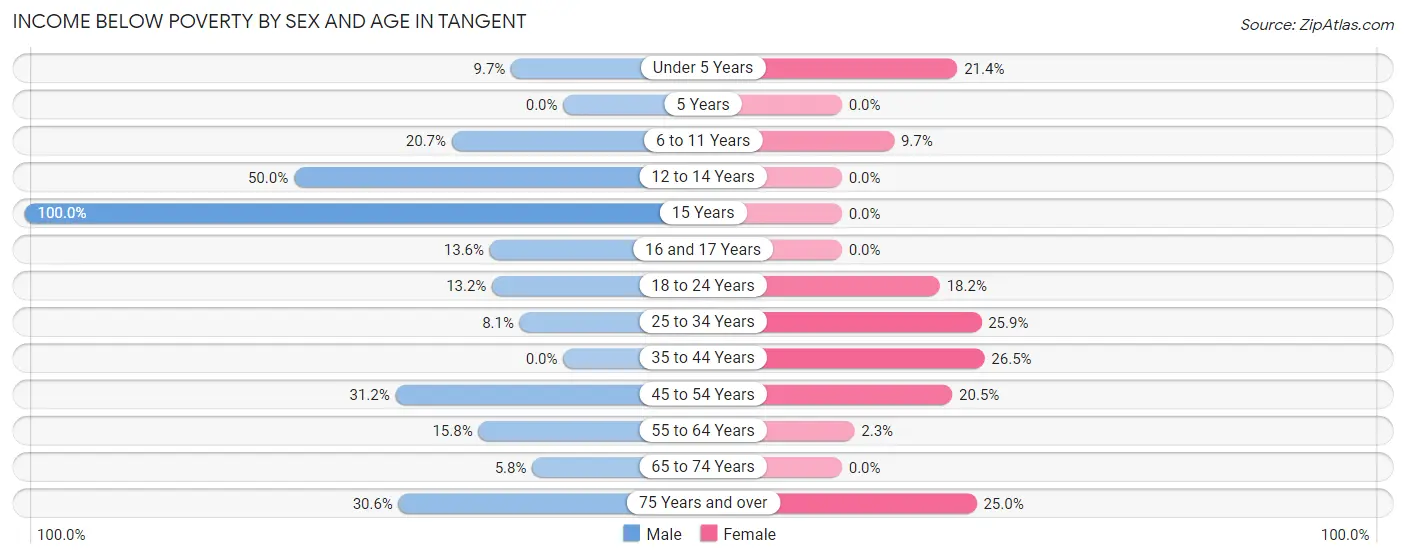
| Age Bracket | Male | Female |
| Under 5 Years | 3 (9.7%) | 3 (21.4%) |
| 5 Years | 0 (0.0%) | 0 (0.0%) |
| 6 to 11 Years | 12 (20.7%) | 6 (9.7%) |
| 12 to 14 Years | 15 (50.0%) | 0 (0.0%) |
| 15 Years | 12 (100.0%) | 0 (0.0%) |
| 16 and 17 Years | 3 (13.6%) | 0 (0.0%) |
| 18 to 24 Years | 7 (13.2%) | 12 (18.2%) |
| 25 to 34 Years | 11 (8.1%) | 22 (25.9%) |
| 35 to 44 Years | 0 (0.0%) | 18 (26.5%) |
| 45 to 54 Years | 19 (31.1%) | 17 (20.5%) |
| 55 to 64 Years | 23 (15.8%) | 2 (2.3%) |
| 65 to 74 Years | 3 (5.8%) | 0 (0.0%) |
| 75 Years and over | 11 (30.6%) | 9 (25.0%) |
| Total | 119 (16.8%) | 89 (15.1%) |
Income Above Poverty by Sex and Age in Tangent
According to the poverty statistics in Tangent, males aged 35 to 44 years and females aged 5 years are the age groups that are most secure financially, with 100.0% of males and 100.0% of females in these age groups living above the poverty line.
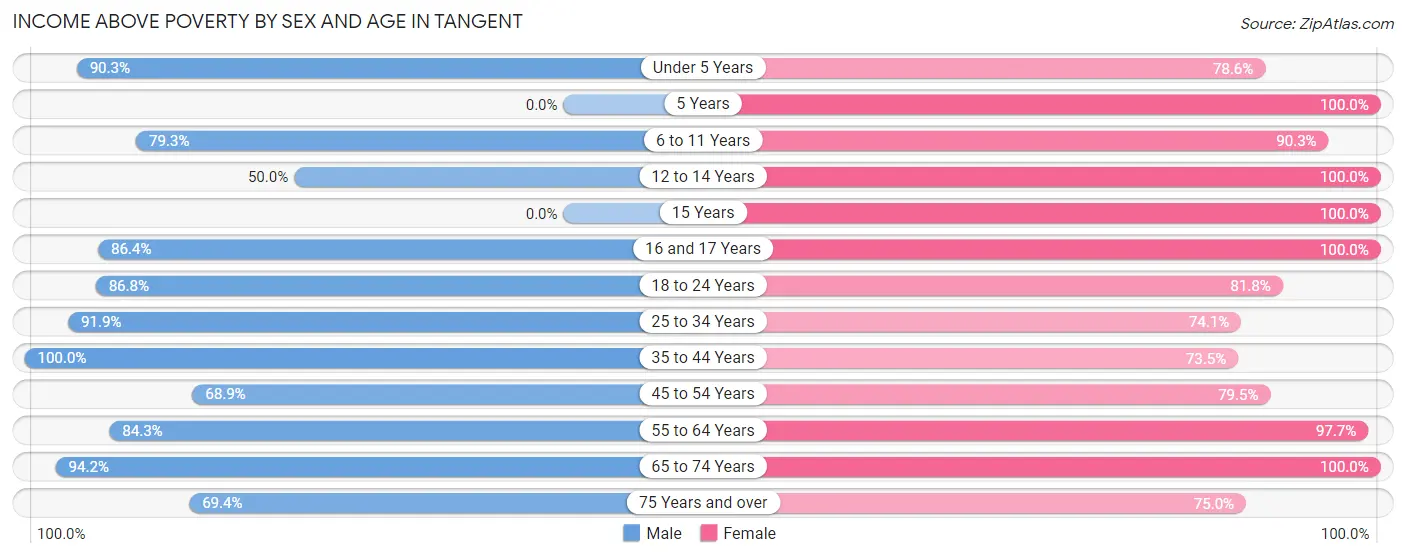
| Age Bracket | Male | Female |
| Under 5 Years | 28 (90.3%) | 11 (78.6%) |
| 5 Years | 0 (0.0%) | 3 (100.0%) |
| 6 to 11 Years | 46 (79.3%) | 56 (90.3%) |
| 12 to 14 Years | 15 (50.0%) | 20 (100.0%) |
| 15 Years | 0 (0.0%) | 3 (100.0%) |
| 16 and 17 Years | 19 (86.4%) | 4 (100.0%) |
| 18 to 24 Years | 46 (86.8%) | 54 (81.8%) |
| 25 to 34 Years | 125 (91.9%) | 63 (74.1%) |
| 35 to 44 Years | 73 (100.0%) | 50 (73.5%) |
| 45 to 54 Years | 42 (68.9%) | 66 (79.5%) |
| 55 to 64 Years | 123 (84.3%) | 84 (97.7%) |
| 65 to 74 Years | 49 (94.2%) | 59 (100.0%) |
| 75 Years and over | 25 (69.4%) | 27 (75.0%) |
| Total | 591 (83.2%) | 500 (84.9%) |
Income Below Poverty Among Married-Couple Families in Tangent
The poverty statistics for married-couple families in Tangent show that 4.0% or 10 of the total 251 families live below the poverty line. Families with 1 or 2 children have the highest poverty rate of 10.1%, comprising of 8 families. On the other hand, families with 3 or 4 children have the lowest poverty rate of 0.0%, which includes 0 families.
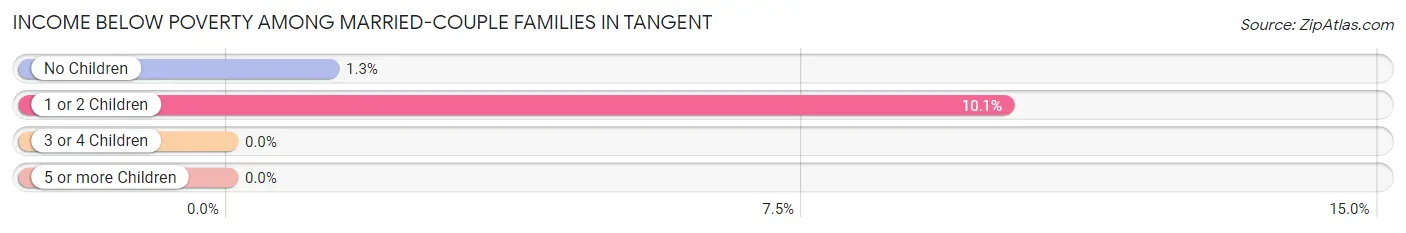
| Children | Above Poverty | Below Poverty |
| No Children | 150 (98.7%) | 2 (1.3%) |
| 1 or 2 Children | 71 (89.9%) | 8 (10.1%) |
| 3 or 4 Children | 20 (100.0%) | 0 (0.0%) |
| 5 or more Children | 0 (0.0%) | 0 (0.0%) |
| Total | 241 (96.0%) | 10 (4.0%) |
Income Below Poverty Among Single-Parent Households in Tangent
According to the poverty data in Tangent, 22.0% or 9 single-father households and 20.0% or 15 single-mother households are living below the poverty line. Among single-father households, those with no children have the highest poverty rate, with 9 households (22.0%) experiencing poverty. Likewise, among single-mother households, those with 1 or 2 children have the highest poverty rate, with 15 households (39.5%) falling below the poverty line.
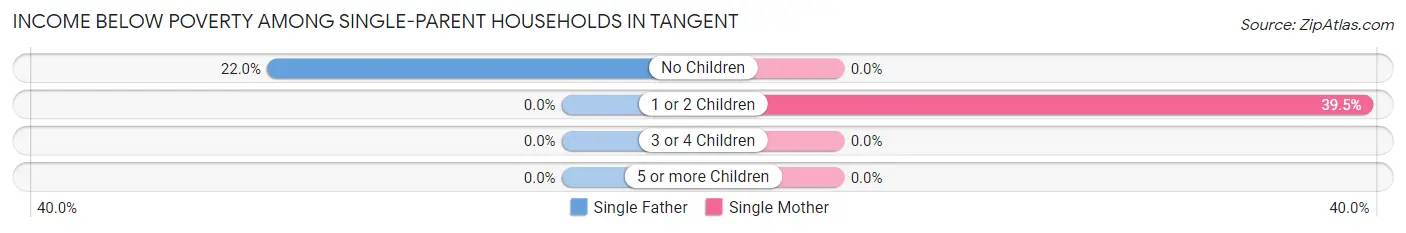
| Children | Single Father | Single Mother |
| No Children | 9 (22.0%) | 0 (0.0%) |
| 1 or 2 Children | 0 (0.0%) | 15 (39.5%) |
| 3 or 4 Children | 0 (0.0%) | 0 (0.0%) |
| 5 or more Children | 0 (0.0%) | 0 (0.0%) |
| Total | 9 (22.0%) | 15 (20.0%) |
Income Below Poverty Among Married-Couple vs Single-Parent Households in Tangent
The poverty data for Tangent shows that 10 of the married-couple family households (4.0%) and 24 of the single-parent households (20.7%) are living below the poverty level. Within the married-couple family households, those with 1 or 2 children have the highest poverty rate, with 8 households (10.1%) falling below the poverty line. Among the single-parent households, those with 1 or 2 children have the highest poverty rate, with 15 household (39.5%) living below poverty.
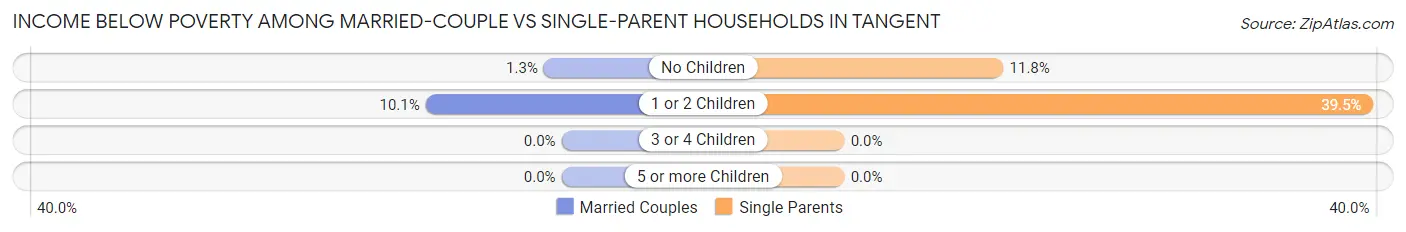
| Children | Married-Couple Families | Single-Parent Households |
| No Children | 2 (1.3%) | 9 (11.8%) |
| 1 or 2 Children | 8 (10.1%) | 15 (39.5%) |
| 3 or 4 Children | 0 (0.0%) | 0 (0.0%) |
| 5 or more Children | 0 (0.0%) | 0 (0.0%) |
| Total | 10 (4.0%) | 24 (20.7%) |
Race in Tangent
The most populous races in Tangent are White / Caucasian (1,176 | 90.5%), Hispanic or Latino (162 | 12.5%), and Some other Race (61 | 4.7%).
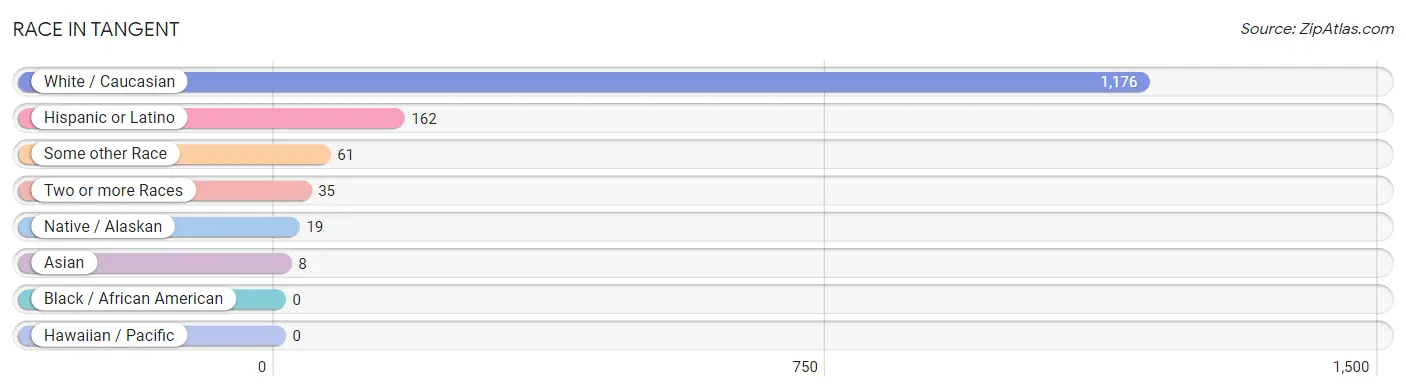
| Race | # Population | % Population |
| Asian | 8 | 0.6% |
| Black / African American | 0 | 0.0% |
| Hawaiian / Pacific | 0 | 0.0% |
| Hispanic or Latino | 162 | 12.5% |
| Native / Alaskan | 19 | 1.5% |
| White / Caucasian | 1,176 | 90.5% |
| Two or more Races | 35 | 2.7% |
| Some other Race | 61 | 4.7% |
| Total | 1,299 | 100.0% |
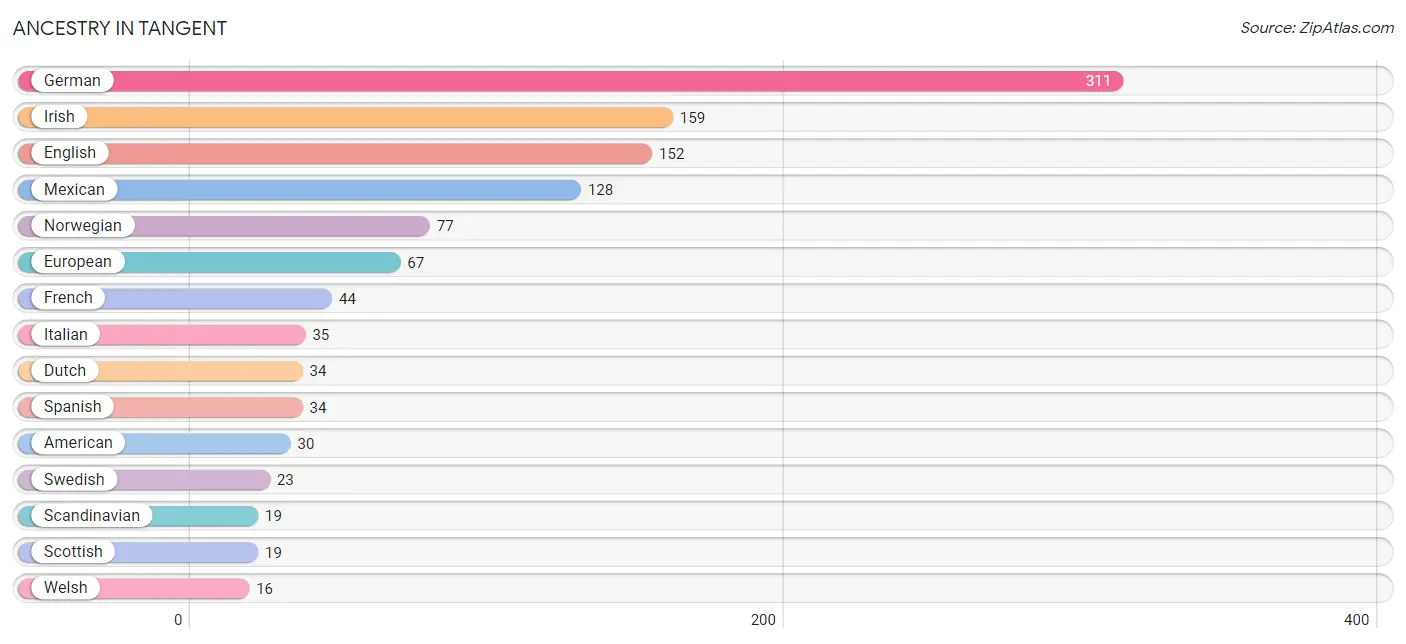
Ancestry in Tangent
The most populous ancestries reported in Tangent are German (311 | 23.9%), Irish (159 | 12.2%), English (152 | 11.7%), Mexican (128 | 9.9%), and Norwegian (77 | 5.9%), together accounting for 63.7% of all Tangent residents.
| Ancestry | # Population | % Population |
| American | 30 | 2.3% |
| Armenian | 2 | 0.2% |
| Austrian | 3 | 0.2% |
| British | 13 | 1.0% |
| Burmese | 3 | 0.2% |
| Canadian | 3 | 0.2% |
| Cherokee | 13 | 1.0% |
| Chickasaw | 6 | 0.5% |
| Croatian | 4 | 0.3% |
| Czechoslovakian | 7 | 0.5% |
| Danish | 11 | 0.9% |
| Dutch | 34 | 2.6% |
| Eastern European | 6 | 0.5% |
| English | 152 | 11.7% |
| European | 67 | 5.2% |
| Finnish | 1 | 0.1% |
| French | 44 | 3.4% |
| French American Indian | 1 | 0.1% |
| French Canadian | 4 | 0.3% |
| German | 311 | 23.9% |
| Greek | 3 | 0.2% |
| Indian (Asian) | 3 | 0.2% |
| Irish | 159 | 12.2% |
| Italian | 35 | 2.7% |
| Mexican | 128 | 9.9% |
| Norwegian | 77 | 5.9% |
| Polish | 7 | 0.5% |
| Russian | 12 | 0.9% |
| Scandinavian | 19 | 1.5% |
| Scotch-Irish | 9 | 0.7% |
| Scottish | 19 | 1.5% |
| Sioux | 1 | 0.1% |
| Spanish | 34 | 2.6% |
| Swedish | 23 | 1.8% |
| Swiss | 7 | 0.5% |
| Thai | 5 | 0.4% |
| Welsh | 16 | 1.2% | View All 37 Rows |
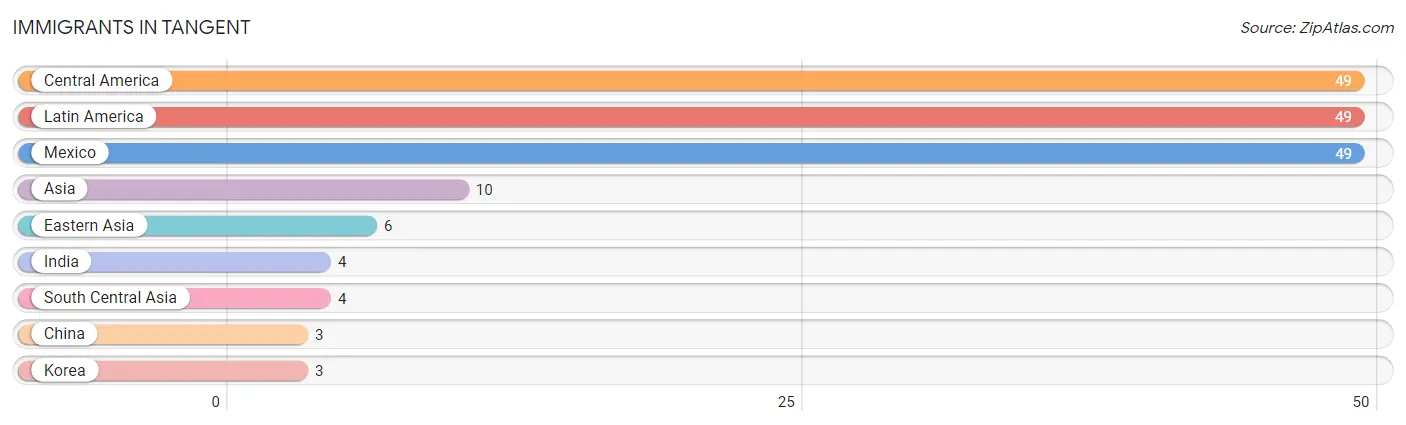
Immigrants in Tangent
The most numerous immigrant groups reported in Tangent came from Central America (49 | 3.8%), Latin America (49 | 3.8%), Mexico (49 | 3.8%), Asia (10 | 0.8%), and Eastern Asia (6 | 0.5%), together accounting for 12.5% of all Tangent residents.
| Immigration Origin | # Population | % Population |
| Asia | 10 | 0.8% |
| Central America | 49 | 3.8% |
| China | 3 | 0.2% |
| Eastern Asia | 6 | 0.5% |
| India | 4 | 0.3% |
| Korea | 3 | 0.2% |
| Latin America | 49 | 3.8% |
| Mexico | 49 | 3.8% |
| South Central Asia | 4 | 0.3% | View All 9 Rows |
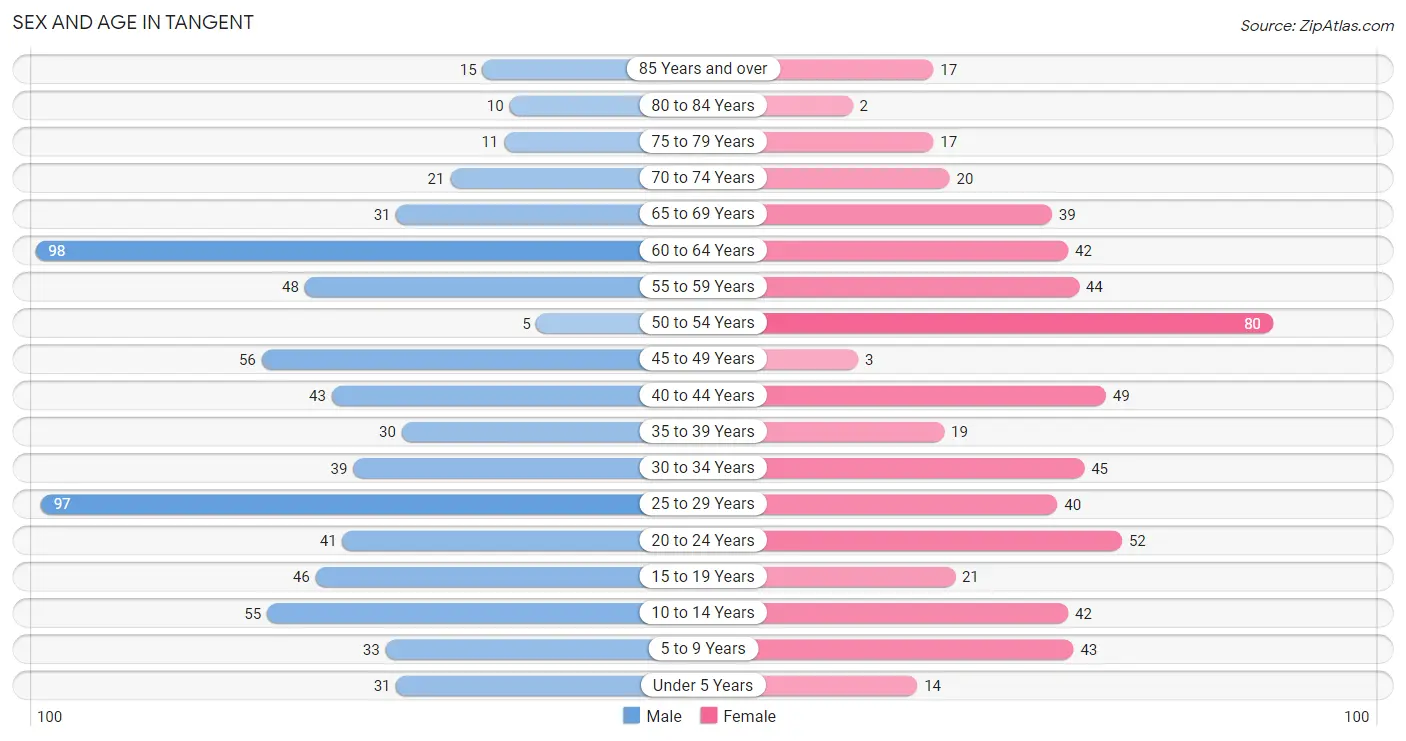
Sex and Age in Tangent
Sex and Age in Tangent
The most populous age groups in Tangent are 60 to 64 Years (98 | 13.8%) for men and 50 to 54 Years (80 | 13.6%) for women.
| Age Bracket | Male | Female |
| Under 5 Years | 31 (4.4%) | 14 (2.4%) |
| 5 to 9 Years | 33 (4.6%) | 43 (7.3%) |
| 10 to 14 Years | 55 (7.7%) | 42 (7.1%) |
| 15 to 19 Years | 46 (6.5%) | 21 (3.6%) |
| 20 to 24 Years | 41 (5.8%) | 52 (8.8%) |
| 25 to 29 Years | 97 (13.7%) | 40 (6.8%) |
| 30 to 34 Years | 39 (5.5%) | 45 (7.6%) |
| 35 to 39 Years | 30 (4.2%) | 19 (3.2%) |
| 40 to 44 Years | 43 (6.1%) | 49 (8.3%) |
| 45 to 49 Years | 56 (7.9%) | 3 (0.5%) |
| 50 to 54 Years | 5 (0.7%) | 80 (13.6%) |
| 55 to 59 Years | 48 (6.8%) | 44 (7.5%) |
| 60 to 64 Years | 98 (13.8%) | 42 (7.1%) |
| 65 to 69 Years | 31 (4.4%) | 39 (6.6%) |
| 70 to 74 Years | 21 (3.0%) | 20 (3.4%) |
| 75 to 79 Years | 11 (1.5%) | 17 (2.9%) |
| 80 to 84 Years | 10 (1.4%) | 2 (0.3%) |
| 85 Years and over | 15 (2.1%) | 17 (2.9%) |
| Total | 710 (100.0%) | 589 (100.0%) |
Families and Households in Tangent
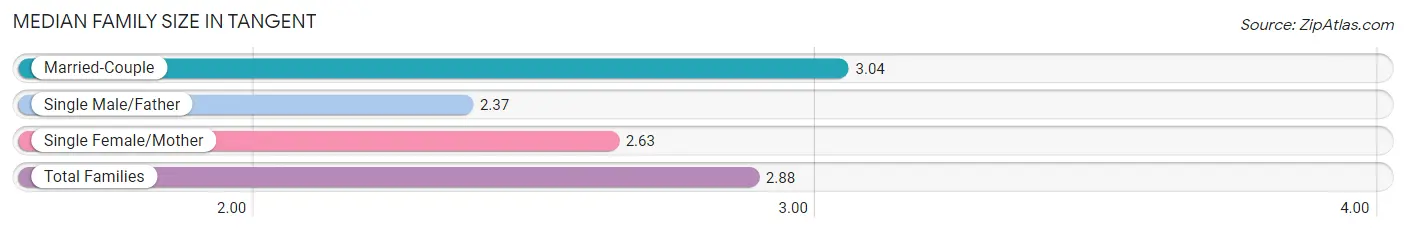
Median Family Size in Tangent
The median family size in Tangent is 2.88 persons per family, with married-couple families (251 | 68.4%) accounting for the largest median family size of 3.04 persons per family. On the other hand, single male/father families (41 | 11.2%) represent the smallest median family size with 2.37 persons per family.
| Family Type | # Families | Family Size |
| Married-Couple | 251 (68.4%) | 3.04 |
| Single Male/Father | 41 (11.2%) | 2.37 |
| Single Female/Mother | 75 (20.4%) | 2.63 |
| Total Families | 367 (100.0%) | 2.88 |
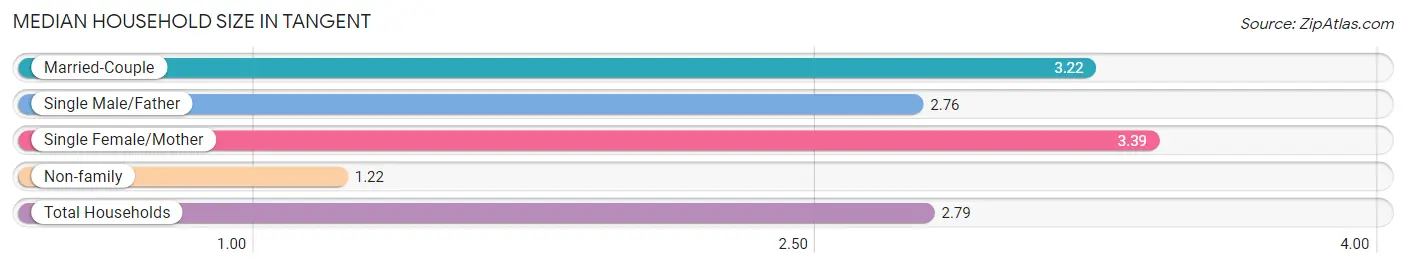
Median Household Size in Tangent
The median household size in Tangent is 2.79 persons per household, with single female/mother households (75 | 16.2%) accounting for the largest median household size of 3.39 persons per household. non-family households (97 | 20.9%) represent the smallest median household size with 1.22 persons per household.
| Household Type | # Households | Household Size |
| Married-Couple | 251 (54.1%) | 3.22 |
| Single Male/Father | 41 (8.8%) | 2.76 |
| Single Female/Mother | 75 (16.2%) | 3.39 |
| Non-family | 97 (20.9%) | 1.22 |
| Total Households | 464 (100.0%) | 2.79 |
Household Size by Marriage Status in Tangent
Out of a total of 464 households in Tangent, 367 (79.1%) are family households, while 97 (20.9%) are nonfamily households. The most numerous type of family households are 2-person households, comprising 139, and the most common type of nonfamily households are 1-person households, comprising 80.
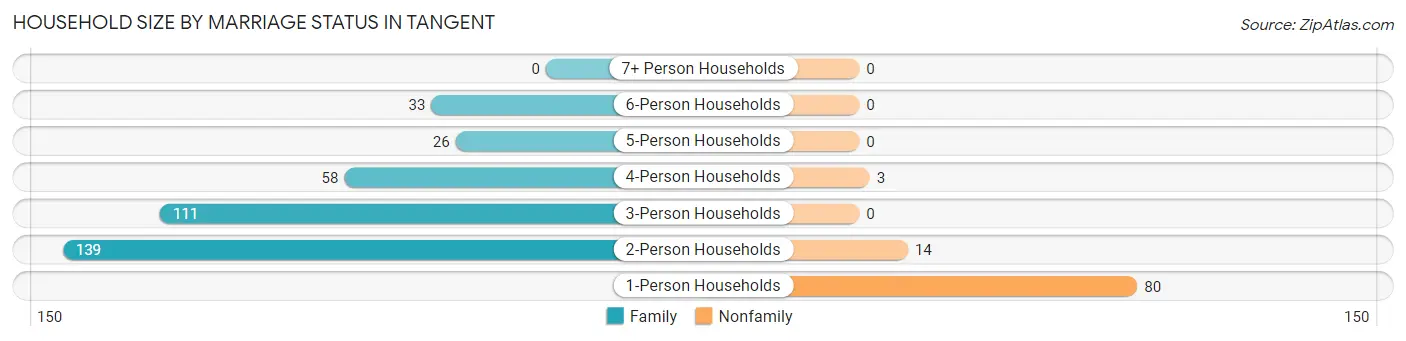
| Household Size | Family Households | Nonfamily Households |
| 1-Person Households | - | 80 (17.2%) |
| 2-Person Households | 139 (30.0%) | 14 (3.0%) |
| 3-Person Households | 111 (23.9%) | 0 (0.0%) |
| 4-Person Households | 58 (12.5%) | 3 (0.6%) |
| 5-Person Households | 26 (5.6%) | 0 (0.0%) |
| 6-Person Households | 33 (7.1%) | 0 (0.0%) |
| 7+ Person Households | 0 (0.0%) | 0 (0.0%) |
| Total | 367 (79.1%) | 97 (20.9%) |
Female Fertility in Tangent
Fertility by Age in Tangent
Average fertility rate in Tangent is 72.0 births per 1,000 women. Women in the age bracket of 35 to 50 years have the highest fertility rate with 163.0 births per 1,000 women. Women in the age bracket of 35 to 50 years acount for 83.3% of all women with births.
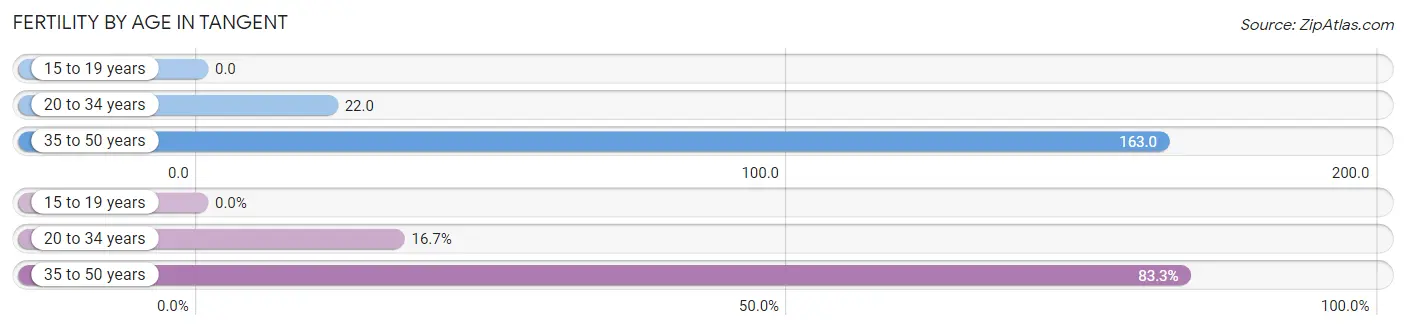
| Age Bracket | Women with Births | Births / 1,000 Women |
| 15 to 19 years | 0 (0.0%) | 0.0 |
| 20 to 34 years | 3 (16.7%) | 22.0 |
| 35 to 50 years | 15 (83.3%) | 163.0 |
| Total | 18 (100.0%) | 72.0 |
Fertility by Age by Marriage Status in Tangent
33.3% of women with births (18) in Tangent are married. The highest percentage of unmarried women with births falls into 35 to 50 years age bracket with 80.0% of them unmarried at the time of birth, while the lowest percentage of unmarried women with births belong to 20 to 34 years age bracket with 0.0% of them unmarried.
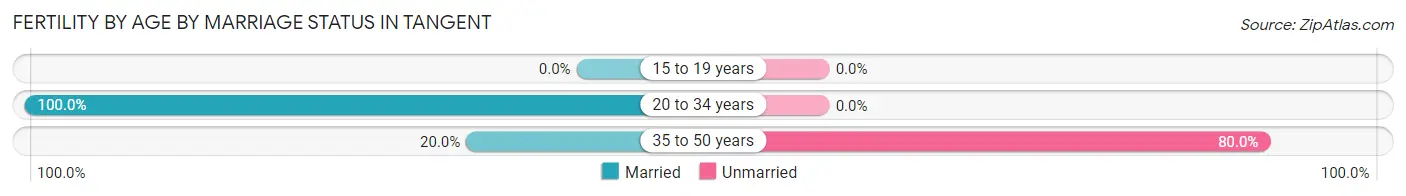
| Age Bracket | Married | Unmarried |
| 15 to 19 years | 0 (0.0%) | 0 (0.0%) |
| 20 to 34 years | 3 (100.0%) | 0 (0.0%) |
| 35 to 50 years | 3 (20.0%) | 12 (80.0%) |
| Total | 6 (33.3%) | 12 (66.7%) |
Fertility by Education in Tangent
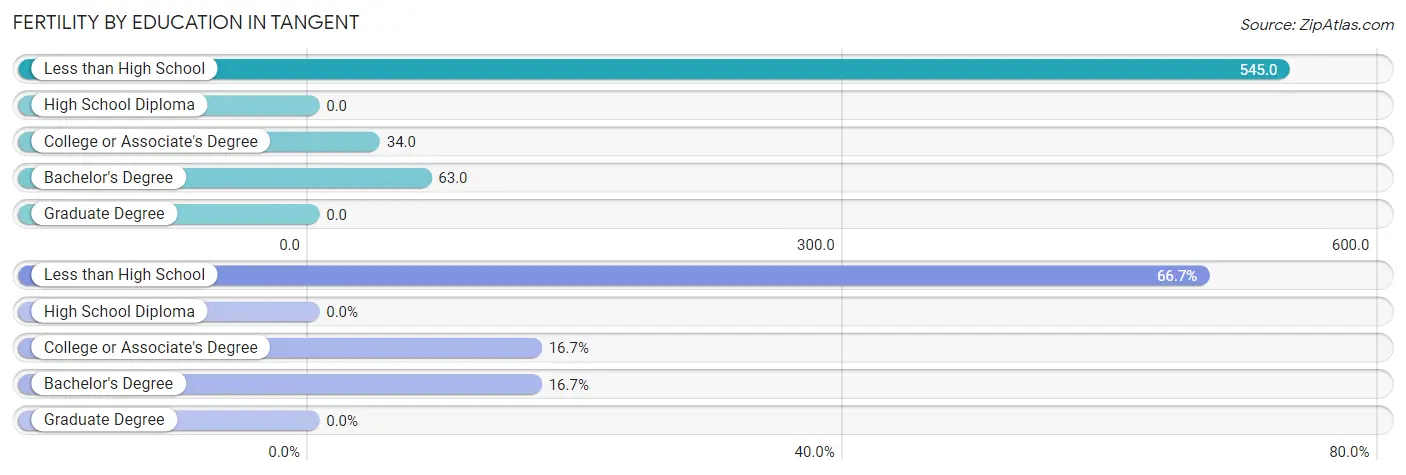
| Educational Attainment | Women with Births | Births / 1,000 Women |
| Less than High School | 12 (66.7%) | 545.0 |
| High School Diploma | 0 (0.0%) | 0.0 |
| College or Associate's Degree | 3 (16.7%) | 34.0 |
| Bachelor's Degree | 3 (16.7%) | 63.0 |
| Graduate Degree | 0 (0.0%) | 0.0 |
| Total | 18 (100.0%) | 72.0 |
Fertility by Education by Marriage Status in Tangent
66.7% of women with births in Tangent are unmarried. Women with the educational attainment of college or associate's degree are most likely to be married with 100.0% of them married at childbirth, while women with the educational attainment of less than high school are least likely to be married with 100.0% of them unmarried at childbirth.
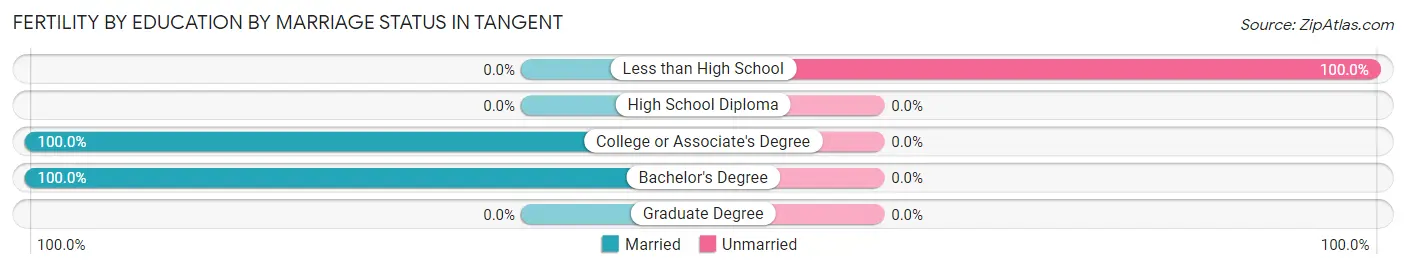
| Educational Attainment | Married | Unmarried |
| Less than High School | 0 (0.0%) | 12 (100.0%) |
| High School Diploma | 0 (0.0%) | 0 (0.0%) |
| College or Associate's Degree | 3 (100.0%) | 0 (0.0%) |
| Bachelor's Degree | 3 (100.0%) | 0 (0.0%) |
| Graduate Degree | 0 (0.0%) | 0 (0.0%) |
| Total | 6 (33.3%) | 12 (66.7%) |
Employment Characteristics in Tangent
Employment by Class of Employer in Tangent
Among the 639 employed individuals in Tangent, private company employees (423 | 66.2%), self-employed (not incorporated) (62 | 9.7%), and local government employees (55 | 8.6%) make up the most common classes of employment.
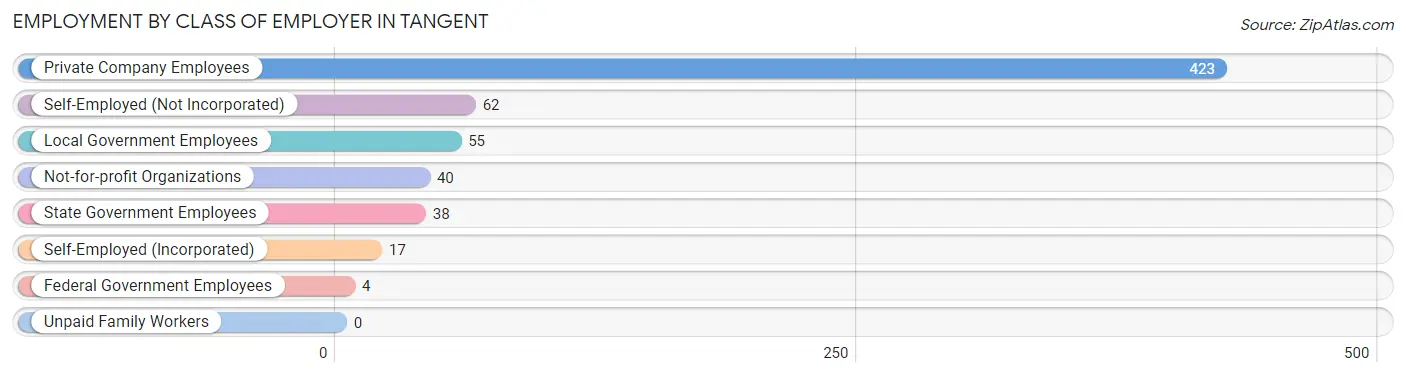
| Employer Class | # Employees | % Employees |
| Private Company Employees | 423 | 66.2% |
| Self-Employed (Incorporated) | 17 | 2.7% |
| Self-Employed (Not Incorporated) | 62 | 9.7% |
| Not-for-profit Organizations | 40 | 6.3% |
| Local Government Employees | 55 | 8.6% |
| State Government Employees | 38 | 5.9% |
| Federal Government Employees | 4 | 0.6% |
| Unpaid Family Workers | 0 | 0.0% |
| Total | 639 | 100.0% |
Employment Status by Age in Tangent
According to the labor force statistics for Tangent, out of the total population over 16 years of age (1,066), 64.8% or 691 individuals are in the labor force, with 5.8% or 40 of them unemployed. The age group with the highest labor force participation rate is 35 to 44 years, with 93.6% or 132 individuals in the labor force. Within the labor force, the 20 to 24 years age range has the highest percentage of unemployed individuals, with 24.4% or 21 of them being unemployed.
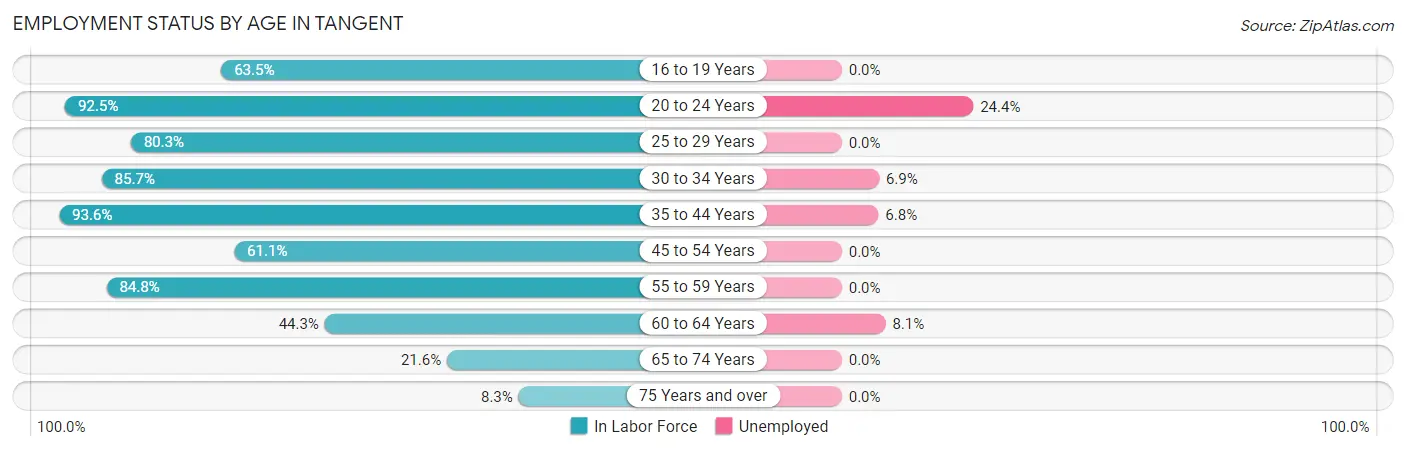
| Age Bracket | In Labor Force | Unemployed |
| 16 to 19 Years | 33 (63.5%) | 0 (0.0%) |
| 20 to 24 Years | 86 (92.5%) | 21 (24.4%) |
| 25 to 29 Years | 110 (80.3%) | 0 (0.0%) |
| 30 to 34 Years | 72 (85.7%) | 5 (6.9%) |
| 35 to 44 Years | 132 (93.6%) | 9 (6.8%) |
| 45 to 54 Years | 88 (61.1%) | 0 (0.0%) |
| 55 to 59 Years | 78 (84.8%) | 0 (0.0%) |
| 60 to 64 Years | 62 (44.3%) | 5 (8.1%) |
| 65 to 74 Years | 24 (21.6%) | 0 (0.0%) |
| 75 Years and over | 6 (8.3%) | 0 (0.0%) |
| Total | 691 (64.8%) | 40 (5.8%) |
Employment Status by Educational Attainment in Tangent
According to labor force statistics for Tangent, 73.4% of individuals (542) out of the total population between 25 and 64 years of age (738) are in the labor force, with 3.5% or 19 of them being unemployed. The group with the highest labor force participation rate are those with the educational attainment of bachelor's degree or higher, with 88.2% or 150 individuals in the labor force. Within the labor force, individuals with high school diploma education have the highest percentage of unemployment, with 3.9% or 6 of them being unemployed.
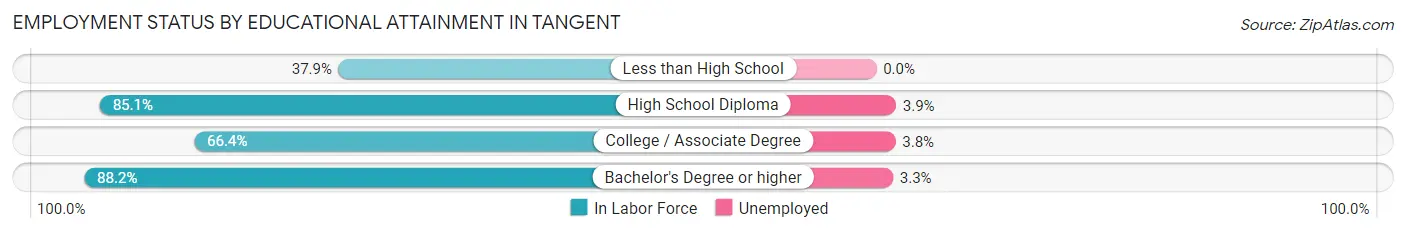
| Educational Attainment | In Labor Force | Unemployed |
| Less than High School | 25 (37.9%) | 0 (0.0%) |
| High School Diploma | 154 (85.1%) | 7 (3.9%) |
| College / Associate Degree | 213 (66.4%) | 12 (3.8%) |
| Bachelor's Degree or higher | 150 (88.2%) | 6 (3.3%) |
| Total | 542 (73.4%) | 26 (3.5%) |
Employment Occupations by Sex in Tangent
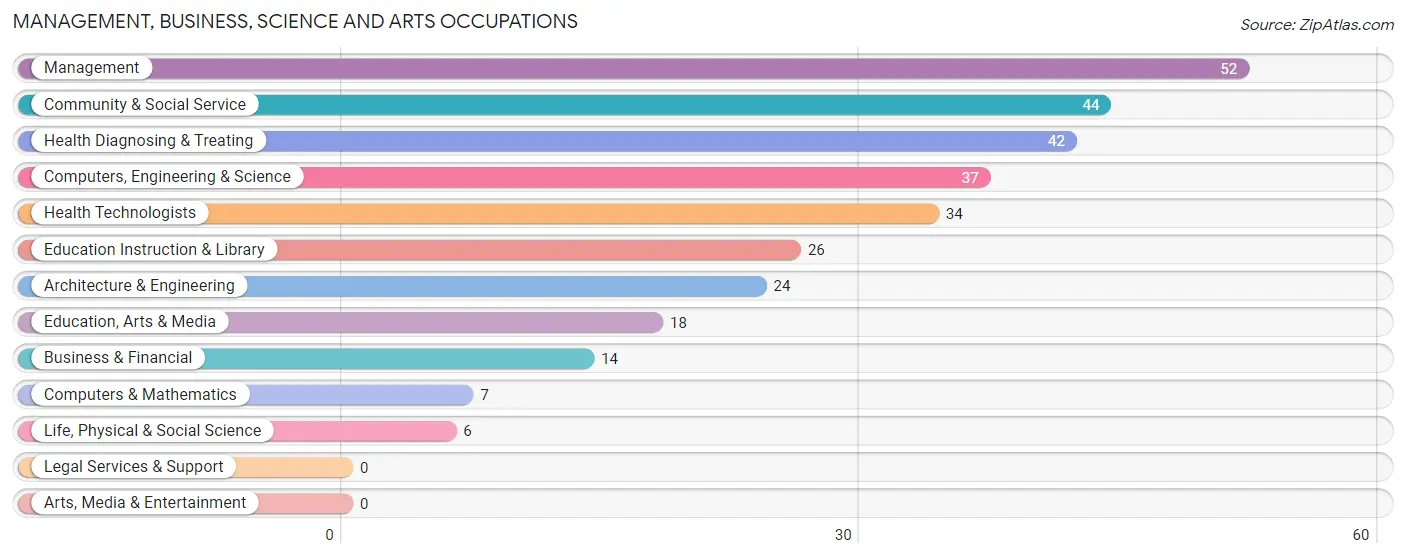
Management, Business, Science and Arts Occupations
The most common Management, Business, Science and Arts occupations in Tangent are Management (52 | 8.0%), Community & Social Service (44 | 6.8%), Health Diagnosing & Treating (42 | 6.5%), Computers, Engineering & Science (37 | 5.7%), and Health Technologists (34 | 5.2%).
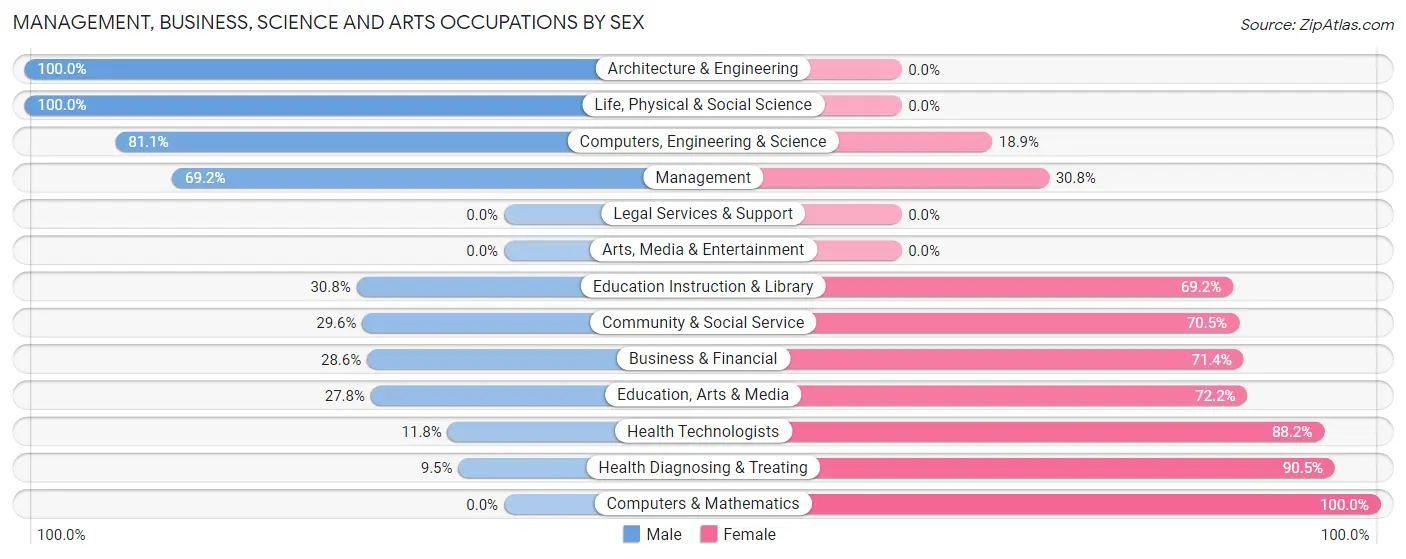
Management, Business, Science and Arts Occupations by Sex
Within the Management, Business, Science and Arts occupations in Tangent, the most male-oriented occupations are Architecture & Engineering (100.0%), Life, Physical & Social Science (100.0%), and Computers, Engineering & Science (81.1%), while the most female-oriented occupations are Computers & Mathematics (100.0%), Health Diagnosing & Treating (90.5%), and Health Technologists (88.2%).
| Occupation | Male | Female |
| Management | 36 (69.2%) | 16 (30.8%) |
| Business & Financial | 4 (28.6%) | 10 (71.4%) |
| Computers, Engineering & Science | 30 (81.1%) | 7 (18.9%) |
| Computers & Mathematics | 0 (0.0%) | 7 (100.0%) |
| Architecture & Engineering | 24 (100.0%) | 0 (0.0%) |
| Life, Physical & Social Science | 6 (100.0%) | 0 (0.0%) |
| Community & Social Service | 13 (29.5%) | 31 (70.5%) |
| Education, Arts & Media | 5 (27.8%) | 13 (72.2%) |
| Legal Services & Support | 0 (0.0%) | 0 (0.0%) |
| Education Instruction & Library | 8 (30.8%) | 18 (69.2%) |
| Arts, Media & Entertainment | 0 (0.0%) | 0 (0.0%) |
| Health Diagnosing & Treating | 4 (9.5%) | 38 (90.5%) |
| Health Technologists | 4 (11.8%) | 30 (88.2%) |
| Total (Category) | 87 (46.0%) | 102 (54.0%) |
| Total (Overall) | 365 (56.1%) | 286 (43.9%) |
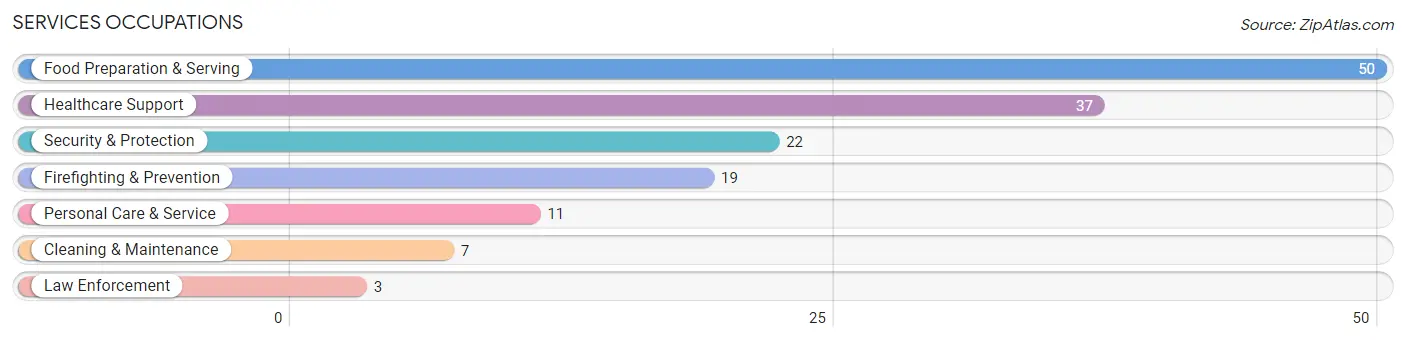
Services Occupations
The most common Services occupations in Tangent are Food Preparation & Serving (50 | 7.7%), Healthcare Support (37 | 5.7%), Security & Protection (22 | 3.4%), Firefighting & Prevention (19 | 2.9%), and Personal Care & Service (11 | 1.7%).
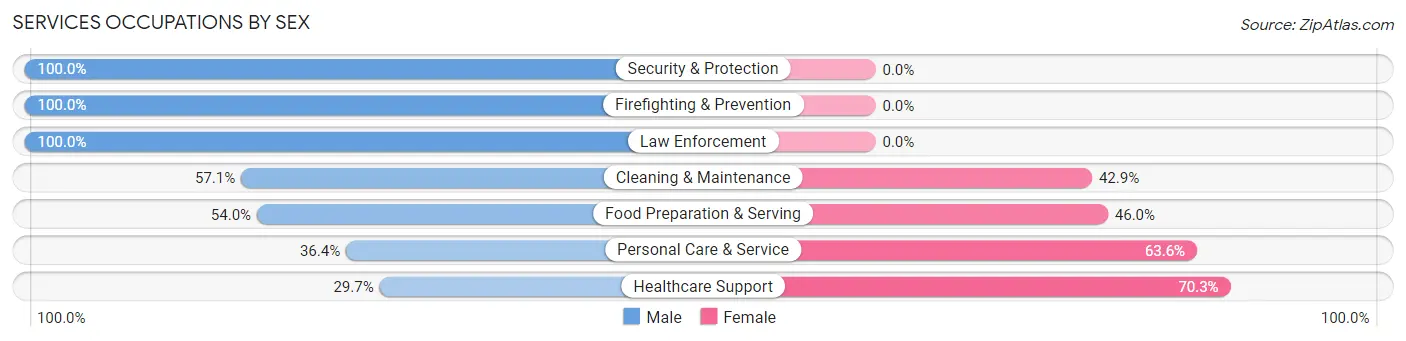
Services Occupations by Sex
Within the Services occupations in Tangent, the most male-oriented occupations are Security & Protection (100.0%), Firefighting & Prevention (100.0%), and Law Enforcement (100.0%), while the most female-oriented occupations are Healthcare Support (70.3%), Personal Care & Service (63.6%), and Food Preparation & Serving (46.0%).
| Occupation | Male | Female |
| Healthcare Support | 11 (29.7%) | 26 (70.3%) |
| Security & Protection | 22 (100.0%) | 0 (0.0%) |
| Firefighting & Prevention | 19 (100.0%) | 0 (0.0%) |
| Law Enforcement | 3 (100.0%) | 0 (0.0%) |
| Food Preparation & Serving | 27 (54.0%) | 23 (46.0%) |
| Cleaning & Maintenance | 4 (57.1%) | 3 (42.9%) |
| Personal Care & Service | 4 (36.4%) | 7 (63.6%) |
| Total (Category) | 68 (53.5%) | 59 (46.5%) |
| Total (Overall) | 365 (56.1%) | 286 (43.9%) |
Sales and Office Occupations
The most common Sales and Office occupations in Tangent are Sales & Related (62 | 9.5%), and Office & Administration (57 | 8.8%).
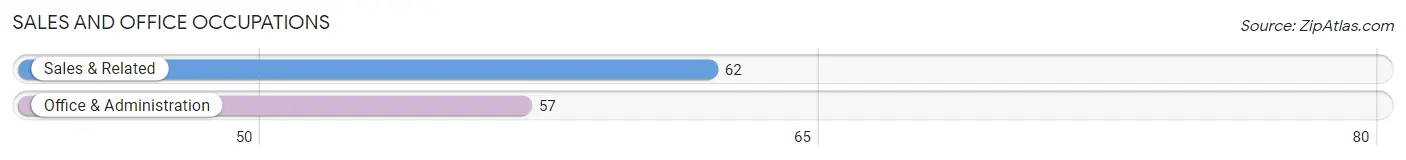
Sales and Office Occupations by Sex
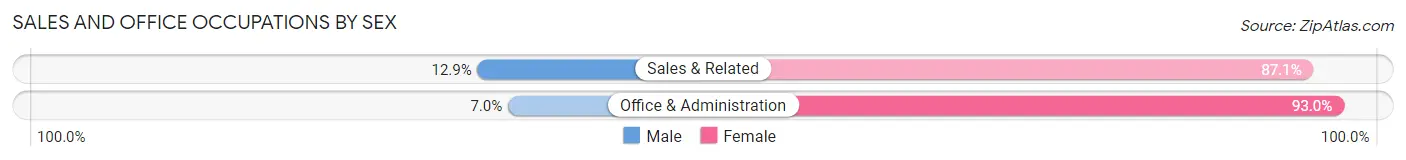
| Occupation | Male | Female |
| Sales & Related | 8 (12.9%) | 54 (87.1%) |
| Office & Administration | 4 (7.0%) | 53 (93.0%) |
| Total (Category) | 12 (10.1%) | 107 (89.9%) |
| Total (Overall) | 365 (56.1%) | 286 (43.9%) |
Natural Resources, Construction and Maintenance Occupations
The most common Natural Resources, Construction and Maintenance occupations in Tangent are Construction & Extraction (33 | 5.1%), Installation, Maintenance & Repair (25 | 3.8%), and Farming, Fishing & Forestry (4 | 0.6%).
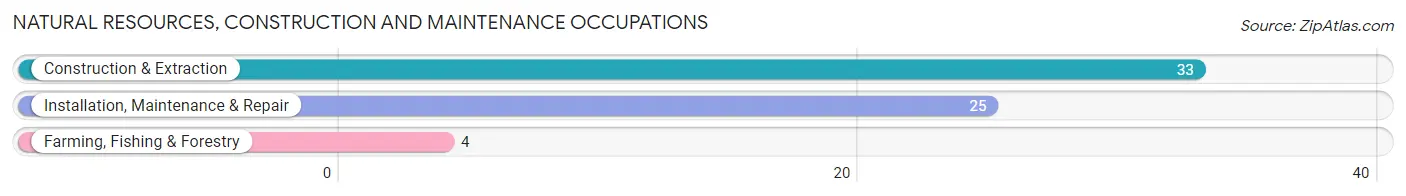
Natural Resources, Construction and Maintenance Occupations by Sex
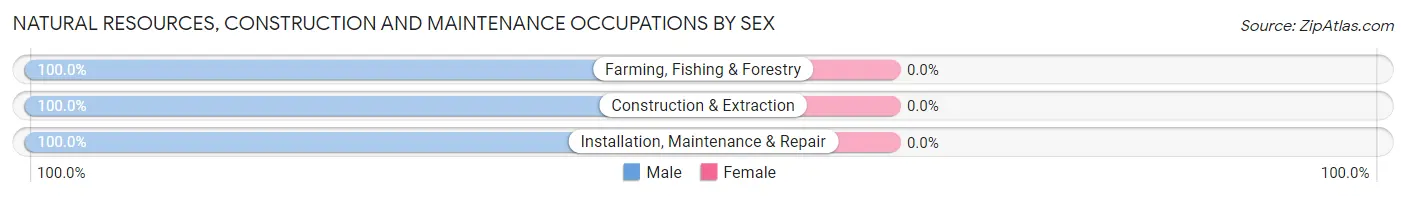
| Occupation | Male | Female |
| Farming, Fishing & Forestry | 4 (100.0%) | 0 (0.0%) |
| Construction & Extraction | 33 (100.0%) | 0 (0.0%) |
| Installation, Maintenance & Repair | 25 (100.0%) | 0 (0.0%) |
| Total (Category) | 62 (100.0%) | 0 (0.0%) |
| Total (Overall) | 365 (56.1%) | 286 (43.9%) |
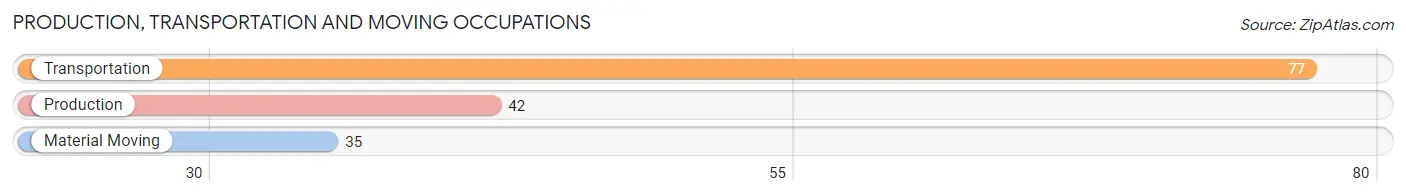
Production, Transportation and Moving Occupations
The most common Production, Transportation and Moving occupations in Tangent are Transportation (77 | 11.8%), Production (42 | 6.5%), and Material Moving (35 | 5.4%).
Production, Transportation and Moving Occupations by Sex
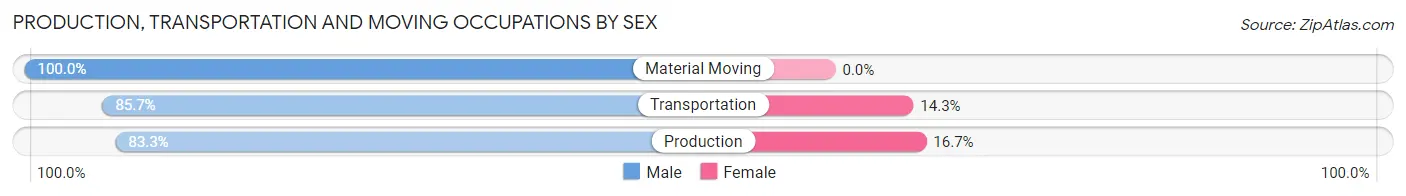
| Occupation | Male | Female |
| Production | 35 (83.3%) | 7 (16.7%) |
| Transportation | 66 (85.7%) | 11 (14.3%) |
| Material Moving | 35 (100.0%) | 0 (0.0%) |
| Total (Category) | 136 (88.3%) | 18 (11.7%) |
| Total (Overall) | 365 (56.1%) | 286 (43.9%) |
Employment Industries by Sex in Tangent
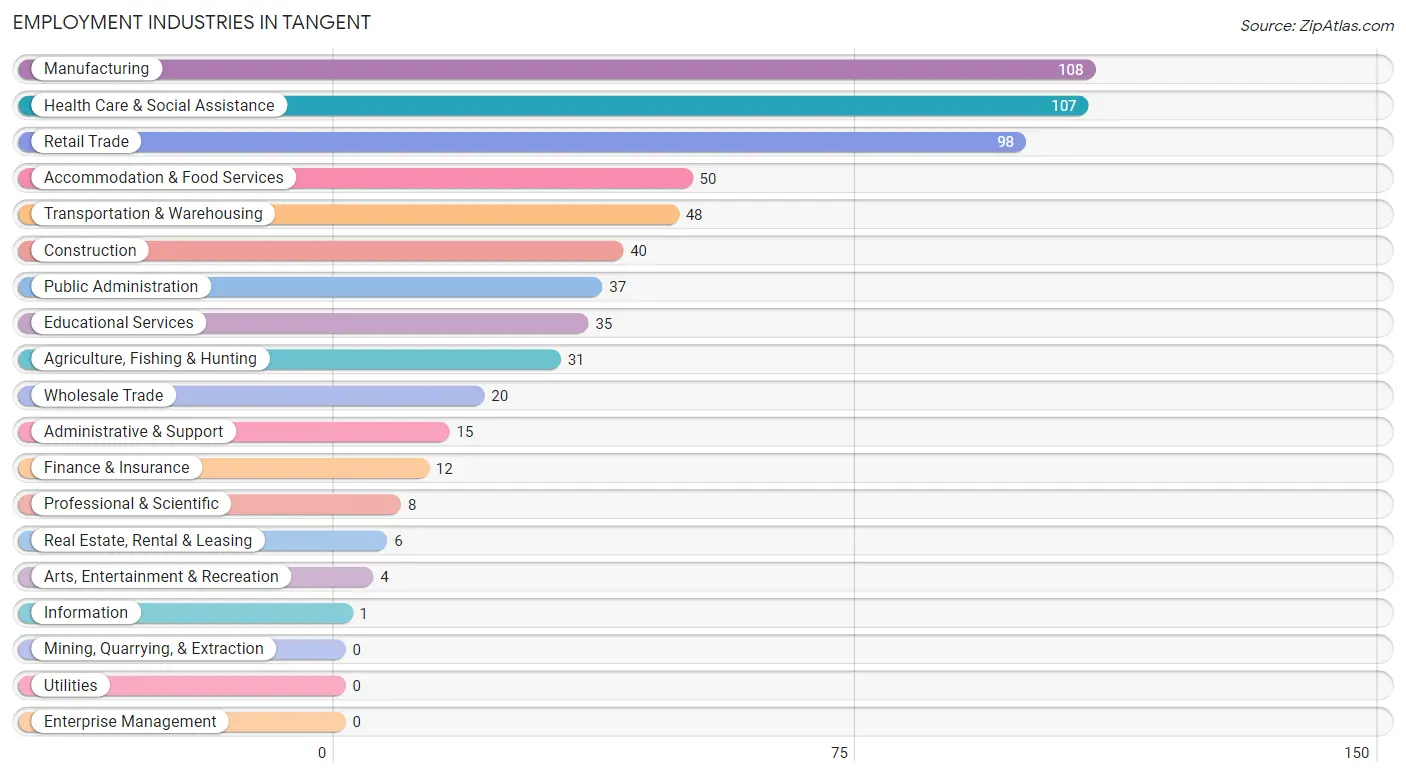
Employment Industries in Tangent
The major employment industries in Tangent include Manufacturing (108 | 16.6%), Health Care & Social Assistance (107 | 16.4%), Retail Trade (98 | 15.0%), Accommodation & Food Services (50 | 7.7%), and Transportation & Warehousing (48 | 7.4%).
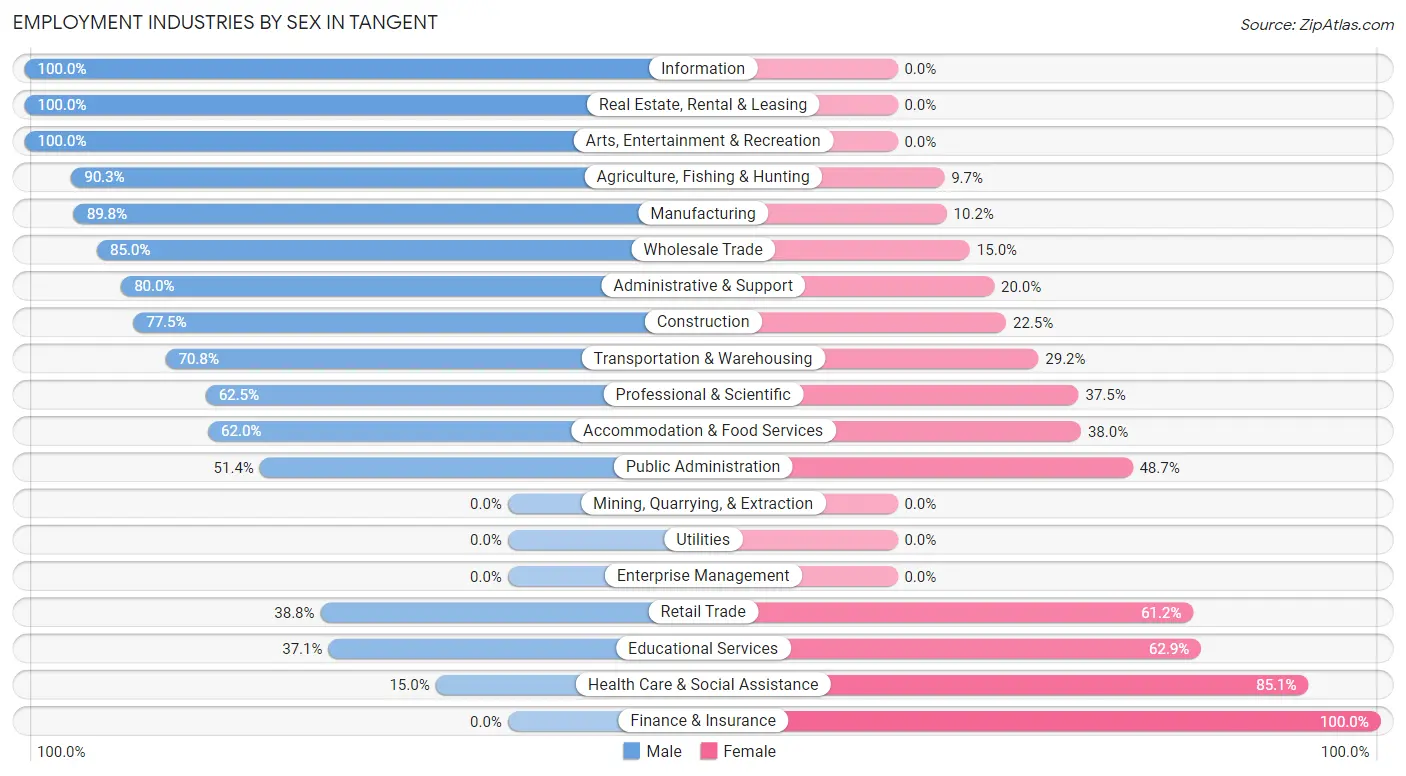
Employment Industries by Sex in Tangent
The Tangent industries that see more men than women are Information (100.0%), Real Estate, Rental & Leasing (100.0%), and Arts, Entertainment & Recreation (100.0%), whereas the industries that tend to have a higher number of women are Finance & Insurance (100.0%), Health Care & Social Assistance (85.1%), and Educational Services (62.9%).
| Industry | Male | Female |
| Agriculture, Fishing & Hunting | 28 (90.3%) | 3 (9.7%) |
| Mining, Quarrying, & Extraction | 0 (0.0%) | 0 (0.0%) |
| Construction | 31 (77.5%) | 9 (22.5%) |
| Manufacturing | 97 (89.8%) | 11 (10.2%) |
| Wholesale Trade | 17 (85.0%) | 3 (15.0%) |
| Retail Trade | 38 (38.8%) | 60 (61.2%) |
| Transportation & Warehousing | 34 (70.8%) | 14 (29.2%) |
| Utilities | 0 (0.0%) | 0 (0.0%) |
| Information | 1 (100.0%) | 0 (0.0%) |
| Finance & Insurance | 0 (0.0%) | 12 (100.0%) |
| Real Estate, Rental & Leasing | 6 (100.0%) | 0 (0.0%) |
| Professional & Scientific | 5 (62.5%) | 3 (37.5%) |
| Enterprise Management | 0 (0.0%) | 0 (0.0%) |
| Administrative & Support | 12 (80.0%) | 3 (20.0%) |
| Educational Services | 13 (37.1%) | 22 (62.9%) |
| Health Care & Social Assistance | 16 (14.9%) | 91 (85.1%) |
| Arts, Entertainment & Recreation | 4 (100.0%) | 0 (0.0%) |
| Accommodation & Food Services | 31 (62.0%) | 19 (38.0%) |
| Public Administration | 19 (51.3%) | 18 (48.6%) |
| Total | 365 (56.1%) | 286 (43.9%) |
Education in Tangent
School Enrollment in Tangent
The most common levels of schooling among the 313 students in Tangent are middle school (85 | 27.2%), elementary school (76 | 24.3%), and college / undergraduate (70 | 22.4%).
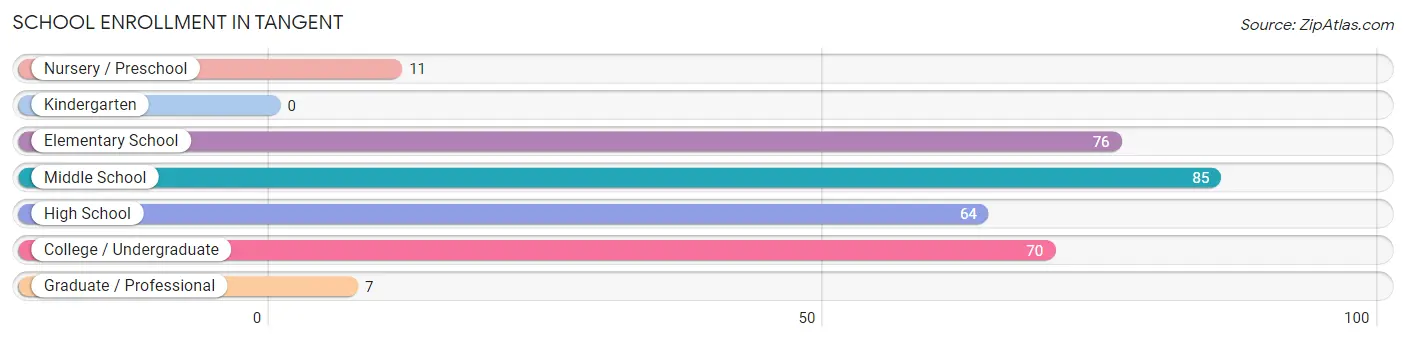
| School Level | # Students | % Students |
| Nursery / Preschool | 11 | 3.5% |
| Kindergarten | 0 | 0.0% |
| Elementary School | 76 | 24.3% |
| Middle School | 85 | 27.2% |
| High School | 64 | 20.4% |
| College / Undergraduate | 70 | 22.4% |
| Graduate / Professional | 7 | 2.2% |
| Total | 313 | 100.0% |
School Enrollment by Age by Funding Source in Tangent
Out of a total of 313 students who are enrolled in schools in Tangent, 46 (14.7%) attend a private institution, while the remaining 267 (85.3%) are enrolled in public schools. The age group of 35 years and over has the highest likelihood of being enrolled in private schools, with 4 (100.0% in the age bracket) enrolled. Conversely, the age group of 18 to 19 year olds has the lowest likelihood of being enrolled in a private school, with 13 (100.0% in the age bracket) attending a public institution.
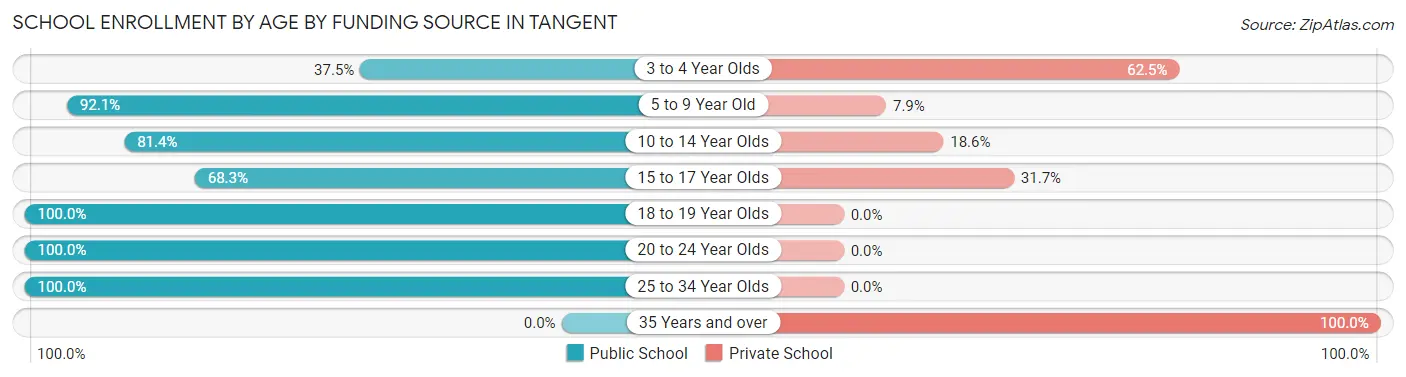
| Age Bracket | Public School | Private School |
| 3 to 4 Year Olds | 3 (37.5%) | 5 (62.5%) |
| 5 to 9 Year Old | 70 (92.1%) | 6 (7.9%) |
| 10 to 14 Year Olds | 79 (81.4%) | 18 (18.6%) |
| 15 to 17 Year Olds | 28 (68.3%) | 13 (31.7%) |
| 18 to 19 Year Olds | 13 (100.0%) | 0 (0.0%) |
| 20 to 24 Year Olds | 18 (100.0%) | 0 (0.0%) |
| 25 to 34 Year Olds | 56 (100.0%) | 0 (0.0%) |
| 35 Years and over | 0 (0.0%) | 4 (100.0%) |
| Total | 267 (85.3%) | 46 (14.7%) |
Educational Attainment by Field of Study in Tangent
Engineering (34 | 15.0%), business (30 | 13.3%), bio, nature & agricultural (25 | 11.1%), science & technology (23 | 10.2%), and psychology (19 | 8.4%) are the most common fields of study among 226 individuals in Tangent who have obtained a bachelor's degree or higher.
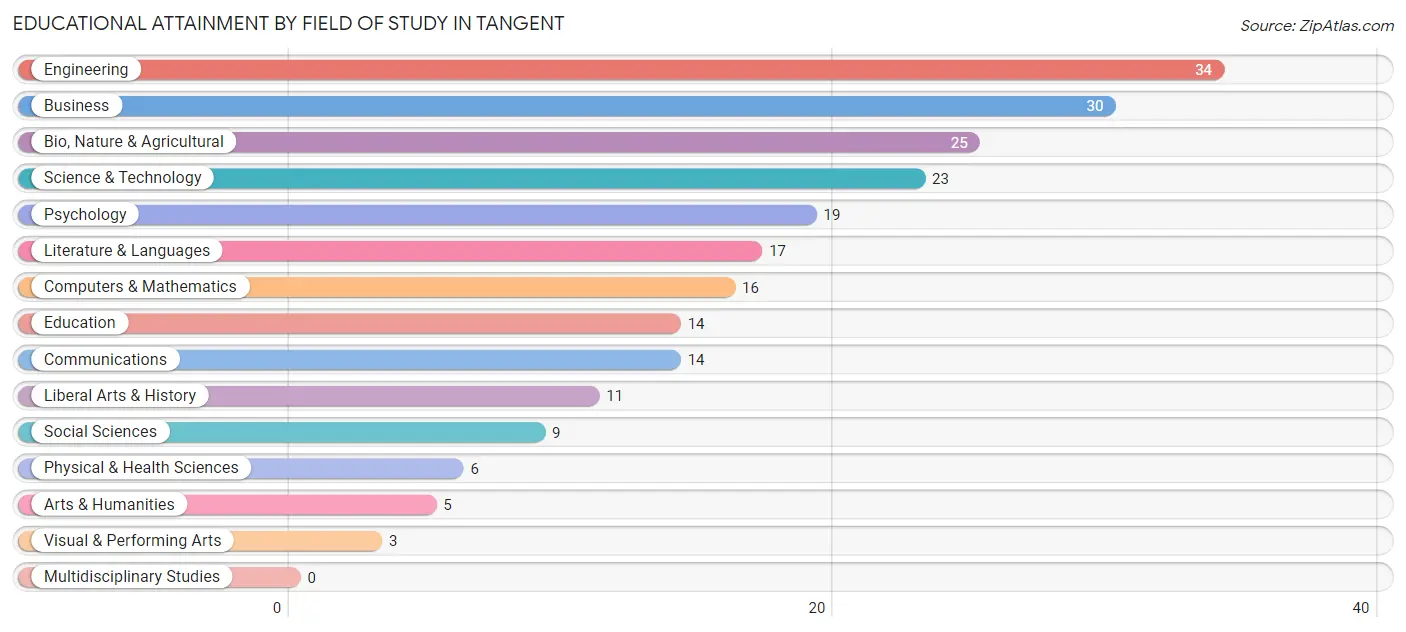
| Field of Study | # Graduates | % Graduates |
| Computers & Mathematics | 16 | 7.1% |
| Bio, Nature & Agricultural | 25 | 11.1% |
| Physical & Health Sciences | 6 | 2.6% |
| Psychology | 19 | 8.4% |
| Social Sciences | 9 | 4.0% |
| Engineering | 34 | 15.0% |
| Multidisciplinary Studies | 0 | 0.0% |
| Science & Technology | 23 | 10.2% |
| Business | 30 | 13.3% |
| Education | 14 | 6.2% |
| Literature & Languages | 17 | 7.5% |
| Liberal Arts & History | 11 | 4.9% |
| Visual & Performing Arts | 3 | 1.3% |
| Communications | 14 | 6.2% |
| Arts & Humanities | 5 | 2.2% |
| Total | 226 | 100.0% |
Transportation & Commute in Tangent
Vehicle Availability by Sex in Tangent
The most prevalent vehicle ownership categories in Tangent are males with 2 vehicles (148, accounting for 41.8%) and females with 2 vehicles (124, making up 52.5%).
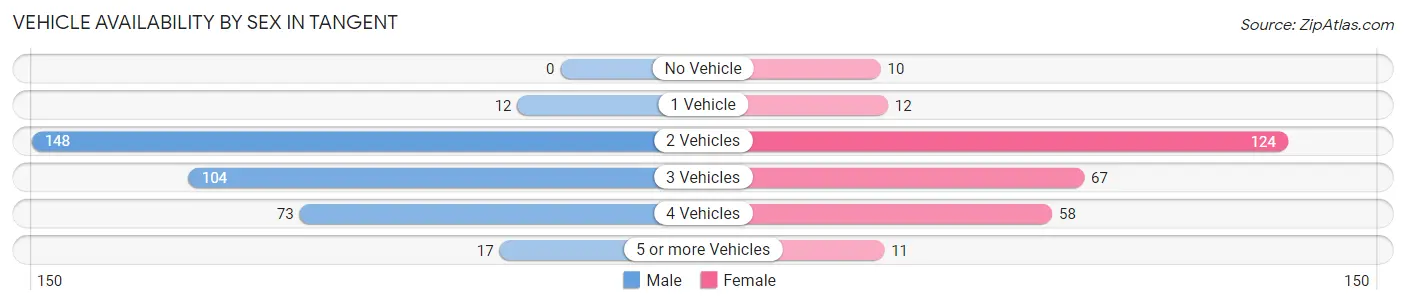
| Vehicles Available | Male | Female |
| No Vehicle | 0 (0.0%) | 10 (3.5%) |
| 1 Vehicle | 12 (3.4%) | 12 (4.3%) |
| 2 Vehicles | 148 (41.8%) | 124 (44.0%) |
| 3 Vehicles | 104 (29.4%) | 67 (23.8%) |
| 4 Vehicles | 73 (20.6%) | 58 (20.6%) |
| 5 or more Vehicles | 17 (4.8%) | 11 (3.9%) |
| Total | 354 (100.0%) | 282 (100.0%) |
Commute Time in Tangent
The most frequently occuring commute durations in Tangent are 15 to 19 minutes (201 commuters, 35.3%), 10 to 14 minutes (101 commuters, 17.7%), and 20 to 24 minutes (81 commuters, 14.2%).
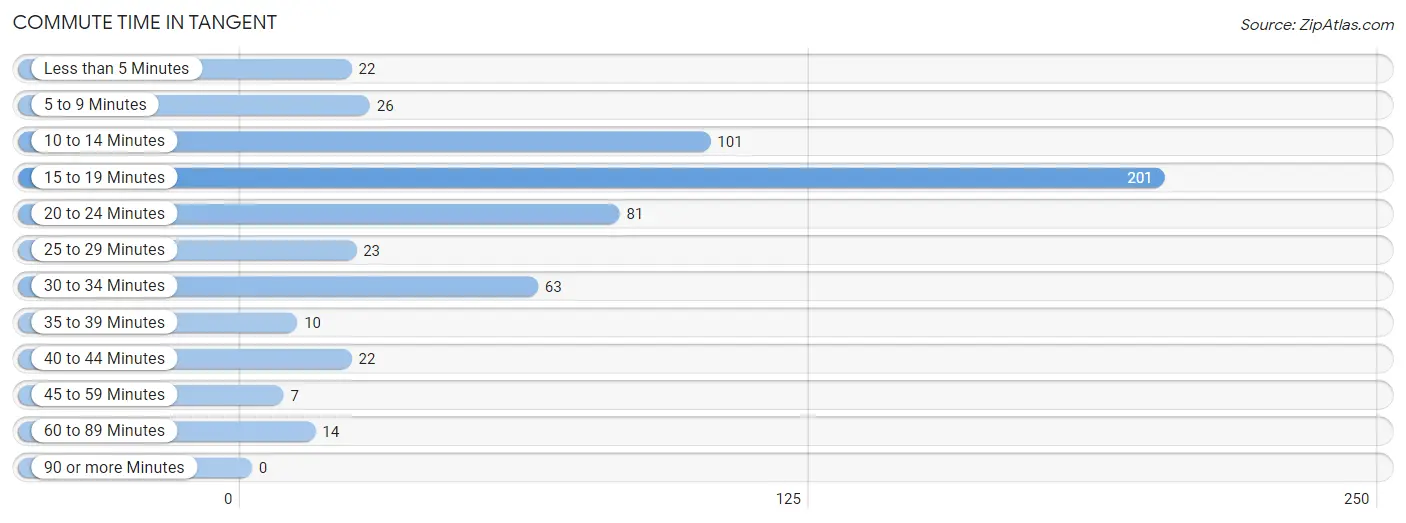
| Commute Time | # Commuters | % Commuters |
| Less than 5 Minutes | 22 | 3.9% |
| 5 to 9 Minutes | 26 | 4.6% |
| 10 to 14 Minutes | 101 | 17.7% |
| 15 to 19 Minutes | 201 | 35.3% |
| 20 to 24 Minutes | 81 | 14.2% |
| 25 to 29 Minutes | 23 | 4.0% |
| 30 to 34 Minutes | 63 | 11.1% |
| 35 to 39 Minutes | 10 | 1.8% |
| 40 to 44 Minutes | 22 | 3.9% |
| 45 to 59 Minutes | 7 | 1.2% |
| 60 to 89 Minutes | 14 | 2.5% |
| 90 or more Minutes | 0 | 0.0% |
Commute Time by Sex in Tangent
The most common commute times in Tangent are 15 to 19 minutes (87 commuters, 26.0%) for males and 15 to 19 minutes (114 commuters, 48.5%) for females.
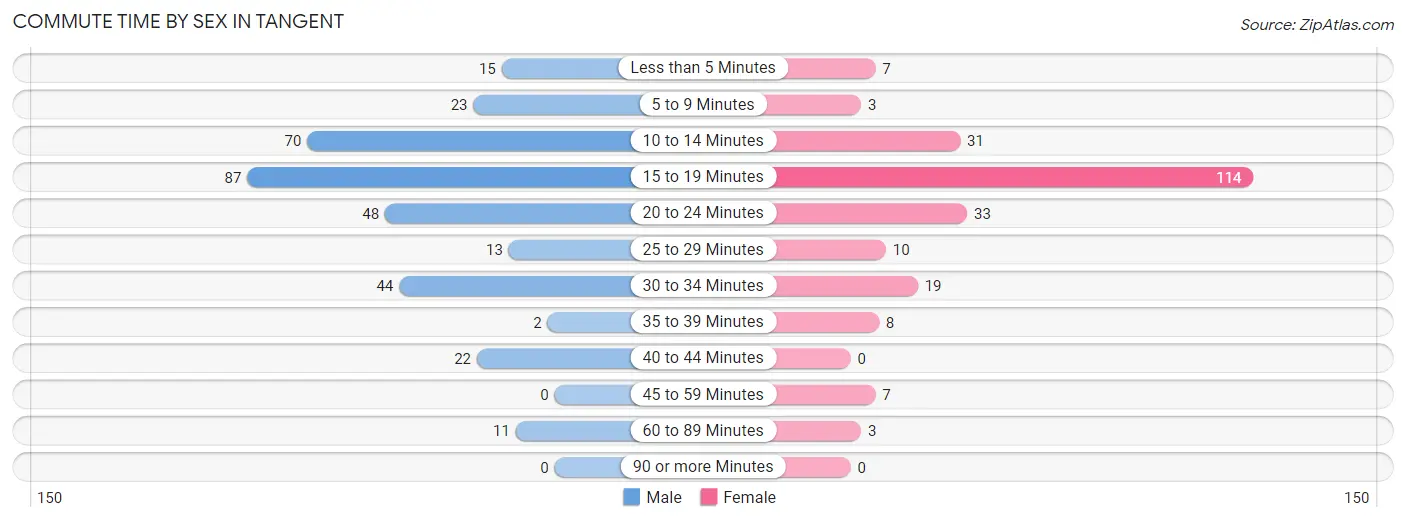
| Commute Time | Male | Female |
| Less than 5 Minutes | 15 (4.5%) | 7 (3.0%) |
| 5 to 9 Minutes | 23 (6.9%) | 3 (1.3%) |
| 10 to 14 Minutes | 70 (20.9%) | 31 (13.2%) |
| 15 to 19 Minutes | 87 (26.0%) | 114 (48.5%) |
| 20 to 24 Minutes | 48 (14.3%) | 33 (14.0%) |
| 25 to 29 Minutes | 13 (3.9%) | 10 (4.3%) |
| 30 to 34 Minutes | 44 (13.1%) | 19 (8.1%) |
| 35 to 39 Minutes | 2 (0.6%) | 8 (3.4%) |
| 40 to 44 Minutes | 22 (6.6%) | 0 (0.0%) |
| 45 to 59 Minutes | 0 (0.0%) | 7 (3.0%) |
| 60 to 89 Minutes | 11 (3.3%) | 3 (1.3%) |
| 90 or more Minutes | 0 (0.0%) | 0 (0.0%) |
Time of Departure to Work by Sex in Tangent
The most frequent times of departure to work in Tangent are 7:00 AM to 7:29 AM (78, 23.3%) for males and 7:30 AM to 7:59 AM (57, 24.3%) for females.
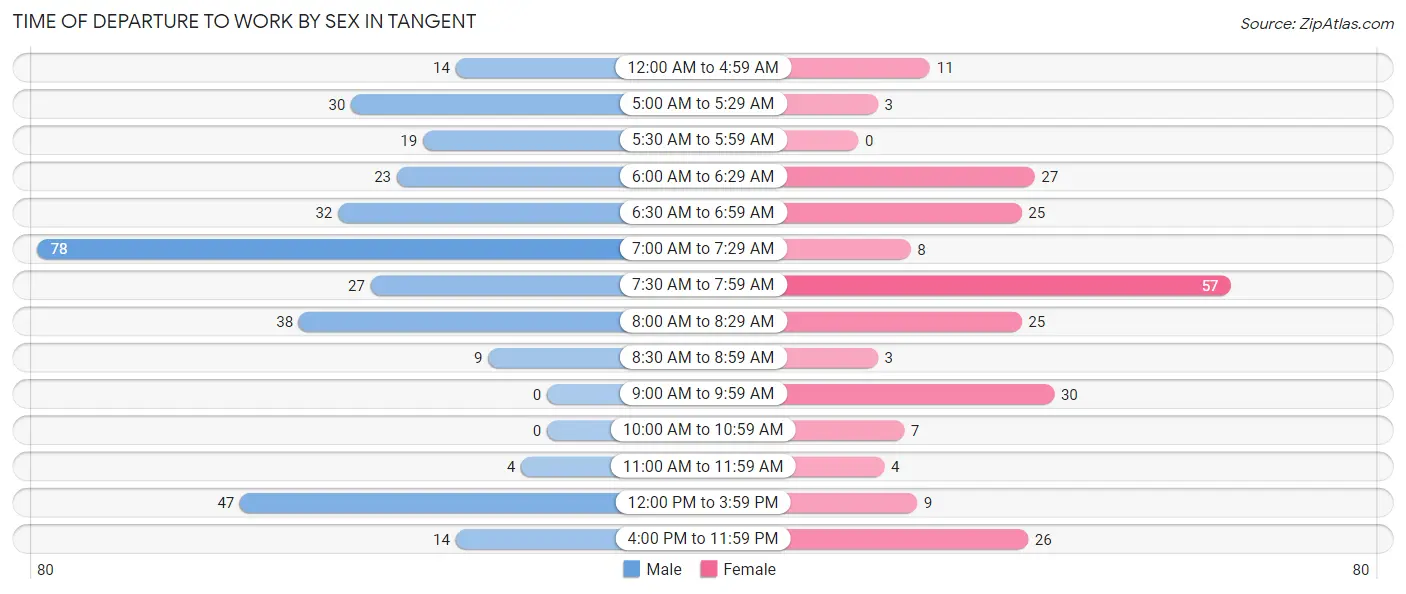
| Time of Departure | Male | Female |
| 12:00 AM to 4:59 AM | 14 (4.2%) | 11 (4.7%) |
| 5:00 AM to 5:29 AM | 30 (9.0%) | 3 (1.3%) |
| 5:30 AM to 5:59 AM | 19 (5.7%) | 0 (0.0%) |
| 6:00 AM to 6:29 AM | 23 (6.9%) | 27 (11.5%) |
| 6:30 AM to 6:59 AM | 32 (9.6%) | 25 (10.6%) |
| 7:00 AM to 7:29 AM | 78 (23.3%) | 8 (3.4%) |
| 7:30 AM to 7:59 AM | 27 (8.1%) | 57 (24.3%) |
| 8:00 AM to 8:29 AM | 38 (11.3%) | 25 (10.6%) |
| 8:30 AM to 8:59 AM | 9 (2.7%) | 3 (1.3%) |
| 9:00 AM to 9:59 AM | 0 (0.0%) | 30 (12.8%) |
| 10:00 AM to 10:59 AM | 0 (0.0%) | 7 (3.0%) |
| 11:00 AM to 11:59 AM | 4 (1.2%) | 4 (1.7%) |
| 12:00 PM to 3:59 PM | 47 (14.0%) | 9 (3.8%) |
| 4:00 PM to 11:59 PM | 14 (4.2%) | 26 (11.1%) |
| Total | 335 (100.0%) | 235 (100.0%) |
Housing Occupancy in Tangent
Occupancy by Ownership in Tangent
Of the total 464 dwellings in Tangent, owner-occupied units account for 327 (70.5%), while renter-occupied units make up 137 (29.5%).
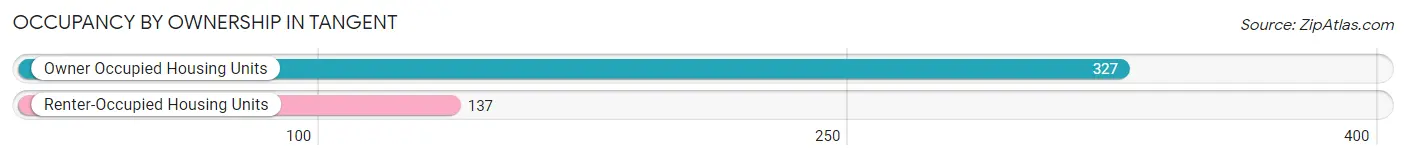
| Occupancy | # Housing Units | % Housing Units |
| Owner Occupied Housing Units | 327 | 70.5% |
| Renter-Occupied Housing Units | 137 | 29.5% |
| Total Occupied Housing Units | 464 | 100.0% |
Occupancy by Household Size in Tangent
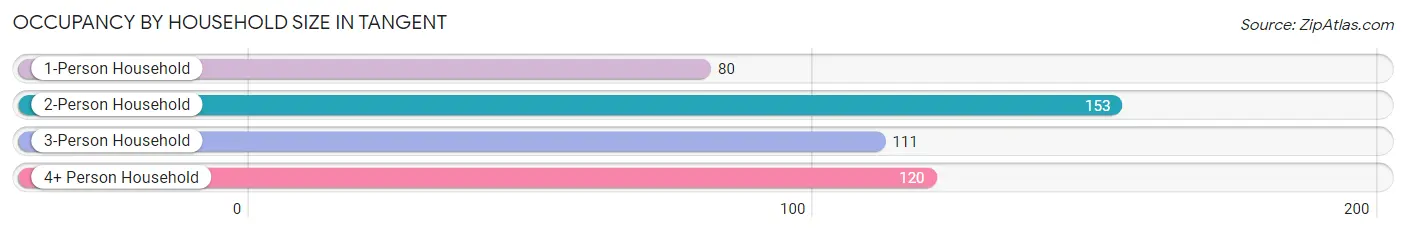
| Household Size | # Housing Units | % Housing Units |
| 1-Person Household | 80 | 17.2% |
| 2-Person Household | 153 | 33.0% |
| 3-Person Household | 111 | 23.9% |
| 4+ Person Household | 120 | 25.9% |
| Total Housing Units | 464 | 100.0% |
Occupancy by Ownership by Household Size in Tangent
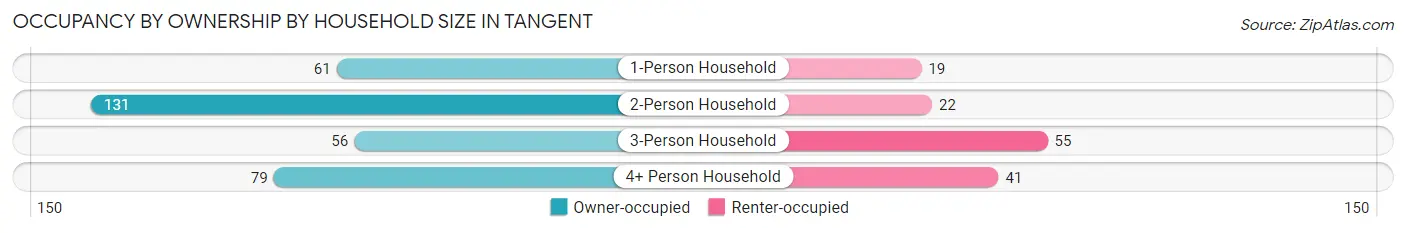
| Household Size | Owner-occupied | Renter-occupied |
| 1-Person Household | 61 (76.2%) | 19 (23.7%) |
| 2-Person Household | 131 (85.6%) | 22 (14.4%) |
| 3-Person Household | 56 (50.4%) | 55 (49.5%) |
| 4+ Person Household | 79 (65.8%) | 41 (34.2%) |
| Total Housing Units | 327 (70.5%) | 137 (29.5%) |
Occupancy by Educational Attainment in Tangent
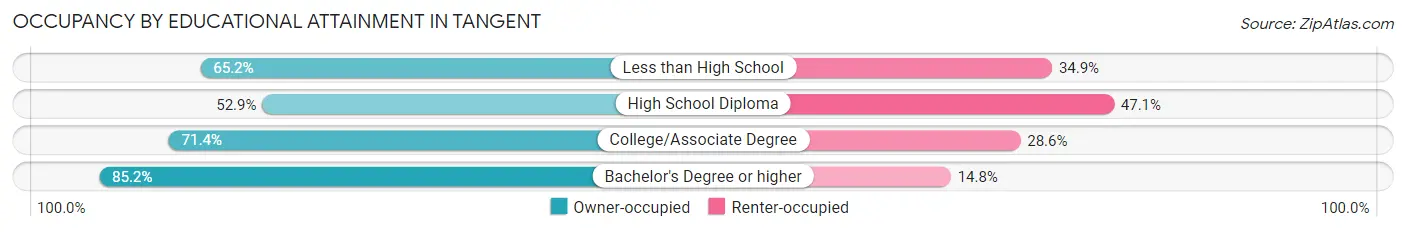
| Household Size | Owner-occupied | Renter-occupied |
| Less than High School | 43 (65.1%) | 23 (34.8%) |
| High School Diploma | 46 (52.9%) | 41 (47.1%) |
| College/Associate Degree | 140 (71.4%) | 56 (28.6%) |
| Bachelor's Degree or higher | 98 (85.2%) | 17 (14.8%) |
Occupancy by Age of Householder in Tangent
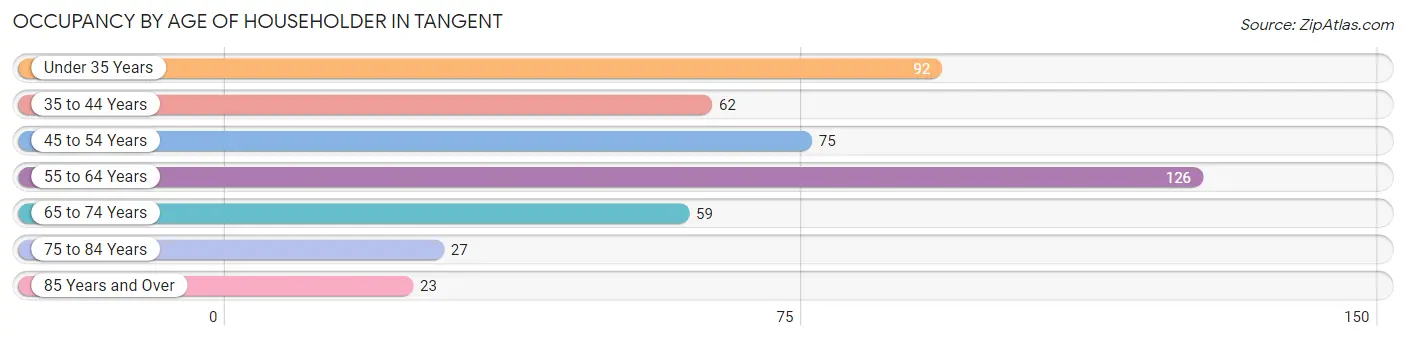
| Age Bracket | # Households | % Households |
| Under 35 Years | 92 | 19.8% |
| 35 to 44 Years | 62 | 13.4% |
| 45 to 54 Years | 75 | 16.2% |
| 55 to 64 Years | 126 | 27.2% |
| 65 to 74 Years | 59 | 12.7% |
| 75 to 84 Years | 27 | 5.8% |
| 85 Years and Over | 23 | 5.0% |
| Total | 464 | 100.0% |
Housing Finances in Tangent
Median Income by Occupancy in Tangent
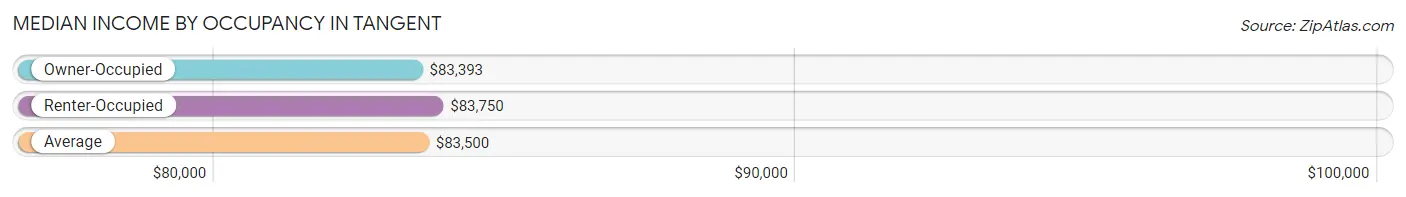
| Occupancy Type | # Households | Median Income |
| Owner-Occupied | 327 (70.5%) | $83,393 |
| Renter-Occupied | 137 (29.5%) | $83,750 |
| Average | 464 (100.0%) | $83,500 |
Occupancy by Householder Income Bracket in Tangent
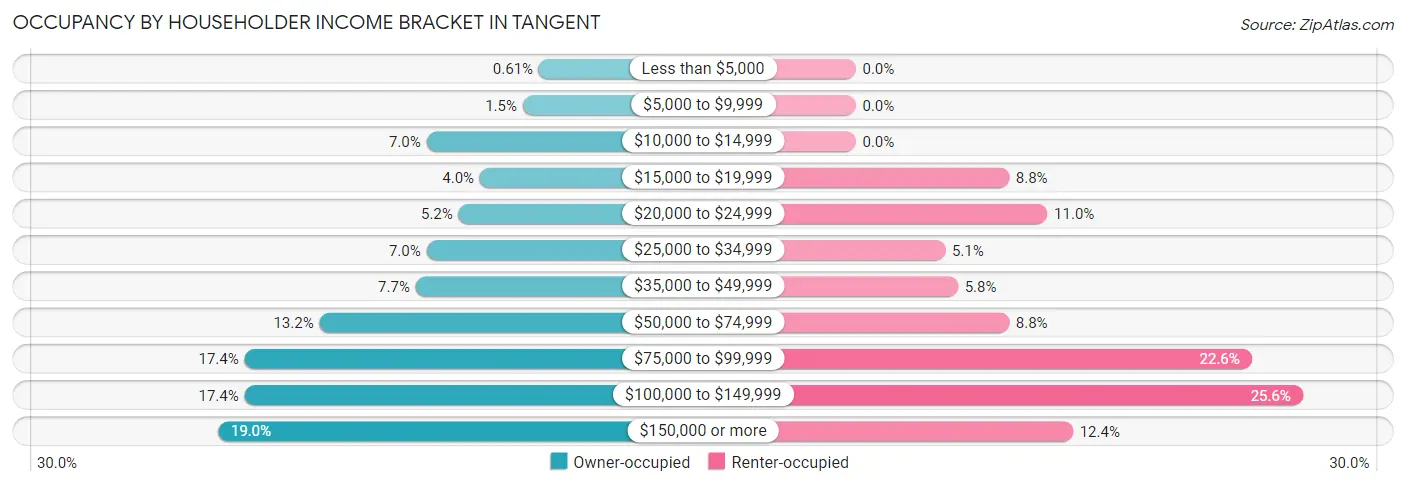
| Income Bracket | Owner-occupied | Renter-occupied |
| Less than $5,000 | 2 (0.6%) | 0 (0.0%) |
| $5,000 to $9,999 | 5 (1.5%) | 0 (0.0%) |
| $10,000 to $14,999 | 23 (7.0%) | 0 (0.0%) |
| $15,000 to $19,999 | 13 (4.0%) | 12 (8.8%) |
| $20,000 to $24,999 | 17 (5.2%) | 15 (11.0%) |
| $25,000 to $34,999 | 23 (7.0%) | 7 (5.1%) |
| $35,000 to $49,999 | 25 (7.6%) | 8 (5.8%) |
| $50,000 to $74,999 | 43 (13.2%) | 12 (8.8%) |
| $75,000 to $99,999 | 57 (17.4%) | 31 (22.6%) |
| $100,000 to $149,999 | 57 (17.4%) | 35 (25.6%) |
| $150,000 or more | 62 (19.0%) | 17 (12.4%) |
| Total | 327 (100.0%) | 137 (100.0%) |
Monthly Housing Cost Tiers in Tangent
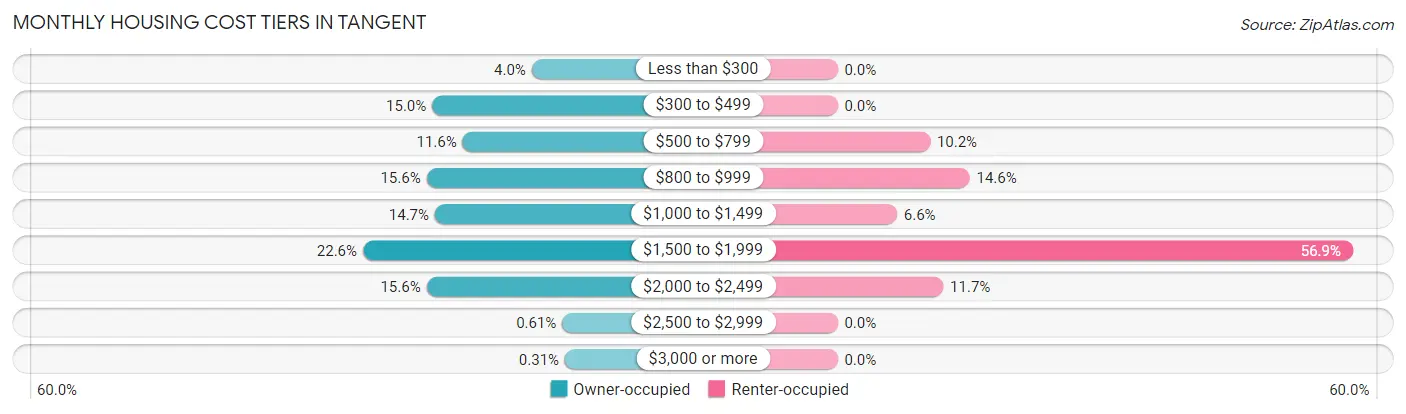
| Monthly Cost | Owner-occupied | Renter-occupied |
| Less than $300 | 13 (4.0%) | 0 (0.0%) |
| $300 to $499 | 49 (15.0%) | 0 (0.0%) |
| $500 to $799 | 38 (11.6%) | 14 (10.2%) |
| $800 to $999 | 51 (15.6%) | 20 (14.6%) |
| $1,000 to $1,499 | 48 (14.7%) | 9 (6.6%) |
| $1,500 to $1,999 | 74 (22.6%) | 78 (56.9%) |
| $2,000 to $2,499 | 51 (15.6%) | 16 (11.7%) |
| $2,500 to $2,999 | 2 (0.6%) | 0 (0.0%) |
| $3,000 or more | 1 (0.3%) | 0 (0.0%) |
| Total | 327 (100.0%) | 137 (100.0%) |
Physical Housing Characteristics in Tangent
Housing Structures in Tangent
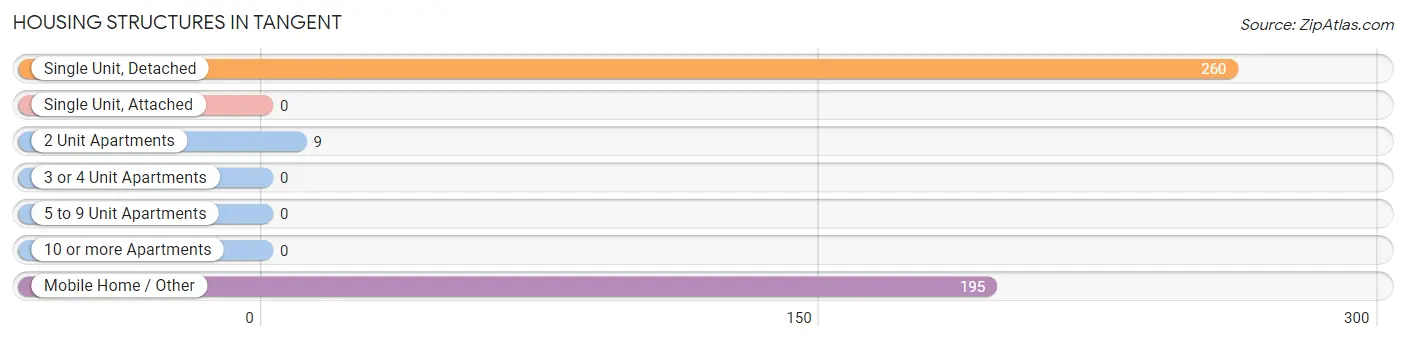
| Structure Type | # Housing Units | % Housing Units |
| Single Unit, Detached | 260 | 56.0% |
| Single Unit, Attached | 0 | 0.0% |
| 2 Unit Apartments | 9 | 1.9% |
| 3 or 4 Unit Apartments | 0 | 0.0% |
| 5 to 9 Unit Apartments | 0 | 0.0% |
| 10 or more Apartments | 0 | 0.0% |
| Mobile Home / Other | 195 | 42.0% |
| Total | 464 | 100.0% |
Housing Structures by Occupancy in Tangent
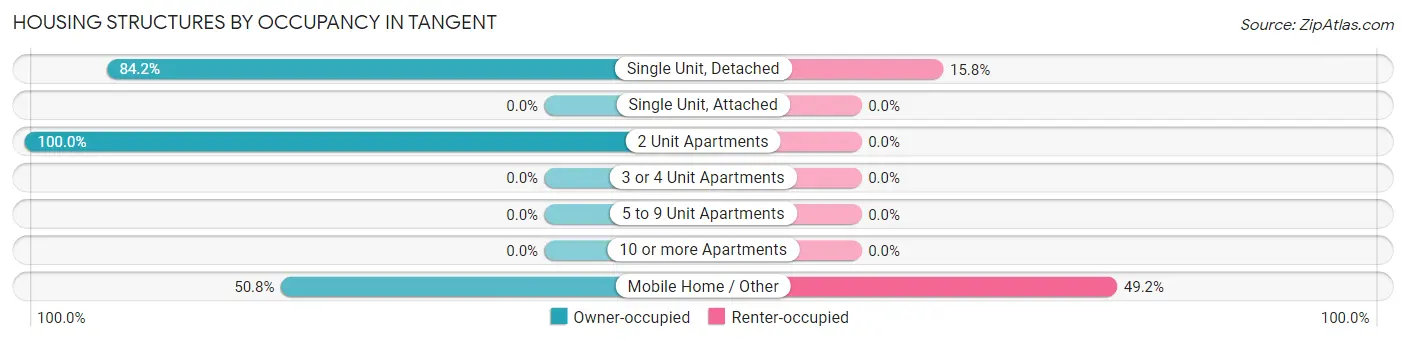
| Structure Type | Owner-occupied | Renter-occupied |
| Single Unit, Detached | 219 (84.2%) | 41 (15.8%) |
| Single Unit, Attached | 0 (0.0%) | 0 (0.0%) |
| 2 Unit Apartments | 9 (100.0%) | 0 (0.0%) |
| 3 or 4 Unit Apartments | 0 (0.0%) | 0 (0.0%) |
| 5 to 9 Unit Apartments | 0 (0.0%) | 0 (0.0%) |
| 10 or more Apartments | 0 (0.0%) | 0 (0.0%) |
| Mobile Home / Other | 99 (50.8%) | 96 (49.2%) |
| Total | 327 (70.5%) | 137 (29.5%) |
Housing Structures by Number of Rooms in Tangent
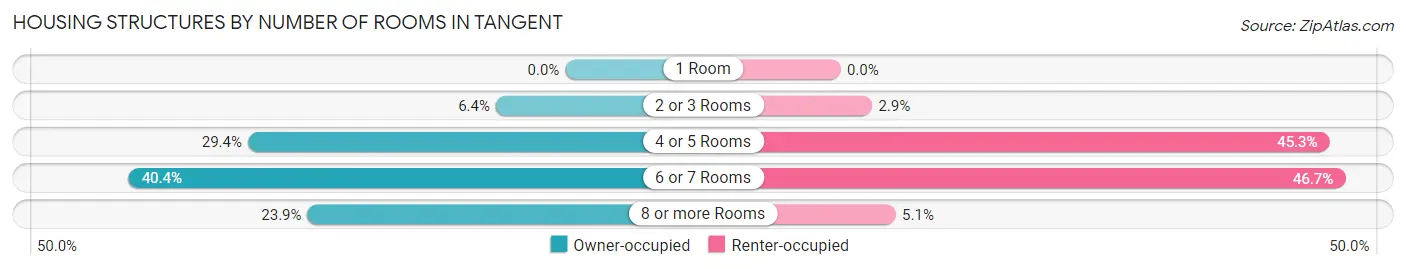
| Number of Rooms | Owner-occupied | Renter-occupied |
| 1 Room | 0 (0.0%) | 0 (0.0%) |
| 2 or 3 Rooms | 21 (6.4%) | 4 (2.9%) |
| 4 or 5 Rooms | 96 (29.4%) | 62 (45.3%) |
| 6 or 7 Rooms | 132 (40.4%) | 64 (46.7%) |
| 8 or more Rooms | 78 (23.8%) | 7 (5.1%) |
| Total | 327 (100.0%) | 137 (100.0%) |
Housing Structure by Heating Type in Tangent
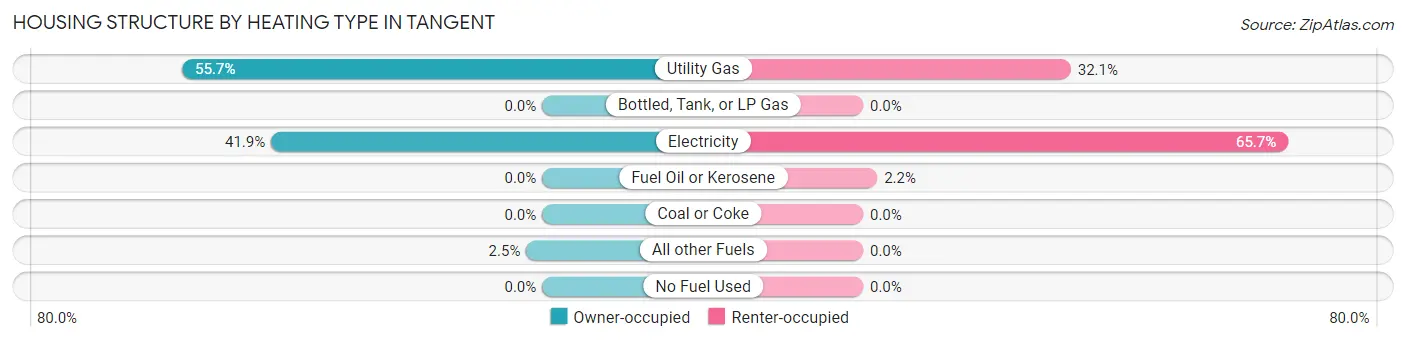
| Heating Type | Owner-occupied | Renter-occupied |
| Utility Gas | 182 (55.7%) | 44 (32.1%) |
| Bottled, Tank, or LP Gas | 0 (0.0%) | 0 (0.0%) |
| Electricity | 137 (41.9%) | 90 (65.7%) |
| Fuel Oil or Kerosene | 0 (0.0%) | 3 (2.2%) |
| Coal or Coke | 0 (0.0%) | 0 (0.0%) |
| All other Fuels | 8 (2.5%) | 0 (0.0%) |
| No Fuel Used | 0 (0.0%) | 0 (0.0%) |
| Total | 327 (100.0%) | 137 (100.0%) |
Household Vehicle Usage in Tangent
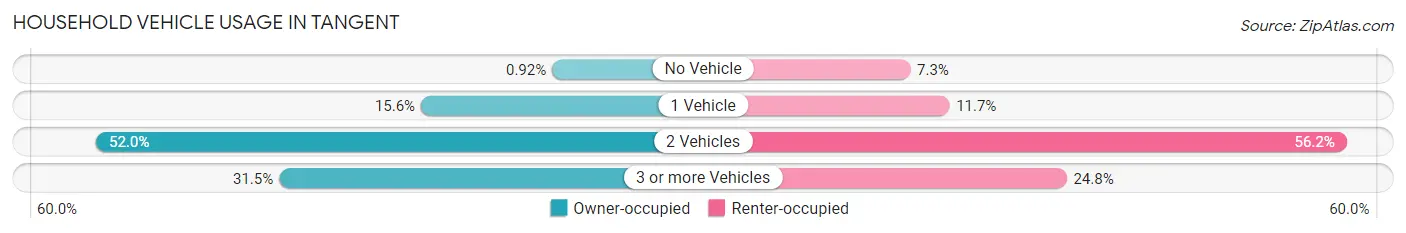
| Vehicles per Household | Owner-occupied | Renter-occupied |
| No Vehicle | 3 (0.9%) | 10 (7.3%) |
| 1 Vehicle | 51 (15.6%) | 16 (11.7%) |
| 2 Vehicles | 170 (52.0%) | 77 (56.2%) |
| 3 or more Vehicles | 103 (31.5%) | 34 (24.8%) |
| Total | 327 (100.0%) | 137 (100.0%) |
Real Estate & Mortgages in Tangent
Real Estate and Mortgage Overview in Tangent
| Characteristic | Without Mortgage | With Mortgage |
| Housing Units | 136 | 191 |
| Median Property Value | - | - |
| Median Household Income | $52,500 | $53 |
| Monthly Housing Costs | $556 | $1 |
| Real Estate Taxes | $2,151 | $5 |
Property Value by Mortgage Status in Tangent
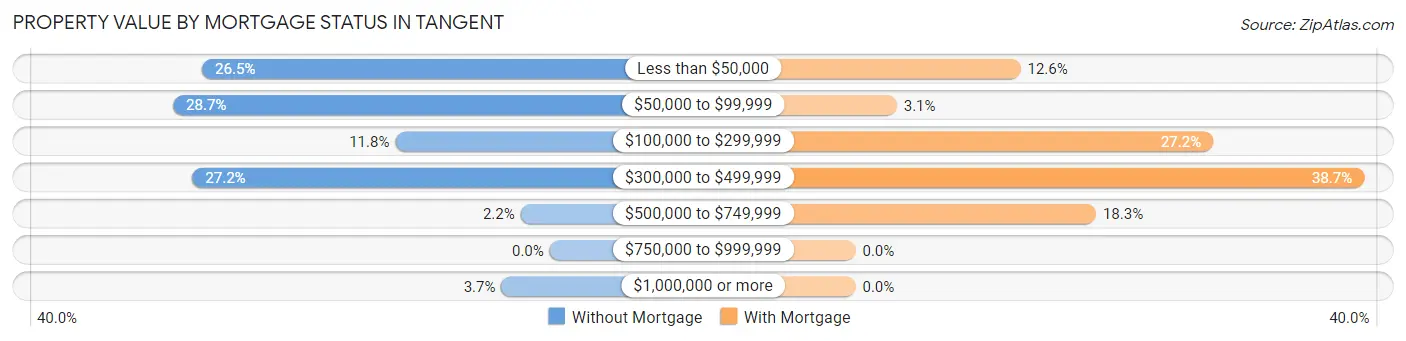
| Property Value | Without Mortgage | With Mortgage |
| Less than $50,000 | 36 (26.5%) | 24 (12.6%) |
| $50,000 to $99,999 | 39 (28.7%) | 6 (3.1%) |
| $100,000 to $299,999 | 16 (11.8%) | 52 (27.2%) |
| $300,000 to $499,999 | 37 (27.2%) | 74 (38.7%) |
| $500,000 to $749,999 | 3 (2.2%) | 35 (18.3%) |
| $750,000 to $999,999 | 0 (0.0%) | 0 (0.0%) |
| $1,000,000 or more | 5 (3.7%) | 0 (0.0%) |
| Total | 136 (100.0%) | 191 (100.0%) |
Household Income by Mortgage Status in Tangent
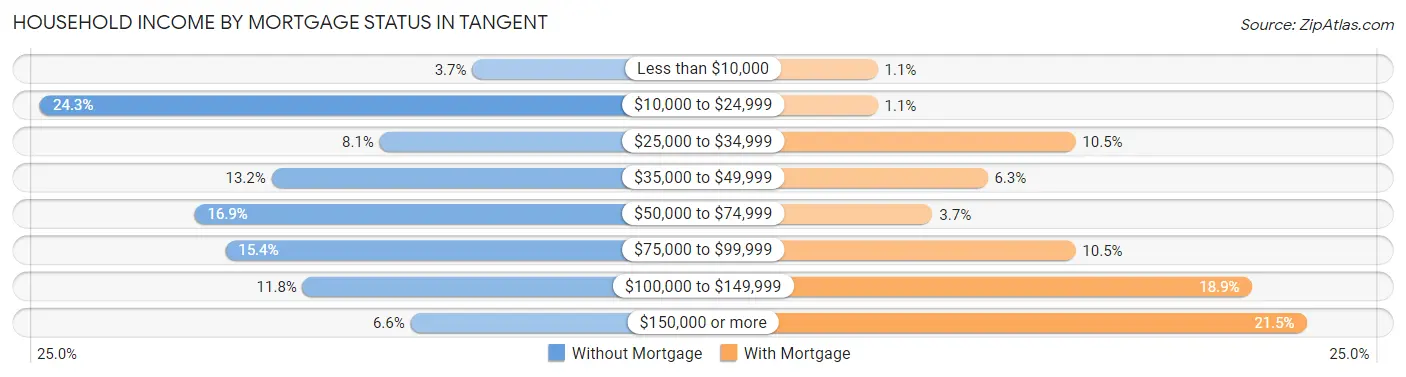
| Household Income | Without Mortgage | With Mortgage |
| Less than $10,000 | 5 (3.7%) | 2 (1.1%) |
| $10,000 to $24,999 | 33 (24.3%) | 2 (1.1%) |
| $25,000 to $34,999 | 11 (8.1%) | 20 (10.5%) |
| $35,000 to $49,999 | 18 (13.2%) | 12 (6.3%) |
| $50,000 to $74,999 | 23 (16.9%) | 7 (3.7%) |
| $75,000 to $99,999 | 21 (15.4%) | 20 (10.5%) |
| $100,000 to $149,999 | 16 (11.8%) | 36 (18.9%) |
| $150,000 or more | 9 (6.6%) | 41 (21.5%) |
| Total | 136 (100.0%) | 191 (100.0%) |
Property Value to Household Income Ratio in Tangent
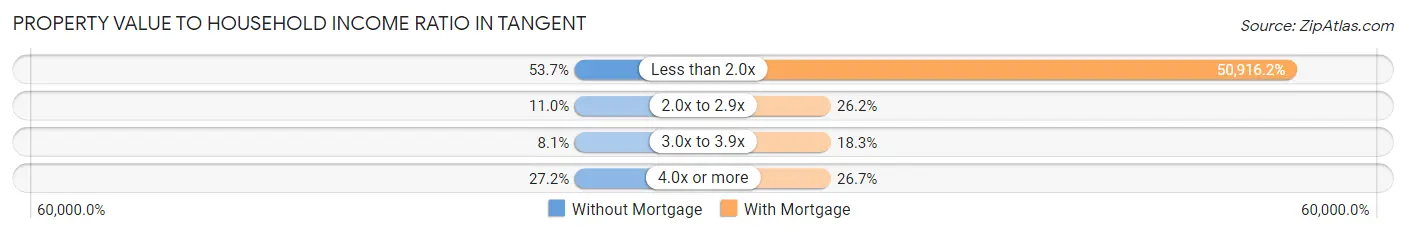
| Value-to-Income Ratio | Without Mortgage | With Mortgage |
| Less than 2.0x | 73 (53.7%) | 97,250 (50,916.2%) |
| 2.0x to 2.9x | 15 (11.0%) | 50 (26.2%) |
| 3.0x to 3.9x | 11 (8.1%) | 35 (18.3%) |
| 4.0x or more | 37 (27.2%) | 51 (26.7%) |
| Total | 136 (100.0%) | 191 (100.0%) |
Real Estate Taxes by Mortgage Status in Tangent
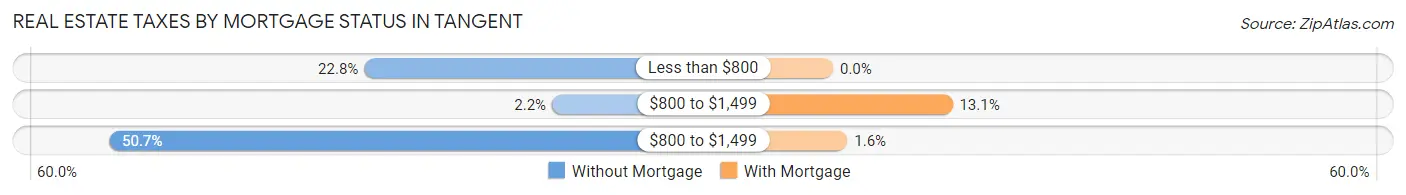
| Property Taxes | Without Mortgage | With Mortgage |
| Less than $800 | 31 (22.8%) | 0 (0.0%) |
| $800 to $1,499 | 3 (2.2%) | 25 (13.1%) |
| $800 to $1,499 | 69 (50.7%) | 3 (1.6%) |
| Total | 136 (100.0%) | 191 (100.0%) |
Health & Disability in Tangent
Health Insurance Coverage by Age in Tangent
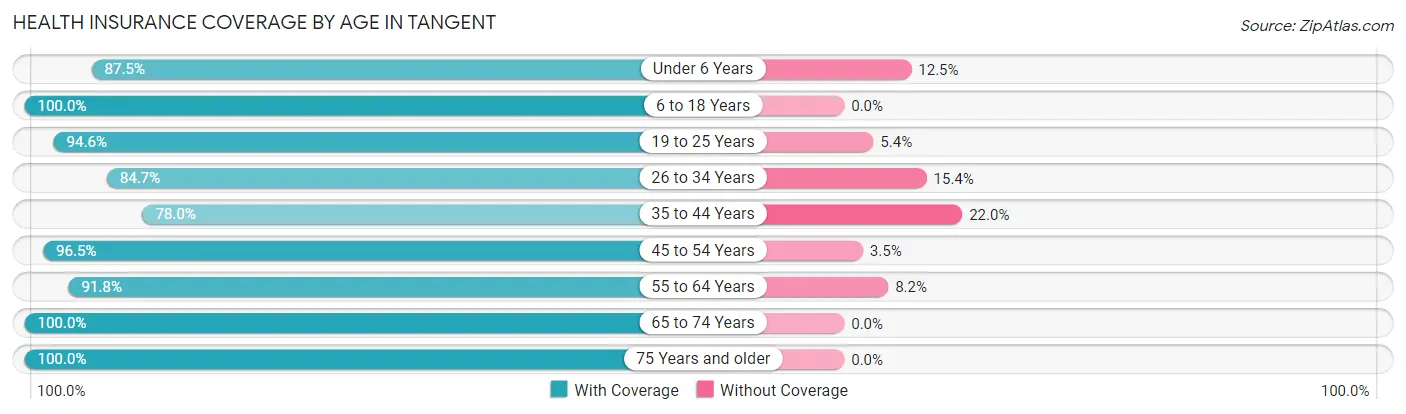
| Age Bracket | With Coverage | Without Coverage |
| Under 6 Years | 42 (87.5%) | 6 (12.5%) |
| 6 to 18 Years | 220 (100.0%) | 0 (0.0%) |
| 19 to 25 Years | 122 (94.6%) | 7 (5.4%) |
| 26 to 34 Years | 171 (84.7%) | 31 (15.3%) |
| 35 to 44 Years | 110 (78.0%) | 31 (22.0%) |
| 45 to 54 Years | 139 (96.5%) | 5 (3.5%) |
| 55 to 64 Years | 213 (91.8%) | 19 (8.2%) |
| 65 to 74 Years | 111 (100.0%) | 0 (0.0%) |
| 75 Years and older | 72 (100.0%) | 0 (0.0%) |
| Total | 1,200 (92.4%) | 99 (7.6%) |
Health Insurance Coverage by Citizenship Status in Tangent
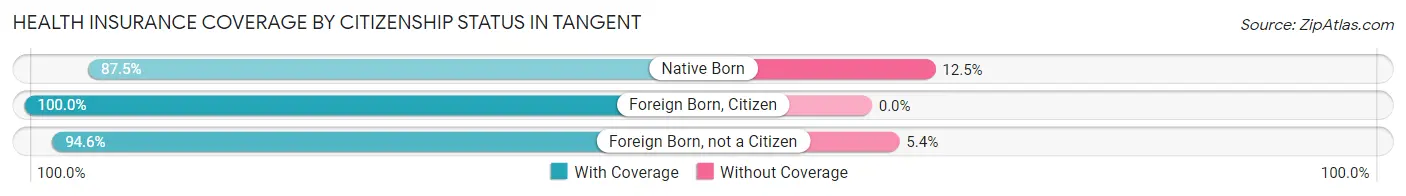
| Citizenship Status | With Coverage | Without Coverage |
| Native Born | 42 (87.5%) | 6 (12.5%) |
| Foreign Born, Citizen | 220 (100.0%) | 0 (0.0%) |
| Foreign Born, not a Citizen | 122 (94.6%) | 7 (5.4%) |
Health Insurance Coverage by Household Income in Tangent
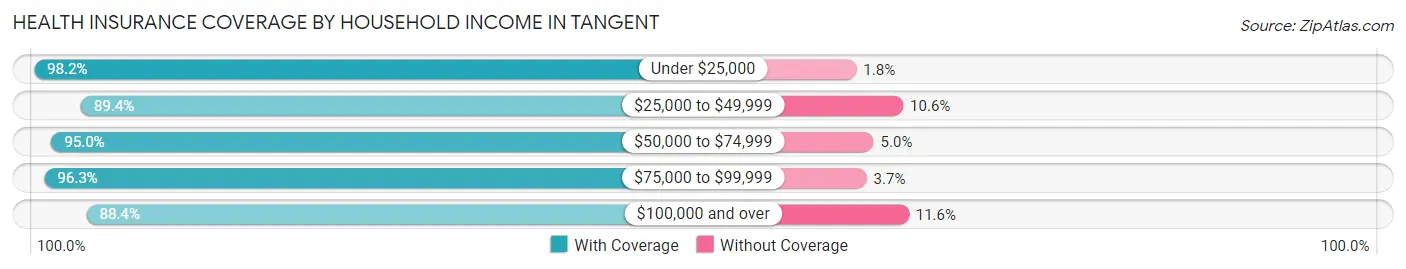
| Household Income | With Coverage | Without Coverage |
| Under $25,000 | 164 (98.2%) | 3 (1.8%) |
| $25,000 to $49,999 | 127 (89.4%) | 15 (10.6%) |
| $50,000 to $74,999 | 189 (95.0%) | 10 (5.0%) |
| $75,000 to $99,999 | 259 (96.3%) | 10 (3.7%) |
| $100,000 and over | 457 (88.4%) | 60 (11.6%) |
Public vs Private Health Insurance Coverage by Age in Tangent
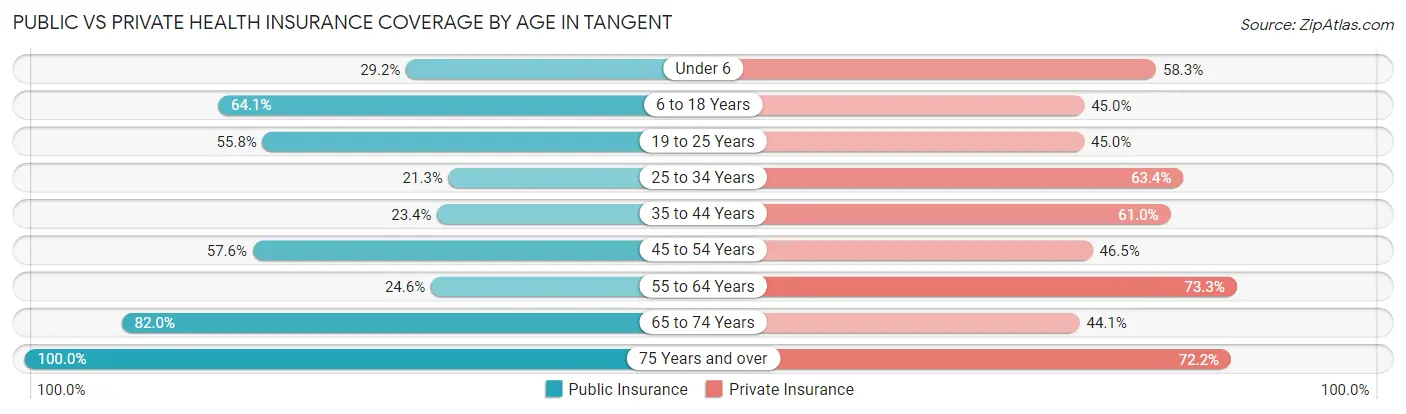
| Age Bracket | Public Insurance | Private Insurance |
| Under 6 | 14 (29.2%) | 28 (58.3%) |
| 6 to 18 Years | 141 (64.1%) | 99 (45.0%) |
| 19 to 25 Years | 72 (55.8%) | 58 (45.0%) |
| 25 to 34 Years | 43 (21.3%) | 128 (63.4%) |
| 35 to 44 Years | 33 (23.4%) | 86 (61.0%) |
| 45 to 54 Years | 83 (57.6%) | 67 (46.5%) |
| 55 to 64 Years | 57 (24.6%) | 170 (73.3%) |
| 65 to 74 Years | 91 (82.0%) | 49 (44.1%) |
| 75 Years and over | 72 (100.0%) | 52 (72.2%) |
| Total | 606 (46.7%) | 737 (56.7%) |
Disability Status by Sex by Age in Tangent
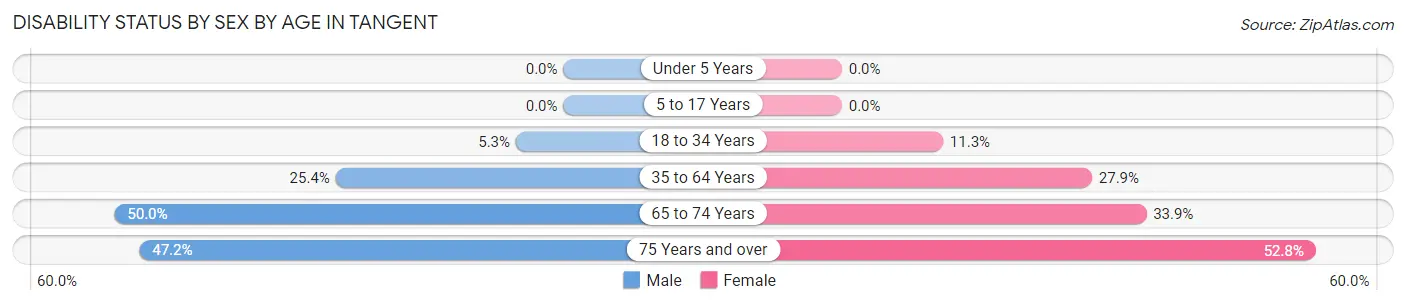
| Age Bracket | Male | Female |
| Under 5 Years | 0 (0.0%) | 0 (0.0%) |
| 5 to 17 Years | 0 (0.0%) | 0 (0.0%) |
| 18 to 34 Years | 10 (5.3%) | 17 (11.3%) |
| 35 to 64 Years | 71 (25.4%) | 66 (27.9%) |
| 65 to 74 Years | 26 (50.0%) | 20 (33.9%) |
| 75 Years and over | 17 (47.2%) | 19 (52.8%) |
Disability Class by Sex by Age in Tangent
Disability Class: Hearing Difficulty
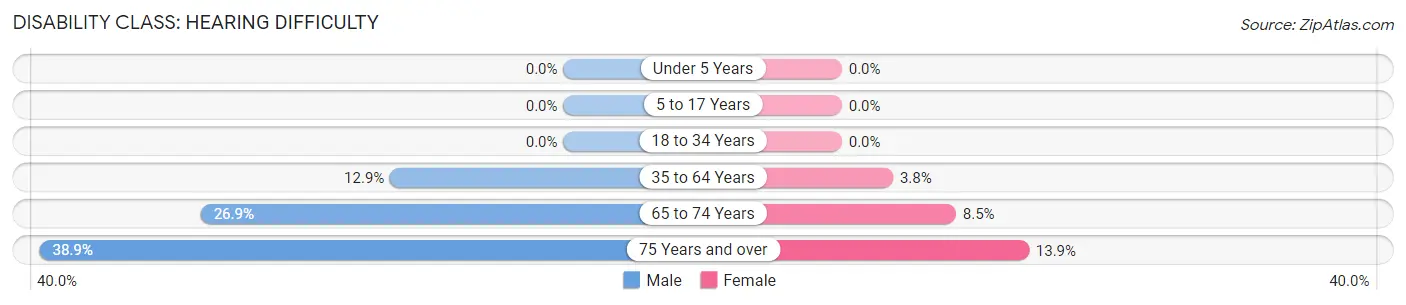
| Age Bracket | Male | Female |
| Under 5 Years | 0 (0.0%) | 0 (0.0%) |
| 5 to 17 Years | 0 (0.0%) | 0 (0.0%) |
| 18 to 34 Years | 0 (0.0%) | 0 (0.0%) |
| 35 to 64 Years | 36 (12.9%) | 9 (3.8%) |
| 65 to 74 Years | 14 (26.9%) | 5 (8.5%) |
| 75 Years and over | 14 (38.9%) | 5 (13.9%) |
Disability Class: Vision Difficulty
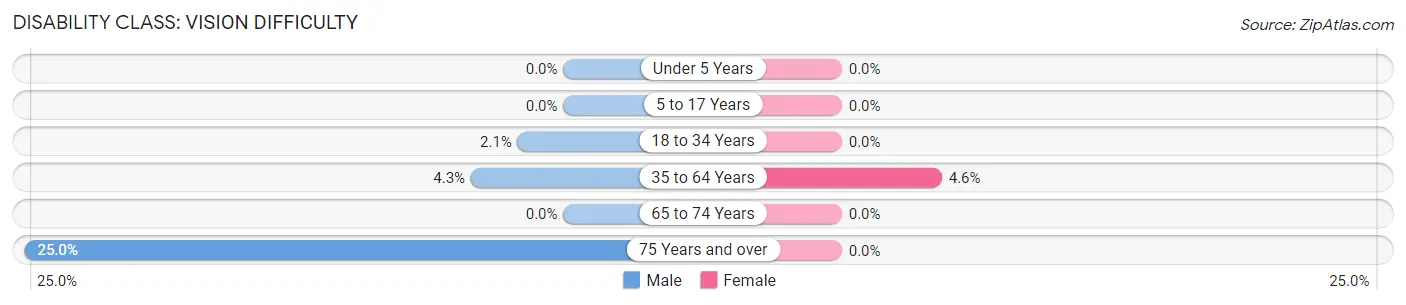
| Age Bracket | Male | Female |
| Under 5 Years | 0 (0.0%) | 0 (0.0%) |
| 5 to 17 Years | 0 (0.0%) | 0 (0.0%) |
| 18 to 34 Years | 4 (2.1%) | 0 (0.0%) |
| 35 to 64 Years | 12 (4.3%) | 11 (4.6%) |
| 65 to 74 Years | 0 (0.0%) | 0 (0.0%) |
| 75 Years and over | 9 (25.0%) | 0 (0.0%) |
Disability Class: Cognitive Difficulty
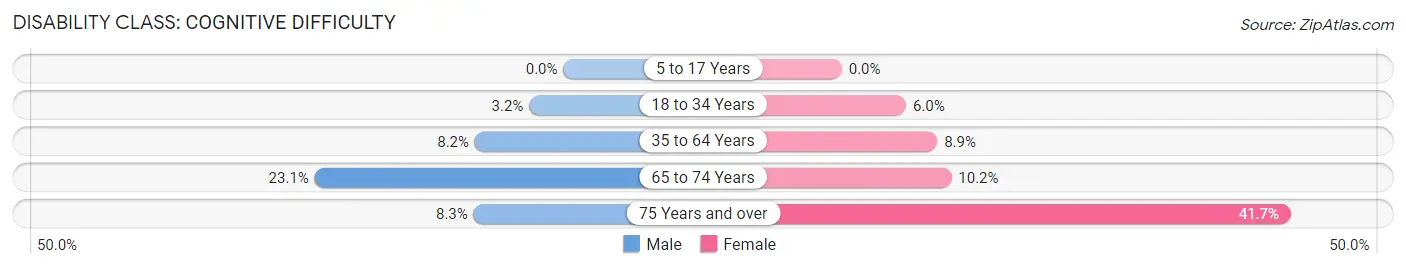
| Age Bracket | Male | Female |
| 5 to 17 Years | 0 (0.0%) | 0 (0.0%) |
| 18 to 34 Years | 6 (3.2%) | 9 (6.0%) |
| 35 to 64 Years | 23 (8.2%) | 21 (8.9%) |
| 65 to 74 Years | 12 (23.1%) | 6 (10.2%) |
| 75 Years and over | 3 (8.3%) | 15 (41.7%) |
Disability Class: Ambulatory Difficulty
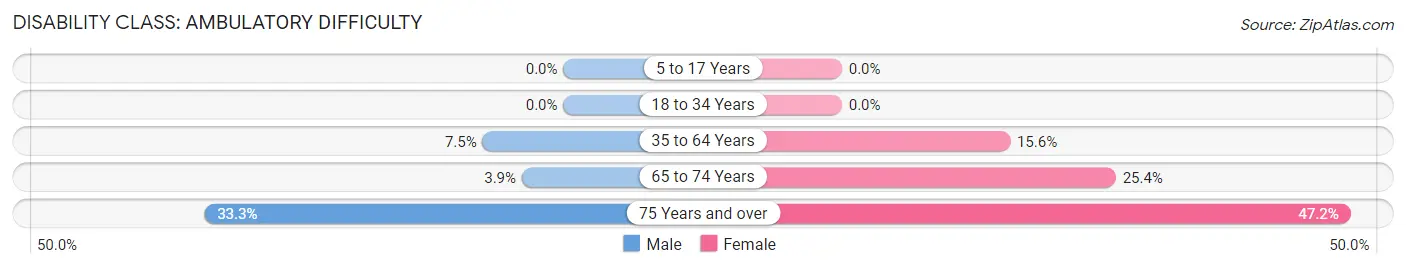
| Age Bracket | Male | Female |
| 5 to 17 Years | 0 (0.0%) | 0 (0.0%) |
| 18 to 34 Years | 0 (0.0%) | 0 (0.0%) |
| 35 to 64 Years | 21 (7.5%) | 37 (15.6%) |
| 65 to 74 Years | 2 (3.8%) | 15 (25.4%) |
| 75 Years and over | 12 (33.3%) | 17 (47.2%) |
Disability Class: Self-Care Difficulty
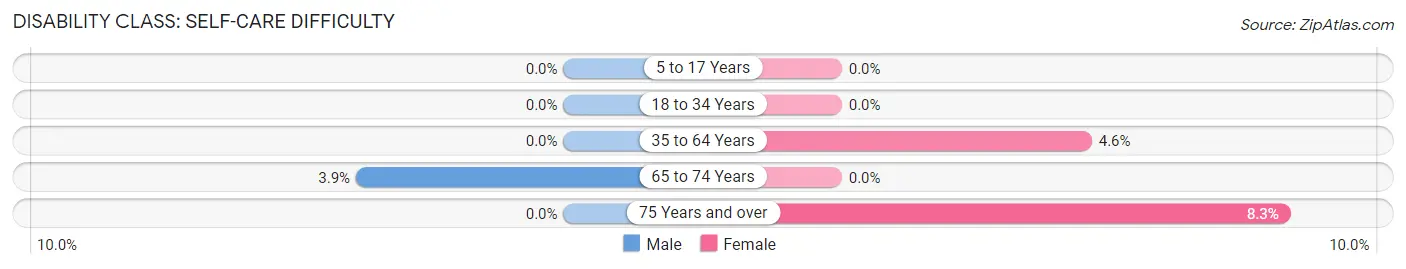
| Age Bracket | Male | Female |
| 5 to 17 Years | 0 (0.0%) | 0 (0.0%) |
| 18 to 34 Years | 0 (0.0%) | 0 (0.0%) |
| 35 to 64 Years | 0 (0.0%) | 11 (4.6%) |
| 65 to 74 Years | 2 (3.8%) | 0 (0.0%) |
| 75 Years and over | 0 (0.0%) | 3 (8.3%) |
Technology Access in Tangent
Computing Device Access in Tangent
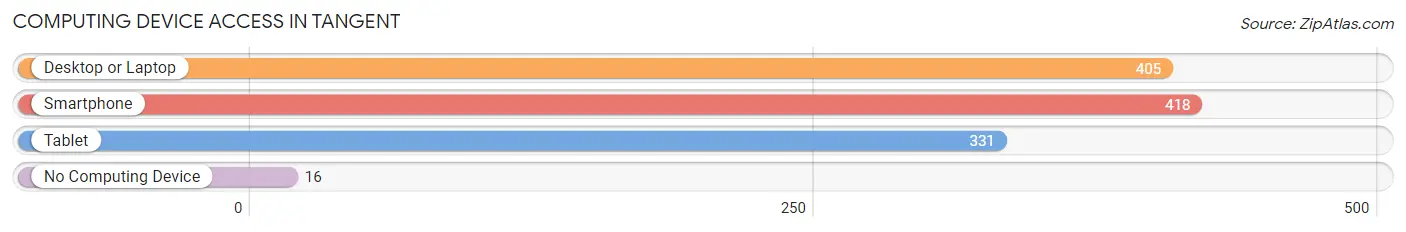
| Device Type | # Households | % Households |
| Desktop or Laptop | 405 | 87.3% |
| Smartphone | 418 | 90.1% |
| Tablet | 331 | 71.3% |
| No Computing Device | 16 | 3.5% |
| Total | 464 | 100.0% |
Internet Access in Tangent
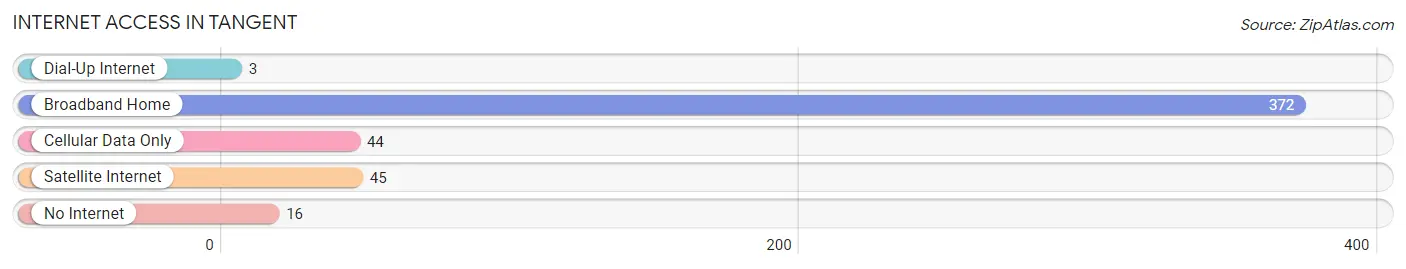
| Internet Type | # Households | % Households |
| Dial-Up Internet | 3 | 0.6% |
| Broadband Home | 372 | 80.2% |
| Cellular Data Only | 44 | 9.5% |
| Satellite Internet | 45 | 9.7% |
| No Internet | 16 | 3.5% |
| Total | 464 | 100.0% |
Tangent Summary
History
Oregon is a state located in the Pacific Northwest region of the United States. It is bordered by Washington to the north, Idaho to the east, California and Nevada to the south, and the Pacific Ocean to the west. Oregon was admitted to the Union as the 33rd state on February 14, 1859.
The first inhabitants of Oregon were Native American tribes, including the Chinook, Kalapuya, Molalla, and many others. The first Europeans to explore the area were Spanish explorers in the late 1700s. In 1805, Lewis and Clark explored the area and established the Oregon Trail, which brought thousands of settlers to the region.
In 1843, the Oregon Territory was established, and in 1848, the Oregon Treaty was signed, which established the border between the United States and British North America. In 1859, Oregon was admitted to the Union as the 33rd state.
During the late 1800s and early 1900s, Oregon experienced a period of rapid growth and development. The population increased significantly, and the economy shifted from an agricultural-based economy to an industrial-based economy. The timber industry was particularly important to the state’s economy, and the state became known as the “Timber State.”
In the mid-1900s, Oregon experienced a period of economic decline. The timber industry declined, and the state’s economy shifted to a service-based economy. In the late 1900s, the state experienced a period of economic recovery, and the economy shifted to a more diversified base.
Geography
Oregon is located in the Pacific Northwest region of the United States. It is bordered by Washington to the north, Idaho to the east, California and Nevada to the south, and the Pacific Ocean to the west. Oregon is the ninth largest state in the United States, with a total area of 98,381 square miles.
Oregon is divided into seven distinct geographic regions: the Coast Range, the Cascade Range, the Columbia Plateau, the Klamath Mountains, the Blue Mountains, the Willamette Valley, and the Columbia River Gorge. The Coast Range is a coastal mountain range that runs along the Pacific Ocean. The Cascade Range is a mountain range that runs through the state from north to south. The Columbia Plateau is a large plateau that covers much of the eastern part of the state. The Klamath Mountains are a mountain range located in the southwestern part of the state. The Blue Mountains are a mountain range located in the northeastern part of the state. The Willamette Valley is a fertile valley located in the western part of the state. The Columbia River Gorge is a deep gorge that runs along the Columbia River.
Economy
In 2000, Oregon’s economy was largely based on services, manufacturing, and agriculture. The state’s largest industries included timber, agriculture, manufacturing, and tourism.
The timber industry was the largest industry in the state, accounting for nearly 20% of the state’s total economic output. The timber industry was largely based in the western part of the state, and it employed thousands of people.
Agriculture was the second largest industry in the state, accounting for nearly 10% of the state’s total economic output. The state’s agricultural products included wheat, hay, potatoes, and other crops.
Manufacturing was the third largest industry in the state, accounting for nearly 8% of the state’s total economic output. The state’s manufacturing sector was largely based in the Portland metropolitan area, and it employed thousands of people.
Tourism was the fourth largest industry in the state, accounting for nearly 6% of the state’s total economic output. The state’s tourism industry was largely based in the coastal areas, and it employed thousands of people.
Demographics
In 2000, Oregon had a population of 3,421,399 people. The state’s population was largely concentrated in the western part of the state, particularly in the Portland metropolitan area.
The largest ethnic group in the state was white, accounting for nearly 80% of the state’s population. The second largest ethnic group was Hispanic, accounting for nearly 10% of the state’s population. The third largest ethnic group was Asian, accounting for nearly 5% of the state’s population.
The median household income in the state was $41,845, and the median family income was $51,845. The poverty rate in the state was 11.3%.
Common Questions
What is Per Capita Income in Tangent?
Per Capita income in Tangent is $33,358.
What is the Median Family Income in Tangent?
Median Family Income in Tangent is $88,393.
What is the Median Household income in Tangent?
Median Household Income in Tangent is $83,500.
What is Income or Wage Gap in Tangent?
Income or Wage Gap in Tangent is 34.8%.
Women in Tangent earn 65.2 cents for every dollar earned by a man.
What is Inequality or Gini Index in Tangent?
Inequality or Gini Index in Tangent is 0.40.
What is the Total Population of Tangent?
Total Population of Tangent is 1,299.
What is the Total Male Population of Tangent?
Total Male Population of Tangent is 710.
What is the Total Female Population of Tangent?
Total Female Population of Tangent is 589.
What is the Ratio of Males per 100 Females in Tangent?
There are 120.54 Males per 100 Females in Tangent.
What is the Ratio of Females per 100 Males in Tangent?
There are 82.96 Females per 100 Males in Tangent.
What is the Median Population Age in Tangent?
Median Population Age in Tangent is 40.1 Years.
What is the Average Family Size in Tangent
Average Family Size in Tangent is 2.9 People.
What is the Average Household Size in Tangent
Average Household Size in Tangent is 2.8 People.
How Large is the Labor Force in Tangent?
There are 691 People in the Labor Forcein in Tangent.
What is the Percentage of People in the Labor Force in Tangent?
64.8% of People are in the Labor Force in Tangent.
What is the Unemployment Rate in Tangent?
Unemployment Rate in Tangent is 5.8%.