Madras, OR Map & Demographics
Madras Map
Madras Overview
$23,764
PER CAPITA INCOME
$63,032
AVG FAMILY INCOME
$52,500
AVG HOUSEHOLD INCOME
31.1%
WAGE / INCOME GAP [ % ]
68.9¢/ $1
WAGE / INCOME GAP [ $ ]
0.47
INEQUALITY / GINI INDEX
7,494
TOTAL POPULATION
3,535
MALE POPULATION
3,959
FEMALE POPULATION
89.29
MALES / 100 FEMALES
111.99
FEMALES / 100 MALES
33.0
MEDIAN AGE
3.5
AVG FAMILY SIZE
3.0
AVG HOUSEHOLD SIZE
3,362
LABOR FORCE [ PEOPLE ]
63.9%
PERCENT IN LABOR FORCE
10.0%
UNEMPLOYMENT RATE
Madras Zip Codes
Madras Area Codes
Income in Madras
Income Overview in Madras
Per Capita Income in Madras is $23,764, while median incomes of families and households are $63,032 and $52,500 respectively.
| Characteristic | Number | Measure |
| Per Capita Income | 7,494 | $23,764 |
| Median Family Income | 1,722 | $63,032 |
| Mean Family Income | 1,722 | $76,699 |
| Median Household Income | 2,470 | $52,500 |
| Mean Household Income | 2,470 | $69,508 |
| Income Deficit | 1,722 | $0 |
| Wage / Income Gap (%) | 7,494 | 31.11% |
| Wage / Income Gap ($) | 7,494 | 68.89¢ per $1 |
| Gini / Inequality Index | 7,494 | 0.47 |
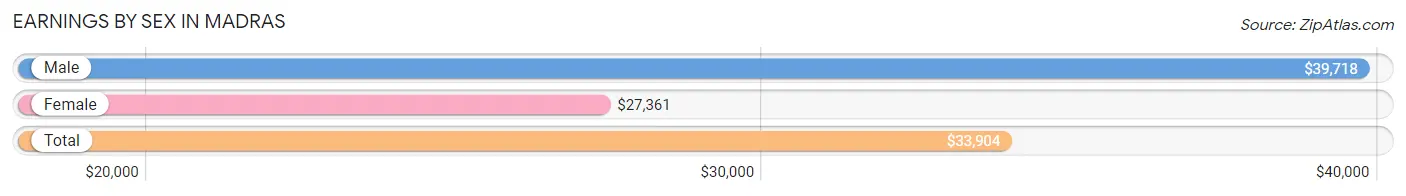
Earnings by Sex in Madras
Average Earnings in Madras are $33,904, $39,718 for men and $27,361 for women, a difference of 31.1%.
| Sex | Number | Average Earnings |
| Male | 1,567 (45.2%) | $39,718 |
| Female | 1,899 (54.8%) | $27,361 |
| Total | 3,466 (100.0%) | $33,904 |
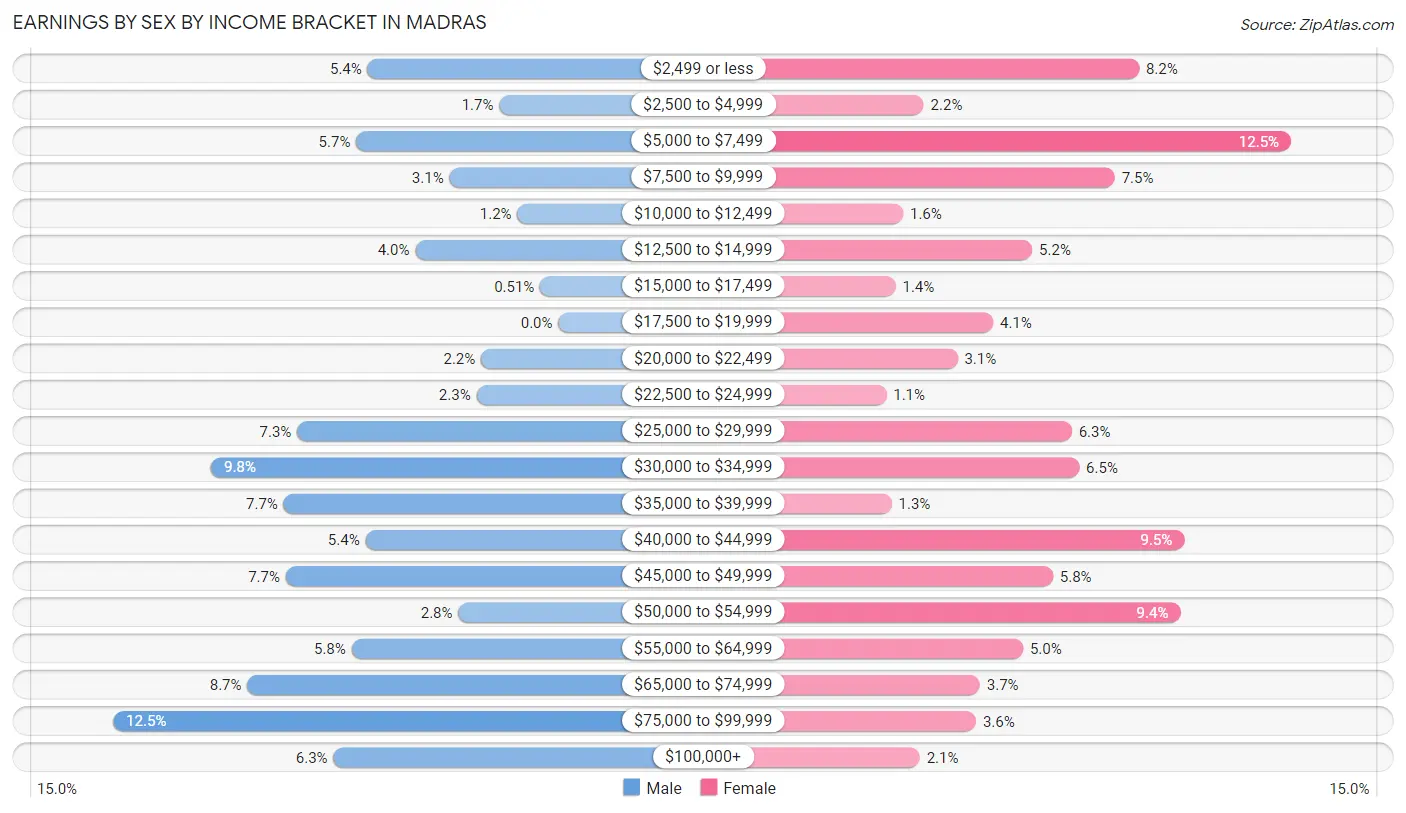
Earnings by Sex by Income Bracket in Madras
The most common earnings brackets in Madras are $75,000 to $99,999 for men (196 | 12.5%) and $5,000 to $7,499 for women (237 | 12.5%).
| Income | Male | Female |
| $2,499 or less | 84 (5.4%) | 156 (8.2%) |
| $2,500 to $4,999 | 26 (1.7%) | 41 (2.2%) |
| $5,000 to $7,499 | 89 (5.7%) | 237 (12.5%) |
| $7,500 to $9,999 | 48 (3.1%) | 143 (7.5%) |
| $10,000 to $12,499 | 18 (1.1%) | 30 (1.6%) |
| $12,500 to $14,999 | 63 (4.0%) | 99 (5.2%) |
| $15,000 to $17,499 | 8 (0.5%) | 26 (1.4%) |
| $17,500 to $19,999 | 0 (0.0%) | 78 (4.1%) |
| $20,000 to $22,499 | 34 (2.2%) | 59 (3.1%) |
| $22,500 to $24,999 | 36 (2.3%) | 21 (1.1%) |
| $25,000 to $29,999 | 115 (7.3%) | 120 (6.3%) |
| $30,000 to $34,999 | 153 (9.8%) | 124 (6.5%) |
| $35,000 to $39,999 | 121 (7.7%) | 24 (1.3%) |
| $40,000 to $44,999 | 85 (5.4%) | 180 (9.5%) |
| $45,000 to $49,999 | 120 (7.7%) | 110 (5.8%) |
| $50,000 to $54,999 | 44 (2.8%) | 178 (9.4%) |
| $55,000 to $64,999 | 91 (5.8%) | 94 (5.0%) |
| $65,000 to $74,999 | 137 (8.7%) | 71 (3.7%) |
| $75,000 to $99,999 | 196 (12.5%) | 69 (3.6%) |
| $100,000+ | 99 (6.3%) | 39 (2.1%) |
| Total | 1,567 (100.0%) | 1,899 (100.0%) |
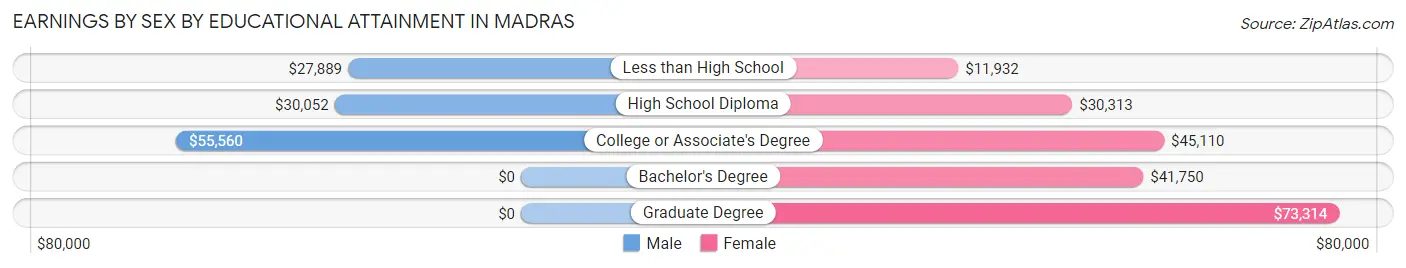
Earnings by Sex by Educational Attainment in Madras
Average earnings in Madras are $43,341 for men and $36,944 for women, a difference of 14.8%. Men with an educational attainment of college or associate's degree enjoy the highest average annual earnings of $55,560, while those with less than high school education earn the least with $27,889. Women with an educational attainment of graduate degree earn the most with the average annual earnings of $73,314, while those with less than high school education have the smallest earnings of $11,932.
| Educational Attainment | Male Income | Female Income |
| Less than High School | $27,889 | $11,932 |
| High School Diploma | $30,052 | $30,313 |
| College or Associate's Degree | $55,560 | $45,110 |
| Bachelor's Degree | - | - |
| Graduate Degree | - | - |
| Total | $43,341 | $36,944 |
Family Income in Madras
Family Income Brackets in Madras
According to the Madras family income data, there are 289 families falling into the $50,000 to $74,999 income range, which is the most common income bracket and makes up 16.8% of all families. Conversely, the $200,000+ income bracket is the least frequent group with only 41 families (2.4%) belonging to this category.
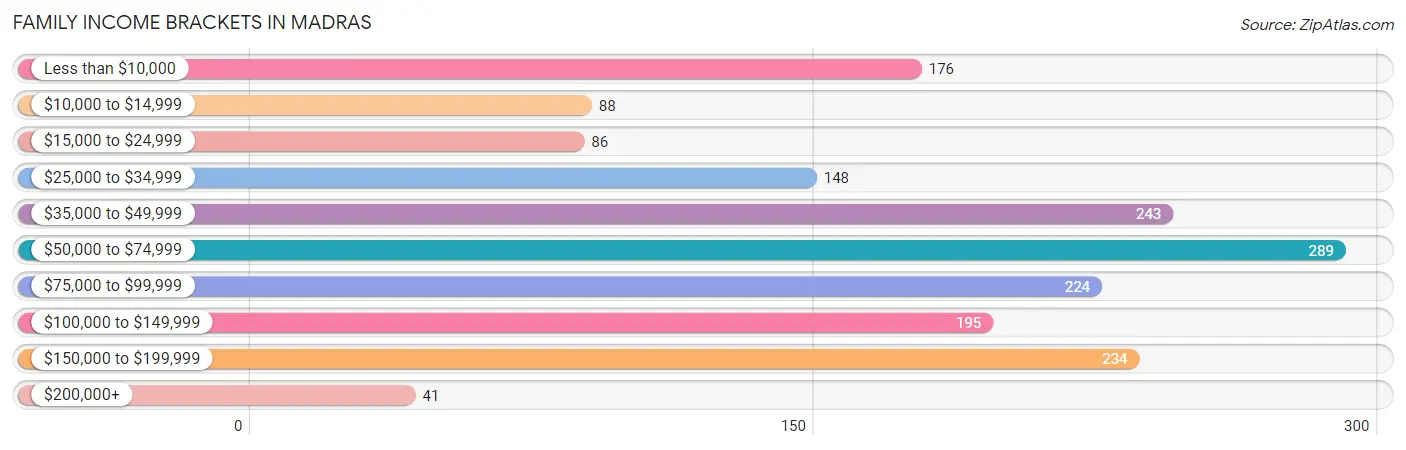
| Income Bracket | # Families | % Families |
| Less than $10,000 | 176 | 10.2% |
| $10,000 to $14,999 | 88 | 5.1% |
| $15,000 to $24,999 | 86 | 5.0% |
| $25,000 to $34,999 | 148 | 8.6% |
| $35,000 to $49,999 | 243 | 14.1% |
| $50,000 to $74,999 | 289 | 16.8% |
| $75,000 to $99,999 | 224 | 13.0% |
| $100,000 to $149,999 | 195 | 11.3% |
| $150,000 to $199,999 | 234 | 13.6% |
| $200,000+ | 41 | 2.4% |
Family Income by Famaliy Size in Madras
5-person families (137 | 8.0%) account for the highest median family income in Madras with $162,532 per family, while 5-person families (137 | 8.0%) have the highest median income of $32,506 per family member.
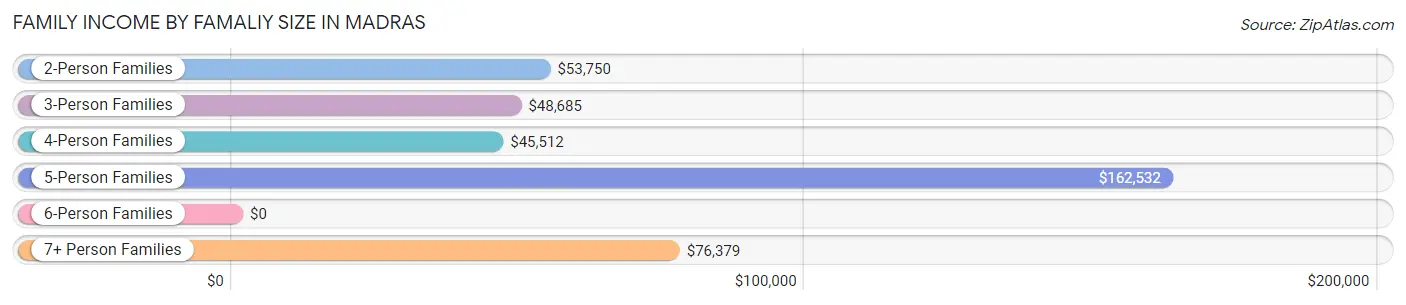
| Income Bracket | # Families | Median Income |
| 2-Person Families | 634 (36.8%) | $53,750 |
| 3-Person Families | 503 (29.2%) | $48,685 |
| 4-Person Families | 261 (15.2%) | $45,512 |
| 5-Person Families | 137 (8.0%) | $162,532 |
| 6-Person Families | 112 (6.5%) | $0 |
| 7+ Person Families | 75 (4.4%) | $76,379 |
| Total | 1,722 (100.0%) | $63,032 |
Family Income by Number of Earners in Madras
The median family income in Madras is $63,032, with families comprising 2 earners (535) having the highest median family income of $120,282, while families with no earners (203) have the lowest median family income of $18,250, accounting for 31.1% and 11.8% of families, respectively.
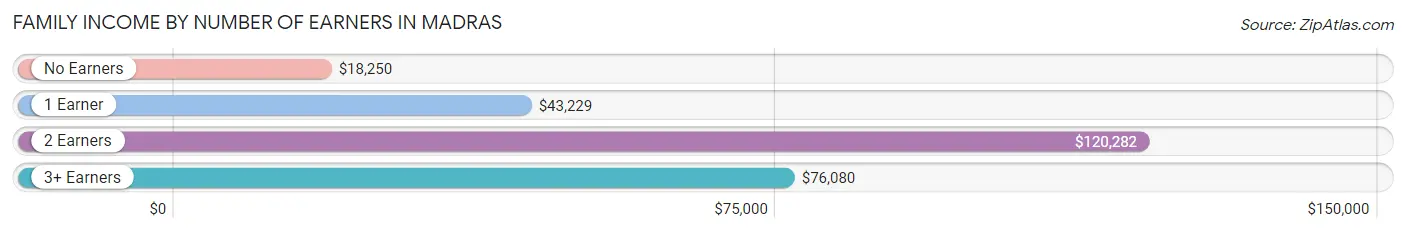
| Number of Earners | # Families | Median Income |
| No Earners | 203 (11.8%) | $18,250 |
| 1 Earner | 738 (42.9%) | $43,229 |
| 2 Earners | 535 (31.1%) | $120,282 |
| 3+ Earners | 246 (14.3%) | $76,080 |
| Total | 1,722 (100.0%) | $63,032 |
Household Income in Madras
Household Income Brackets in Madras
With 445 households falling in the category, the $50,000 to $74,999 income range is the most frequent in Madras, accounting for 18.0% of all households. In contrast, only 86 households (3.5%) fall into the $200,000+ income bracket, making it the least populous group.
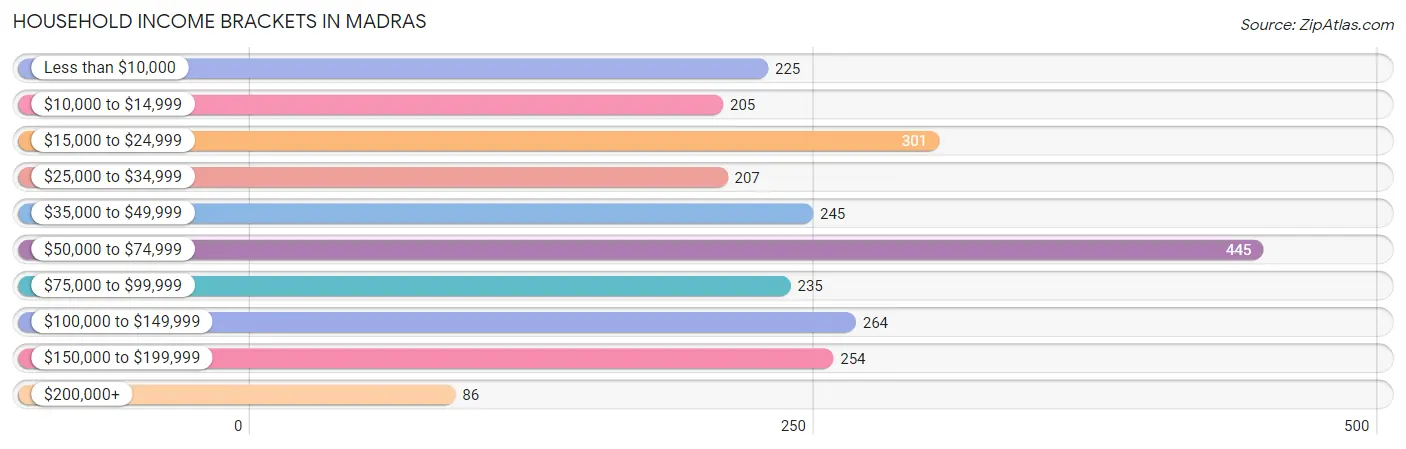
| Income Bracket | # Households | % Households |
| Less than $10,000 | 225 | 9.1% |
| $10,000 to $14,999 | 205 | 8.3% |
| $15,000 to $24,999 | 301 | 12.2% |
| $25,000 to $34,999 | 207 | 8.4% |
| $35,000 to $49,999 | 245 | 9.9% |
| $50,000 to $74,999 | 445 | 18.0% |
| $75,000 to $99,999 | 235 | 9.5% |
| $100,000 to $149,999 | 264 | 10.7% |
| $150,000 to $199,999 | 254 | 10.3% |
| $200,000+ | 86 | 3.5% |
Household Income by Householder Age in Madras
The median household income in Madras is $52,500, with the highest median household income of $73,634 found in the 25 to 44 years age bracket for the primary householder. A total of 769 households (31.1%) fall into this category. Meanwhile, the 15 to 24 years age bracket for the primary householder has the lowest median household income of $26,358, with 133 households (5.4%) in this group.
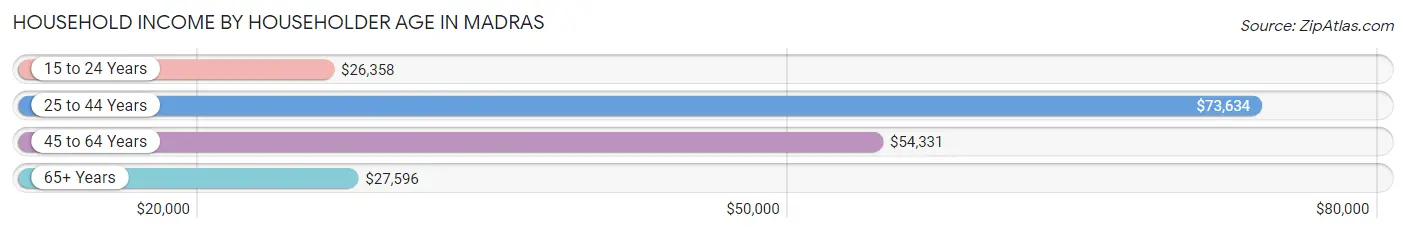
| Income Bracket | # Households | Median Income |
| 15 to 24 Years | 133 (5.4%) | $26,358 |
| 25 to 44 Years | 769 (31.1%) | $73,634 |
| 45 to 64 Years | 997 (40.4%) | $54,331 |
| 65+ Years | 571 (23.1%) | $27,596 |
| Total | 2,470 (100.0%) | $52,500 |
Poverty in Madras
Income Below Poverty by Sex and Age in Madras
With 19.9% poverty level for males and 16.5% for females among the residents of Madras, 5 year old males and 25 to 34 year old females are the most vulnerable to poverty, with 26 males (100.0%) and 145 females (33.3%) in their respective age groups living below the poverty level.
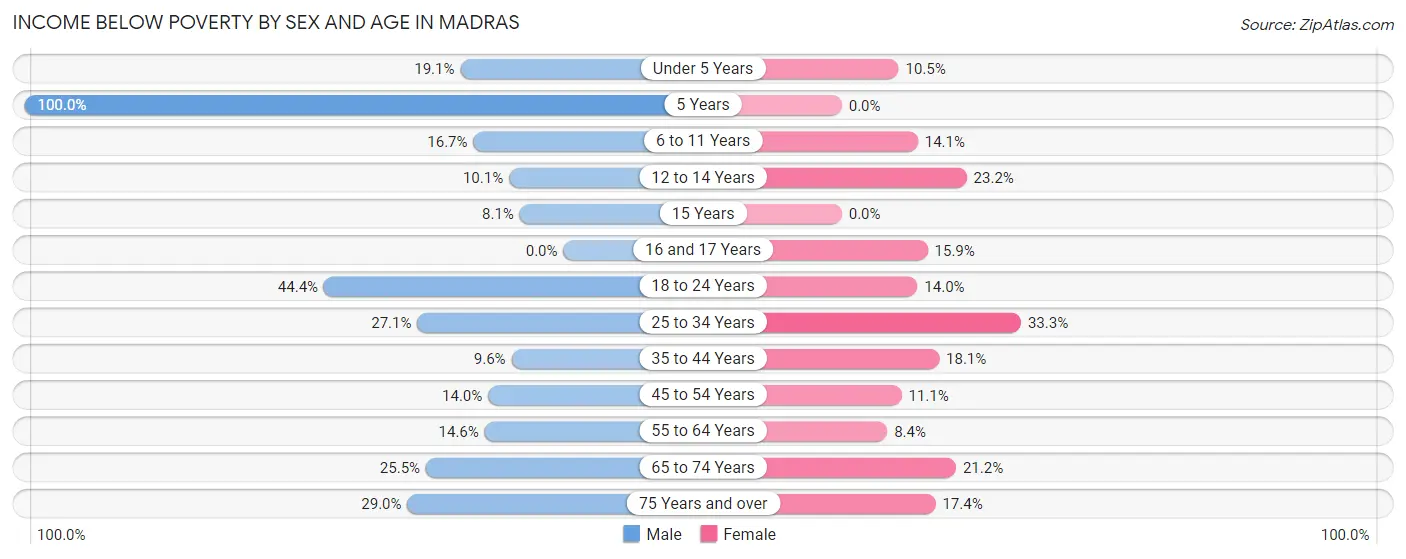
| Age Bracket | Male | Female |
| Under 5 Years | 78 (19.1%) | 46 (10.5%) |
| 5 Years | 26 (100.0%) | 0 (0.0%) |
| 6 to 11 Years | 77 (16.7%) | 47 (14.1%) |
| 12 to 14 Years | 22 (10.1%) | 54 (23.2%) |
| 15 Years | 3 (8.1%) | 0 (0.0%) |
| 16 and 17 Years | 0 (0.0%) | 36 (15.9%) |
| 18 to 24 Years | 84 (44.4%) | 55 (14.0%) |
| 25 to 34 Years | 119 (27.1%) | 145 (33.3%) |
| 35 to 44 Years | 34 (9.6%) | 84 (18.1%) |
| 45 to 54 Years | 70 (14.0%) | 49 (11.1%) |
| 55 to 64 Years | 45 (14.6%) | 35 (8.4%) |
| 65 to 74 Years | 75 (25.5%) | 39 (21.2%) |
| 75 Years and over | 55 (28.9%) | 44 (17.4%) |
| Total | 688 (19.9%) | 634 (16.5%) |
Income Above Poverty by Sex and Age in Madras
According to the poverty statistics in Madras, males aged 16 and 17 years and females aged 15 years are the age groups that are most secure financially, with 100.0% of males and 100.0% of females in these age groups living above the poverty line.
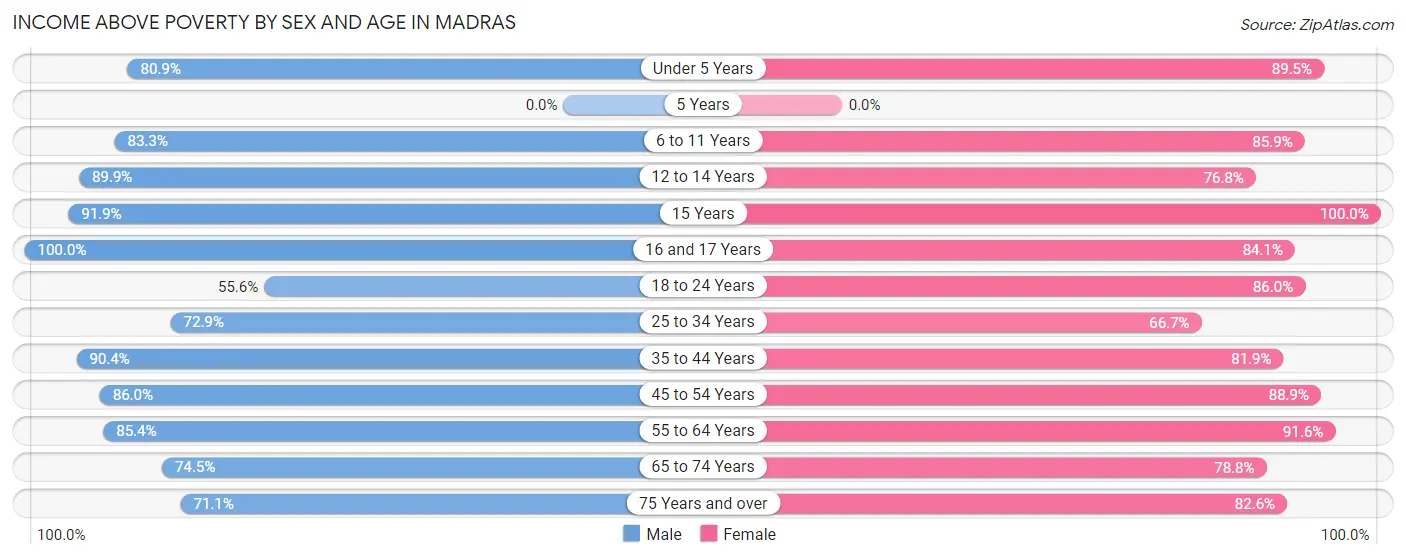
| Age Bracket | Male | Female |
| Under 5 Years | 330 (80.9%) | 391 (89.5%) |
| 5 Years | 0 (0.0%) | 0 (0.0%) |
| 6 to 11 Years | 384 (83.3%) | 286 (85.9%) |
| 12 to 14 Years | 196 (89.9%) | 179 (76.8%) |
| 15 Years | 34 (91.9%) | 33 (100.0%) |
| 16 and 17 Years | 30 (100.0%) | 190 (84.1%) |
| 18 to 24 Years | 105 (55.6%) | 337 (86.0%) |
| 25 to 34 Years | 320 (72.9%) | 291 (66.7%) |
| 35 to 44 Years | 319 (90.4%) | 381 (81.9%) |
| 45 to 54 Years | 431 (86.0%) | 393 (88.9%) |
| 55 to 64 Years | 263 (85.4%) | 380 (91.6%) |
| 65 to 74 Years | 219 (74.5%) | 145 (78.8%) |
| 75 Years and over | 135 (71.1%) | 209 (82.6%) |
| Total | 2,766 (80.1%) | 3,215 (83.5%) |
Income Below Poverty Among Married-Couple Families in Madras
The poverty statistics for married-couple families in Madras show that 12.2% or 120 of the total 987 families live below the poverty line. Families with 1 or 2 children have the highest poverty rate of 30.0%, comprising of 64 families. On the other hand, families with 3 or 4 children have the lowest poverty rate of 0.0%, which includes 0 families.
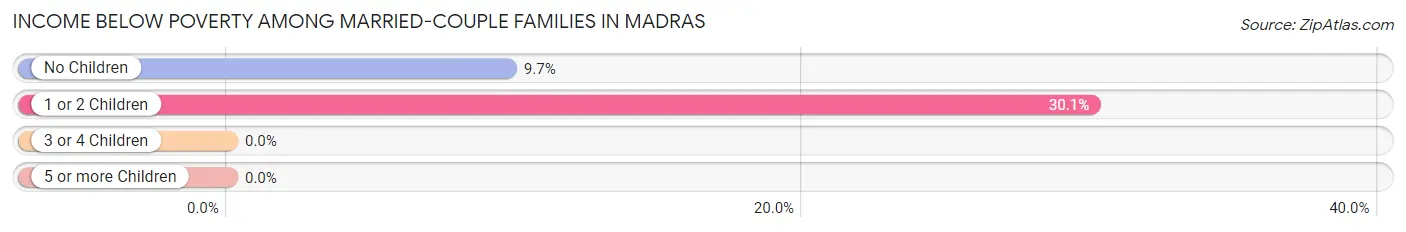
| Children | Above Poverty | Below Poverty |
| No Children | 521 (90.3%) | 56 (9.7%) |
| 1 or 2 Children | 149 (70.0%) | 64 (30.0%) |
| 3 or 4 Children | 129 (100.0%) | 0 (0.0%) |
| 5 or more Children | 68 (100.0%) | 0 (0.0%) |
| Total | 867 (87.8%) | 120 (12.2%) |
Income Below Poverty Among Single-Parent Households in Madras
According to the poverty data in Madras, 32.9% or 120 single-father households and 34.9% or 129 single-mother households are living below the poverty line. Among single-father households, those with 1 or 2 children have the highest poverty rate, with 120 households (62.5%) experiencing poverty. Likewise, among single-mother households, those with 3 or 4 children have the highest poverty rate, with 18 households (66.7%) falling below the poverty line.
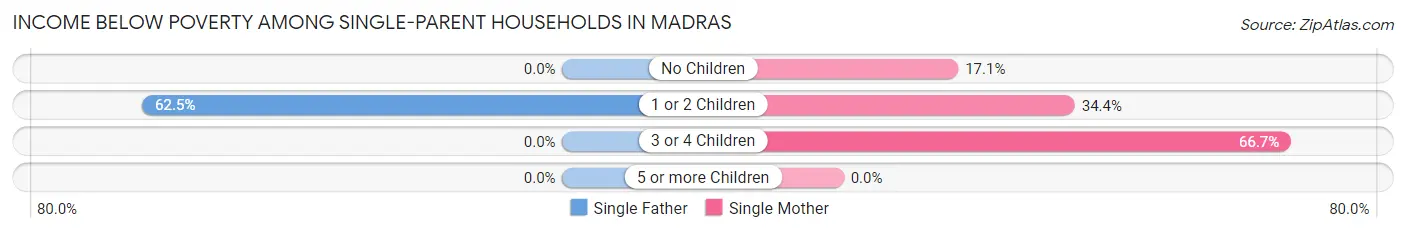
| Children | Single Father | Single Mother |
| No Children | 0 (0.0%) | 7 (17.1%) |
| 1 or 2 Children | 120 (62.5%) | 104 (34.4%) |
| 3 or 4 Children | 0 (0.0%) | 18 (66.7%) |
| 5 or more Children | 0 (0.0%) | 0 (0.0%) |
| Total | 120 (32.9%) | 129 (34.9%) |
Income Below Poverty Among Married-Couple vs Single-Parent Households in Madras
The poverty data for Madras shows that 120 of the married-couple family households (12.2%) and 249 of the single-parent households (33.9%) are living below the poverty level. Within the married-couple family households, those with 1 or 2 children have the highest poverty rate, with 64 households (30.0%) falling below the poverty line. Among the single-parent households, those with 1 or 2 children have the highest poverty rate, with 224 household (45.3%) living below poverty.
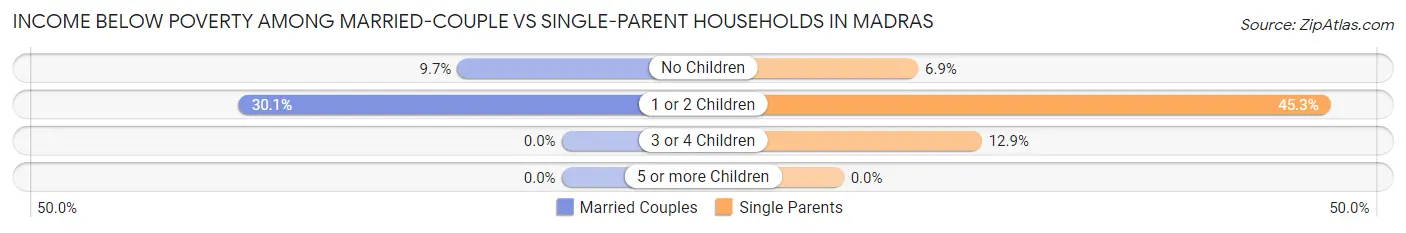
| Children | Married-Couple Families | Single-Parent Households |
| No Children | 56 (9.7%) | 7 (6.9%) |
| 1 or 2 Children | 64 (30.0%) | 224 (45.3%) |
| 3 or 4 Children | 0 (0.0%) | 18 (12.9%) |
| 5 or more Children | 0 (0.0%) | 0 (0.0%) |
| Total | 120 (12.2%) | 249 (33.9%) |
Race in Madras
The most populous races in Madras are White / Caucasian (3,758 | 50.1%), Hispanic or Latino (2,834 | 37.8%), and Two or more Races (1,527 | 20.4%).
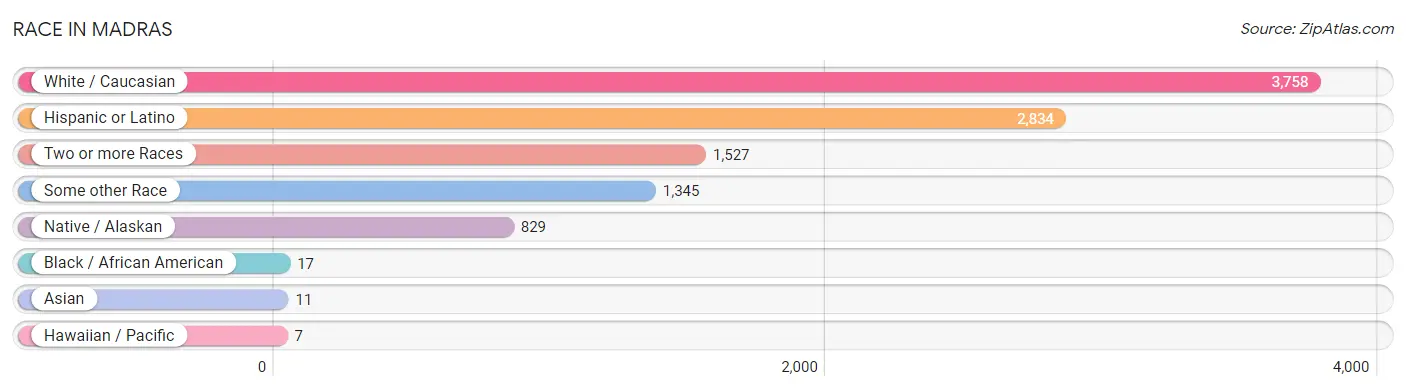
| Race | # Population | % Population |
| Asian | 11 | 0.2% |
| Black / African American | 17 | 0.2% |
| Hawaiian / Pacific | 7 | 0.1% |
| Hispanic or Latino | 2,834 | 37.8% |
| Native / Alaskan | 829 | 11.1% |
| White / Caucasian | 3,758 | 50.1% |
| Two or more Races | 1,527 | 20.4% |
| Some other Race | 1,345 | 17.9% |
| Total | 7,494 | 100.0% |
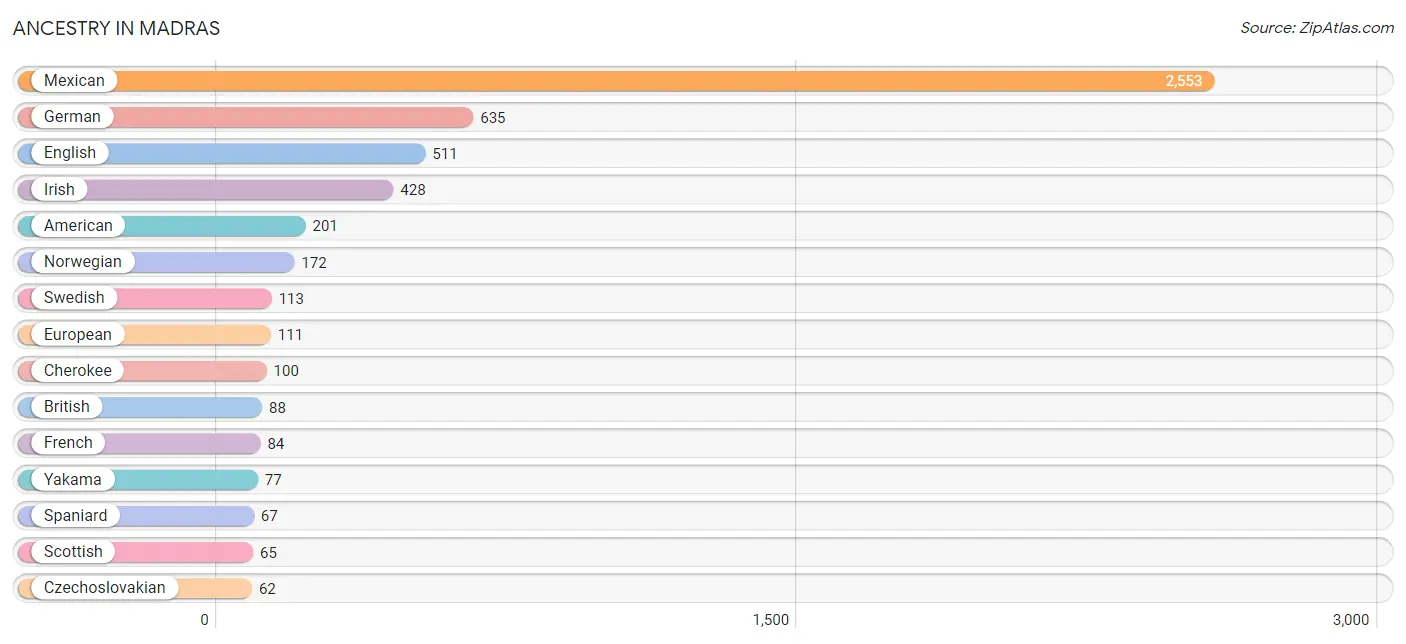
Ancestry in Madras
The most populous ancestries reported in Madras are Mexican (2,553 | 34.1%), German (635 | 8.5%), English (511 | 6.8%), Irish (428 | 5.7%), and American (201 | 2.7%), together accounting for 57.8% of all Madras residents.
| Ancestry | # Population | % Population |
| American | 201 | 2.7% |
| Apache | 9 | 0.1% |
| Belgian | 15 | 0.2% |
| Bhutanese | 5 | 0.1% |
| Blackfeet | 11 | 0.2% |
| British | 88 | 1.2% |
| Canadian | 10 | 0.1% |
| Central American | 39 | 0.5% |
| Cherokee | 100 | 1.3% |
| Costa Rican | 13 | 0.2% |
| Czech | 19 | 0.3% |
| Czechoslovakian | 62 | 0.8% |
| Danish | 54 | 0.7% |
| Dutch | 42 | 0.6% |
| English | 511 | 6.8% |
| European | 111 | 1.5% |
| Finnish | 14 | 0.2% |
| French | 84 | 1.1% |
| French Canadian | 58 | 0.8% |
| German | 635 | 8.5% |
| Hopi | 39 | 0.5% |
| Hungarian | 14 | 0.2% |
| Indian (Asian) | 48 | 0.6% |
| Irish | 428 | 5.7% |
| Iroquois | 9 | 0.1% |
| Italian | 62 | 0.8% |
| Korean | 53 | 0.7% |
| Mexican | 2,553 | 34.1% |
| Mexican American Indian | 34 | 0.4% |
| Native Hawaiian | 40 | 0.5% |
| Navajo | 52 | 0.7% |
| Norwegian | 172 | 2.3% |
| Paiute | 14 | 0.2% |
| Peruvian | 27 | 0.4% |
| Polish | 10 | 0.1% |
| Portuguese | 23 | 0.3% |
| Puerto Rican | 25 | 0.3% |
| Salvadoran | 26 | 0.4% |
| Samoan | 43 | 0.6% |
| Scandinavian | 21 | 0.3% |
| Scotch-Irish | 5 | 0.1% |
| Scottish | 65 | 0.9% |
| Sioux | 12 | 0.2% |
| South American | 27 | 0.4% |
| Spaniard | 67 | 0.9% |
| Sri Lankan | 8 | 0.1% |
| Swedish | 113 | 1.5% |
| Swiss | 14 | 0.2% |
| Turkish | 6 | 0.1% |
| Welsh | 16 | 0.2% |
| Yakama | 77 | 1.0% | View All 51 Rows |
Immigrants in Madras
The most numerous immigrant groups reported in Madras came from Latin America (799 | 10.7%), Central America (782 | 10.4%), Mexico (762 | 10.2%), Europe (111 | 1.5%), and Northern Europe (75 | 1.0%), together accounting for 33.8% of all Madras residents.
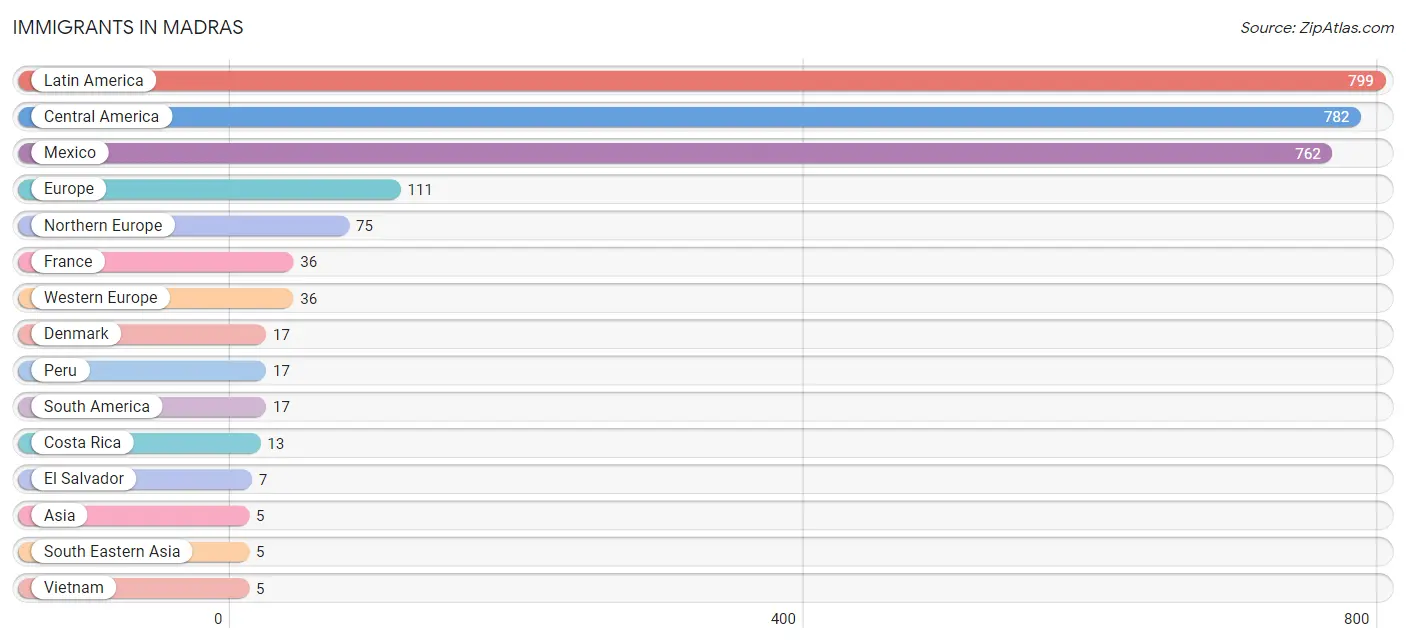
| Immigration Origin | # Population | % Population |
| Asia | 5 | 0.1% |
| Central America | 782 | 10.4% |
| Costa Rica | 13 | 0.2% |
| Denmark | 17 | 0.2% |
| El Salvador | 7 | 0.1% |
| Europe | 111 | 1.5% |
| France | 36 | 0.5% |
| Latin America | 799 | 10.7% |
| Mexico | 762 | 10.2% |
| Northern Europe | 75 | 1.0% |
| Peru | 17 | 0.2% |
| South America | 17 | 0.2% |
| South Eastern Asia | 5 | 0.1% |
| Vietnam | 5 | 0.1% |
| Western Europe | 36 | 0.5% | View All 15 Rows |
Sex and Age in Madras
Sex and Age in Madras
The most populous age groups in Madras are Under 5 Years (408 | 11.5%) for men and Under 5 Years (463 | 11.7%) for women.
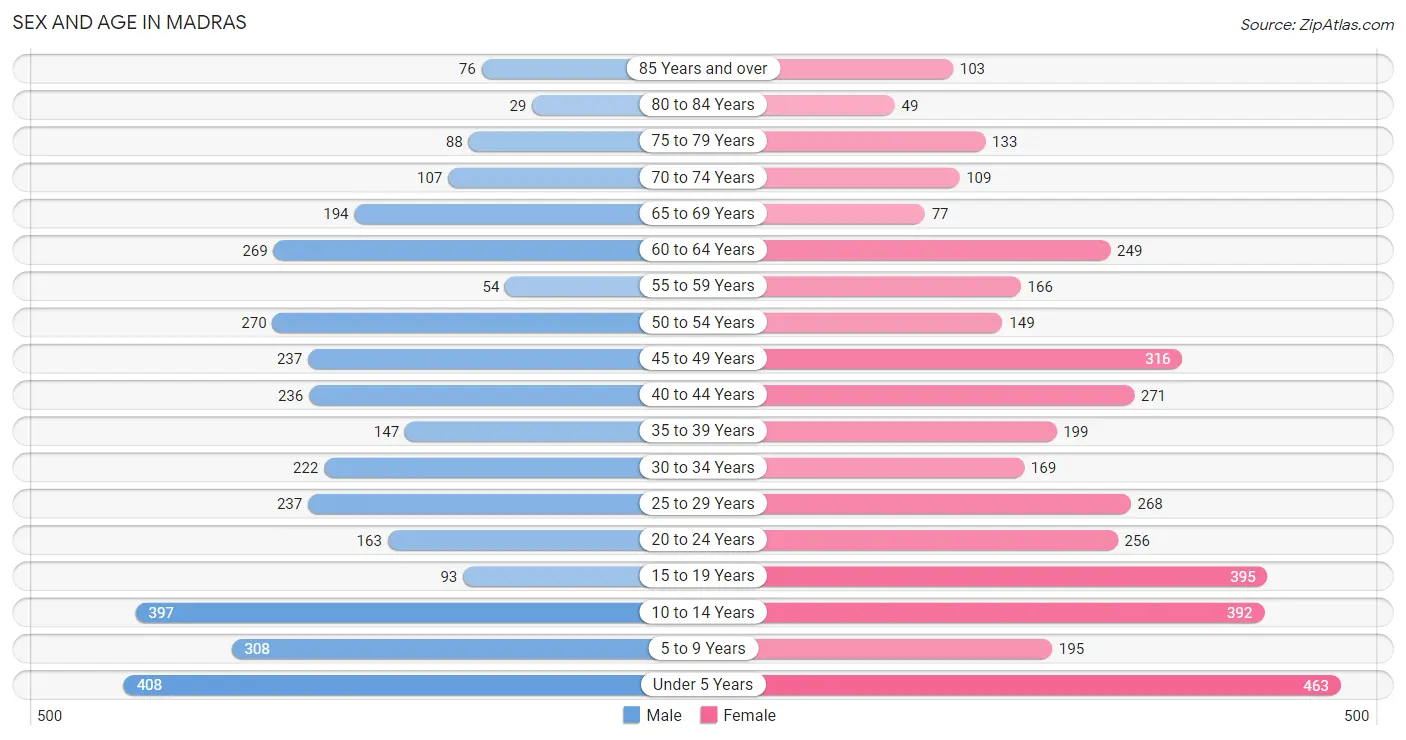
| Age Bracket | Male | Female |
| Under 5 Years | 408 (11.5%) | 463 (11.7%) |
| 5 to 9 Years | 308 (8.7%) | 195 (4.9%) |
| 10 to 14 Years | 397 (11.2%) | 392 (9.9%) |
| 15 to 19 Years | 93 (2.6%) | 395 (10.0%) |
| 20 to 24 Years | 163 (4.6%) | 256 (6.5%) |
| 25 to 29 Years | 237 (6.7%) | 268 (6.8%) |
| 30 to 34 Years | 222 (6.3%) | 169 (4.3%) |
| 35 to 39 Years | 147 (4.2%) | 199 (5.0%) |
| 40 to 44 Years | 236 (6.7%) | 271 (6.9%) |
| 45 to 49 Years | 237 (6.7%) | 316 (8.0%) |
| 50 to 54 Years | 270 (7.6%) | 149 (3.8%) |
| 55 to 59 Years | 54 (1.5%) | 166 (4.2%) |
| 60 to 64 Years | 269 (7.6%) | 249 (6.3%) |
| 65 to 69 Years | 194 (5.5%) | 77 (1.9%) |
| 70 to 74 Years | 107 (3.0%) | 109 (2.8%) |
| 75 to 79 Years | 88 (2.5%) | 133 (3.4%) |
| 80 to 84 Years | 29 (0.8%) | 49 (1.2%) |
| 85 Years and over | 76 (2.1%) | 103 (2.6%) |
| Total | 3,535 (100.0%) | 3,959 (100.0%) |
Families and Households in Madras
Median Family Size in Madras
The median family size in Madras is 3.52 persons per family, with married-couple families (987 | 57.3%) accounting for the largest median family size of 4.21 persons per family. On the other hand, single male/father families (365 | 21.2%) represent the smallest median family size with 2.55 persons per family.
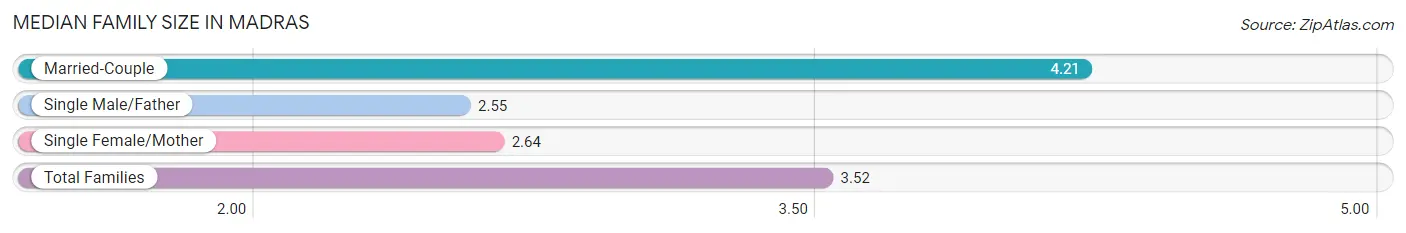
| Family Type | # Families | Family Size |
| Married-Couple | 987 (57.3%) | 4.21 |
| Single Male/Father | 365 (21.2%) | 2.55 |
| Single Female/Mother | 370 (21.5%) | 2.64 |
| Total Families | 1,722 (100.0%) | 3.52 |
Median Household Size in Madras
The median household size in Madras is 2.95 persons per household, with married-couple households (987 | 40.0%) accounting for the largest median household size of 4.24 persons per household. non-family households (748 | 30.3%) represent the smallest median household size with 1.36 persons per household.
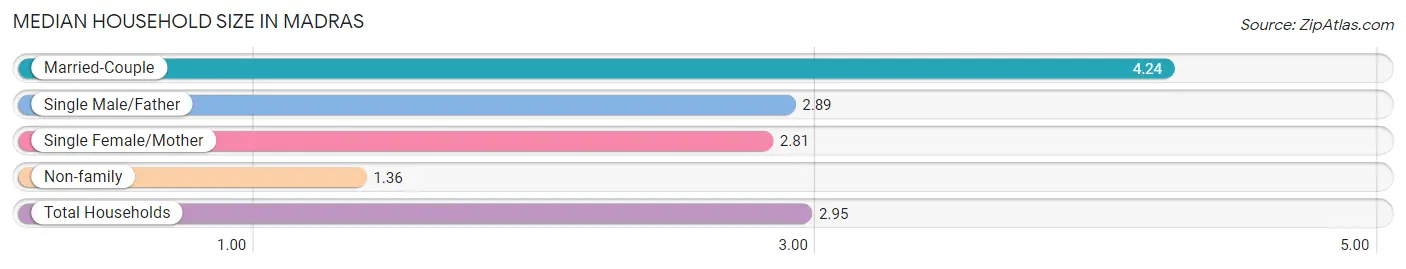
| Household Type | # Households | Household Size |
| Married-Couple | 987 (40.0%) | 4.24 |
| Single Male/Father | 365 (14.8%) | 2.89 |
| Single Female/Mother | 370 (15.0%) | 2.81 |
| Non-family | 748 (30.3%) | 1.36 |
| Total Households | 2,470 (100.0%) | 2.95 |
Household Size by Marriage Status in Madras
Out of a total of 2,470 households in Madras, 1,722 (69.7%) are family households, while 748 (30.3%) are nonfamily households. The most numerous type of family households are 2-person households, comprising 545, and the most common type of nonfamily households are 1-person households, comprising 584.
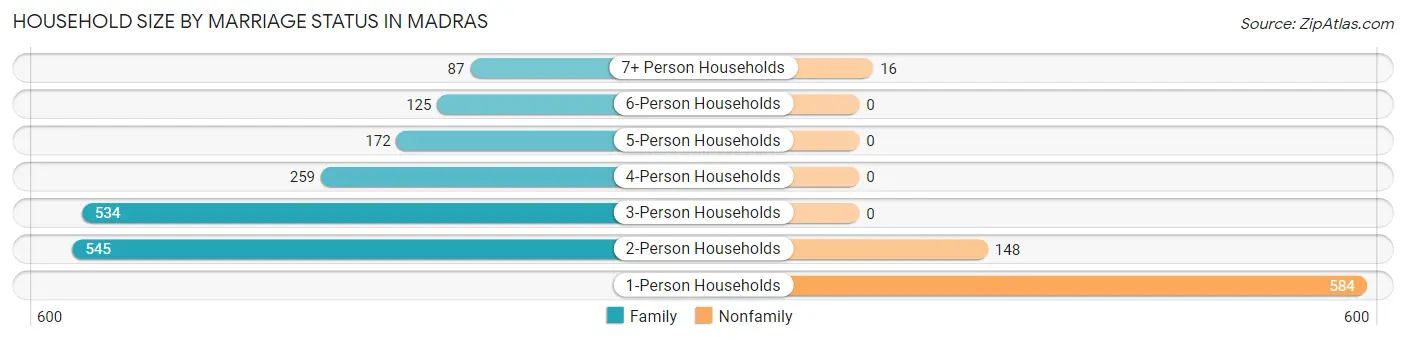
| Household Size | Family Households | Nonfamily Households |
| 1-Person Households | - | 584 (23.6%) |
| 2-Person Households | 545 (22.1%) | 148 (6.0%) |
| 3-Person Households | 534 (21.6%) | 0 (0.0%) |
| 4-Person Households | 259 (10.5%) | 0 (0.0%) |
| 5-Person Households | 172 (7.0%) | 0 (0.0%) |
| 6-Person Households | 125 (5.1%) | 0 (0.0%) |
| 7+ Person Households | 87 (3.5%) | 16 (0.6%) |
| Total | 1,722 (69.7%) | 748 (30.3%) |
Female Fertility in Madras
Fertility by Age in Madras
Average fertility rate in Madras is 49.0 births per 1,000 women. Women in the age bracket of 35 to 50 years have the highest fertility rate with 82.0 births per 1,000 women. Women in the age bracket of 35 to 50 years acount for 72.3% of all women with births.
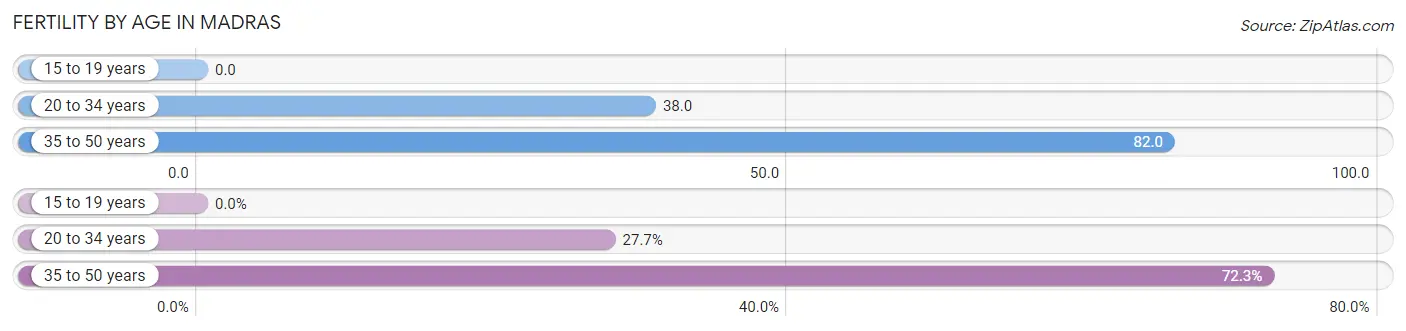
| Age Bracket | Women with Births | Births / 1,000 Women |
| 15 to 19 years | 0 (0.0%) | 0.0 |
| 20 to 34 years | 26 (27.7%) | 38.0 |
| 35 to 50 years | 68 (72.3%) | 82.0 |
| Total | 94 (100.0%) | 49.0 |
Fertility by Age by Marriage Status in Madras
84.0% of women with births (94) in Madras are married. The highest percentage of unmarried women with births falls into 20 to 34 years age bracket with 57.7% of them unmarried at the time of birth, while the lowest percentage of unmarried women with births belong to 35 to 50 years age bracket with 0.0% of them unmarried.
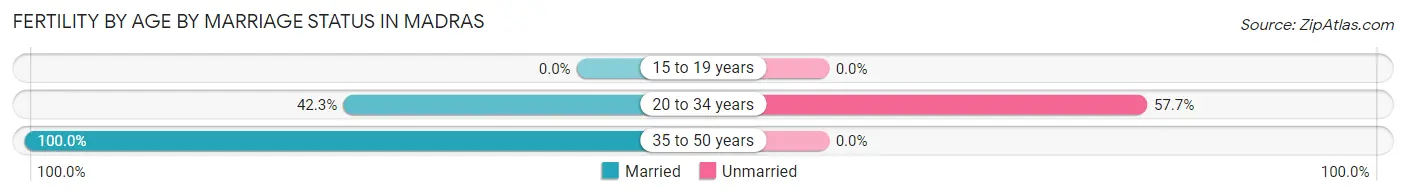
| Age Bracket | Married | Unmarried |
| 15 to 19 years | 0 (0.0%) | 0 (0.0%) |
| 20 to 34 years | 11 (42.3%) | 15 (57.7%) |
| 35 to 50 years | 68 (100.0%) | 0 (0.0%) |
| Total | 79 (84.0%) | 15 (16.0%) |
Fertility by Education in Madras
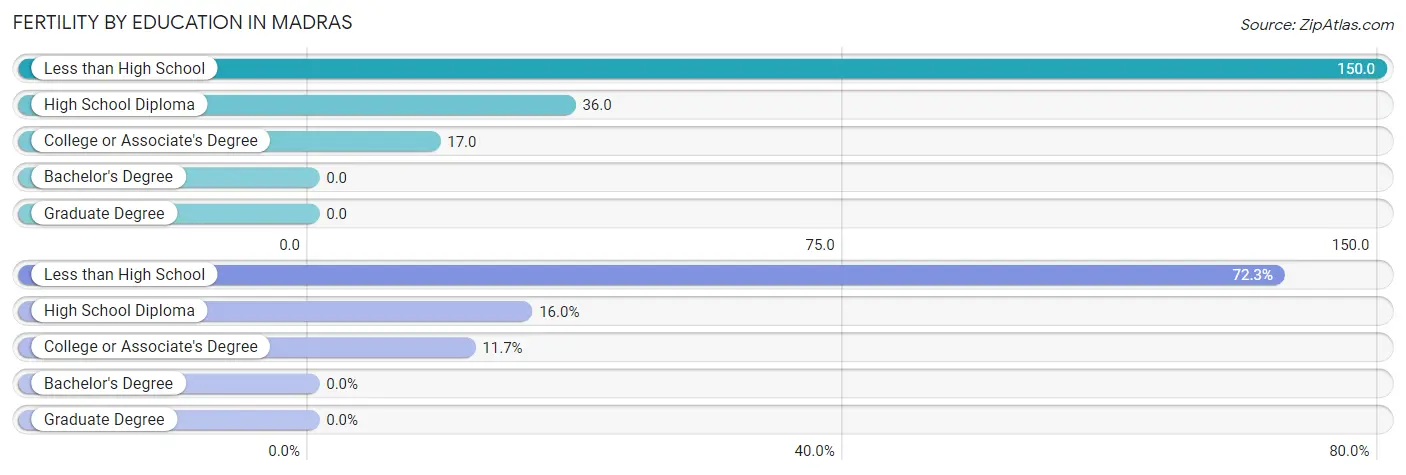
| Educational Attainment | Women with Births | Births / 1,000 Women |
| Less than High School | 68 (72.3%) | 150.0 |
| High School Diploma | 15 (16.0%) | 36.0 |
| College or Associate's Degree | 11 (11.7%) | 17.0 |
| Bachelor's Degree | 0 (0.0%) | 0.0 |
| Graduate Degree | 0 (0.0%) | 0.0 |
| Total | 94 (100.0%) | 49.0 |
Fertility by Education by Marriage Status in Madras
16.0% of women with births in Madras are unmarried. Women with the educational attainment of less than high school are most likely to be married with 100.0% of them married at childbirth, while women with the educational attainment of high school diploma are least likely to be married with 100.0% of them unmarried at childbirth.
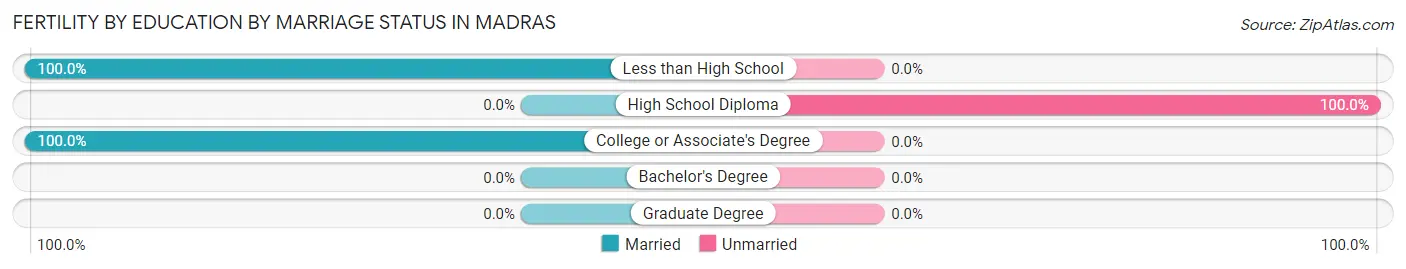
| Educational Attainment | Married | Unmarried |
| Less than High School | 68 (100.0%) | 0 (0.0%) |
| High School Diploma | 0 (0.0%) | 15 (100.0%) |
| College or Associate's Degree | 11 (100.0%) | 0 (0.0%) |
| Bachelor's Degree | 0 (0.0%) | 0 (0.0%) |
| Graduate Degree | 0 (0.0%) | 0 (0.0%) |
| Total | 79 (84.0%) | 15 (16.0%) |
Employment Characteristics in Madras
Employment by Class of Employer in Madras
Among the 2,915 employed individuals in Madras, private company employees (1,935 | 66.4%), local government employees (358 | 12.3%), and not-for-profit organizations (238 | 8.2%) make up the most common classes of employment.
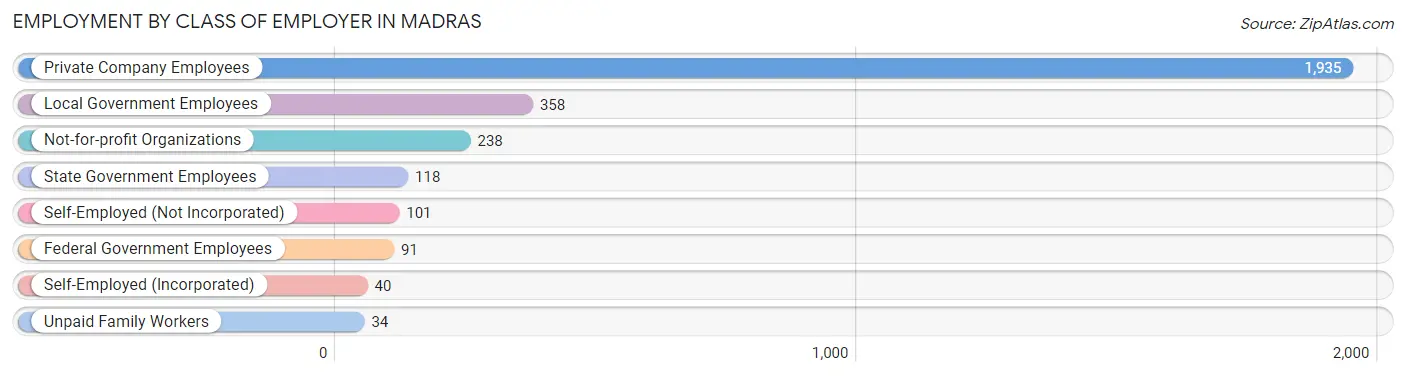
| Employer Class | # Employees | % Employees |
| Private Company Employees | 1,935 | 66.4% |
| Self-Employed (Incorporated) | 40 | 1.4% |
| Self-Employed (Not Incorporated) | 101 | 3.5% |
| Not-for-profit Organizations | 238 | 8.2% |
| Local Government Employees | 358 | 12.3% |
| State Government Employees | 118 | 4.1% |
| Federal Government Employees | 91 | 3.1% |
| Unpaid Family Workers | 34 | 1.2% |
| Total | 2,915 | 100.0% |
Employment Status by Age in Madras
According to the labor force statistics for Madras, out of the total population over 16 years of age (5,261), 63.9% or 3,362 individuals are in the labor force, with 10.0% or 336 of them unemployed. The age group with the highest labor force participation rate is 25 to 29 years, with 94.7% or 478 individuals in the labor force. Within the labor force, the 30 to 34 years age range has the highest percentage of unemployed individuals, with 29.8% or 109 of them being unemployed.
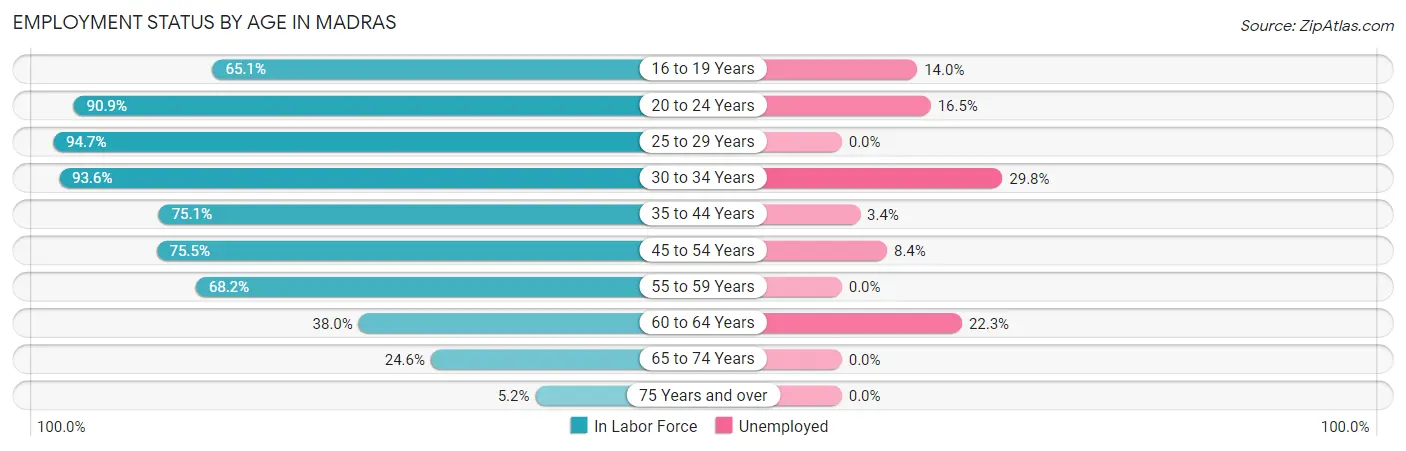
| Age Bracket | In Labor Force | Unemployed |
| 16 to 19 Years | 272 (65.1%) | 38 (14.0%) |
| 20 to 24 Years | 381 (90.9%) | 63 (16.5%) |
| 25 to 29 Years | 478 (94.7%) | 0 (0.0%) |
| 30 to 34 Years | 366 (93.6%) | 109 (29.8%) |
| 35 to 44 Years | 641 (75.1%) | 22 (3.4%) |
| 45 to 54 Years | 734 (75.5%) | 62 (8.4%) |
| 55 to 59 Years | 150 (68.2%) | 0 (0.0%) |
| 60 to 64 Years | 197 (38.0%) | 44 (22.3%) |
| 65 to 74 Years | 120 (24.6%) | 0 (0.0%) |
| 75 Years and over | 25 (5.2%) | 0 (0.0%) |
| Total | 3,362 (63.9%) | 336 (10.0%) |
Employment Status by Educational Attainment in Madras
According to labor force statistics for Madras, 74.2% of individuals (2,567) out of the total population between 25 and 64 years of age (3,459) are in the labor force, with 9.2% or 236 of them being unemployed. The group with the highest labor force participation rate are those with the educational attainment of college / associate degree, with 85.0% or 1,028 individuals in the labor force. Within the labor force, individuals with less than high school education have the highest percentage of unemployment, with 29.7% or 102 of them being unemployed.
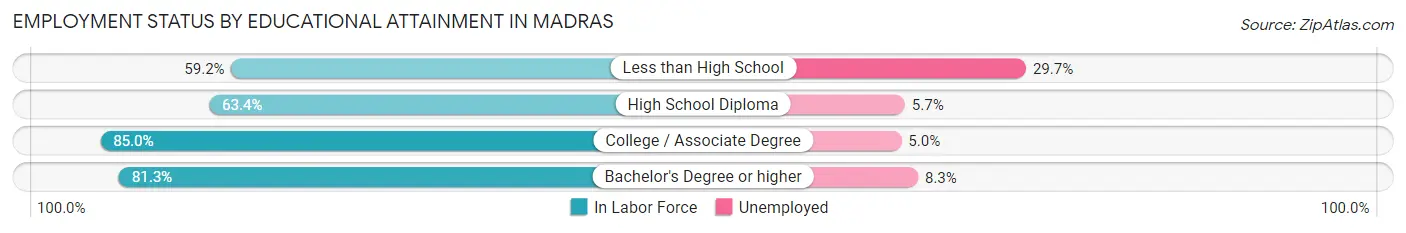
| Educational Attainment | In Labor Force | Unemployed |
| Less than High School | 343 (59.2%) | 172 (29.7%) |
| High School Diploma | 580 (63.4%) | 52 (5.7%) |
| College / Associate Degree | 1,028 (85.0%) | 60 (5.0%) |
| Bachelor's Degree or higher | 614 (81.3%) | 63 (8.3%) |
| Total | 2,567 (74.2%) | 318 (9.2%) |
Employment Occupations by Sex in Madras
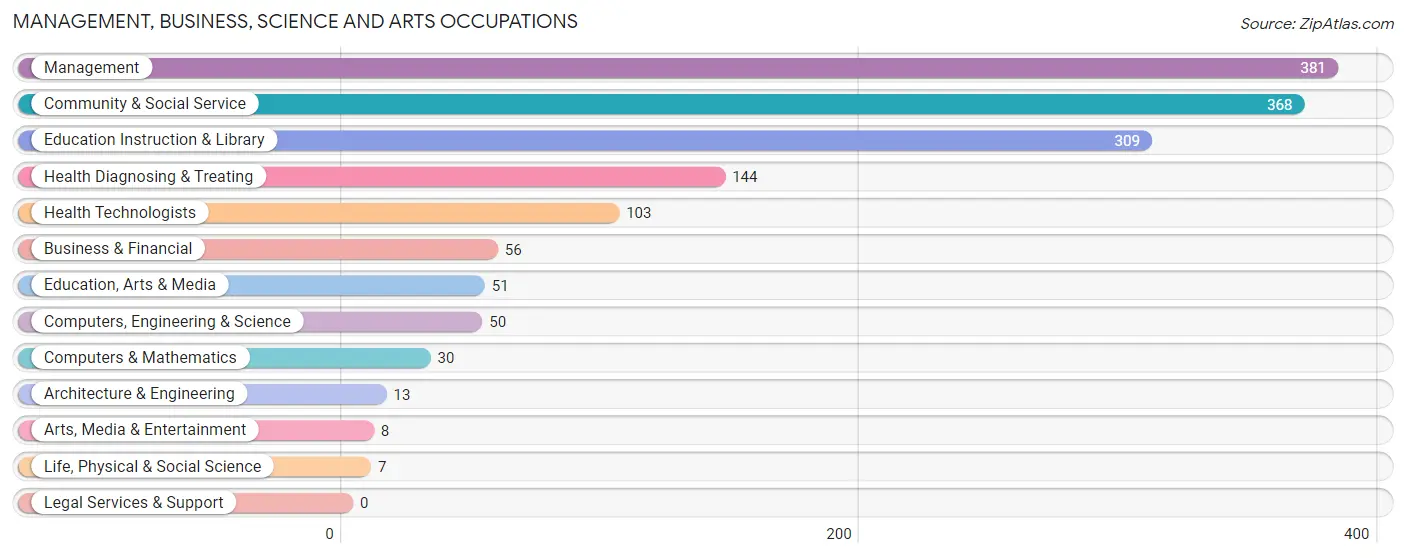
Management, Business, Science and Arts Occupations
The most common Management, Business, Science and Arts occupations in Madras are Management (381 | 12.6%), Community & Social Service (368 | 12.2%), Education Instruction & Library (309 | 10.2%), Health Diagnosing & Treating (144 | 4.8%), and Health Technologists (103 | 3.4%).
Management, Business, Science and Arts Occupations by Sex
Within the Management, Business, Science and Arts occupations in Madras, the most male-oriented occupations are Computers & Mathematics (100.0%), Architecture & Engineering (100.0%), and Computers, Engineering & Science (86.0%), while the most female-oriented occupations are Life, Physical & Social Science (100.0%), Education, Arts & Media (100.0%), and Health Technologists (100.0%).
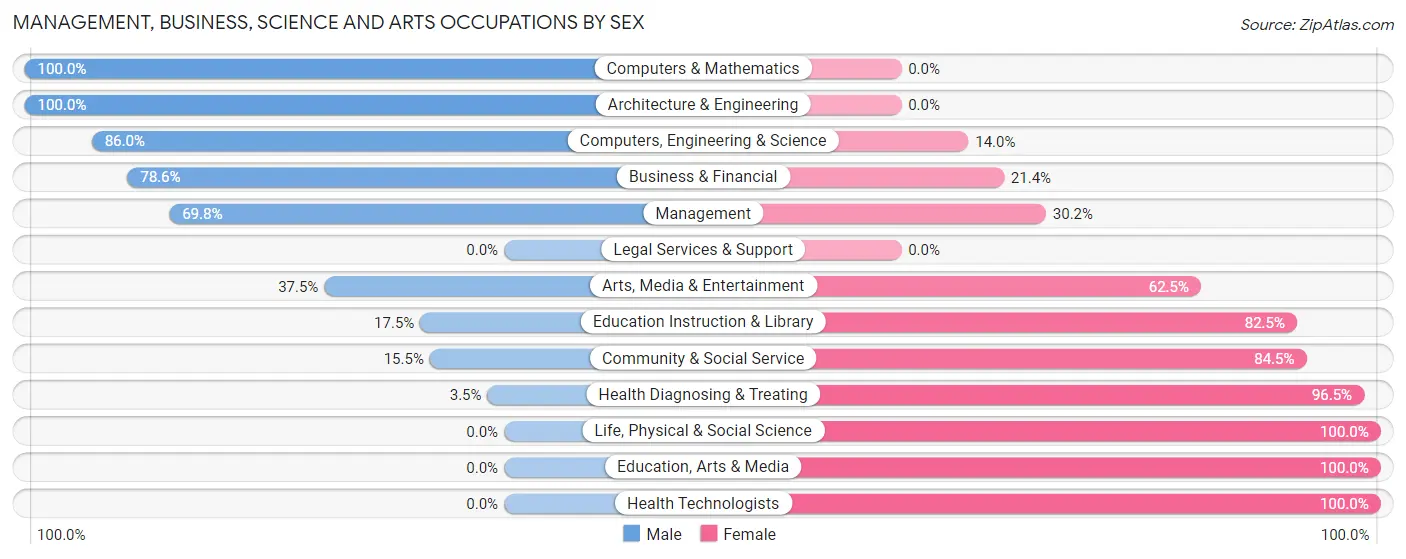
| Occupation | Male | Female |
| Management | 266 (69.8%) | 115 (30.2%) |
| Business & Financial | 44 (78.6%) | 12 (21.4%) |
| Computers, Engineering & Science | 43 (86.0%) | 7 (14.0%) |
| Computers & Mathematics | 30 (100.0%) | 0 (0.0%) |
| Architecture & Engineering | 13 (100.0%) | 0 (0.0%) |
| Life, Physical & Social Science | 0 (0.0%) | 7 (100.0%) |
| Community & Social Service | 57 (15.5%) | 311 (84.5%) |
| Education, Arts & Media | 0 (0.0%) | 51 (100.0%) |
| Legal Services & Support | 0 (0.0%) | 0 (0.0%) |
| Education Instruction & Library | 54 (17.5%) | 255 (82.5%) |
| Arts, Media & Entertainment | 3 (37.5%) | 5 (62.5%) |
| Health Diagnosing & Treating | 5 (3.5%) | 139 (96.5%) |
| Health Technologists | 0 (0.0%) | 103 (100.0%) |
| Total (Category) | 415 (41.5%) | 584 (58.5%) |
| Total (Overall) | 1,341 (44.3%) | 1,685 (55.7%) |
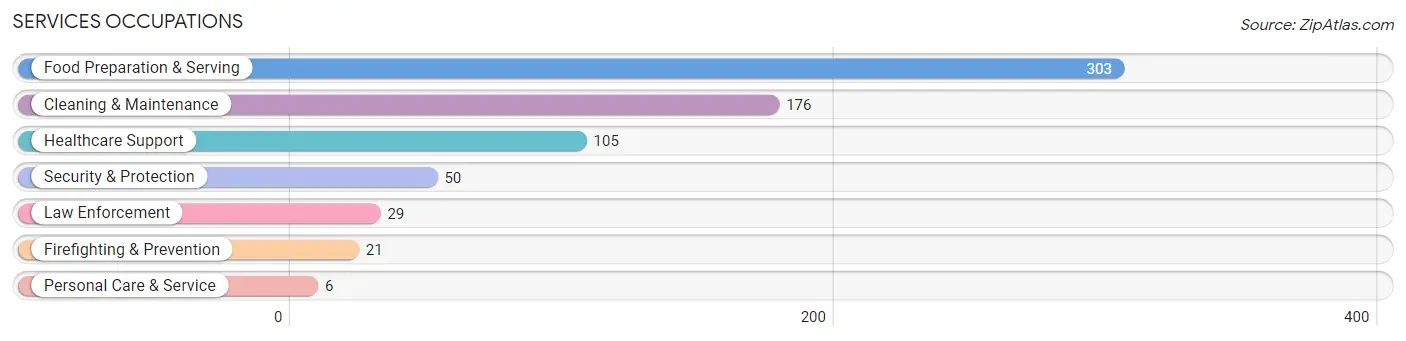
Services Occupations
The most common Services occupations in Madras are Food Preparation & Serving (303 | 10.0%), Cleaning & Maintenance (176 | 5.8%), Healthcare Support (105 | 3.5%), Security & Protection (50 | 1.7%), and Law Enforcement (29 | 1.0%).
Services Occupations by Sex
Within the Services occupations in Madras, the most male-oriented occupations are Firefighting & Prevention (100.0%), Security & Protection (90.0%), and Law Enforcement (82.8%), while the most female-oriented occupations are Healthcare Support (100.0%), Personal Care & Service (100.0%), and Food Preparation & Serving (74.6%).
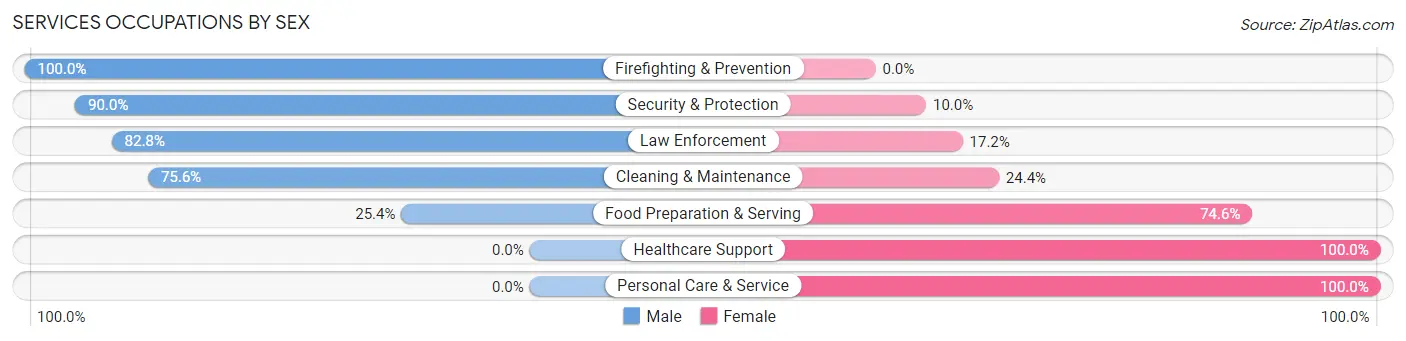
| Occupation | Male | Female |
| Healthcare Support | 0 (0.0%) | 105 (100.0%) |
| Security & Protection | 45 (90.0%) | 5 (10.0%) |
| Firefighting & Prevention | 21 (100.0%) | 0 (0.0%) |
| Law Enforcement | 24 (82.8%) | 5 (17.2%) |
| Food Preparation & Serving | 77 (25.4%) | 226 (74.6%) |
| Cleaning & Maintenance | 133 (75.6%) | 43 (24.4%) |
| Personal Care & Service | 0 (0.0%) | 6 (100.0%) |
| Total (Category) | 255 (39.8%) | 385 (60.2%) |
| Total (Overall) | 1,341 (44.3%) | 1,685 (55.7%) |
Sales and Office Occupations
The most common Sales and Office occupations in Madras are Office & Administration (479 | 15.8%), and Sales & Related (342 | 11.3%).
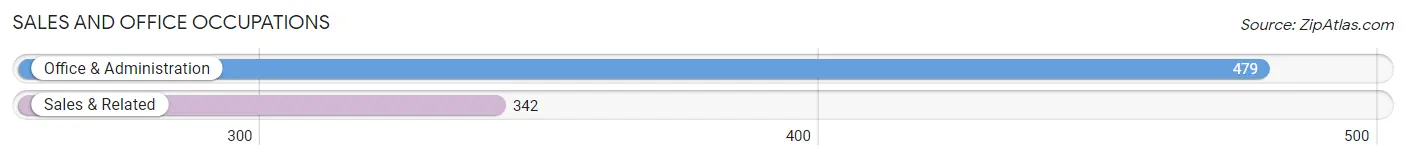
Sales and Office Occupations by Sex
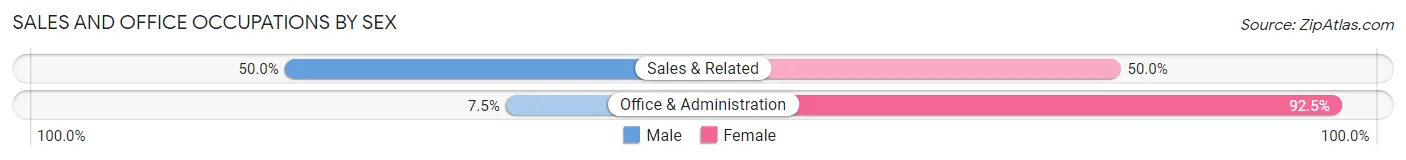
| Occupation | Male | Female |
| Sales & Related | 171 (50.0%) | 171 (50.0%) |
| Office & Administration | 36 (7.5%) | 443 (92.5%) |
| Total (Category) | 207 (25.2%) | 614 (74.8%) |
| Total (Overall) | 1,341 (44.3%) | 1,685 (55.7%) |
Natural Resources, Construction and Maintenance Occupations
The most common Natural Resources, Construction and Maintenance occupations in Madras are Installation, Maintenance & Repair (117 | 3.9%), Farming, Fishing & Forestry (87 | 2.9%), and Construction & Extraction (42 | 1.4%).
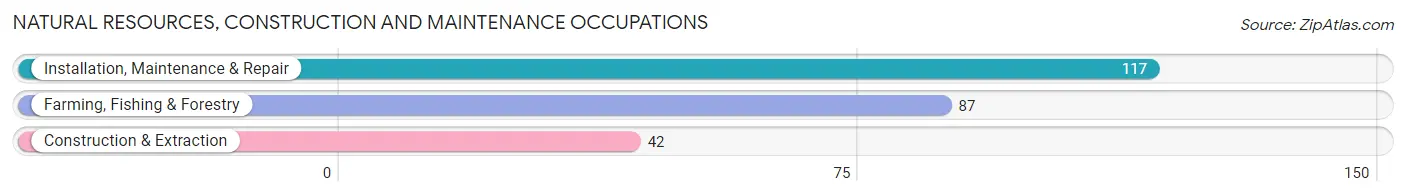
Natural Resources, Construction and Maintenance Occupations by Sex
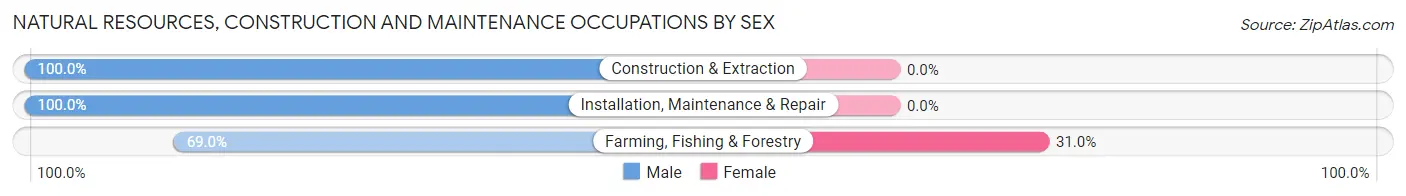
| Occupation | Male | Female |
| Farming, Fishing & Forestry | 60 (69.0%) | 27 (31.0%) |
| Construction & Extraction | 42 (100.0%) | 0 (0.0%) |
| Installation, Maintenance & Repair | 117 (100.0%) | 0 (0.0%) |
| Total (Category) | 219 (89.0%) | 27 (11.0%) |
| Total (Overall) | 1,341 (44.3%) | 1,685 (55.7%) |
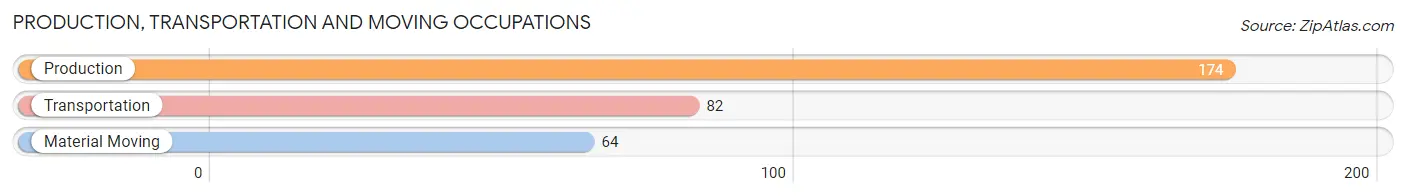
Production, Transportation and Moving Occupations
The most common Production, Transportation and Moving occupations in Madras are Production (174 | 5.8%), Transportation (82 | 2.7%), and Material Moving (64 | 2.1%).
Production, Transportation and Moving Occupations by Sex
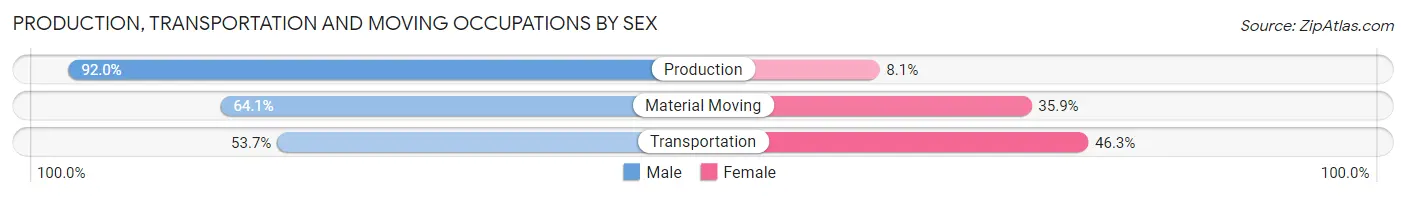
| Occupation | Male | Female |
| Production | 160 (91.9%) | 14 (8.1%) |
| Transportation | 44 (53.7%) | 38 (46.3%) |
| Material Moving | 41 (64.1%) | 23 (35.9%) |
| Total (Category) | 245 (76.6%) | 75 (23.4%) |
| Total (Overall) | 1,341 (44.3%) | 1,685 (55.7%) |
Employment Industries by Sex in Madras
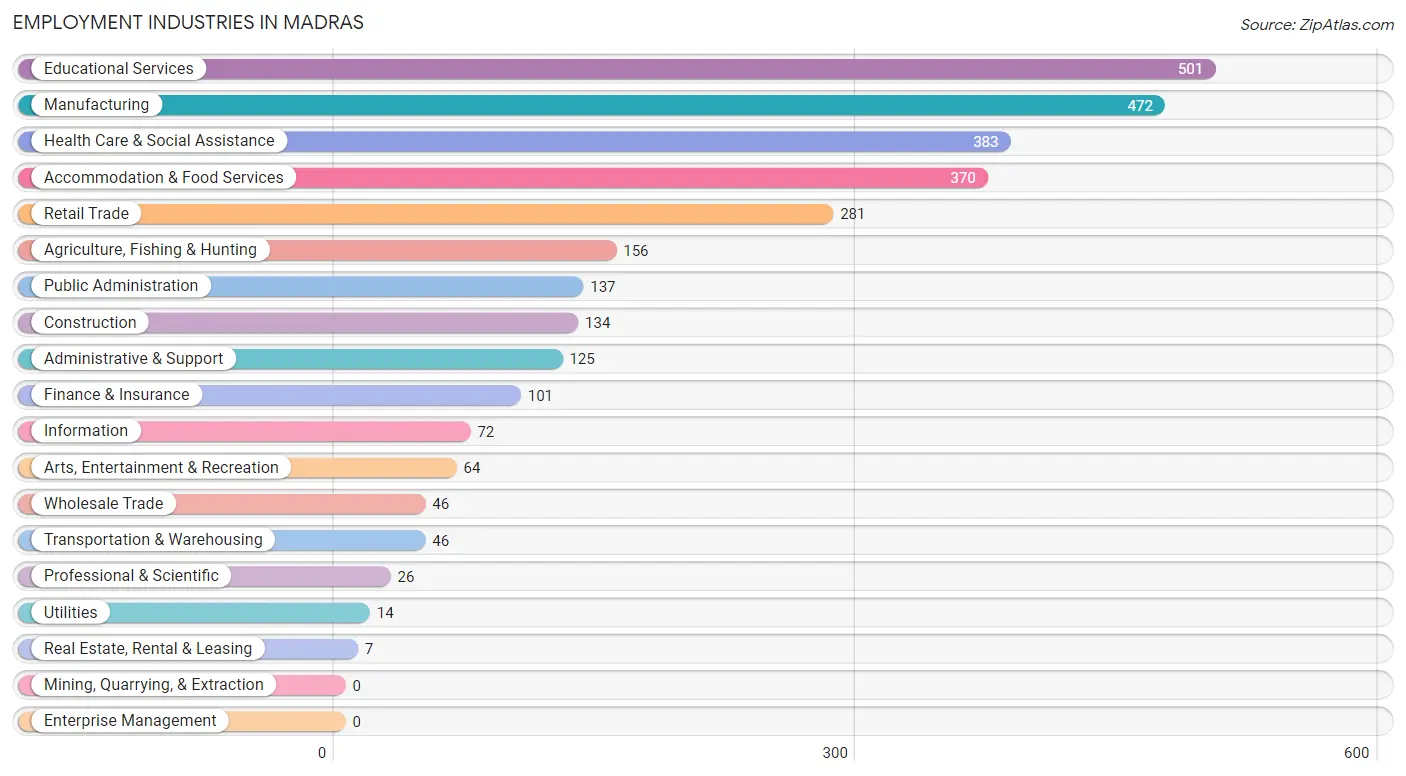
Employment Industries in Madras
The major employment industries in Madras include Educational Services (501 | 16.6%), Manufacturing (472 | 15.6%), Health Care & Social Assistance (383 | 12.7%), Accommodation & Food Services (370 | 12.2%), and Retail Trade (281 | 9.3%).
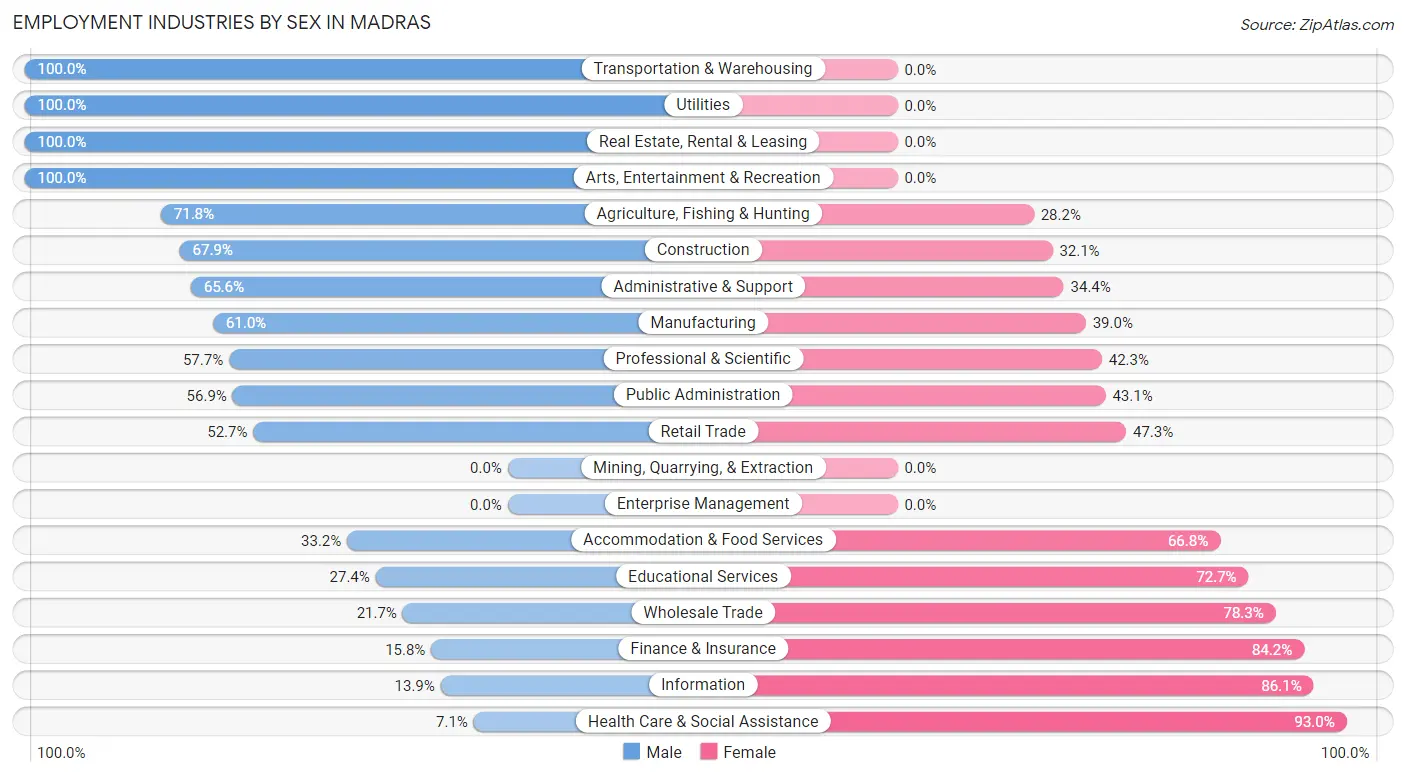
Employment Industries by Sex in Madras
The Madras industries that see more men than women are Transportation & Warehousing (100.0%), Utilities (100.0%), and Real Estate, Rental & Leasing (100.0%), whereas the industries that tend to have a higher number of women are Health Care & Social Assistance (92.9%), Information (86.1%), and Finance & Insurance (84.2%).
| Industry | Male | Female |
| Agriculture, Fishing & Hunting | 112 (71.8%) | 44 (28.2%) |
| Mining, Quarrying, & Extraction | 0 (0.0%) | 0 (0.0%) |
| Construction | 91 (67.9%) | 43 (32.1%) |
| Manufacturing | 288 (61.0%) | 184 (39.0%) |
| Wholesale Trade | 10 (21.7%) | 36 (78.3%) |
| Retail Trade | 148 (52.7%) | 133 (47.3%) |
| Transportation & Warehousing | 46 (100.0%) | 0 (0.0%) |
| Utilities | 14 (100.0%) | 0 (0.0%) |
| Information | 10 (13.9%) | 62 (86.1%) |
| Finance & Insurance | 16 (15.8%) | 85 (84.2%) |
| Real Estate, Rental & Leasing | 7 (100.0%) | 0 (0.0%) |
| Professional & Scientific | 15 (57.7%) | 11 (42.3%) |
| Enterprise Management | 0 (0.0%) | 0 (0.0%) |
| Administrative & Support | 82 (65.6%) | 43 (34.4%) |
| Educational Services | 137 (27.4%) | 364 (72.7%) |
| Health Care & Social Assistance | 27 (7.0%) | 356 (92.9%) |
| Arts, Entertainment & Recreation | 64 (100.0%) | 0 (0.0%) |
| Accommodation & Food Services | 123 (33.2%) | 247 (66.8%) |
| Public Administration | 78 (56.9%) | 59 (43.1%) |
| Total | 1,341 (44.3%) | 1,685 (55.7%) |
Education in Madras
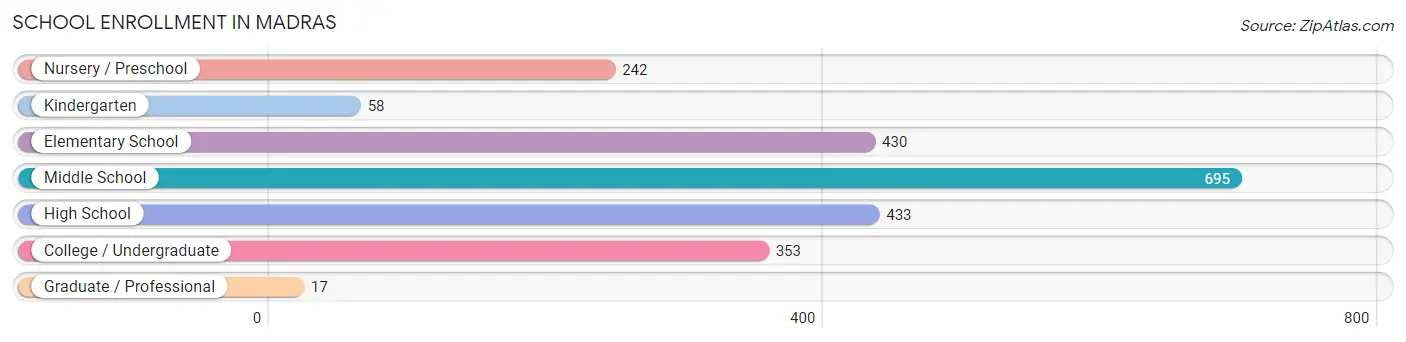
School Enrollment in Madras
The most common levels of schooling among the 2,228 students in Madras are middle school (695 | 31.2%), high school (433 | 19.4%), and elementary school (430 | 19.3%).
| School Level | # Students | % Students |
| Nursery / Preschool | 242 | 10.9% |
| Kindergarten | 58 | 2.6% |
| Elementary School | 430 | 19.3% |
| Middle School | 695 | 31.2% |
| High School | 433 | 19.4% |
| College / Undergraduate | 353 | 15.8% |
| Graduate / Professional | 17 | 0.8% |
| Total | 2,228 | 100.0% |
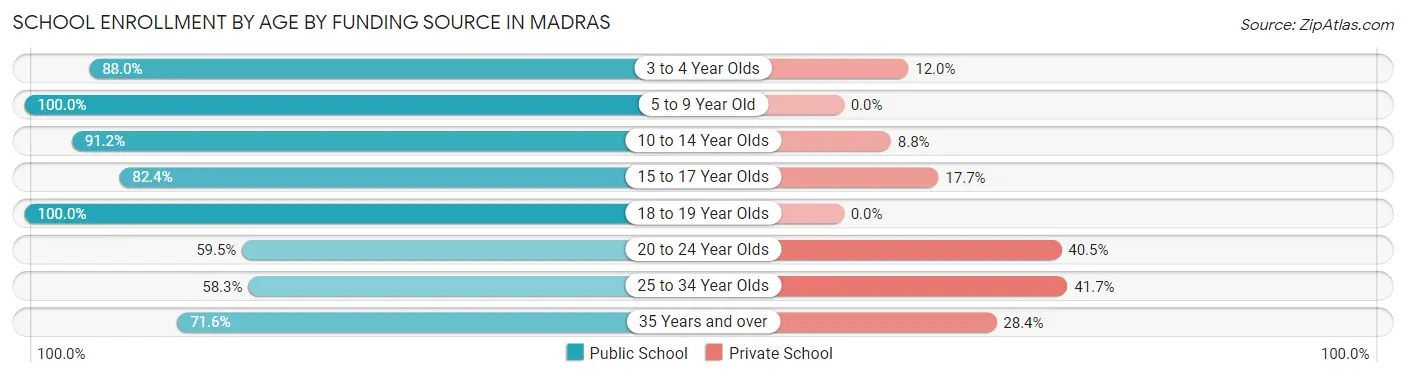
School Enrollment by Age by Funding Source in Madras
Out of a total of 2,228 students who are enrolled in schools in Madras, 267 (12.0%) attend a private institution, while the remaining 1,961 (88.0%) are enrolled in public schools. The age group of 25 to 34 year olds has the highest likelihood of being enrolled in private schools, with 10 (41.7% in the age bracket) enrolled. Conversely, the age group of 5 to 9 year old has the lowest likelihood of being enrolled in a private school, with 485 (100.0% in the age bracket) attending a public institution.
| Age Bracket | Public School | Private School |
| 3 to 4 Year Olds | 190 (88.0%) | 26 (12.0%) |
| 5 to 9 Year Old | 485 (100.0%) | 0 (0.0%) |
| 10 to 14 Year Olds | 695 (91.2%) | 67 (8.8%) |
| 15 to 17 Year Olds | 266 (82.4%) | 57 (17.6%) |
| 18 to 19 Year Olds | 119 (100.0%) | 0 (0.0%) |
| 20 to 24 Year Olds | 113 (59.5%) | 77 (40.5%) |
| 25 to 34 Year Olds | 14 (58.3%) | 10 (41.7%) |
| 35 Years and over | 78 (71.6%) | 31 (28.4%) |
| Total | 1,961 (88.0%) | 267 (12.0%) |
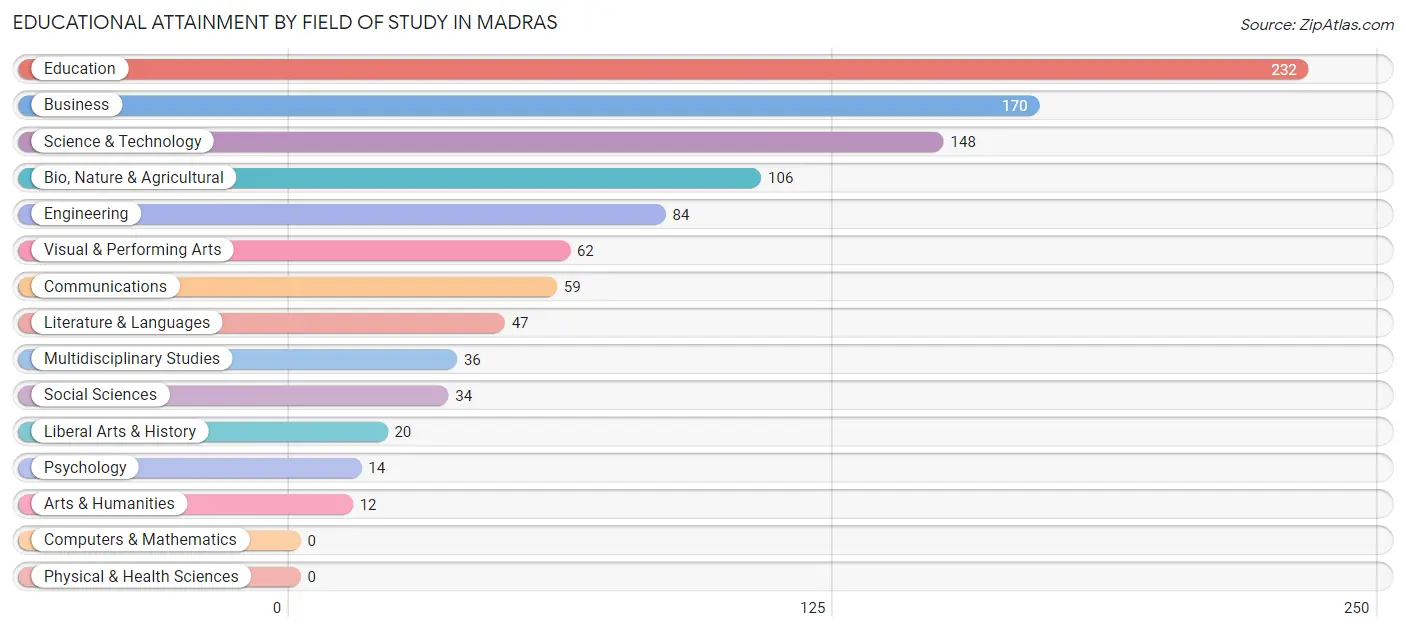
Educational Attainment by Field of Study in Madras
Education (232 | 22.7%), business (170 | 16.6%), science & technology (148 | 14.4%), bio, nature & agricultural (106 | 10.3%), and engineering (84 | 8.2%) are the most common fields of study among 1,024 individuals in Madras who have obtained a bachelor's degree or higher.
| Field of Study | # Graduates | % Graduates |
| Computers & Mathematics | 0 | 0.0% |
| Bio, Nature & Agricultural | 106 | 10.3% |
| Physical & Health Sciences | 0 | 0.0% |
| Psychology | 14 | 1.4% |
| Social Sciences | 34 | 3.3% |
| Engineering | 84 | 8.2% |
| Multidisciplinary Studies | 36 | 3.5% |
| Science & Technology | 148 | 14.4% |
| Business | 170 | 16.6% |
| Education | 232 | 22.7% |
| Literature & Languages | 47 | 4.6% |
| Liberal Arts & History | 20 | 1.9% |
| Visual & Performing Arts | 62 | 6.0% |
| Communications | 59 | 5.8% |
| Arts & Humanities | 12 | 1.2% |
| Total | 1,024 | 100.0% |
Transportation & Commute in Madras
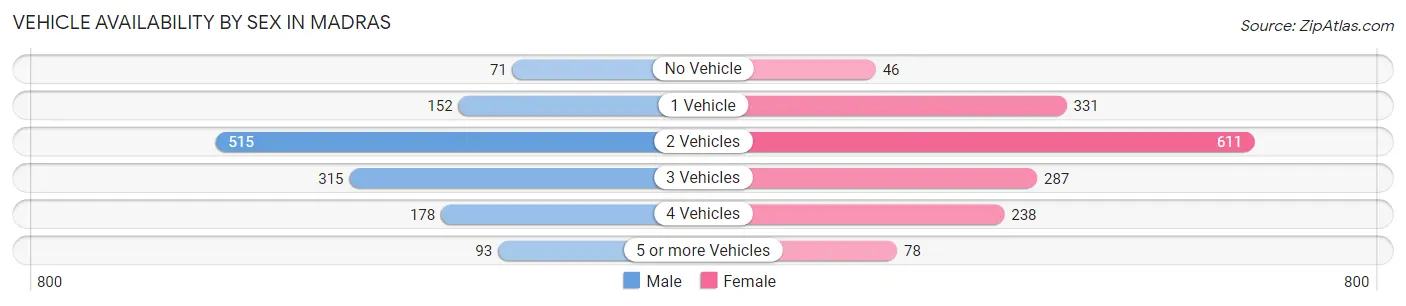
Vehicle Availability by Sex in Madras
The most prevalent vehicle ownership categories in Madras are males with 2 vehicles (515, accounting for 38.9%) and females with 2 vehicles (611, making up 32.4%).
| Vehicles Available | Male | Female |
| No Vehicle | 71 (5.4%) | 46 (2.9%) |
| 1 Vehicle | 152 (11.5%) | 331 (20.8%) |
| 2 Vehicles | 515 (38.9%) | 611 (38.4%) |
| 3 Vehicles | 315 (23.8%) | 287 (18.0%) |
| 4 Vehicles | 178 (13.4%) | 238 (15.0%) |
| 5 or more Vehicles | 93 (7.0%) | 78 (4.9%) |
| Total | 1,324 (100.0%) | 1,591 (100.0%) |
Commute Time in Madras
The most frequently occuring commute durations in Madras are 5 to 9 minutes (723 commuters, 26.6%), 30 to 34 minutes (392 commuters, 14.4%), and 10 to 14 minutes (353 commuters, 13.0%).
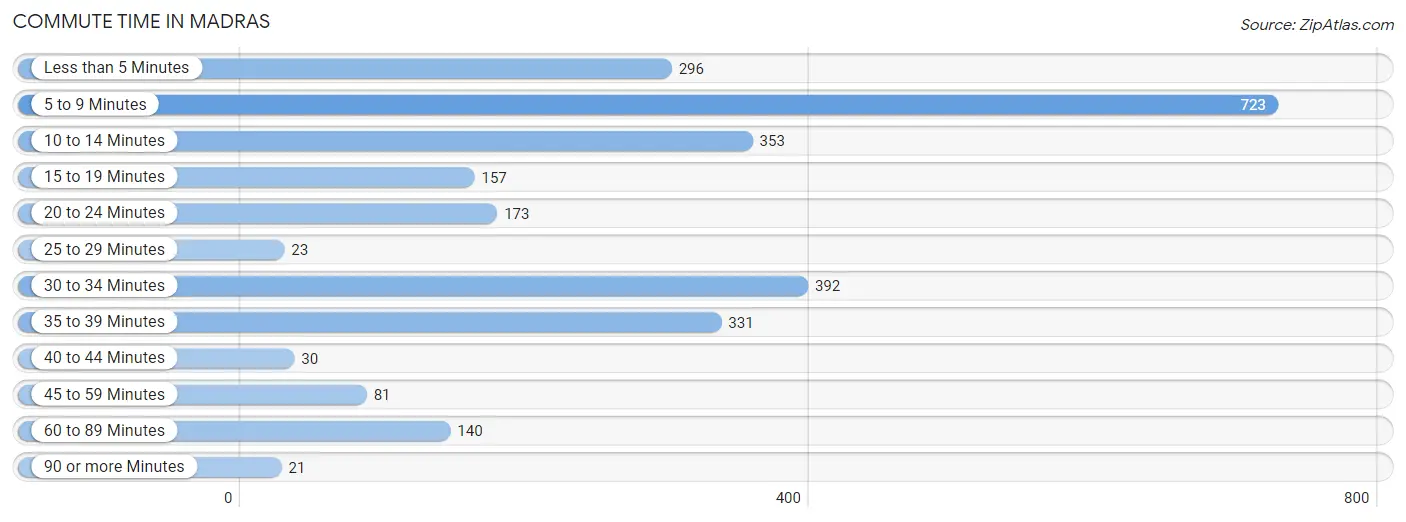
| Commute Time | # Commuters | % Commuters |
| Less than 5 Minutes | 296 | 10.9% |
| 5 to 9 Minutes | 723 | 26.6% |
| 10 to 14 Minutes | 353 | 13.0% |
| 15 to 19 Minutes | 157 | 5.8% |
| 20 to 24 Minutes | 173 | 6.4% |
| 25 to 29 Minutes | 23 | 0.9% |
| 30 to 34 Minutes | 392 | 14.4% |
| 35 to 39 Minutes | 331 | 12.2% |
| 40 to 44 Minutes | 30 | 1.1% |
| 45 to 59 Minutes | 81 | 3.0% |
| 60 to 89 Minutes | 140 | 5.1% |
| 90 or more Minutes | 21 | 0.8% |
Commute Time by Sex in Madras
The most common commute times in Madras are 5 to 9 minutes (302 commuters, 24.4%) for males and 5 to 9 minutes (421 commuters, 28.4%) for females.
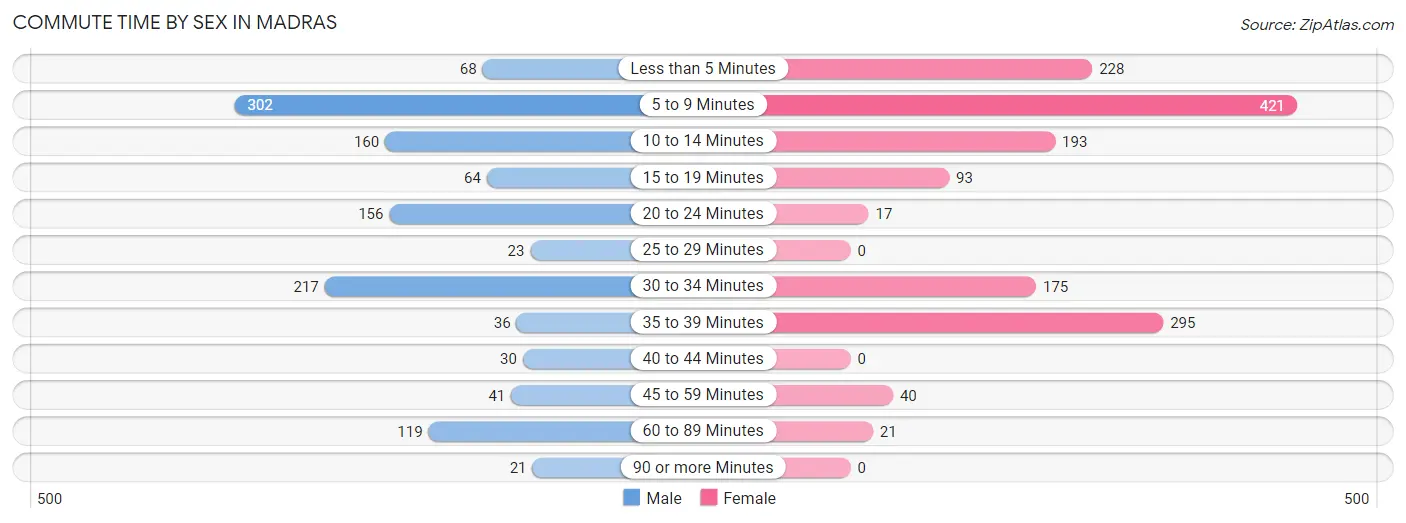
| Commute Time | Male | Female |
| Less than 5 Minutes | 68 (5.5%) | 228 (15.4%) |
| 5 to 9 Minutes | 302 (24.4%) | 421 (28.4%) |
| 10 to 14 Minutes | 160 (12.9%) | 193 (13.0%) |
| 15 to 19 Minutes | 64 (5.2%) | 93 (6.3%) |
| 20 to 24 Minutes | 156 (12.6%) | 17 (1.1%) |
| 25 to 29 Minutes | 23 (1.9%) | 0 (0.0%) |
| 30 to 34 Minutes | 217 (17.5%) | 175 (11.8%) |
| 35 to 39 Minutes | 36 (2.9%) | 295 (19.9%) |
| 40 to 44 Minutes | 30 (2.4%) | 0 (0.0%) |
| 45 to 59 Minutes | 41 (3.3%) | 40 (2.7%) |
| 60 to 89 Minutes | 119 (9.6%) | 21 (1.4%) |
| 90 or more Minutes | 21 (1.7%) | 0 (0.0%) |
Time of Departure to Work by Sex in Madras
The most frequent times of departure to work in Madras are 12:00 AM to 4:59 AM (223, 18.0%) for males and 12:00 PM to 3:59 PM (304, 20.5%) for females.
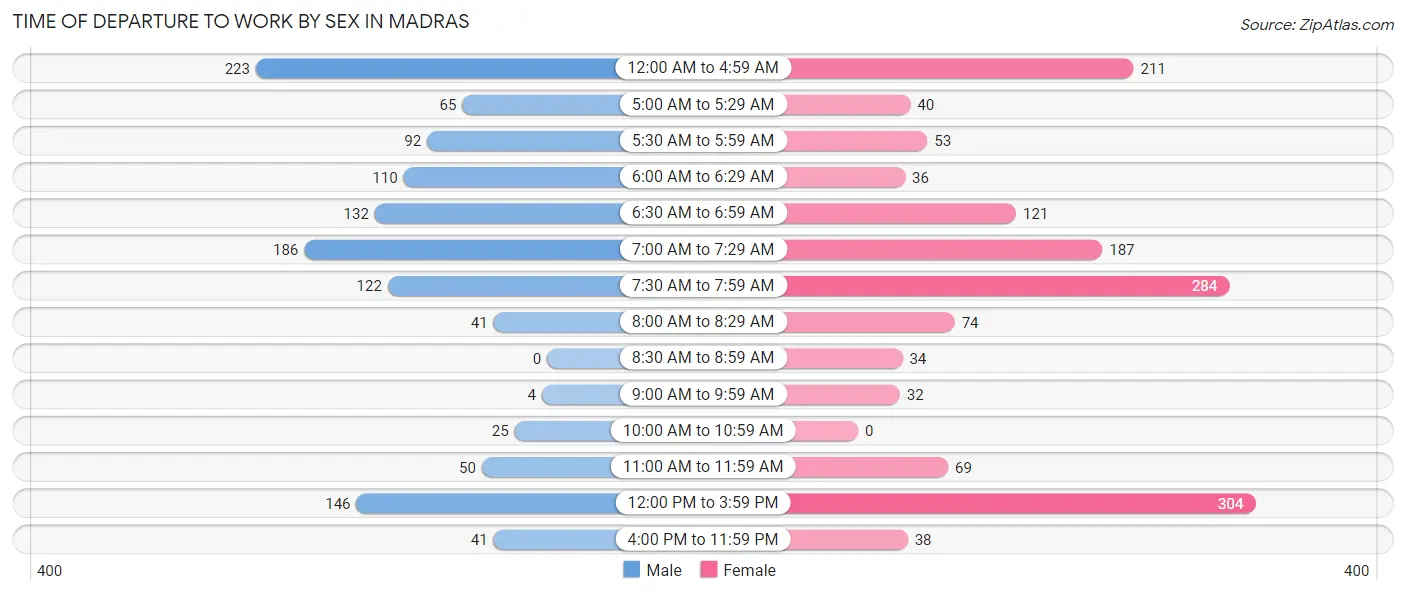
| Time of Departure | Male | Female |
| 12:00 AM to 4:59 AM | 223 (18.0%) | 211 (14.2%) |
| 5:00 AM to 5:29 AM | 65 (5.2%) | 40 (2.7%) |
| 5:30 AM to 5:59 AM | 92 (7.4%) | 53 (3.6%) |
| 6:00 AM to 6:29 AM | 110 (8.9%) | 36 (2.4%) |
| 6:30 AM to 6:59 AM | 132 (10.7%) | 121 (8.2%) |
| 7:00 AM to 7:29 AM | 186 (15.0%) | 187 (12.6%) |
| 7:30 AM to 7:59 AM | 122 (9.9%) | 284 (19.2%) |
| 8:00 AM to 8:29 AM | 41 (3.3%) | 74 (5.0%) |
| 8:30 AM to 8:59 AM | 0 (0.0%) | 34 (2.3%) |
| 9:00 AM to 9:59 AM | 4 (0.3%) | 32 (2.2%) |
| 10:00 AM to 10:59 AM | 25 (2.0%) | 0 (0.0%) |
| 11:00 AM to 11:59 AM | 50 (4.0%) | 69 (4.6%) |
| 12:00 PM to 3:59 PM | 146 (11.8%) | 304 (20.5%) |
| 4:00 PM to 11:59 PM | 41 (3.3%) | 38 (2.6%) |
| Total | 1,237 (100.0%) | 1,483 (100.0%) |
Housing Occupancy in Madras
Occupancy by Ownership in Madras
Of the total 2,470 dwellings in Madras, owner-occupied units account for 1,220 (49.4%), while renter-occupied units make up 1,250 (50.6%).
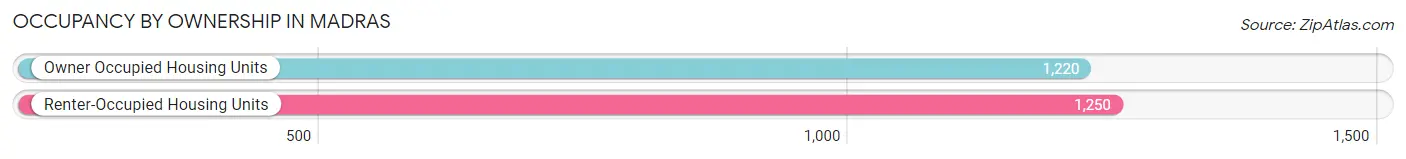
| Occupancy | # Housing Units | % Housing Units |
| Owner Occupied Housing Units | 1,220 | 49.4% |
| Renter-Occupied Housing Units | 1,250 | 50.6% |
| Total Occupied Housing Units | 2,470 | 100.0% |
Occupancy by Household Size in Madras
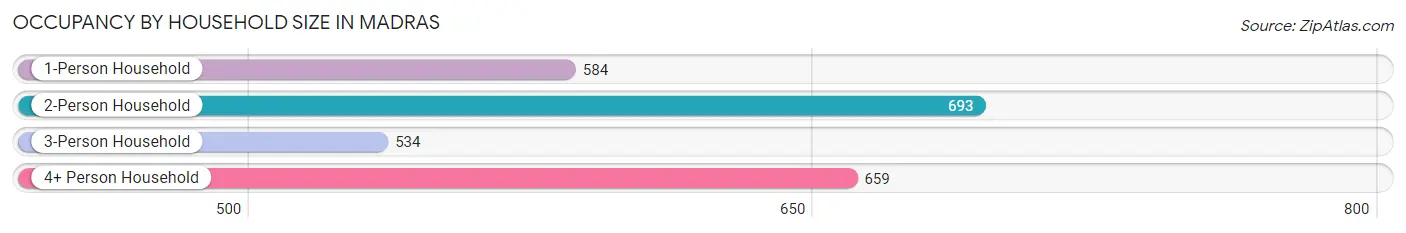
| Household Size | # Housing Units | % Housing Units |
| 1-Person Household | 584 | 23.6% |
| 2-Person Household | 693 | 28.1% |
| 3-Person Household | 534 | 21.6% |
| 4+ Person Household | 659 | 26.7% |
| Total Housing Units | 2,470 | 100.0% |
Occupancy by Ownership by Household Size in Madras
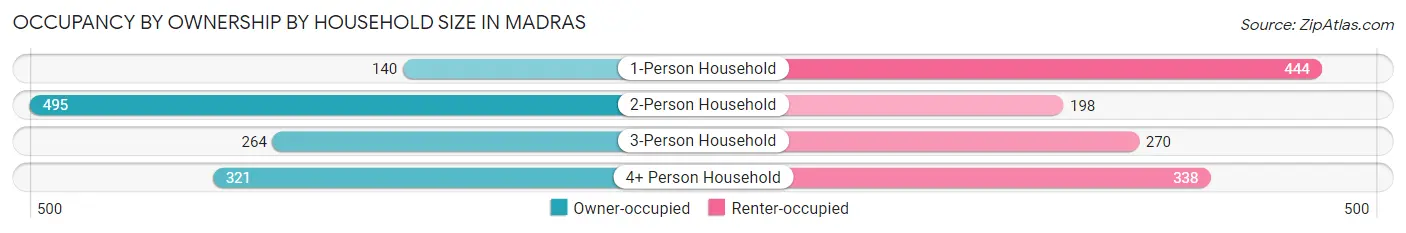
| Household Size | Owner-occupied | Renter-occupied |
| 1-Person Household | 140 (24.0%) | 444 (76.0%) |
| 2-Person Household | 495 (71.4%) | 198 (28.6%) |
| 3-Person Household | 264 (49.4%) | 270 (50.6%) |
| 4+ Person Household | 321 (48.7%) | 338 (51.3%) |
| Total Housing Units | 1,220 (49.4%) | 1,250 (50.6%) |
Occupancy by Educational Attainment in Madras
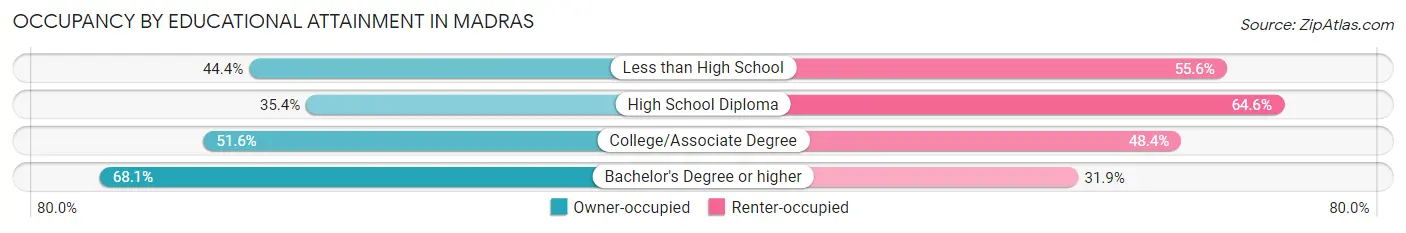
| Household Size | Owner-occupied | Renter-occupied |
| Less than High School | 135 (44.4%) | 169 (55.6%) |
| High School Diploma | 209 (35.4%) | 382 (64.6%) |
| College/Associate Degree | 616 (51.6%) | 577 (48.4%) |
| Bachelor's Degree or higher | 260 (68.1%) | 122 (31.9%) |
Occupancy by Age of Householder in Madras
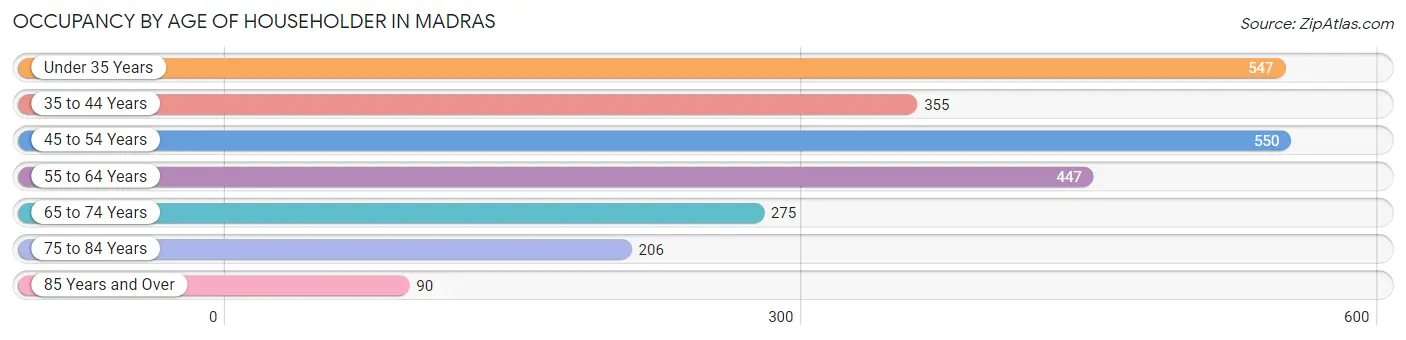
| Age Bracket | # Households | % Households |
| Under 35 Years | 547 | 22.2% |
| 35 to 44 Years | 355 | 14.4% |
| 45 to 54 Years | 550 | 22.3% |
| 55 to 64 Years | 447 | 18.1% |
| 65 to 74 Years | 275 | 11.1% |
| 75 to 84 Years | 206 | 8.3% |
| 85 Years and Over | 90 | 3.6% |
| Total | 2,470 | 100.0% |
Housing Finances in Madras
Median Income by Occupancy in Madras
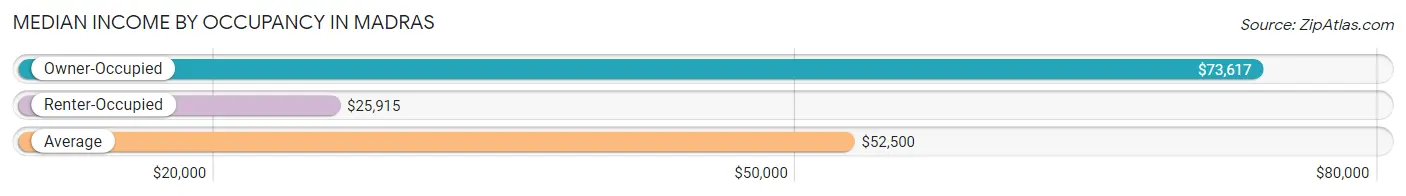
| Occupancy Type | # Households | Median Income |
| Owner-Occupied | 1,220 (49.4%) | $73,617 |
| Renter-Occupied | 1,250 (50.6%) | $25,915 |
| Average | 2,470 (100.0%) | $52,500 |
Occupancy by Householder Income Bracket in Madras
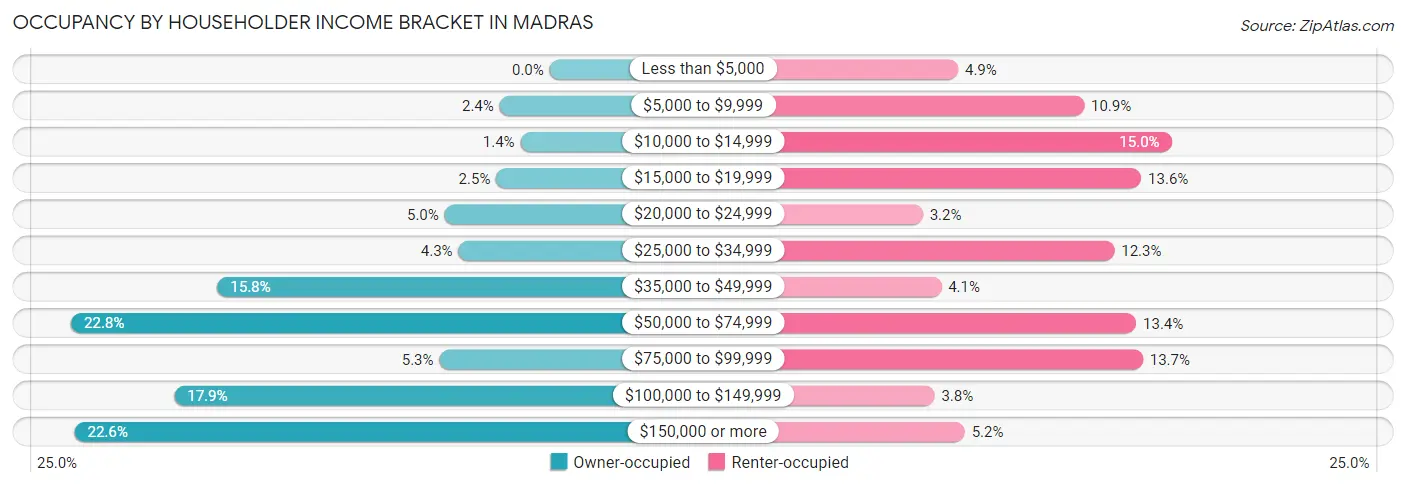
| Income Bracket | Owner-occupied | Renter-occupied |
| Less than $5,000 | 0 (0.0%) | 61 (4.9%) |
| $5,000 to $9,999 | 29 (2.4%) | 136 (10.9%) |
| $10,000 to $14,999 | 17 (1.4%) | 188 (15.0%) |
| $15,000 to $19,999 | 31 (2.5%) | 170 (13.6%) |
| $20,000 to $24,999 | 61 (5.0%) | 40 (3.2%) |
| $25,000 to $34,999 | 53 (4.3%) | 154 (12.3%) |
| $35,000 to $49,999 | 193 (15.8%) | 51 (4.1%) |
| $50,000 to $74,999 | 278 (22.8%) | 167 (13.4%) |
| $75,000 to $99,999 | 64 (5.2%) | 171 (13.7%) |
| $100,000 to $149,999 | 218 (17.9%) | 47 (3.8%) |
| $150,000 or more | 276 (22.6%) | 65 (5.2%) |
| Total | 1,220 (100.0%) | 1,250 (100.0%) |
Monthly Housing Cost Tiers in Madras
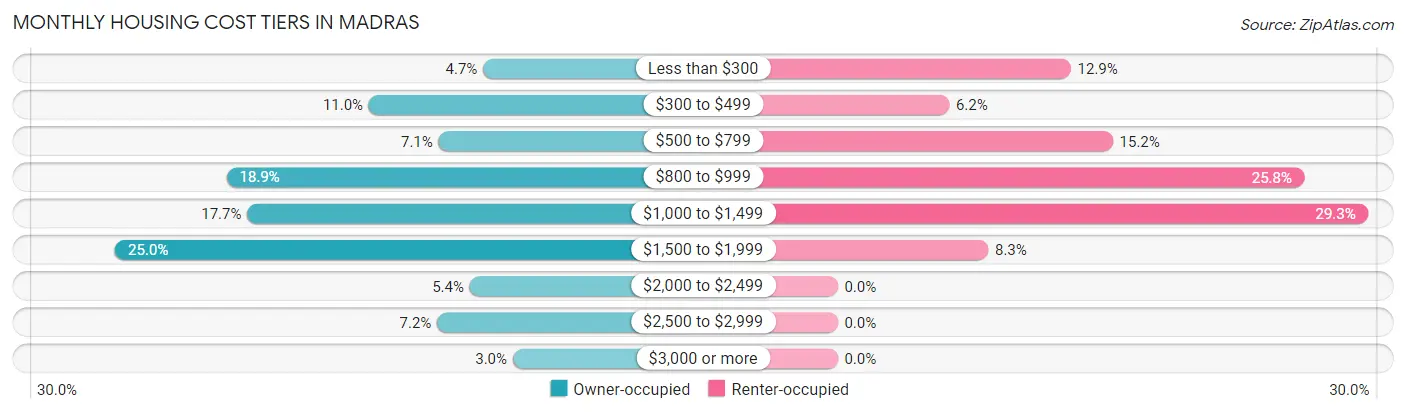
| Monthly Cost | Owner-occupied | Renter-occupied |
| Less than $300 | 57 (4.7%) | 161 (12.9%) |
| $300 to $499 | 134 (11.0%) | 77 (6.2%) |
| $500 to $799 | 87 (7.1%) | 190 (15.2%) |
| $800 to $999 | 230 (18.9%) | 322 (25.8%) |
| $1,000 to $1,499 | 216 (17.7%) | 366 (29.3%) |
| $1,500 to $1,999 | 305 (25.0%) | 104 (8.3%) |
| $2,000 to $2,499 | 66 (5.4%) | 0 (0.0%) |
| $2,500 to $2,999 | 88 (7.2%) | 0 (0.0%) |
| $3,000 or more | 37 (3.0%) | 0 (0.0%) |
| Total | 1,220 (100.0%) | 1,250 (100.0%) |
Physical Housing Characteristics in Madras
Housing Structures in Madras
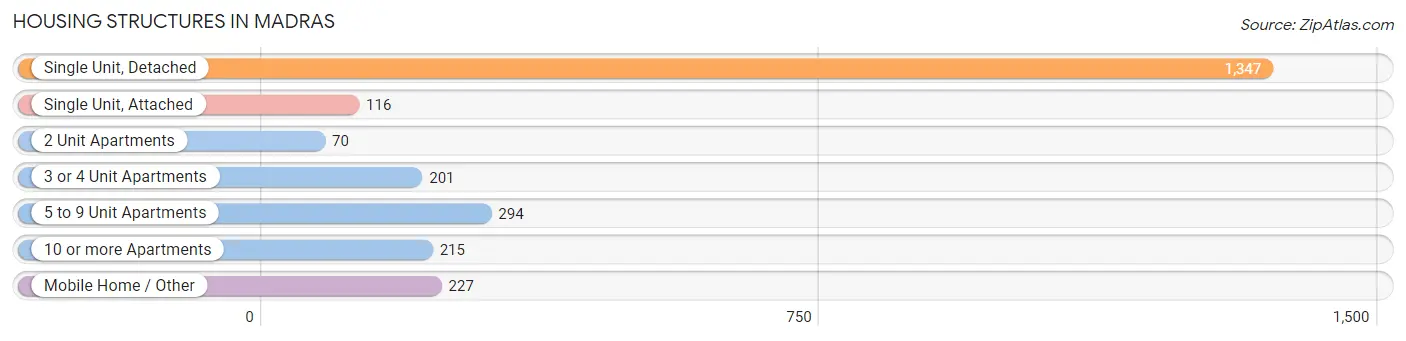
| Structure Type | # Housing Units | % Housing Units |
| Single Unit, Detached | 1,347 | 54.5% |
| Single Unit, Attached | 116 | 4.7% |
| 2 Unit Apartments | 70 | 2.8% |
| 3 or 4 Unit Apartments | 201 | 8.1% |
| 5 to 9 Unit Apartments | 294 | 11.9% |
| 10 or more Apartments | 215 | 8.7% |
| Mobile Home / Other | 227 | 9.2% |
| Total | 2,470 | 100.0% |
Housing Structures by Occupancy in Madras
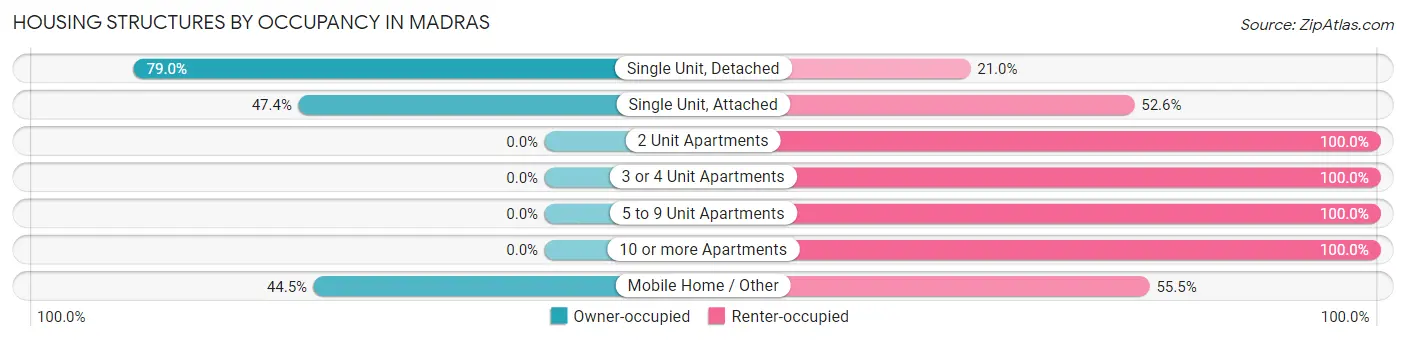
| Structure Type | Owner-occupied | Renter-occupied |
| Single Unit, Detached | 1,064 (79.0%) | 283 (21.0%) |
| Single Unit, Attached | 55 (47.4%) | 61 (52.6%) |
| 2 Unit Apartments | 0 (0.0%) | 70 (100.0%) |
| 3 or 4 Unit Apartments | 0 (0.0%) | 201 (100.0%) |
| 5 to 9 Unit Apartments | 0 (0.0%) | 294 (100.0%) |
| 10 or more Apartments | 0 (0.0%) | 215 (100.0%) |
| Mobile Home / Other | 101 (44.5%) | 126 (55.5%) |
| Total | 1,220 (49.4%) | 1,250 (50.6%) |
Housing Structures by Number of Rooms in Madras
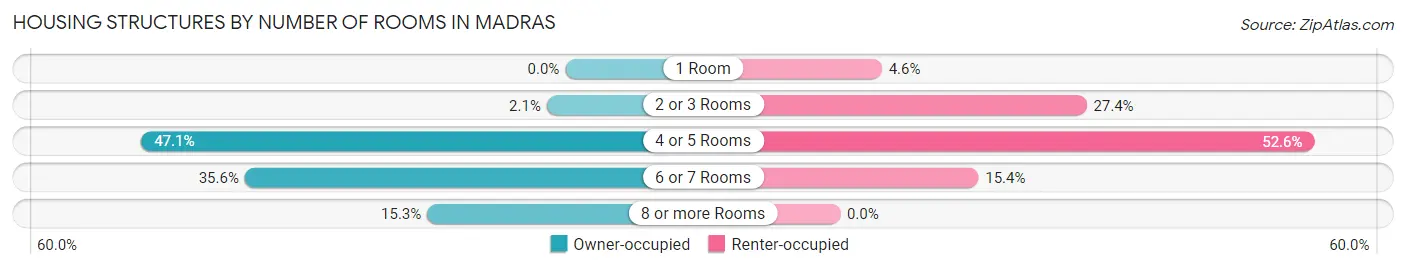
| Number of Rooms | Owner-occupied | Renter-occupied |
| 1 Room | 0 (0.0%) | 58 (4.6%) |
| 2 or 3 Rooms | 25 (2.1%) | 342 (27.4%) |
| 4 or 5 Rooms | 574 (47.0%) | 658 (52.6%) |
| 6 or 7 Rooms | 434 (35.6%) | 192 (15.4%) |
| 8 or more Rooms | 187 (15.3%) | 0 (0.0%) |
| Total | 1,220 (100.0%) | 1,250 (100.0%) |
Housing Structure by Heating Type in Madras
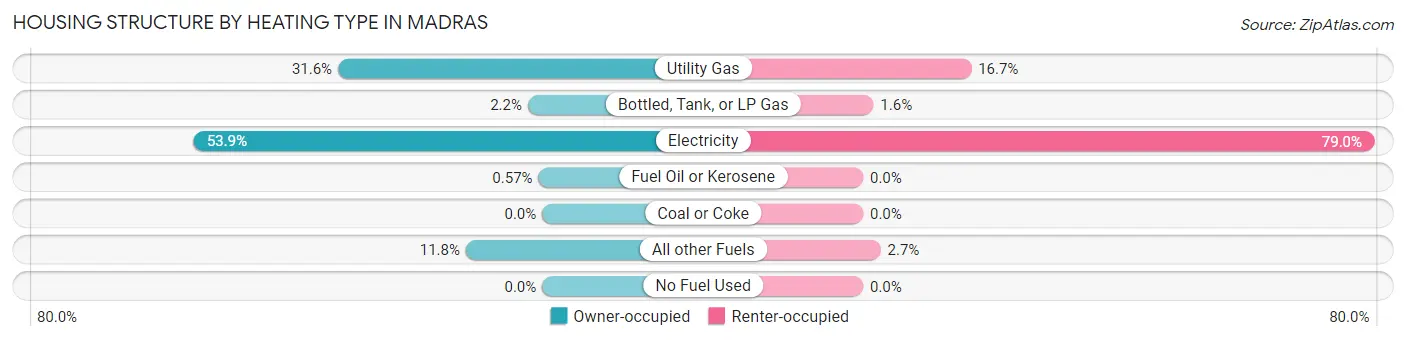
| Heating Type | Owner-occupied | Renter-occupied |
| Utility Gas | 385 (31.6%) | 209 (16.7%) |
| Bottled, Tank, or LP Gas | 27 (2.2%) | 20 (1.6%) |
| Electricity | 657 (53.8%) | 987 (79.0%) |
| Fuel Oil or Kerosene | 7 (0.6%) | 0 (0.0%) |
| Coal or Coke | 0 (0.0%) | 0 (0.0%) |
| All other Fuels | 144 (11.8%) | 34 (2.7%) |
| No Fuel Used | 0 (0.0%) | 0 (0.0%) |
| Total | 1,220 (100.0%) | 1,250 (100.0%) |
Household Vehicle Usage in Madras
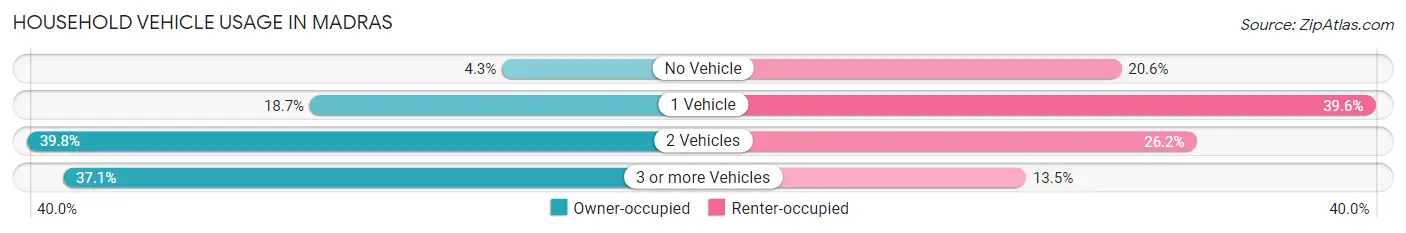
| Vehicles per Household | Owner-occupied | Renter-occupied |
| No Vehicle | 53 (4.3%) | 258 (20.6%) |
| 1 Vehicle | 228 (18.7%) | 495 (39.6%) |
| 2 Vehicles | 486 (39.8%) | 328 (26.2%) |
| 3 or more Vehicles | 453 (37.1%) | 169 (13.5%) |
| Total | 1,220 (100.0%) | 1,250 (100.0%) |
Real Estate & Mortgages in Madras
Real Estate and Mortgage Overview in Madras
| Characteristic | Without Mortgage | With Mortgage |
| Housing Units | 332 | 888 |
| Median Property Value | $203,700 | $264,500 |
| Median Household Income | $54,545 | $261 |
| Monthly Housing Costs | $488 | $37 |
| Real Estate Taxes | $1,699 | $0 |
Property Value by Mortgage Status in Madras
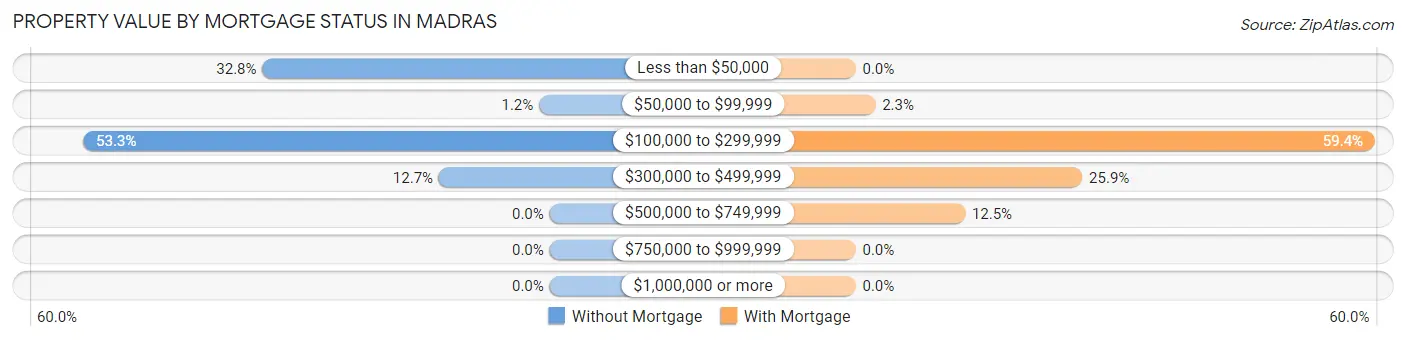
| Property Value | Without Mortgage | With Mortgage |
| Less than $50,000 | 109 (32.8%) | 0 (0.0%) |
| $50,000 to $99,999 | 4 (1.2%) | 20 (2.2%) |
| $100,000 to $299,999 | 177 (53.3%) | 527 (59.4%) |
| $300,000 to $499,999 | 42 (12.7%) | 230 (25.9%) |
| $500,000 to $749,999 | 0 (0.0%) | 111 (12.5%) |
| $750,000 to $999,999 | 0 (0.0%) | 0 (0.0%) |
| $1,000,000 or more | 0 (0.0%) | 0 (0.0%) |
| Total | 332 (100.0%) | 888 (100.0%) |
Household Income by Mortgage Status in Madras
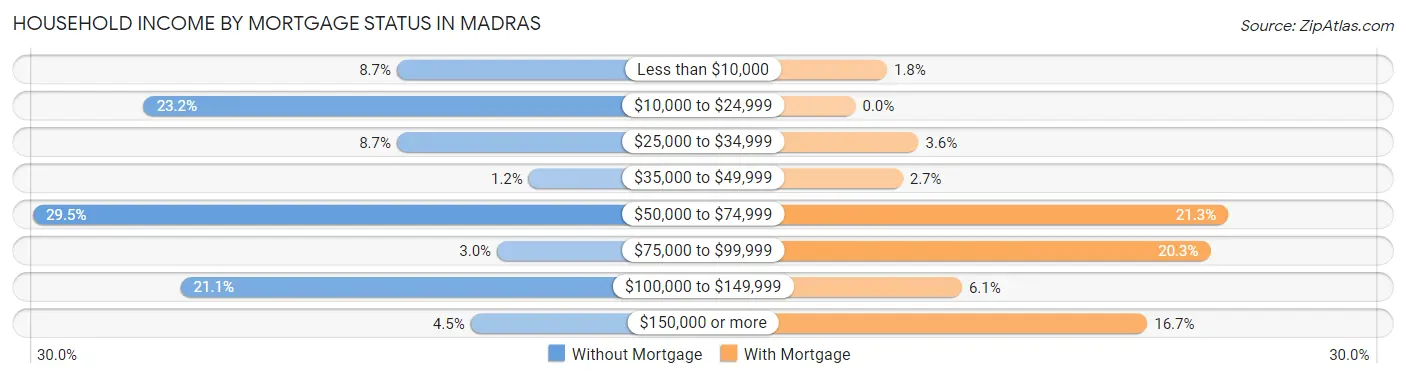
| Household Income | Without Mortgage | With Mortgage |
| Less than $10,000 | 29 (8.7%) | 16 (1.8%) |
| $10,000 to $24,999 | 77 (23.2%) | 0 (0.0%) |
| $25,000 to $34,999 | 29 (8.7%) | 32 (3.6%) |
| $35,000 to $49,999 | 4 (1.2%) | 24 (2.7%) |
| $50,000 to $74,999 | 98 (29.5%) | 189 (21.3%) |
| $75,000 to $99,999 | 10 (3.0%) | 180 (20.3%) |
| $100,000 to $149,999 | 70 (21.1%) | 54 (6.1%) |
| $150,000 or more | 15 (4.5%) | 148 (16.7%) |
| Total | 332 (100.0%) | 888 (100.0%) |
Property Value to Household Income Ratio in Madras
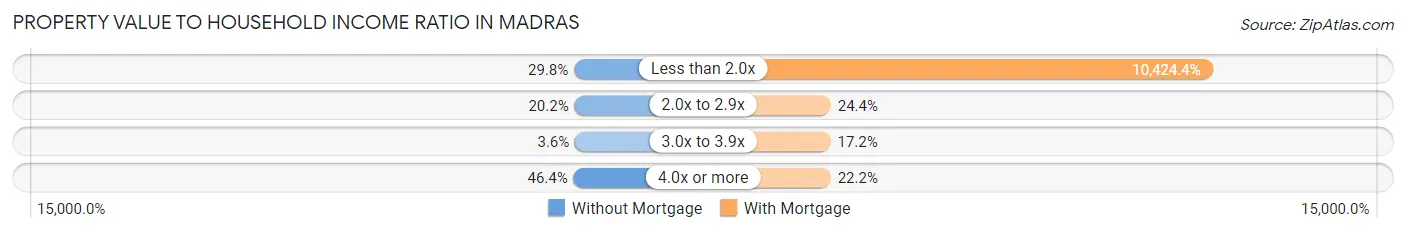
| Value-to-Income Ratio | Without Mortgage | With Mortgage |
| Less than 2.0x | 99 (29.8%) | 92,569 (10,424.4%) |
| 2.0x to 2.9x | 67 (20.2%) | 217 (24.4%) |
| 3.0x to 3.9x | 12 (3.6%) | 153 (17.2%) |
| 4.0x or more | 154 (46.4%) | 197 (22.2%) |
| Total | 332 (100.0%) | 888 (100.0%) |
Real Estate Taxes by Mortgage Status in Madras
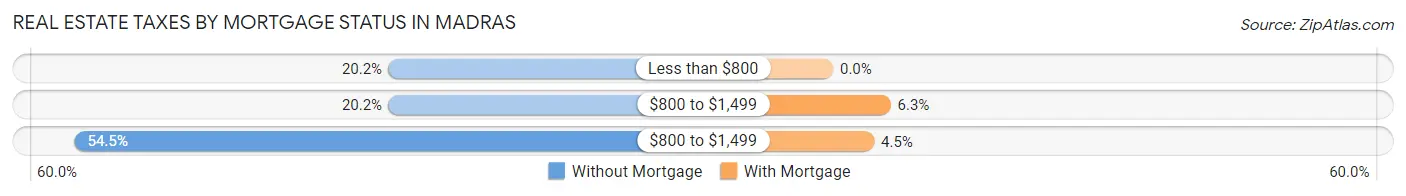
| Property Taxes | Without Mortgage | With Mortgage |
| Less than $800 | 67 (20.2%) | 0 (0.0%) |
| $800 to $1,499 | 67 (20.2%) | 56 (6.3%) |
| $800 to $1,499 | 181 (54.5%) | 40 (4.5%) |
| Total | 332 (100.0%) | 888 (100.0%) |
Health & Disability in Madras
Health Insurance Coverage by Age in Madras
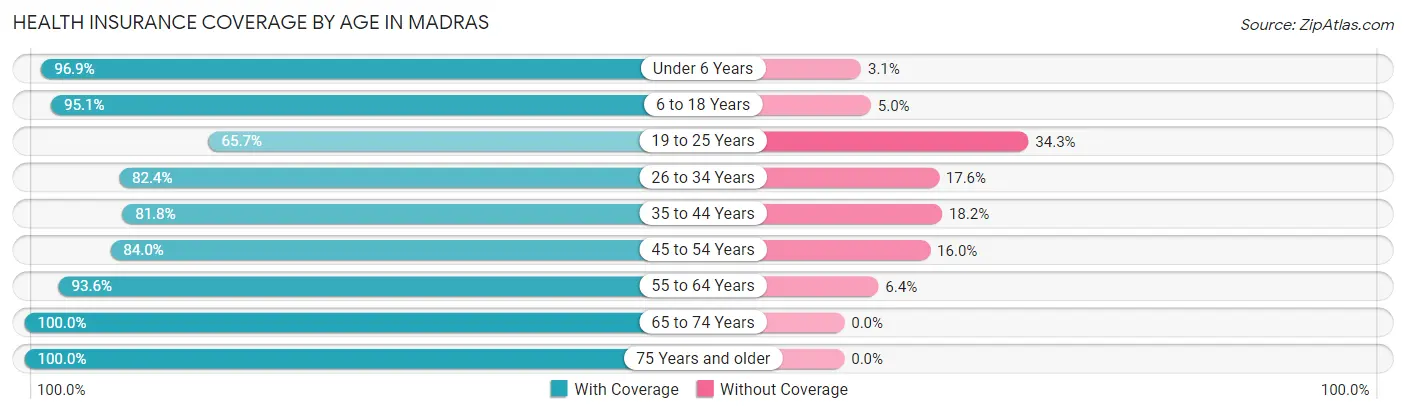
| Age Bracket | With Coverage | Without Coverage |
| Under 6 Years | 869 (96.9%) | 28 (3.1%) |
| 6 to 18 Years | 1,633 (95.1%) | 85 (5.0%) |
| 19 to 25 Years | 352 (65.7%) | 184 (34.3%) |
| 26 to 34 Years | 654 (82.4%) | 140 (17.6%) |
| 35 to 44 Years | 669 (81.8%) | 149 (18.2%) |
| 45 to 54 Years | 792 (84.0%) | 151 (16.0%) |
| 55 to 64 Years | 677 (93.6%) | 46 (6.4%) |
| 65 to 74 Years | 478 (100.0%) | 0 (0.0%) |
| 75 Years and older | 443 (100.0%) | 0 (0.0%) |
| Total | 6,567 (89.3%) | 783 (10.6%) |
Health Insurance Coverage by Citizenship Status in Madras
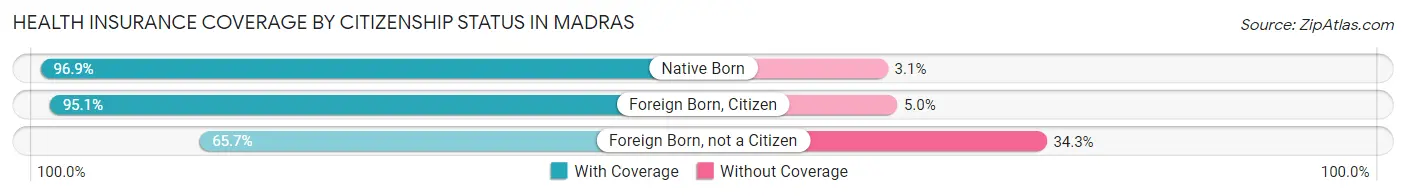
| Citizenship Status | With Coverage | Without Coverage |
| Native Born | 869 (96.9%) | 28 (3.1%) |
| Foreign Born, Citizen | 1,633 (95.1%) | 85 (5.0%) |
| Foreign Born, not a Citizen | 352 (65.7%) | 184 (34.3%) |
Health Insurance Coverage by Household Income in Madras
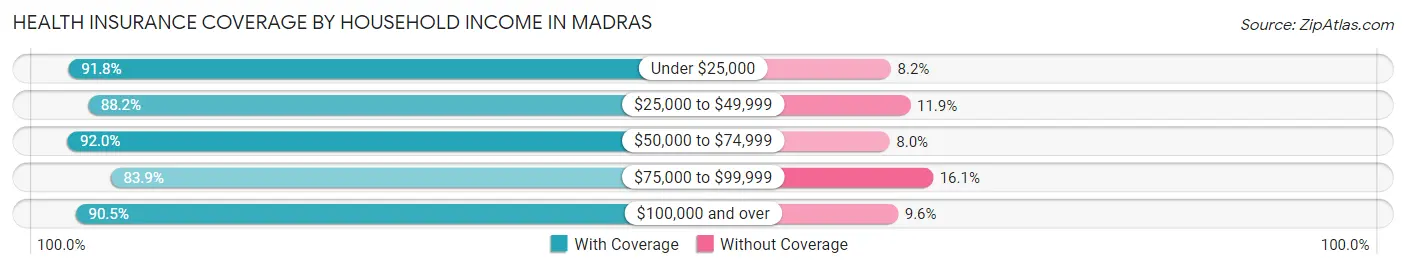
| Household Income | With Coverage | Without Coverage |
| Under $25,000 | 1,140 (91.8%) | 102 (8.2%) |
| $25,000 to $49,999 | 967 (88.1%) | 130 (11.8%) |
| $50,000 to $74,999 | 1,005 (92.0%) | 87 (8.0%) |
| $75,000 to $99,999 | 1,214 (83.9%) | 233 (16.1%) |
| $100,000 and over | 2,187 (90.4%) | 231 (9.6%) |
Public vs Private Health Insurance Coverage by Age in Madras
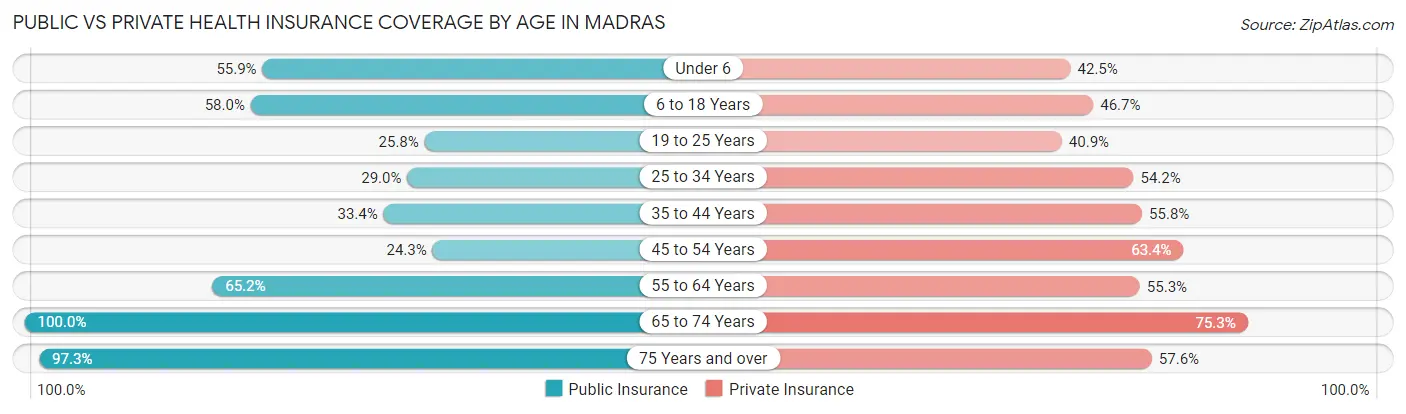
| Age Bracket | Public Insurance | Private Insurance |
| Under 6 | 501 (55.8%) | 381 (42.5%) |
| 6 to 18 Years | 997 (58.0%) | 802 (46.7%) |
| 19 to 25 Years | 138 (25.8%) | 219 (40.9%) |
| 25 to 34 Years | 230 (29.0%) | 430 (54.2%) |
| 35 to 44 Years | 273 (33.4%) | 456 (55.7%) |
| 45 to 54 Years | 229 (24.3%) | 598 (63.4%) |
| 55 to 64 Years | 471 (65.1%) | 400 (55.3%) |
| 65 to 74 Years | 478 (100.0%) | 360 (75.3%) |
| 75 Years and over | 431 (97.3%) | 255 (57.6%) |
| Total | 3,748 (51.0%) | 3,901 (53.1%) |
Disability Status by Sex by Age in Madras
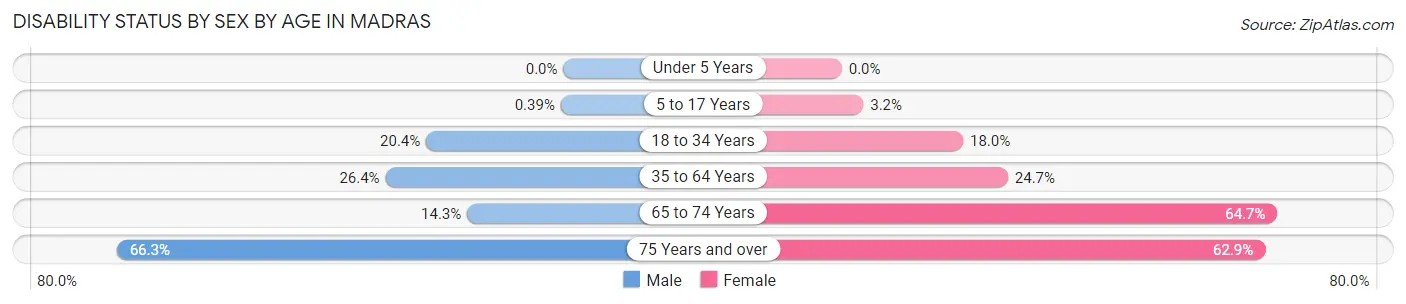
| Age Bracket | Male | Female |
| Under 5 Years | 0 (0.0%) | 0 (0.0%) |
| 5 to 17 Years | 3 (0.4%) | 27 (3.2%) |
| 18 to 34 Years | 128 (20.4%) | 149 (18.0%) |
| 35 to 64 Years | 307 (26.4%) | 326 (24.7%) |
| 65 to 74 Years | 42 (14.3%) | 119 (64.7%) |
| 75 Years and over | 126 (66.3%) | 159 (62.8%) |
Disability Class by Sex by Age in Madras
Disability Class: Hearing Difficulty
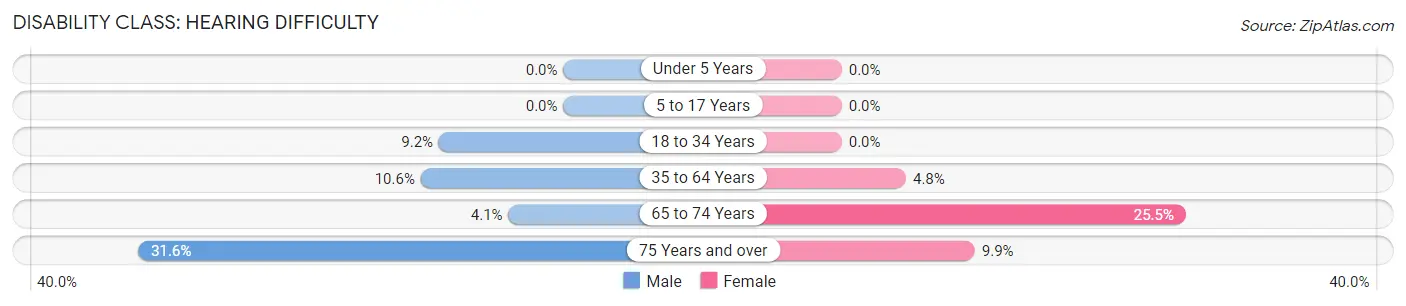
| Age Bracket | Male | Female |
| Under 5 Years | 0 (0.0%) | 0 (0.0%) |
| 5 to 17 Years | 0 (0.0%) | 0 (0.0%) |
| 18 to 34 Years | 58 (9.2%) | 0 (0.0%) |
| 35 to 64 Years | 123 (10.6%) | 63 (4.8%) |
| 65 to 74 Years | 12 (4.1%) | 47 (25.5%) |
| 75 Years and over | 60 (31.6%) | 25 (9.9%) |
Disability Class: Vision Difficulty
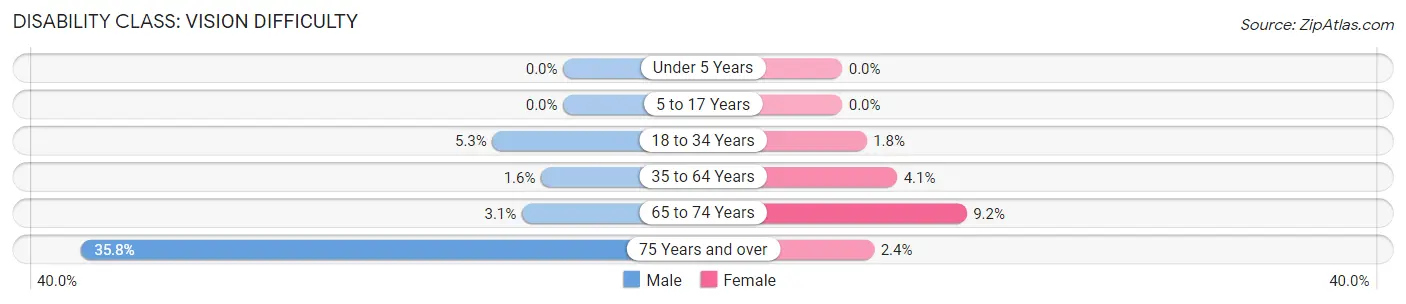
| Age Bracket | Male | Female |
| Under 5 Years | 0 (0.0%) | 0 (0.0%) |
| 5 to 17 Years | 0 (0.0%) | 0 (0.0%) |
| 18 to 34 Years | 33 (5.2%) | 15 (1.8%) |
| 35 to 64 Years | 19 (1.6%) | 54 (4.1%) |
| 65 to 74 Years | 9 (3.1%) | 17 (9.2%) |
| 75 Years and over | 68 (35.8%) | 6 (2.4%) |
Disability Class: Cognitive Difficulty
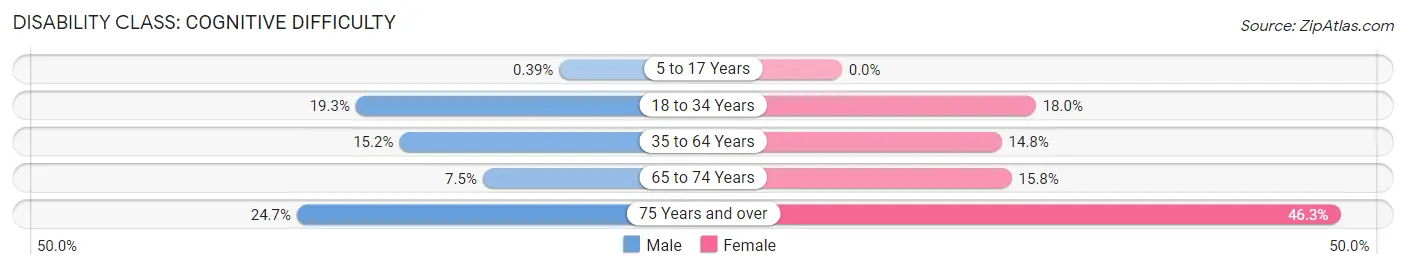
| Age Bracket | Male | Female |
| 5 to 17 Years | 3 (0.4%) | 0 (0.0%) |
| 18 to 34 Years | 121 (19.3%) | 149 (18.0%) |
| 35 to 64 Years | 177 (15.2%) | 196 (14.8%) |
| 65 to 74 Years | 22 (7.5%) | 29 (15.8%) |
| 75 Years and over | 47 (24.7%) | 117 (46.3%) |
Disability Class: Ambulatory Difficulty
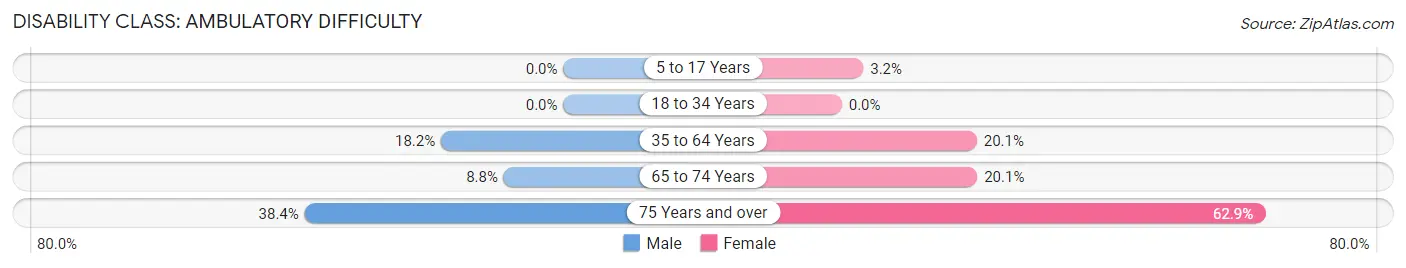
| Age Bracket | Male | Female |
| 5 to 17 Years | 0 (0.0%) | 27 (3.2%) |
| 18 to 34 Years | 0 (0.0%) | 0 (0.0%) |
| 35 to 64 Years | 211 (18.2%) | 265 (20.1%) |
| 65 to 74 Years | 26 (8.8%) | 37 (20.1%) |
| 75 Years and over | 73 (38.4%) | 159 (62.8%) |
Disability Class: Self-Care Difficulty
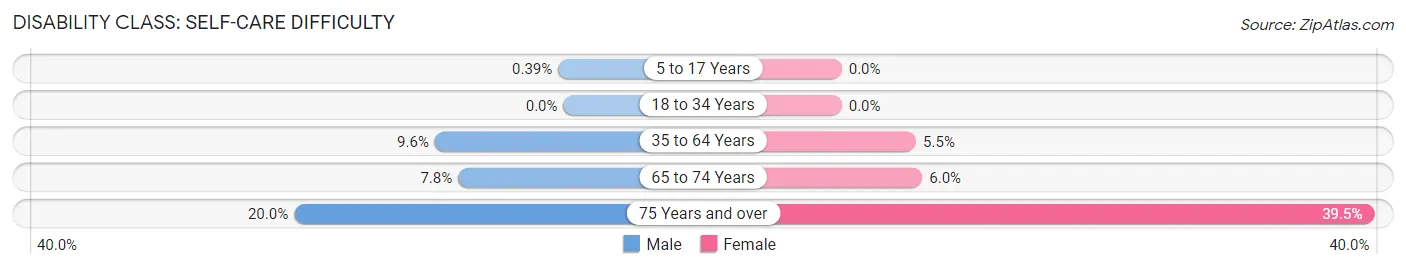
| Age Bracket | Male | Female |
| 5 to 17 Years | 3 (0.4%) | 0 (0.0%) |
| 18 to 34 Years | 0 (0.0%) | 0 (0.0%) |
| 35 to 64 Years | 111 (9.6%) | 73 (5.5%) |
| 65 to 74 Years | 23 (7.8%) | 11 (6.0%) |
| 75 Years and over | 38 (20.0%) | 100 (39.5%) |
Technology Access in Madras
Computing Device Access in Madras
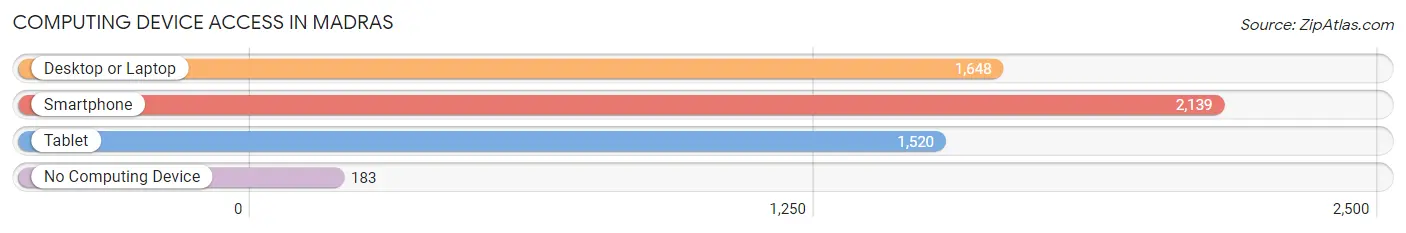
| Device Type | # Households | % Households |
| Desktop or Laptop | 1,648 | 66.7% |
| Smartphone | 2,139 | 86.6% |
| Tablet | 1,520 | 61.5% |
| No Computing Device | 183 | 7.4% |
| Total | 2,470 | 100.0% |
Internet Access in Madras
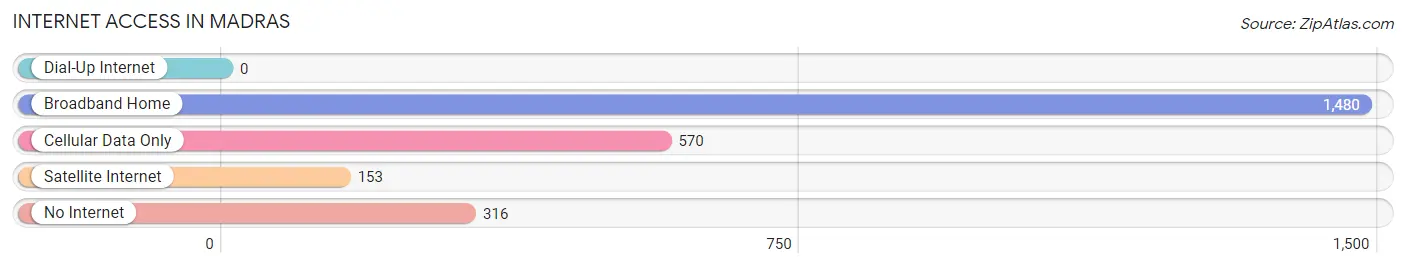
| Internet Type | # Households | % Households |
| Dial-Up Internet | 0 | 0.0% |
| Broadband Home | 1,480 | 59.9% |
| Cellular Data Only | 570 | 23.1% |
| Satellite Internet | 153 | 6.2% |
| No Internet | 316 | 12.8% |
| Total | 2,470 | 100.0% |
Madras Summary
Madras is a city located in Jefferson County, Oregon, United States. It is the county seat of Jefferson County and is located in the heart of Central Oregon. The city is situated on the banks of the Deschutes River and is surrounded by the Cascade Mountains. The city has a population of 6,046 as of the 2010 census.
History
The area that is now Madras was originally inhabited by the Warm Springs Native American tribe. The first white settlers arrived in the area in the late 1800s and the city was officially incorporated in 1911. The city was named after the city of Madras in India, which was the birthplace of one of the city's early settlers.
The city was initially an agricultural center, with the main crops being wheat, barley, and potatoes. In the early 1900s, the city began to grow and develop as a transportation hub. The Oregon Trunk Railway was built through the city in 1911, connecting it to the rest of the state. The city also became a center for the lumber industry, with several sawmills being built in the area.
In the 1950s, the city began to experience a population boom as the nearby Hanford Nuclear Reservation began to expand. The city also became a center for the aerospace industry, with several aerospace companies setting up operations in the area.
Geography
Madras is located in Central Oregon at the junction of US Highway 26 and US Highway 97. The city is situated on the banks of the Deschutes River and is surrounded by the Cascade Mountains. The city has a total area of 4.2 square miles, all of which is land.
The city has a semi-arid climate, with hot summers and cold winters. The average annual temperature is 52.3°F, with an average high of 79.2°F in July and an average low of 25.3°F in January. The average annual precipitation is 8.9 inches.
Economy
The economy of Madras is largely based on agriculture, manufacturing, and tourism. The city is home to several agricultural businesses, including a large potato processing plant. The city is also home to several manufacturing companies, including a large aerospace parts manufacturer.
The city is also a popular tourist destination, with several outdoor recreation opportunities in the surrounding area. The city is home to several golf courses, as well as the nearby Deschutes National Forest.
Demographics
As of the 2010 census, the population of Madras was 6,046. The racial makeup of the city was 79.2% White, 0.7% African American, 1.2% Native American, 0.7% Asian, 0.1% Pacific Islander, 15.2% from other races, and 3.0% from two or more races. Hispanic or Latino of any race were 24.2% of the population.
The median household income in the city was $37,917, and the median family income was $45,938. The per capita income in the city was $19,945. About 16.2% of the population was below the poverty line.
Common Questions
What is Per Capita Income in Madras?
Per Capita income in Madras is $23,764.
What is the Median Family Income in Madras?
Median Family Income in Madras is $63,032.
What is the Median Household income in Madras?
Median Household Income in Madras is $52,500.
What is Income or Wage Gap in Madras?
Income or Wage Gap in Madras is 31.1%.
Women in Madras earn 68.9 cents for every dollar earned by a man.
What is Inequality or Gini Index in Madras?
Inequality or Gini Index in Madras is 0.47.
What is the Total Population of Madras?
Total Population of Madras is 7,494.
What is the Total Male Population of Madras?
Total Male Population of Madras is 3,535.
What is the Total Female Population of Madras?
Total Female Population of Madras is 3,959.
What is the Ratio of Males per 100 Females in Madras?
There are 89.29 Males per 100 Females in Madras.
What is the Ratio of Females per 100 Males in Madras?
There are 111.99 Females per 100 Males in Madras.
What is the Median Population Age in Madras?
Median Population Age in Madras is 33.0 Years.
What is the Average Family Size in Madras
Average Family Size in Madras is 3.5 People.
What is the Average Household Size in Madras
Average Household Size in Madras is 3.0 People.
How Large is the Labor Force in Madras?
There are 3,362 People in the Labor Forcein in Madras.
What is the Percentage of People in the Labor Force in Madras?
63.9% of People are in the Labor Force in Madras.
What is the Unemployment Rate in Madras?
Unemployment Rate in Madras is 10.0%.