Banks, OR Map & Demographics
Banks Map
Banks Overview
$40,991
PER CAPITA INCOME
$118,750
AVG FAMILY INCOME
$82,708
AVG HOUSEHOLD INCOME
63.2%
WAGE / INCOME GAP [ % ]
36.8¢/ $1
WAGE / INCOME GAP [ $ ]
0.33
INEQUALITY / GINI INDEX
2,047
TOTAL POPULATION
937
MALE POPULATION
1,110
FEMALE POPULATION
84.41
MALES / 100 FEMALES
118.46
FEMALES / 100 MALES
34.8
MEDIAN AGE
3.3
AVG FAMILY SIZE
2.7
AVG HOUSEHOLD SIZE
1,216
LABOR FORCE [ PEOPLE ]
81.5%
PERCENT IN LABOR FORCE
7.9%
UNEMPLOYMENT RATE
Banks Zip Codes
Income in Banks
Income Overview in Banks
Per Capita Income in Banks is $40,991, while median incomes of families and households are $118,750 and $82,708 respectively.
| Characteristic | Number | Measure |
| Per Capita Income | 2,047 | $40,991 |
| Median Family Income | 520 | $118,750 |
| Mean Family Income | 520 | $124,115 |
| Median Household Income | 758 | $82,708 |
| Mean Household Income | 758 | $109,063 |
| Income Deficit | 520 | $0 |
| Wage / Income Gap (%) | 2,047 | 63.17% |
| Wage / Income Gap ($) | 2,047 | 36.83¢ per $1 |
| Gini / Inequality Index | 2,047 | 0.33 |
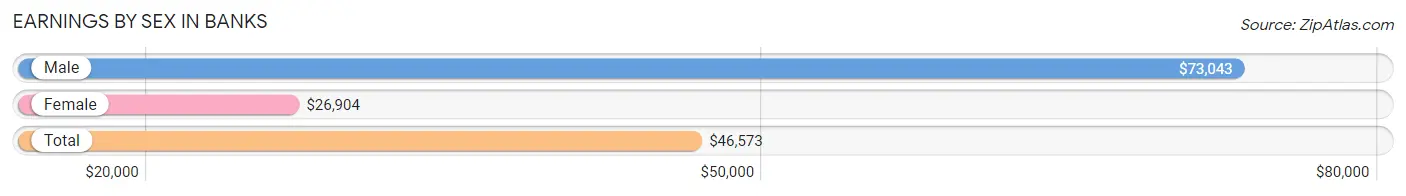
Earnings by Sex in Banks
Average Earnings in Banks are $46,573, $73,043 for men and $26,904 for women, a difference of 63.2%.
| Sex | Number | Average Earnings |
| Male | 546 (44.3%) | $73,043 |
| Female | 687 (55.7%) | $26,904 |
| Total | 1,233 (100.0%) | $46,573 |
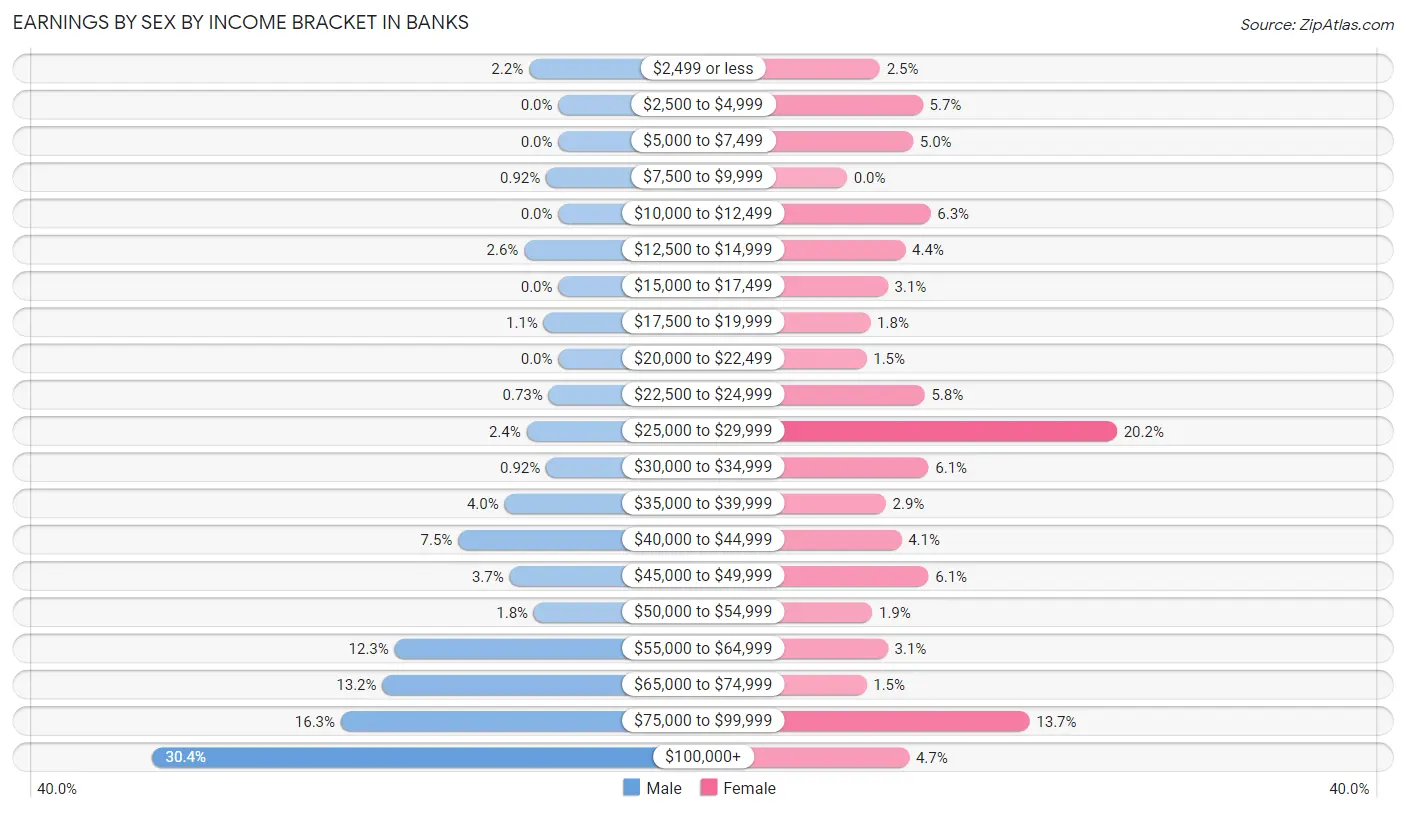
Earnings by Sex by Income Bracket in Banks
The most common earnings brackets in Banks are $100,000+ for men (166 | 30.4%) and $25,000 to $29,999 for women (139 | 20.2%).
| Income | Male | Female |
| $2,499 or less | 12 (2.2%) | 17 (2.5%) |
| $2,500 to $4,999 | 0 (0.0%) | 39 (5.7%) |
| $5,000 to $7,499 | 0 (0.0%) | 34 (5.0%) |
| $7,500 to $9,999 | 5 (0.9%) | 0 (0.0%) |
| $10,000 to $12,499 | 0 (0.0%) | 43 (6.3%) |
| $12,500 to $14,999 | 14 (2.6%) | 30 (4.4%) |
| $15,000 to $17,499 | 0 (0.0%) | 21 (3.1%) |
| $17,500 to $19,999 | 6 (1.1%) | 12 (1.8%) |
| $20,000 to $22,499 | 0 (0.0%) | 10 (1.5%) |
| $22,500 to $24,999 | 4 (0.7%) | 40 (5.8%) |
| $25,000 to $29,999 | 13 (2.4%) | 139 (20.2%) |
| $30,000 to $34,999 | 5 (0.9%) | 42 (6.1%) |
| $35,000 to $39,999 | 22 (4.0%) | 20 (2.9%) |
| $40,000 to $44,999 | 41 (7.5%) | 28 (4.1%) |
| $45,000 to $49,999 | 20 (3.7%) | 42 (6.1%) |
| $50,000 to $54,999 | 10 (1.8%) | 13 (1.9%) |
| $55,000 to $64,999 | 67 (12.3%) | 21 (3.1%) |
| $65,000 to $74,999 | 72 (13.2%) | 10 (1.5%) |
| $75,000 to $99,999 | 89 (16.3%) | 94 (13.7%) |
| $100,000+ | 166 (30.4%) | 32 (4.7%) |
| Total | 546 (100.0%) | 687 (100.0%) |
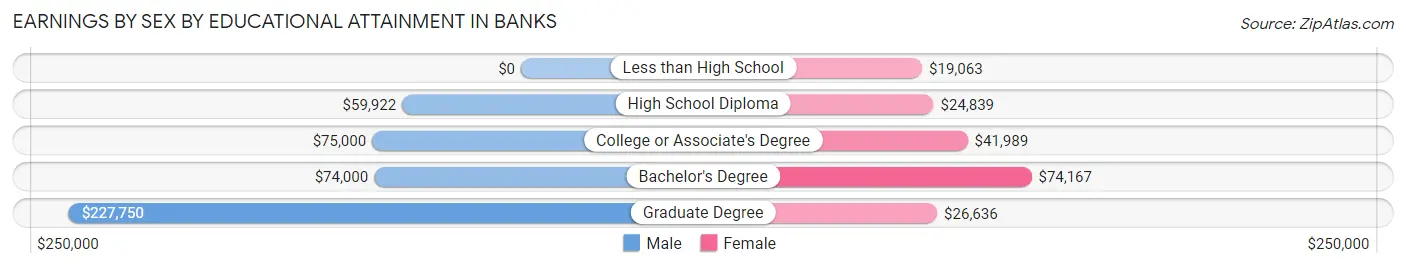
Earnings by Sex by Educational Attainment in Banks
Average earnings in Banks are $74,076 for men and $30,764 for women, a difference of 58.5%. Men with an educational attainment of graduate degree enjoy the highest average annual earnings of $227,750, while those with high school diploma education earn the least with $59,922. Women with an educational attainment of bachelor's degree earn the most with the average annual earnings of $74,167, while those with less than high school education have the smallest earnings of $19,063.
| Educational Attainment | Male Income | Female Income |
| Less than High School | - | - |
| High School Diploma | $59,922 | $24,839 |
| College or Associate's Degree | $75,000 | $41,989 |
| Bachelor's Degree | $74,000 | $74,167 |
| Graduate Degree | $227,750 | $26,636 |
| Total | $74,076 | $30,764 |
Family Income in Banks
Family Income Brackets in Banks
According to the Banks family income data, there are 177 families falling into the $100,000 to $149,999 income range, which is the most common income bracket and makes up 34.0% of all families.
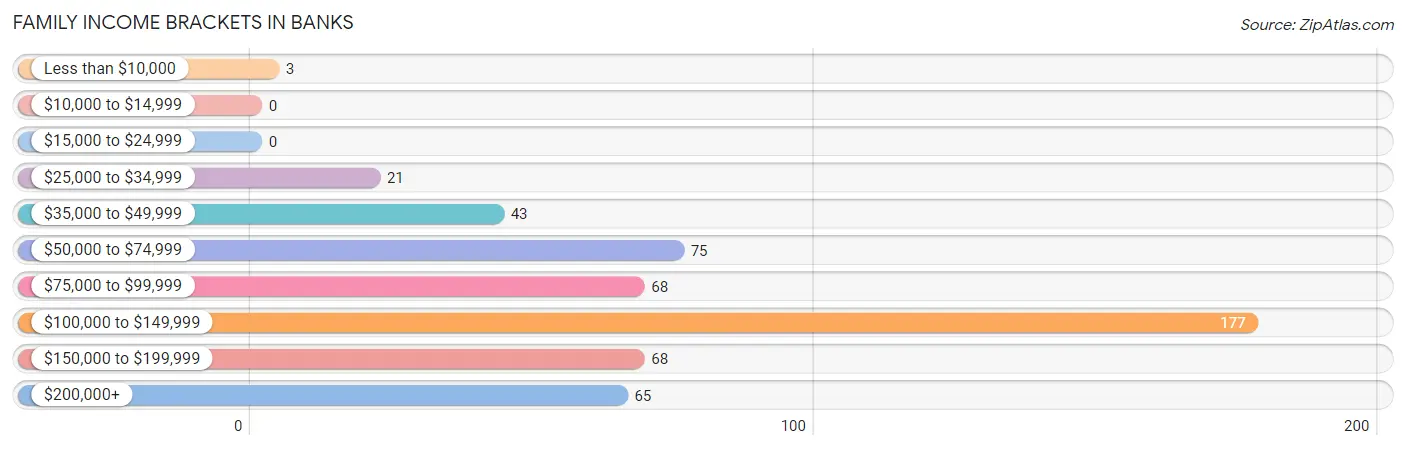
| Income Bracket | # Families | % Families |
| Less than $10,000 | 3 | 0.6% |
| $10,000 to $14,999 | 0 | 0.0% |
| $15,000 to $24,999 | 0 | 0.0% |
| $25,000 to $34,999 | 21 | 4.0% |
| $35,000 to $49,999 | 43 | 8.3% |
| $50,000 to $74,999 | 75 | 14.4% |
| $75,000 to $99,999 | 68 | 13.1% |
| $100,000 to $149,999 | 177 | 34.0% |
| $150,000 to $199,999 | 68 | 13.1% |
| $200,000+ | 65 | 12.5% |
Family Income by Famaliy Size in Banks
4-person families (159 | 30.6%) account for the highest median family income in Banks with $122,404 per family, while 2-person families (188 | 36.1%) have the highest median income of $57,500 per family member.
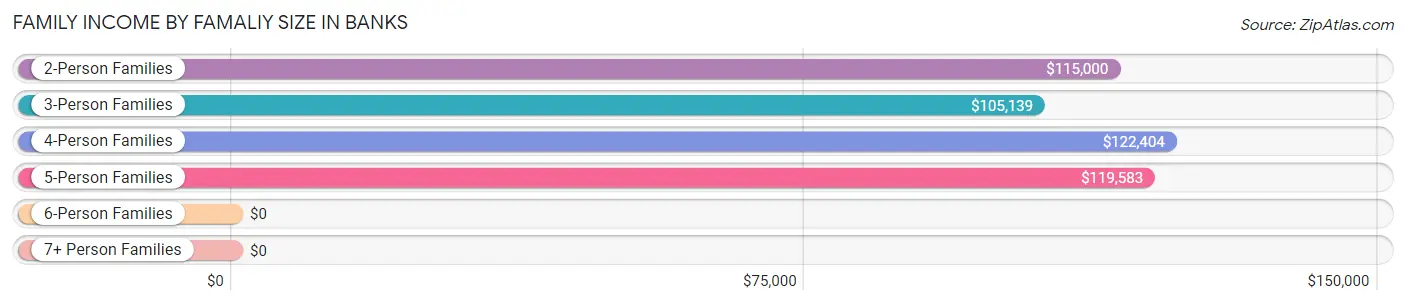
| Income Bracket | # Families | Median Income |
| 2-Person Families | 188 (36.1%) | $115,000 |
| 3-Person Families | 97 (18.6%) | $105,139 |
| 4-Person Families | 159 (30.6%) | $122,404 |
| 5-Person Families | 55 (10.6%) | $119,583 |
| 6-Person Families | 14 (2.7%) | $0 |
| 7+ Person Families | 7 (1.3%) | $0 |
| Total | 520 (100.0%) | $118,750 |
Family Income by Number of Earners in Banks
The median family income in Banks is $118,750, with families comprising 2 earners (280) having the highest median family income of $142,083, while families with 1 earner (170) have the lowest median family income of $70,769, accounting for 53.8% and 32.7% of families, respectively.
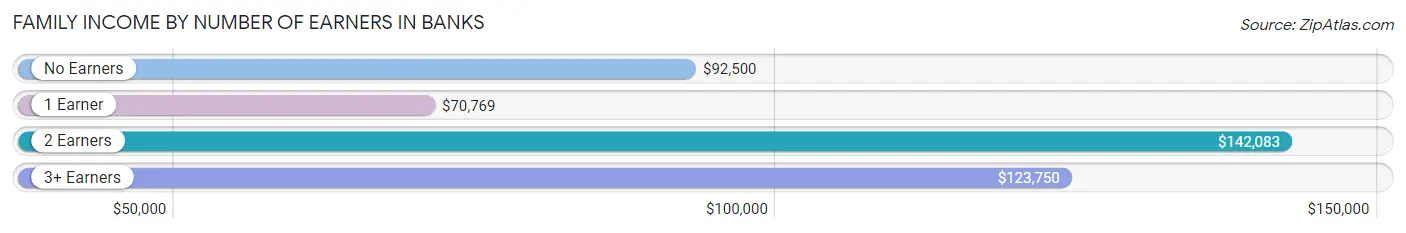
| Number of Earners | # Families | Median Income |
| No Earners | 20 (3.8%) | $92,500 |
| 1 Earner | 170 (32.7%) | $70,769 |
| 2 Earners | 280 (53.8%) | $142,083 |
| 3+ Earners | 50 (9.6%) | $123,750 |
| Total | 520 (100.0%) | $118,750 |
Household Income in Banks
Household Income Brackets in Banks
With 195 households falling in the category, the $75,000 to $99,999 income range is the most frequent in Banks, accounting for 25.7% of all households. In contrast, only 3 households (0.4%) fall into the less than $10,000 income bracket, making it the least populous group.
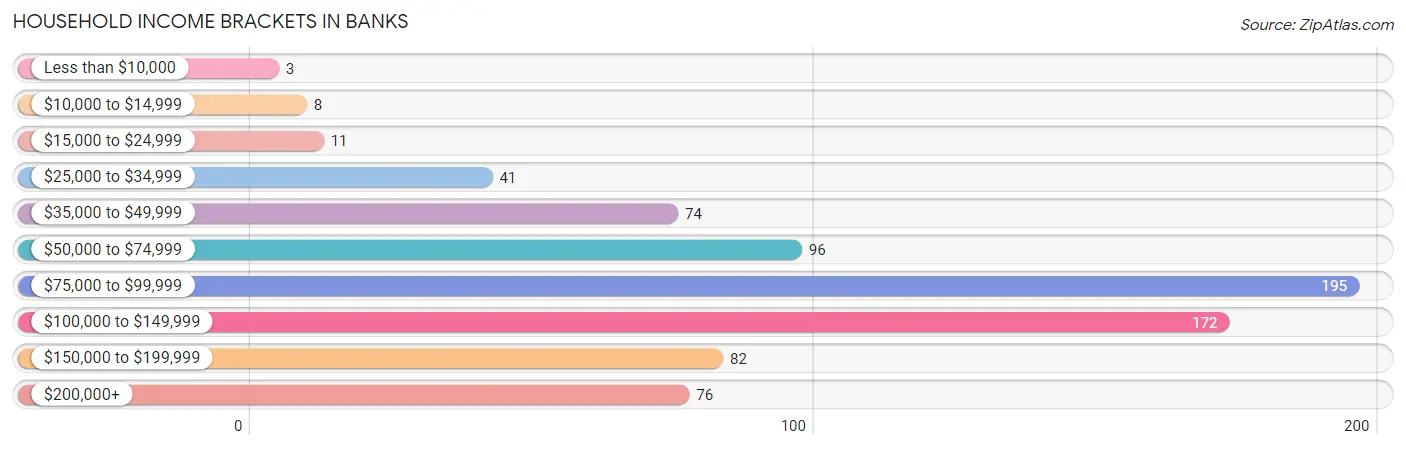
| Income Bracket | # Households | % Households |
| Less than $10,000 | 3 | 0.4% |
| $10,000 to $14,999 | 8 | 1.1% |
| $15,000 to $24,999 | 11 | 1.5% |
| $25,000 to $34,999 | 41 | 5.4% |
| $35,000 to $49,999 | 74 | 9.8% |
| $50,000 to $74,999 | 96 | 12.7% |
| $75,000 to $99,999 | 195 | 25.7% |
| $100,000 to $149,999 | 172 | 22.7% |
| $150,000 to $199,999 | 82 | 10.8% |
| $200,000+ | 76 | 10.0% |
Household Income by Householder Age in Banks
The median household income in Banks is $82,708, with the highest median household income of $103,958 found in the 25 to 44 years age bracket for the primary householder. A total of 341 households (45.0%) fall into this category. Meanwhile, the 65+ years age bracket for the primary householder has the lowest median household income of $78,750, with 76 households (10.0%) in this group.
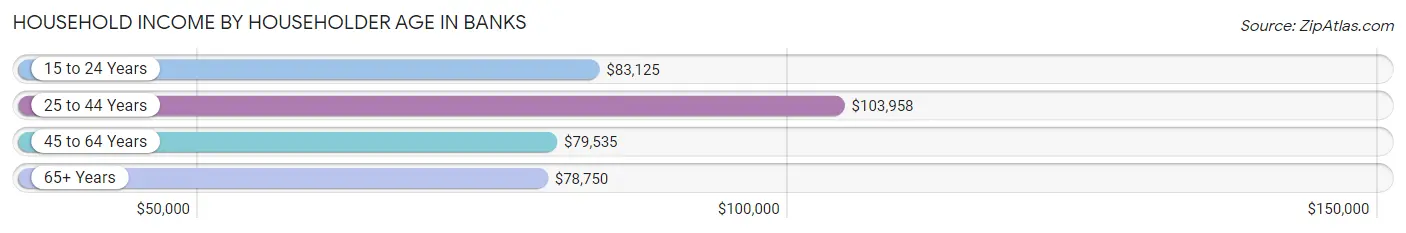
| Income Bracket | # Households | Median Income |
| 15 to 24 Years | 12 (1.6%) | $83,125 |
| 25 to 44 Years | 341 (45.0%) | $103,958 |
| 45 to 64 Years | 329 (43.4%) | $79,535 |
| 65+ Years | 76 (10.0%) | $78,750 |
| Total | 758 (100.0%) | $82,708 |
Poverty in Banks
Income Below Poverty by Sex and Age in Banks
With 6.9% poverty level for males and 5.5% for females among the residents of Banks, under 5 year old males and under 5 year old females are the most vulnerable to poverty, with 35 males (34.0%) and 19 females (25.0%) in their respective age groups living below the poverty level.
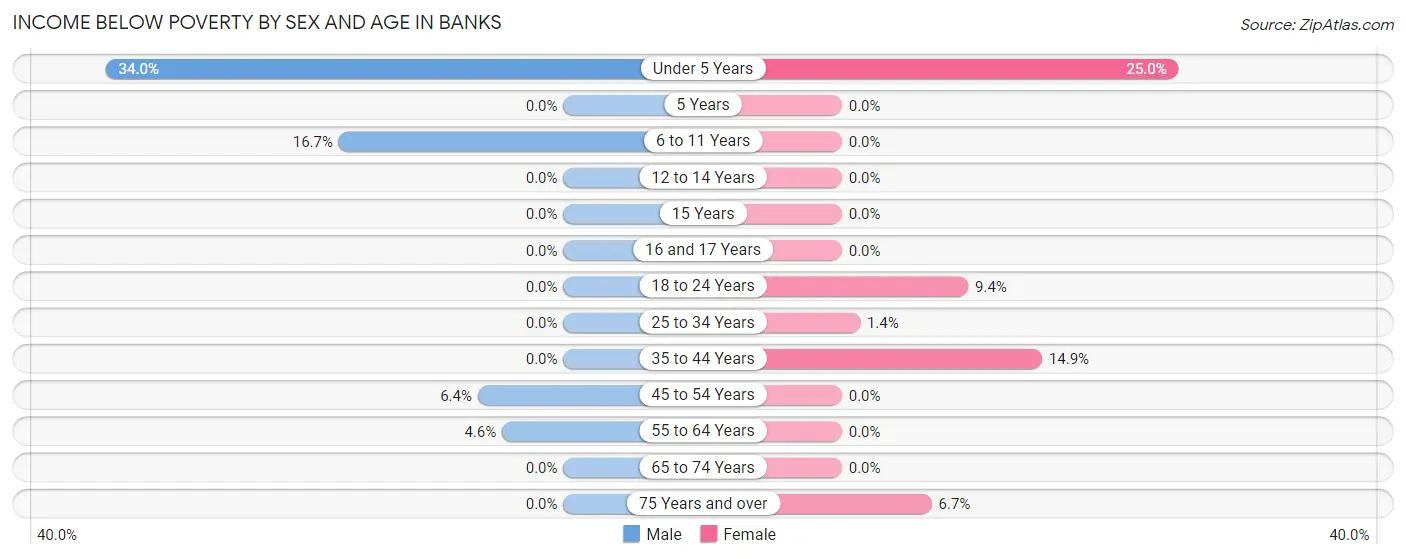
| Age Bracket | Male | Female |
| Under 5 Years | 35 (34.0%) | 19 (25.0%) |
| 5 Years | 0 (0.0%) | 0 (0.0%) |
| 6 to 11 Years | 19 (16.7%) | 0 (0.0%) |
| 12 to 14 Years | 0 (0.0%) | 0 (0.0%) |
| 15 Years | 0 (0.0%) | 0 (0.0%) |
| 16 and 17 Years | 0 (0.0%) | 0 (0.0%) |
| 18 to 24 Years | 0 (0.0%) | 12 (9.4%) |
| 25 to 34 Years | 0 (0.0%) | 2 (1.3%) |
| 35 to 44 Years | 0 (0.0%) | 26 (14.9%) |
| 45 to 54 Years | 8 (6.4%) | 0 (0.0%) |
| 55 to 64 Years | 3 (4.5%) | 0 (0.0%) |
| 65 to 74 Years | 0 (0.0%) | 0 (0.0%) |
| 75 Years and over | 0 (0.0%) | 2 (6.7%) |
| Total | 65 (6.9%) | 61 (5.5%) |
Income Above Poverty by Sex and Age in Banks
According to the poverty statistics in Banks, males aged 5 years and females aged 5 years are the age groups that are most secure financially, with 100.0% of males and 100.0% of females in these age groups living above the poverty line.
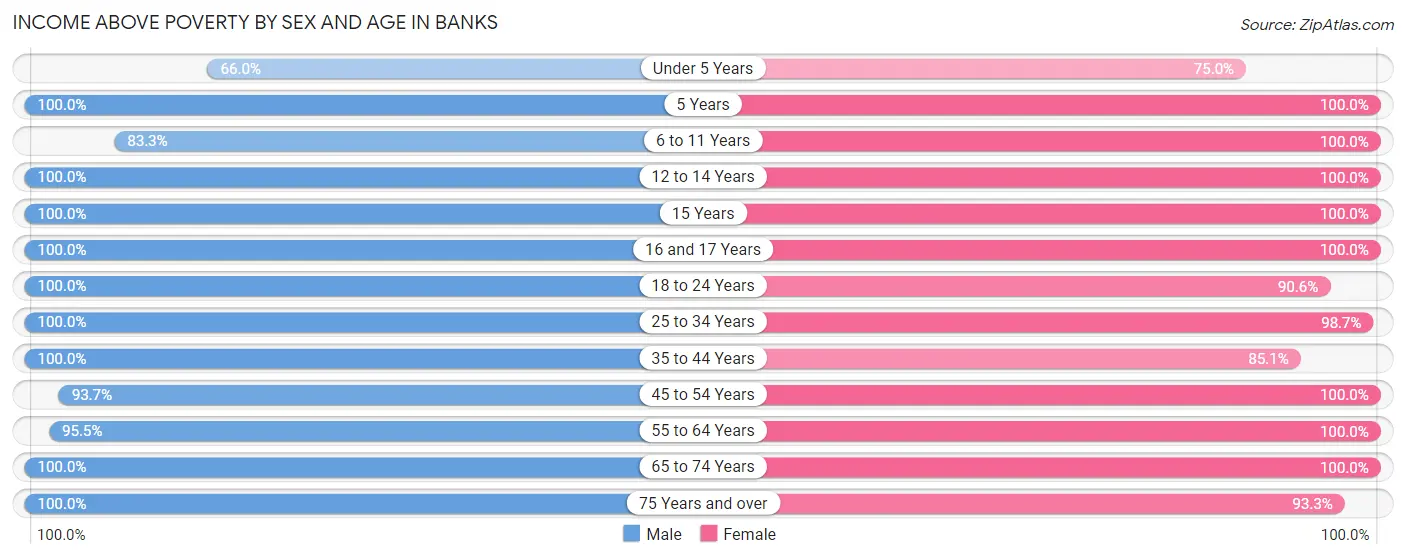
| Age Bracket | Male | Female |
| Under 5 Years | 68 (66.0%) | 57 (75.0%) |
| 5 Years | 16 (100.0%) | 8 (100.0%) |
| 6 to 11 Years | 95 (83.3%) | 80 (100.0%) |
| 12 to 14 Years | 29 (100.0%) | 73 (100.0%) |
| 15 Years | 34 (100.0%) | 19 (100.0%) |
| 16 and 17 Years | 20 (100.0%) | 16 (100.0%) |
| 18 to 24 Years | 57 (100.0%) | 116 (90.6%) |
| 25 to 34 Years | 106 (100.0%) | 146 (98.7%) |
| 35 to 44 Years | 213 (100.0%) | 149 (85.1%) |
| 45 to 54 Years | 118 (93.6%) | 115 (100.0%) |
| 55 to 64 Years | 63 (95.5%) | 195 (100.0%) |
| 65 to 74 Years | 45 (100.0%) | 44 (100.0%) |
| 75 Years and over | 8 (100.0%) | 28 (93.3%) |
| Total | 872 (93.1%) | 1,046 (94.5%) |
Income Below Poverty Among Married-Couple Families in Banks
The poverty statistics for married-couple families in Banks show that 0.8% or 3 of the total 366 families live below the poverty line. Families with no children have the highest poverty rate of 1.9%, comprising of 3 families. On the other hand, families with 1 or 2 children have the lowest poverty rate of 0.0%, which includes 0 families.
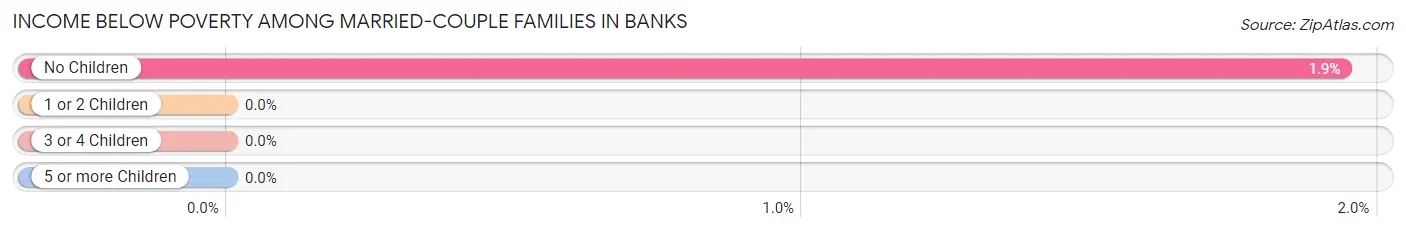
| Children | Above Poverty | Below Poverty |
| No Children | 152 (98.1%) | 3 (1.9%) |
| 1 or 2 Children | 174 (100.0%) | 0 (0.0%) |
| 3 or 4 Children | 37 (100.0%) | 0 (0.0%) |
| 5 or more Children | 0 (0.0%) | 0 (0.0%) |
| Total | 363 (99.2%) | 3 (0.8%) |
Income Below Poverty Among Single-Parent Households in Banks
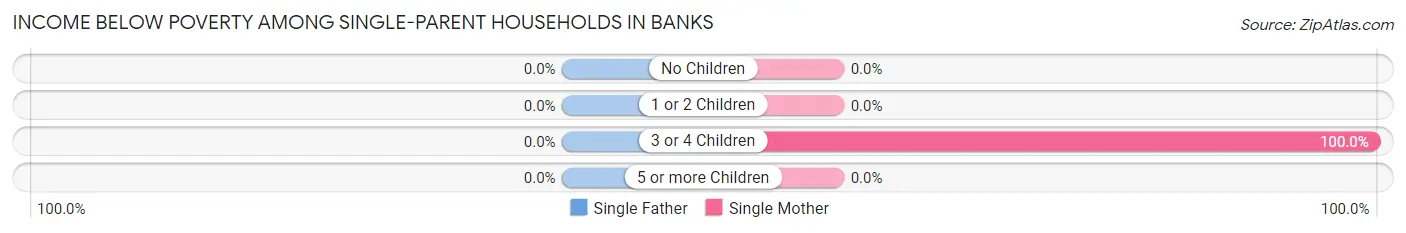
| Children | Single Father | Single Mother |
| No Children | 0 (0.0%) | 0 (0.0%) |
| 1 or 2 Children | 0 (0.0%) | 0 (0.0%) |
| 3 or 4 Children | 0 (0.0%) | 21 (100.0%) |
| 5 or more Children | 0 (0.0%) | 0 (0.0%) |
| Total | 0 (0.0%) | 21 (23.1%) |
Income Below Poverty Among Married-Couple vs Single-Parent Households in Banks
The poverty data for Banks shows that 3 of the married-couple family households (0.8%) and 21 of the single-parent households (13.6%) are living below the poverty level. Within the married-couple family households, those with no children have the highest poverty rate, with 3 households (1.9%) falling below the poverty line. Among the single-parent households, those with 3 or 4 children have the highest poverty rate, with 21 household (100.0%) living below poverty.
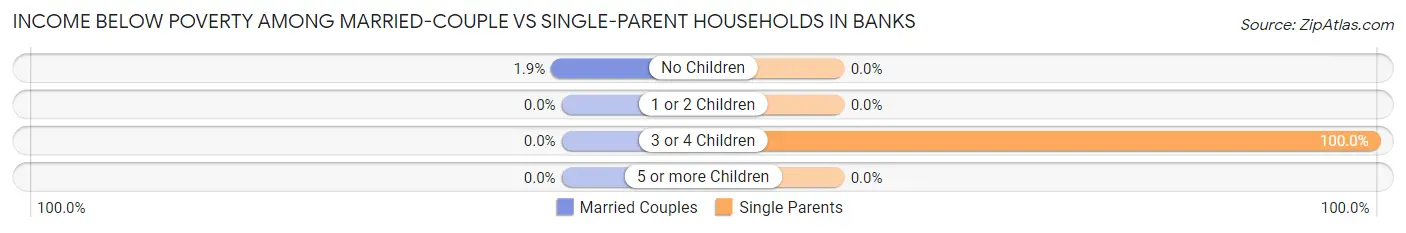
| Children | Married-Couple Families | Single-Parent Households |
| No Children | 3 (1.9%) | 0 (0.0%) |
| 1 or 2 Children | 0 (0.0%) | 0 (0.0%) |
| 3 or 4 Children | 0 (0.0%) | 21 (100.0%) |
| 5 or more Children | 0 (0.0%) | 0 (0.0%) |
| Total | 3 (0.8%) | 21 (13.6%) |
Race in Banks
The most populous races in Banks are White / Caucasian (1,586 | 77.5%), Two or more Races (262 | 12.8%), and Hispanic or Latino (211 | 10.3%).
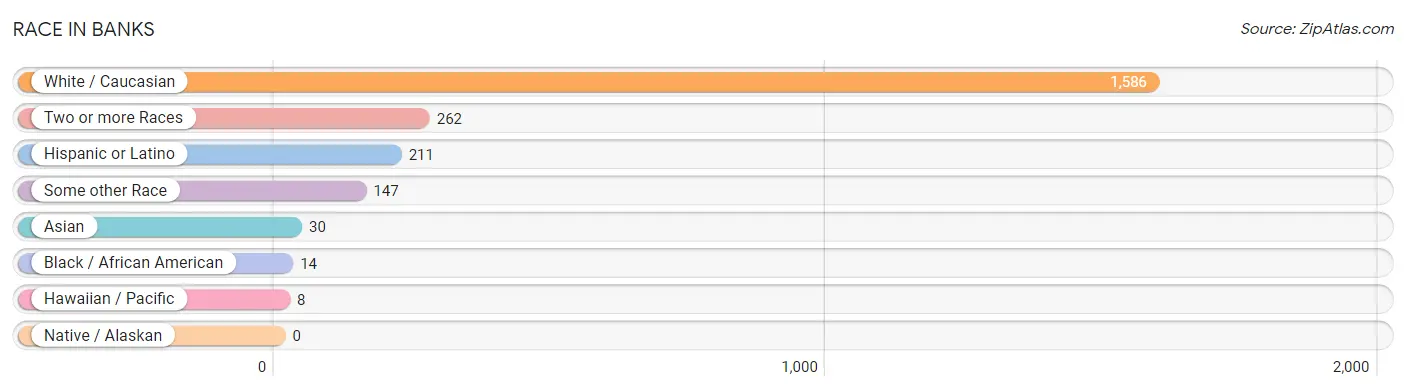
| Race | # Population | % Population |
| Asian | 30 | 1.5% |
| Black / African American | 14 | 0.7% |
| Hawaiian / Pacific | 8 | 0.4% |
| Hispanic or Latino | 211 | 10.3% |
| Native / Alaskan | 0 | 0.0% |
| White / Caucasian | 1,586 | 77.5% |
| Two or more Races | 262 | 12.8% |
| Some other Race | 147 | 7.2% |
| Total | 2,047 | 100.0% |
Ancestry in Banks
The most populous ancestries reported in Banks are Irish (282 | 13.8%), English (245 | 12.0%), German (240 | 11.7%), Mexican (161 | 7.9%), and American (138 | 6.7%), together accounting for 52.1% of all Banks residents.
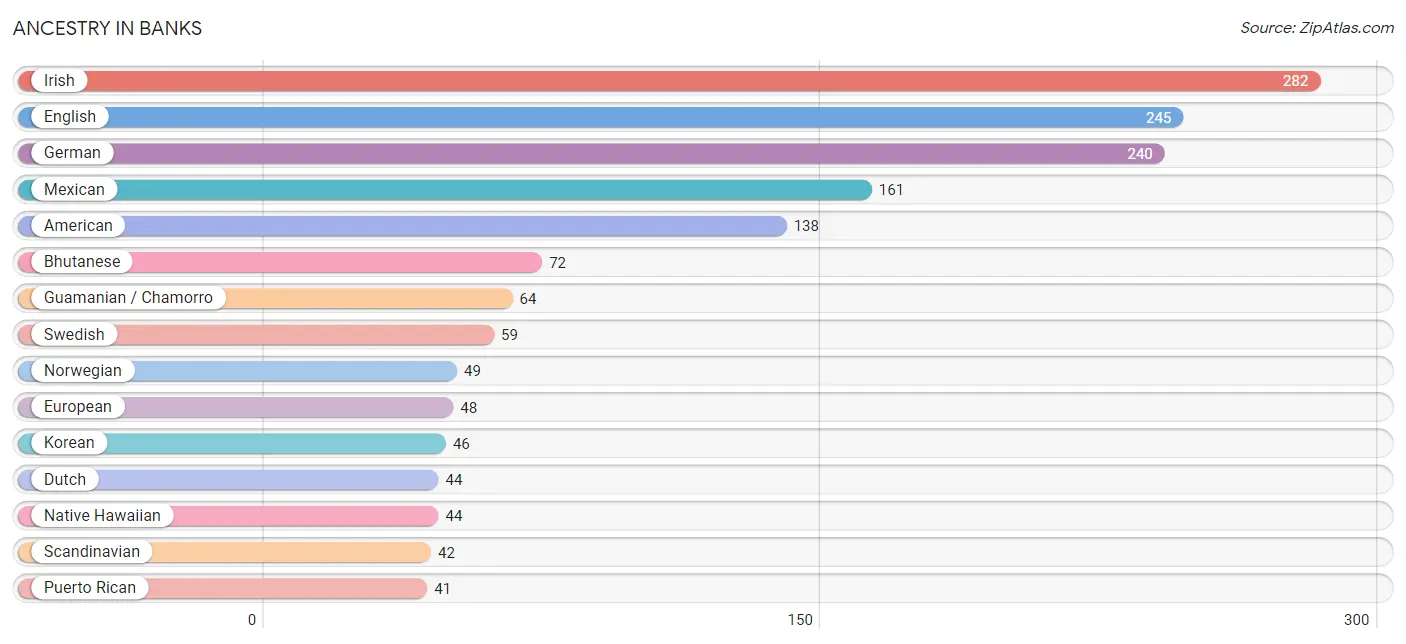
| Ancestry | # Population | % Population |
| American | 138 | 6.7% |
| Apache | 2 | 0.1% |
| Arab | 2 | 0.1% |
| Australian | 3 | 0.2% |
| Bhutanese | 72 | 3.5% |
| British | 6 | 0.3% |
| Burmese | 13 | 0.6% |
| Cherokee | 27 | 1.3% |
| Crow | 2 | 0.1% |
| Czech | 14 | 0.7% |
| Czechoslovakian | 3 | 0.2% |
| Dutch | 44 | 2.1% |
| Eastern European | 7 | 0.3% |
| Ecuadorian | 4 | 0.2% |
| English | 245 | 12.0% |
| European | 48 | 2.3% |
| Fijian | 4 | 0.2% |
| Finnish | 30 | 1.5% |
| French | 24 | 1.2% |
| French Canadian | 4 | 0.2% |
| German | 240 | 11.7% |
| Greek | 7 | 0.3% |
| Guamanian / Chamorro | 64 | 3.1% |
| Hungarian | 2 | 0.1% |
| Indian (Asian) | 27 | 1.3% |
| Iranian | 3 | 0.2% |
| Irish | 282 | 13.8% |
| Italian | 39 | 1.9% |
| Japanese | 5 | 0.2% |
| Korean | 46 | 2.2% |
| Lithuanian | 3 | 0.2% |
| Mexican | 161 | 7.9% |
| Native Hawaiian | 44 | 2.1% |
| Northern European | 9 | 0.4% |
| Norwegian | 49 | 2.4% |
| Osage | 2 | 0.1% |
| Peruvian | 5 | 0.2% |
| Polish | 15 | 0.7% |
| Portuguese | 20 | 1.0% |
| Puerto Rican | 41 | 2.0% |
| Romanian | 2 | 0.1% |
| Russian | 3 | 0.2% |
| Scandinavian | 42 | 2.1% |
| Scotch-Irish | 13 | 0.6% |
| Scottish | 26 | 1.3% |
| Sioux | 27 | 1.3% |
| South American | 9 | 0.4% |
| Sri Lankan | 4 | 0.2% |
| Swedish | 59 | 2.9% |
| Swiss | 15 | 0.7% |
| Ute | 7 | 0.3% |
| Welsh | 13 | 0.6% | View All 52 Rows |
Immigrants in Banks
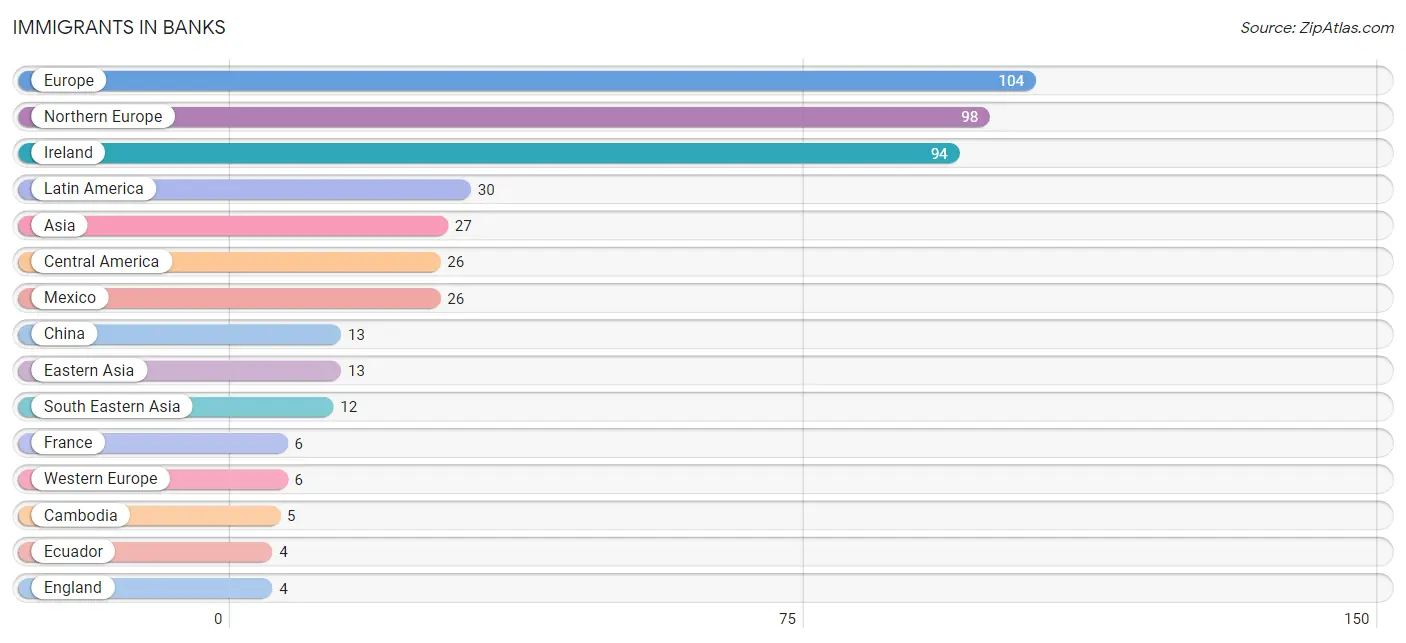
The most numerous immigrant groups reported in Banks came from Europe (104 | 5.1%), Northern Europe (98 | 4.8%), Ireland (94 | 4.6%), Latin America (30 | 1.5%), and Asia (27 | 1.3%), together accounting for 17.2% of all Banks residents.
| Immigration Origin | # Population | % Population |
| Asia | 27 | 1.3% |
| Cambodia | 5 | 0.2% |
| Central America | 26 | 1.3% |
| China | 13 | 0.6% |
| Eastern Asia | 13 | 0.6% |
| Ecuador | 4 | 0.2% |
| England | 4 | 0.2% |
| Europe | 104 | 5.1% |
| France | 6 | 0.3% |
| Iran | 2 | 0.1% |
| Ireland | 94 | 4.6% |
| Latin America | 30 | 1.5% |
| Mexico | 26 | 1.3% |
| Northern Europe | 98 | 4.8% |
| Oceania | 4 | 0.2% |
| Philippines | 3 | 0.2% |
| South America | 4 | 0.2% |
| South Central Asia | 2 | 0.1% |
| South Eastern Asia | 12 | 0.6% |
| Vietnam | 4 | 0.2% |
| Western Europe | 6 | 0.3% | View All 21 Rows |
Sex and Age in Banks
Sex and Age in Banks
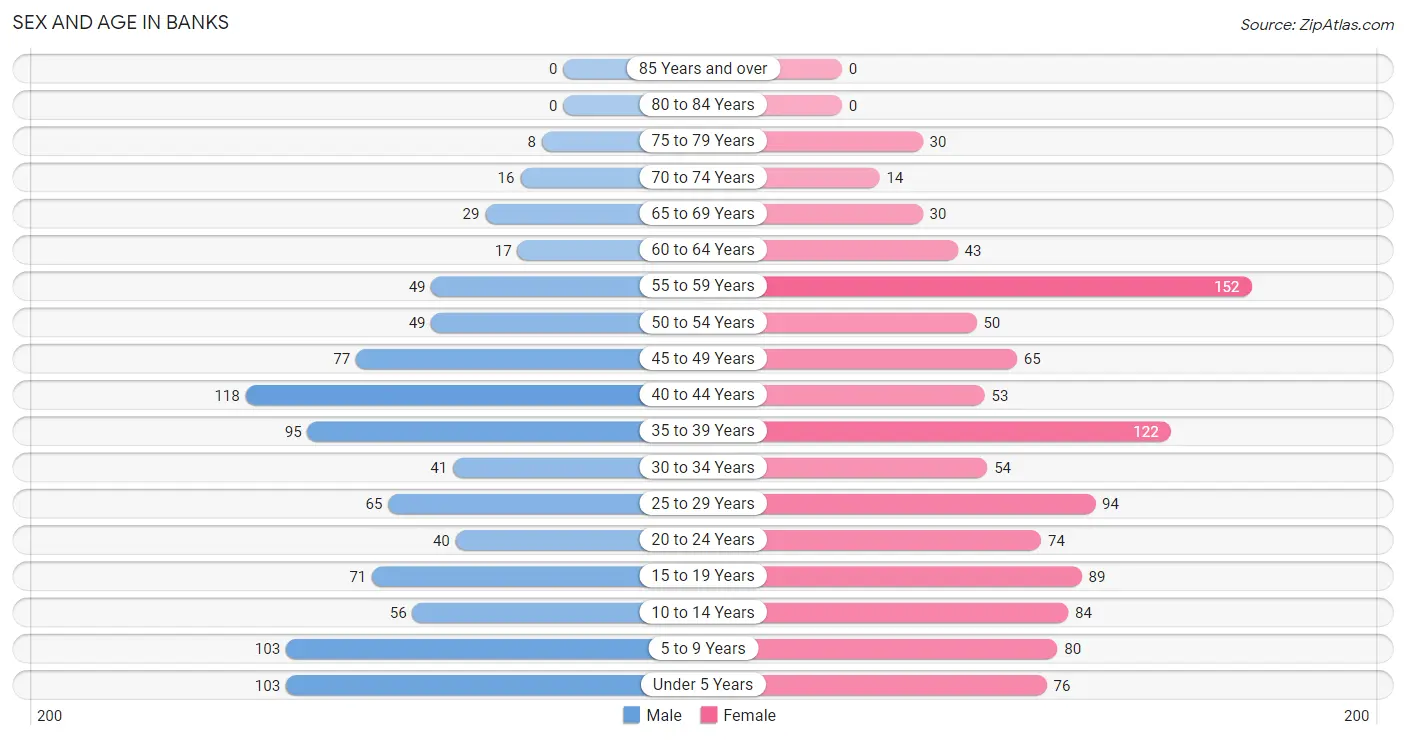
The most populous age groups in Banks are 40 to 44 Years (118 | 12.6%) for men and 55 to 59 Years (152 | 13.7%) for women.
| Age Bracket | Male | Female |
| Under 5 Years | 103 (11.0%) | 76 (6.9%) |
| 5 to 9 Years | 103 (11.0%) | 80 (7.2%) |
| 10 to 14 Years | 56 (6.0%) | 84 (7.6%) |
| 15 to 19 Years | 71 (7.6%) | 89 (8.0%) |
| 20 to 24 Years | 40 (4.3%) | 74 (6.7%) |
| 25 to 29 Years | 65 (6.9%) | 94 (8.5%) |
| 30 to 34 Years | 41 (4.4%) | 54 (4.9%) |
| 35 to 39 Years | 95 (10.1%) | 122 (11.0%) |
| 40 to 44 Years | 118 (12.6%) | 53 (4.8%) |
| 45 to 49 Years | 77 (8.2%) | 65 (5.9%) |
| 50 to 54 Years | 49 (5.2%) | 50 (4.5%) |
| 55 to 59 Years | 49 (5.2%) | 152 (13.7%) |
| 60 to 64 Years | 17 (1.8%) | 43 (3.9%) |
| 65 to 69 Years | 29 (3.1%) | 30 (2.7%) |
| 70 to 74 Years | 16 (1.7%) | 14 (1.3%) |
| 75 to 79 Years | 8 (0.9%) | 30 (2.7%) |
| 80 to 84 Years | 0 (0.0%) | 0 (0.0%) |
| 85 Years and over | 0 (0.0%) | 0 (0.0%) |
| Total | 937 (100.0%) | 1,110 (100.0%) |
Families and Households in Banks
Median Family Size in Banks
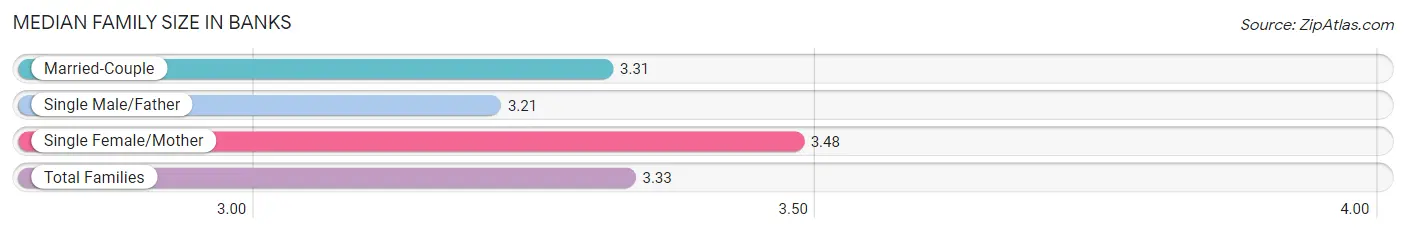
The median family size in Banks is 3.33 persons per family, with single female/mother families (91 | 17.5%) accounting for the largest median family size of 3.48 persons per family. On the other hand, single male/father families (63 | 12.1%) represent the smallest median family size with 3.21 persons per family.
| Family Type | # Families | Family Size |
| Married-Couple | 366 (70.4%) | 3.31 |
| Single Male/Father | 63 (12.1%) | 3.21 |
| Single Female/Mother | 91 (17.5%) | 3.48 |
| Total Families | 520 (100.0%) | 3.33 |
Median Household Size in Banks
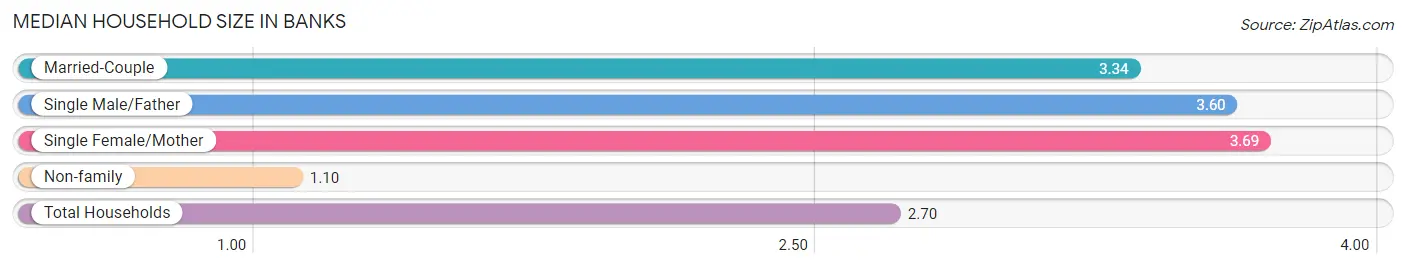
The median household size in Banks is 2.70 persons per household, with single female/mother households (91 | 12.0%) accounting for the largest median household size of 3.69 persons per household. non-family households (238 | 31.4%) represent the smallest median household size with 1.10 persons per household.
| Household Type | # Households | Household Size |
| Married-Couple | 366 (48.3%) | 3.34 |
| Single Male/Father | 63 (8.3%) | 3.60 |
| Single Female/Mother | 91 (12.0%) | 3.69 |
| Non-family | 238 (31.4%) | 1.10 |
| Total Households | 758 (100.0%) | 2.70 |
Household Size by Marriage Status in Banks
Out of a total of 758 households in Banks, 520 (68.6%) are family households, while 238 (31.4%) are nonfamily households. The most numerous type of family households are 4-person households, comprising 169, and the most common type of nonfamily households are 1-person households, comprising 219.
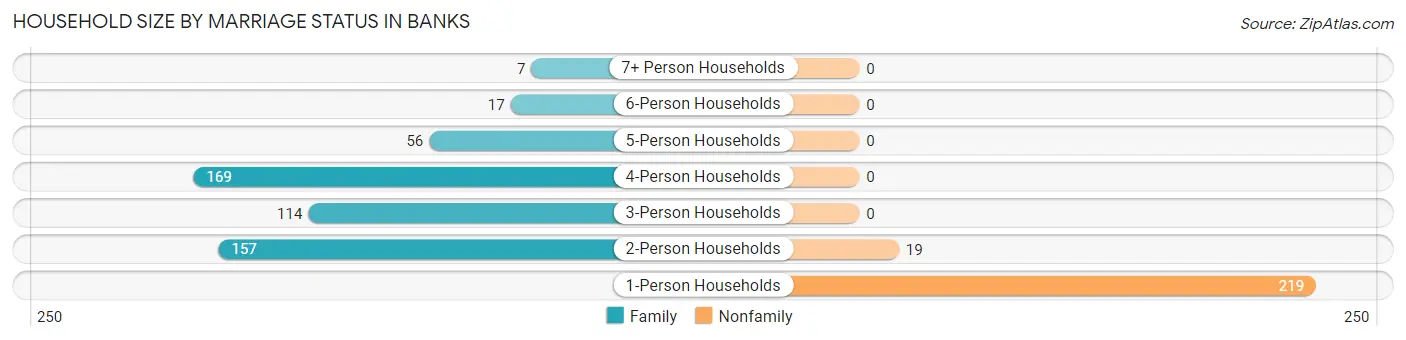
| Household Size | Family Households | Nonfamily Households |
| 1-Person Households | - | 219 (28.9%) |
| 2-Person Households | 157 (20.7%) | 19 (2.5%) |
| 3-Person Households | 114 (15.0%) | 0 (0.0%) |
| 4-Person Households | 169 (22.3%) | 0 (0.0%) |
| 5-Person Households | 56 (7.4%) | 0 (0.0%) |
| 6-Person Households | 17 (2.2%) | 0 (0.0%) |
| 7+ Person Households | 7 (0.9%) | 0 (0.0%) |
| Total | 520 (68.6%) | 238 (31.4%) |
Female Fertility in Banks
Fertility by Age in Banks
Average fertility rate in Banks is 71.0 births per 1,000 women. Women in the age bracket of 20 to 34 years have the highest fertility rate with 185.0 births per 1,000 women. Women in the age bracket of 20 to 34 years acount for 100.0% of all women with births.
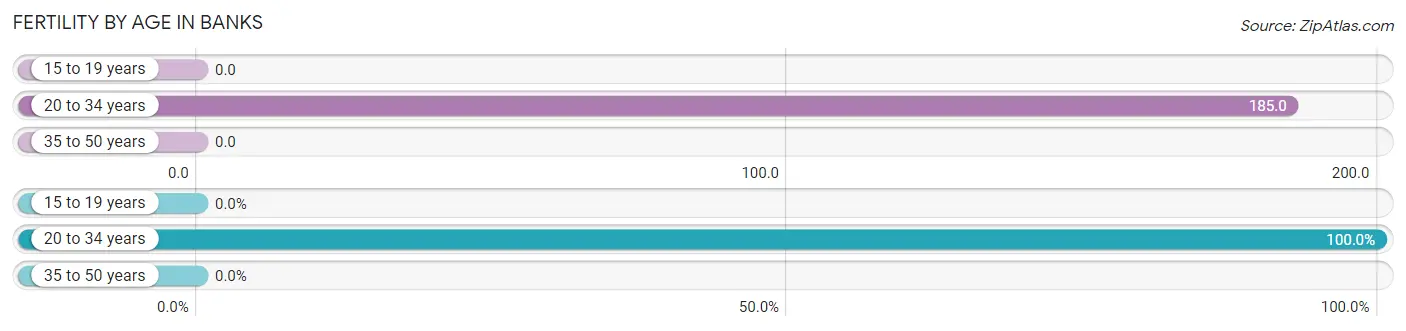
| Age Bracket | Women with Births | Births / 1,000 Women |
| 15 to 19 years | 0 (0.0%) | 0.0 |
| 20 to 34 years | 41 (100.0%) | 185.0 |
| 35 to 50 years | 0 (0.0%) | 0.0 |
| Total | 41 (100.0%) | 71.0 |
Fertility by Age by Marriage Status in Banks
78.0% of women with births (41) in Banks are married. The highest percentage of unmarried women with births falls into 20 to 34 years age bracket with 22.0% of them unmarried at the time of birth, while the lowest percentage of unmarried women with births belong to 20 to 34 years age bracket with 22.0% of them unmarried.
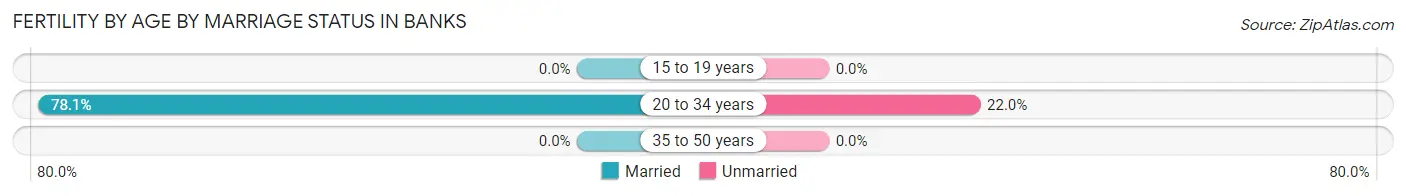
| Age Bracket | Married | Unmarried |
| 15 to 19 years | 0 (0.0%) | 0 (0.0%) |
| 20 to 34 years | 32 (78.0%) | 9 (22.0%) |
| 35 to 50 years | 0 (0.0%) | 0 (0.0%) |
| Total | 32 (78.0%) | 9 (22.0%) |
Fertility by Education in Banks
Average fertility rate in Banks is 71.0 births per 1,000 women. Women with the education attainment of graduate degree have the highest fertility rate of 92.0 births per 1,000 women, while women with the education attainment of bachelor's degree have the lowest fertility at 38.0 births per 1,000 women. Women with the education attainment of college or associate's degree represent 36.6% of all women with births.
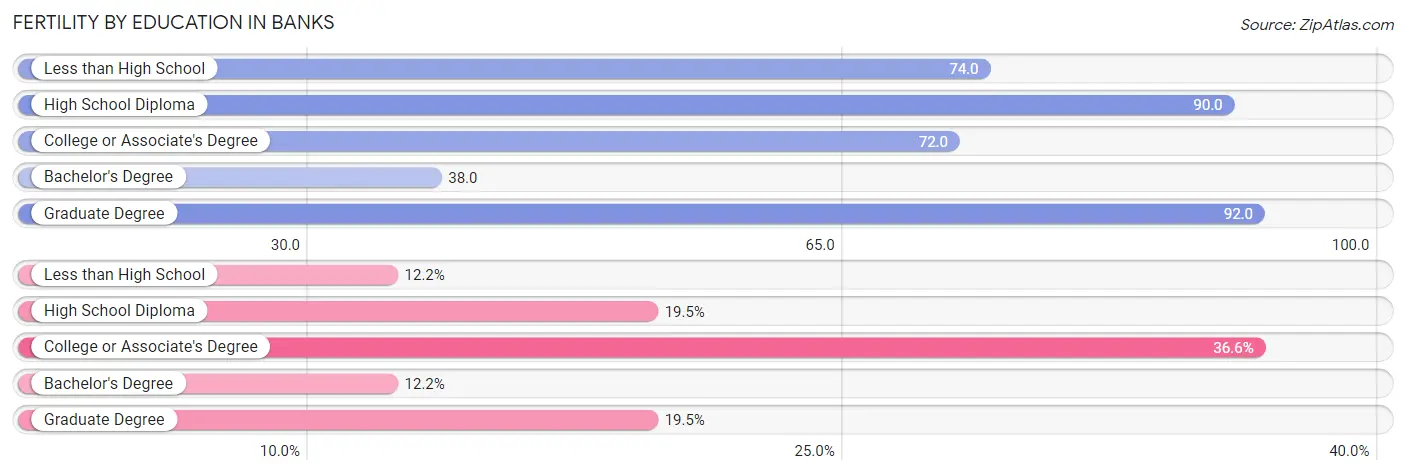
| Educational Attainment | Women with Births | Births / 1,000 Women |
| Less than High School | 5 (12.2%) | 74.0 |
| High School Diploma | 8 (19.5%) | 90.0 |
| College or Associate's Degree | 15 (36.6%) | 72.0 |
| Bachelor's Degree | 5 (12.2%) | 38.0 |
| Graduate Degree | 8 (19.5%) | 92.0 |
| Total | 41 (100.0%) | 71.0 |
Fertility by Education by Marriage Status in Banks
22.0% of women with births in Banks are unmarried. Women with the educational attainment of college or associate's degree are most likely to be married with 100.0% of them married at childbirth, while women with the educational attainment of less than high school are least likely to be married with 100.0% of them unmarried at childbirth.
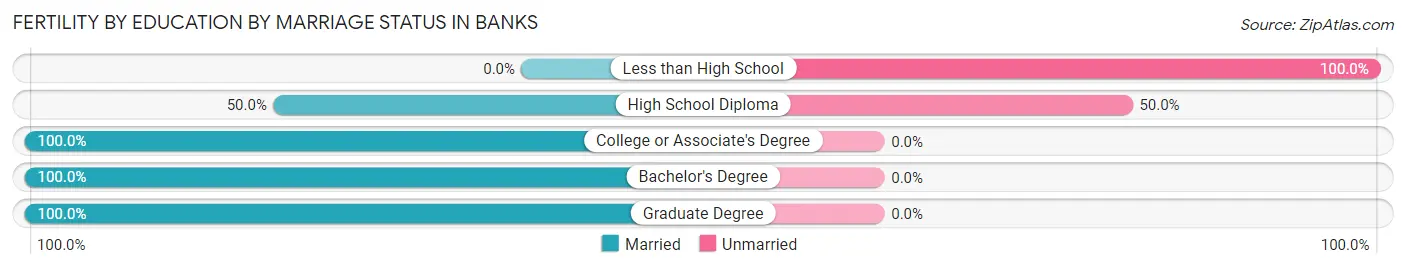
| Educational Attainment | Married | Unmarried |
| Less than High School | 0 (0.0%) | 5 (100.0%) |
| High School Diploma | 4 (50.0%) | 4 (50.0%) |
| College or Associate's Degree | 15 (100.0%) | 0 (0.0%) |
| Bachelor's Degree | 5 (100.0%) | 0 (0.0%) |
| Graduate Degree | 8 (100.0%) | 0 (0.0%) |
| Total | 32 (78.0%) | 9 (22.0%) |
Employment Characteristics in Banks
Employment by Class of Employer in Banks
Among the 1,014 employed individuals in Banks, private company employees (765 | 75.4%), local government employees (99 | 9.8%), and not-for-profit organizations (58 | 5.7%) make up the most common classes of employment.
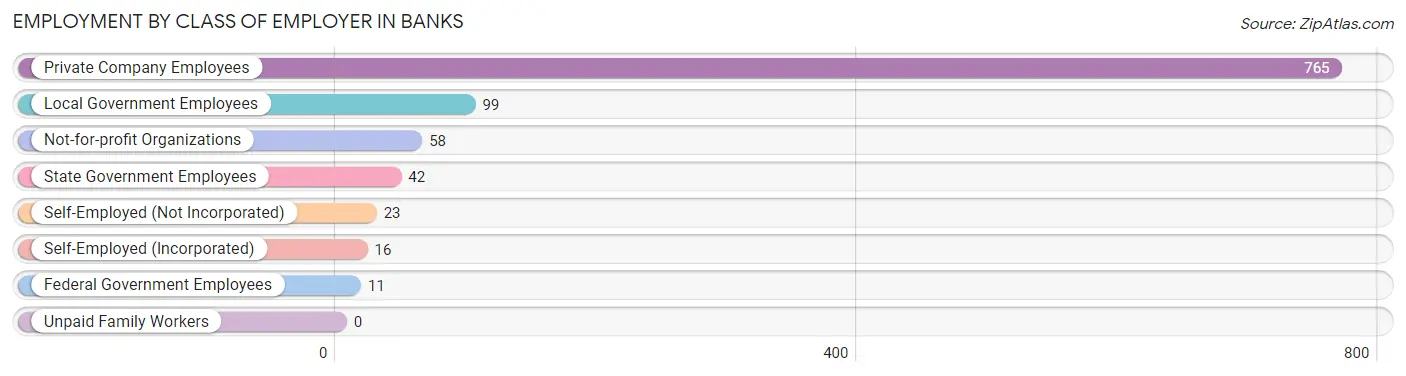
| Employer Class | # Employees | % Employees |
| Private Company Employees | 765 | 75.4% |
| Self-Employed (Incorporated) | 16 | 1.6% |
| Self-Employed (Not Incorporated) | 23 | 2.3% |
| Not-for-profit Organizations | 58 | 5.7% |
| Local Government Employees | 99 | 9.8% |
| State Government Employees | 42 | 4.1% |
| Federal Government Employees | 11 | 1.1% |
| Unpaid Family Workers | 0 | 0.0% |
| Total | 1,014 | 100.0% |
Employment Status by Age in Banks
According to the labor force statistics for Banks, out of the total population over 16 years of age (1,492), 81.5% or 1,216 individuals are in the labor force, with 7.9% or 96 of them unemployed. The age group with the highest labor force participation rate is 25 to 29 years, with 98.1% or 156 individuals in the labor force. Within the labor force, the 16 to 19 years age range has the highest percentage of unemployed individuals, with 47.0% or 31 of them being unemployed.
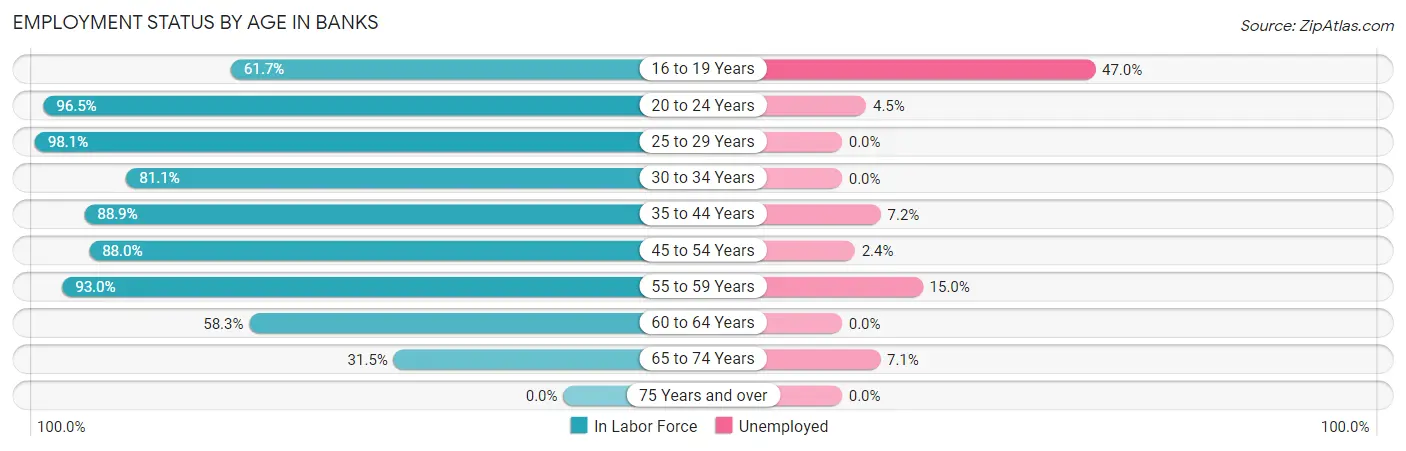
| Age Bracket | In Labor Force | Unemployed |
| 16 to 19 Years | 66 (61.7%) | 31 (47.0%) |
| 20 to 24 Years | 110 (96.5%) | 5 (4.5%) |
| 25 to 29 Years | 156 (98.1%) | 0 (0.0%) |
| 30 to 34 Years | 77 (81.1%) | 0 (0.0%) |
| 35 to 44 Years | 345 (88.9%) | 25 (7.2%) |
| 45 to 54 Years | 212 (88.0%) | 5 (2.4%) |
| 55 to 59 Years | 187 (93.0%) | 28 (15.0%) |
| 60 to 64 Years | 35 (58.3%) | 0 (0.0%) |
| 65 to 74 Years | 28 (31.5%) | 2 (7.1%) |
| 75 Years and over | 0 (0.0%) | 0 (0.0%) |
| Total | 1,216 (81.5%) | 96 (7.9%) |
Employment Status by Educational Attainment in Banks
According to labor force statistics for Banks, 88.5% of individuals (1,012) out of the total population between 25 and 64 years of age (1,144) are in the labor force, with 5.7% or 58 of them being unemployed. The group with the highest labor force participation rate are those with the educational attainment of bachelor's degree or higher, with 92.0% or 391 individuals in the labor force. Within the labor force, individuals with high school diploma education have the highest percentage of unemployment, with 12.8% or 28 of them being unemployed.
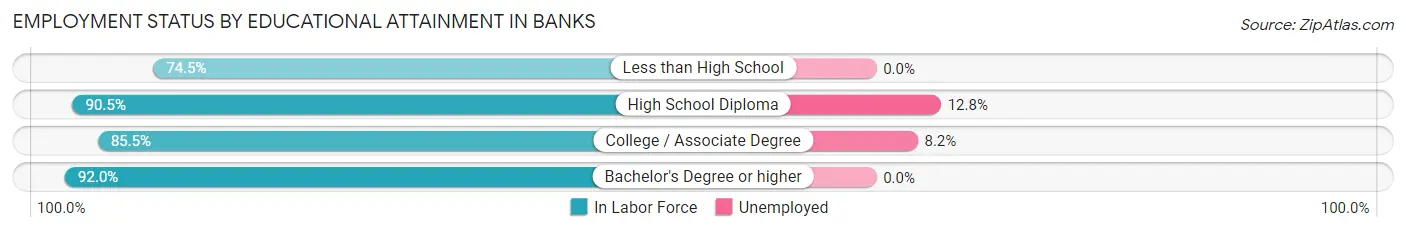
| Educational Attainment | In Labor Force | Unemployed |
| Less than High School | 38 (74.5%) | 0 (0.0%) |
| High School Diploma | 218 (90.5%) | 31 (12.8%) |
| College / Associate Degree | 365 (85.5%) | 35 (8.2%) |
| Bachelor's Degree or higher | 391 (92.0%) | 0 (0.0%) |
| Total | 1,012 (88.5%) | 65 (5.7%) |
Employment Occupations by Sex in Banks
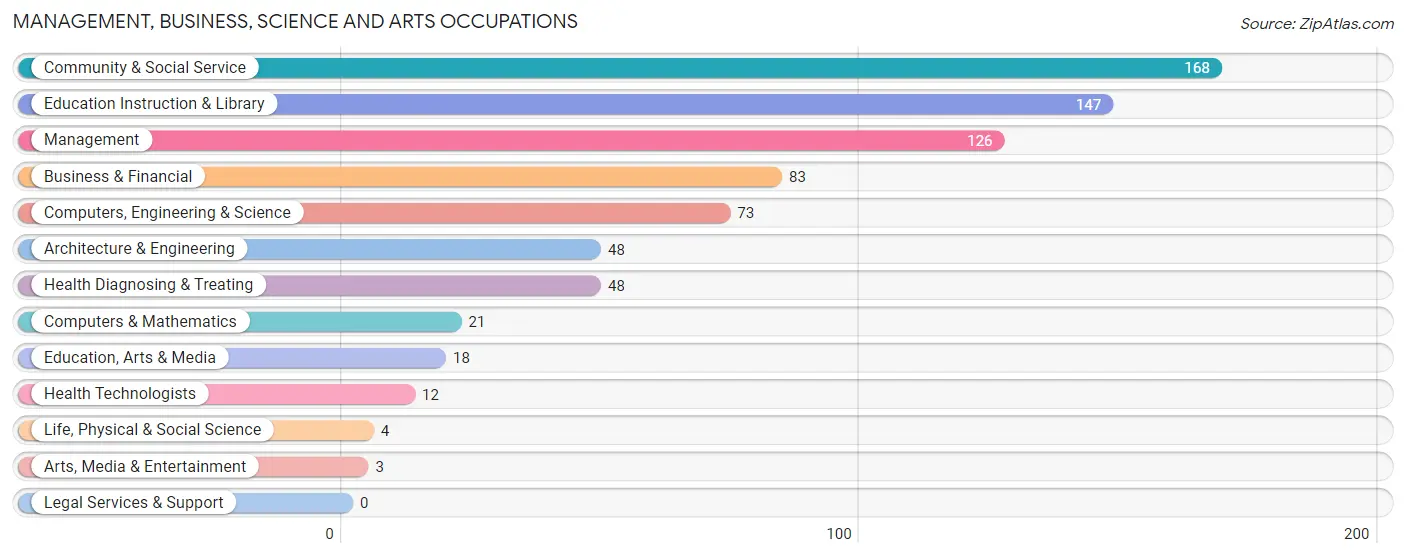
Management, Business, Science and Arts Occupations
The most common Management, Business, Science and Arts occupations in Banks are Community & Social Service (168 | 15.0%), Education Instruction & Library (147 | 13.1%), Management (126 | 11.3%), Business & Financial (83 | 7.4%), and Computers, Engineering & Science (73 | 6.5%).
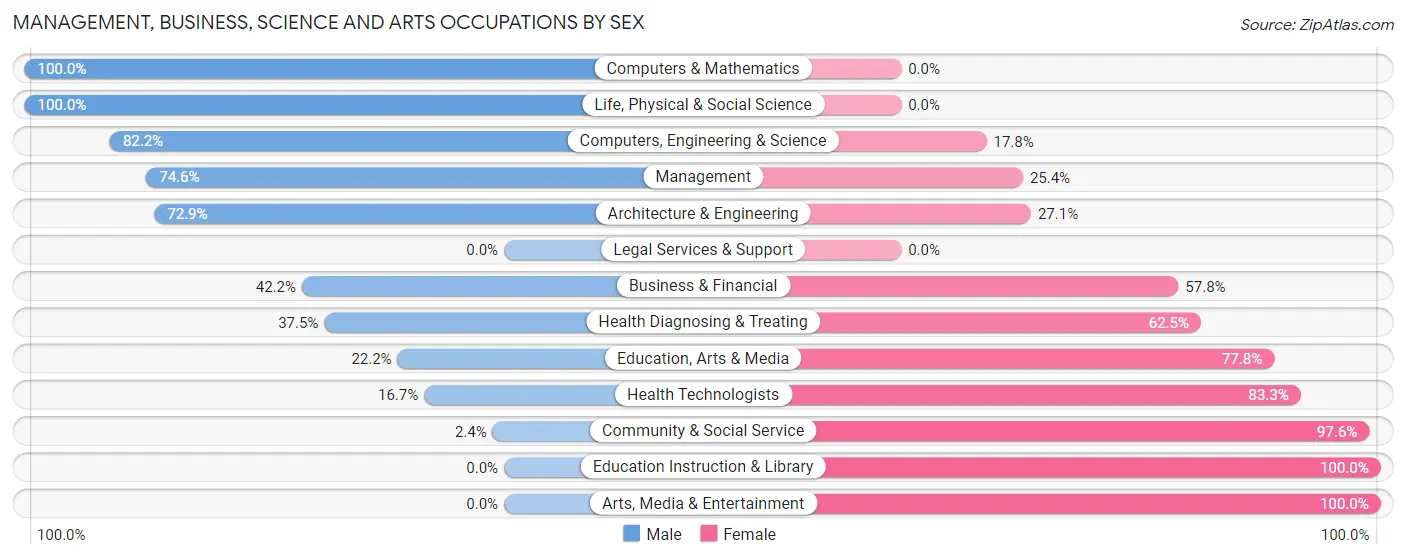
Management, Business, Science and Arts Occupations by Sex
Within the Management, Business, Science and Arts occupations in Banks, the most male-oriented occupations are Computers & Mathematics (100.0%), Life, Physical & Social Science (100.0%), and Computers, Engineering & Science (82.2%), while the most female-oriented occupations are Education Instruction & Library (100.0%), Arts, Media & Entertainment (100.0%), and Community & Social Service (97.6%).
| Occupation | Male | Female |
| Management | 94 (74.6%) | 32 (25.4%) |
| Business & Financial | 35 (42.2%) | 48 (57.8%) |
| Computers, Engineering & Science | 60 (82.2%) | 13 (17.8%) |
| Computers & Mathematics | 21 (100.0%) | 0 (0.0%) |
| Architecture & Engineering | 35 (72.9%) | 13 (27.1%) |
| Life, Physical & Social Science | 4 (100.0%) | 0 (0.0%) |
| Community & Social Service | 4 (2.4%) | 164 (97.6%) |
| Education, Arts & Media | 4 (22.2%) | 14 (77.8%) |
| Legal Services & Support | 0 (0.0%) | 0 (0.0%) |
| Education Instruction & Library | 0 (0.0%) | 147 (100.0%) |
| Arts, Media & Entertainment | 0 (0.0%) | 3 (100.0%) |
| Health Diagnosing & Treating | 18 (37.5%) | 30 (62.5%) |
| Health Technologists | 2 (16.7%) | 10 (83.3%) |
| Total (Category) | 211 (42.4%) | 287 (57.6%) |
| Total (Overall) | 537 (47.9%) | 583 (52.0%) |
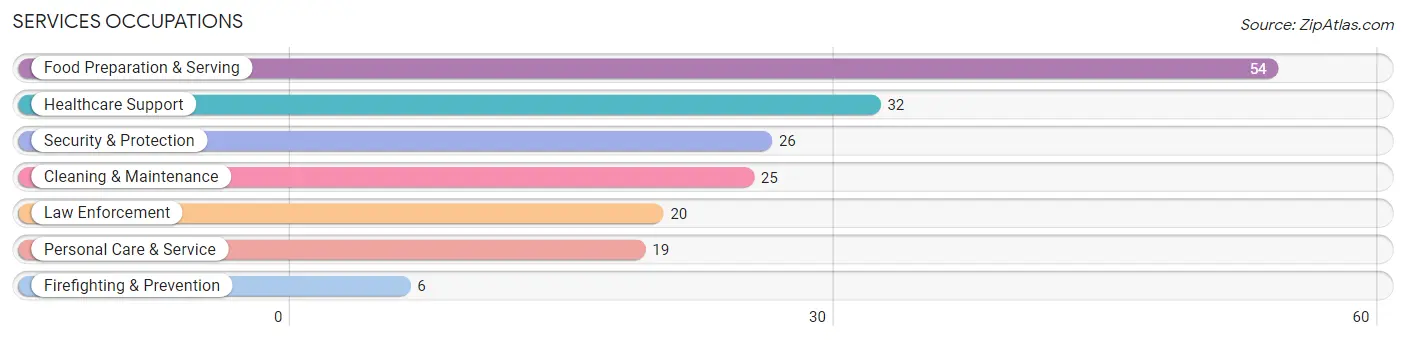
Services Occupations
The most common Services occupations in Banks are Food Preparation & Serving (54 | 4.8%), Healthcare Support (32 | 2.9%), Security & Protection (26 | 2.3%), Cleaning & Maintenance (25 | 2.2%), and Law Enforcement (20 | 1.8%).
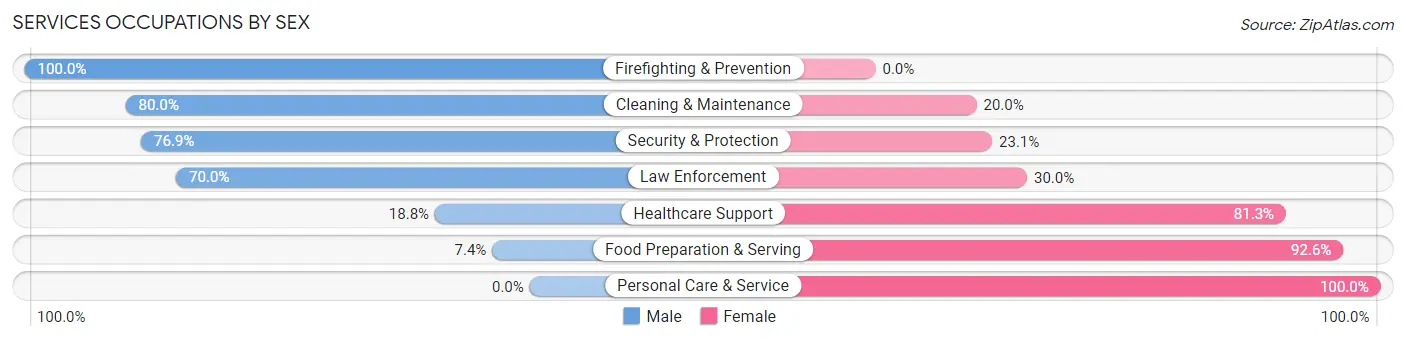
Services Occupations by Sex
Within the Services occupations in Banks, the most male-oriented occupations are Firefighting & Prevention (100.0%), Cleaning & Maintenance (80.0%), and Security & Protection (76.9%), while the most female-oriented occupations are Personal Care & Service (100.0%), Food Preparation & Serving (92.6%), and Healthcare Support (81.2%).
| Occupation | Male | Female |
| Healthcare Support | 6 (18.8%) | 26 (81.2%) |
| Security & Protection | 20 (76.9%) | 6 (23.1%) |
| Firefighting & Prevention | 6 (100.0%) | 0 (0.0%) |
| Law Enforcement | 14 (70.0%) | 6 (30.0%) |
| Food Preparation & Serving | 4 (7.4%) | 50 (92.6%) |
| Cleaning & Maintenance | 20 (80.0%) | 5 (20.0%) |
| Personal Care & Service | 0 (0.0%) | 19 (100.0%) |
| Total (Category) | 50 (32.1%) | 106 (67.9%) |
| Total (Overall) | 537 (47.9%) | 583 (52.0%) |
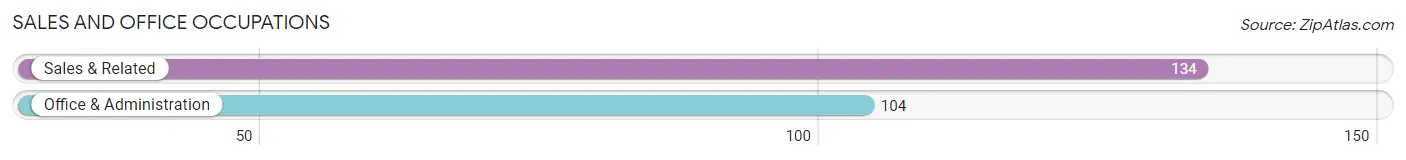
Sales and Office Occupations
The most common Sales and Office occupations in Banks are Sales & Related (134 | 12.0%), and Office & Administration (104 | 9.3%).
Sales and Office Occupations by Sex
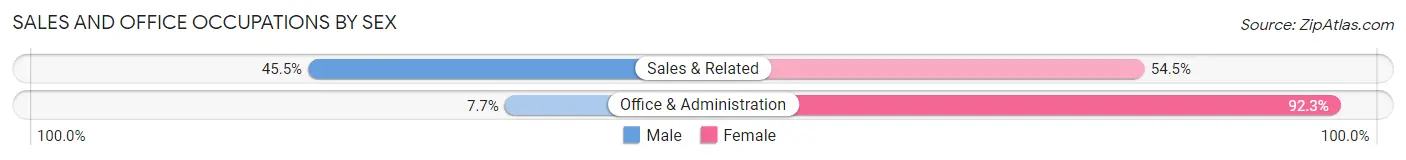
| Occupation | Male | Female |
| Sales & Related | 61 (45.5%) | 73 (54.5%) |
| Office & Administration | 8 (7.7%) | 96 (92.3%) |
| Total (Category) | 69 (29.0%) | 169 (71.0%) |
| Total (Overall) | 537 (47.9%) | 583 (52.0%) |
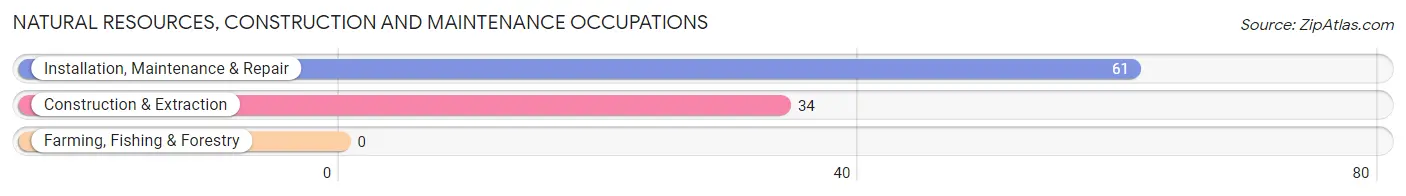
Natural Resources, Construction and Maintenance Occupations
The most common Natural Resources, Construction and Maintenance occupations in Banks are Installation, Maintenance & Repair (61 | 5.4%), and Construction & Extraction (34 | 3.0%).
Natural Resources, Construction and Maintenance Occupations by Sex
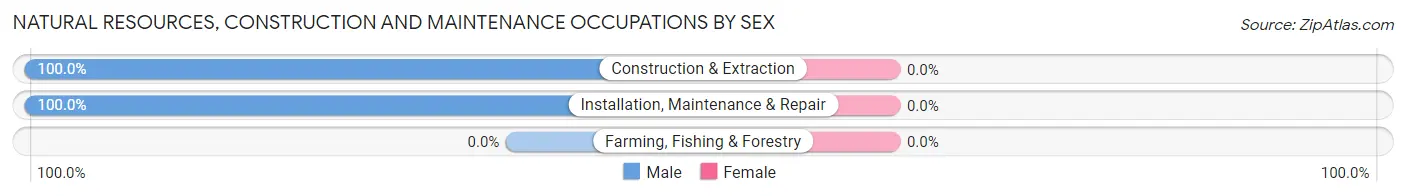
| Occupation | Male | Female |
| Farming, Fishing & Forestry | 0 (0.0%) | 0 (0.0%) |
| Construction & Extraction | 34 (100.0%) | 0 (0.0%) |
| Installation, Maintenance & Repair | 61 (100.0%) | 0 (0.0%) |
| Total (Category) | 95 (100.0%) | 0 (0.0%) |
| Total (Overall) | 537 (47.9%) | 583 (52.0%) |
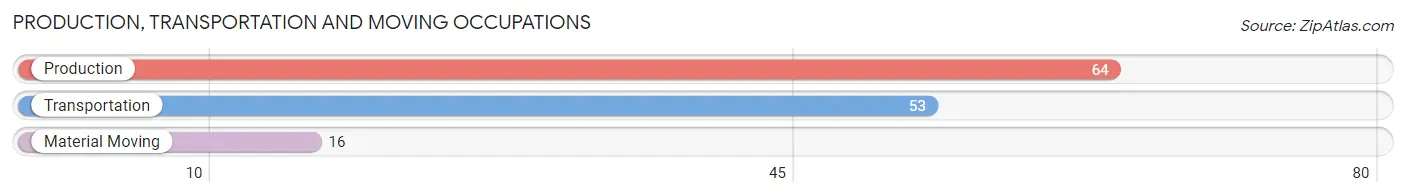
Production, Transportation and Moving Occupations
The most common Production, Transportation and Moving occupations in Banks are Production (64 | 5.7%), Transportation (53 | 4.7%), and Material Moving (16 | 1.4%).
Production, Transportation and Moving Occupations by Sex
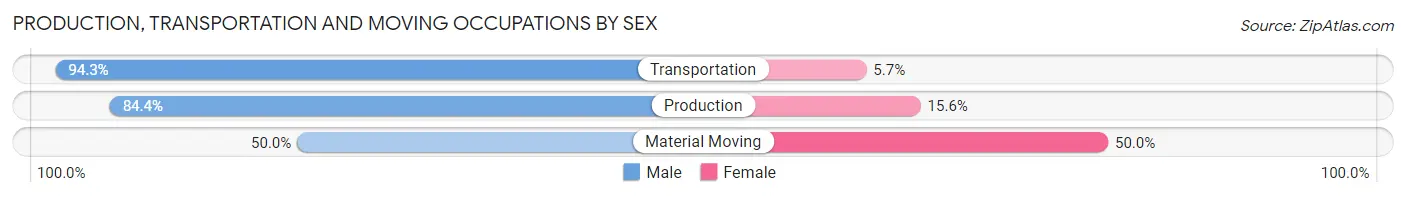
| Occupation | Male | Female |
| Production | 54 (84.4%) | 10 (15.6%) |
| Transportation | 50 (94.3%) | 3 (5.7%) |
| Material Moving | 8 (50.0%) | 8 (50.0%) |
| Total (Category) | 112 (84.2%) | 21 (15.8%) |
| Total (Overall) | 537 (47.9%) | 583 (52.0%) |
Employment Industries by Sex in Banks
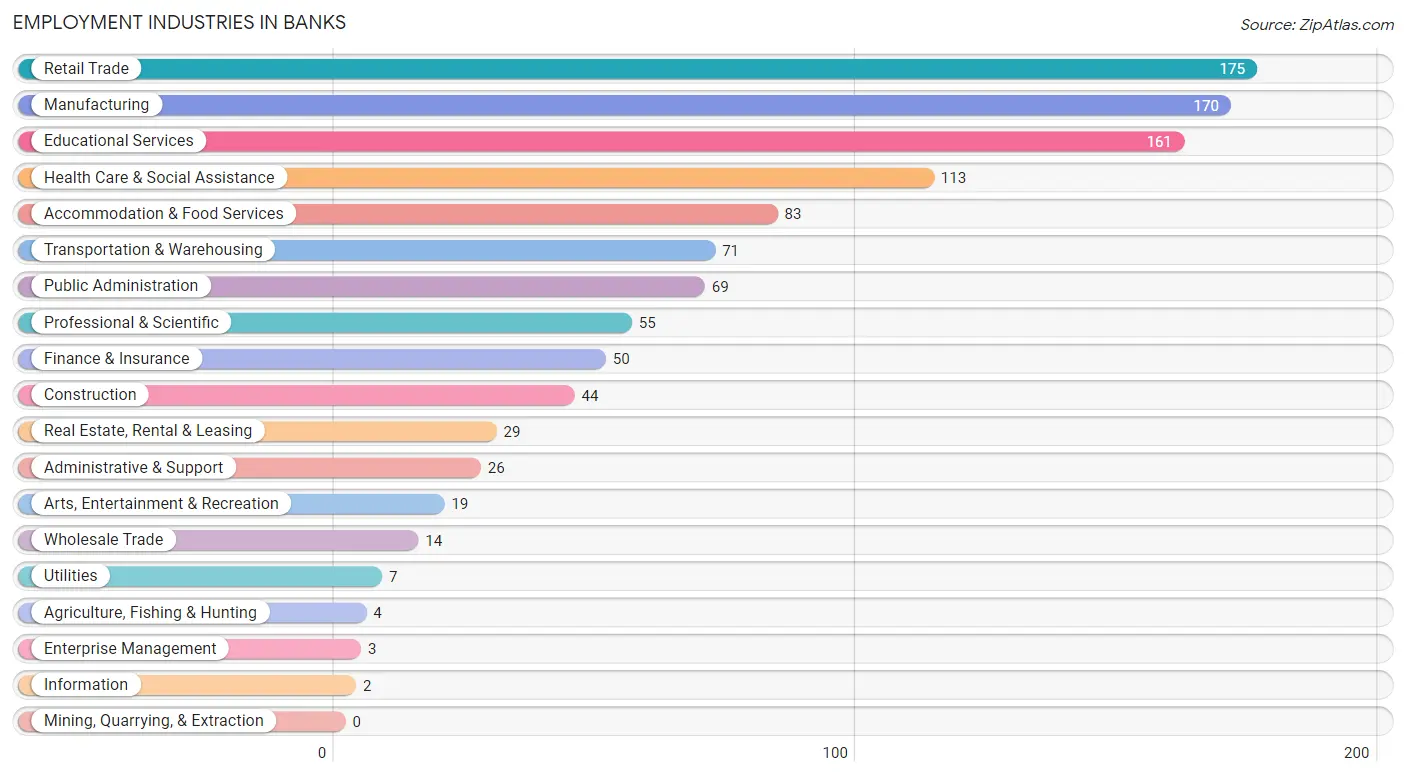
Employment Industries in Banks
The major employment industries in Banks include Retail Trade (175 | 15.6%), Manufacturing (170 | 15.2%), Educational Services (161 | 14.4%), Health Care & Social Assistance (113 | 10.1%), and Accommodation & Food Services (83 | 7.4%).
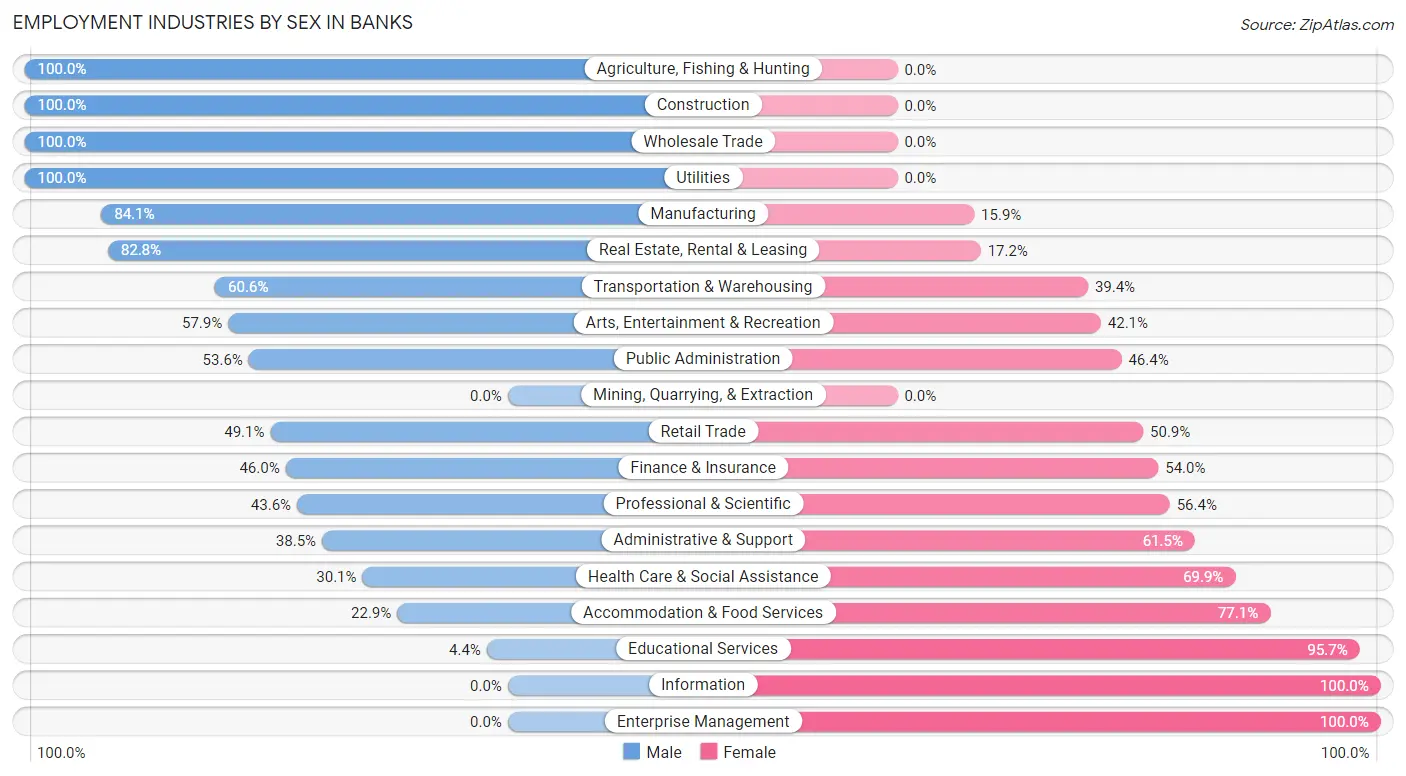
Employment Industries by Sex in Banks
The Banks industries that see more men than women are Agriculture, Fishing & Hunting (100.0%), Construction (100.0%), and Wholesale Trade (100.0%), whereas the industries that tend to have a higher number of women are Information (100.0%), Enterprise Management (100.0%), and Educational Services (95.7%).
| Industry | Male | Female |
| Agriculture, Fishing & Hunting | 4 (100.0%) | 0 (0.0%) |
| Mining, Quarrying, & Extraction | 0 (0.0%) | 0 (0.0%) |
| Construction | 44 (100.0%) | 0 (0.0%) |
| Manufacturing | 143 (84.1%) | 27 (15.9%) |
| Wholesale Trade | 14 (100.0%) | 0 (0.0%) |
| Retail Trade | 86 (49.1%) | 89 (50.9%) |
| Transportation & Warehousing | 43 (60.6%) | 28 (39.4%) |
| Utilities | 7 (100.0%) | 0 (0.0%) |
| Information | 0 (0.0%) | 2 (100.0%) |
| Finance & Insurance | 23 (46.0%) | 27 (54.0%) |
| Real Estate, Rental & Leasing | 24 (82.8%) | 5 (17.2%) |
| Professional & Scientific | 24 (43.6%) | 31 (56.4%) |
| Enterprise Management | 0 (0.0%) | 3 (100.0%) |
| Administrative & Support | 10 (38.5%) | 16 (61.5%) |
| Educational Services | 7 (4.3%) | 154 (95.7%) |
| Health Care & Social Assistance | 34 (30.1%) | 79 (69.9%) |
| Arts, Entertainment & Recreation | 11 (57.9%) | 8 (42.1%) |
| Accommodation & Food Services | 19 (22.9%) | 64 (77.1%) |
| Public Administration | 37 (53.6%) | 32 (46.4%) |
| Total | 537 (47.9%) | 583 (52.0%) |
Education in Banks
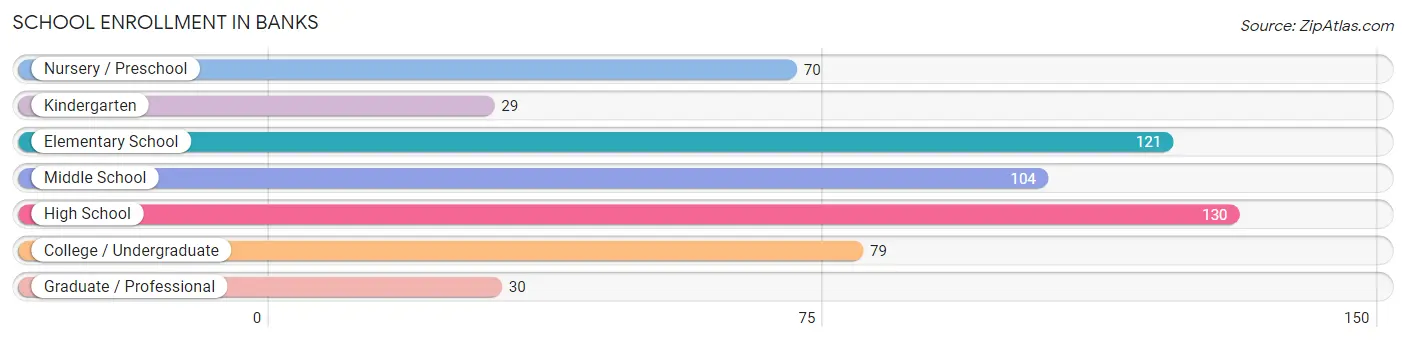
School Enrollment in Banks
The most common levels of schooling among the 563 students in Banks are high school (130 | 23.1%), elementary school (121 | 21.5%), and middle school (104 | 18.5%).
| School Level | # Students | % Students |
| Nursery / Preschool | 70 | 12.4% |
| Kindergarten | 29 | 5.1% |
| Elementary School | 121 | 21.5% |
| Middle School | 104 | 18.5% |
| High School | 130 | 23.1% |
| College / Undergraduate | 79 | 14.0% |
| Graduate / Professional | 30 | 5.3% |
| Total | 563 | 100.0% |
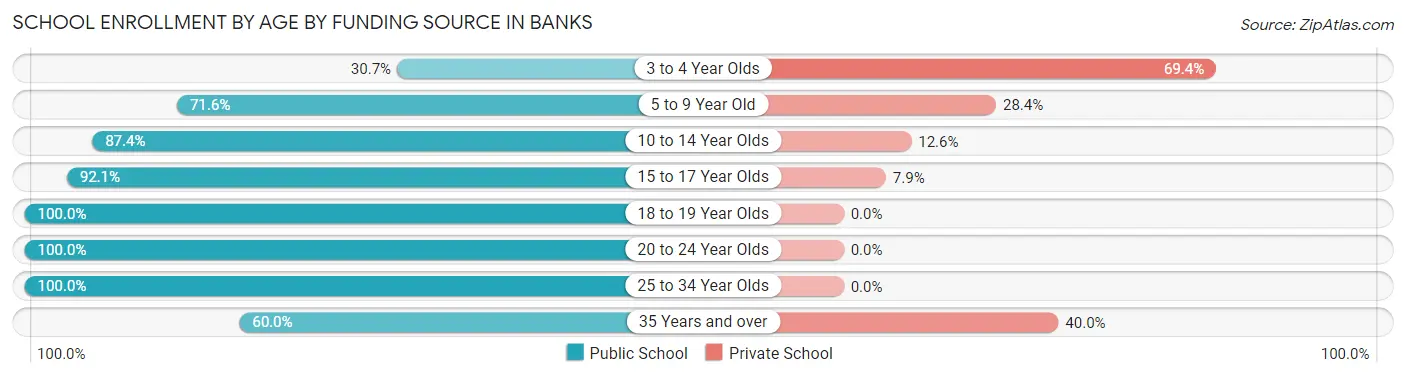
School Enrollment by Age by Funding Source in Banks
Out of a total of 563 students who are enrolled in schools in Banks, 120 (21.3%) attend a private institution, while the remaining 443 (78.7%) are enrolled in public schools. The age group of 3 to 4 year olds has the highest likelihood of being enrolled in private schools, with 43 (69.4% in the age bracket) enrolled. Conversely, the age group of 18 to 19 year olds has the lowest likelihood of being enrolled in a private school, with 39 (100.0% in the age bracket) attending a public institution.
| Age Bracket | Public School | Private School |
| 3 to 4 Year Olds | 19 (30.6%) | 43 (69.4%) |
| 5 to 9 Year Old | 111 (71.6%) | 44 (28.4%) |
| 10 to 14 Year Olds | 111 (87.4%) | 16 (12.6%) |
| 15 to 17 Year Olds | 82 (92.1%) | 7 (7.9%) |
| 18 to 19 Year Olds | 39 (100.0%) | 0 (0.0%) |
| 20 to 24 Year Olds | 30 (100.0%) | 0 (0.0%) |
| 25 to 34 Year Olds | 36 (100.0%) | 0 (0.0%) |
| 35 Years and over | 15 (60.0%) | 10 (40.0%) |
| Total | 443 (78.7%) | 120 (21.3%) |
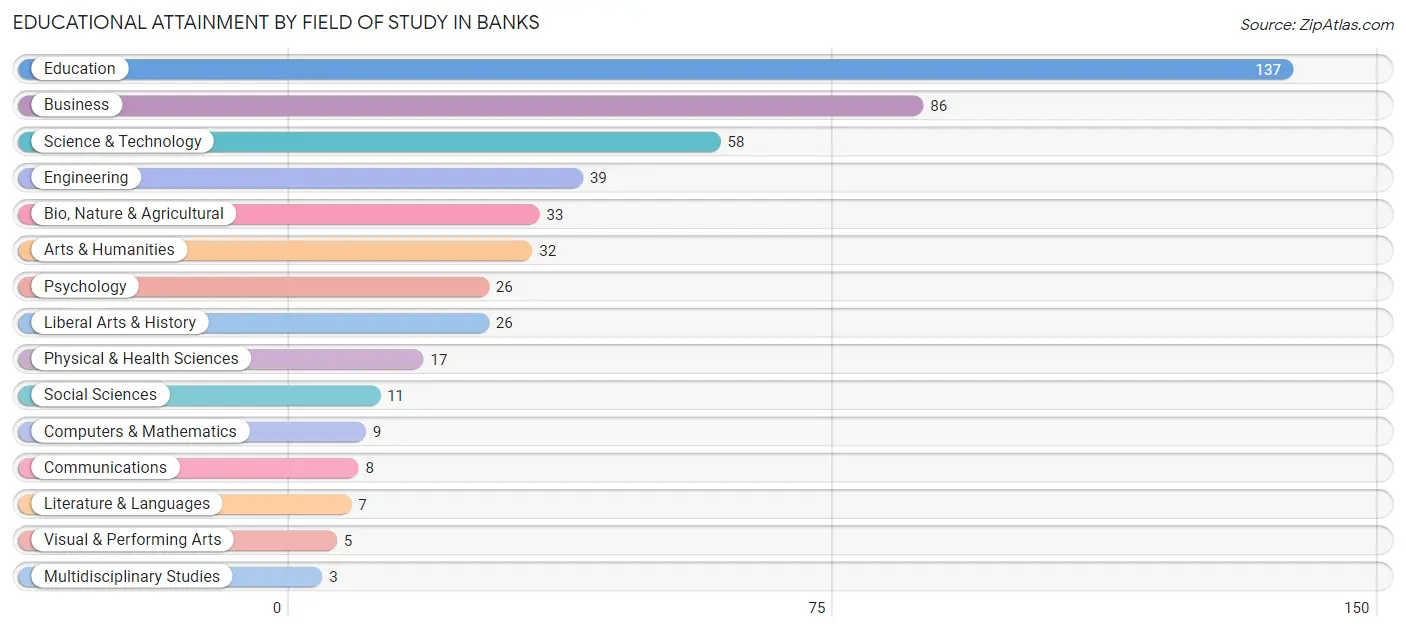
Educational Attainment by Field of Study in Banks
Education (137 | 27.6%), business (86 | 17.3%), science & technology (58 | 11.7%), engineering (39 | 7.9%), and bio, nature & agricultural (33 | 6.6%) are the most common fields of study among 497 individuals in Banks who have obtained a bachelor's degree or higher.
| Field of Study | # Graduates | % Graduates |
| Computers & Mathematics | 9 | 1.8% |
| Bio, Nature & Agricultural | 33 | 6.6% |
| Physical & Health Sciences | 17 | 3.4% |
| Psychology | 26 | 5.2% |
| Social Sciences | 11 | 2.2% |
| Engineering | 39 | 7.9% |
| Multidisciplinary Studies | 3 | 0.6% |
| Science & Technology | 58 | 11.7% |
| Business | 86 | 17.3% |
| Education | 137 | 27.6% |
| Literature & Languages | 7 | 1.4% |
| Liberal Arts & History | 26 | 5.2% |
| Visual & Performing Arts | 5 | 1.0% |
| Communications | 8 | 1.6% |
| Arts & Humanities | 32 | 6.4% |
| Total | 497 | 100.0% |
Transportation & Commute in Banks
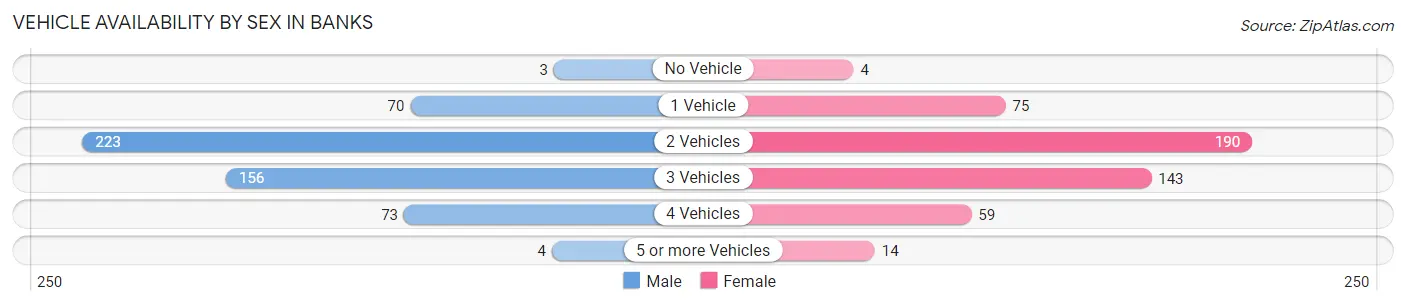
Vehicle Availability by Sex in Banks
The most prevalent vehicle ownership categories in Banks are males with 2 vehicles (223, accounting for 42.2%) and females with 2 vehicles (190, making up 46.0%).
| Vehicles Available | Male | Female |
| No Vehicle | 3 (0.6%) | 4 (0.8%) |
| 1 Vehicle | 70 (13.2%) | 75 (15.5%) |
| 2 Vehicles | 223 (42.2%) | 190 (39.2%) |
| 3 Vehicles | 156 (29.5%) | 143 (29.5%) |
| 4 Vehicles | 73 (13.8%) | 59 (12.2%) |
| 5 or more Vehicles | 4 (0.8%) | 14 (2.9%) |
| Total | 529 (100.0%) | 485 (100.0%) |
Commute Time in Banks
The most frequently occuring commute durations in Banks are 20 to 24 minutes (332 commuters, 36.3%), 15 to 19 minutes (125 commuters, 13.7%), and 30 to 34 minutes (116 commuters, 12.7%).
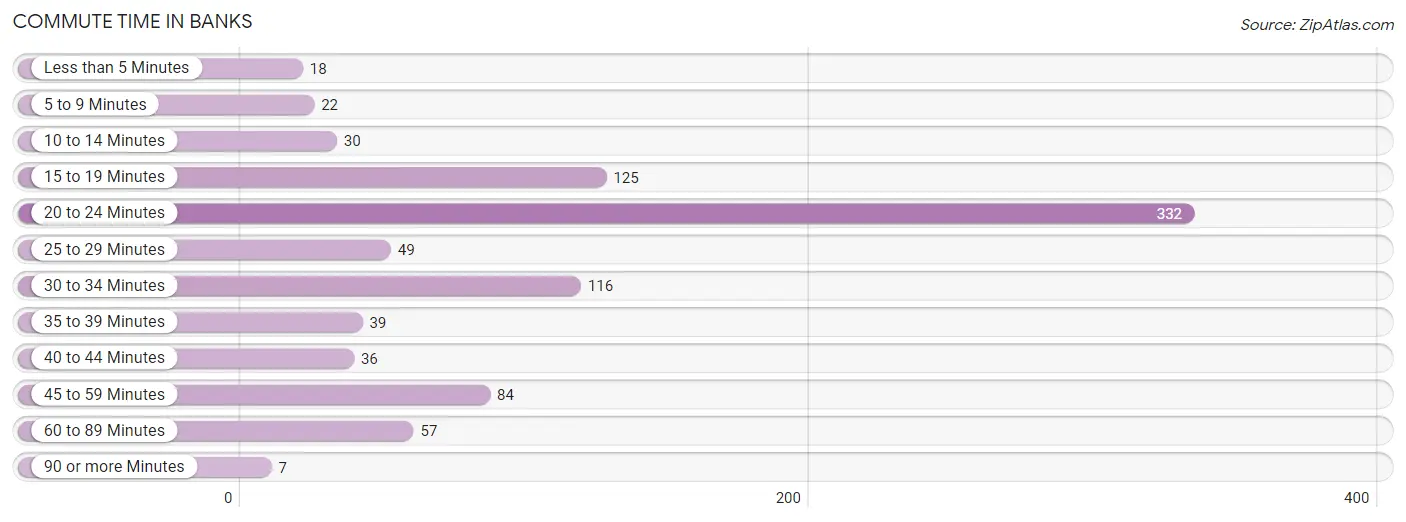
| Commute Time | # Commuters | % Commuters |
| Less than 5 Minutes | 18 | 2.0% |
| 5 to 9 Minutes | 22 | 2.4% |
| 10 to 14 Minutes | 30 | 3.3% |
| 15 to 19 Minutes | 125 | 13.7% |
| 20 to 24 Minutes | 332 | 36.3% |
| 25 to 29 Minutes | 49 | 5.4% |
| 30 to 34 Minutes | 116 | 12.7% |
| 35 to 39 Minutes | 39 | 4.3% |
| 40 to 44 Minutes | 36 | 3.9% |
| 45 to 59 Minutes | 84 | 9.2% |
| 60 to 89 Minutes | 57 | 6.2% |
| 90 or more Minutes | 7 | 0.8% |
Commute Time by Sex in Banks
The most common commute times in Banks are 20 to 24 minutes (176 commuters, 34.8%) for males and 20 to 24 minutes (156 commuters, 38.1%) for females.
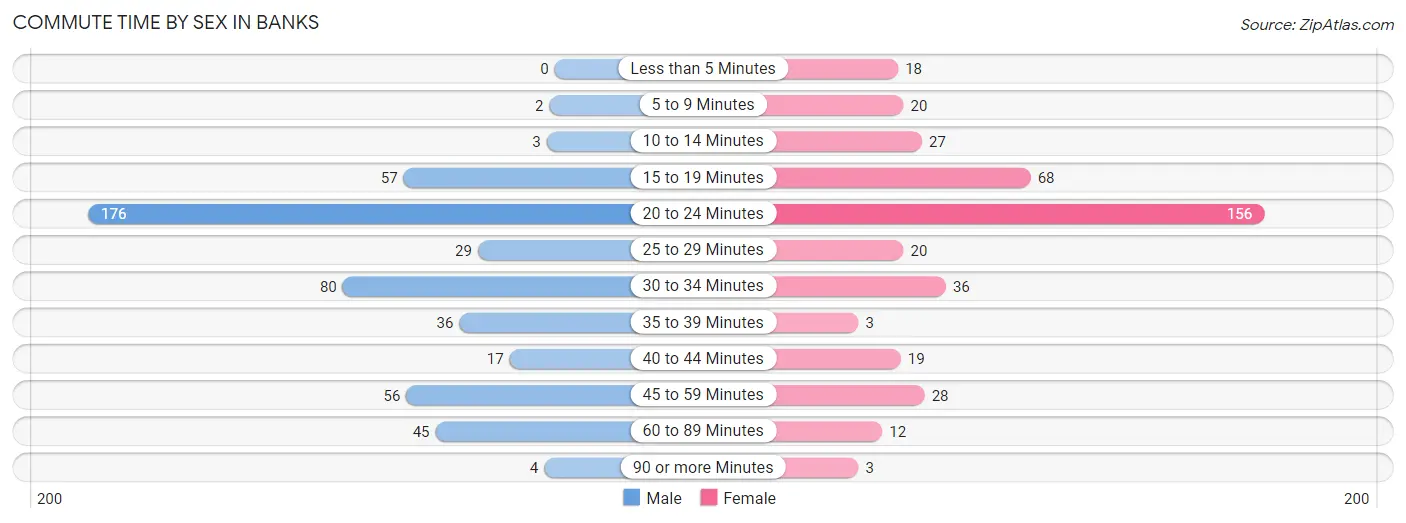
| Commute Time | Male | Female |
| Less than 5 Minutes | 0 (0.0%) | 18 (4.4%) |
| 5 to 9 Minutes | 2 (0.4%) | 20 (4.9%) |
| 10 to 14 Minutes | 3 (0.6%) | 27 (6.6%) |
| 15 to 19 Minutes | 57 (11.3%) | 68 (16.6%) |
| 20 to 24 Minutes | 176 (34.8%) | 156 (38.1%) |
| 25 to 29 Minutes | 29 (5.7%) | 20 (4.9%) |
| 30 to 34 Minutes | 80 (15.8%) | 36 (8.8%) |
| 35 to 39 Minutes | 36 (7.1%) | 3 (0.7%) |
| 40 to 44 Minutes | 17 (3.4%) | 19 (4.6%) |
| 45 to 59 Minutes | 56 (11.1%) | 28 (6.8%) |
| 60 to 89 Minutes | 45 (8.9%) | 12 (2.9%) |
| 90 or more Minutes | 4 (0.8%) | 3 (0.7%) |
Time of Departure to Work by Sex in Banks
The most frequent times of departure to work in Banks are 6:00 AM to 6:29 AM (84, 16.6%) for males and 7:30 AM to 7:59 AM (80, 19.5%) for females.
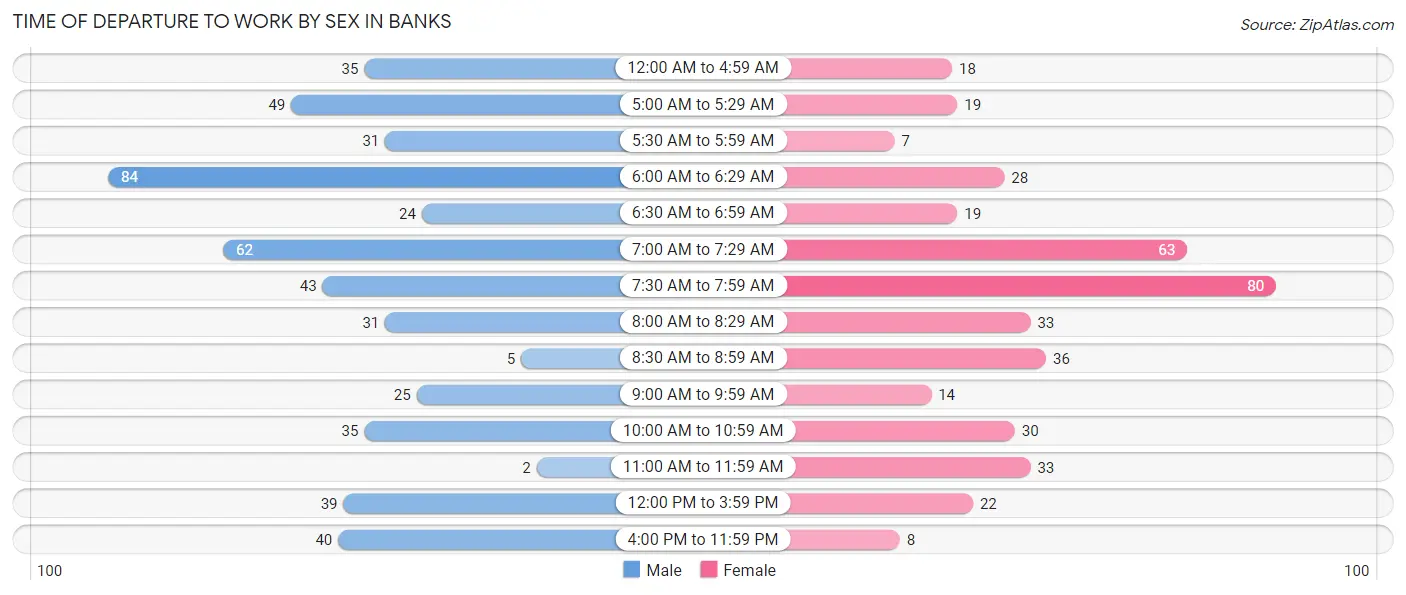
| Time of Departure | Male | Female |
| 12:00 AM to 4:59 AM | 35 (6.9%) | 18 (4.4%) |
| 5:00 AM to 5:29 AM | 49 (9.7%) | 19 (4.6%) |
| 5:30 AM to 5:59 AM | 31 (6.1%) | 7 (1.7%) |
| 6:00 AM to 6:29 AM | 84 (16.6%) | 28 (6.8%) |
| 6:30 AM to 6:59 AM | 24 (4.8%) | 19 (4.6%) |
| 7:00 AM to 7:29 AM | 62 (12.3%) | 63 (15.4%) |
| 7:30 AM to 7:59 AM | 43 (8.5%) | 80 (19.5%) |
| 8:00 AM to 8:29 AM | 31 (6.1%) | 33 (8.1%) |
| 8:30 AM to 8:59 AM | 5 (1.0%) | 36 (8.8%) |
| 9:00 AM to 9:59 AM | 25 (5.0%) | 14 (3.4%) |
| 10:00 AM to 10:59 AM | 35 (6.9%) | 30 (7.3%) |
| 11:00 AM to 11:59 AM | 2 (0.4%) | 33 (8.1%) |
| 12:00 PM to 3:59 PM | 39 (7.7%) | 22 (5.4%) |
| 4:00 PM to 11:59 PM | 40 (7.9%) | 8 (1.9%) |
| Total | 505 (100.0%) | 410 (100.0%) |
Housing Occupancy in Banks
Occupancy by Ownership in Banks
Of the total 758 dwellings in Banks, owner-occupied units account for 591 (78.0%), while renter-occupied units make up 167 (22.0%).
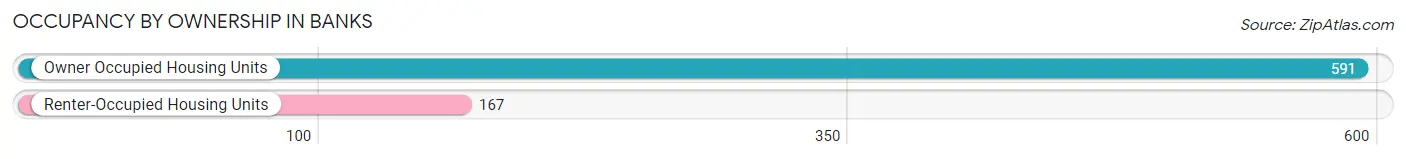
| Occupancy | # Housing Units | % Housing Units |
| Owner Occupied Housing Units | 591 | 78.0% |
| Renter-Occupied Housing Units | 167 | 22.0% |
| Total Occupied Housing Units | 758 | 100.0% |
Occupancy by Household Size in Banks
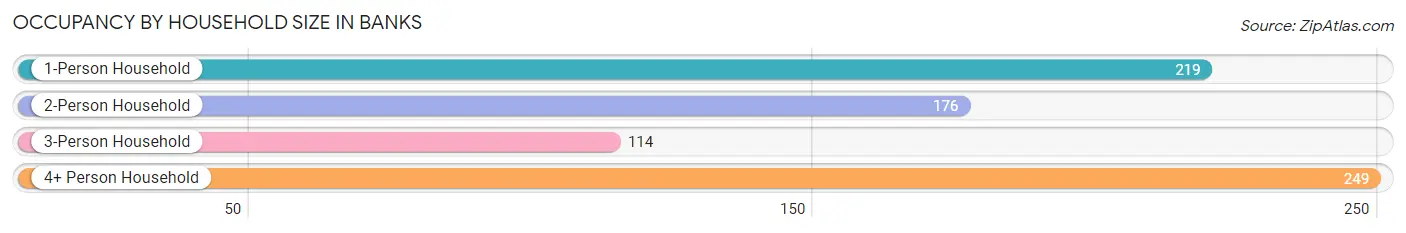
| Household Size | # Housing Units | % Housing Units |
| 1-Person Household | 219 | 28.9% |
| 2-Person Household | 176 | 23.2% |
| 3-Person Household | 114 | 15.0% |
| 4+ Person Household | 249 | 32.9% |
| Total Housing Units | 758 | 100.0% |
Occupancy by Ownership by Household Size in Banks
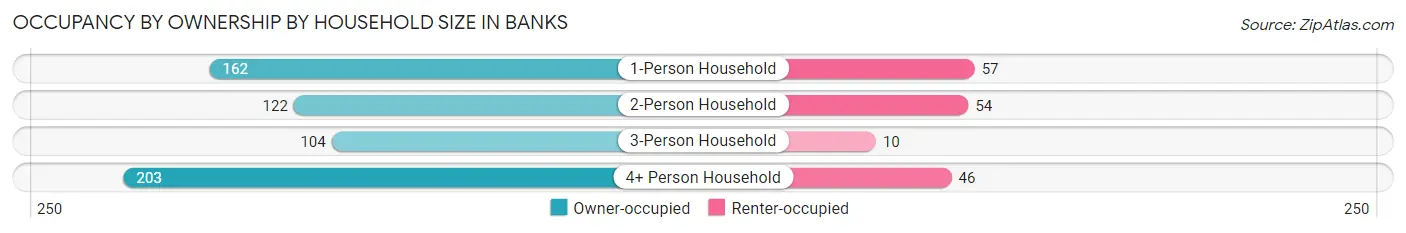
| Household Size | Owner-occupied | Renter-occupied |
| 1-Person Household | 162 (74.0%) | 57 (26.0%) |
| 2-Person Household | 122 (69.3%) | 54 (30.7%) |
| 3-Person Household | 104 (91.2%) | 10 (8.8%) |
| 4+ Person Household | 203 (81.5%) | 46 (18.5%) |
| Total Housing Units | 591 (78.0%) | 167 (22.0%) |
Occupancy by Educational Attainment in Banks
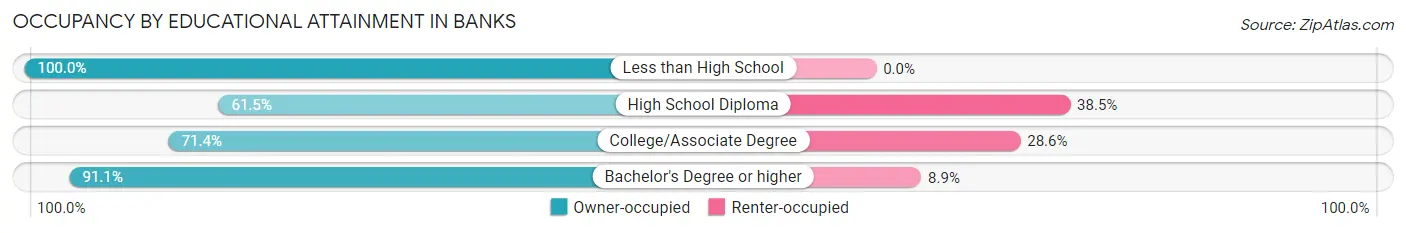
| Household Size | Owner-occupied | Renter-occupied |
| Less than High School | 7 (100.0%) | 0 (0.0%) |
| High School Diploma | 88 (61.5%) | 55 (38.5%) |
| College/Associate Degree | 210 (71.4%) | 84 (28.6%) |
| Bachelor's Degree or higher | 286 (91.1%) | 28 (8.9%) |
Occupancy by Age of Householder in Banks
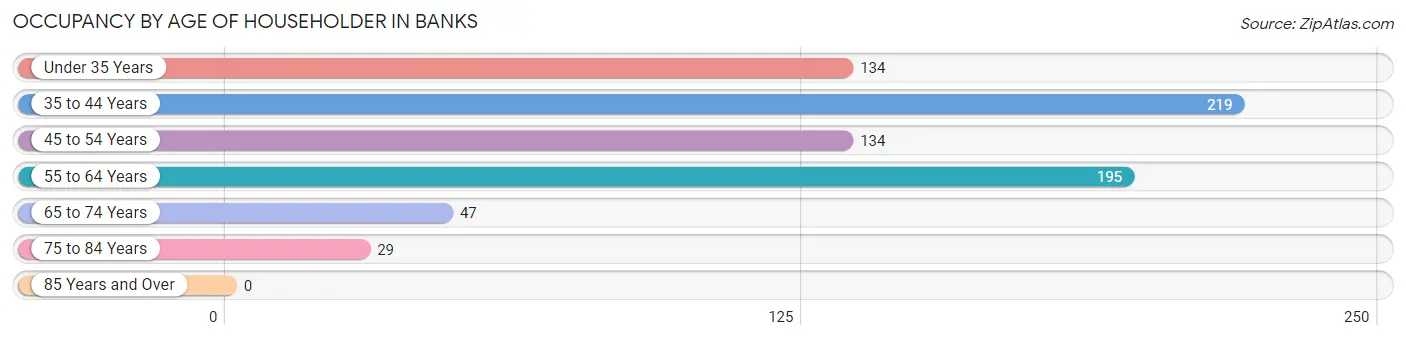
| Age Bracket | # Households | % Households |
| Under 35 Years | 134 | 17.7% |
| 35 to 44 Years | 219 | 28.9% |
| 45 to 54 Years | 134 | 17.7% |
| 55 to 64 Years | 195 | 25.7% |
| 65 to 74 Years | 47 | 6.2% |
| 75 to 84 Years | 29 | 3.8% |
| 85 Years and Over | 0 | 0.0% |
| Total | 758 | 100.0% |
Housing Finances in Banks
Median Income by Occupancy in Banks
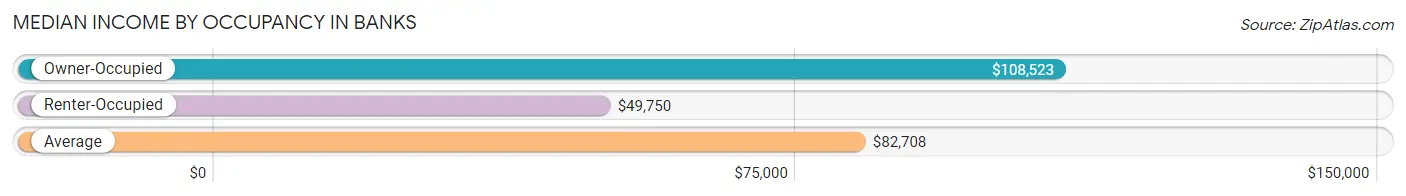
| Occupancy Type | # Households | Median Income |
| Owner-Occupied | 591 (78.0%) | $108,523 |
| Renter-Occupied | 167 (22.0%) | $49,750 |
| Average | 758 (100.0%) | $82,708 |
Occupancy by Householder Income Bracket in Banks
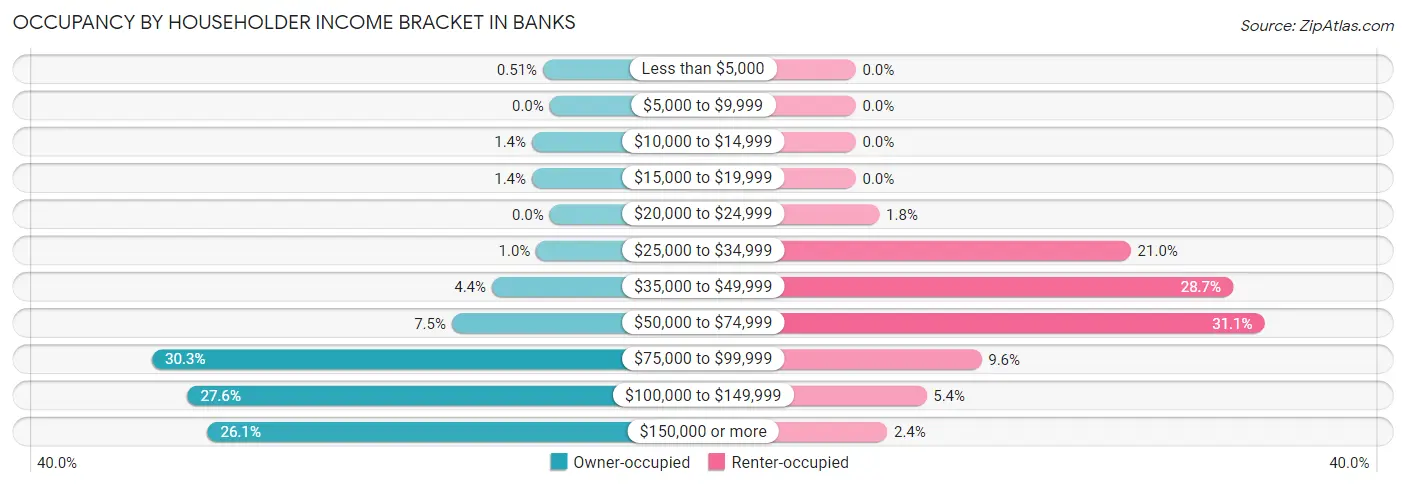
| Income Bracket | Owner-occupied | Renter-occupied |
| Less than $5,000 | 3 (0.5%) | 0 (0.0%) |
| $5,000 to $9,999 | 0 (0.0%) | 0 (0.0%) |
| $10,000 to $14,999 | 8 (1.3%) | 0 (0.0%) |
| $15,000 to $19,999 | 8 (1.3%) | 0 (0.0%) |
| $20,000 to $24,999 | 0 (0.0%) | 3 (1.8%) |
| $25,000 to $34,999 | 6 (1.0%) | 35 (21.0%) |
| $35,000 to $49,999 | 26 (4.4%) | 48 (28.7%) |
| $50,000 to $74,999 | 44 (7.4%) | 52 (31.1%) |
| $75,000 to $99,999 | 179 (30.3%) | 16 (9.6%) |
| $100,000 to $149,999 | 163 (27.6%) | 9 (5.4%) |
| $150,000 or more | 154 (26.1%) | 4 (2.4%) |
| Total | 591 (100.0%) | 167 (100.0%) |
Monthly Housing Cost Tiers in Banks
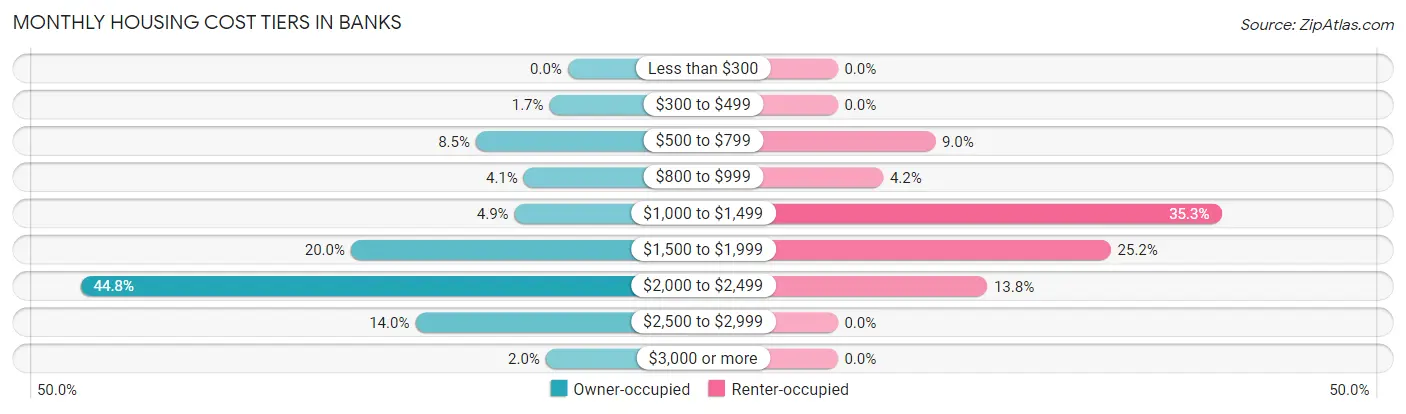
| Monthly Cost | Owner-occupied | Renter-occupied |
| Less than $300 | 0 (0.0%) | 0 (0.0%) |
| $300 to $499 | 10 (1.7%) | 0 (0.0%) |
| $500 to $799 | 50 (8.5%) | 15 (9.0%) |
| $800 to $999 | 24 (4.1%) | 7 (4.2%) |
| $1,000 to $1,499 | 29 (4.9%) | 59 (35.3%) |
| $1,500 to $1,999 | 118 (20.0%) | 42 (25.2%) |
| $2,000 to $2,499 | 265 (44.8%) | 23 (13.8%) |
| $2,500 to $2,999 | 83 (14.0%) | 0 (0.0%) |
| $3,000 or more | 12 (2.0%) | 0 (0.0%) |
| Total | 591 (100.0%) | 167 (100.0%) |
Physical Housing Characteristics in Banks
Housing Structures in Banks
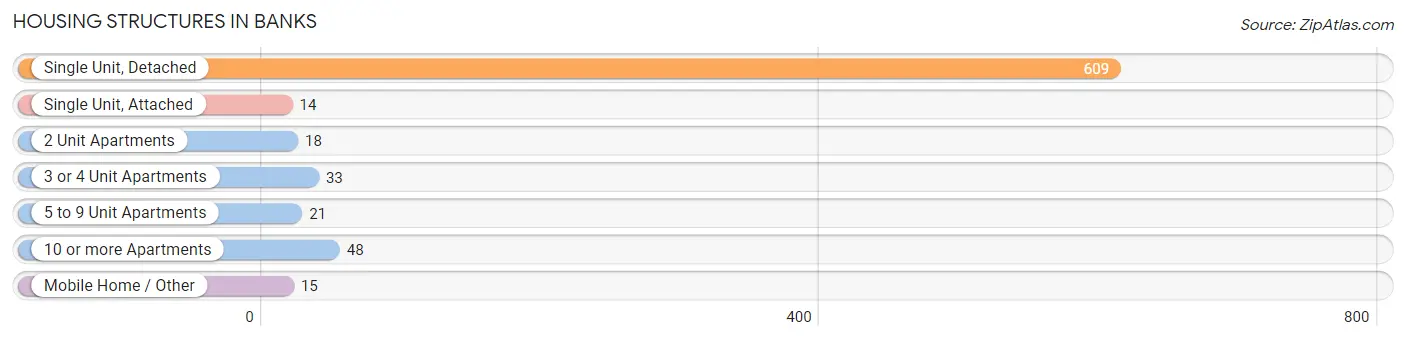
| Structure Type | # Housing Units | % Housing Units |
| Single Unit, Detached | 609 | 80.3% |
| Single Unit, Attached | 14 | 1.8% |
| 2 Unit Apartments | 18 | 2.4% |
| 3 or 4 Unit Apartments | 33 | 4.3% |
| 5 to 9 Unit Apartments | 21 | 2.8% |
| 10 or more Apartments | 48 | 6.3% |
| Mobile Home / Other | 15 | 2.0% |
| Total | 758 | 100.0% |
Housing Structures by Occupancy in Banks
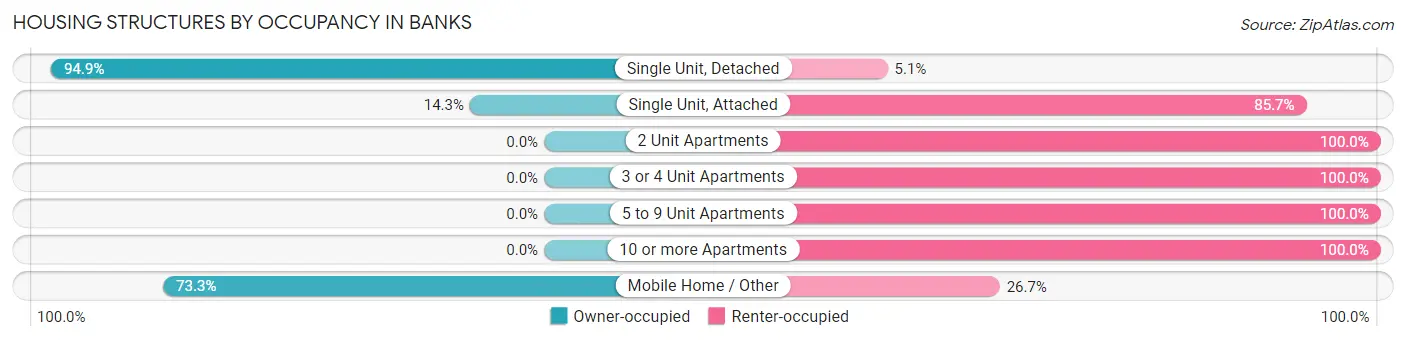
| Structure Type | Owner-occupied | Renter-occupied |
| Single Unit, Detached | 578 (94.9%) | 31 (5.1%) |
| Single Unit, Attached | 2 (14.3%) | 12 (85.7%) |
| 2 Unit Apartments | 0 (0.0%) | 18 (100.0%) |
| 3 or 4 Unit Apartments | 0 (0.0%) | 33 (100.0%) |
| 5 to 9 Unit Apartments | 0 (0.0%) | 21 (100.0%) |
| 10 or more Apartments | 0 (0.0%) | 48 (100.0%) |
| Mobile Home / Other | 11 (73.3%) | 4 (26.7%) |
| Total | 591 (78.0%) | 167 (22.0%) |
Housing Structures by Number of Rooms in Banks
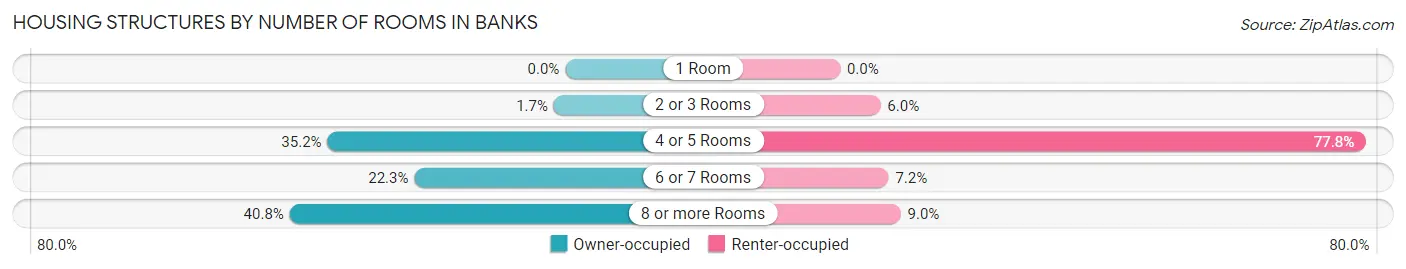
| Number of Rooms | Owner-occupied | Renter-occupied |
| 1 Room | 0 (0.0%) | 0 (0.0%) |
| 2 or 3 Rooms | 10 (1.7%) | 10 (6.0%) |
| 4 or 5 Rooms | 208 (35.2%) | 130 (77.8%) |
| 6 or 7 Rooms | 132 (22.3%) | 12 (7.2%) |
| 8 or more Rooms | 241 (40.8%) | 15 (9.0%) |
| Total | 591 (100.0%) | 167 (100.0%) |
Housing Structure by Heating Type in Banks
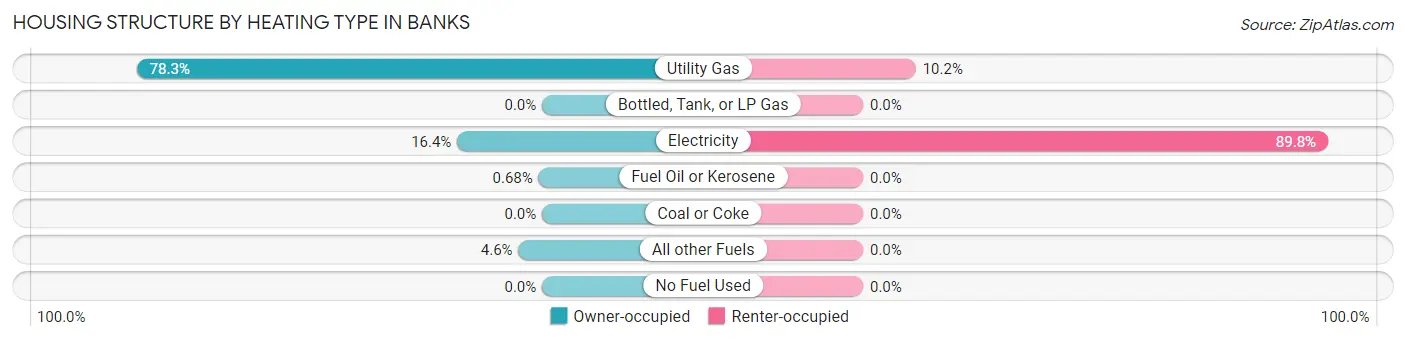
| Heating Type | Owner-occupied | Renter-occupied |
| Utility Gas | 463 (78.3%) | 17 (10.2%) |
| Bottled, Tank, or LP Gas | 0 (0.0%) | 0 (0.0%) |
| Electricity | 97 (16.4%) | 150 (89.8%) |
| Fuel Oil or Kerosene | 4 (0.7%) | 0 (0.0%) |
| Coal or Coke | 0 (0.0%) | 0 (0.0%) |
| All other Fuels | 27 (4.6%) | 0 (0.0%) |
| No Fuel Used | 0 (0.0%) | 0 (0.0%) |
| Total | 591 (100.0%) | 167 (100.0%) |
Household Vehicle Usage in Banks
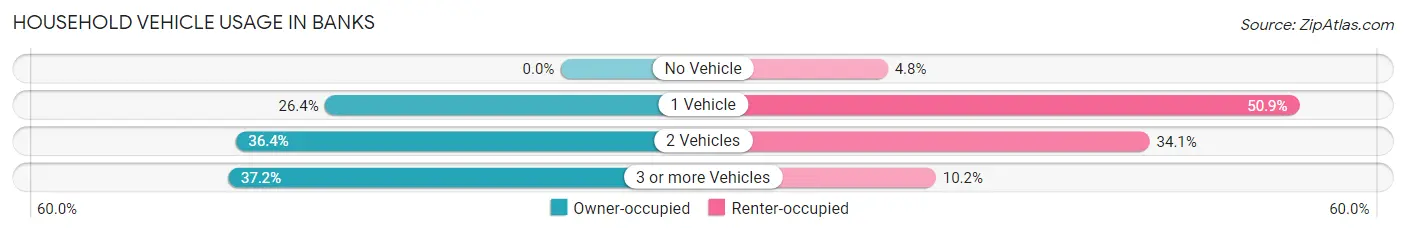
| Vehicles per Household | Owner-occupied | Renter-occupied |
| No Vehicle | 0 (0.0%) | 8 (4.8%) |
| 1 Vehicle | 156 (26.4%) | 85 (50.9%) |
| 2 Vehicles | 215 (36.4%) | 57 (34.1%) |
| 3 or more Vehicles | 220 (37.2%) | 17 (10.2%) |
| Total | 591 (100.0%) | 167 (100.0%) |
Real Estate & Mortgages in Banks
Real Estate and Mortgage Overview in Banks
| Characteristic | Without Mortgage | With Mortgage |
| Housing Units | 78 | 513 |
| Median Property Value | $448,000 | $411,100 |
| Median Household Income | $127,813 | $126 |
| Monthly Housing Costs | $736 | $12 |
| Real Estate Taxes | $4,047 | $8 |
Property Value by Mortgage Status in Banks
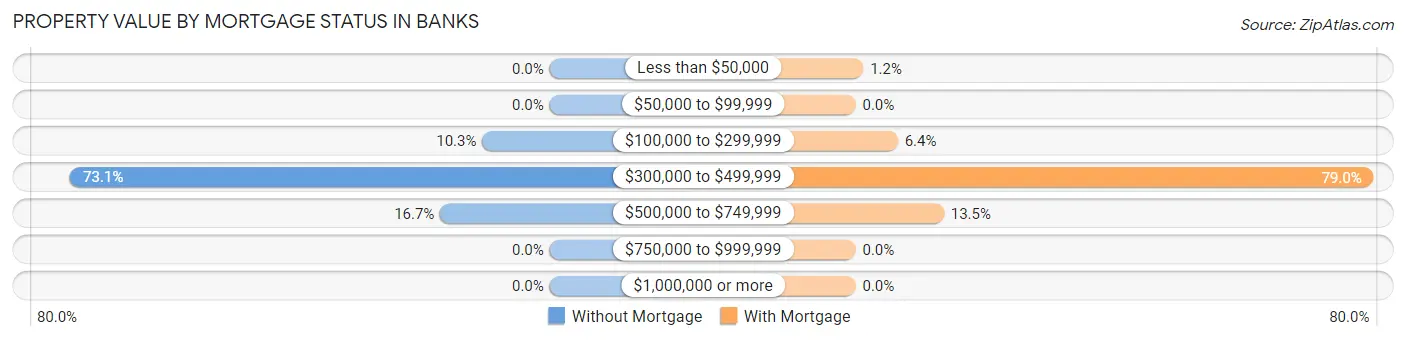
| Property Value | Without Mortgage | With Mortgage |
| Less than $50,000 | 0 (0.0%) | 6 (1.2%) |
| $50,000 to $99,999 | 0 (0.0%) | 0 (0.0%) |
| $100,000 to $299,999 | 8 (10.3%) | 33 (6.4%) |
| $300,000 to $499,999 | 57 (73.1%) | 405 (78.9%) |
| $500,000 to $749,999 | 13 (16.7%) | 69 (13.5%) |
| $750,000 to $999,999 | 0 (0.0%) | 0 (0.0%) |
| $1,000,000 or more | 0 (0.0%) | 0 (0.0%) |
| Total | 78 (100.0%) | 513 (100.0%) |
Household Income by Mortgage Status in Banks
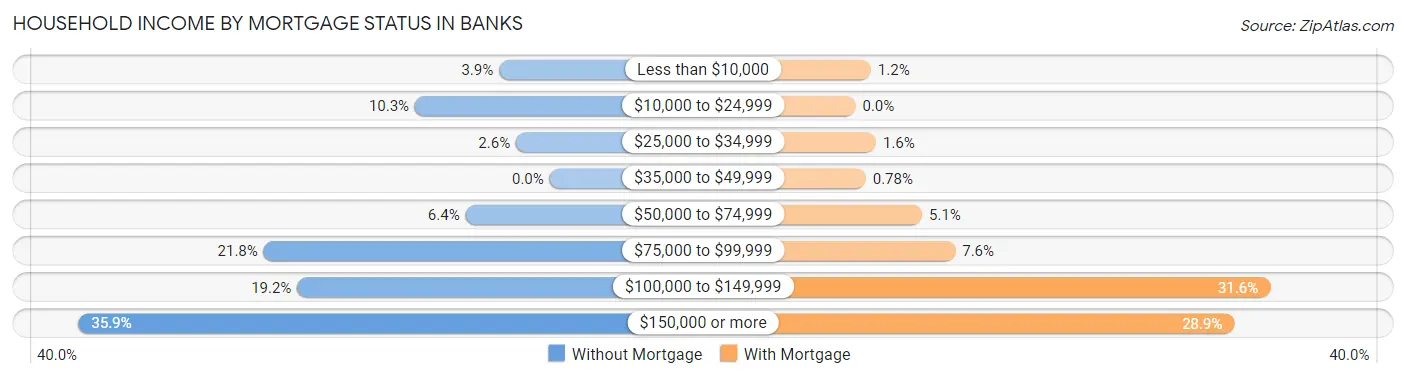
| Household Income | Without Mortgage | With Mortgage |
| Less than $10,000 | 3 (3.8%) | 6 (1.2%) |
| $10,000 to $24,999 | 8 (10.3%) | 0 (0.0%) |
| $25,000 to $34,999 | 2 (2.6%) | 8 (1.6%) |
| $35,000 to $49,999 | 0 (0.0%) | 4 (0.8%) |
| $50,000 to $74,999 | 5 (6.4%) | 26 (5.1%) |
| $75,000 to $99,999 | 17 (21.8%) | 39 (7.6%) |
| $100,000 to $149,999 | 15 (19.2%) | 162 (31.6%) |
| $150,000 or more | 28 (35.9%) | 148 (28.8%) |
| Total | 78 (100.0%) | 513 (100.0%) |
Property Value to Household Income Ratio in Banks
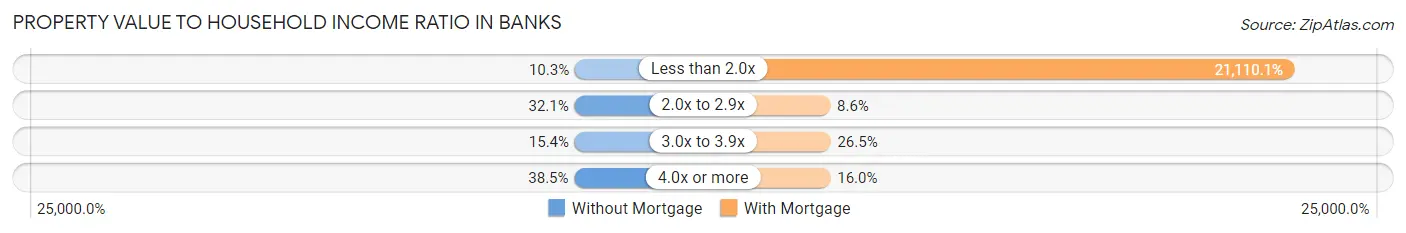
| Value-to-Income Ratio | Without Mortgage | With Mortgage |
| Less than 2.0x | 8 (10.3%) | 108,295 (21,110.1%) |
| 2.0x to 2.9x | 25 (32.1%) | 44 (8.6%) |
| 3.0x to 3.9x | 12 (15.4%) | 136 (26.5%) |
| 4.0x or more | 30 (38.5%) | 82 (16.0%) |
| Total | 78 (100.0%) | 513 (100.0%) |
Real Estate Taxes by Mortgage Status in Banks
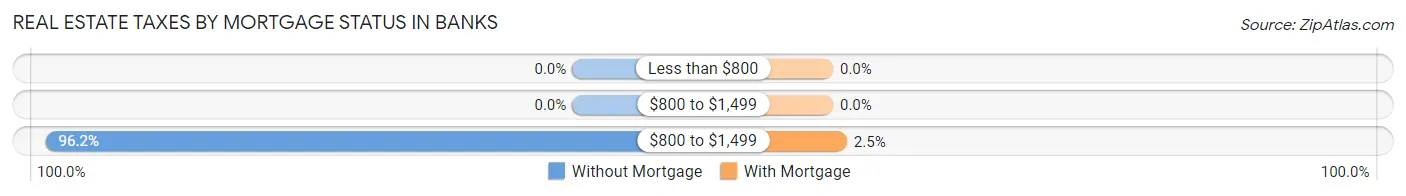
| Property Taxes | Without Mortgage | With Mortgage |
| Less than $800 | 0 (0.0%) | 0 (0.0%) |
| $800 to $1,499 | 0 (0.0%) | 0 (0.0%) |
| $800 to $1,499 | 75 (96.2%) | 13 (2.5%) |
| Total | 78 (100.0%) | 513 (100.0%) |
Health & Disability in Banks
Health Insurance Coverage by Age in Banks
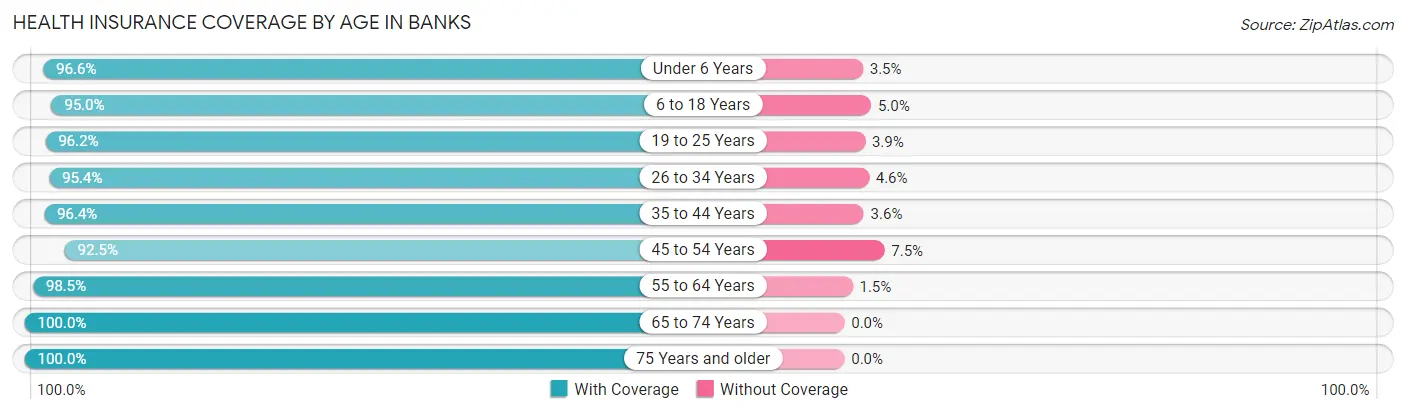
| Age Bracket | With Coverage | Without Coverage |
| Under 6 Years | 196 (96.6%) | 7 (3.5%) |
| 6 to 18 Years | 401 (95.0%) | 21 (5.0%) |
| 19 to 25 Years | 200 (96.2%) | 8 (3.8%) |
| 26 to 34 Years | 188 (95.4%) | 9 (4.6%) |
| 35 to 44 Years | 374 (96.4%) | 14 (3.6%) |
| 45 to 54 Years | 223 (92.5%) | 18 (7.5%) |
| 55 to 64 Years | 257 (98.5%) | 4 (1.5%) |
| 65 to 74 Years | 89 (100.0%) | 0 (0.0%) |
| 75 Years and older | 38 (100.0%) | 0 (0.0%) |
| Total | 1,966 (96.0%) | 81 (4.0%) |
Health Insurance Coverage by Citizenship Status in Banks
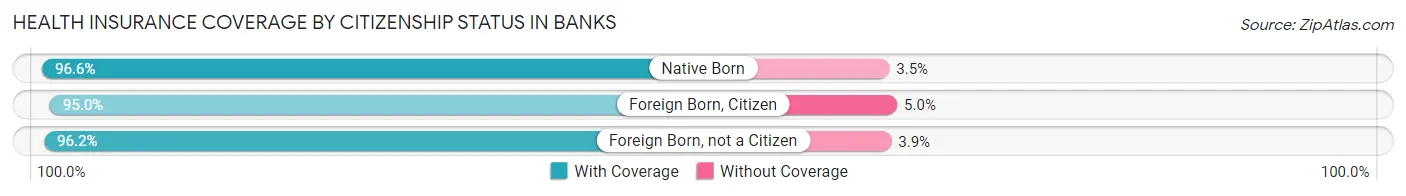
| Citizenship Status | With Coverage | Without Coverage |
| Native Born | 196 (96.6%) | 7 (3.5%) |
| Foreign Born, Citizen | 401 (95.0%) | 21 (5.0%) |
| Foreign Born, not a Citizen | 200 (96.2%) | 8 (3.8%) |
Health Insurance Coverage by Household Income in Banks
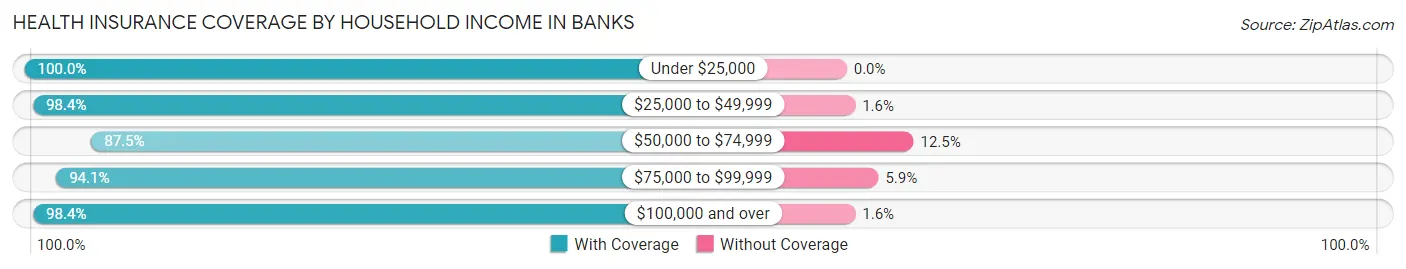
| Household Income | With Coverage | Without Coverage |
| Under $25,000 | 24 (100.0%) | 0 (0.0%) |
| $25,000 to $49,999 | 249 (98.4%) | 4 (1.6%) |
| $50,000 to $74,999 | 273 (87.5%) | 39 (12.5%) |
| $75,000 to $99,999 | 317 (94.1%) | 20 (5.9%) |
| $100,000 and over | 1,103 (98.4%) | 18 (1.6%) |
Public vs Private Health Insurance Coverage by Age in Banks
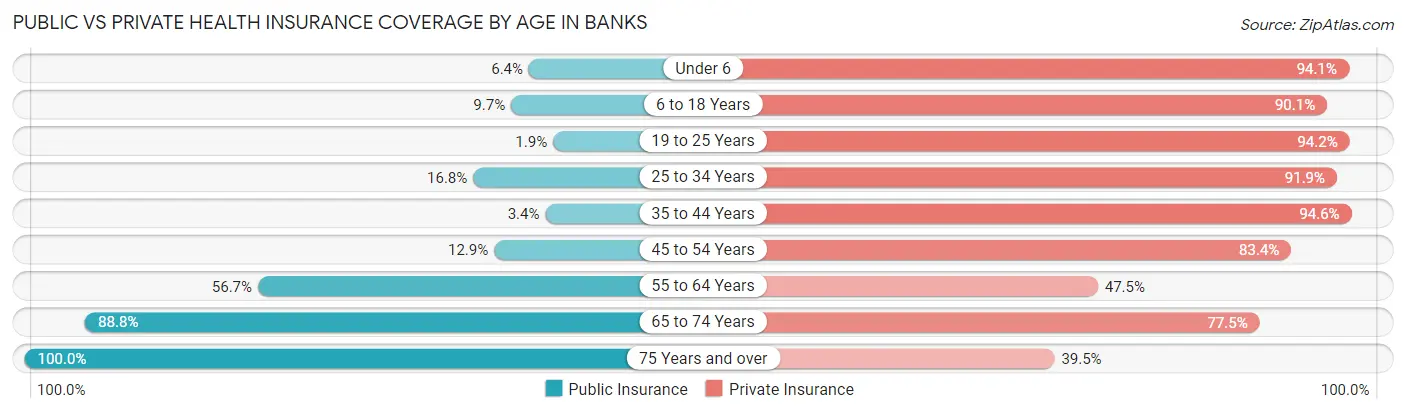
| Age Bracket | Public Insurance | Private Insurance |
| Under 6 | 13 (6.4%) | 191 (94.1%) |
| 6 to 18 Years | 41 (9.7%) | 380 (90.0%) |
| 19 to 25 Years | 4 (1.9%) | 196 (94.2%) |
| 25 to 34 Years | 33 (16.8%) | 181 (91.9%) |
| 35 to 44 Years | 13 (3.4%) | 367 (94.6%) |
| 45 to 54 Years | 31 (12.9%) | 201 (83.4%) |
| 55 to 64 Years | 148 (56.7%) | 124 (47.5%) |
| 65 to 74 Years | 79 (88.8%) | 69 (77.5%) |
| 75 Years and over | 38 (100.0%) | 15 (39.5%) |
| Total | 400 (19.5%) | 1,724 (84.2%) |
Disability Status by Sex by Age in Banks
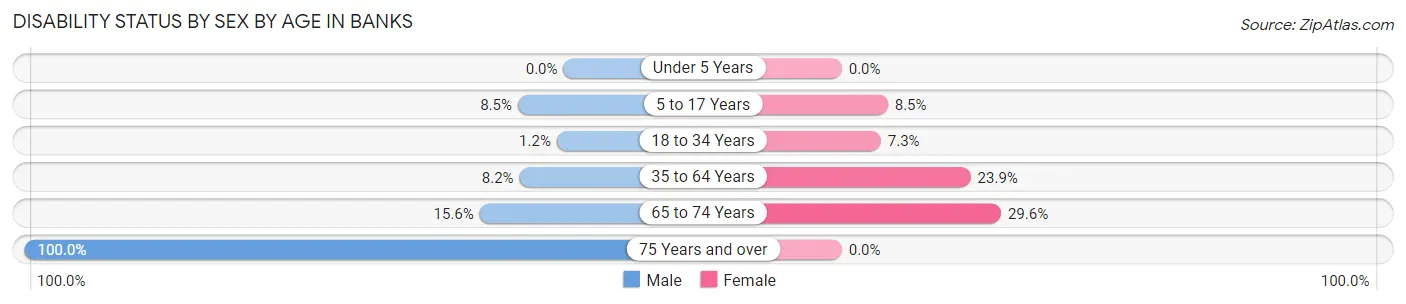
| Age Bracket | Male | Female |
| Under 5 Years | 0 (0.0%) | 0 (0.0%) |
| 5 to 17 Years | 18 (8.5%) | 17 (8.5%) |
| 18 to 34 Years | 2 (1.2%) | 20 (7.2%) |
| 35 to 64 Years | 33 (8.2%) | 116 (23.9%) |
| 65 to 74 Years | 7 (15.6%) | 13 (29.5%) |
| 75 Years and over | 8 (100.0%) | 0 (0.0%) |
Disability Class by Sex by Age in Banks
Disability Class: Hearing Difficulty
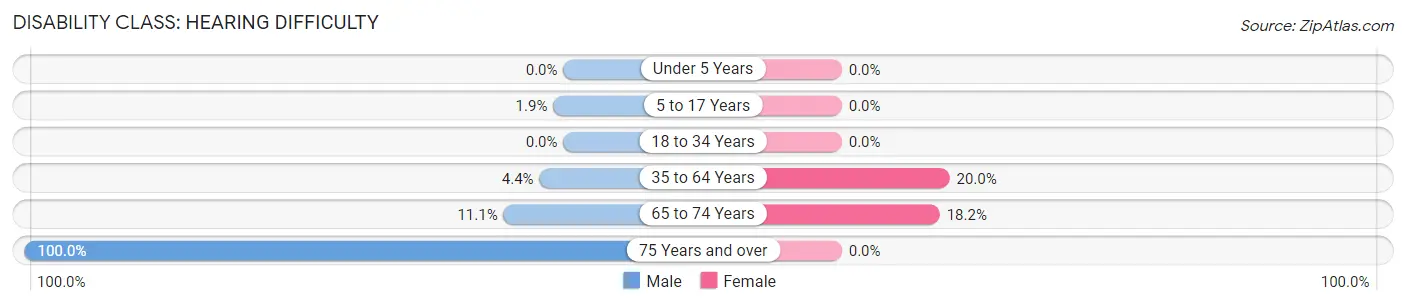
| Age Bracket | Male | Female |
| Under 5 Years | 0 (0.0%) | 0 (0.0%) |
| 5 to 17 Years | 4 (1.9%) | 0 (0.0%) |
| 18 to 34 Years | 0 (0.0%) | 0 (0.0%) |
| 35 to 64 Years | 18 (4.4%) | 97 (20.0%) |
| 65 to 74 Years | 5 (11.1%) | 8 (18.2%) |
| 75 Years and over | 8 (100.0%) | 0 (0.0%) |
Disability Class: Vision Difficulty
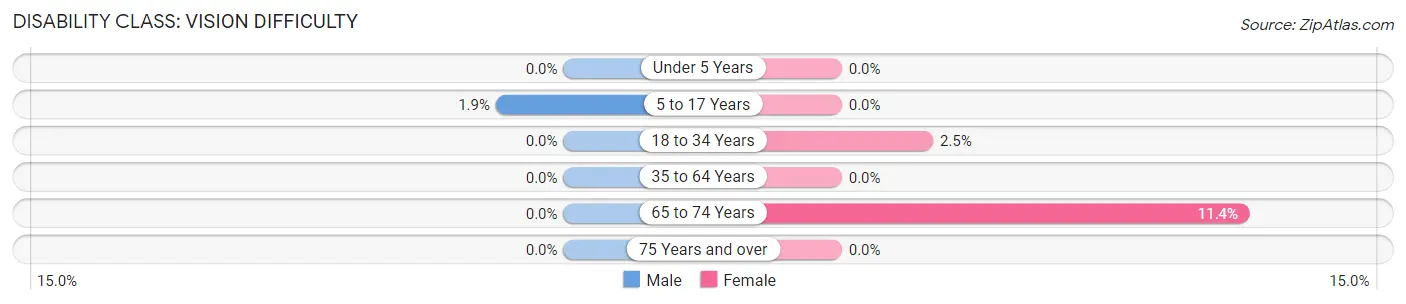
| Age Bracket | Male | Female |
| Under 5 Years | 0 (0.0%) | 0 (0.0%) |
| 5 to 17 Years | 4 (1.9%) | 0 (0.0%) |
| 18 to 34 Years | 0 (0.0%) | 7 (2.5%) |
| 35 to 64 Years | 0 (0.0%) | 0 (0.0%) |
| 65 to 74 Years | 0 (0.0%) | 5 (11.4%) |
| 75 Years and over | 0 (0.0%) | 0 (0.0%) |
Disability Class: Cognitive Difficulty
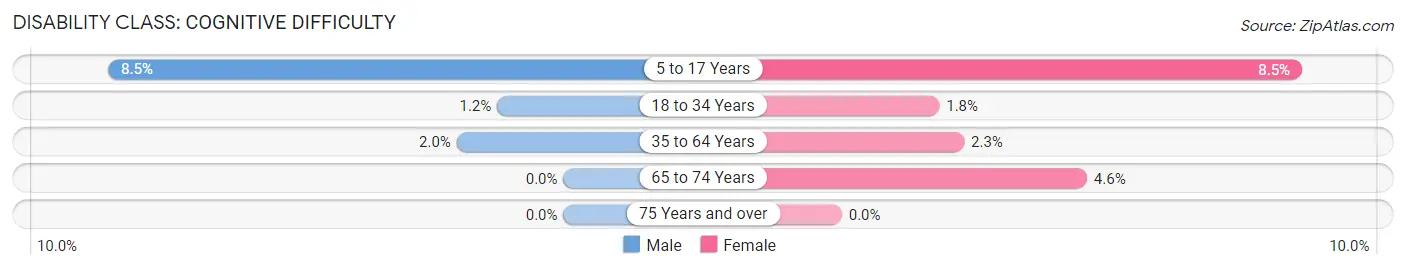
| Age Bracket | Male | Female |
| 5 to 17 Years | 18 (8.5%) | 17 (8.5%) |
| 18 to 34 Years | 2 (1.2%) | 5 (1.8%) |
| 35 to 64 Years | 8 (2.0%) | 11 (2.3%) |
| 65 to 74 Years | 0 (0.0%) | 2 (4.5%) |
| 75 Years and over | 0 (0.0%) | 0 (0.0%) |
Disability Class: Ambulatory Difficulty
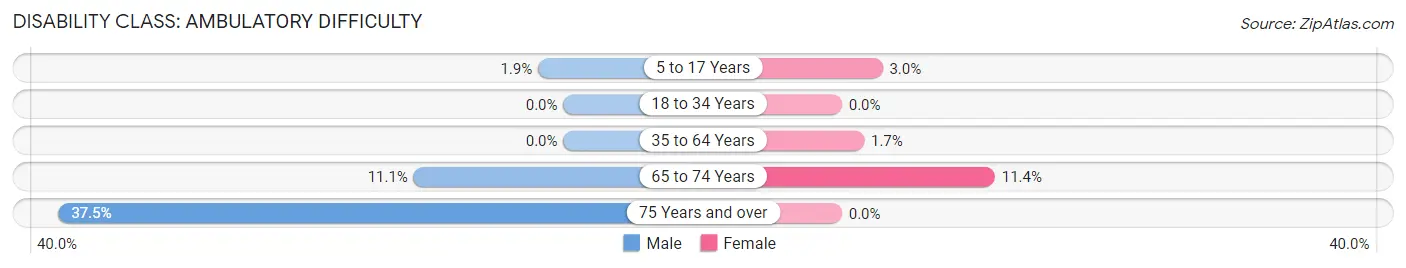
| Age Bracket | Male | Female |
| 5 to 17 Years | 4 (1.9%) | 6 (3.0%) |
| 18 to 34 Years | 0 (0.0%) | 0 (0.0%) |
| 35 to 64 Years | 0 (0.0%) | 8 (1.7%) |
| 65 to 74 Years | 5 (11.1%) | 5 (11.4%) |
| 75 Years and over | 3 (37.5%) | 0 (0.0%) |
Disability Class: Self-Care Difficulty
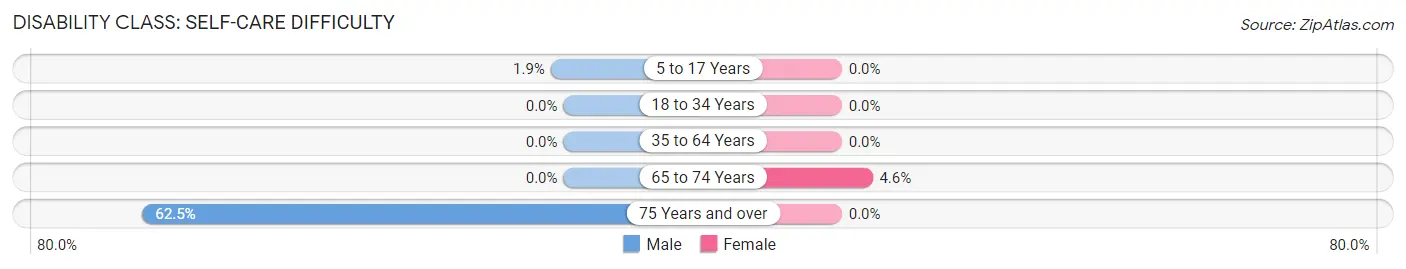
| Age Bracket | Male | Female |
| 5 to 17 Years | 4 (1.9%) | 0 (0.0%) |
| 18 to 34 Years | 0 (0.0%) | 0 (0.0%) |
| 35 to 64 Years | 0 (0.0%) | 0 (0.0%) |
| 65 to 74 Years | 0 (0.0%) | 2 (4.5%) |
| 75 Years and over | 5 (62.5%) | 0 (0.0%) |
Technology Access in Banks
Computing Device Access in Banks
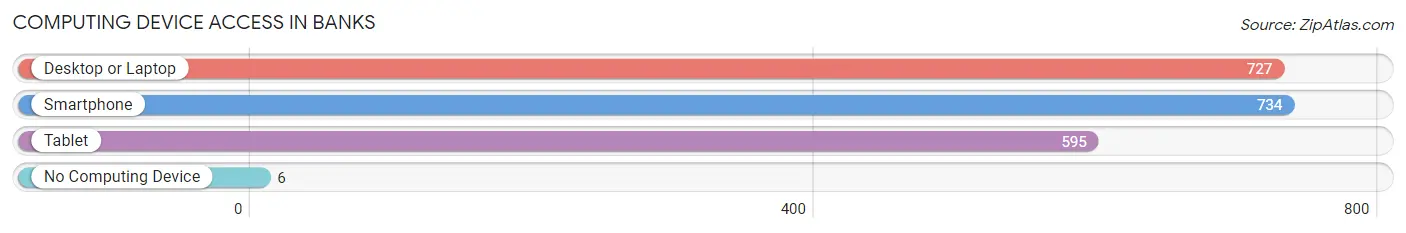
| Device Type | # Households | % Households |
| Desktop or Laptop | 727 | 95.9% |
| Smartphone | 734 | 96.8% |
| Tablet | 595 | 78.5% |
| No Computing Device | 6 | 0.8% |
| Total | 758 | 100.0% |
Internet Access in Banks
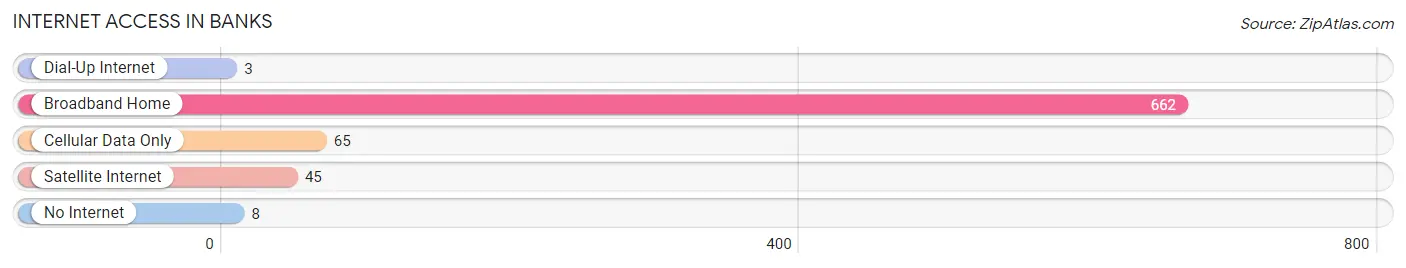
| Internet Type | # Households | % Households |
| Dial-Up Internet | 3 | 0.4% |
| Broadband Home | 662 | 87.3% |
| Cellular Data Only | 65 | 8.6% |
| Satellite Internet | 45 | 5.9% |
| No Internet | 8 | 1.1% |
| Total | 758 | 100.0% |
Banks Summary
Banks, Oregon is a small city located in Washington County, Oregon, United States. It is situated in the Tualatin Valley, approximately 20 miles west of Portland. The city was founded in 1891 and incorporated in 1911. As of the 2010 census, the population of Banks was 1,976.
History
The area that is now Banks was originally inhabited by the Atfalati tribe of the Kalapuya Native American people. The first white settlers arrived in the area in the early 1840s. The city was named after the Banks family, who were among the first settlers in the area.
In 1891, the Oregon and California Railroad built a line through the area, connecting it to Portland. This allowed for the development of the city, and it soon became a popular destination for farmers and ranchers.
In 1911, Banks was officially incorporated as a city. The city grew steadily over the next few decades, and by the 1950s, it had become a popular tourist destination.
Geography
Banks is located in the Tualatin Valley, approximately 20 miles west of Portland. The city is situated on the banks of the Tualatin River, which flows through the city. The city is surrounded by rolling hills and forests, and is home to several parks and recreational areas.
The climate in Banks is mild and temperate, with warm summers and cool winters. The average annual temperature is around 50 degrees Fahrenheit.
Economy
Banks is primarily a residential community, and the majority of its residents are employed in the service sector. The city is home to several small businesses, including restaurants, retail stores, and professional services.
The city is also home to several large employers, including Intel, which has a large manufacturing facility in the city. Other major employers include Nike, which has a distribution center in the city, and the Oregon Department of Transportation, which has a regional office in Banks.
Demographics
As of the 2010 census, the population of Banks was 1,976. The racial makeup of the city was 94.3% White, 0.7% African American, 0.4% Native American, 1.2% Asian, 0.1% Pacific Islander, 1.2% from other races, and 2.1% from two or more races. Hispanic or Latino of any race were 4.2% of the population.
The median income for a household in Banks was $50,938, and the median income for a family was $60,938. The per capita income for the city was $25,938. About 6.2% of families and 8.2% of the population were below the poverty line, including 10.2% of those under age 18 and 5.2% of those age 65 or over.
Common Questions
What is Per Capita Income in Banks?
Per Capita income in Banks is $40,991.
What is the Median Family Income in Banks?
Median Family Income in Banks is $118,750.
What is the Median Household income in Banks?
Median Household Income in Banks is $82,708.
What is Income or Wage Gap in Banks?
Income or Wage Gap in Banks is 63.2%.
Women in Banks earn 36.8 cents for every dollar earned by a man.
What is Inequality or Gini Index in Banks?
Inequality or Gini Index in Banks is 0.33.
What is the Total Population of Banks?
Total Population of Banks is 2,047.
What is the Total Male Population of Banks?
Total Male Population of Banks is 937.
What is the Total Female Population of Banks?
Total Female Population of Banks is 1,110.
What is the Ratio of Males per 100 Females in Banks?
There are 84.41 Males per 100 Females in Banks.
What is the Ratio of Females per 100 Males in Banks?
There are 118.46 Females per 100 Males in Banks.
What is the Median Population Age in Banks?
Median Population Age in Banks is 34.8 Years.
What is the Average Family Size in Banks
Average Family Size in Banks is 3.3 People.
What is the Average Household Size in Banks
Average Household Size in Banks is 2.7 People.
How Large is the Labor Force in Banks?
There are 1,216 People in the Labor Forcein in Banks.
What is the Percentage of People in the Labor Force in Banks?
81.5% of People are in the Labor Force in Banks.
What is the Unemployment Rate in Banks?
Unemployment Rate in Banks is 7.9%.