Glendale, OR Map & Demographics
Glendale Map
Glendale Overview
$24,148
PER CAPITA INCOME
$55,343
AVG FAMILY INCOME
$55,481
AVG HOUSEHOLD INCOME
38.8%
WAGE / INCOME GAP [ % ]
61.2¢/ $1
WAGE / INCOME GAP [ $ ]
$19,282
FAMILY INCOME DEFICIT
0.34
INEQUALITY / GINI INDEX
827
TOTAL POPULATION
395
MALE POPULATION
432
FEMALE POPULATION
91.44
MALES / 100 FEMALES
109.37
FEMALES / 100 MALES
36.6
MEDIAN AGE
3.1
AVG FAMILY SIZE
2.3
AVG HOUSEHOLD SIZE
391
LABOR FORCE [ PEOPLE ]
64.3%
PERCENT IN LABOR FORCE
12.3%
UNEMPLOYMENT RATE
Glendale Zip Codes
Glendale Area Codes
Income in Glendale
Income Overview in Glendale
Per Capita Income in Glendale is $24,148, while median incomes of families and households are $55,343 and $55,481 respectively.
| Characteristic | Number | Measure |
| Per Capita Income | 827 | $24,148 |
| Median Family Income | 194 | $55,343 |
| Mean Family Income | 194 | $53,573 |
| Median Household Income | 354 | $55,481 |
| Mean Household Income | 354 | $53,818 |
| Income Deficit | 194 | $19,282 |
| Wage / Income Gap (%) | 827 | 38.82% |
| Wage / Income Gap ($) | 827 | 61.18¢ per $1 |
| Gini / Inequality Index | 827 | 0.34 |
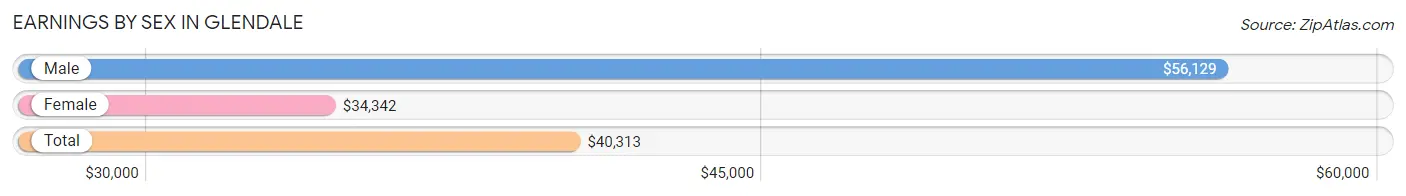
Earnings by Sex in Glendale
Average Earnings in Glendale are $40,313, $56,129 for men and $34,342 for women, a difference of 38.8%.
| Sex | Number | Average Earnings |
| Male | 256 (66.0%) | $56,129 |
| Female | 132 (34.0%) | $34,342 |
| Total | 388 (100.0%) | $40,313 |
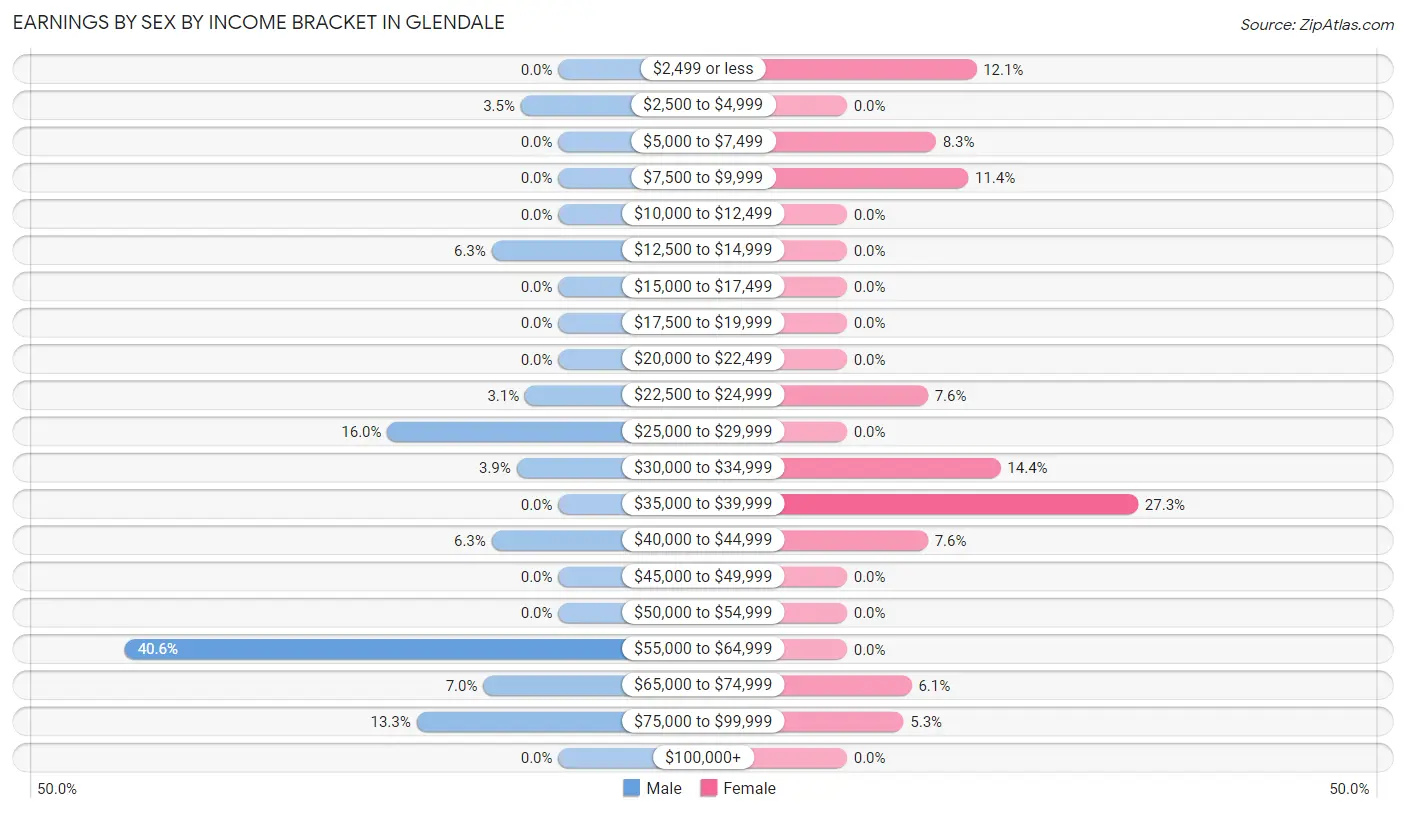
Earnings by Sex by Income Bracket in Glendale
The most common earnings brackets in Glendale are $55,000 to $64,999 for men (104 | 40.6%) and $35,000 to $39,999 for women (36 | 27.3%).
| Income | Male | Female |
| $2,499 or less | 0 (0.0%) | 16 (12.1%) |
| $2,500 to $4,999 | 9 (3.5%) | 0 (0.0%) |
| $5,000 to $7,499 | 0 (0.0%) | 11 (8.3%) |
| $7,500 to $9,999 | 0 (0.0%) | 15 (11.4%) |
| $10,000 to $12,499 | 0 (0.0%) | 0 (0.0%) |
| $12,500 to $14,999 | 16 (6.2%) | 0 (0.0%) |
| $15,000 to $17,499 | 0 (0.0%) | 0 (0.0%) |
| $17,500 to $19,999 | 0 (0.0%) | 0 (0.0%) |
| $20,000 to $22,499 | 0 (0.0%) | 0 (0.0%) |
| $22,500 to $24,999 | 8 (3.1%) | 10 (7.6%) |
| $25,000 to $29,999 | 41 (16.0%) | 0 (0.0%) |
| $30,000 to $34,999 | 10 (3.9%) | 19 (14.4%) |
| $35,000 to $39,999 | 0 (0.0%) | 36 (27.3%) |
| $40,000 to $44,999 | 16 (6.2%) | 10 (7.6%) |
| $45,000 to $49,999 | 0 (0.0%) | 0 (0.0%) |
| $50,000 to $54,999 | 0 (0.0%) | 0 (0.0%) |
| $55,000 to $64,999 | 104 (40.6%) | 0 (0.0%) |
| $65,000 to $74,999 | 18 (7.0%) | 8 (6.1%) |
| $75,000 to $99,999 | 34 (13.3%) | 7 (5.3%) |
| $100,000+ | 0 (0.0%) | 0 (0.0%) |
| Total | 256 (100.0%) | 132 (100.0%) |
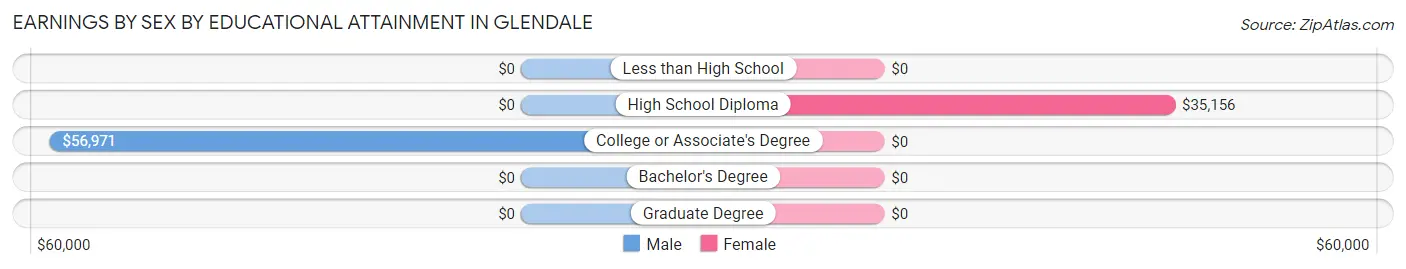
Earnings by Sex by Educational Attainment in Glendale
Average earnings in Glendale are $56,274 for men and $34,342 for women, a difference of 39.0%. Men with an educational attainment of college or associate's degree enjoy the highest average annual earnings of $56,971, while those with college or associate's degree education earn the least with $56,971. Women with an educational attainment of high school diploma earn the most with the average annual earnings of $35,156, while those with high school diploma education have the smallest earnings of $35,156.
| Educational Attainment | Male Income | Female Income |
| Less than High School | - | - |
| High School Diploma | - | - |
| College or Associate's Degree | $56,971 | $0 |
| Bachelor's Degree | - | - |
| Graduate Degree | - | - |
| Total | $56,274 | $34,342 |
Family Income in Glendale
Family Income Brackets in Glendale
According to the Glendale family income data, there are 90 families falling into the $50,000 to $74,999 income range, which is the most common income bracket and makes up 46.4% of all families.
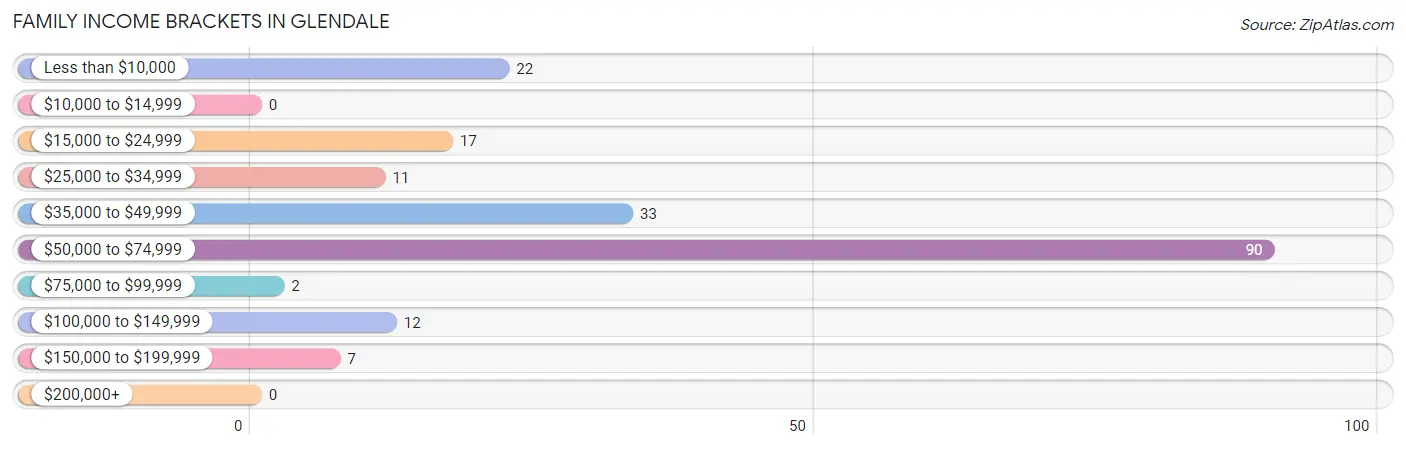
| Income Bracket | # Families | % Families |
| Less than $10,000 | 22 | 11.3% |
| $10,000 to $14,999 | 0 | 0.0% |
| $15,000 to $24,999 | 17 | 8.8% |
| $25,000 to $34,999 | 11 | 5.7% |
| $35,000 to $49,999 | 33 | 17.0% |
| $50,000 to $74,999 | 90 | 46.4% |
| $75,000 to $99,999 | 2 | 1.0% |
| $100,000 to $149,999 | 12 | 6.2% |
| $150,000 to $199,999 | 7 | 3.6% |
| $200,000+ | 0 | 0.0% |
Family Income by Famaliy Size in Glendale
4-person families (44 | 22.7%) account for the highest median family income in Glendale with $56,014 per family, while 2-person families (71 | 36.6%) have the highest median income of $20,625 per family member.
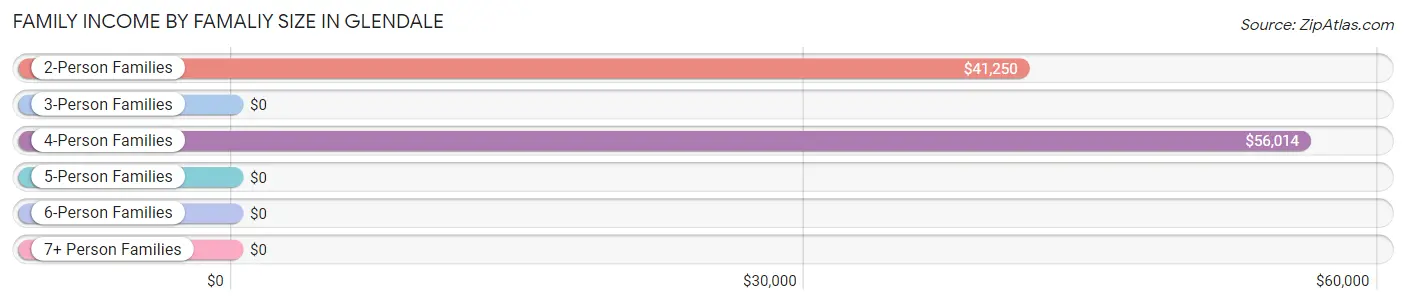
| Income Bracket | # Families | Median Income |
| 2-Person Families | 71 (36.6%) | $41,250 |
| 3-Person Families | 47 (24.2%) | $0 |
| 4-Person Families | 44 (22.7%) | $56,014 |
| 5-Person Families | 24 (12.4%) | $0 |
| 6-Person Families | 8 (4.1%) | $0 |
| 7+ Person Families | 0 (0.0%) | $0 |
| Total | 194 (100.0%) | $55,343 |
Family Income by Number of Earners in Glendale
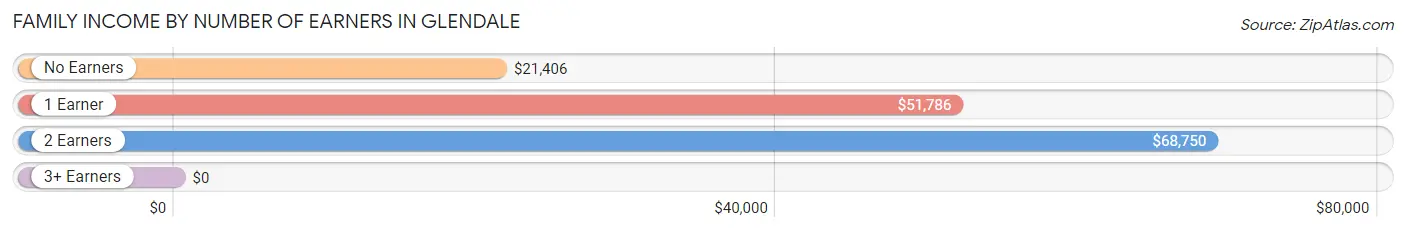
| Number of Earners | # Families | Median Income |
| No Earners | 21 (10.8%) | $21,406 |
| 1 Earner | 120 (61.9%) | $51,786 |
| 2 Earners | 53 (27.3%) | $68,750 |
| 3+ Earners | 0 (0.0%) | $0 |
| Total | 194 (100.0%) | $55,343 |
Household Income in Glendale
Household Income Brackets in Glendale
With 115 households falling in the category, the $50,000 to $74,999 income range is the most frequent in Glendale, accounting for 32.5% of all households.
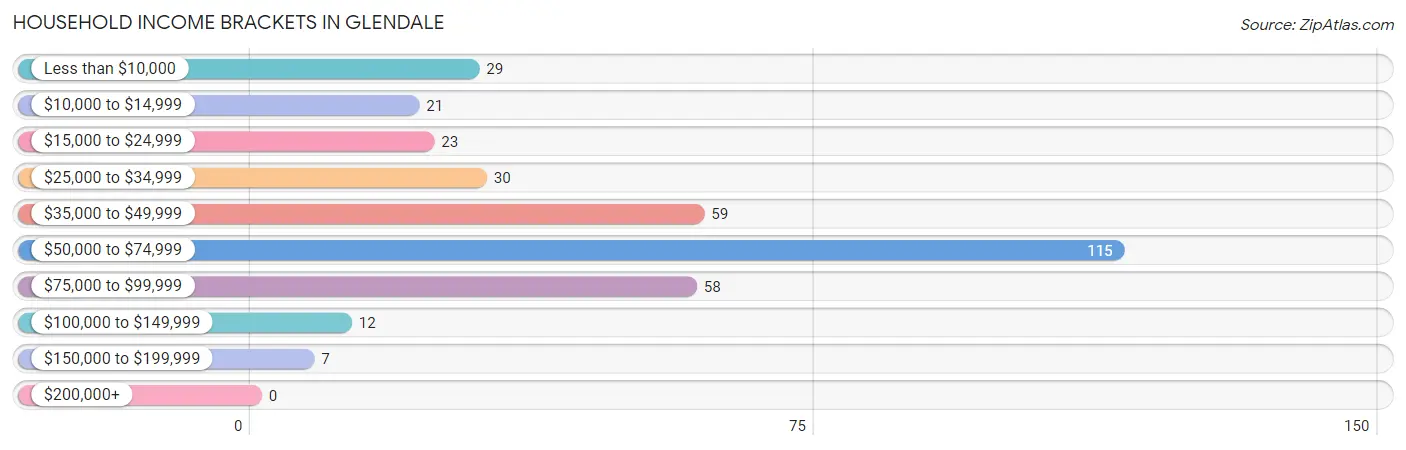
| Income Bracket | # Households | % Households |
| Less than $10,000 | 29 | 8.2% |
| $10,000 to $14,999 | 21 | 5.9% |
| $15,000 to $24,999 | 23 | 6.5% |
| $25,000 to $34,999 | 30 | 8.5% |
| $35,000 to $49,999 | 59 | 16.7% |
| $50,000 to $74,999 | 115 | 32.5% |
| $75,000 to $99,999 | 58 | 16.4% |
| $100,000 to $149,999 | 12 | 3.4% |
| $150,000 to $199,999 | 7 | 2.0% |
| $200,000+ | 0 | 0.0% |
Household Income by Householder Age in Glendale
The median household income in Glendale is $55,481, with the highest median household income of $67,841 found in the 25 to 44 years age bracket for the primary householder. A total of 151 households (42.7%) fall into this category. Meanwhile, the 15 to 24 years age bracket for the primary householder has the lowest median household income of $0, with 18 households (5.1%) in this group.
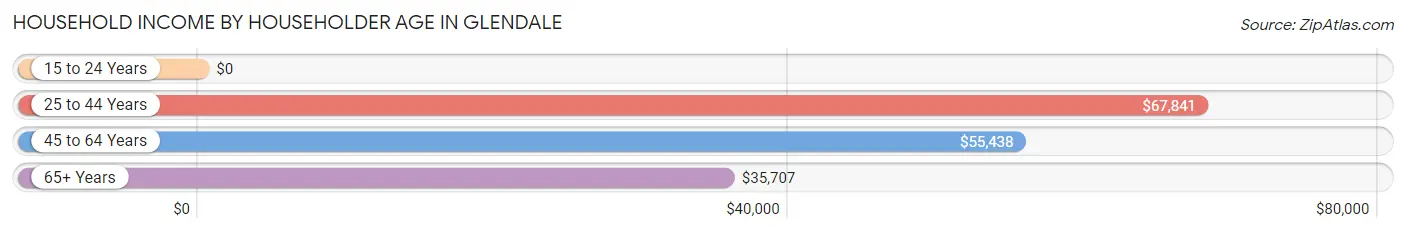
| Income Bracket | # Households | Median Income |
| 15 to 24 Years | 18 (5.1%) | $0 |
| 25 to 44 Years | 151 (42.7%) | $67,841 |
| 45 to 64 Years | 114 (32.2%) | $55,438 |
| 65+ Years | 71 (20.1%) | $35,707 |
| Total | 354 (100.0%) | $55,481 |
Poverty in Glendale
Income Below Poverty by Sex and Age in Glendale
With 14.7% poverty level for males and 10.9% for females among the residents of Glendale, 12 to 14 year old males and under 5 year old females are the most vulnerable to poverty, with 12 males (100.0%) and 11 females (40.7%) in their respective age groups living below the poverty level.
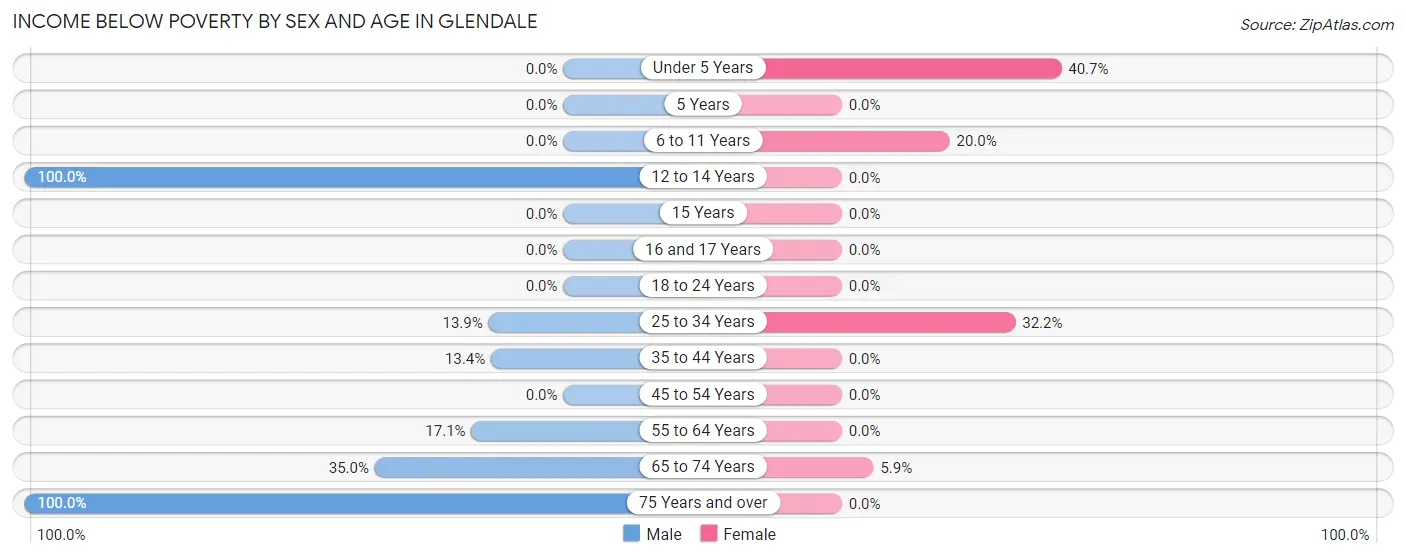
| Age Bracket | Male | Female |
| Under 5 Years | 0 (0.0%) | 11 (40.7%) |
| 5 Years | 0 (0.0%) | 0 (0.0%) |
| 6 to 11 Years | 0 (0.0%) | 14 (20.0%) |
| 12 to 14 Years | 12 (100.0%) | 0 (0.0%) |
| 15 Years | 0 (0.0%) | 0 (0.0%) |
| 16 and 17 Years | 0 (0.0%) | 0 (0.0%) |
| 18 to 24 Years | 0 (0.0%) | 0 (0.0%) |
| 25 to 34 Years | 10 (13.9%) | 19 (32.2%) |
| 35 to 44 Years | 9 (13.4%) | 0 (0.0%) |
| 45 to 54 Years | 0 (0.0%) | 0 (0.0%) |
| 55 to 64 Years | 7 (17.1%) | 0 (0.0%) |
| 65 to 74 Years | 7 (35.0%) | 3 (5.9%) |
| 75 Years and over | 13 (100.0%) | 0 (0.0%) |
| Total | 58 (14.7%) | 47 (10.9%) |
Income Above Poverty by Sex and Age in Glendale
According to the poverty statistics in Glendale, males aged under 5 years and females aged 5 years are the age groups that are most secure financially, with 100.0% of males and 100.0% of females in these age groups living above the poverty line.
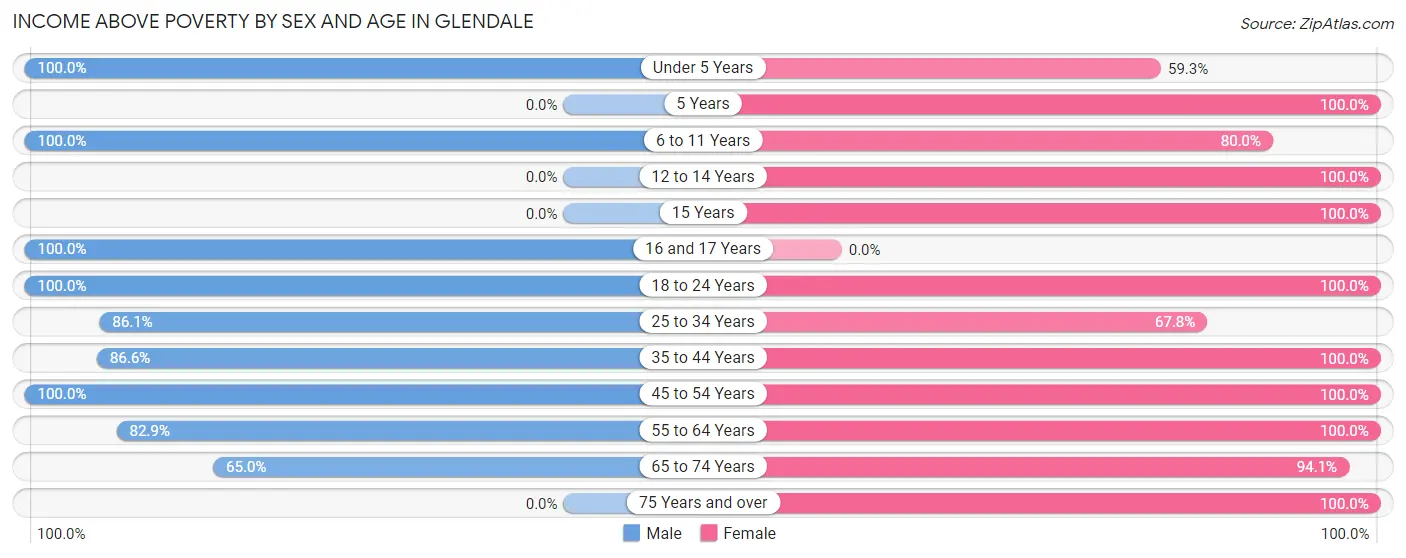
| Age Bracket | Male | Female |
| Under 5 Years | 61 (100.0%) | 16 (59.3%) |
| 5 Years | 0 (0.0%) | 11 (100.0%) |
| 6 to 11 Years | 9 (100.0%) | 56 (80.0%) |
| 12 to 14 Years | 0 (0.0%) | 16 (100.0%) |
| 15 Years | 0 (0.0%) | 13 (100.0%) |
| 16 and 17 Years | 6 (100.0%) | 0 (0.0%) |
| 18 to 24 Years | 16 (100.0%) | 11 (100.0%) |
| 25 to 34 Years | 62 (86.1%) | 40 (67.8%) |
| 35 to 44 Years | 58 (86.6%) | 51 (100.0%) |
| 45 to 54 Years | 78 (100.0%) | 54 (100.0%) |
| 55 to 64 Years | 34 (82.9%) | 53 (100.0%) |
| 65 to 74 Years | 13 (65.0%) | 48 (94.1%) |
| 75 Years and over | 0 (0.0%) | 16 (100.0%) |
| Total | 337 (85.3%) | 385 (89.1%) |
Income Below Poverty Among Married-Couple Families in Glendale
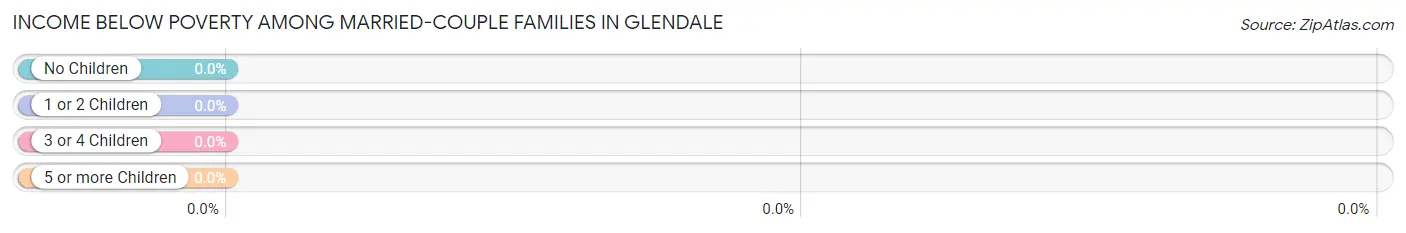
| Children | Above Poverty | Below Poverty |
| No Children | 42 (100.0%) | 0 (0.0%) |
| 1 or 2 Children | 62 (100.0%) | 0 (0.0%) |
| 3 or 4 Children | 32 (100.0%) | 0 (0.0%) |
| 5 or more Children | 0 (0.0%) | 0 (0.0%) |
| Total | 136 (100.0%) | 0 (0.0%) |
Income Below Poverty Among Single-Parent Households in Glendale
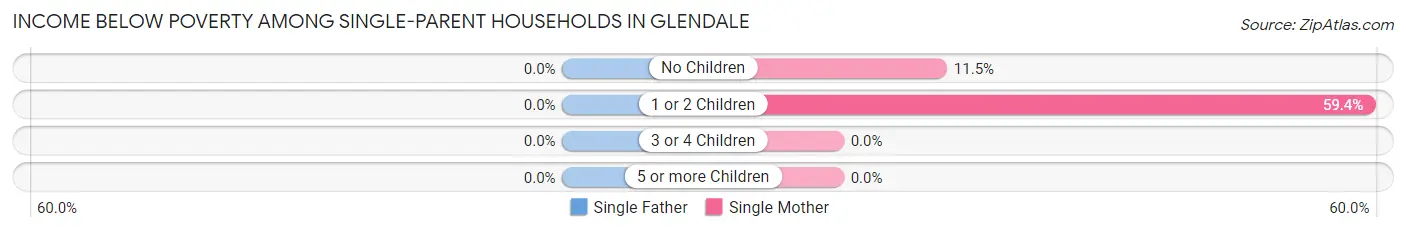
| Children | Single Father | Single Mother |
| No Children | 0 (0.0%) | 3 (11.5%) |
| 1 or 2 Children | 0 (0.0%) | 19 (59.4%) |
| 3 or 4 Children | 0 (0.0%) | 0 (0.0%) |
| 5 or more Children | 0 (0.0%) | 0 (0.0%) |
| Total | 0 (0.0%) | 22 (37.9%) |
Income Below Poverty Among Married-Couple vs Single-Parent Households in Glendale
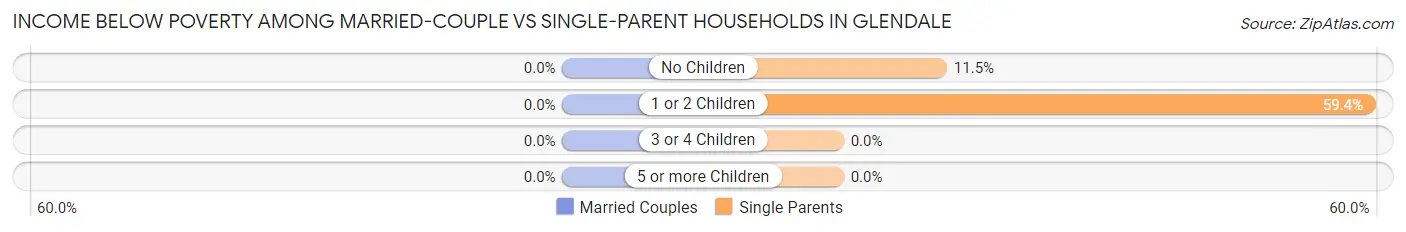
| Children | Married-Couple Families | Single-Parent Households |
| No Children | 0 (0.0%) | 3 (11.5%) |
| 1 or 2 Children | 0 (0.0%) | 19 (59.4%) |
| 3 or 4 Children | 0 (0.0%) | 0 (0.0%) |
| 5 or more Children | 0 (0.0%) | 0 (0.0%) |
| Total | 0 (0.0%) | 22 (37.9%) |
Race in Glendale
The most populous races in Glendale are White / Caucasian (706 | 85.4%), Two or more Races (87 | 10.5%), and Native / Alaskan (34 | 4.1%).
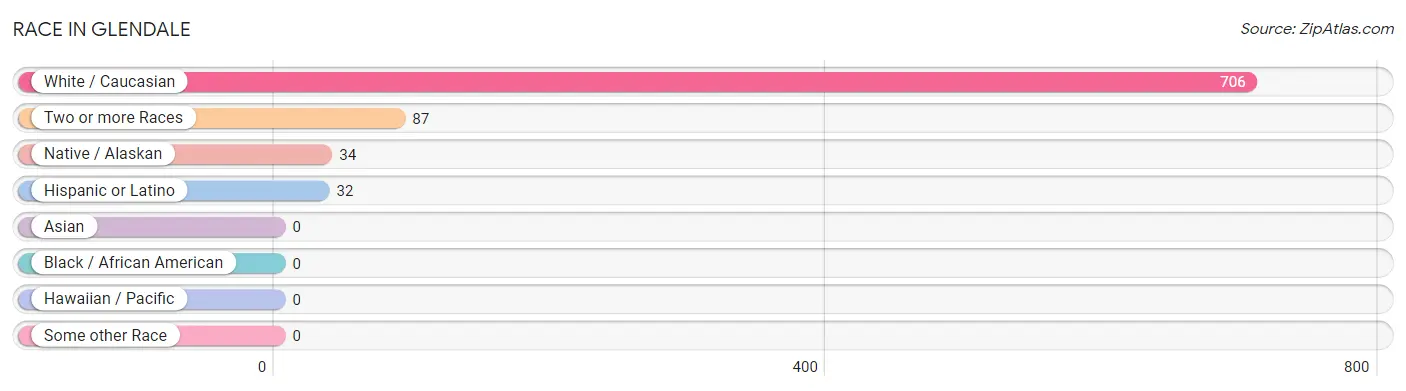
| Race | # Population | % Population |
| Asian | 0 | 0.0% |
| Black / African American | 0 | 0.0% |
| Hawaiian / Pacific | 0 | 0.0% |
| Hispanic or Latino | 32 | 3.9% |
| Native / Alaskan | 34 | 4.1% |
| White / Caucasian | 706 | 85.4% |
| Two or more Races | 87 | 10.5% |
| Some other Race | 0 | 0.0% |
| Total | 827 | 100.0% |
Ancestry in Glendale
The most populous ancestries reported in Glendale are German (215 | 26.0%), Irish (81 | 9.8%), English (80 | 9.7%), European (73 | 8.8%), and Scotch-Irish (60 | 7.3%), together accounting for 61.6% of all Glendale residents.
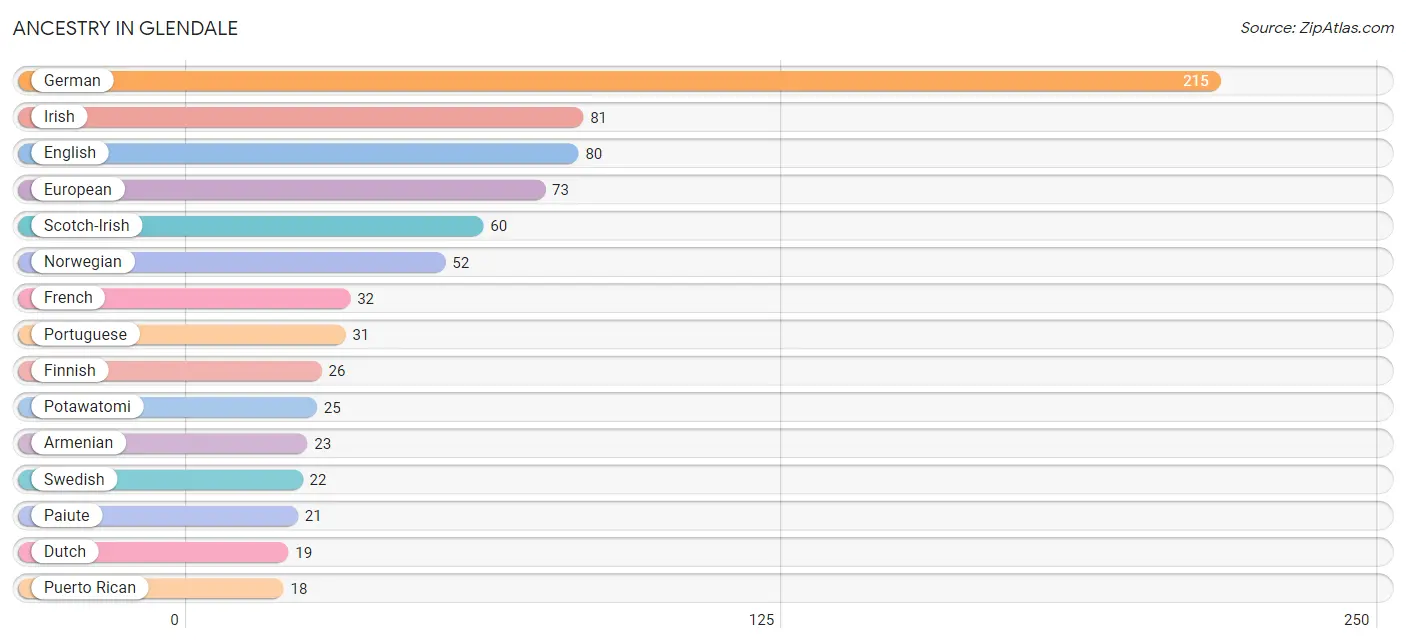
| Ancestry | # Population | % Population |
| Aleut | 16 | 1.9% |
| American | 16 | 1.9% |
| Armenian | 23 | 2.8% |
| Blackfeet | 6 | 0.7% |
| British | 4 | 0.5% |
| Cherokee | 11 | 1.3% |
| Danish | 7 | 0.9% |
| Dutch | 19 | 2.3% |
| English | 80 | 9.7% |
| European | 73 | 8.8% |
| Finnish | 26 | 3.1% |
| French | 32 | 3.9% |
| German | 215 | 26.0% |
| Irish | 81 | 9.8% |
| Italian | 5 | 0.6% |
| Mexican | 13 | 1.6% |
| Norwegian | 52 | 6.3% |
| Paiute | 21 | 2.5% |
| Portuguese | 31 | 3.7% |
| Potawatomi | 25 | 3.0% |
| Puerto Rican | 18 | 2.2% |
| Russian | 14 | 1.7% |
| Scotch-Irish | 60 | 7.3% |
| Spanish | 1 | 0.1% |
| Swedish | 22 | 2.7% |
| Welsh | 7 | 0.9% |
| Yakama | 6 | 0.7% | View All 27 Rows |
Immigrants in Glendale

| Immigration Origin | # Population | % Population | View All 0 Rows |
Sex and Age in Glendale
Sex and Age in Glendale
The most populous age groups in Glendale are Under 5 Years (61 | 15.4%) for men and 5 to 9 Years (54 | 12.5%) for women.
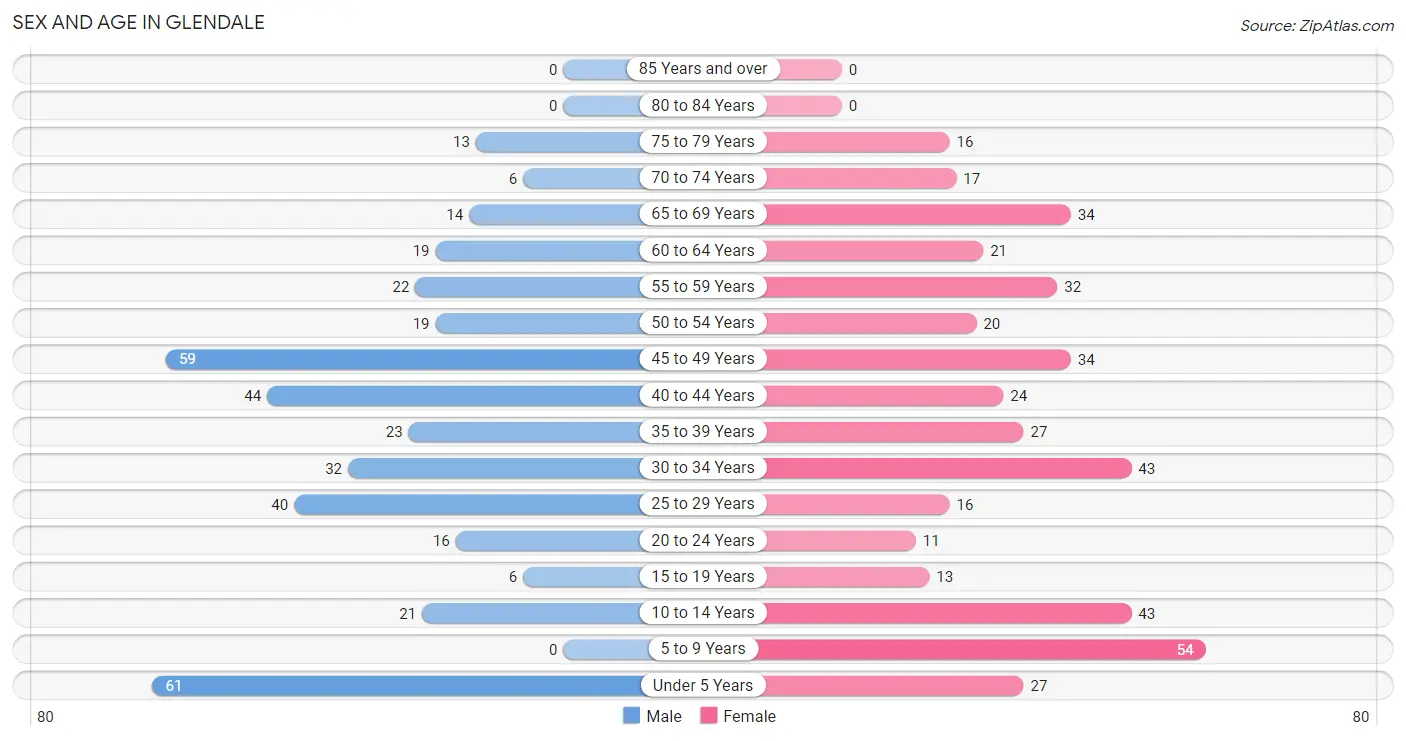
| Age Bracket | Male | Female |
| Under 5 Years | 61 (15.4%) | 27 (6.2%) |
| 5 to 9 Years | 0 (0.0%) | 54 (12.5%) |
| 10 to 14 Years | 21 (5.3%) | 43 (10.0%) |
| 15 to 19 Years | 6 (1.5%) | 13 (3.0%) |
| 20 to 24 Years | 16 (4.1%) | 11 (2.5%) |
| 25 to 29 Years | 40 (10.1%) | 16 (3.7%) |
| 30 to 34 Years | 32 (8.1%) | 43 (10.0%) |
| 35 to 39 Years | 23 (5.8%) | 27 (6.2%) |
| 40 to 44 Years | 44 (11.1%) | 24 (5.6%) |
| 45 to 49 Years | 59 (14.9%) | 34 (7.9%) |
| 50 to 54 Years | 19 (4.8%) | 20 (4.6%) |
| 55 to 59 Years | 22 (5.6%) | 32 (7.4%) |
| 60 to 64 Years | 19 (4.8%) | 21 (4.9%) |
| 65 to 69 Years | 14 (3.5%) | 34 (7.9%) |
| 70 to 74 Years | 6 (1.5%) | 17 (3.9%) |
| 75 to 79 Years | 13 (3.3%) | 16 (3.7%) |
| 80 to 84 Years | 0 (0.0%) | 0 (0.0%) |
| 85 Years and over | 0 (0.0%) | 0 (0.0%) |
| Total | 395 (100.0%) | 432 (100.0%) |
Families and Households in Glendale
Median Family Size in Glendale
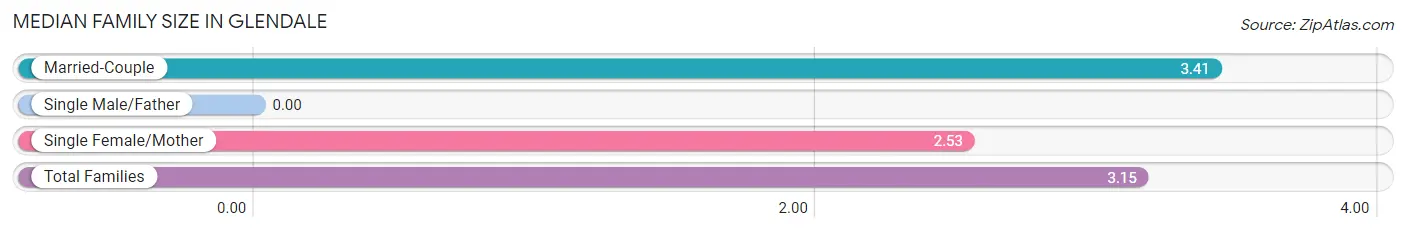
| Family Type | # Families | Family Size |
| Married-Couple | 136 (70.1%) | 3.41 |
| Single Male/Father | 0 (0.0%) | - |
| Single Female/Mother | 58 (29.9%) | 2.53 |
| Total Families | 194 (100.0%) | 3.15 |
Median Household Size in Glendale
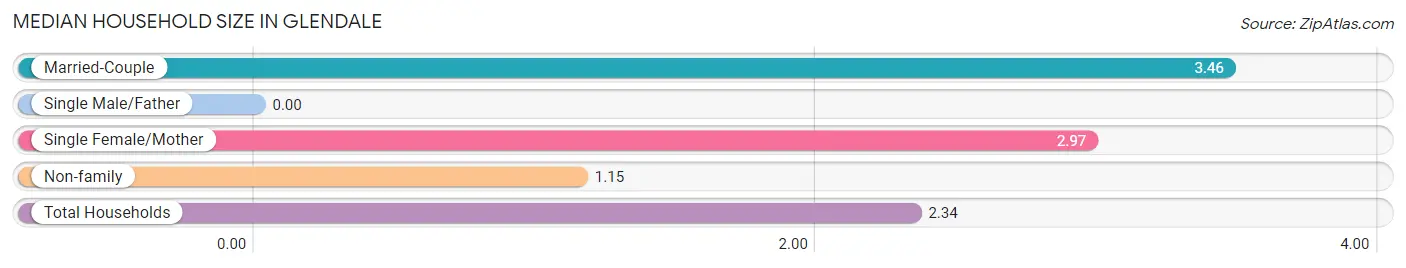
| Household Type | # Households | Household Size |
| Married-Couple | 136 (38.4%) | 3.46 |
| Single Male/Father | 0 (0.0%) | - |
| Single Female/Mother | 58 (16.4%) | 2.97 |
| Non-family | 160 (45.2%) | 1.15 |
| Total Households | 354 (100.0%) | 2.34 |
Household Size by Marriage Status in Glendale
Out of a total of 354 households in Glendale, 194 (54.8%) are family households, while 160 (45.2%) are nonfamily households. The most numerous type of family households are 4-person households, comprising 60, and the most common type of nonfamily households are 1-person households, comprising 136.
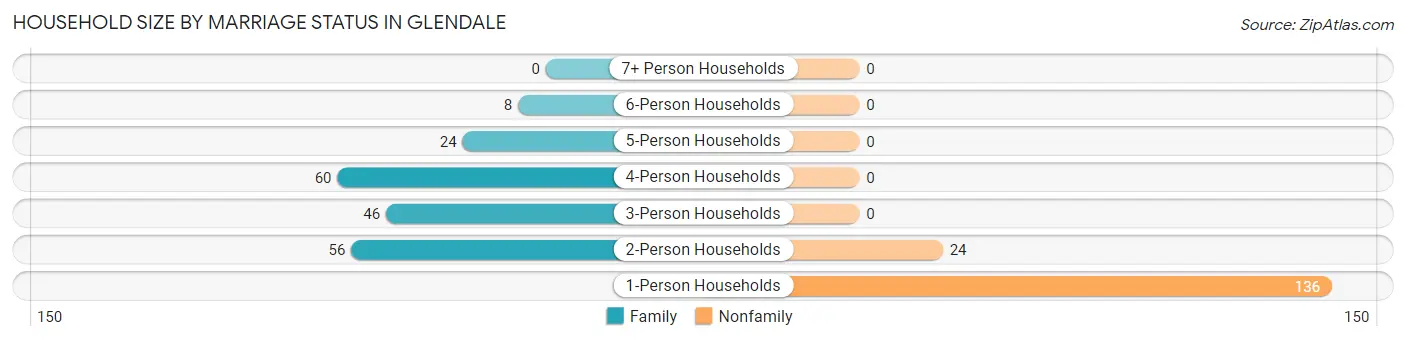
| Household Size | Family Households | Nonfamily Households |
| 1-Person Households | - | 136 (38.4%) |
| 2-Person Households | 56 (15.8%) | 24 (6.8%) |
| 3-Person Households | 46 (13.0%) | 0 (0.0%) |
| 4-Person Households | 60 (17.0%) | 0 (0.0%) |
| 5-Person Households | 24 (6.8%) | 0 (0.0%) |
| 6-Person Households | 8 (2.3%) | 0 (0.0%) |
| 7+ Person Households | 0 (0.0%) | 0 (0.0%) |
| Total | 194 (54.8%) | 160 (45.2%) |
Female Fertility in Glendale
Fertility by Age in Glendale
Average fertility rate in Glendale is 154.0 births per 1,000 women. Women in the age bracket of 20 to 34 years have the highest fertility rate with 386.0 births per 1,000 women. Women in the age bracket of 20 to 34 years acount for 100.0% of all women with births.
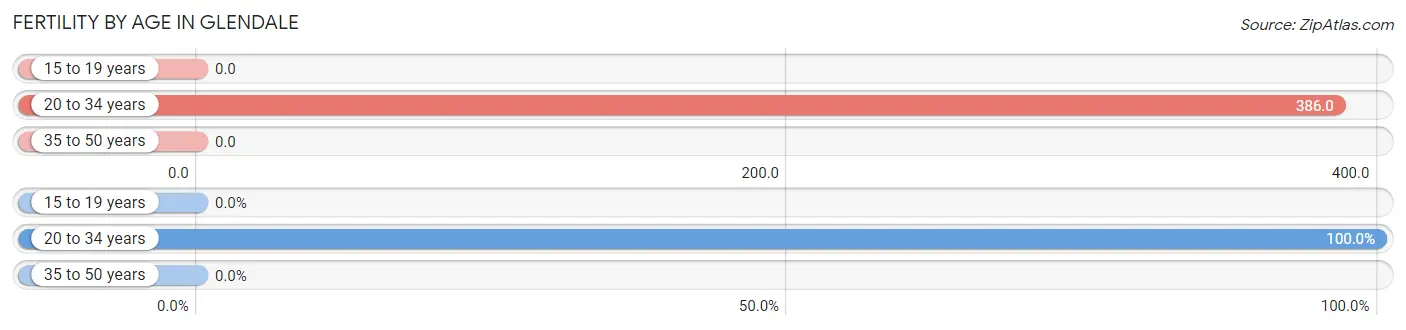
| Age Bracket | Women with Births | Births / 1,000 Women |
| 15 to 19 years | 0 (0.0%) | 0.0 |
| 20 to 34 years | 27 (100.0%) | 386.0 |
| 35 to 50 years | 0 (0.0%) | 0.0 |
| Total | 27 (100.0%) | 154.0 |
Fertility by Age by Marriage Status in Glendale
88.9% of women with births (27) in Glendale are married. The highest percentage of unmarried women with births falls into 20 to 34 years age bracket with 11.1% of them unmarried at the time of birth, while the lowest percentage of unmarried women with births belong to 20 to 34 years age bracket with 11.1% of them unmarried.
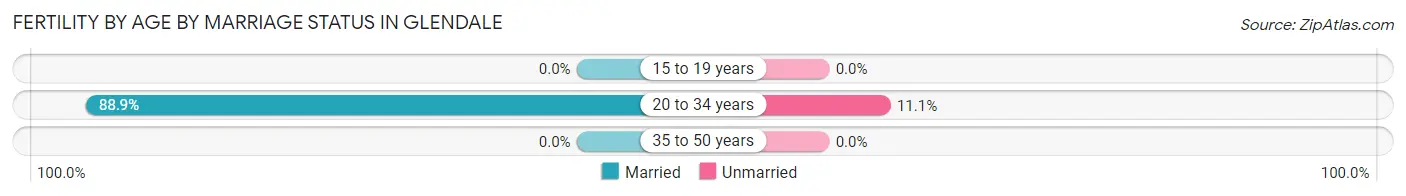
| Age Bracket | Married | Unmarried |
| 15 to 19 years | 0 (0.0%) | 0 (0.0%) |
| 20 to 34 years | 24 (88.9%) | 3 (11.1%) |
| 35 to 50 years | 0 (0.0%) | 0 (0.0%) |
| Total | 24 (88.9%) | 3 (11.1%) |
Fertility by Education in Glendale
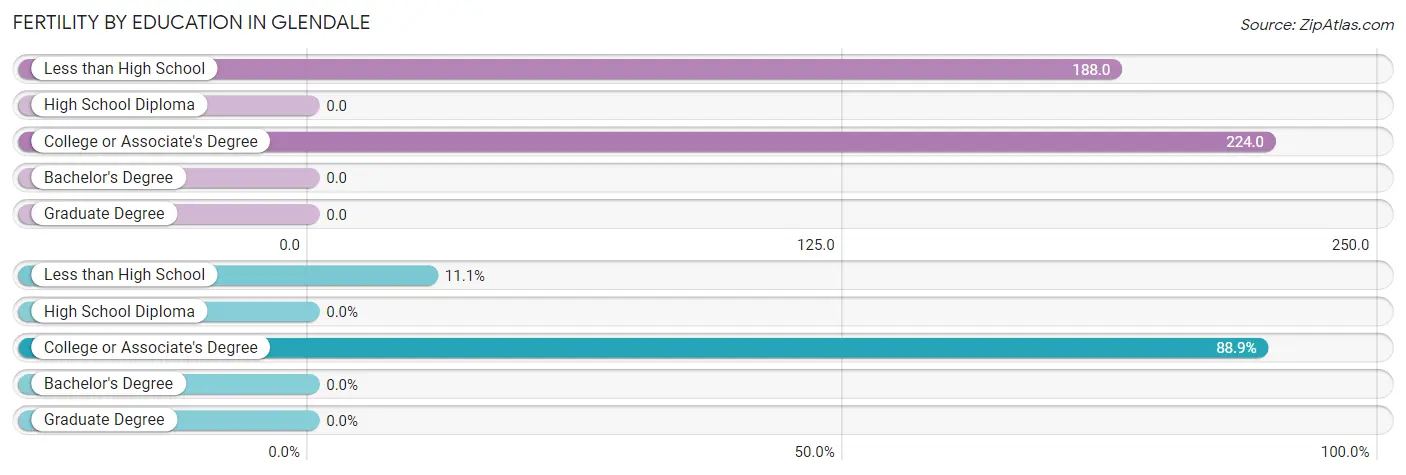
| Educational Attainment | Women with Births | Births / 1,000 Women |
| Less than High School | 3 (11.1%) | 188.0 |
| High School Diploma | 0 (0.0%) | 0.0 |
| College or Associate's Degree | 24 (88.9%) | 224.0 |
| Bachelor's Degree | 0 (0.0%) | 0.0 |
| Graduate Degree | 0 (0.0%) | 0.0 |
| Total | 27 (100.0%) | 154.0 |
Fertility by Education by Marriage Status in Glendale
11.1% of women with births in Glendale are unmarried. Women with the educational attainment of college or associate's degree are most likely to be married with 100.0% of them married at childbirth, while women with the educational attainment of less than high school are least likely to be married with 100.0% of them unmarried at childbirth.
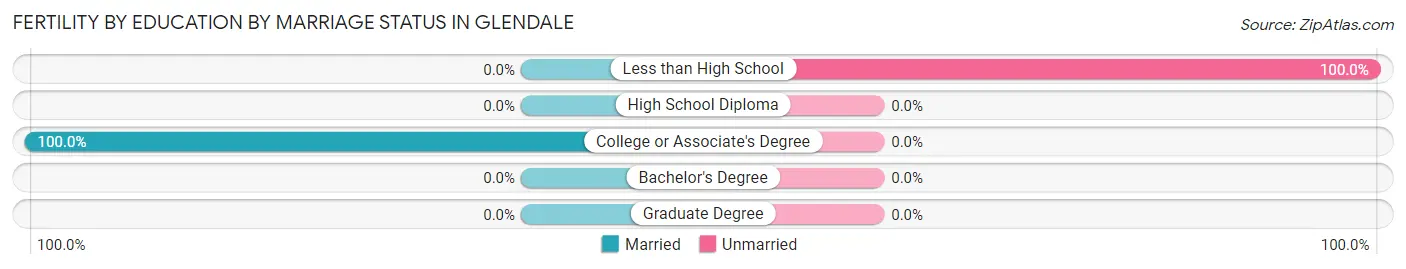
| Educational Attainment | Married | Unmarried |
| Less than High School | 0 (0.0%) | 3 (100.0%) |
| High School Diploma | 0 (0.0%) | 0 (0.0%) |
| College or Associate's Degree | 24 (100.0%) | 0 (0.0%) |
| Bachelor's Degree | 0 (0.0%) | 0 (0.0%) |
| Graduate Degree | 0 (0.0%) | 0 (0.0%) |
| Total | 24 (88.9%) | 3 (11.1%) |
Employment Characteristics in Glendale
Employment by Class of Employer in Glendale
Among the 343 employed individuals in Glendale, private company employees (243 | 70.9%), local government employees (46 | 13.4%), and self-employed (not incorporated) (16 | 4.7%) make up the most common classes of employment.
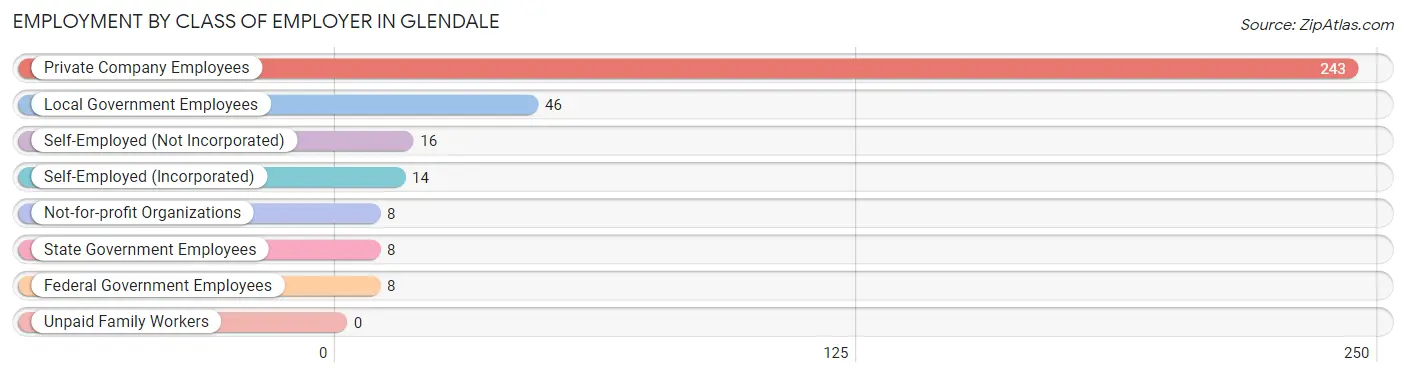
| Employer Class | # Employees | % Employees |
| Private Company Employees | 243 | 70.9% |
| Self-Employed (Incorporated) | 14 | 4.1% |
| Self-Employed (Not Incorporated) | 16 | 4.7% |
| Not-for-profit Organizations | 8 | 2.3% |
| Local Government Employees | 46 | 13.4% |
| State Government Employees | 8 | 2.3% |
| Federal Government Employees | 8 | 2.3% |
| Unpaid Family Workers | 0 | 0.0% |
| Total | 343 | 100.0% |
Employment Status by Age in Glendale
According to the labor force statistics for Glendale, out of the total population over 16 years of age (608), 64.3% or 391 individuals are in the labor force, with 12.3% or 48 of them unemployed. The age group with the highest labor force participation rate is 35 to 44 years, with 100.0% or 118 individuals in the labor force. Within the labor force, the 25 to 29 years age range has the highest percentage of unemployed individuals, with 48.8% or 21 of them being unemployed.
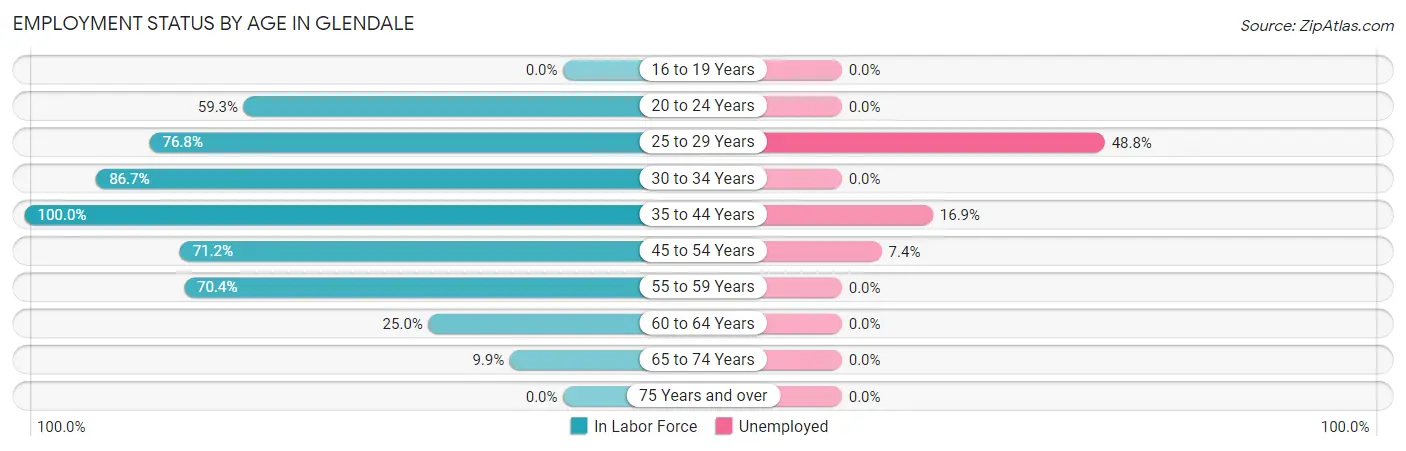
| Age Bracket | In Labor Force | Unemployed |
| 16 to 19 Years | 0 (0.0%) | 0 (0.0%) |
| 20 to 24 Years | 16 (59.3%) | 0 (0.0%) |
| 25 to 29 Years | 43 (76.8%) | 21 (48.8%) |
| 30 to 34 Years | 65 (86.7%) | 0 (0.0%) |
| 35 to 44 Years | 118 (100.0%) | 20 (16.9%) |
| 45 to 54 Years | 94 (71.2%) | 7 (7.4%) |
| 55 to 59 Years | 38 (70.4%) | 0 (0.0%) |
| 60 to 64 Years | 10 (25.0%) | 0 (0.0%) |
| 65 to 74 Years | 7 (9.9%) | 0 (0.0%) |
| 75 Years and over | 0 (0.0%) | 0 (0.0%) |
| Total | 391 (64.3%) | 48 (12.3%) |
Employment Status by Educational Attainment in Glendale
According to labor force statistics for Glendale, 77.5% of individuals (368) out of the total population between 25 and 64 years of age (475) are in the labor force, with 13.0% or 48 of them being unemployed. The group with the highest labor force participation rate are those with the educational attainment of less than high school, with 100.0% or 37 individuals in the labor force. Within the labor force, individuals with college / associate degree education have the highest percentage of unemployment, with 17.8% or 33 of them being unemployed.
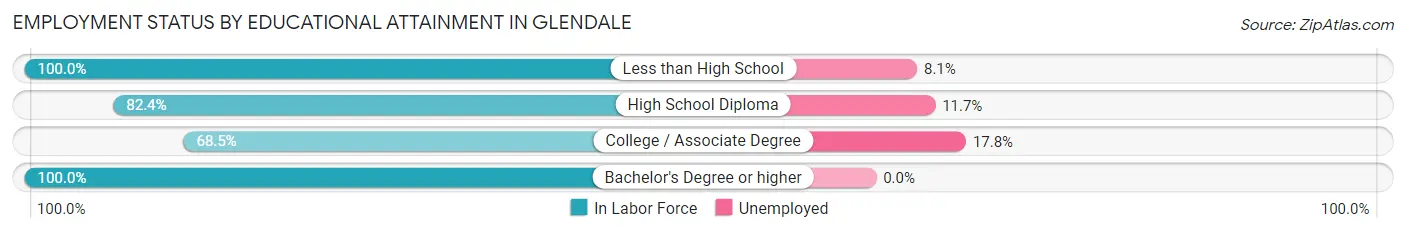
| Educational Attainment | In Labor Force | Unemployed |
| Less than High School | 37 (100.0%) | 3 (8.1%) |
| High School Diploma | 103 (82.4%) | 15 (11.7%) |
| College / Associate Degree | 185 (68.5%) | 48 (17.8%) |
| Bachelor's Degree or higher | 43 (100.0%) | 0 (0.0%) |
| Total | 368 (77.5%) | 62 (13.0%) |
Employment Occupations by Sex in Glendale
Management, Business, Science and Arts Occupations
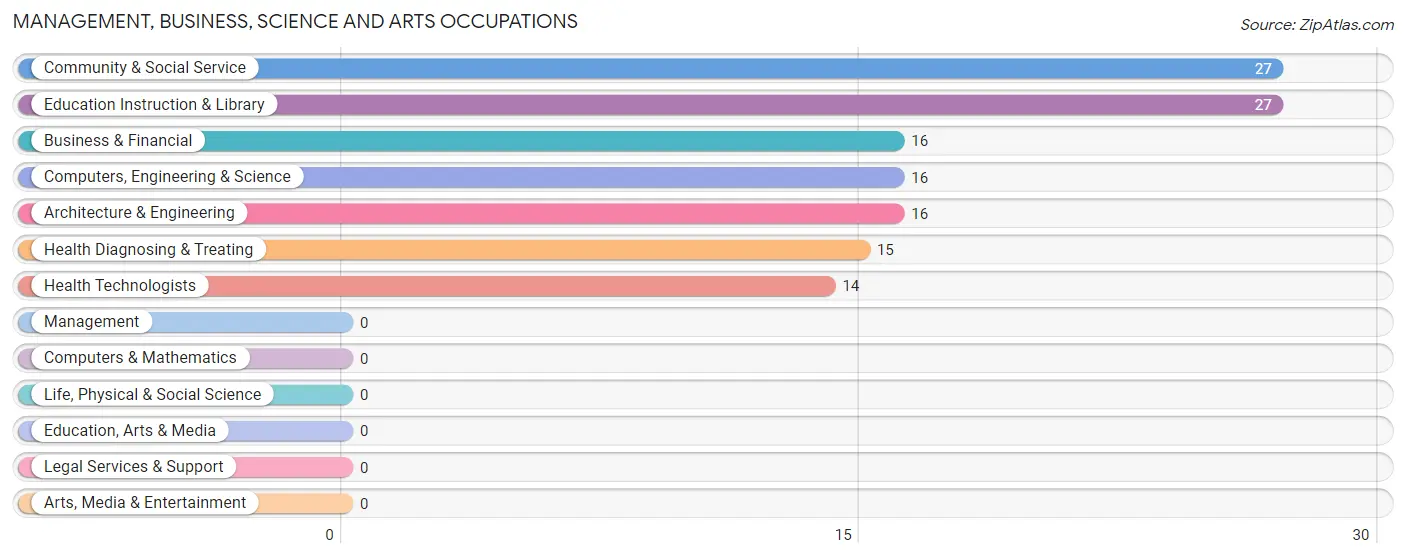
The most common Management, Business, Science and Arts occupations in Glendale are Community & Social Service (27 | 7.9%), Education Instruction & Library (27 | 7.9%), Business & Financial (16 | 4.7%), Computers, Engineering & Science (16 | 4.7%), and Architecture & Engineering (16 | 4.7%).
Management, Business, Science and Arts Occupations by Sex
Within the Management, Business, Science and Arts occupations in Glendale, the most male-oriented occupations are Computers, Engineering & Science (100.0%), Architecture & Engineering (100.0%), and Community & Social Service (100.0%), while the most female-oriented occupations are Business & Financial (100.0%), Health Diagnosing & Treating (100.0%), and Health Technologists (100.0%).
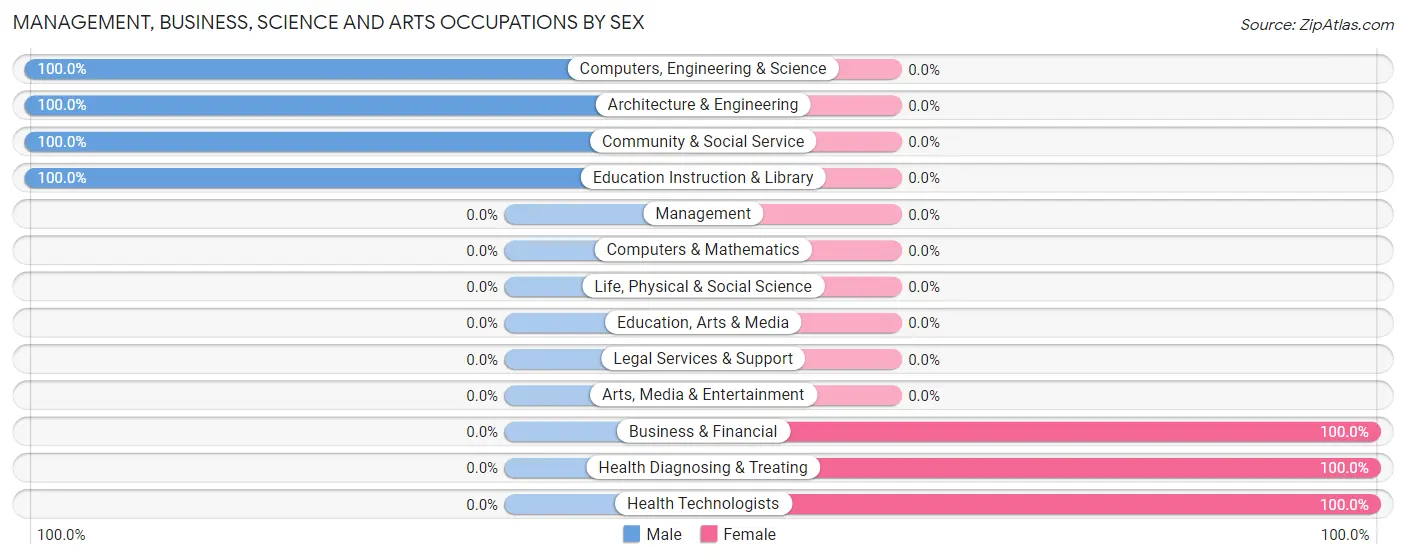
| Occupation | Male | Female |
| Management | 0 (0.0%) | 0 (0.0%) |
| Business & Financial | 0 (0.0%) | 16 (100.0%) |
| Computers, Engineering & Science | 16 (100.0%) | 0 (0.0%) |
| Computers & Mathematics | 0 (0.0%) | 0 (0.0%) |
| Architecture & Engineering | 16 (100.0%) | 0 (0.0%) |
| Life, Physical & Social Science | 0 (0.0%) | 0 (0.0%) |
| Community & Social Service | 27 (100.0%) | 0 (0.0%) |
| Education, Arts & Media | 0 (0.0%) | 0 (0.0%) |
| Legal Services & Support | 0 (0.0%) | 0 (0.0%) |
| Education Instruction & Library | 27 (100.0%) | 0 (0.0%) |
| Arts, Media & Entertainment | 0 (0.0%) | 0 (0.0%) |
| Health Diagnosing & Treating | 0 (0.0%) | 15 (100.0%) |
| Health Technologists | 0 (0.0%) | 14 (100.0%) |
| Total (Category) | 43 (58.1%) | 31 (41.9%) |
| Total (Overall) | 211 (61.5%) | 132 (38.5%) |
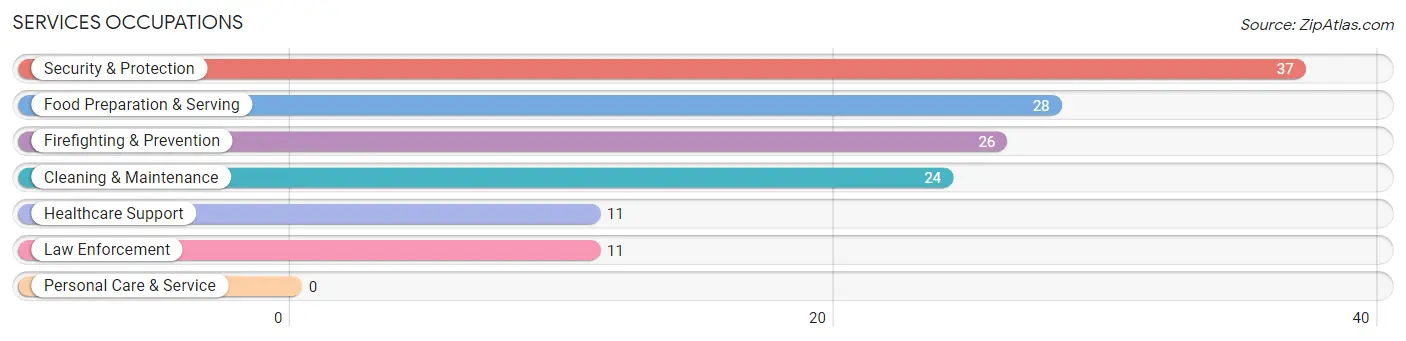
Services Occupations
The most common Services occupations in Glendale are Security & Protection (37 | 10.8%), Food Preparation & Serving (28 | 8.2%), Firefighting & Prevention (26 | 7.6%), Cleaning & Maintenance (24 | 7.0%), and Healthcare Support (11 | 3.2%).
Services Occupations by Sex
Within the Services occupations in Glendale, the most male-oriented occupations are Security & Protection (100.0%), Firefighting & Prevention (100.0%), and Law Enforcement (100.0%), while the most female-oriented occupations are Healthcare Support (100.0%), Cleaning & Maintenance (100.0%), and Food Preparation & Serving (67.9%).
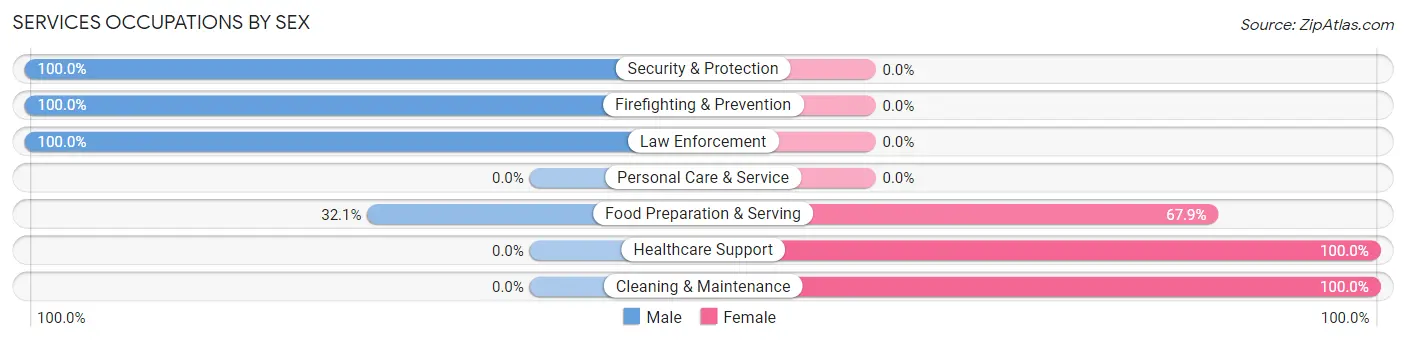
| Occupation | Male | Female |
| Healthcare Support | 0 (0.0%) | 11 (100.0%) |
| Security & Protection | 37 (100.0%) | 0 (0.0%) |
| Firefighting & Prevention | 26 (100.0%) | 0 (0.0%) |
| Law Enforcement | 11 (100.0%) | 0 (0.0%) |
| Food Preparation & Serving | 9 (32.1%) | 19 (67.9%) |
| Cleaning & Maintenance | 0 (0.0%) | 24 (100.0%) |
| Personal Care & Service | 0 (0.0%) | 0 (0.0%) |
| Total (Category) | 46 (46.0%) | 54 (54.0%) |
| Total (Overall) | 211 (61.5%) | 132 (38.5%) |
Sales and Office Occupations
The most common Sales and Office occupations in Glendale are Sales & Related (8 | 2.3%), and Office & Administration (8 | 2.3%).
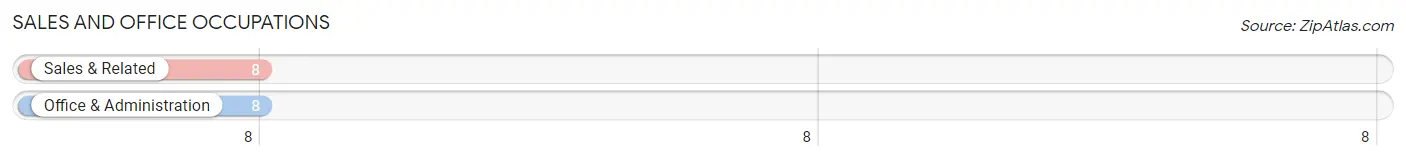
Sales and Office Occupations by Sex
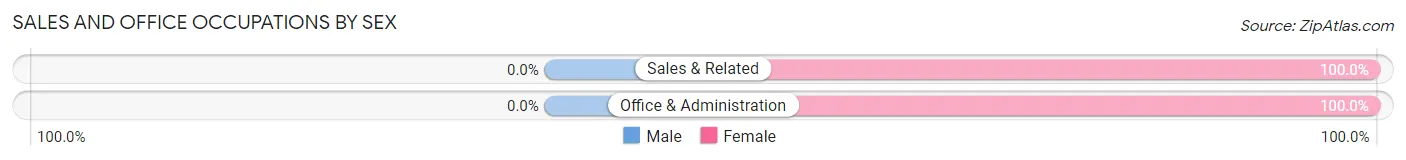
| Occupation | Male | Female |
| Sales & Related | 0 (0.0%) | 8 (100.0%) |
| Office & Administration | 0 (0.0%) | 8 (100.0%) |
| Total (Category) | 0 (0.0%) | 16 (100.0%) |
| Total (Overall) | 211 (61.5%) | 132 (38.5%) |
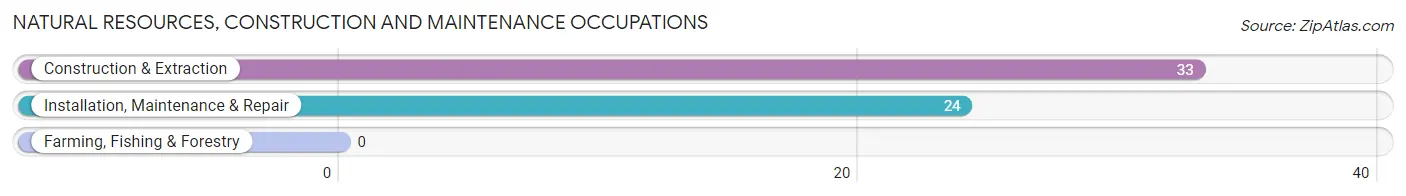
Natural Resources, Construction and Maintenance Occupations
The most common Natural Resources, Construction and Maintenance occupations in Glendale are Construction & Extraction (33 | 9.6%), and Installation, Maintenance & Repair (24 | 7.0%).
Natural Resources, Construction and Maintenance Occupations by Sex
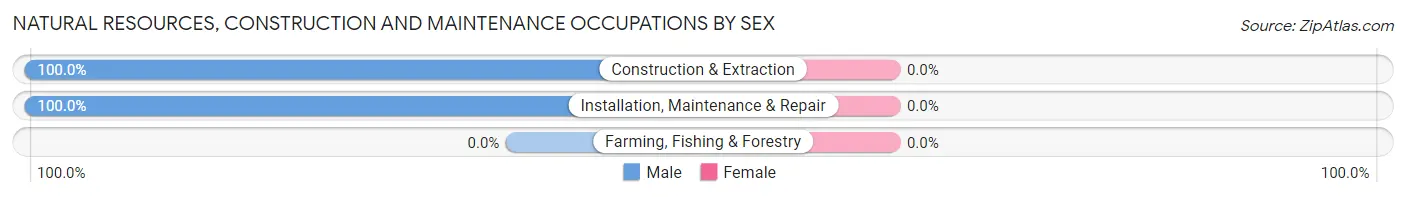
| Occupation | Male | Female |
| Farming, Fishing & Forestry | 0 (0.0%) | 0 (0.0%) |
| Construction & Extraction | 33 (100.0%) | 0 (0.0%) |
| Installation, Maintenance & Repair | 24 (100.0%) | 0 (0.0%) |
| Total (Category) | 57 (100.0%) | 0 (0.0%) |
| Total (Overall) | 211 (61.5%) | 132 (38.5%) |
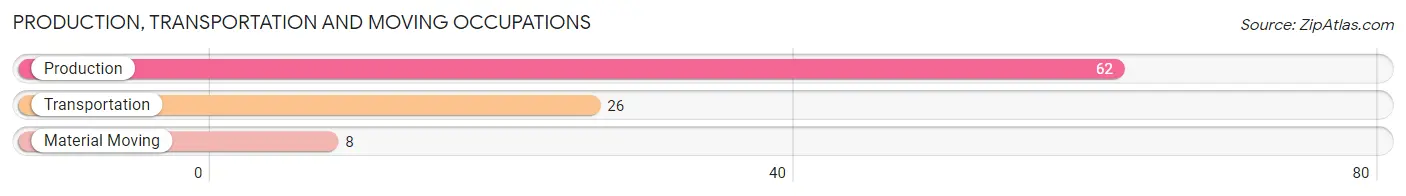
Production, Transportation and Moving Occupations
The most common Production, Transportation and Moving occupations in Glendale are Production (62 | 18.1%), Transportation (26 | 7.6%), and Material Moving (8 | 2.3%).
Production, Transportation and Moving Occupations by Sex
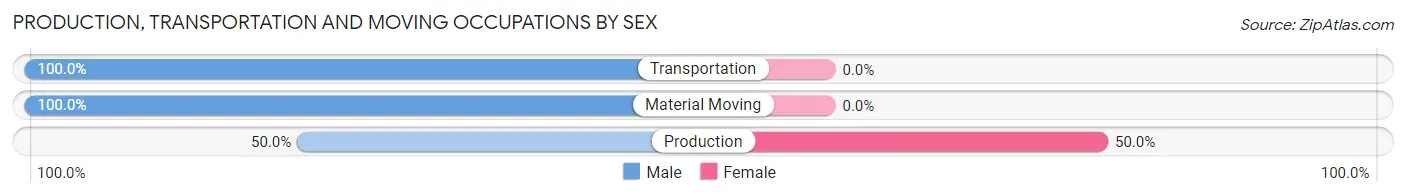
| Occupation | Male | Female |
| Production | 31 (50.0%) | 31 (50.0%) |
| Transportation | 26 (100.0%) | 0 (0.0%) |
| Material Moving | 8 (100.0%) | 0 (0.0%) |
| Total (Category) | 65 (67.7%) | 31 (32.3%) |
| Total (Overall) | 211 (61.5%) | 132 (38.5%) |
Employment Industries by Sex in Glendale
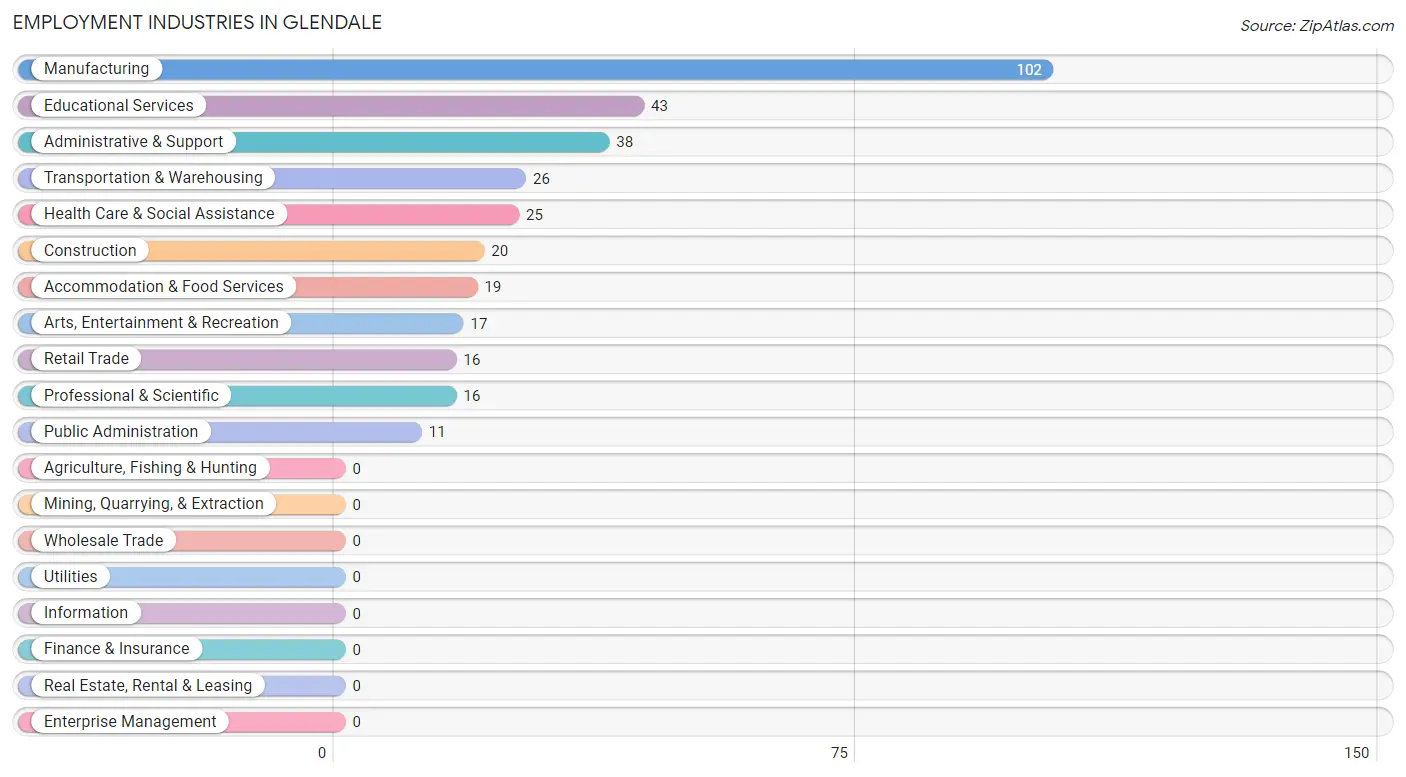
Employment Industries in Glendale
The major employment industries in Glendale include Manufacturing (102 | 29.7%), Educational Services (43 | 12.5%), Administrative & Support (38 | 11.1%), Transportation & Warehousing (26 | 7.6%), and Health Care & Social Assistance (25 | 7.3%).
Employment Industries by Sex in Glendale
The Glendale industries that see more men than women are Construction (100.0%), Retail Trade (100.0%), and Public Administration (100.0%), whereas the industries that tend to have a higher number of women are Professional & Scientific (100.0%), Health Care & Social Assistance (100.0%), and Accommodation & Food Services (100.0%).
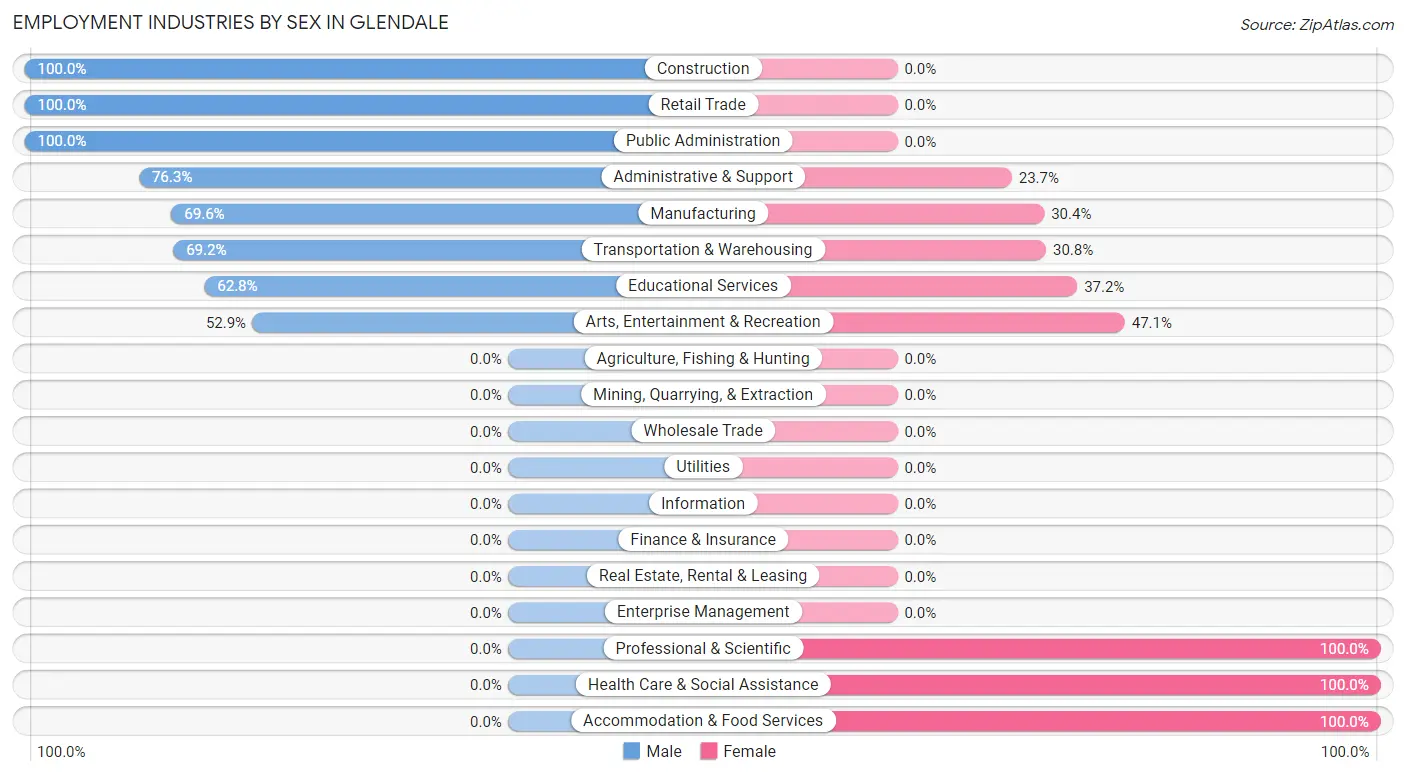
| Industry | Male | Female |
| Agriculture, Fishing & Hunting | 0 (0.0%) | 0 (0.0%) |
| Mining, Quarrying, & Extraction | 0 (0.0%) | 0 (0.0%) |
| Construction | 20 (100.0%) | 0 (0.0%) |
| Manufacturing | 71 (69.6%) | 31 (30.4%) |
| Wholesale Trade | 0 (0.0%) | 0 (0.0%) |
| Retail Trade | 16 (100.0%) | 0 (0.0%) |
| Transportation & Warehousing | 18 (69.2%) | 8 (30.8%) |
| Utilities | 0 (0.0%) | 0 (0.0%) |
| Information | 0 (0.0%) | 0 (0.0%) |
| Finance & Insurance | 0 (0.0%) | 0 (0.0%) |
| Real Estate, Rental & Leasing | 0 (0.0%) | 0 (0.0%) |
| Professional & Scientific | 0 (0.0%) | 16 (100.0%) |
| Enterprise Management | 0 (0.0%) | 0 (0.0%) |
| Administrative & Support | 29 (76.3%) | 9 (23.7%) |
| Educational Services | 27 (62.8%) | 16 (37.2%) |
| Health Care & Social Assistance | 0 (0.0%) | 25 (100.0%) |
| Arts, Entertainment & Recreation | 9 (52.9%) | 8 (47.1%) |
| Accommodation & Food Services | 0 (0.0%) | 19 (100.0%) |
| Public Administration | 11 (100.0%) | 0 (0.0%) |
| Total | 211 (61.5%) | 132 (38.5%) |
Education in Glendale
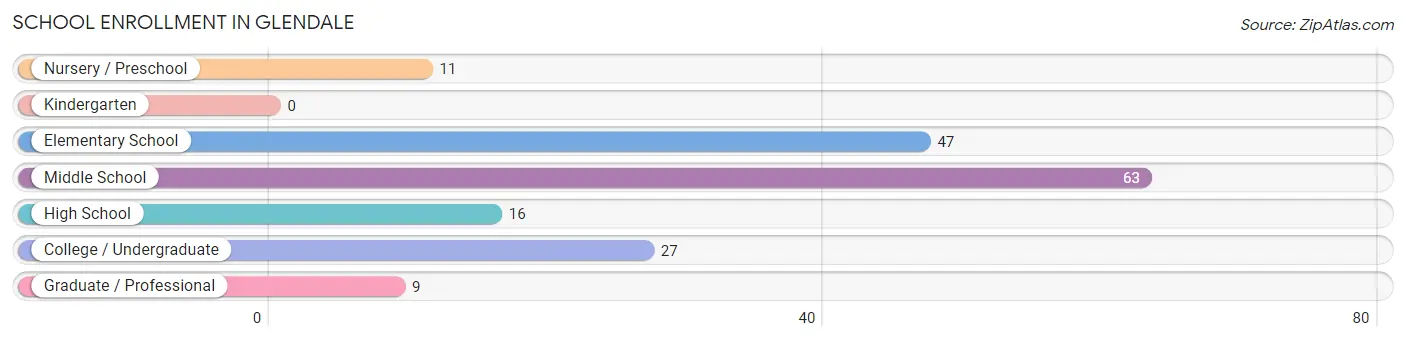
School Enrollment in Glendale
The most common levels of schooling among the 173 students in Glendale are middle school (63 | 36.4%), elementary school (47 | 27.2%), and college / undergraduate (27 | 15.6%).
| School Level | # Students | % Students |
| Nursery / Preschool | 11 | 6.4% |
| Kindergarten | 0 | 0.0% |
| Elementary School | 47 | 27.2% |
| Middle School | 63 | 36.4% |
| High School | 16 | 9.2% |
| College / Undergraduate | 27 | 15.6% |
| Graduate / Professional | 9 | 5.2% |
| Total | 173 | 100.0% |
School Enrollment by Age by Funding Source in Glendale
Out of a total of 173 students who are enrolled in schools in Glendale, 38 (22.0%) attend a private institution, while the remaining 135 (78.0%) are enrolled in public schools. The age group of 35 years and over has the highest likelihood of being enrolled in private schools, with 9 (100.0% in the age bracket) enrolled. Conversely, the age group of 15 to 17 year olds has the lowest likelihood of being enrolled in a private school, with 19 (100.0% in the age bracket) attending a public institution.
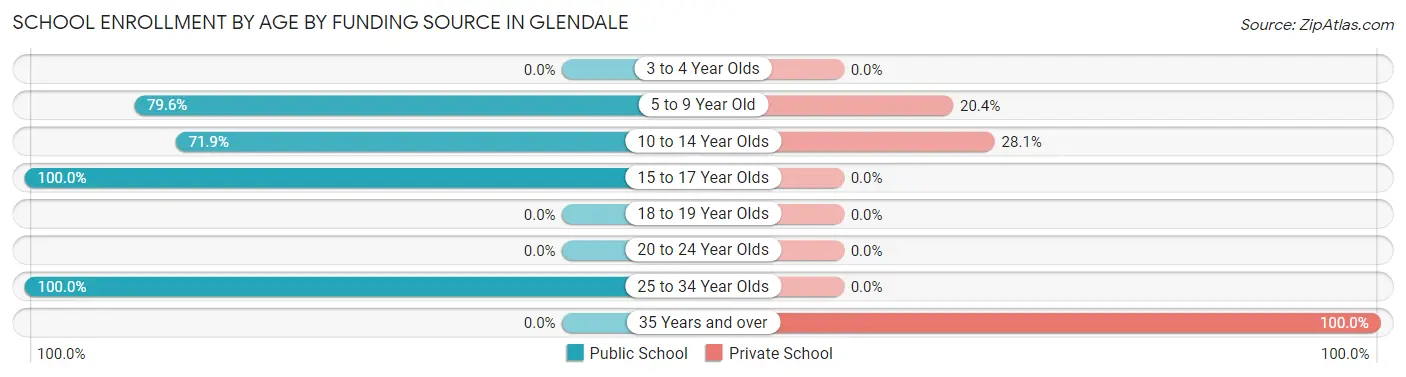
| Age Bracket | Public School | Private School |
| 3 to 4 Year Olds | 0 (0.0%) | 0 (0.0%) |
| 5 to 9 Year Old | 43 (79.6%) | 11 (20.4%) |
| 10 to 14 Year Olds | 46 (71.9%) | 18 (28.1%) |
| 15 to 17 Year Olds | 19 (100.0%) | 0 (0.0%) |
| 18 to 19 Year Olds | 0 (0.0%) | 0 (0.0%) |
| 20 to 24 Year Olds | 0 (0.0%) | 0 (0.0%) |
| 25 to 34 Year Olds | 27 (100.0%) | 0 (0.0%) |
| 35 Years and over | 0 (0.0%) | 9 (100.0%) |
| Total | 135 (78.0%) | 38 (22.0%) |
Educational Attainment by Field of Study in Glendale
Liberal arts & history (27 | 62.8%), and computers & mathematics (16 | 37.2%) are the most common fields of study among 43 individuals in Glendale who have obtained a bachelor's degree or higher.
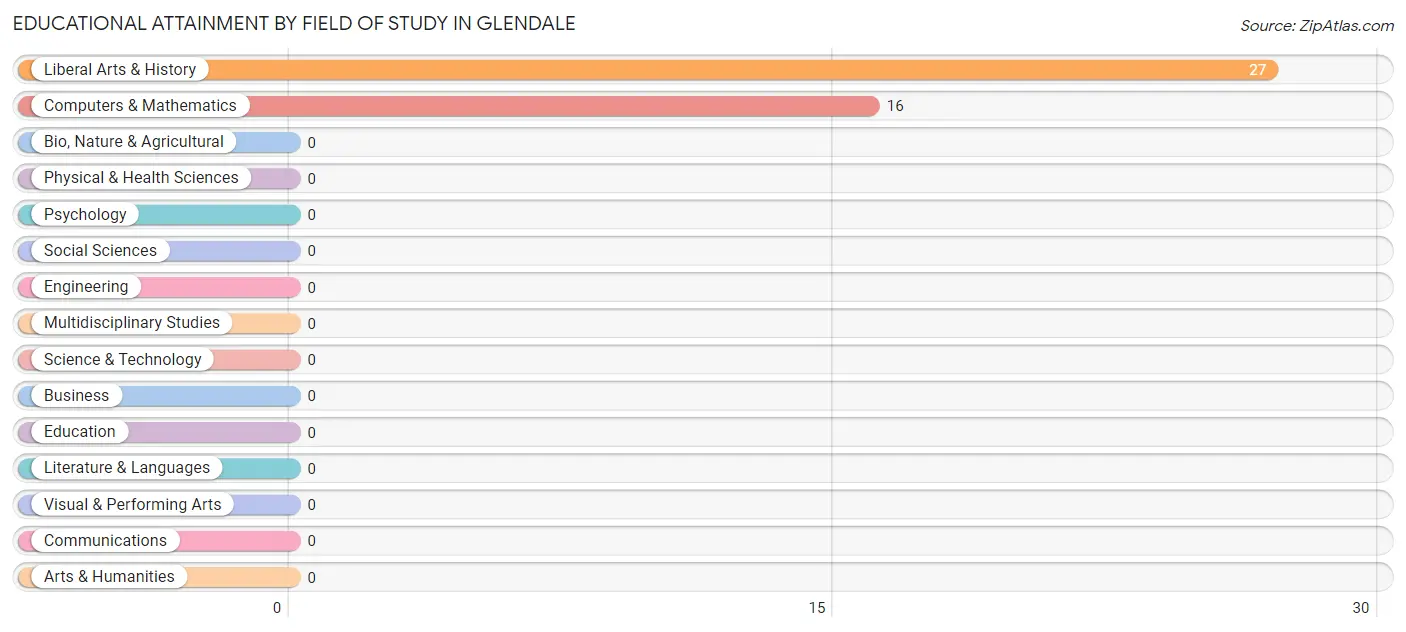
| Field of Study | # Graduates | % Graduates |
| Computers & Mathematics | 16 | 37.2% |
| Bio, Nature & Agricultural | 0 | 0.0% |
| Physical & Health Sciences | 0 | 0.0% |
| Psychology | 0 | 0.0% |
| Social Sciences | 0 | 0.0% |
| Engineering | 0 | 0.0% |
| Multidisciplinary Studies | 0 | 0.0% |
| Science & Technology | 0 | 0.0% |
| Business | 0 | 0.0% |
| Education | 0 | 0.0% |
| Literature & Languages | 0 | 0.0% |
| Liberal Arts & History | 27 | 62.8% |
| Visual & Performing Arts | 0 | 0.0% |
| Communications | 0 | 0.0% |
| Arts & Humanities | 0 | 0.0% |
| Total | 43 | 100.0% |
Transportation & Commute in Glendale
Vehicle Availability by Sex in Glendale
The most prevalent vehicle ownership categories in Glendale are males with 3 vehicles (82, accounting for 38.9%) and females with 3 vehicles (35, making up 62.1%).
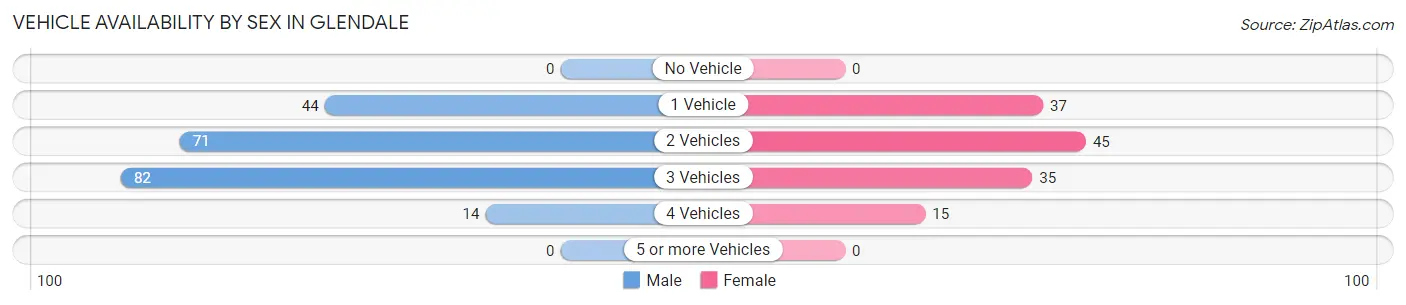
| Vehicles Available | Male | Female |
| No Vehicle | 0 (0.0%) | 0 (0.0%) |
| 1 Vehicle | 44 (20.8%) | 37 (28.0%) |
| 2 Vehicles | 71 (33.7%) | 45 (34.1%) |
| 3 Vehicles | 82 (38.9%) | 35 (26.5%) |
| 4 Vehicles | 14 (6.6%) | 15 (11.4%) |
| 5 or more Vehicles | 0 (0.0%) | 0 (0.0%) |
| Total | 211 (100.0%) | 132 (100.0%) |
Commute Time in Glendale
The most frequently occuring commute durations in Glendale are less than 5 minutes (74 commuters, 23.1%), 15 to 19 minutes (58 commuters, 18.1%), and 5 to 9 minutes (56 commuters, 17.5%).
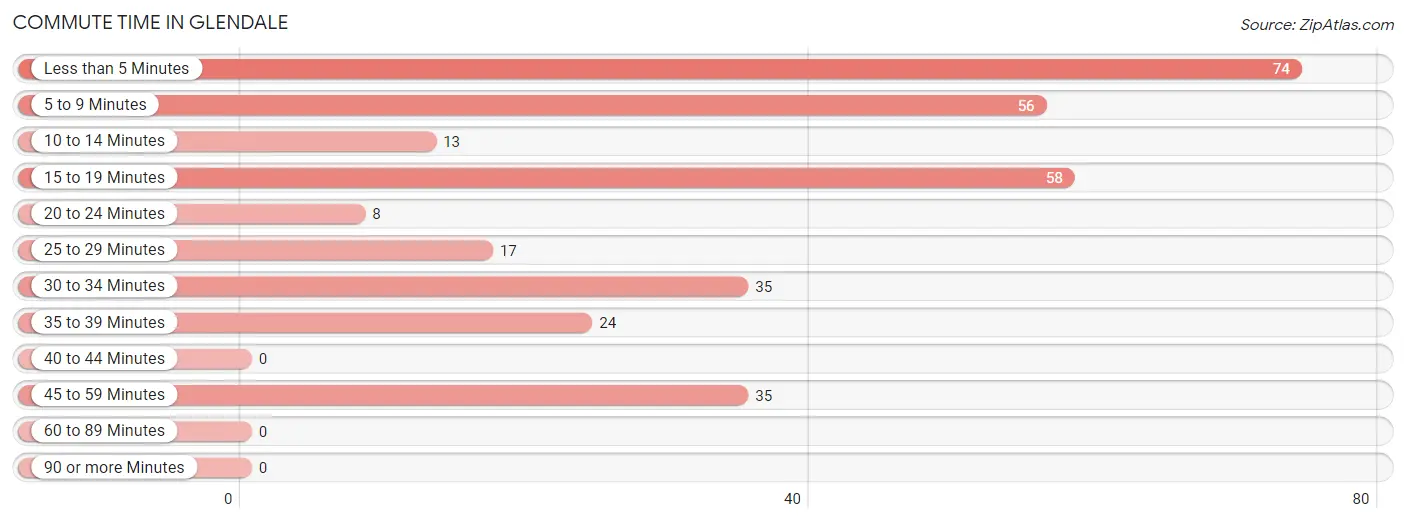
| Commute Time | # Commuters | % Commuters |
| Less than 5 Minutes | 74 | 23.1% |
| 5 to 9 Minutes | 56 | 17.5% |
| 10 to 14 Minutes | 13 | 4.1% |
| 15 to 19 Minutes | 58 | 18.1% |
| 20 to 24 Minutes | 8 | 2.5% |
| 25 to 29 Minutes | 17 | 5.3% |
| 30 to 34 Minutes | 35 | 10.9% |
| 35 to 39 Minutes | 24 | 7.5% |
| 40 to 44 Minutes | 0 | 0.0% |
| 45 to 59 Minutes | 35 | 10.9% |
| 60 to 89 Minutes | 0 | 0.0% |
| 90 or more Minutes | 0 | 0.0% |
Commute Time by Sex in Glendale
The most common commute times in Glendale are 5 to 9 minutes (56 commuters, 28.7%) for males and 15 to 19 minutes (34 commuters, 27.2%) for females.
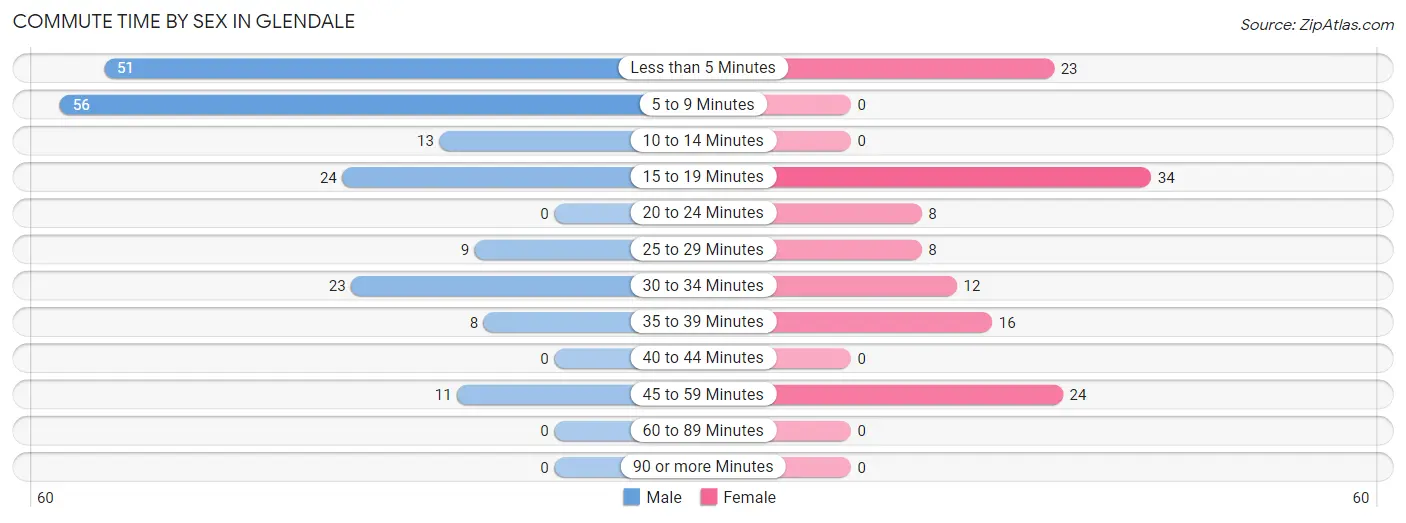
| Commute Time | Male | Female |
| Less than 5 Minutes | 51 (26.2%) | 23 (18.4%) |
| 5 to 9 Minutes | 56 (28.7%) | 0 (0.0%) |
| 10 to 14 Minutes | 13 (6.7%) | 0 (0.0%) |
| 15 to 19 Minutes | 24 (12.3%) | 34 (27.2%) |
| 20 to 24 Minutes | 0 (0.0%) | 8 (6.4%) |
| 25 to 29 Minutes | 9 (4.6%) | 8 (6.4%) |
| 30 to 34 Minutes | 23 (11.8%) | 12 (9.6%) |
| 35 to 39 Minutes | 8 (4.1%) | 16 (12.8%) |
| 40 to 44 Minutes | 0 (0.0%) | 0 (0.0%) |
| 45 to 59 Minutes | 11 (5.6%) | 24 (19.2%) |
| 60 to 89 Minutes | 0 (0.0%) | 0 (0.0%) |
| 90 or more Minutes | 0 (0.0%) | 0 (0.0%) |
Time of Departure to Work by Sex in Glendale
The most frequent times of departure to work in Glendale are 12:00 PM to 3:59 PM (67, 34.4%) for males and 12:00 PM to 3:59 PM (50, 40.0%) for females.
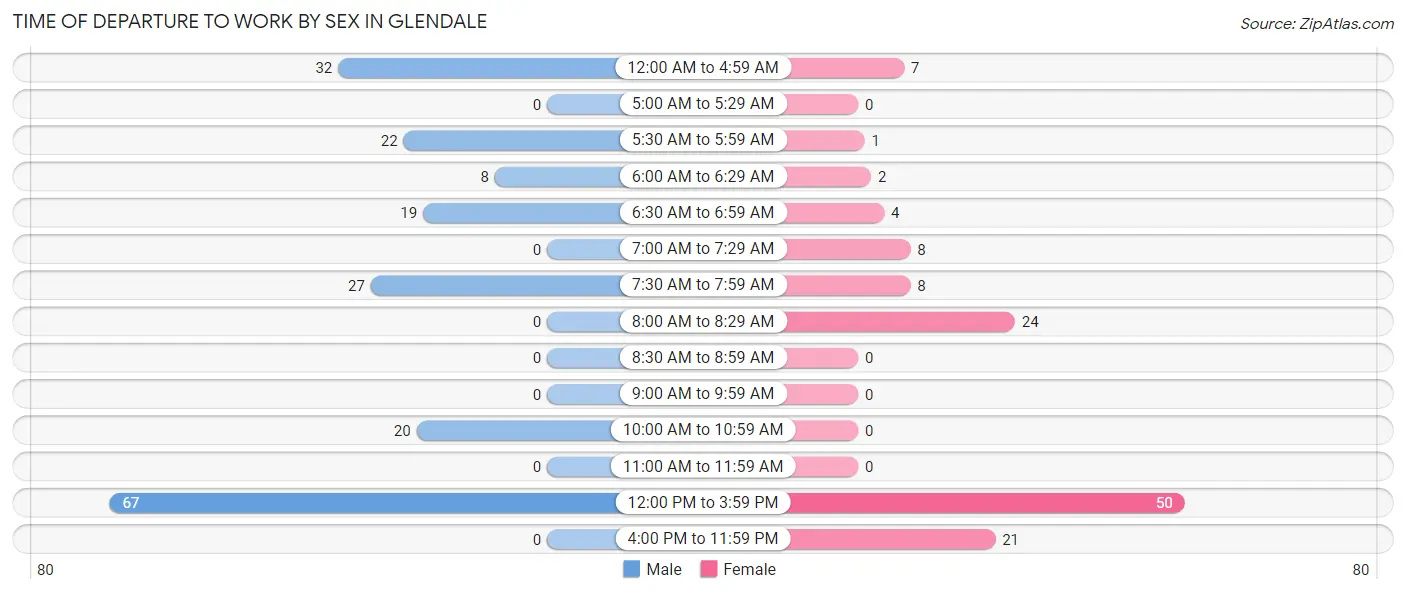
| Time of Departure | Male | Female |
| 12:00 AM to 4:59 AM | 32 (16.4%) | 7 (5.6%) |
| 5:00 AM to 5:29 AM | 0 (0.0%) | 0 (0.0%) |
| 5:30 AM to 5:59 AM | 22 (11.3%) | 1 (0.8%) |
| 6:00 AM to 6:29 AM | 8 (4.1%) | 2 (1.6%) |
| 6:30 AM to 6:59 AM | 19 (9.7%) | 4 (3.2%) |
| 7:00 AM to 7:29 AM | 0 (0.0%) | 8 (6.4%) |
| 7:30 AM to 7:59 AM | 27 (13.9%) | 8 (6.4%) |
| 8:00 AM to 8:29 AM | 0 (0.0%) | 24 (19.2%) |
| 8:30 AM to 8:59 AM | 0 (0.0%) | 0 (0.0%) |
| 9:00 AM to 9:59 AM | 0 (0.0%) | 0 (0.0%) |
| 10:00 AM to 10:59 AM | 20 (10.3%) | 0 (0.0%) |
| 11:00 AM to 11:59 AM | 0 (0.0%) | 0 (0.0%) |
| 12:00 PM to 3:59 PM | 67 (34.4%) | 50 (40.0%) |
| 4:00 PM to 11:59 PM | 0 (0.0%) | 21 (16.8%) |
| Total | 195 (100.0%) | 125 (100.0%) |
Housing Occupancy in Glendale
Occupancy by Ownership in Glendale
Of the total 354 dwellings in Glendale, owner-occupied units account for 172 (48.6%), while renter-occupied units make up 182 (51.4%).
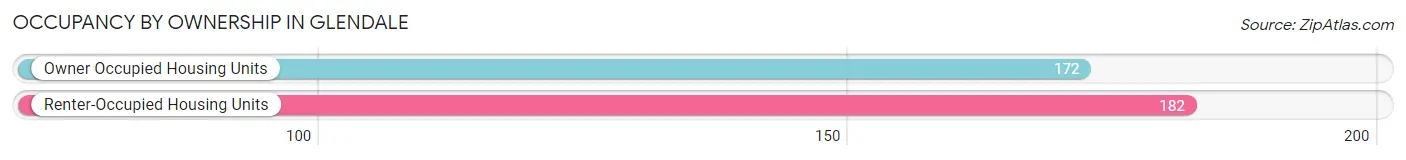
| Occupancy | # Housing Units | % Housing Units |
| Owner Occupied Housing Units | 172 | 48.6% |
| Renter-Occupied Housing Units | 182 | 51.4% |
| Total Occupied Housing Units | 354 | 100.0% |
Occupancy by Household Size in Glendale
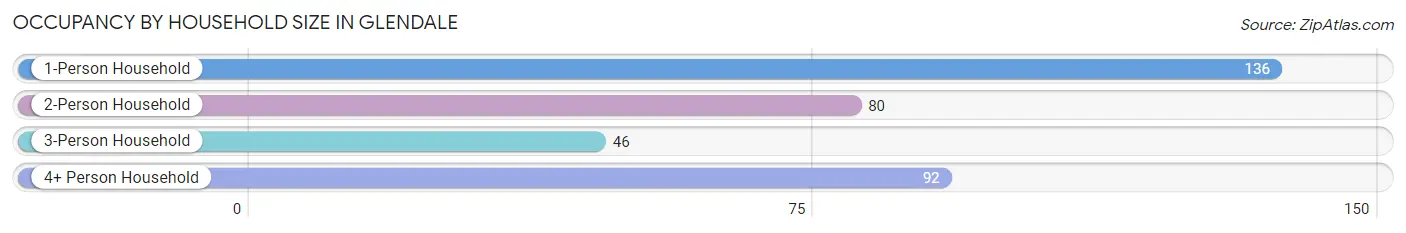
| Household Size | # Housing Units | % Housing Units |
| 1-Person Household | 136 | 38.4% |
| 2-Person Household | 80 | 22.6% |
| 3-Person Household | 46 | 13.0% |
| 4+ Person Household | 92 | 26.0% |
| Total Housing Units | 354 | 100.0% |
Occupancy by Ownership by Household Size in Glendale
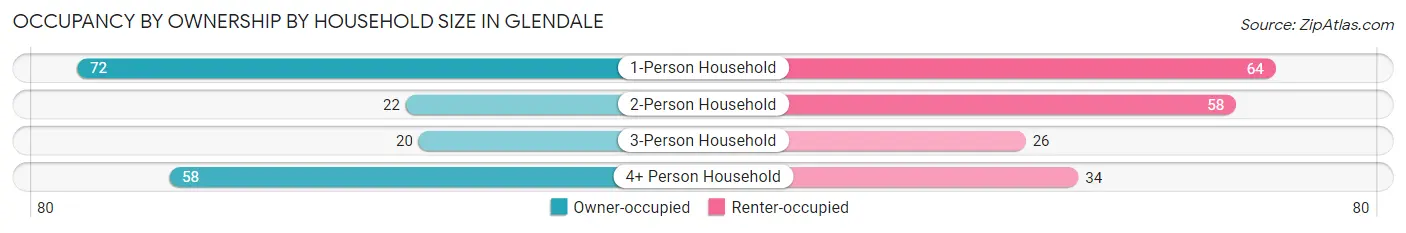
| Household Size | Owner-occupied | Renter-occupied |
| 1-Person Household | 72 (52.9%) | 64 (47.1%) |
| 2-Person Household | 22 (27.5%) | 58 (72.5%) |
| 3-Person Household | 20 (43.5%) | 26 (56.5%) |
| 4+ Person Household | 58 (63.0%) | 34 (37.0%) |
| Total Housing Units | 172 (48.6%) | 182 (51.4%) |
Occupancy by Educational Attainment in Glendale
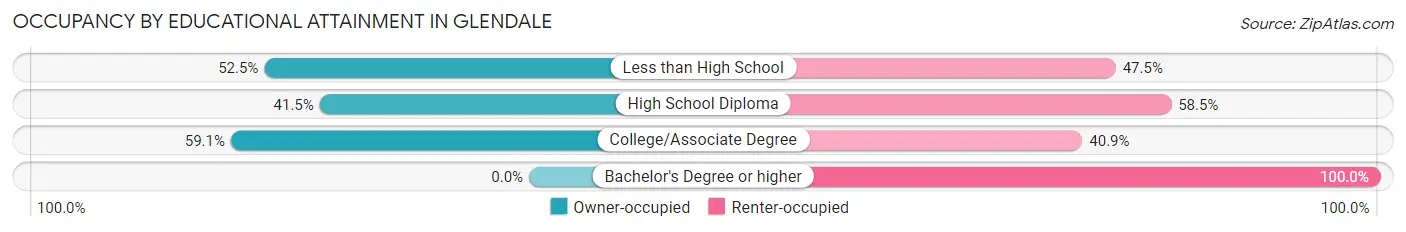
| Household Size | Owner-occupied | Renter-occupied |
| Less than High School | 21 (52.5%) | 19 (47.5%) |
| High School Diploma | 44 (41.5%) | 62 (58.5%) |
| College/Associate Degree | 107 (59.1%) | 74 (40.9%) |
| Bachelor's Degree or higher | 0 (0.0%) | 27 (100.0%) |
Occupancy by Age of Householder in Glendale
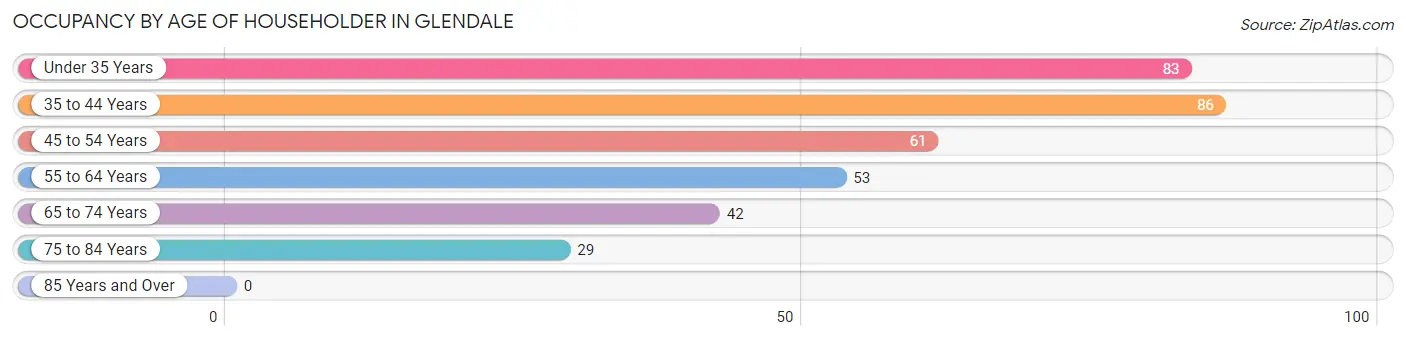
| Age Bracket | # Households | % Households |
| Under 35 Years | 83 | 23.4% |
| 35 to 44 Years | 86 | 24.3% |
| 45 to 54 Years | 61 | 17.2% |
| 55 to 64 Years | 53 | 15.0% |
| 65 to 74 Years | 42 | 11.9% |
| 75 to 84 Years | 29 | 8.2% |
| 85 Years and Over | 0 | 0.0% |
| Total | 354 | 100.0% |
Housing Finances in Glendale
Median Income by Occupancy in Glendale
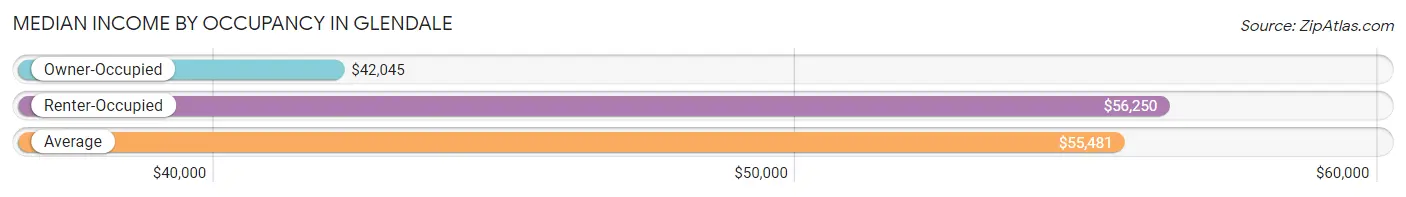
| Occupancy Type | # Households | Median Income |
| Owner-Occupied | 172 (48.6%) | $42,045 |
| Renter-Occupied | 182 (51.4%) | $56,250 |
| Average | 354 (100.0%) | $55,481 |
Occupancy by Householder Income Bracket in Glendale
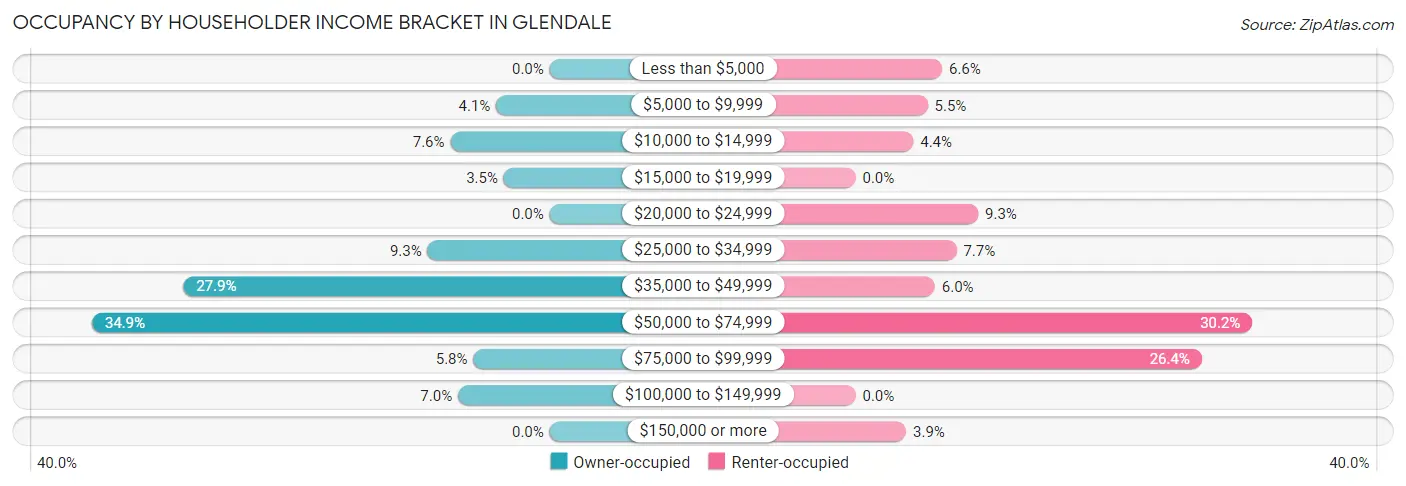
| Income Bracket | Owner-occupied | Renter-occupied |
| Less than $5,000 | 0 (0.0%) | 12 (6.6%) |
| $5,000 to $9,999 | 7 (4.1%) | 10 (5.5%) |
| $10,000 to $14,999 | 13 (7.6%) | 8 (4.4%) |
| $15,000 to $19,999 | 6 (3.5%) | 0 (0.0%) |
| $20,000 to $24,999 | 0 (0.0%) | 17 (9.3%) |
| $25,000 to $34,999 | 16 (9.3%) | 14 (7.7%) |
| $35,000 to $49,999 | 48 (27.9%) | 11 (6.0%) |
| $50,000 to $74,999 | 60 (34.9%) | 55 (30.2%) |
| $75,000 to $99,999 | 10 (5.8%) | 48 (26.4%) |
| $100,000 to $149,999 | 12 (7.0%) | 0 (0.0%) |
| $150,000 or more | 0 (0.0%) | 7 (3.8%) |
| Total | 172 (100.0%) | 182 (100.0%) |
Monthly Housing Cost Tiers in Glendale
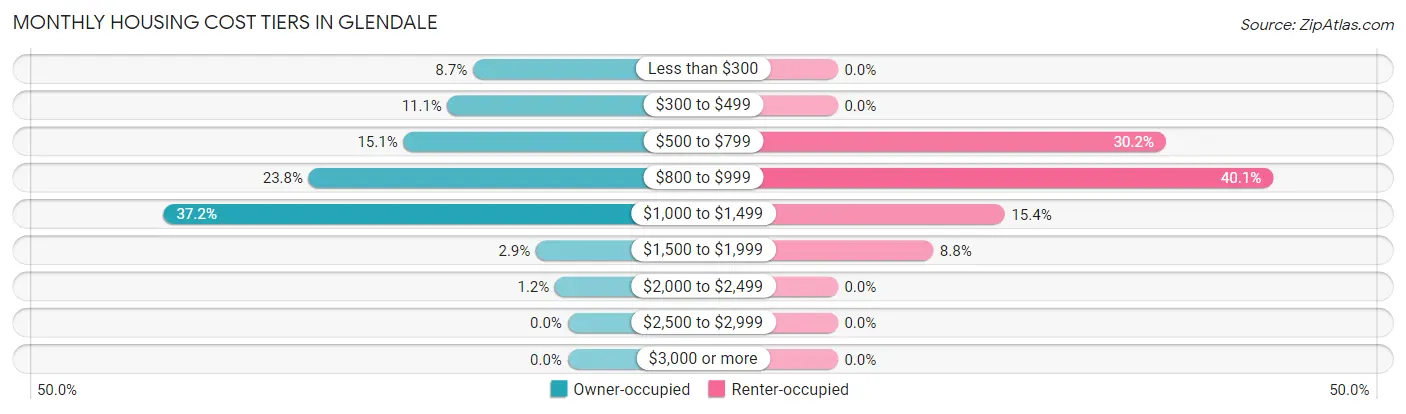
| Monthly Cost | Owner-occupied | Renter-occupied |
| Less than $300 | 15 (8.7%) | 0 (0.0%) |
| $300 to $499 | 19 (11.1%) | 0 (0.0%) |
| $500 to $799 | 26 (15.1%) | 55 (30.2%) |
| $800 to $999 | 41 (23.8%) | 73 (40.1%) |
| $1,000 to $1,499 | 64 (37.2%) | 28 (15.4%) |
| $1,500 to $1,999 | 5 (2.9%) | 16 (8.8%) |
| $2,000 to $2,499 | 2 (1.2%) | 0 (0.0%) |
| $2,500 to $2,999 | 0 (0.0%) | 0 (0.0%) |
| $3,000 or more | 0 (0.0%) | 0 (0.0%) |
| Total | 172 (100.0%) | 182 (100.0%) |
Physical Housing Characteristics in Glendale
Housing Structures in Glendale
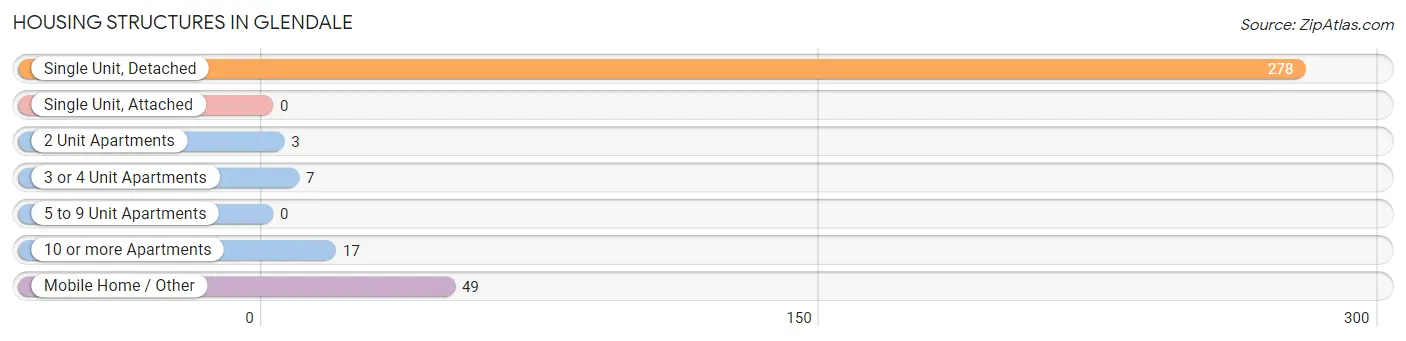
| Structure Type | # Housing Units | % Housing Units |
| Single Unit, Detached | 278 | 78.5% |
| Single Unit, Attached | 0 | 0.0% |
| 2 Unit Apartments | 3 | 0.9% |
| 3 or 4 Unit Apartments | 7 | 2.0% |
| 5 to 9 Unit Apartments | 0 | 0.0% |
| 10 or more Apartments | 17 | 4.8% |
| Mobile Home / Other | 49 | 13.8% |
| Total | 354 | 100.0% |
Housing Structures by Occupancy in Glendale
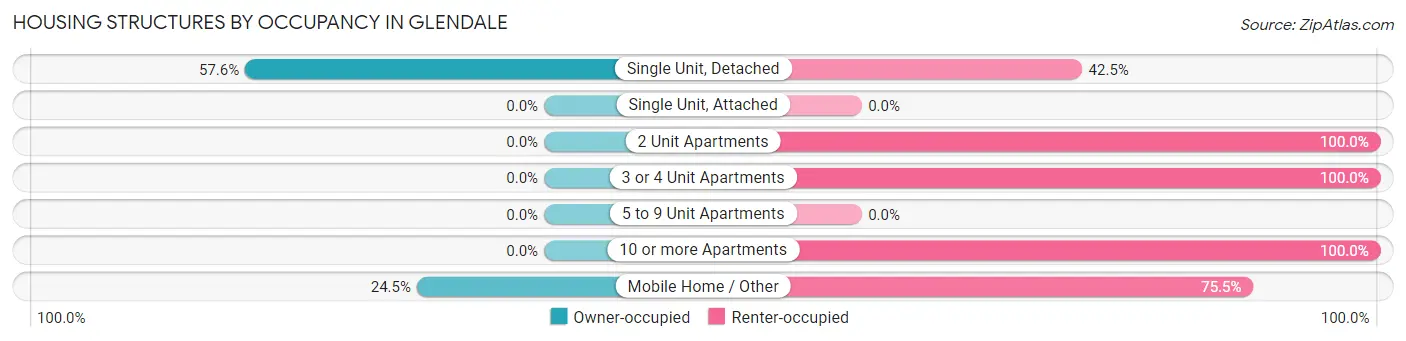
| Structure Type | Owner-occupied | Renter-occupied |
| Single Unit, Detached | 160 (57.6%) | 118 (42.4%) |
| Single Unit, Attached | 0 (0.0%) | 0 (0.0%) |
| 2 Unit Apartments | 0 (0.0%) | 3 (100.0%) |
| 3 or 4 Unit Apartments | 0 (0.0%) | 7 (100.0%) |
| 5 to 9 Unit Apartments | 0 (0.0%) | 0 (0.0%) |
| 10 or more Apartments | 0 (0.0%) | 17 (100.0%) |
| Mobile Home / Other | 12 (24.5%) | 37 (75.5%) |
| Total | 172 (48.6%) | 182 (51.4%) |
Housing Structures by Number of Rooms in Glendale
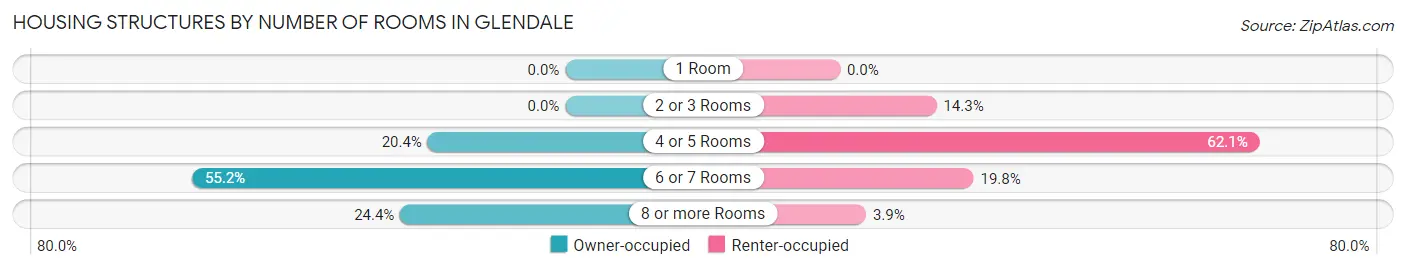
| Number of Rooms | Owner-occupied | Renter-occupied |
| 1 Room | 0 (0.0%) | 0 (0.0%) |
| 2 or 3 Rooms | 0 (0.0%) | 26 (14.3%) |
| 4 or 5 Rooms | 35 (20.3%) | 113 (62.1%) |
| 6 or 7 Rooms | 95 (55.2%) | 36 (19.8%) |
| 8 or more Rooms | 42 (24.4%) | 7 (3.8%) |
| Total | 172 (100.0%) | 182 (100.0%) |
Housing Structure by Heating Type in Glendale
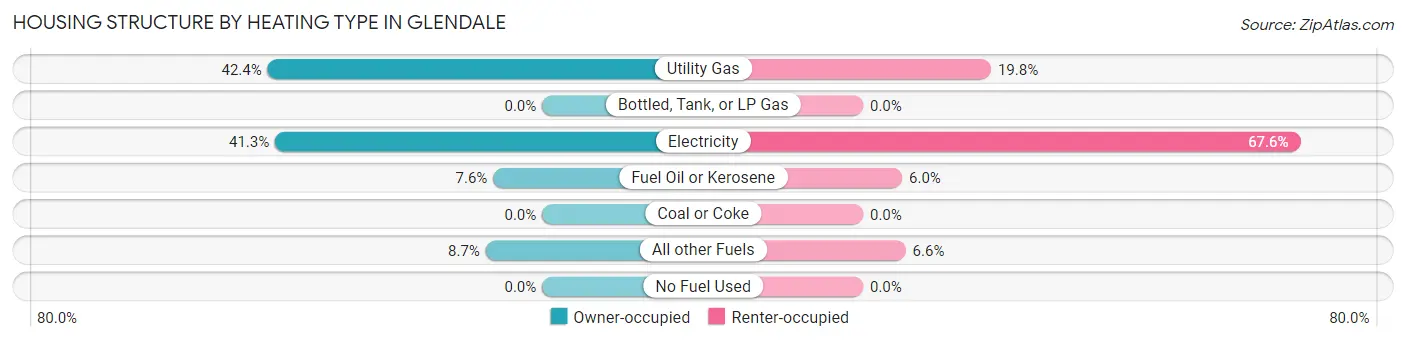
| Heating Type | Owner-occupied | Renter-occupied |
| Utility Gas | 73 (42.4%) | 36 (19.8%) |
| Bottled, Tank, or LP Gas | 0 (0.0%) | 0 (0.0%) |
| Electricity | 71 (41.3%) | 123 (67.6%) |
| Fuel Oil or Kerosene | 13 (7.6%) | 11 (6.0%) |
| Coal or Coke | 0 (0.0%) | 0 (0.0%) |
| All other Fuels | 15 (8.7%) | 12 (6.6%) |
| No Fuel Used | 0 (0.0%) | 0 (0.0%) |
| Total | 172 (100.0%) | 182 (100.0%) |
Household Vehicle Usage in Glendale
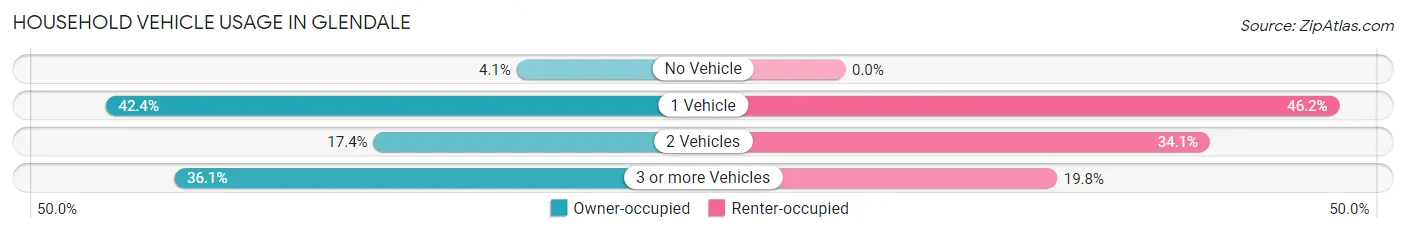
| Vehicles per Household | Owner-occupied | Renter-occupied |
| No Vehicle | 7 (4.1%) | 0 (0.0%) |
| 1 Vehicle | 73 (42.4%) | 84 (46.2%) |
| 2 Vehicles | 30 (17.4%) | 62 (34.1%) |
| 3 or more Vehicles | 62 (36.0%) | 36 (19.8%) |
| Total | 172 (100.0%) | 182 (100.0%) |
Real Estate & Mortgages in Glendale
Real Estate and Mortgage Overview in Glendale
| Characteristic | Without Mortgage | With Mortgage |
| Housing Units | 60 | 112 |
| Median Property Value | $216,700 | $168,900 |
| Median Household Income | $35,357 | $0 |
| Monthly Housing Costs | $375 | $0 |
| Real Estate Taxes | $813 | $0 |
Property Value by Mortgage Status in Glendale
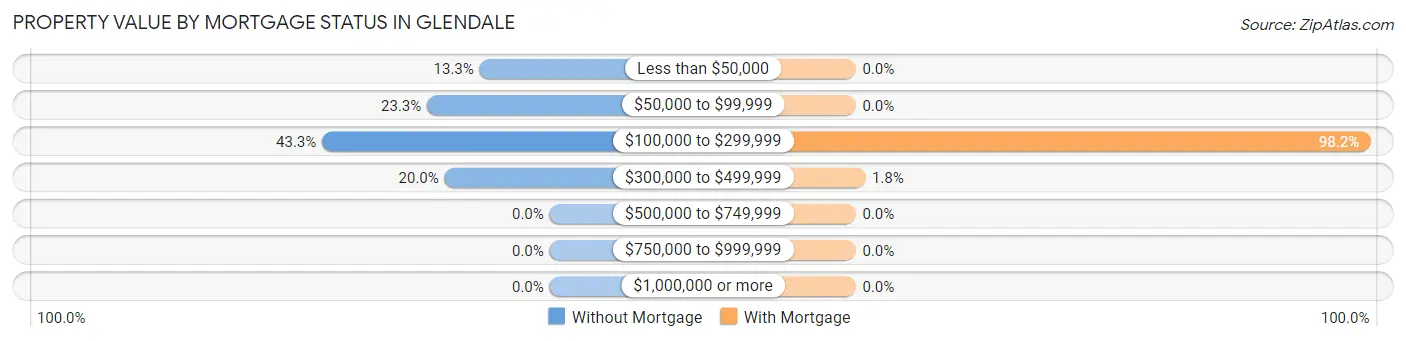
| Property Value | Without Mortgage | With Mortgage |
| Less than $50,000 | 8 (13.3%) | 0 (0.0%) |
| $50,000 to $99,999 | 14 (23.3%) | 0 (0.0%) |
| $100,000 to $299,999 | 26 (43.3%) | 110 (98.2%) |
| $300,000 to $499,999 | 12 (20.0%) | 2 (1.8%) |
| $500,000 to $749,999 | 0 (0.0%) | 0 (0.0%) |
| $750,000 to $999,999 | 0 (0.0%) | 0 (0.0%) |
| $1,000,000 or more | 0 (0.0%) | 0 (0.0%) |
| Total | 60 (100.0%) | 112 (100.0%) |
Household Income by Mortgage Status in Glendale
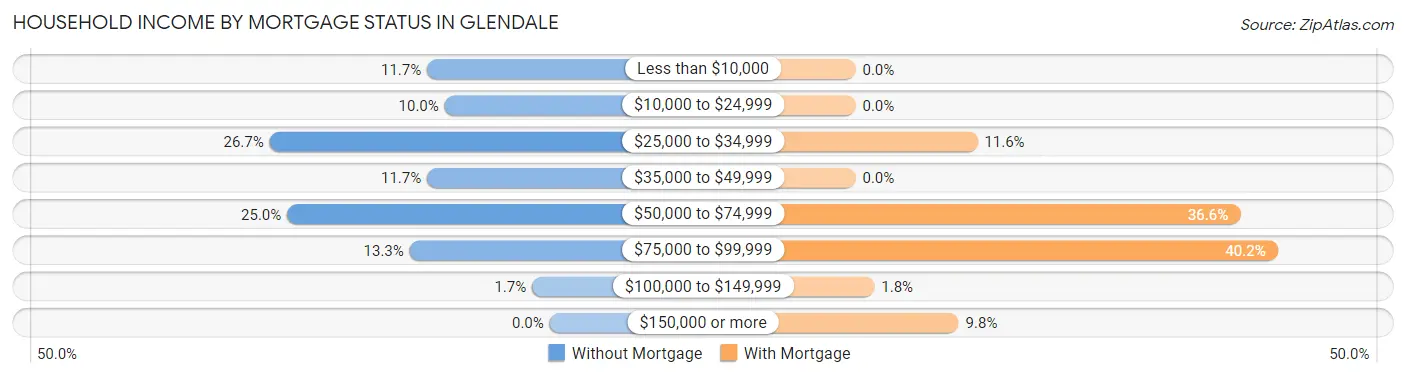
| Household Income | Without Mortgage | With Mortgage |
| Less than $10,000 | 7 (11.7%) | 0 (0.0%) |
| $10,000 to $24,999 | 6 (10.0%) | 0 (0.0%) |
| $25,000 to $34,999 | 16 (26.7%) | 13 (11.6%) |
| $35,000 to $49,999 | 7 (11.7%) | 0 (0.0%) |
| $50,000 to $74,999 | 15 (25.0%) | 41 (36.6%) |
| $75,000 to $99,999 | 8 (13.3%) | 45 (40.2%) |
| $100,000 to $149,999 | 1 (1.7%) | 2 (1.8%) |
| $150,000 or more | 0 (0.0%) | 11 (9.8%) |
| Total | 60 (100.0%) | 112 (100.0%) |
Property Value to Household Income Ratio in Glendale
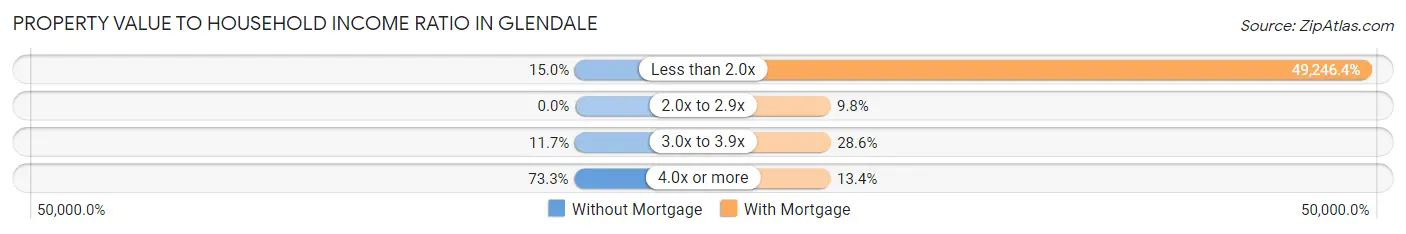
| Value-to-Income Ratio | Without Mortgage | With Mortgage |
| Less than 2.0x | 9 (15.0%) | 55,156 (49,246.4%) |
| 2.0x to 2.9x | 0 (0.0%) | 11 (9.8%) |
| 3.0x to 3.9x | 7 (11.7%) | 32 (28.6%) |
| 4.0x or more | 44 (73.3%) | 15 (13.4%) |
| Total | 60 (100.0%) | 112 (100.0%) |
Real Estate Taxes by Mortgage Status in Glendale
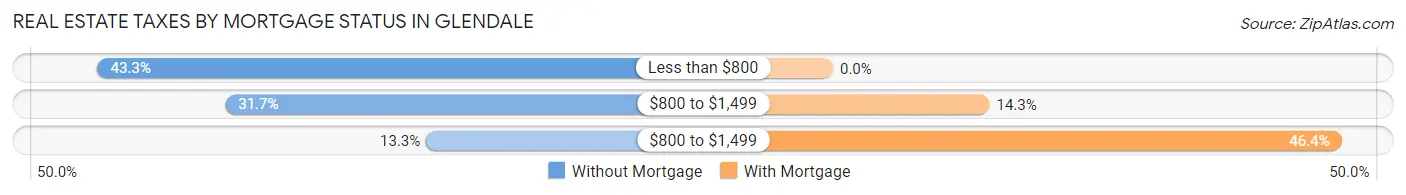
| Property Taxes | Without Mortgage | With Mortgage |
| Less than $800 | 26 (43.3%) | 0 (0.0%) |
| $800 to $1,499 | 19 (31.7%) | 16 (14.3%) |
| $800 to $1,499 | 8 (13.3%) | 52 (46.4%) |
| Total | 60 (100.0%) | 112 (100.0%) |
Health & Disability in Glendale
Health Insurance Coverage by Age in Glendale
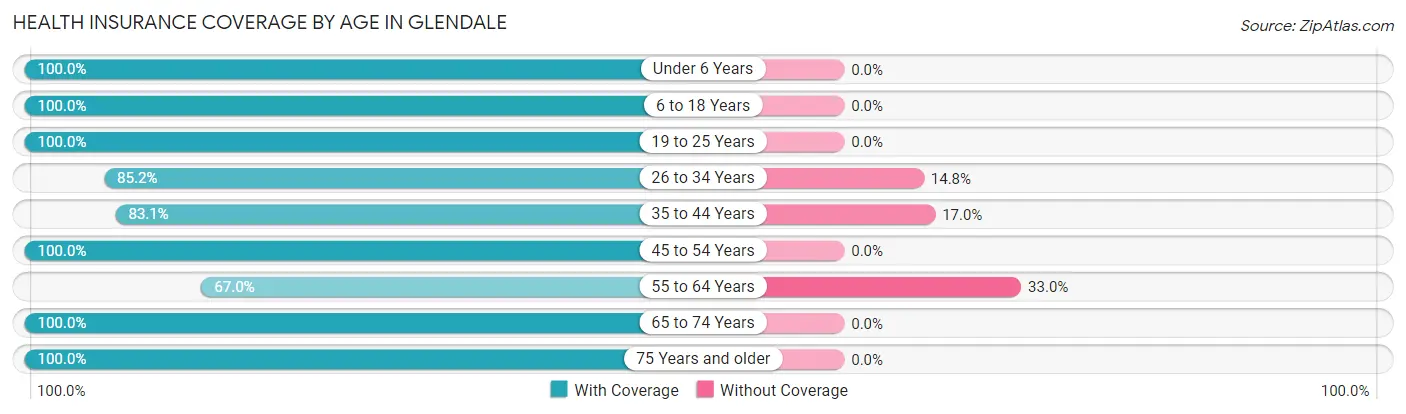
| Age Bracket | With Coverage | Without Coverage |
| Under 6 Years | 99 (100.0%) | 0 (0.0%) |
| 6 to 18 Years | 126 (100.0%) | 0 (0.0%) |
| 19 to 25 Years | 30 (100.0%) | 0 (0.0%) |
| 26 to 34 Years | 109 (85.2%) | 19 (14.8%) |
| 35 to 44 Years | 98 (83.1%) | 20 (17.0%) |
| 45 to 54 Years | 132 (100.0%) | 0 (0.0%) |
| 55 to 64 Years | 63 (67.0%) | 31 (33.0%) |
| 65 to 74 Years | 71 (100.0%) | 0 (0.0%) |
| 75 Years and older | 29 (100.0%) | 0 (0.0%) |
| Total | 757 (91.5%) | 70 (8.5%) |
Health Insurance Coverage by Citizenship Status in Glendale
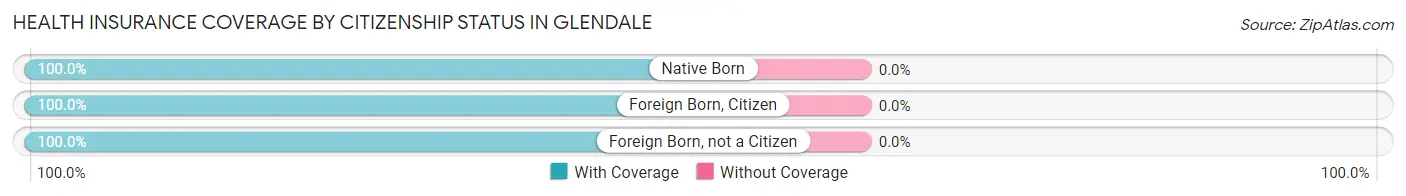
| Citizenship Status | With Coverage | Without Coverage |
| Native Born | 99 (100.0%) | 0 (0.0%) |
| Foreign Born, Citizen | 126 (100.0%) | 0 (0.0%) |
| Foreign Born, not a Citizen | 30 (100.0%) | 0 (0.0%) |
Health Insurance Coverage by Household Income in Glendale
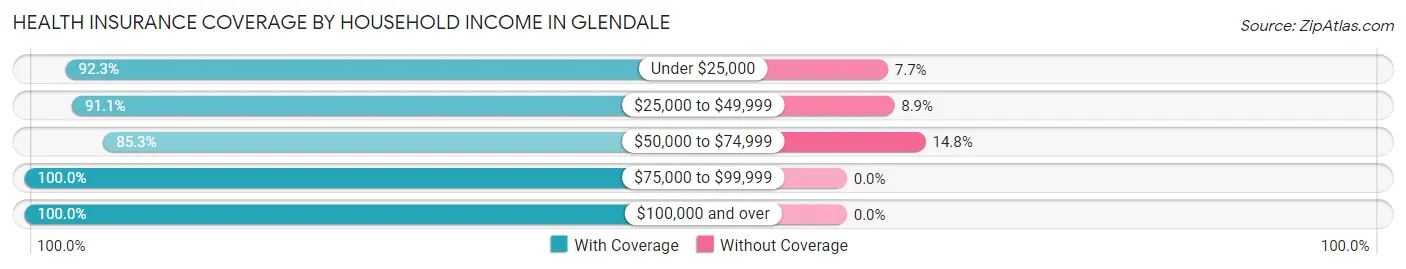
| Household Income | With Coverage | Without Coverage |
| Under $25,000 | 96 (92.3%) | 8 (7.7%) |
| $25,000 to $49,999 | 174 (91.1%) | 17 (8.9%) |
| $50,000 to $74,999 | 260 (85.3%) | 45 (14.7%) |
| $75,000 to $99,999 | 156 (100.0%) | 0 (0.0%) |
| $100,000 and over | 71 (100.0%) | 0 (0.0%) |
Public vs Private Health Insurance Coverage by Age in Glendale
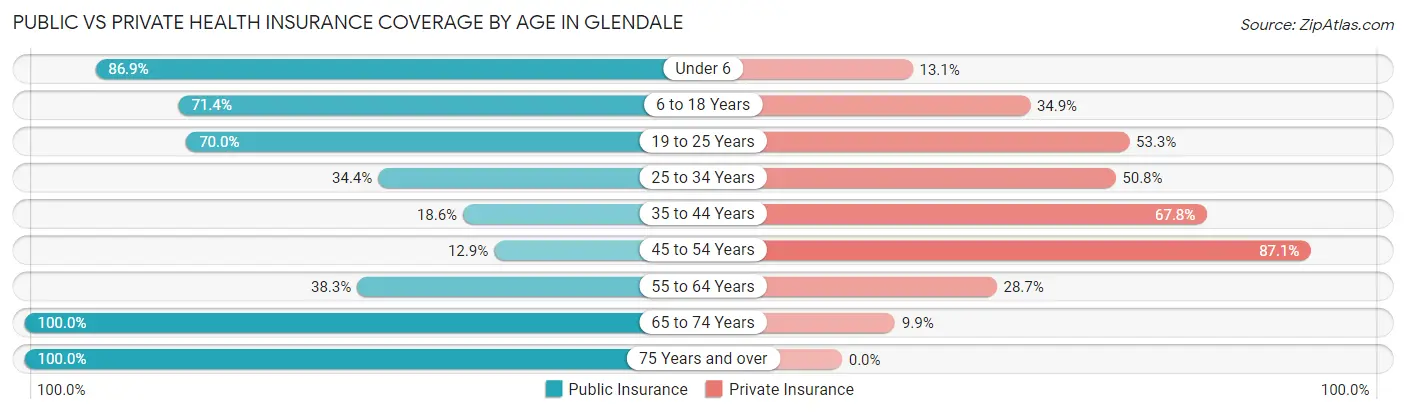
| Age Bracket | Public Insurance | Private Insurance |
| Under 6 | 86 (86.9%) | 13 (13.1%) |
| 6 to 18 Years | 90 (71.4%) | 44 (34.9%) |
| 19 to 25 Years | 21 (70.0%) | 16 (53.3%) |
| 25 to 34 Years | 44 (34.4%) | 65 (50.8%) |
| 35 to 44 Years | 22 (18.6%) | 80 (67.8%) |
| 45 to 54 Years | 17 (12.9%) | 115 (87.1%) |
| 55 to 64 Years | 36 (38.3%) | 27 (28.7%) |
| 65 to 74 Years | 71 (100.0%) | 7 (9.9%) |
| 75 Years and over | 29 (100.0%) | 0 (0.0%) |
| Total | 416 (50.3%) | 367 (44.4%) |
Disability Status by Sex by Age in Glendale
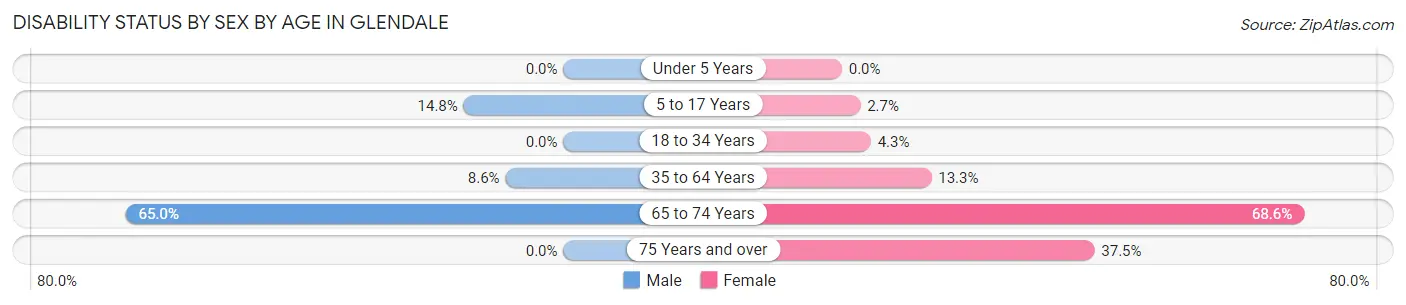
| Age Bracket | Male | Female |
| Under 5 Years | 0 (0.0%) | 0 (0.0%) |
| 5 to 17 Years | 4 (14.8%) | 3 (2.7%) |
| 18 to 34 Years | 0 (0.0%) | 3 (4.3%) |
| 35 to 64 Years | 16 (8.6%) | 21 (13.3%) |
| 65 to 74 Years | 13 (65.0%) | 35 (68.6%) |
| 75 Years and over | 0 (0.0%) | 6 (37.5%) |
Disability Class by Sex by Age in Glendale
Disability Class: Hearing Difficulty
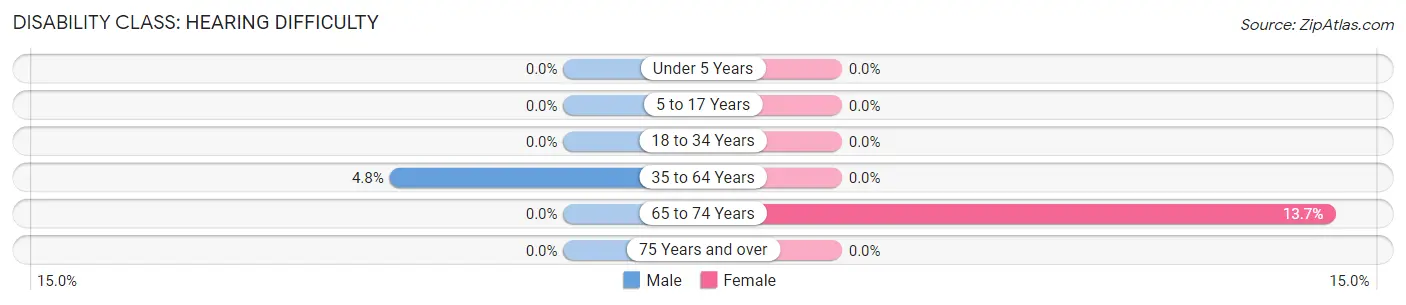
| Age Bracket | Male | Female |
| Under 5 Years | 0 (0.0%) | 0 (0.0%) |
| 5 to 17 Years | 0 (0.0%) | 0 (0.0%) |
| 18 to 34 Years | 0 (0.0%) | 0 (0.0%) |
| 35 to 64 Years | 9 (4.8%) | 0 (0.0%) |
| 65 to 74 Years | 0 (0.0%) | 7 (13.7%) |
| 75 Years and over | 0 (0.0%) | 0 (0.0%) |
Disability Class: Vision Difficulty
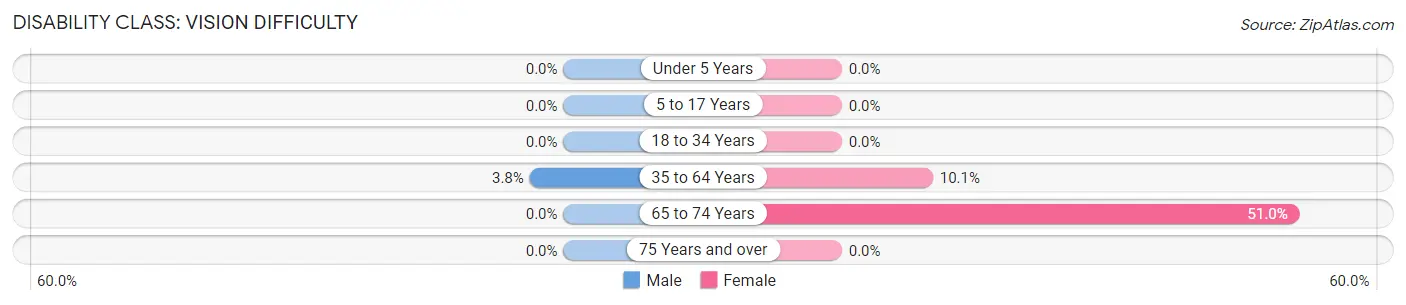
| Age Bracket | Male | Female |
| Under 5 Years | 0 (0.0%) | 0 (0.0%) |
| 5 to 17 Years | 0 (0.0%) | 0 (0.0%) |
| 18 to 34 Years | 0 (0.0%) | 0 (0.0%) |
| 35 to 64 Years | 7 (3.8%) | 16 (10.1%) |
| 65 to 74 Years | 0 (0.0%) | 26 (51.0%) |
| 75 Years and over | 0 (0.0%) | 0 (0.0%) |
Disability Class: Cognitive Difficulty
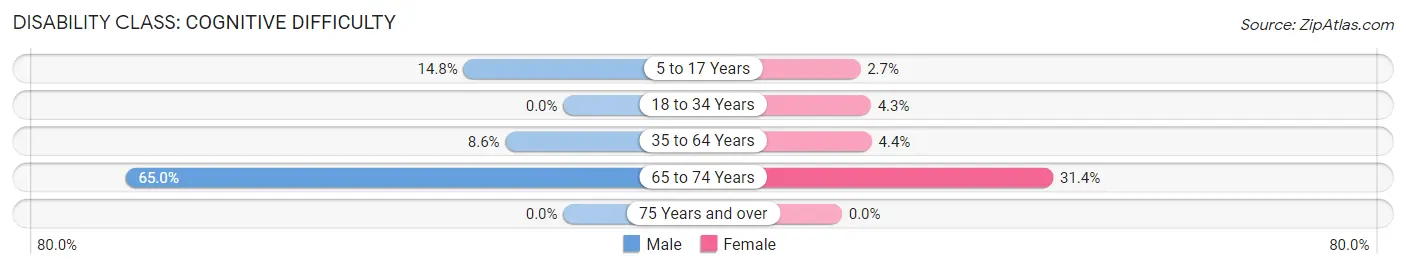
| Age Bracket | Male | Female |
| 5 to 17 Years | 4 (14.8%) | 3 (2.7%) |
| 18 to 34 Years | 0 (0.0%) | 3 (4.3%) |
| 35 to 64 Years | 16 (8.6%) | 7 (4.4%) |
| 65 to 74 Years | 13 (65.0%) | 16 (31.4%) |
| 75 Years and over | 0 (0.0%) | 0 (0.0%) |
Disability Class: Ambulatory Difficulty
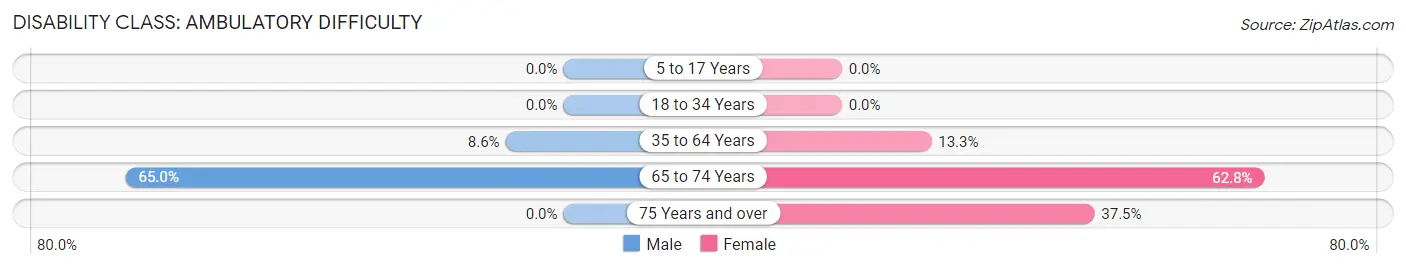
| Age Bracket | Male | Female |
| 5 to 17 Years | 0 (0.0%) | 0 (0.0%) |
| 18 to 34 Years | 0 (0.0%) | 0 (0.0%) |
| 35 to 64 Years | 16 (8.6%) | 21 (13.3%) |
| 65 to 74 Years | 13 (65.0%) | 32 (62.7%) |
| 75 Years and over | 0 (0.0%) | 6 (37.5%) |
Disability Class: Self-Care Difficulty
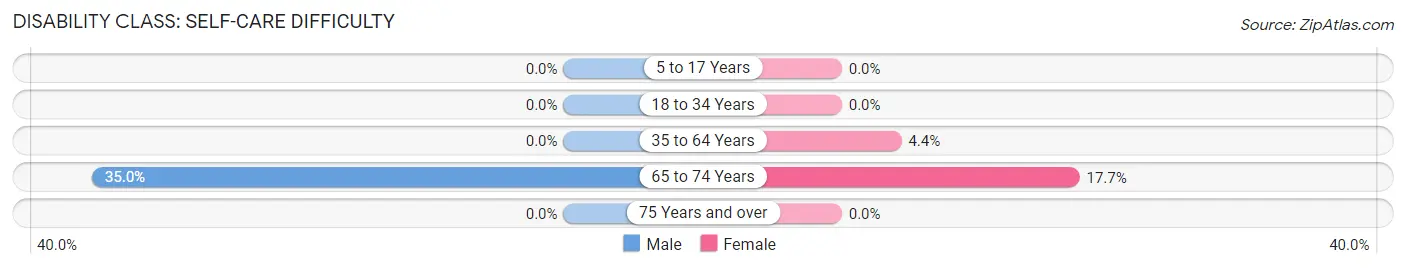
| Age Bracket | Male | Female |
| 5 to 17 Years | 0 (0.0%) | 0 (0.0%) |
| 18 to 34 Years | 0 (0.0%) | 0 (0.0%) |
| 35 to 64 Years | 0 (0.0%) | 7 (4.4%) |
| 65 to 74 Years | 7 (35.0%) | 9 (17.6%) |
| 75 Years and over | 0 (0.0%) | 0 (0.0%) |
Technology Access in Glendale
Computing Device Access in Glendale
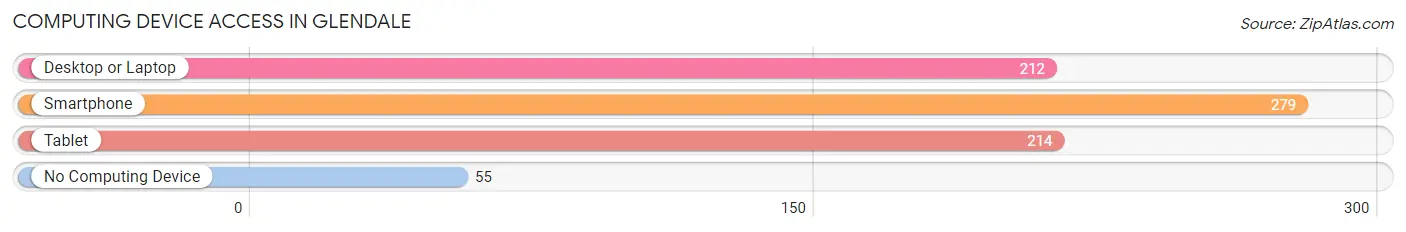
| Device Type | # Households | % Households |
| Desktop or Laptop | 212 | 59.9% |
| Smartphone | 279 | 78.8% |
| Tablet | 214 | 60.5% |
| No Computing Device | 55 | 15.5% |
| Total | 354 | 100.0% |
Internet Access in Glendale
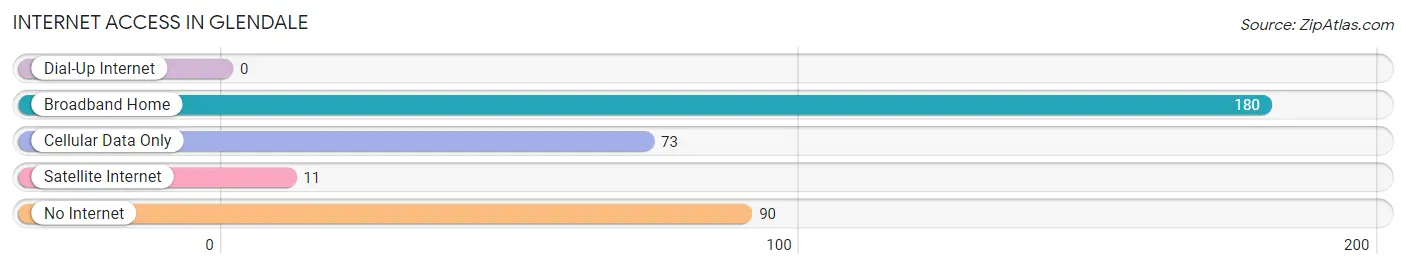
| Internet Type | # Households | % Households |
| Dial-Up Internet | 0 | 0.0% |
| Broadband Home | 180 | 50.8% |
| Cellular Data Only | 73 | 20.6% |
| Satellite Internet | 11 | 3.1% |
| No Internet | 90 | 25.4% |
| Total | 354 | 100.0% |
Glendale Summary
Glendale, Oregon is a small city located in Douglas County, Oregon, United States. It is situated on the banks of the Umpqua River, approximately 20 miles east of Roseburg. The city has a population of approximately 1,000 people and covers an area of 1.2 square miles.
History
Glendale was founded in 1851 by a group of settlers from the Oregon Trail. The city was originally known as “Umpqua City” and was the first permanent settlement in Douglas County. The city was renamed Glendale in 1854, after the nearby Glendale Creek.
In the late 1800s, Glendale was a bustling logging town. The city was home to several sawmills and lumber companies, and the timber industry was the main source of employment for the residents. The city also had a thriving agricultural industry, with many farmers growing apples, pears, and other fruits and vegetables.
In the early 1900s, Glendale began to experience a decline in its timber industry. The city’s economy shifted to focus on agriculture and tourism. The city was home to several resorts and hotels, and the Umpqua River was a popular destination for fishing and boating.
Geography
Glendale is located in the Umpqua Valley, a region of rolling hills and lush forests. The city is situated on the banks of the Umpqua River, approximately 20 miles east of Roseburg. The city is surrounded by the Umpqua National Forest, which provides a variety of recreational activities, including camping, hiking, and fishing.
The climate in Glendale is mild and temperate, with warm summers and cool winters. The average annual temperature is around 50 degrees Fahrenheit. The city receives an average of 35 inches of precipitation per year, with most of it falling in the winter months.
Economy
The economy of Glendale is largely based on agriculture and tourism. The city is home to several farms and orchards, which produce a variety of fruits and vegetables. The city is also home to several resorts and hotels, which attract tourists from all over the region.
The city is also home to several small businesses, including restaurants, retail stores, and service providers. The city is also home to a small manufacturing sector, which produces a variety of products, including furniture and wood products.
Demographics
As of the 2010 census, Glendale had a population of 1,000 people. The racial makeup of the city was 94.2% White, 0.7% African American, 0.7% Native American, 0.7% Asian, 0.3% Pacific Islander, and 2.3% from other races. The median household income was $37,500, and the median family income was $41,250.
The city is home to a variety of religious denominations, including Baptist, Methodist, and Catholic. The city is also home to a variety of cultural and recreational activities, including festivals, concerts, and sporting events.
Conclusion
Glendale, Oregon is a small city located in Douglas County, Oregon, United States. It is situated on the banks of the Umpqua River, approximately 20 miles east of Roseburg. The city has a population of approximately 1,000 people and covers an area of 1.2 square miles. The economy of Glendale is largely based on agriculture and tourism, and the city is home to a variety of religious denominations and cultural and recreational activities.
Common Questions
What is Per Capita Income in Glendale?
Per Capita income in Glendale is $24,148.
What is the Median Family Income in Glendale?
Median Family Income in Glendale is $55,343.
What is the Median Household income in Glendale?
Median Household Income in Glendale is $55,481.
What is Income or Wage Gap in Glendale?
Income or Wage Gap in Glendale is 38.8%.
Women in Glendale earn 61.2 cents for every dollar earned by a man.
What is Family Income Deficit in Glendale?
Family Income Deficit in Glendale is $19,282.
Families that are below poverty line in Glendale earn $19,282 less on average than the poverty threshold level.
What is Inequality or Gini Index in Glendale?
Inequality or Gini Index in Glendale is 0.34.
What is the Total Population of Glendale?
Total Population of Glendale is 827.
What is the Total Male Population of Glendale?
Total Male Population of Glendale is 395.
What is the Total Female Population of Glendale?
Total Female Population of Glendale is 432.
What is the Ratio of Males per 100 Females in Glendale?
There are 91.44 Males per 100 Females in Glendale.
What is the Ratio of Females per 100 Males in Glendale?
There are 109.37 Females per 100 Males in Glendale.
What is the Median Population Age in Glendale?
Median Population Age in Glendale is 36.6 Years.
What is the Average Family Size in Glendale
Average Family Size in Glendale is 3.1 People.
What is the Average Household Size in Glendale
Average Household Size in Glendale is 2.3 People.
How Large is the Labor Force in Glendale?
There are 391 People in the Labor Forcein in Glendale.
What is the Percentage of People in the Labor Force in Glendale?
64.3% of People are in the Labor Force in Glendale.
What is the Unemployment Rate in Glendale?
Unemployment Rate in Glendale is 12.3%.