Bay City, OR Map & Demographics
Bay City Map
Bay City Overview
$30,814
PER CAPITA INCOME
$75,417
AVG FAMILY INCOME
$64,167
AVG HOUSEHOLD INCOME
31.4%
WAGE / INCOME GAP [ % ]
68.6¢/ $1
WAGE / INCOME GAP [ $ ]
0.38
INEQUALITY / GINI INDEX
2,224
TOTAL POPULATION
1,068
MALE POPULATION
1,156
FEMALE POPULATION
92.39
MALES / 100 FEMALES
108.24
FEMALES / 100 MALES
44.5
MEDIAN AGE
3.0
AVG FAMILY SIZE
2.5
AVG HOUSEHOLD SIZE
985
LABOR FORCE [ PEOPLE ]
56.2%
PERCENT IN LABOR FORCE
3.6%
UNEMPLOYMENT RATE
Bay City Zip Codes
Income in Bay City
Income Overview in Bay City
Per Capita Income in Bay City is $30,814, while median incomes of families and households are $75,417 and $64,167 respectively.
| Characteristic | Number | Measure |
| Per Capita Income | 2,224 | $30,814 |
| Median Family Income | 594 | $75,417 |
| Mean Family Income | 594 | $78,185 |
| Median Household Income | 904 | $64,167 |
| Mean Household Income | 904 | $76,362 |
| Income Deficit | 594 | $0 |
| Wage / Income Gap (%) | 2,224 | 31.42% |
| Wage / Income Gap ($) | 2,224 | 68.58¢ per $1 |
| Gini / Inequality Index | 2,224 | 0.38 |
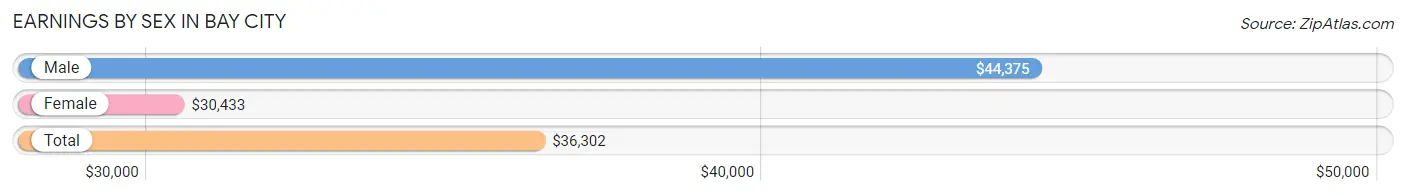
Earnings by Sex in Bay City
Average Earnings in Bay City are $36,302, $44,375 for men and $30,433 for women, a difference of 31.4%.
| Sex | Number | Average Earnings |
| Male | 504 (49.2%) | $44,375 |
| Female | 521 (50.8%) | $30,433 |
| Total | 1,025 (100.0%) | $36,302 |
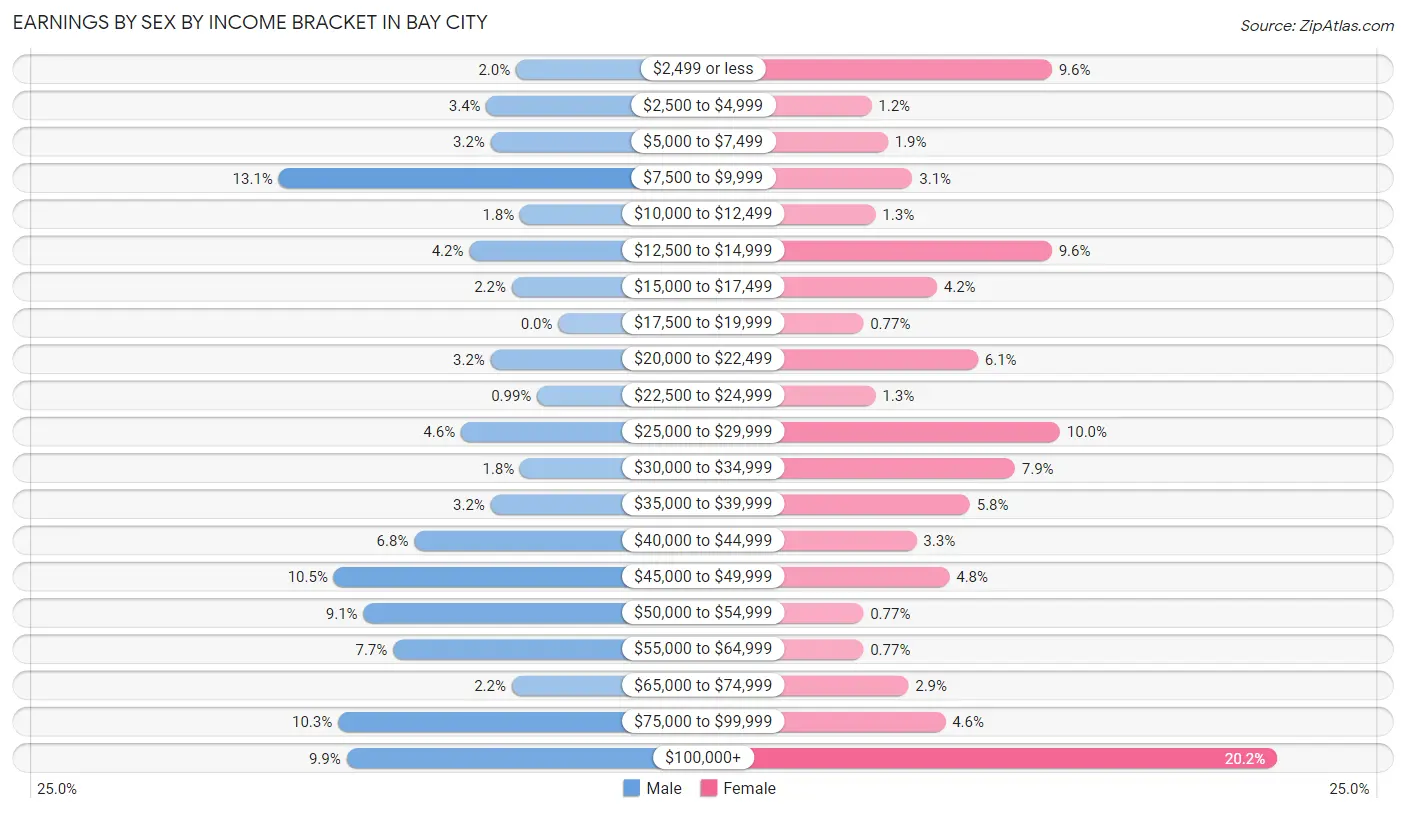
Earnings by Sex by Income Bracket in Bay City
The most common earnings brackets in Bay City are $7,500 to $9,999 for men (66 | 13.1%) and $100,000+ for women (105 | 20.2%).
| Income | Male | Female |
| $2,499 or less | 10 (2.0%) | 50 (9.6%) |
| $2,500 to $4,999 | 17 (3.4%) | 6 (1.1%) |
| $5,000 to $7,499 | 16 (3.2%) | 10 (1.9%) |
| $7,500 to $9,999 | 66 (13.1%) | 16 (3.1%) |
| $10,000 to $12,499 | 9 (1.8%) | 7 (1.3%) |
| $12,500 to $14,999 | 21 (4.2%) | 50 (9.6%) |
| $15,000 to $17,499 | 11 (2.2%) | 22 (4.2%) |
| $17,500 to $19,999 | 0 (0.0%) | 4 (0.8%) |
| $20,000 to $22,499 | 16 (3.2%) | 32 (6.1%) |
| $22,500 to $24,999 | 5 (1.0%) | 7 (1.3%) |
| $25,000 to $29,999 | 23 (4.6%) | 52 (10.0%) |
| $30,000 to $34,999 | 9 (1.8%) | 41 (7.9%) |
| $35,000 to $39,999 | 16 (3.2%) | 30 (5.8%) |
| $40,000 to $44,999 | 34 (6.8%) | 17 (3.3%) |
| $45,000 to $49,999 | 53 (10.5%) | 25 (4.8%) |
| $50,000 to $54,999 | 46 (9.1%) | 4 (0.8%) |
| $55,000 to $64,999 | 39 (7.7%) | 4 (0.8%) |
| $65,000 to $74,999 | 11 (2.2%) | 15 (2.9%) |
| $75,000 to $99,999 | 52 (10.3%) | 24 (4.6%) |
| $100,000+ | 50 (9.9%) | 105 (20.2%) |
| Total | 504 (100.0%) | 521 (100.0%) |
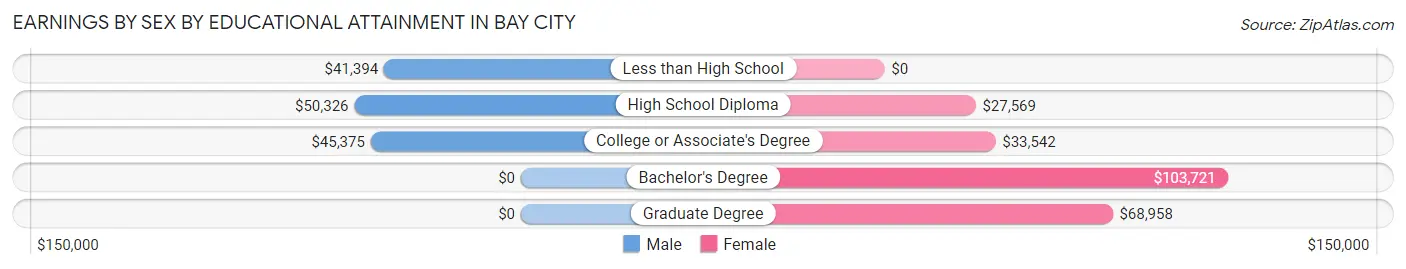
Earnings by Sex by Educational Attainment in Bay City
Average earnings in Bay City are $45,094 for men and $31,635 for women, a difference of 29.8%. Men with an educational attainment of high school diploma enjoy the highest average annual earnings of $50,326, while those with less than high school education earn the least with $41,394. Women with an educational attainment of bachelor's degree earn the most with the average annual earnings of $103,721, while those with high school diploma education have the smallest earnings of $27,569.
| Educational Attainment | Male Income | Female Income |
| Less than High School | $41,394 | $0 |
| High School Diploma | $50,326 | $27,569 |
| College or Associate's Degree | $45,375 | $33,542 |
| Bachelor's Degree | - | - |
| Graduate Degree | - | - |
| Total | $45,094 | $31,635 |
Family Income in Bay City
Family Income Brackets in Bay City
According to the Bay City family income data, there are 180 families falling into the $100,000 to $149,999 income range, which is the most common income bracket and makes up 30.3% of all families.
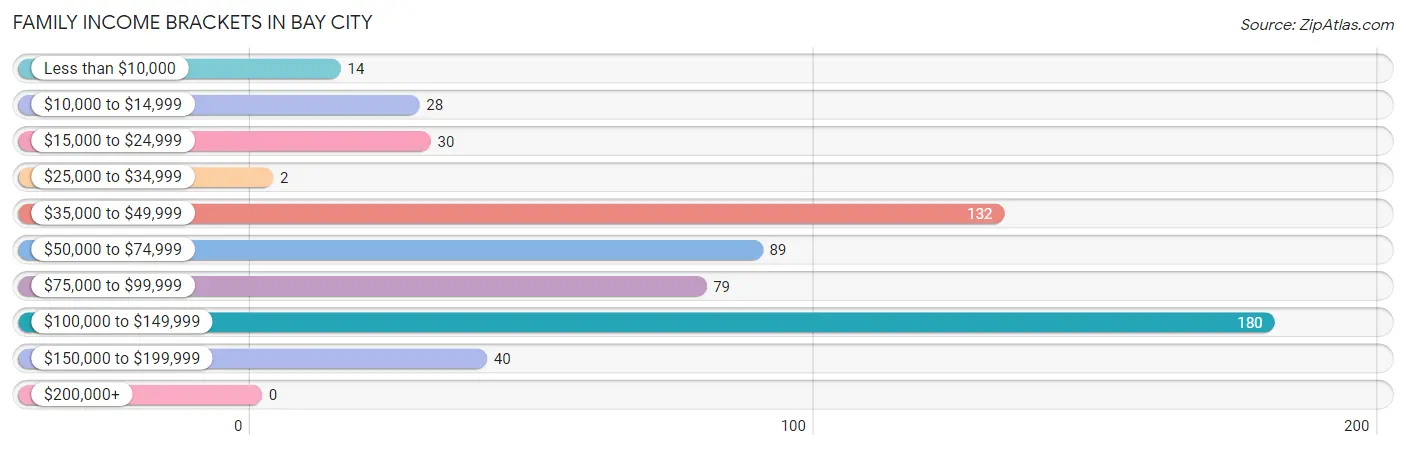
| Income Bracket | # Families | % Families |
| Less than $10,000 | 14 | 2.4% |
| $10,000 to $14,999 | 28 | 4.7% |
| $15,000 to $24,999 | 30 | 5.1% |
| $25,000 to $34,999 | 2 | 0.3% |
| $35,000 to $49,999 | 132 | 22.2% |
| $50,000 to $74,999 | 89 | 15.0% |
| $75,000 to $99,999 | 79 | 13.3% |
| $100,000 to $149,999 | 180 | 30.3% |
| $150,000 to $199,999 | 40 | 6.7% |
| $200,000+ | 0 | 0.0% |
Family Income by Famaliy Size in Bay City
4-person families (84 | 14.1%) account for the highest median family income in Bay City with $113,081 per family, while 2-person families (342 | 57.6%) have the highest median income of $32,334 per family member.
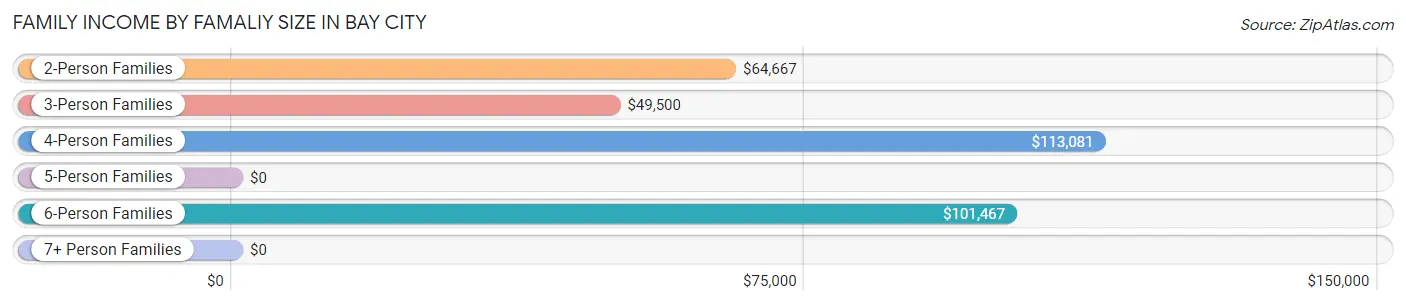
| Income Bracket | # Families | Median Income |
| 2-Person Families | 342 (57.6%) | $64,667 |
| 3-Person Families | 110 (18.5%) | $49,500 |
| 4-Person Families | 84 (14.1%) | $113,081 |
| 5-Person Families | 15 (2.5%) | $0 |
| 6-Person Families | 37 (6.2%) | $101,467 |
| 7+ Person Families | 6 (1.0%) | $0 |
| Total | 594 (100.0%) | $75,417 |
Family Income by Number of Earners in Bay City
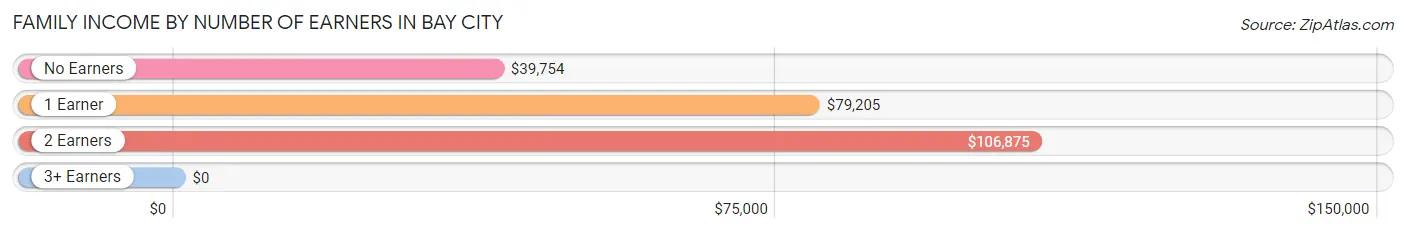
| Number of Earners | # Families | Median Income |
| No Earners | 158 (26.6%) | $39,754 |
| 1 Earner | 175 (29.5%) | $79,205 |
| 2 Earners | 238 (40.1%) | $106,875 |
| 3+ Earners | 23 (3.9%) | $0 |
| Total | 594 (100.0%) | $75,417 |
Household Income in Bay City
Household Income Brackets in Bay City
With 222 households falling in the category, the $100,000 to $149,999 income range is the most frequent in Bay City, accounting for 24.6% of all households. In contrast, only 18 households (2.0%) fall into the $200,000+ income bracket, making it the least populous group.
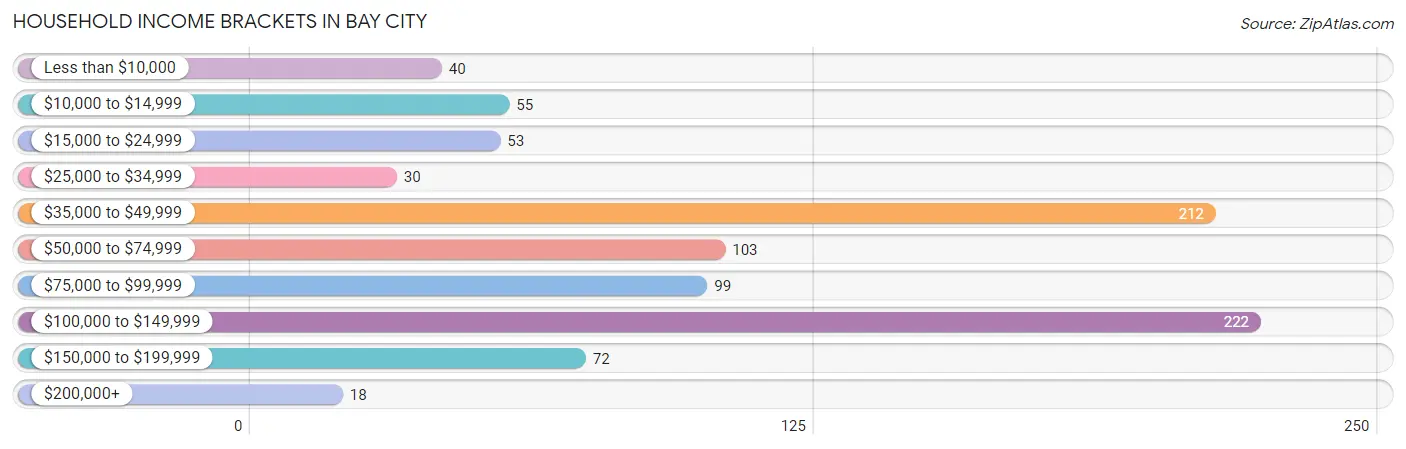
| Income Bracket | # Households | % Households |
| Less than $10,000 | 40 | 4.4% |
| $10,000 to $14,999 | 55 | 6.1% |
| $15,000 to $24,999 | 53 | 5.9% |
| $25,000 to $34,999 | 30 | 3.3% |
| $35,000 to $49,999 | 212 | 23.5% |
| $50,000 to $74,999 | 103 | 11.4% |
| $75,000 to $99,999 | 99 | 11.0% |
| $100,000 to $149,999 | 222 | 24.6% |
| $150,000 to $199,999 | 72 | 8.0% |
| $200,000+ | 18 | 2.0% |
Household Income by Householder Age in Bay City
The median household income in Bay City is $64,167, with the highest median household income of $99,286 found in the 25 to 44 years age bracket for the primary householder. A total of 262 households (29.0%) fall into this category. Meanwhile, the 15 to 24 years age bracket for the primary householder has the lowest median household income of $0, with 8 households (0.9%) in this group.
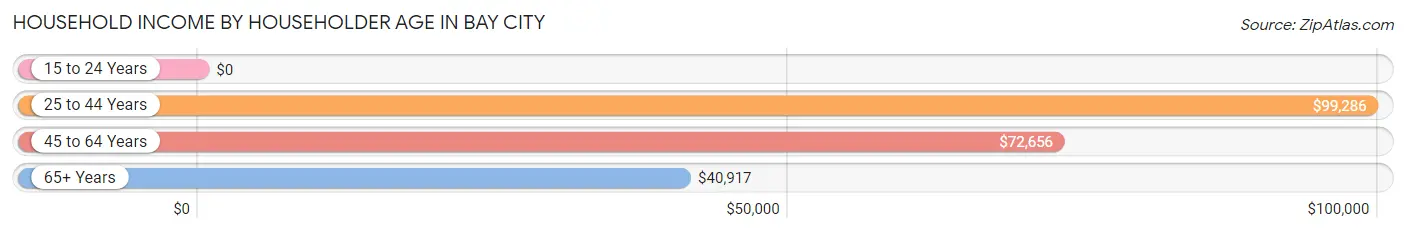
| Income Bracket | # Households | Median Income |
| 15 to 24 Years | 8 (0.9%) | $0 |
| 25 to 44 Years | 262 (29.0%) | $99,286 |
| 45 to 64 Years | 311 (34.4%) | $72,656 |
| 65+ Years | 323 (35.7%) | $40,917 |
| Total | 904 (100.0%) | $64,167 |
Poverty in Bay City
Income Below Poverty by Sex and Age in Bay City
With 16.1% poverty level for males and 12.0% for females among the residents of Bay City, 16 and 17 year old males and 18 to 24 year old females are the most vulnerable to poverty, with 12 males (75.0%) and 23 females (59.0%) in their respective age groups living below the poverty level.
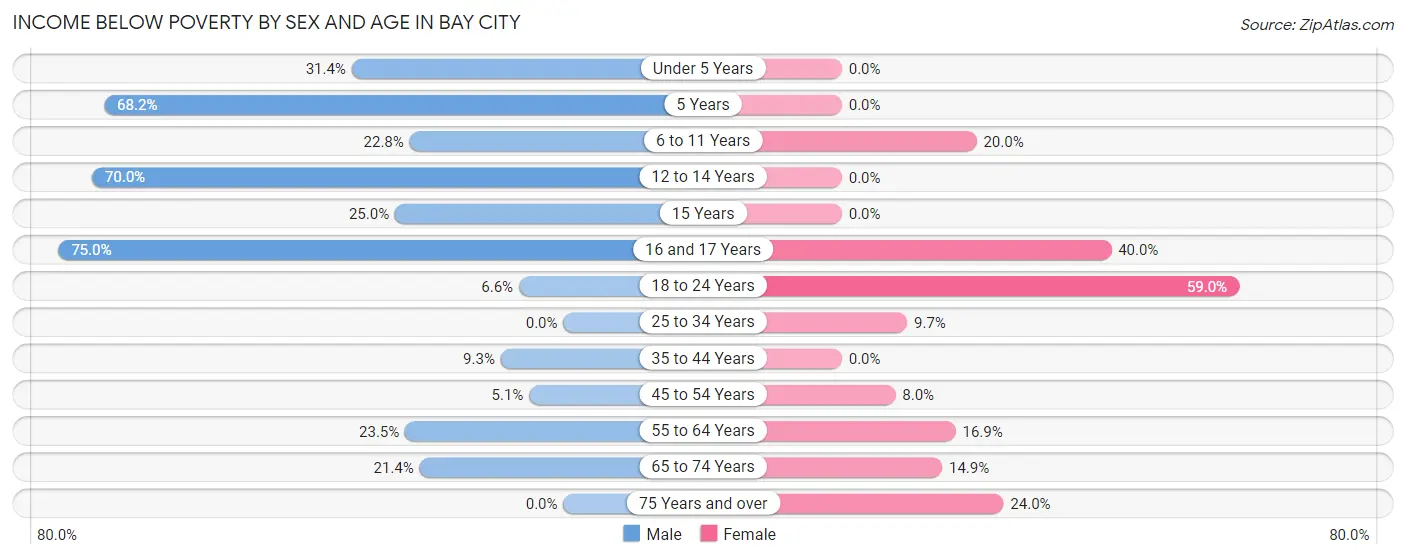
| Age Bracket | Male | Female |
| Under 5 Years | 11 (31.4%) | 0 (0.0%) |
| 5 Years | 15 (68.2%) | 0 (0.0%) |
| 6 to 11 Years | 29 (22.8%) | 6 (20.0%) |
| 12 to 14 Years | 14 (70.0%) | 0 (0.0%) |
| 15 Years | 2 (25.0%) | 0 (0.0%) |
| 16 and 17 Years | 12 (75.0%) | 2 (40.0%) |
| 18 to 24 Years | 6 (6.6%) | 23 (59.0%) |
| 25 to 34 Years | 0 (0.0%) | 13 (9.7%) |
| 35 to 44 Years | 12 (9.3%) | 0 (0.0%) |
| 45 to 54 Years | 7 (5.1%) | 7 (8.0%) |
| 55 to 64 Years | 43 (23.5%) | 37 (16.9%) |
| 65 to 74 Years | 19 (21.3%) | 21 (14.9%) |
| 75 Years and over | 0 (0.0%) | 30 (24.0%) |
| Total | 170 (16.1%) | 139 (12.0%) |
Income Above Poverty by Sex and Age in Bay City
According to the poverty statistics in Bay City, males aged 25 to 34 years and females aged under 5 years are the age groups that are most secure financially, with 100.0% of males and 100.0% of females in these age groups living above the poverty line.
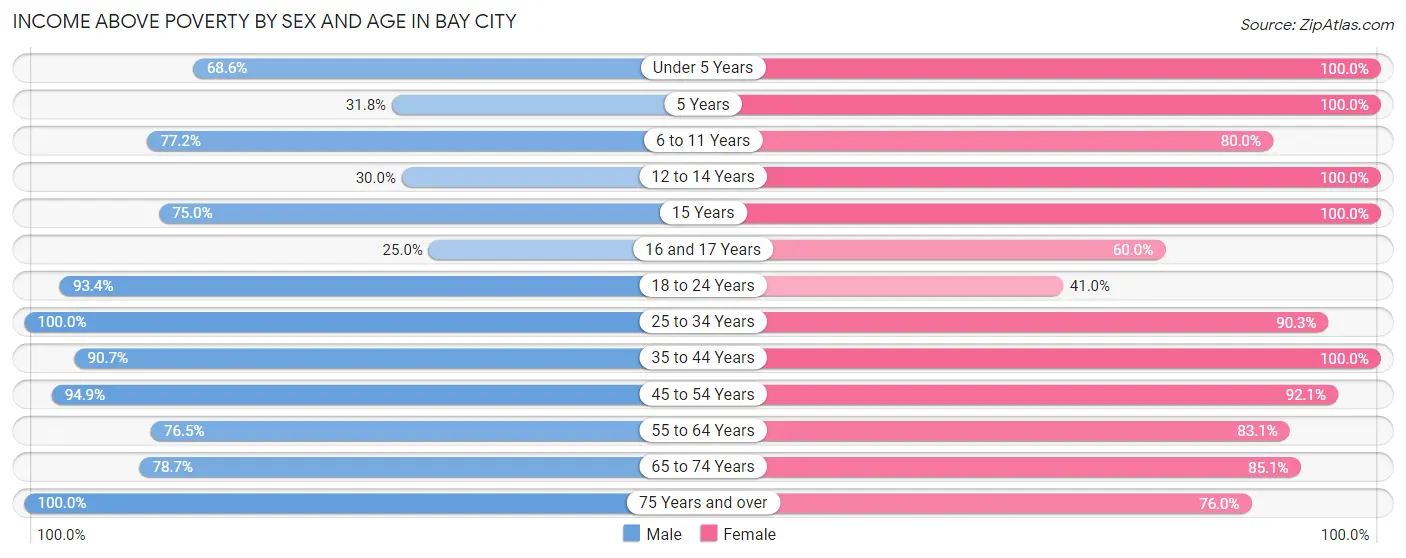
| Age Bracket | Male | Female |
| Under 5 Years | 24 (68.6%) | 123 (100.0%) |
| 5 Years | 7 (31.8%) | 32 (100.0%) |
| 6 to 11 Years | 98 (77.2%) | 24 (80.0%) |
| 12 to 14 Years | 6 (30.0%) | 55 (100.0%) |
| 15 Years | 6 (75.0%) | 11 (100.0%) |
| 16 and 17 Years | 4 (25.0%) | 3 (60.0%) |
| 18 to 24 Years | 85 (93.4%) | 16 (41.0%) |
| 25 to 34 Years | 86 (100.0%) | 121 (90.3%) |
| 35 to 44 Years | 117 (90.7%) | 154 (100.0%) |
| 45 to 54 Years | 131 (94.9%) | 81 (92.0%) |
| 55 to 64 Years | 140 (76.5%) | 182 (83.1%) |
| 65 to 74 Years | 70 (78.6%) | 120 (85.1%) |
| 75 Years and over | 115 (100.0%) | 95 (76.0%) |
| Total | 889 (84.0%) | 1,017 (88.0%) |
Income Below Poverty Among Married-Couple Families in Bay City
The poverty statistics for married-couple families in Bay City show that 7.5% or 37 of the total 493 families live below the poverty line. Families with 1 or 2 children have the highest poverty rate of 11.9%, comprising of 14 families. On the other hand, families with 3 or 4 children have the lowest poverty rate of 4.1%, which includes 2 families.
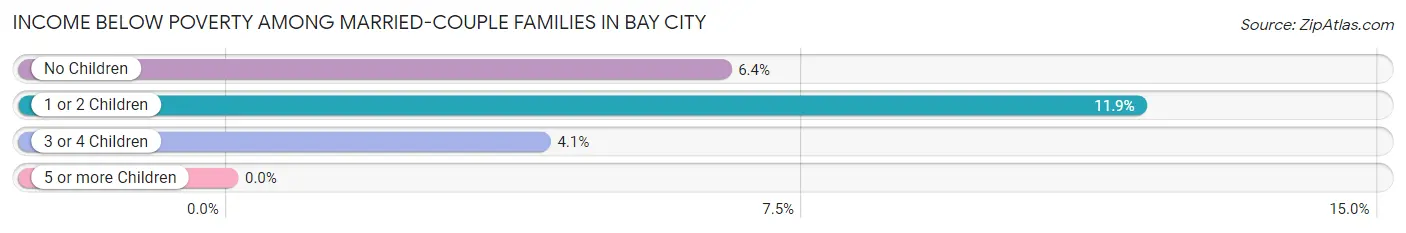
| Children | Above Poverty | Below Poverty |
| No Children | 305 (93.6%) | 21 (6.4%) |
| 1 or 2 Children | 104 (88.1%) | 14 (11.9%) |
| 3 or 4 Children | 47 (95.9%) | 2 (4.1%) |
| 5 or more Children | 0 (0.0%) | 0 (0.0%) |
| Total | 456 (92.5%) | 37 (7.5%) |
Income Below Poverty Among Single-Parent Households in Bay City
According to the poverty data in Bay City, 31.8% or 7 single-father households and 27.9% or 22 single-mother households are living below the poverty line. Among single-father households, those with 1 or 2 children have the highest poverty rate, with 7 households (35.0%) experiencing poverty. Likewise, among single-mother households, those with 3 or 4 children have the highest poverty rate, with 11 households (52.4%) falling below the poverty line.
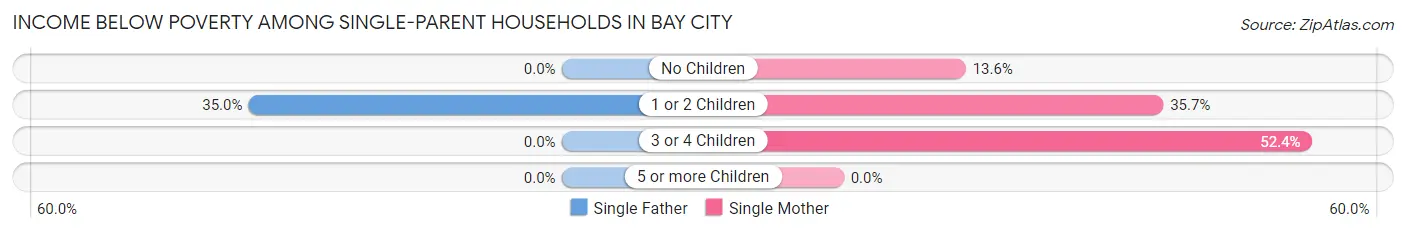
| Children | Single Father | Single Mother |
| No Children | 0 (0.0%) | 6 (13.6%) |
| 1 or 2 Children | 7 (35.0%) | 5 (35.7%) |
| 3 or 4 Children | 0 (0.0%) | 11 (52.4%) |
| 5 or more Children | 0 (0.0%) | 0 (0.0%) |
| Total | 7 (31.8%) | 22 (27.9%) |
Income Below Poverty Among Married-Couple vs Single-Parent Households in Bay City
The poverty data for Bay City shows that 37 of the married-couple family households (7.5%) and 29 of the single-parent households (28.7%) are living below the poverty level. Within the married-couple family households, those with 1 or 2 children have the highest poverty rate, with 14 households (11.9%) falling below the poverty line. Among the single-parent households, those with 3 or 4 children have the highest poverty rate, with 11 household (52.4%) living below poverty.
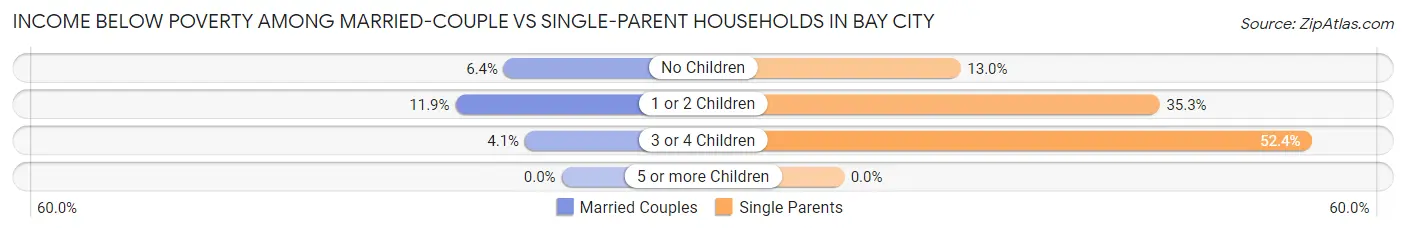
| Children | Married-Couple Families | Single-Parent Households |
| No Children | 21 (6.4%) | 6 (13.0%) |
| 1 or 2 Children | 14 (11.9%) | 12 (35.3%) |
| 3 or 4 Children | 2 (4.1%) | 11 (52.4%) |
| 5 or more Children | 0 (0.0%) | 0 (0.0%) |
| Total | 37 (7.5%) | 29 (28.7%) |
Race in Bay City
The most populous races in Bay City are White / Caucasian (1,941 | 87.3%), Hispanic or Latino (321 | 14.4%), and Two or more Races (181 | 8.1%).
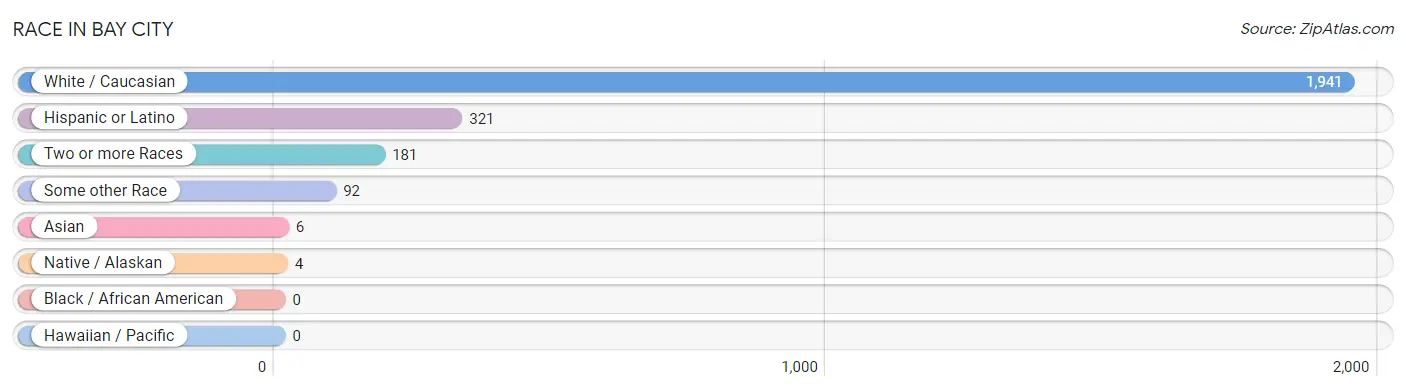
| Race | # Population | % Population |
| Asian | 6 | 0.3% |
| Black / African American | 0 | 0.0% |
| Hawaiian / Pacific | 0 | 0.0% |
| Hispanic or Latino | 321 | 14.4% |
| Native / Alaskan | 4 | 0.2% |
| White / Caucasian | 1,941 | 87.3% |
| Two or more Races | 181 | 8.1% |
| Some other Race | 92 | 4.1% |
| Total | 2,224 | 100.0% |
Ancestry in Bay City
The most populous ancestries reported in Bay City are German (412 | 18.5%), English (343 | 15.4%), Mexican (184 | 8.3%), Irish (163 | 7.3%), and Norwegian (160 | 7.2%), together accounting for 56.7% of all Bay City residents.
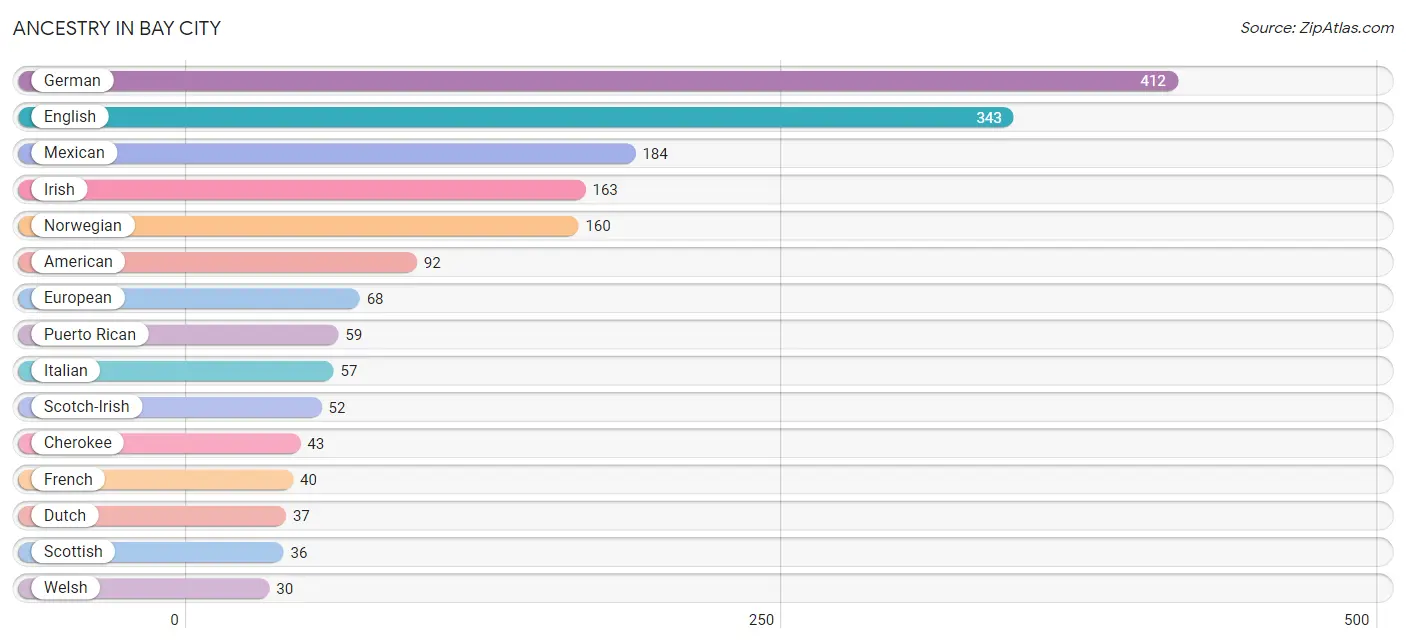
| Ancestry | # Population | % Population |
| African | 3 | 0.1% |
| American | 92 | 4.1% |
| Apache | 10 | 0.4% |
| Arab | 3 | 0.1% |
| Bhutanese | 13 | 0.6% |
| British | 24 | 1.1% |
| Cherokee | 43 | 1.9% |
| Cuban | 25 | 1.1% |
| Czech | 11 | 0.5% |
| Czechoslovakian | 7 | 0.3% |
| Danish | 4 | 0.2% |
| Dutch | 37 | 1.7% |
| Eastern European | 18 | 0.8% |
| Ecuadorian | 11 | 0.5% |
| Egyptian | 3 | 0.1% |
| English | 343 | 15.4% |
| European | 68 | 3.1% |
| Finnish | 8 | 0.4% |
| French | 40 | 1.8% |
| German | 412 | 18.5% |
| Greek | 3 | 0.1% |
| Indian (Asian) | 9 | 0.4% |
| Irish | 163 | 7.3% |
| Italian | 57 | 2.6% |
| Mexican | 184 | 8.3% |
| Mexican American Indian | 4 | 0.2% |
| Native Hawaiian | 5 | 0.2% |
| Northern European | 7 | 0.3% |
| Norwegian | 160 | 7.2% |
| Portuguese | 19 | 0.9% |
| Puerto Rican | 59 | 2.6% |
| Romanian | 5 | 0.2% |
| Scandinavian | 19 | 0.9% |
| Scotch-Irish | 52 | 2.3% |
| Scottish | 36 | 1.6% |
| Somali | 23 | 1.0% |
| South American | 11 | 0.5% |
| Spaniard | 8 | 0.4% |
| Subsaharan African | 26 | 1.2% |
| Swedish | 19 | 0.9% |
| Swiss | 18 | 0.8% |
| Ukrainian | 5 | 0.2% |
| Welsh | 30 | 1.3% |
| Yaqui | 13 | 0.6% | View All 44 Rows |
Immigrants in Bay City
The most numerous immigrant groups reported in Bay City came from Latin America (103 | 4.6%), Central America (95 | 4.3%), Mexico (95 | 4.3%), Caribbean (8 | 0.4%), and Cuba (8 | 0.4%), together accounting for 13.9% of all Bay City residents.
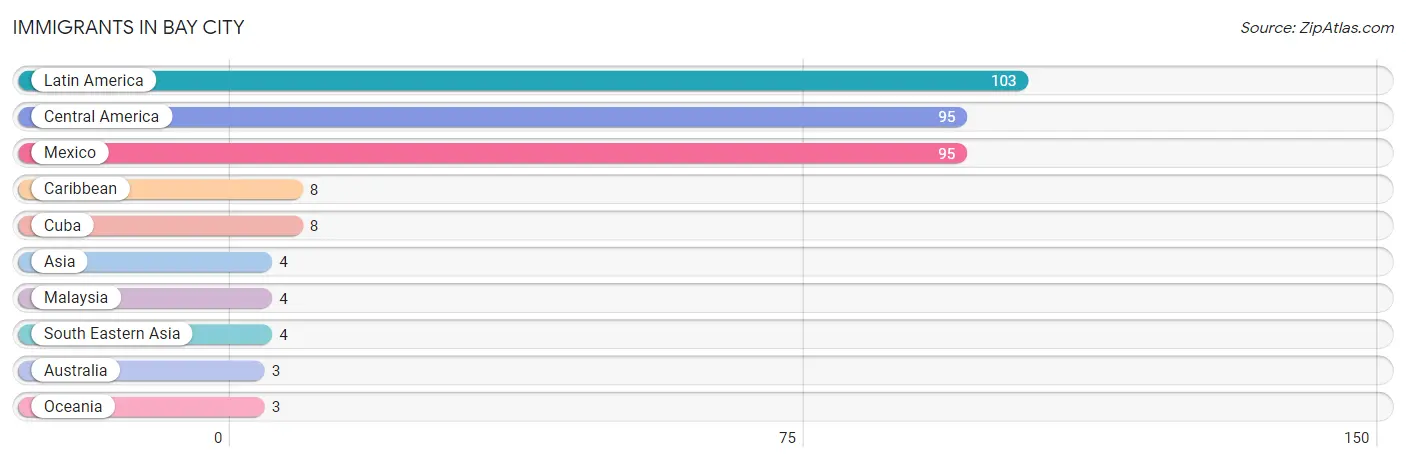
| Immigration Origin | # Population | % Population |
| Asia | 4 | 0.2% |
| Australia | 3 | 0.1% |
| Caribbean | 8 | 0.4% |
| Central America | 95 | 4.3% |
| Cuba | 8 | 0.4% |
| Latin America | 103 | 4.6% |
| Malaysia | 4 | 0.2% |
| Mexico | 95 | 4.3% |
| Oceania | 3 | 0.1% |
| South Eastern Asia | 4 | 0.2% | View All 10 Rows |
Sex and Age in Bay City
Sex and Age in Bay City
The most populous age groups in Bay City are 5 to 9 Years (106 | 9.9%) for men and Under 5 Years (123 | 10.6%) for women.
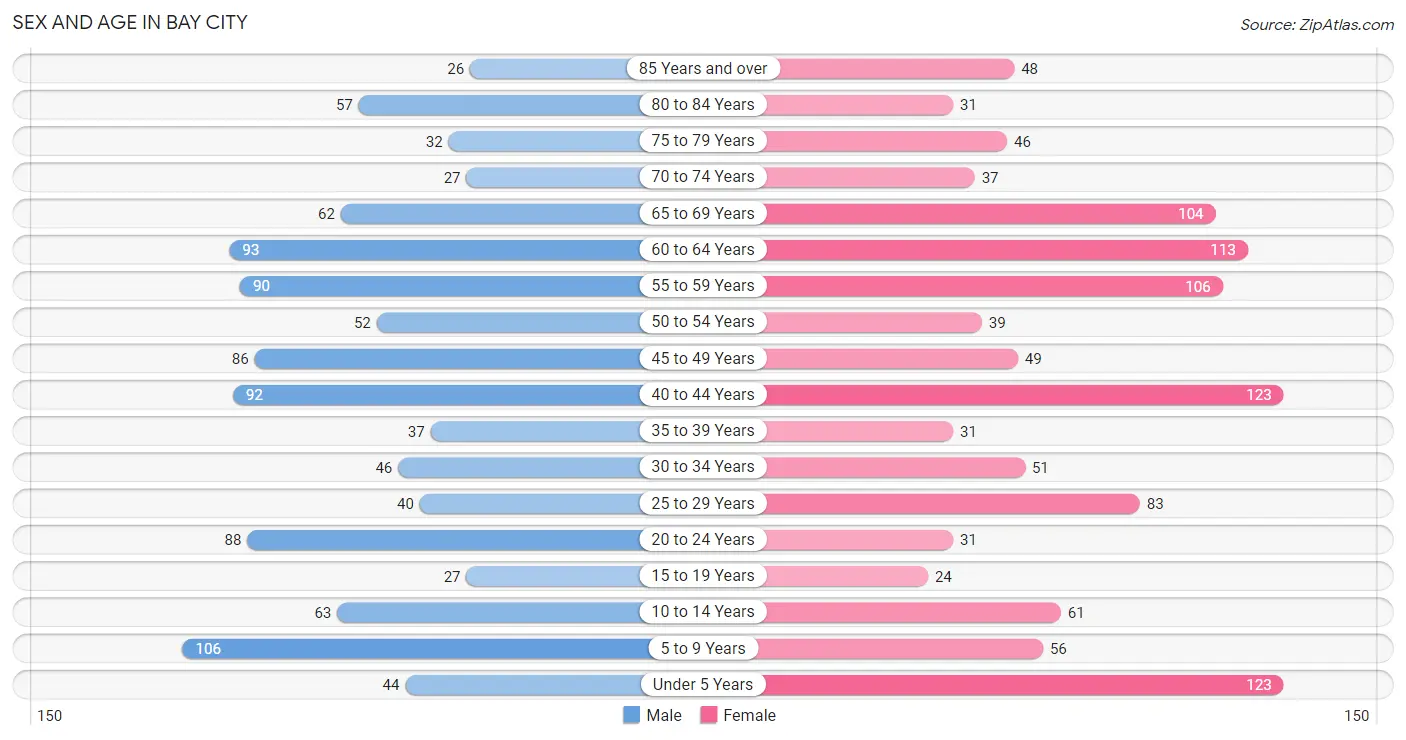
| Age Bracket | Male | Female |
| Under 5 Years | 44 (4.1%) | 123 (10.6%) |
| 5 to 9 Years | 106 (9.9%) | 56 (4.8%) |
| 10 to 14 Years | 63 (5.9%) | 61 (5.3%) |
| 15 to 19 Years | 27 (2.5%) | 24 (2.1%) |
| 20 to 24 Years | 88 (8.2%) | 31 (2.7%) |
| 25 to 29 Years | 40 (3.7%) | 83 (7.2%) |
| 30 to 34 Years | 46 (4.3%) | 51 (4.4%) |
| 35 to 39 Years | 37 (3.5%) | 31 (2.7%) |
| 40 to 44 Years | 92 (8.6%) | 123 (10.6%) |
| 45 to 49 Years | 86 (8.1%) | 49 (4.2%) |
| 50 to 54 Years | 52 (4.9%) | 39 (3.4%) |
| 55 to 59 Years | 90 (8.4%) | 106 (9.2%) |
| 60 to 64 Years | 93 (8.7%) | 113 (9.8%) |
| 65 to 69 Years | 62 (5.8%) | 104 (9.0%) |
| 70 to 74 Years | 27 (2.5%) | 37 (3.2%) |
| 75 to 79 Years | 32 (3.0%) | 46 (4.0%) |
| 80 to 84 Years | 57 (5.3%) | 31 (2.7%) |
| 85 Years and over | 26 (2.4%) | 48 (4.2%) |
| Total | 1,068 (100.0%) | 1,156 (100.0%) |
Families and Households in Bay City
Median Family Size in Bay City
The median family size in Bay City is 2.98 persons per family, with single female/mother families (79 | 13.3%) accounting for the largest median family size of 3.13 persons per family. On the other hand, single male/father families (22 | 3.7%) represent the smallest median family size with 2.45 persons per family.
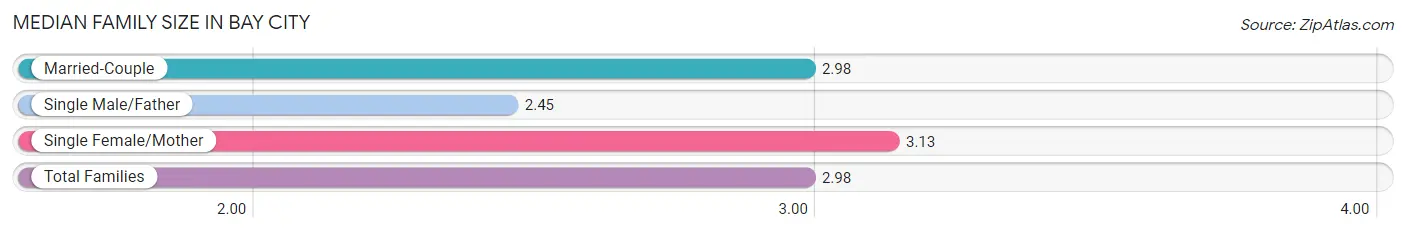
| Family Type | # Families | Family Size |
| Married-Couple | 493 (83.0%) | 2.98 |
| Single Male/Father | 22 (3.7%) | 2.45 |
| Single Female/Mother | 79 (13.3%) | 3.13 |
| Total Families | 594 (100.0%) | 2.98 |
Median Household Size in Bay City
The median household size in Bay City is 2.46 persons per household, with single female/mother households (79 | 8.7%) accounting for the largest median household size of 3.25 persons per household. non-family households (310 | 34.3%) represent the smallest median household size with 1.32 persons per household.
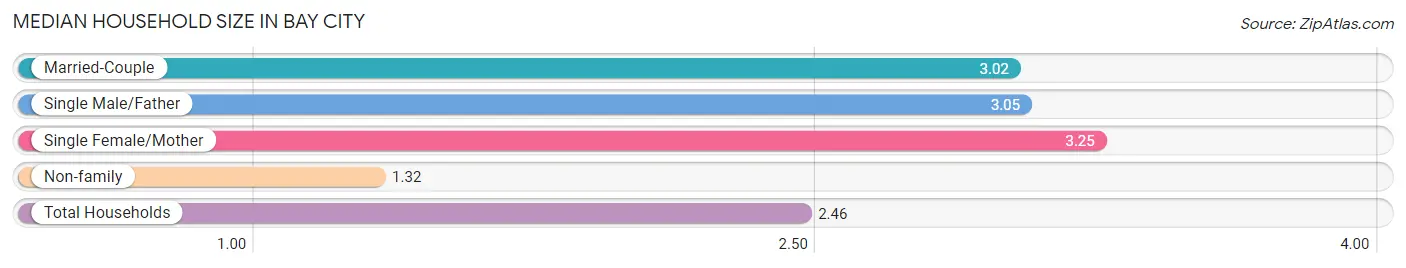
| Household Type | # Households | Household Size |
| Married-Couple | 493 (54.5%) | 3.02 |
| Single Male/Father | 22 (2.4%) | 3.05 |
| Single Female/Mother | 79 (8.7%) | 3.25 |
| Non-family | 310 (34.3%) | 1.32 |
| Total Households | 904 (100.0%) | 2.46 |
Household Size by Marriage Status in Bay City
Out of a total of 904 households in Bay City, 594 (65.7%) are family households, while 310 (34.3%) are nonfamily households. The most numerous type of family households are 2-person households, comprising 308, and the most common type of nonfamily households are 1-person households, comprising 194.
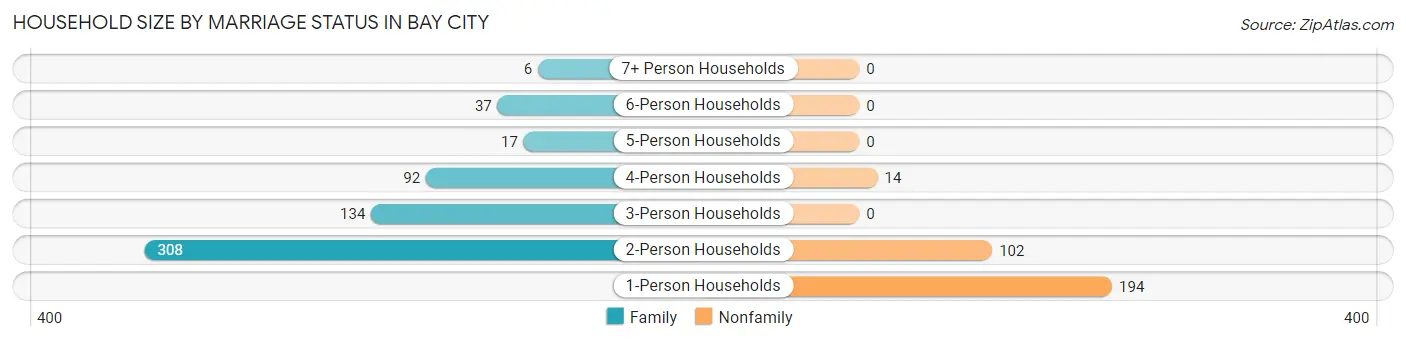
| Household Size | Family Households | Nonfamily Households |
| 1-Person Households | - | 194 (21.5%) |
| 2-Person Households | 308 (34.1%) | 102 (11.3%) |
| 3-Person Households | 134 (14.8%) | 0 (0.0%) |
| 4-Person Households | 92 (10.2%) | 14 (1.5%) |
| 5-Person Households | 17 (1.9%) | 0 (0.0%) |
| 6-Person Households | 37 (4.1%) | 0 (0.0%) |
| 7+ Person Households | 6 (0.7%) | 0 (0.0%) |
| Total | 594 (65.7%) | 310 (34.3%) |
Female Fertility in Bay City
Fertility by Age in Bay City
Average fertility rate in Bay City is 67.0 births per 1,000 women. Women in the age bracket of 20 to 34 years have the highest fertility rate with 164.0 births per 1,000 women. Women in the age bracket of 20 to 34 years acount for 100.0% of all women with births.
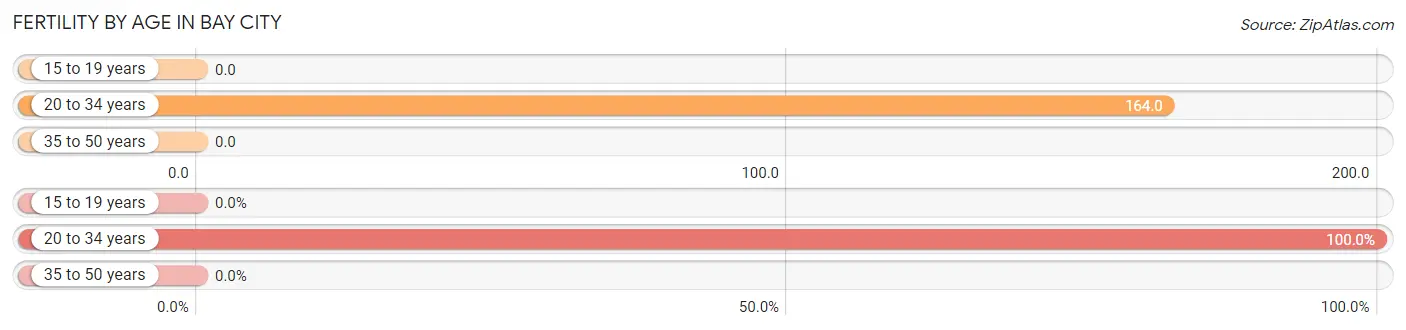
| Age Bracket | Women with Births | Births / 1,000 Women |
| 15 to 19 years | 0 (0.0%) | 0.0 |
| 20 to 34 years | 27 (100.0%) | 164.0 |
| 35 to 50 years | 0 (0.0%) | 0.0 |
| Total | 27 (100.0%) | 67.0 |
Fertility by Age by Marriage Status in Bay City
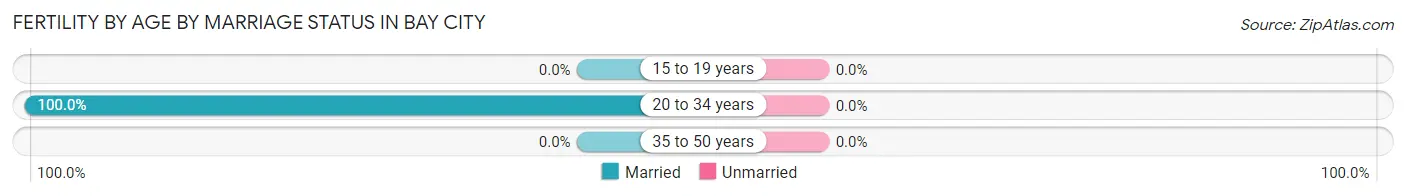
| Age Bracket | Married | Unmarried |
| 15 to 19 years | 0 (0.0%) | 0 (0.0%) |
| 20 to 34 years | 27 (100.0%) | 0 (0.0%) |
| 35 to 50 years | 0 (0.0%) | 0 (0.0%) |
| Total | 27 (100.0%) | 0 (0.0%) |
Fertility by Education in Bay City
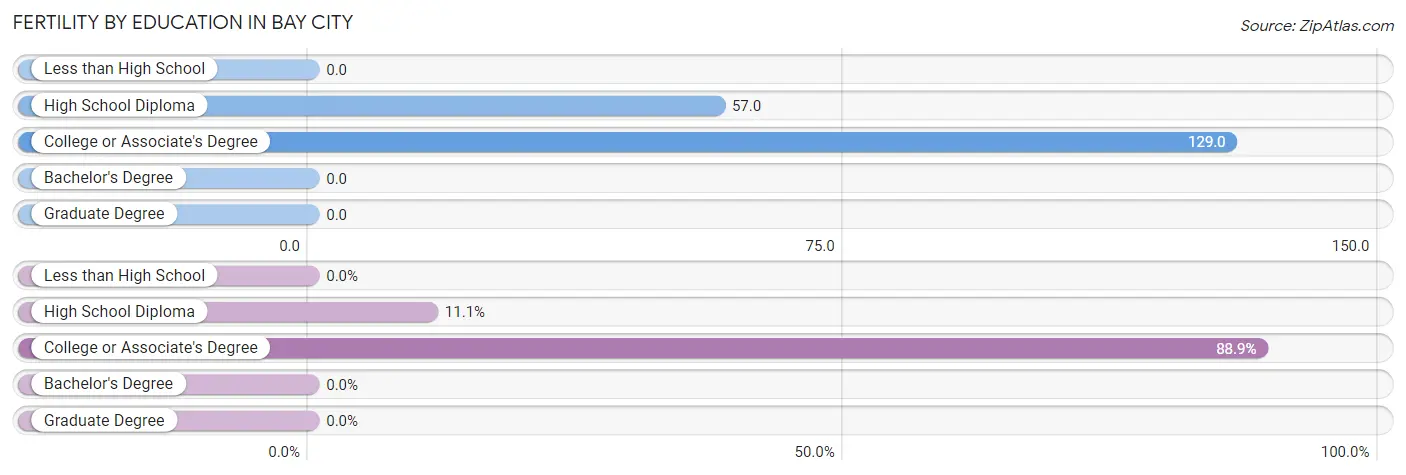
| Educational Attainment | Women with Births | Births / 1,000 Women |
| Less than High School | 0 (0.0%) | 0.0 |
| High School Diploma | 3 (11.1%) | 57.0 |
| College or Associate's Degree | 24 (88.9%) | 129.0 |
| Bachelor's Degree | 0 (0.0%) | 0.0 |
| Graduate Degree | 0 (0.0%) | 0.0 |
| Total | 27 (100.0%) | 67.0 |
Fertility by Education by Marriage Status in Bay City
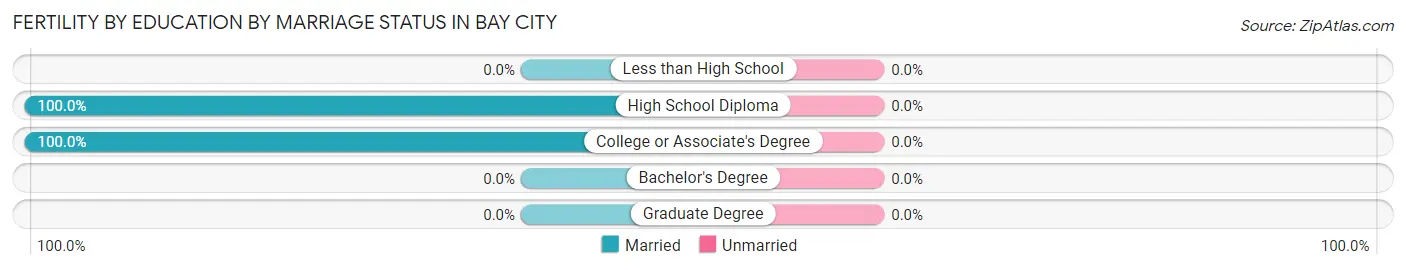
| Educational Attainment | Married | Unmarried |
| Less than High School | 0 (0.0%) | 0 (0.0%) |
| High School Diploma | 3 (100.0%) | 0 (0.0%) |
| College or Associate's Degree | 24 (100.0%) | 0 (0.0%) |
| Bachelor's Degree | 0 (0.0%) | 0 (0.0%) |
| Graduate Degree | 0 (0.0%) | 0 (0.0%) |
| Total | 27 (100.0%) | 0 (0.0%) |
Employment Characteristics in Bay City
Employment by Class of Employer in Bay City
Among the 943 employed individuals in Bay City, private company employees (484 | 51.3%), not-for-profit organizations (203 | 21.5%), and self-employed (not incorporated) (86 | 9.1%) make up the most common classes of employment.
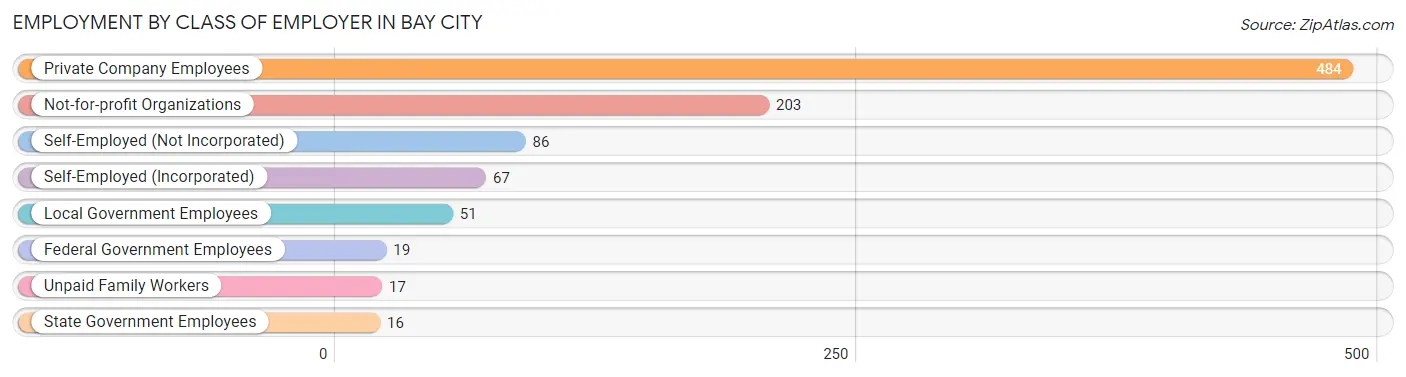
| Employer Class | # Employees | % Employees |
| Private Company Employees | 484 | 51.3% |
| Self-Employed (Incorporated) | 67 | 7.1% |
| Self-Employed (Not Incorporated) | 86 | 9.1% |
| Not-for-profit Organizations | 203 | 21.5% |
| Local Government Employees | 51 | 5.4% |
| State Government Employees | 16 | 1.7% |
| Federal Government Employees | 19 | 2.0% |
| Unpaid Family Workers | 17 | 1.8% |
| Total | 943 | 100.0% |
Employment Status by Age in Bay City
According to the labor force statistics for Bay City, out of the total population over 16 years of age (1,752), 56.2% or 985 individuals are in the labor force, with 3.6% or 35 of them unemployed. The age group with the highest labor force participation rate is 35 to 44 years, with 90.1% or 255 individuals in the labor force. Within the labor force, the 16 to 19 years age range has the highest percentage of unemployed individuals, with 36.4% or 4 of them being unemployed.
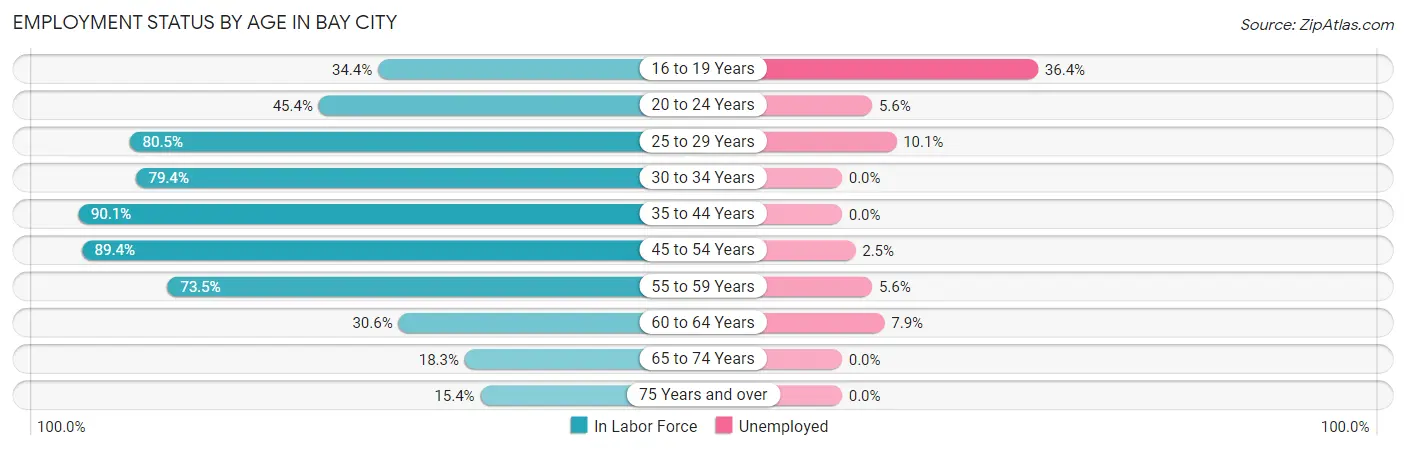
| Age Bracket | In Labor Force | Unemployed |
| 16 to 19 Years | 11 (34.4%) | 4 (36.4%) |
| 20 to 24 Years | 54 (45.4%) | 3 (5.6%) |
| 25 to 29 Years | 99 (80.5%) | 10 (10.1%) |
| 30 to 34 Years | 77 (79.4%) | 0 (0.0%) |
| 35 to 44 Years | 255 (90.1%) | 0 (0.0%) |
| 45 to 54 Years | 202 (89.4%) | 5 (2.5%) |
| 55 to 59 Years | 144 (73.5%) | 8 (5.6%) |
| 60 to 64 Years | 63 (30.6%) | 5 (7.9%) |
| 65 to 74 Years | 42 (18.3%) | 0 (0.0%) |
| 75 Years and over | 37 (15.4%) | 0 (0.0%) |
| Total | 985 (56.2%) | 35 (3.6%) |
Employment Status by Educational Attainment in Bay City
According to labor force statistics for Bay City, 74.3% of individuals (840) out of the total population between 25 and 64 years of age (1,131) are in the labor force, with 3.3% or 28 of them being unemployed. The group with the highest labor force participation rate are those with the educational attainment of bachelor's degree or higher, with 88.2% or 262 individuals in the labor force. Within the labor force, individuals with bachelor's degree or higher education have the highest percentage of unemployment, with 5.7% or 15 of them being unemployed.
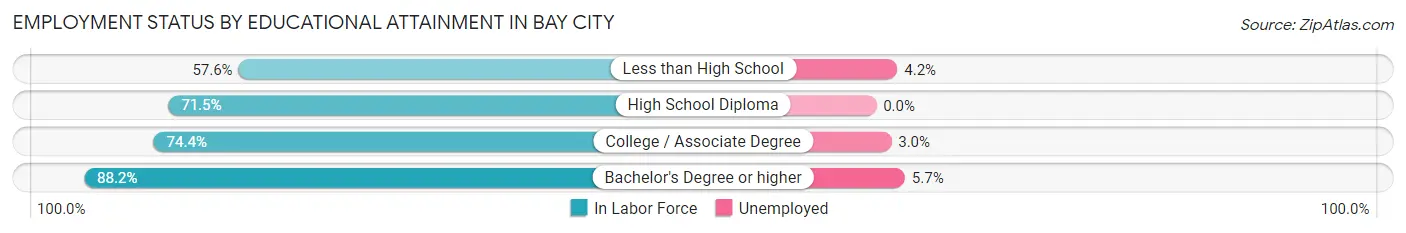
| Educational Attainment | In Labor Force | Unemployed |
| Less than High School | 118 (57.6%) | 9 (4.2%) |
| High School Diploma | 193 (71.5%) | 0 (0.0%) |
| College / Associate Degree | 267 (74.4%) | 11 (3.0%) |
| Bachelor's Degree or higher | 262 (88.2%) | 17 (5.7%) |
| Total | 840 (74.3%) | 37 (3.3%) |
Employment Occupations by Sex in Bay City
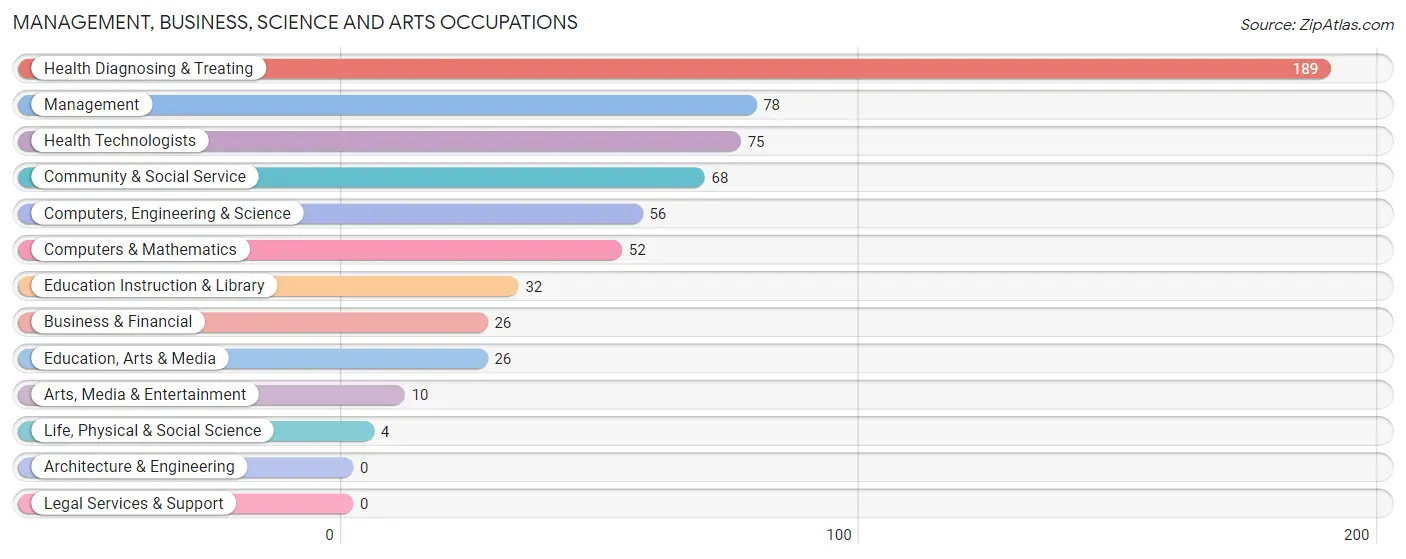
Management, Business, Science and Arts Occupations
The most common Management, Business, Science and Arts occupations in Bay City are Health Diagnosing & Treating (189 | 19.9%), Management (78 | 8.2%), Health Technologists (75 | 7.9%), Community & Social Service (68 | 7.2%), and Computers, Engineering & Science (56 | 5.9%).
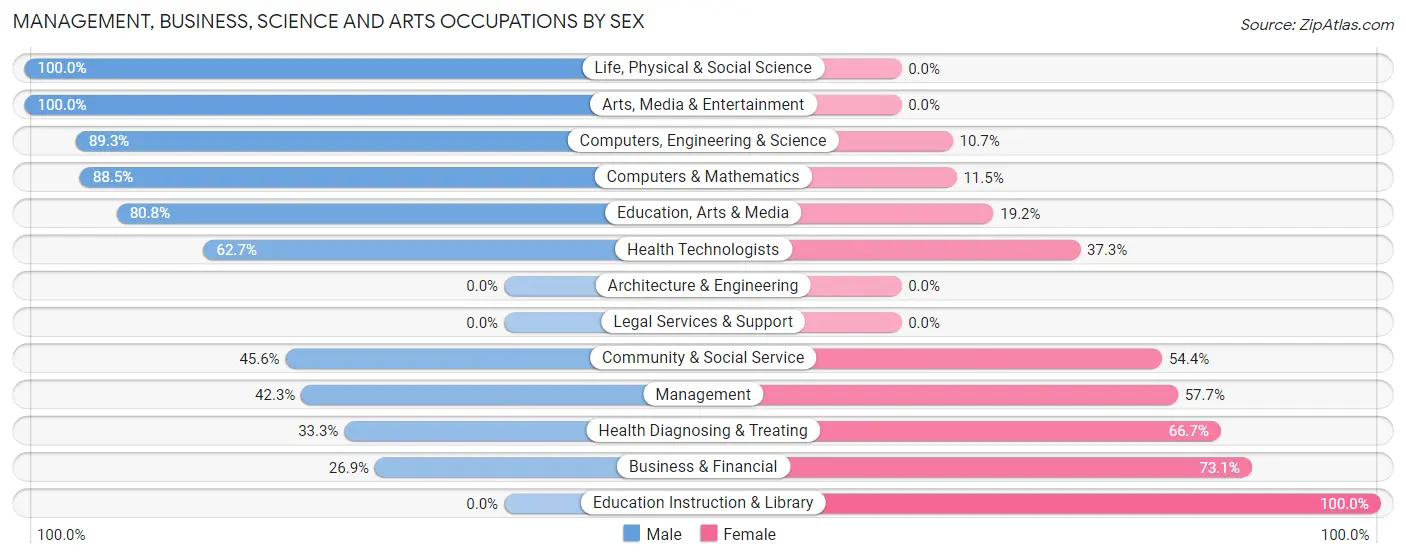
Management, Business, Science and Arts Occupations by Sex
Within the Management, Business, Science and Arts occupations in Bay City, the most male-oriented occupations are Life, Physical & Social Science (100.0%), Arts, Media & Entertainment (100.0%), and Computers, Engineering & Science (89.3%), while the most female-oriented occupations are Education Instruction & Library (100.0%), Business & Financial (73.1%), and Health Diagnosing & Treating (66.7%).
| Occupation | Male | Female |
| Management | 33 (42.3%) | 45 (57.7%) |
| Business & Financial | 7 (26.9%) | 19 (73.1%) |
| Computers, Engineering & Science | 50 (89.3%) | 6 (10.7%) |
| Computers & Mathematics | 46 (88.5%) | 6 (11.5%) |
| Architecture & Engineering | 0 (0.0%) | 0 (0.0%) |
| Life, Physical & Social Science | 4 (100.0%) | 0 (0.0%) |
| Community & Social Service | 31 (45.6%) | 37 (54.4%) |
| Education, Arts & Media | 21 (80.8%) | 5 (19.2%) |
| Legal Services & Support | 0 (0.0%) | 0 (0.0%) |
| Education Instruction & Library | 0 (0.0%) | 32 (100.0%) |
| Arts, Media & Entertainment | 10 (100.0%) | 0 (0.0%) |
| Health Diagnosing & Treating | 63 (33.3%) | 126 (66.7%) |
| Health Technologists | 47 (62.7%) | 28 (37.3%) |
| Total (Category) | 184 (44.1%) | 233 (55.9%) |
| Total (Overall) | 475 (50.0%) | 474 (49.9%) |
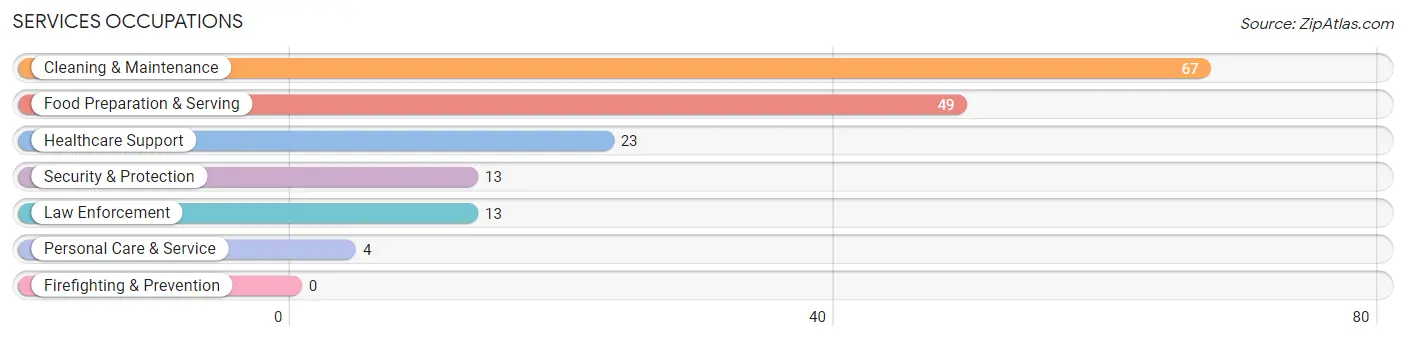
Services Occupations
The most common Services occupations in Bay City are Cleaning & Maintenance (67 | 7.1%), Food Preparation & Serving (49 | 5.2%), Healthcare Support (23 | 2.4%), Security & Protection (13 | 1.4%), and Law Enforcement (13 | 1.4%).
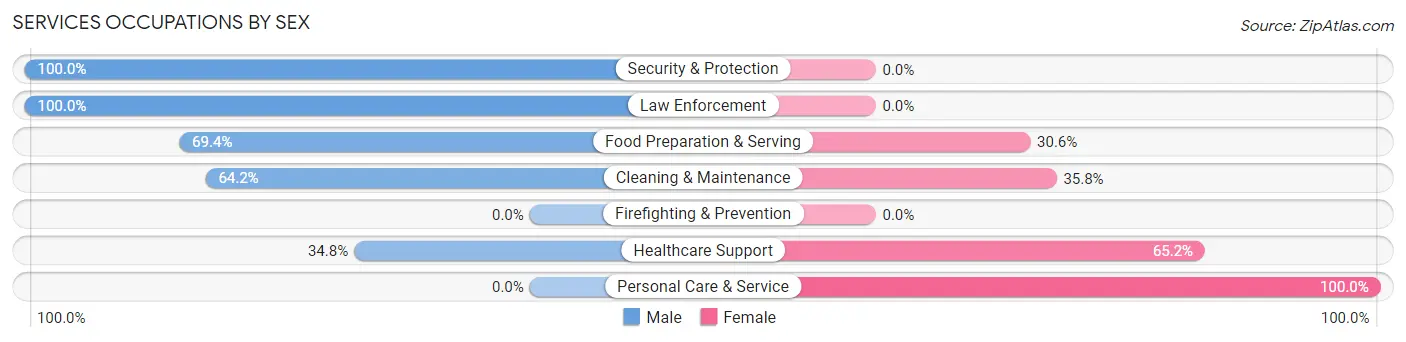
Services Occupations by Sex
Within the Services occupations in Bay City, the most male-oriented occupations are Security & Protection (100.0%), Law Enforcement (100.0%), and Food Preparation & Serving (69.4%), while the most female-oriented occupations are Personal Care & Service (100.0%), Healthcare Support (65.2%), and Cleaning & Maintenance (35.8%).
| Occupation | Male | Female |
| Healthcare Support | 8 (34.8%) | 15 (65.2%) |
| Security & Protection | 13 (100.0%) | 0 (0.0%) |
| Firefighting & Prevention | 0 (0.0%) | 0 (0.0%) |
| Law Enforcement | 13 (100.0%) | 0 (0.0%) |
| Food Preparation & Serving | 34 (69.4%) | 15 (30.6%) |
| Cleaning & Maintenance | 43 (64.2%) | 24 (35.8%) |
| Personal Care & Service | 0 (0.0%) | 4 (100.0%) |
| Total (Category) | 98 (62.8%) | 58 (37.2%) |
| Total (Overall) | 475 (50.0%) | 474 (49.9%) |
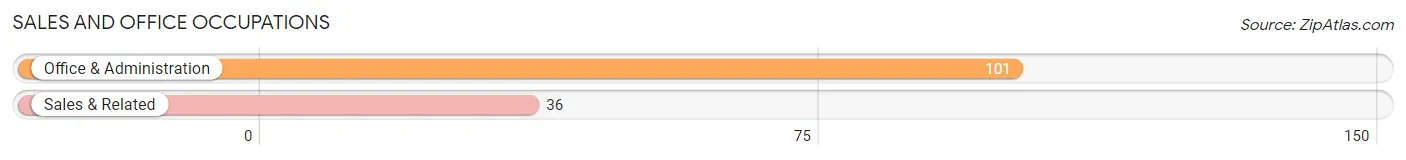
Sales and Office Occupations
The most common Sales and Office occupations in Bay City are Office & Administration (101 | 10.6%), and Sales & Related (36 | 3.8%).
Sales and Office Occupations by Sex
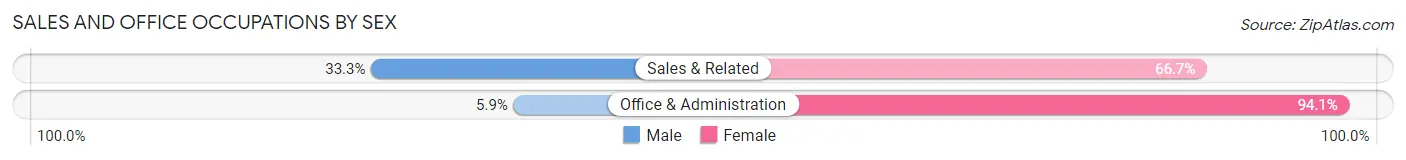
| Occupation | Male | Female |
| Sales & Related | 12 (33.3%) | 24 (66.7%) |
| Office & Administration | 6 (5.9%) | 95 (94.1%) |
| Total (Category) | 18 (13.1%) | 119 (86.9%) |
| Total (Overall) | 475 (50.0%) | 474 (49.9%) |
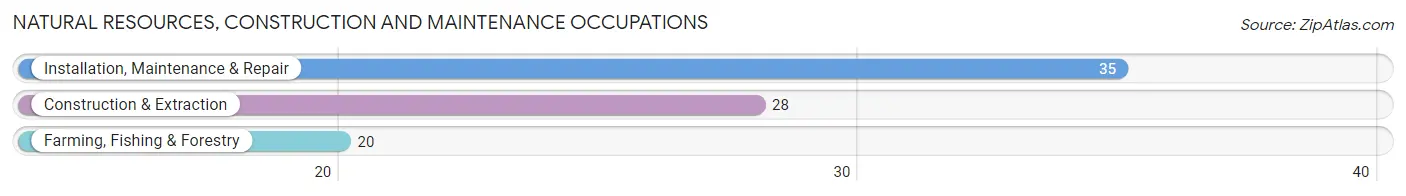
Natural Resources, Construction and Maintenance Occupations
The most common Natural Resources, Construction and Maintenance occupations in Bay City are Installation, Maintenance & Repair (35 | 3.7%), Construction & Extraction (28 | 2.9%), and Farming, Fishing & Forestry (20 | 2.1%).
Natural Resources, Construction and Maintenance Occupations by Sex
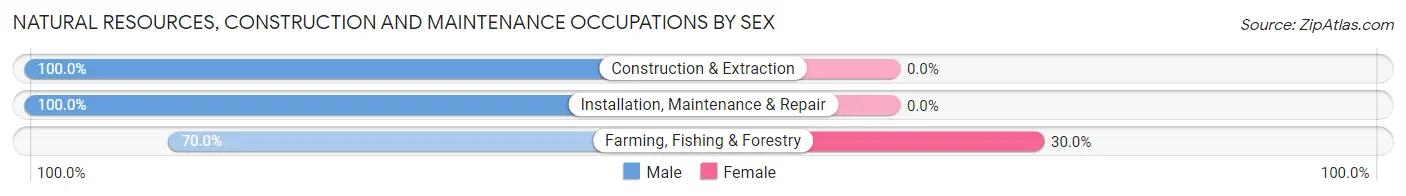
| Occupation | Male | Female |
| Farming, Fishing & Forestry | 14 (70.0%) | 6 (30.0%) |
| Construction & Extraction | 28 (100.0%) | 0 (0.0%) |
| Installation, Maintenance & Repair | 35 (100.0%) | 0 (0.0%) |
| Total (Category) | 77 (92.8%) | 6 (7.2%) |
| Total (Overall) | 475 (50.0%) | 474 (49.9%) |
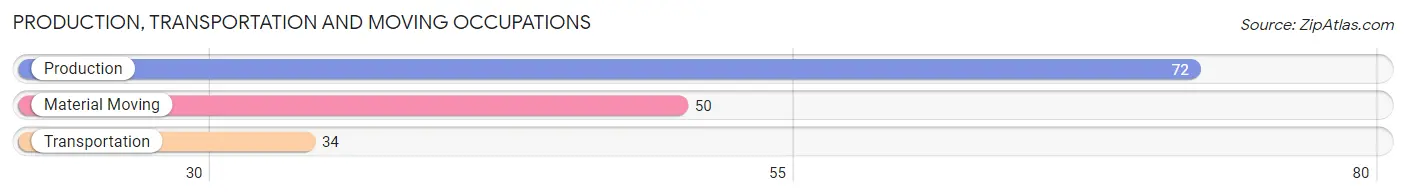
Production, Transportation and Moving Occupations
The most common Production, Transportation and Moving occupations in Bay City are Production (72 | 7.6%), Material Moving (50 | 5.3%), and Transportation (34 | 3.6%).
Production, Transportation and Moving Occupations by Sex

| Occupation | Male | Female |
| Production | 48 (66.7%) | 24 (33.3%) |
| Transportation | 28 (82.4%) | 6 (17.6%) |
| Material Moving | 22 (44.0%) | 28 (56.0%) |
| Total (Category) | 98 (62.8%) | 58 (37.2%) |
| Total (Overall) | 475 (50.0%) | 474 (49.9%) |
Employment Industries by Sex in Bay City
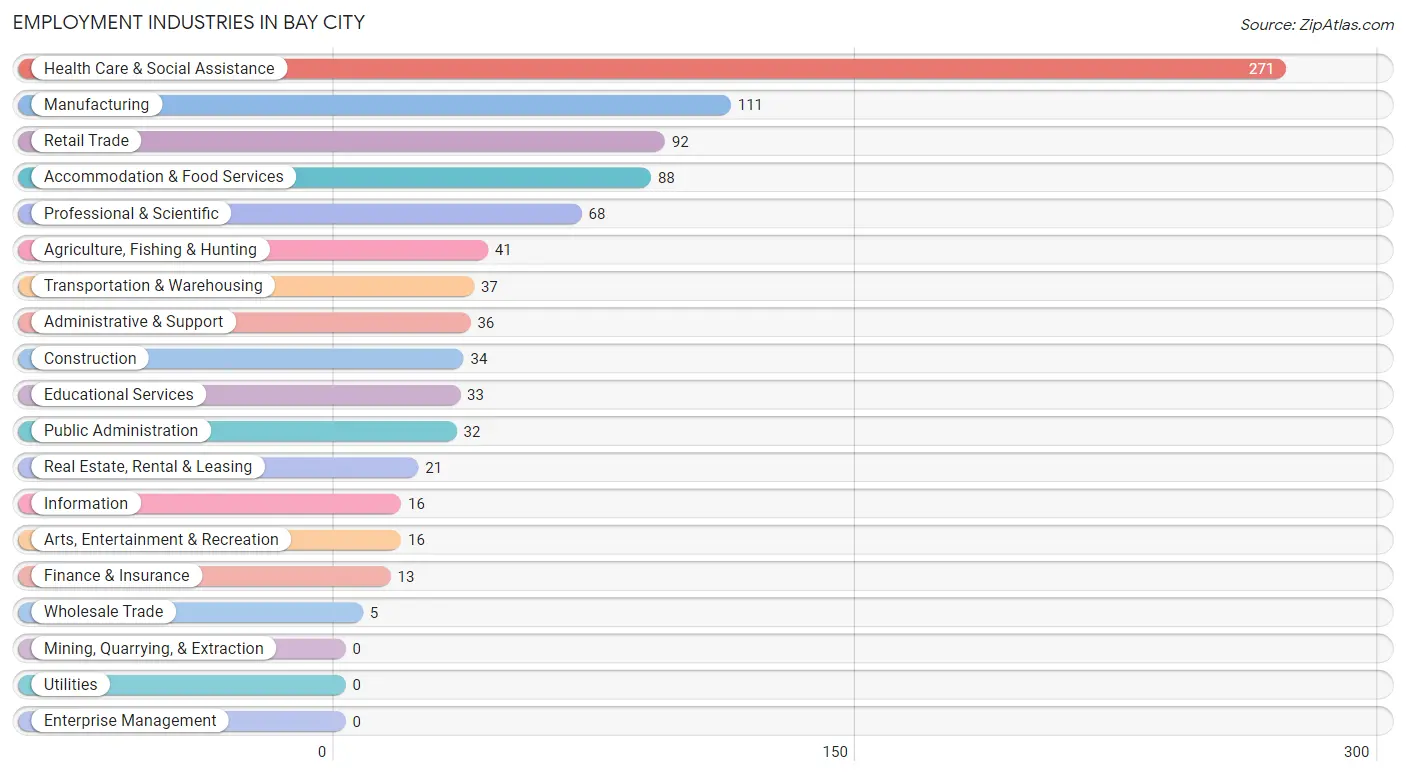
Employment Industries in Bay City
The major employment industries in Bay City include Health Care & Social Assistance (271 | 28.6%), Manufacturing (111 | 11.7%), Retail Trade (92 | 9.7%), Accommodation & Food Services (88 | 9.3%), and Professional & Scientific (68 | 7.2%).
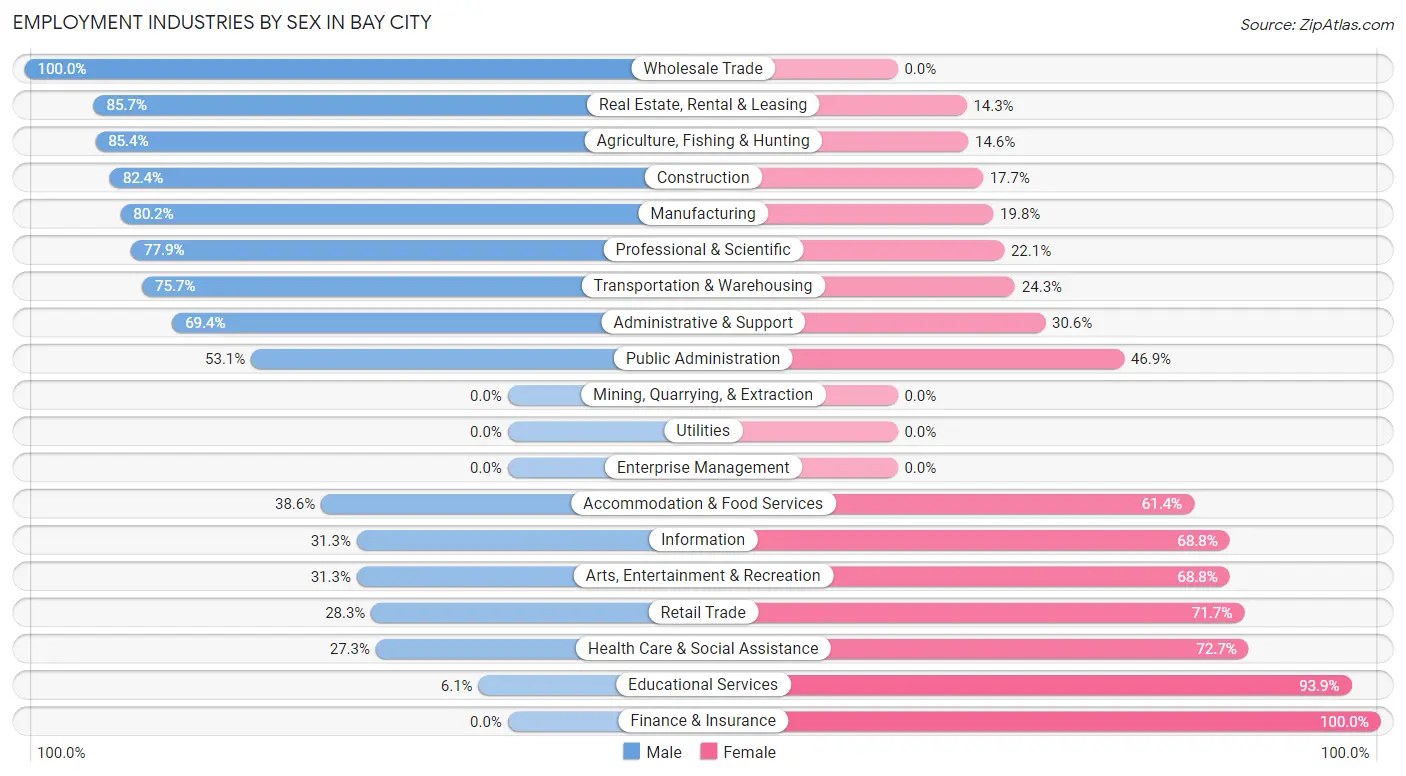
Employment Industries by Sex in Bay City
The Bay City industries that see more men than women are Wholesale Trade (100.0%), Real Estate, Rental & Leasing (85.7%), and Agriculture, Fishing & Hunting (85.4%), whereas the industries that tend to have a higher number of women are Finance & Insurance (100.0%), Educational Services (93.9%), and Health Care & Social Assistance (72.7%).
| Industry | Male | Female |
| Agriculture, Fishing & Hunting | 35 (85.4%) | 6 (14.6%) |
| Mining, Quarrying, & Extraction | 0 (0.0%) | 0 (0.0%) |
| Construction | 28 (82.4%) | 6 (17.6%) |
| Manufacturing | 89 (80.2%) | 22 (19.8%) |
| Wholesale Trade | 5 (100.0%) | 0 (0.0%) |
| Retail Trade | 26 (28.3%) | 66 (71.7%) |
| Transportation & Warehousing | 28 (75.7%) | 9 (24.3%) |
| Utilities | 0 (0.0%) | 0 (0.0%) |
| Information | 5 (31.2%) | 11 (68.8%) |
| Finance & Insurance | 0 (0.0%) | 13 (100.0%) |
| Real Estate, Rental & Leasing | 18 (85.7%) | 3 (14.3%) |
| Professional & Scientific | 53 (77.9%) | 15 (22.1%) |
| Enterprise Management | 0 (0.0%) | 0 (0.0%) |
| Administrative & Support | 25 (69.4%) | 11 (30.6%) |
| Educational Services | 2 (6.1%) | 31 (93.9%) |
| Health Care & Social Assistance | 74 (27.3%) | 197 (72.7%) |
| Arts, Entertainment & Recreation | 5 (31.2%) | 11 (68.8%) |
| Accommodation & Food Services | 34 (38.6%) | 54 (61.4%) |
| Public Administration | 17 (53.1%) | 15 (46.9%) |
| Total | 475 (50.0%) | 474 (49.9%) |
Education in Bay City
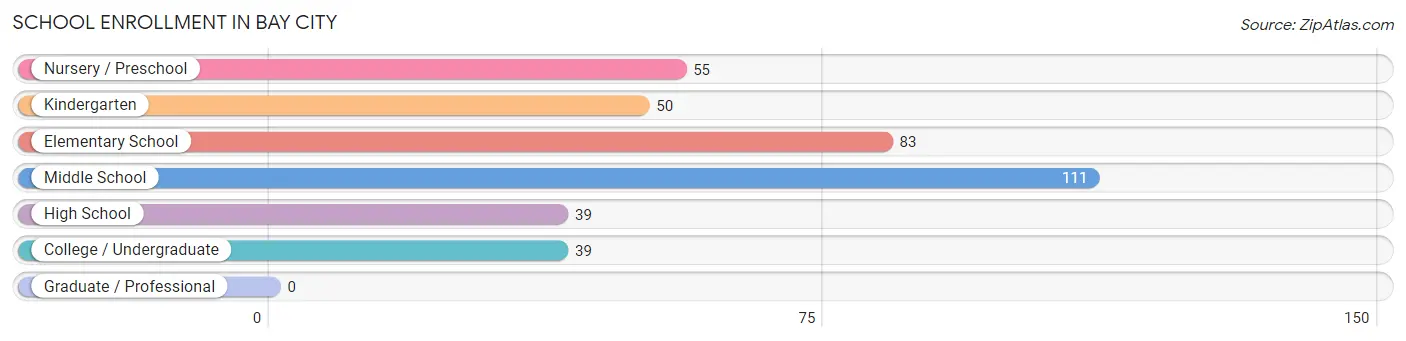
School Enrollment in Bay City
The most common levels of schooling among the 377 students in Bay City are middle school (111 | 29.4%), elementary school (83 | 22.0%), and nursery / preschool (55 | 14.6%).
| School Level | # Students | % Students |
| Nursery / Preschool | 55 | 14.6% |
| Kindergarten | 50 | 13.3% |
| Elementary School | 83 | 22.0% |
| Middle School | 111 | 29.4% |
| High School | 39 | 10.3% |
| College / Undergraduate | 39 | 10.3% |
| Graduate / Professional | 0 | 0.0% |
| Total | 377 | 100.0% |
School Enrollment by Age by Funding Source in Bay City
Out of a total of 377 students who are enrolled in schools in Bay City, 97 (25.7%) attend a private institution, while the remaining 280 (74.3%) are enrolled in public schools. The age group of 5 to 9 year old has the highest likelihood of being enrolled in private schools, with 73 (48.7% in the age bracket) enrolled. Conversely, the age group of 15 to 17 year olds has the lowest likelihood of being enrolled in a private school, with 35 (100.0% in the age bracket) attending a public institution.
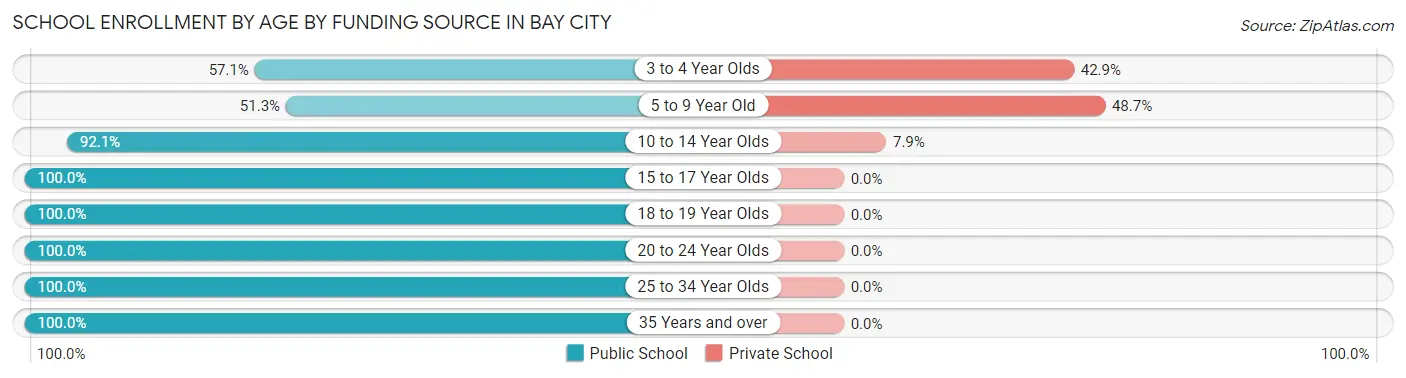
| Age Bracket | Public School | Private School |
| 3 to 4 Year Olds | 20 (57.1%) | 15 (42.9%) |
| 5 to 9 Year Old | 77 (51.3%) | 73 (48.7%) |
| 10 to 14 Year Olds | 105 (92.1%) | 9 (7.9%) |
| 15 to 17 Year Olds | 35 (100.0%) | 0 (0.0%) |
| 18 to 19 Year Olds | 8 (100.0%) | 0 (0.0%) |
| 20 to 24 Year Olds | 24 (100.0%) | 0 (0.0%) |
| 25 to 34 Year Olds | 4 (100.0%) | 0 (0.0%) |
| 35 Years and over | 7 (100.0%) | 0 (0.0%) |
| Total | 280 (74.3%) | 97 (25.7%) |
Educational Attainment by Field of Study in Bay City
Science & technology (111 | 25.3%), engineering (54 | 12.3%), education (50 | 11.4%), social sciences (47 | 10.7%), and liberal arts & history (40 | 9.1%) are the most common fields of study among 439 individuals in Bay City who have obtained a bachelor's degree or higher.
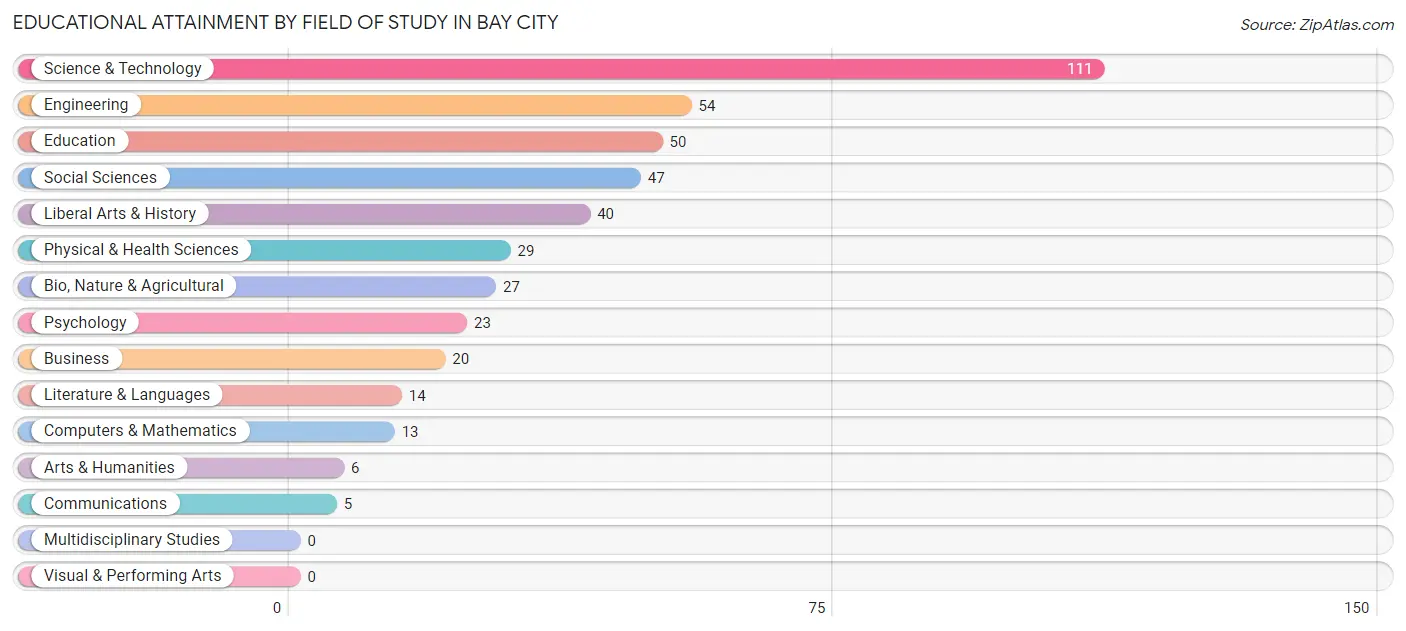
| Field of Study | # Graduates | % Graduates |
| Computers & Mathematics | 13 | 3.0% |
| Bio, Nature & Agricultural | 27 | 6.1% |
| Physical & Health Sciences | 29 | 6.6% |
| Psychology | 23 | 5.2% |
| Social Sciences | 47 | 10.7% |
| Engineering | 54 | 12.3% |
| Multidisciplinary Studies | 0 | 0.0% |
| Science & Technology | 111 | 25.3% |
| Business | 20 | 4.6% |
| Education | 50 | 11.4% |
| Literature & Languages | 14 | 3.2% |
| Liberal Arts & History | 40 | 9.1% |
| Visual & Performing Arts | 0 | 0.0% |
| Communications | 5 | 1.1% |
| Arts & Humanities | 6 | 1.4% |
| Total | 439 | 100.0% |
Transportation & Commute in Bay City
Vehicle Availability by Sex in Bay City
The most prevalent vehicle ownership categories in Bay City are males with 2 vehicles (247, accounting for 52.0%) and females with 2 vehicles (211, making up 52.8%).
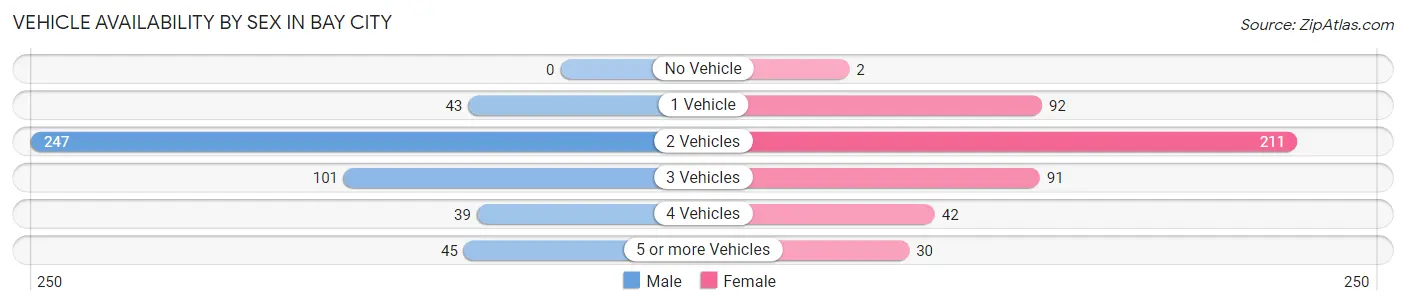
| Vehicles Available | Male | Female |
| No Vehicle | 0 (0.0%) | 2 (0.4%) |
| 1 Vehicle | 43 (9.0%) | 92 (19.7%) |
| 2 Vehicles | 247 (52.0%) | 211 (45.1%) |
| 3 Vehicles | 101 (21.3%) | 91 (19.4%) |
| 4 Vehicles | 39 (8.2%) | 42 (9.0%) |
| 5 or more Vehicles | 45 (9.5%) | 30 (6.4%) |
| Total | 475 (100.0%) | 468 (100.0%) |
Commute Time in Bay City
The most frequently occuring commute durations in Bay City are 10 to 14 minutes (240 commuters, 28.3%), 15 to 19 minutes (169 commuters, 20.0%), and 5 to 9 minutes (135 commuters, 15.9%).
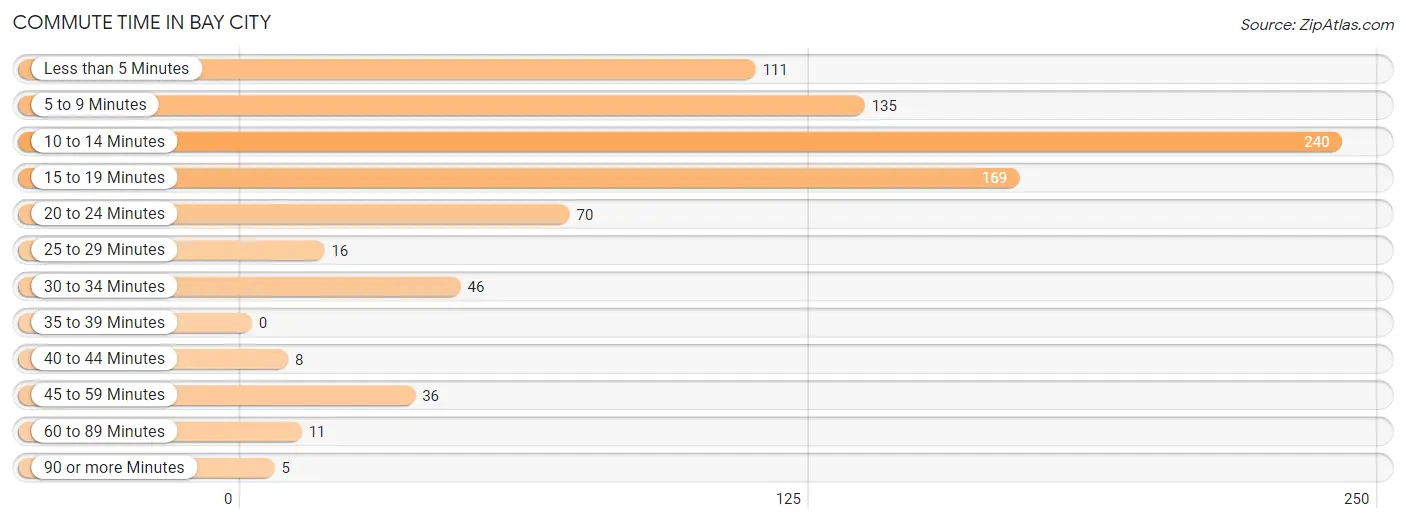
| Commute Time | # Commuters | % Commuters |
| Less than 5 Minutes | 111 | 13.1% |
| 5 to 9 Minutes | 135 | 15.9% |
| 10 to 14 Minutes | 240 | 28.3% |
| 15 to 19 Minutes | 169 | 20.0% |
| 20 to 24 Minutes | 70 | 8.3% |
| 25 to 29 Minutes | 16 | 1.9% |
| 30 to 34 Minutes | 46 | 5.4% |
| 35 to 39 Minutes | 0 | 0.0% |
| 40 to 44 Minutes | 8 | 0.9% |
| 45 to 59 Minutes | 36 | 4.3% |
| 60 to 89 Minutes | 11 | 1.3% |
| 90 or more Minutes | 5 | 0.6% |
Commute Time by Sex in Bay City
The most common commute times in Bay City are 10 to 14 minutes (107 commuters, 26.8%) for males and 10 to 14 minutes (133 commuters, 29.7%) for females.
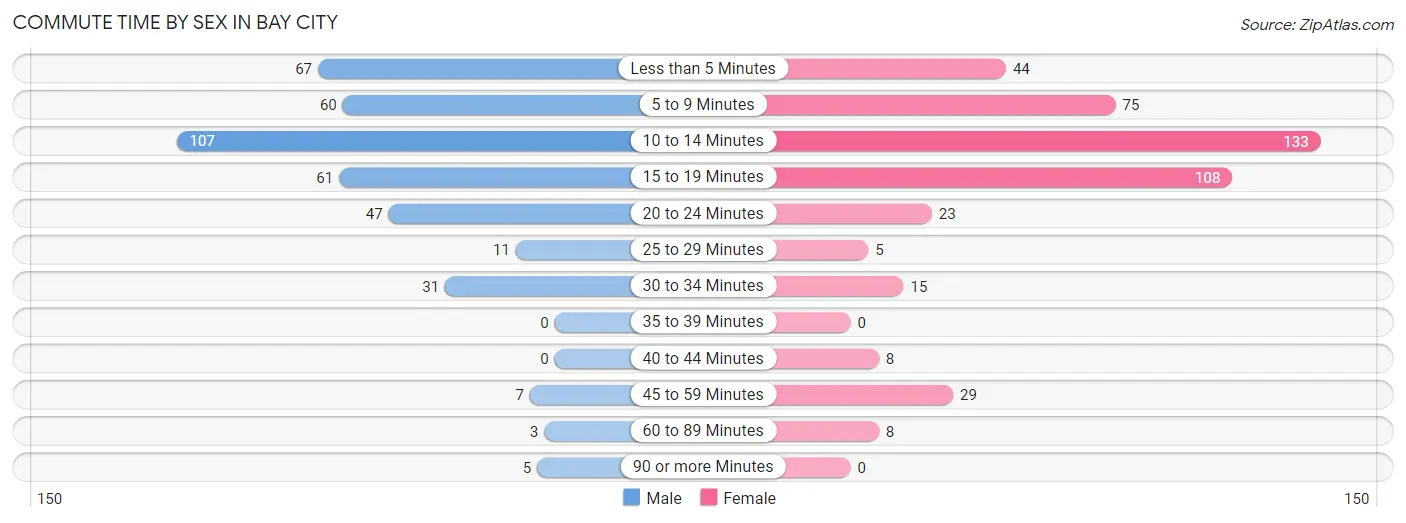
| Commute Time | Male | Female |
| Less than 5 Minutes | 67 (16.8%) | 44 (9.8%) |
| 5 to 9 Minutes | 60 (15.0%) | 75 (16.7%) |
| 10 to 14 Minutes | 107 (26.8%) | 133 (29.7%) |
| 15 to 19 Minutes | 61 (15.3%) | 108 (24.1%) |
| 20 to 24 Minutes | 47 (11.8%) | 23 (5.1%) |
| 25 to 29 Minutes | 11 (2.8%) | 5 (1.1%) |
| 30 to 34 Minutes | 31 (7.8%) | 15 (3.4%) |
| 35 to 39 Minutes | 0 (0.0%) | 0 (0.0%) |
| 40 to 44 Minutes | 0 (0.0%) | 8 (1.8%) |
| 45 to 59 Minutes | 7 (1.8%) | 29 (6.5%) |
| 60 to 89 Minutes | 3 (0.7%) | 8 (1.8%) |
| 90 or more Minutes | 5 (1.3%) | 0 (0.0%) |
Time of Departure to Work by Sex in Bay City
The most frequent times of departure to work in Bay City are 7:00 AM to 7:29 AM (63, 15.8%) for males and 7:30 AM to 7:59 AM (88, 19.6%) for females.
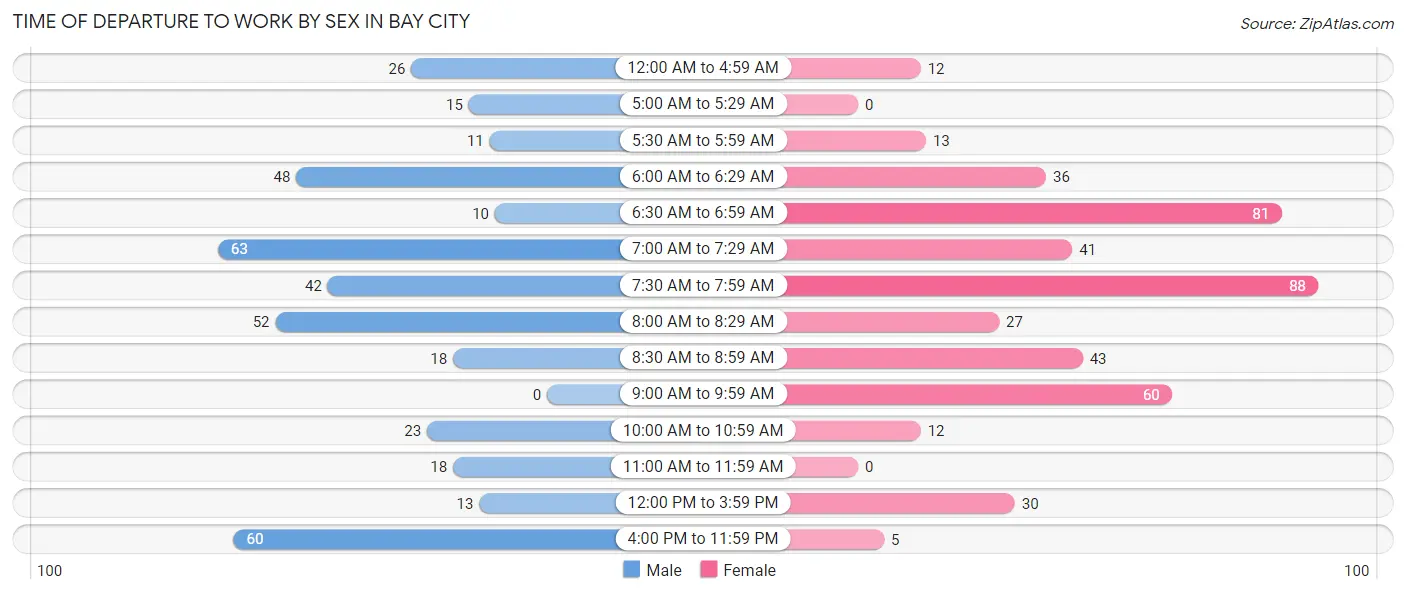
| Time of Departure | Male | Female |
| 12:00 AM to 4:59 AM | 26 (6.5%) | 12 (2.7%) |
| 5:00 AM to 5:29 AM | 15 (3.8%) | 0 (0.0%) |
| 5:30 AM to 5:59 AM | 11 (2.8%) | 13 (2.9%) |
| 6:00 AM to 6:29 AM | 48 (12.0%) | 36 (8.0%) |
| 6:30 AM to 6:59 AM | 10 (2.5%) | 81 (18.1%) |
| 7:00 AM to 7:29 AM | 63 (15.8%) | 41 (9.1%) |
| 7:30 AM to 7:59 AM | 42 (10.5%) | 88 (19.6%) |
| 8:00 AM to 8:29 AM | 52 (13.0%) | 27 (6.0%) |
| 8:30 AM to 8:59 AM | 18 (4.5%) | 43 (9.6%) |
| 9:00 AM to 9:59 AM | 0 (0.0%) | 60 (13.4%) |
| 10:00 AM to 10:59 AM | 23 (5.8%) | 12 (2.7%) |
| 11:00 AM to 11:59 AM | 18 (4.5%) | 0 (0.0%) |
| 12:00 PM to 3:59 PM | 13 (3.3%) | 30 (6.7%) |
| 4:00 PM to 11:59 PM | 60 (15.0%) | 5 (1.1%) |
| Total | 399 (100.0%) | 448 (100.0%) |
Housing Occupancy in Bay City
Occupancy by Ownership in Bay City
Of the total 904 dwellings in Bay City, owner-occupied units account for 689 (76.2%), while renter-occupied units make up 215 (23.8%).
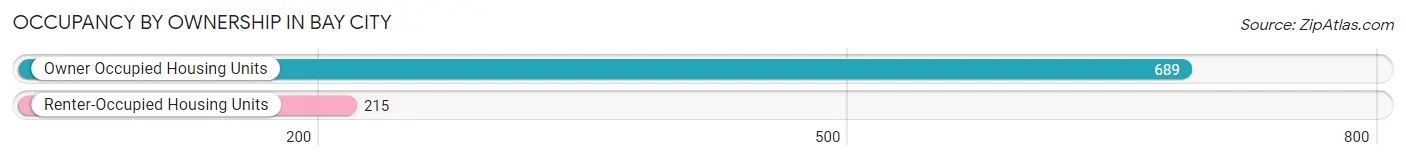
| Occupancy | # Housing Units | % Housing Units |
| Owner Occupied Housing Units | 689 | 76.2% |
| Renter-Occupied Housing Units | 215 | 23.8% |
| Total Occupied Housing Units | 904 | 100.0% |
Occupancy by Household Size in Bay City
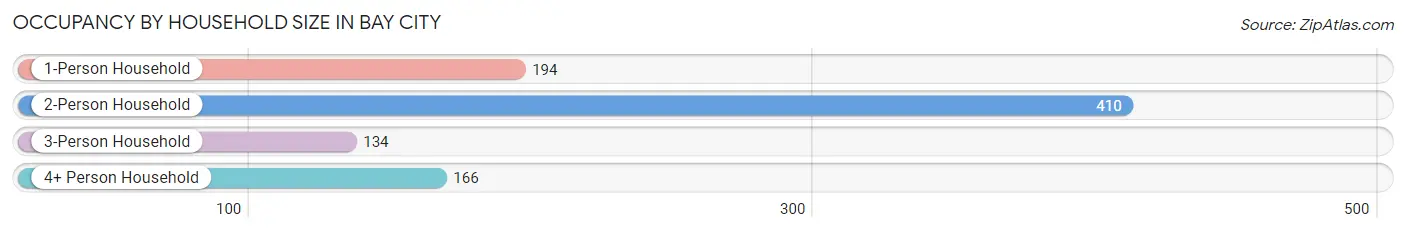
| Household Size | # Housing Units | % Housing Units |
| 1-Person Household | 194 | 21.5% |
| 2-Person Household | 410 | 45.4% |
| 3-Person Household | 134 | 14.8% |
| 4+ Person Household | 166 | 18.4% |
| Total Housing Units | 904 | 100.0% |
Occupancy by Ownership by Household Size in Bay City
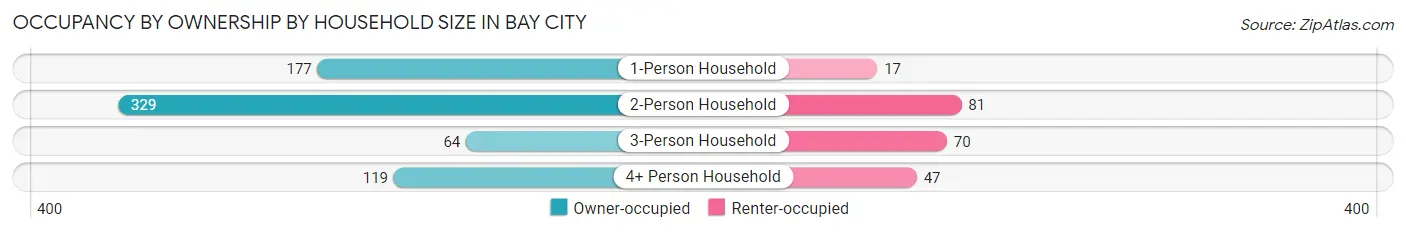
| Household Size | Owner-occupied | Renter-occupied |
| 1-Person Household | 177 (91.2%) | 17 (8.8%) |
| 2-Person Household | 329 (80.2%) | 81 (19.8%) |
| 3-Person Household | 64 (47.8%) | 70 (52.2%) |
| 4+ Person Household | 119 (71.7%) | 47 (28.3%) |
| Total Housing Units | 689 (76.2%) | 215 (23.8%) |
Occupancy by Educational Attainment in Bay City
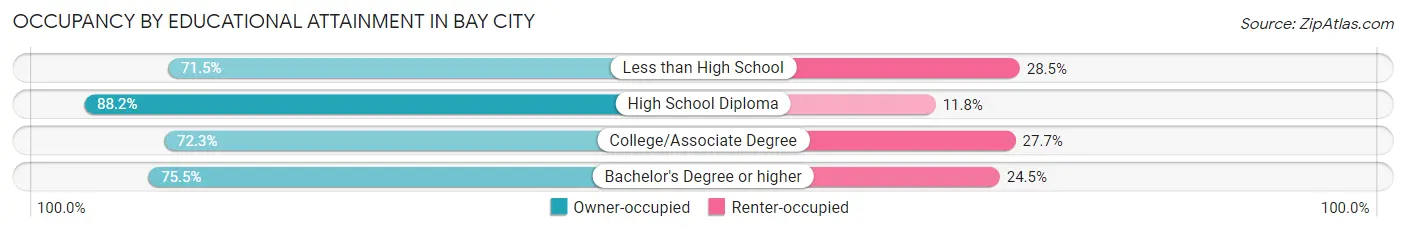
| Household Size | Owner-occupied | Renter-occupied |
| Less than High School | 103 (71.5%) | 41 (28.5%) |
| High School Diploma | 157 (88.2%) | 21 (11.8%) |
| College/Associate Degree | 238 (72.3%) | 91 (27.7%) |
| Bachelor's Degree or higher | 191 (75.5%) | 62 (24.5%) |
Occupancy by Age of Householder in Bay City
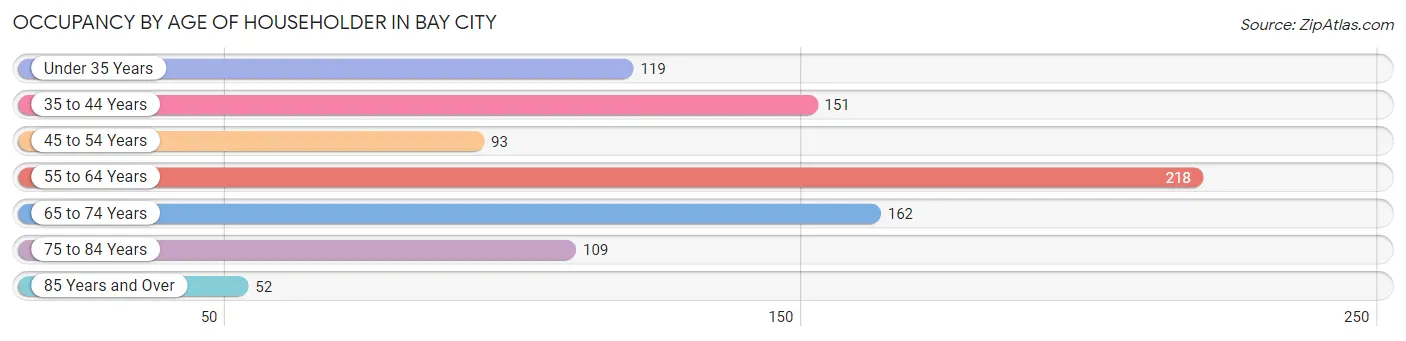
| Age Bracket | # Households | % Households |
| Under 35 Years | 119 | 13.2% |
| 35 to 44 Years | 151 | 16.7% |
| 45 to 54 Years | 93 | 10.3% |
| 55 to 64 Years | 218 | 24.1% |
| 65 to 74 Years | 162 | 17.9% |
| 75 to 84 Years | 109 | 12.1% |
| 85 Years and Over | 52 | 5.8% |
| Total | 904 | 100.0% |
Housing Finances in Bay City
Median Income by Occupancy in Bay City
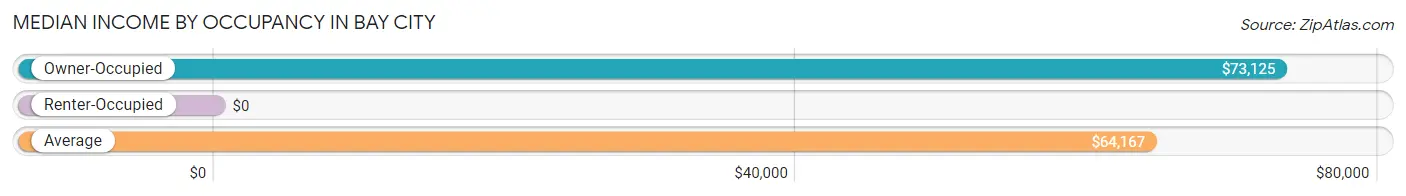
| Occupancy Type | # Households | Median Income |
| Owner-Occupied | 689 (76.2%) | $73,125 |
| Renter-Occupied | 215 (23.8%) | $0 |
| Average | 904 (100.0%) | $64,167 |
Occupancy by Householder Income Bracket in Bay City
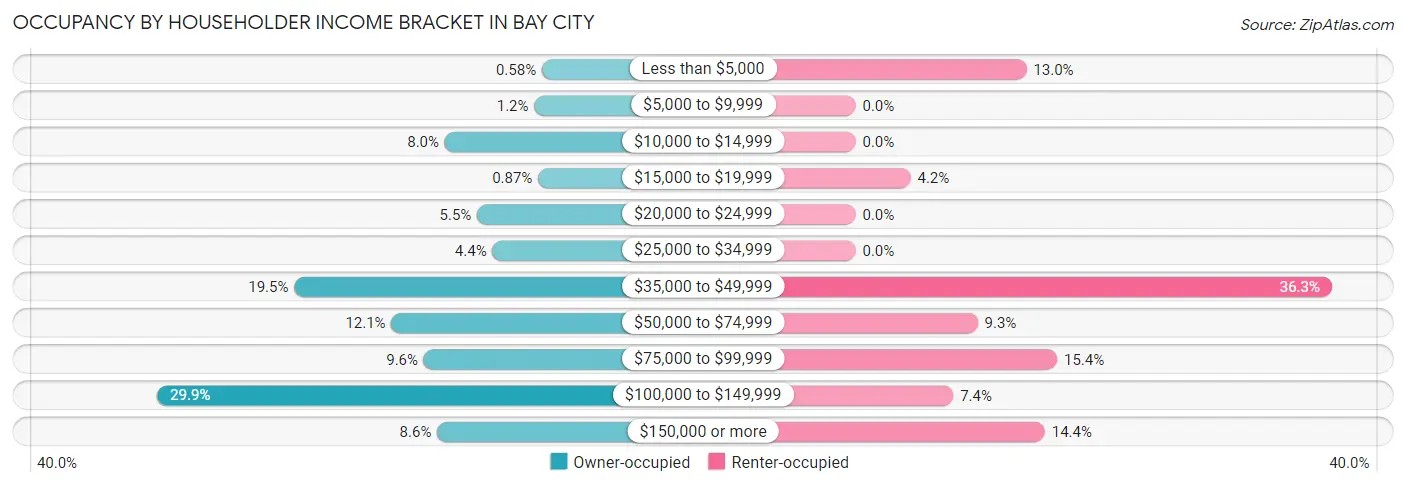
| Income Bracket | Owner-occupied | Renter-occupied |
| Less than $5,000 | 4 (0.6%) | 28 (13.0%) |
| $5,000 to $9,999 | 8 (1.2%) | 0 (0.0%) |
| $10,000 to $14,999 | 55 (8.0%) | 0 (0.0%) |
| $15,000 to $19,999 | 6 (0.9%) | 9 (4.2%) |
| $20,000 to $24,999 | 38 (5.5%) | 0 (0.0%) |
| $25,000 to $34,999 | 30 (4.3%) | 0 (0.0%) |
| $35,000 to $49,999 | 134 (19.5%) | 78 (36.3%) |
| $50,000 to $74,999 | 83 (12.0%) | 20 (9.3%) |
| $75,000 to $99,999 | 66 (9.6%) | 33 (15.3%) |
| $100,000 to $149,999 | 206 (29.9%) | 16 (7.4%) |
| $150,000 or more | 59 (8.6%) | 31 (14.4%) |
| Total | 689 (100.0%) | 215 (100.0%) |
Monthly Housing Cost Tiers in Bay City
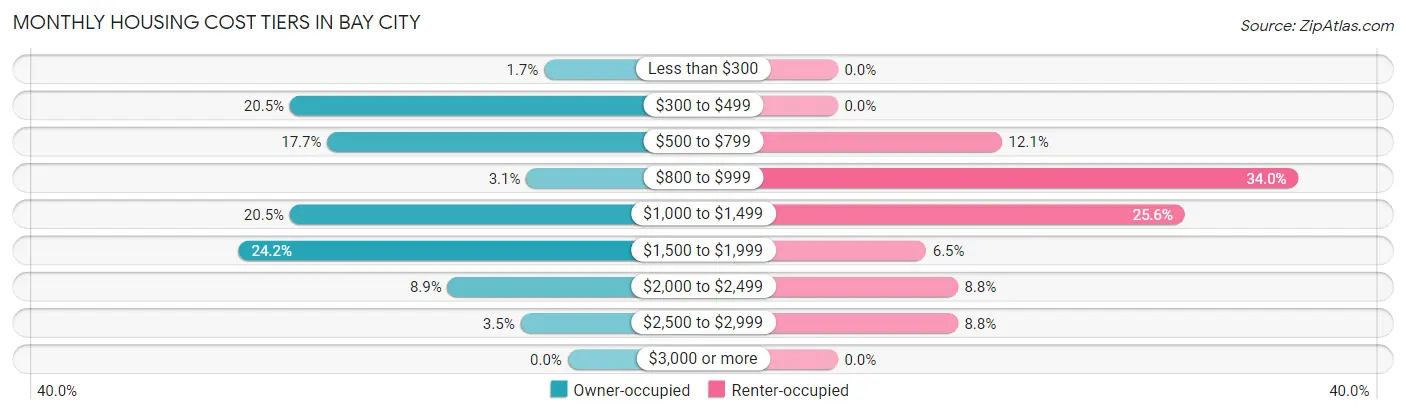
| Monthly Cost | Owner-occupied | Renter-occupied |
| Less than $300 | 12 (1.7%) | 0 (0.0%) |
| $300 to $499 | 141 (20.5%) | 0 (0.0%) |
| $500 to $799 | 122 (17.7%) | 26 (12.1%) |
| $800 to $999 | 21 (3.0%) | 73 (34.0%) |
| $1,000 to $1,499 | 141 (20.5%) | 55 (25.6%) |
| $1,500 to $1,999 | 167 (24.2%) | 14 (6.5%) |
| $2,000 to $2,499 | 61 (8.8%) | 19 (8.8%) |
| $2,500 to $2,999 | 24 (3.5%) | 19 (8.8%) |
| $3,000 or more | 0 (0.0%) | 0 (0.0%) |
| Total | 689 (100.0%) | 215 (100.0%) |
Physical Housing Characteristics in Bay City
Housing Structures in Bay City
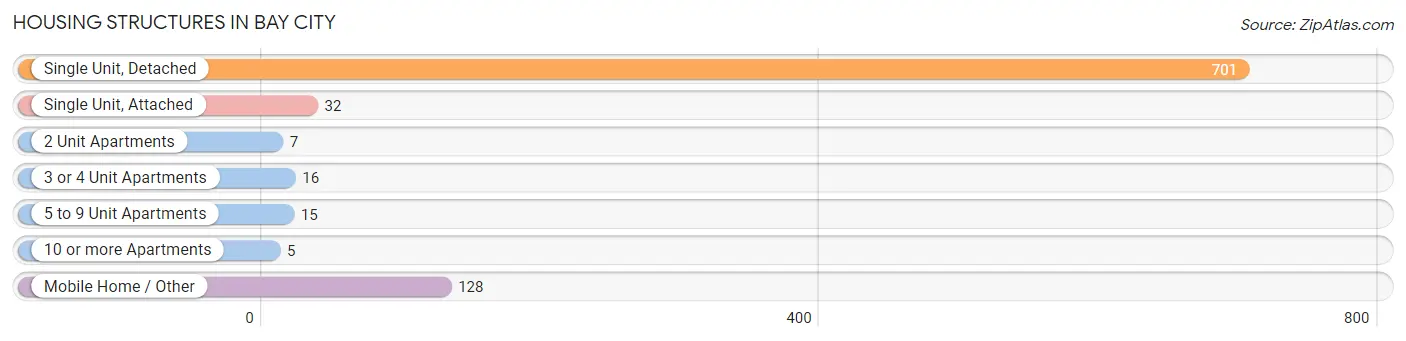
| Structure Type | # Housing Units | % Housing Units |
| Single Unit, Detached | 701 | 77.5% |
| Single Unit, Attached | 32 | 3.5% |
| 2 Unit Apartments | 7 | 0.8% |
| 3 or 4 Unit Apartments | 16 | 1.8% |
| 5 to 9 Unit Apartments | 15 | 1.7% |
| 10 or more Apartments | 5 | 0.5% |
| Mobile Home / Other | 128 | 14.2% |
| Total | 904 | 100.0% |
Housing Structures by Occupancy in Bay City
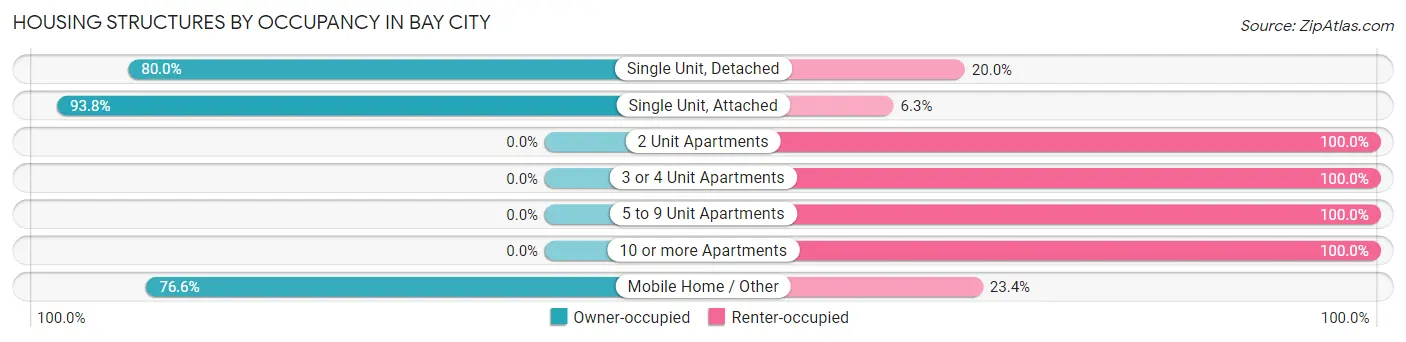
| Structure Type | Owner-occupied | Renter-occupied |
| Single Unit, Detached | 561 (80.0%) | 140 (20.0%) |
| Single Unit, Attached | 30 (93.8%) | 2 (6.2%) |
| 2 Unit Apartments | 0 (0.0%) | 7 (100.0%) |
| 3 or 4 Unit Apartments | 0 (0.0%) | 16 (100.0%) |
| 5 to 9 Unit Apartments | 0 (0.0%) | 15 (100.0%) |
| 10 or more Apartments | 0 (0.0%) | 5 (100.0%) |
| Mobile Home / Other | 98 (76.6%) | 30 (23.4%) |
| Total | 689 (76.2%) | 215 (23.8%) |
Housing Structures by Number of Rooms in Bay City
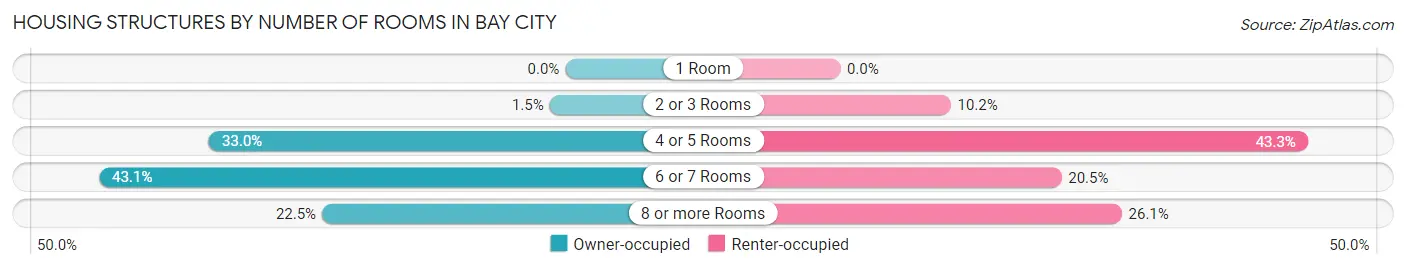
| Number of Rooms | Owner-occupied | Renter-occupied |
| 1 Room | 0 (0.0%) | 0 (0.0%) |
| 2 or 3 Rooms | 10 (1.5%) | 22 (10.2%) |
| 4 or 5 Rooms | 227 (33.0%) | 93 (43.3%) |
| 6 or 7 Rooms | 297 (43.1%) | 44 (20.5%) |
| 8 or more Rooms | 155 (22.5%) | 56 (26.1%) |
| Total | 689 (100.0%) | 215 (100.0%) |
Housing Structure by Heating Type in Bay City
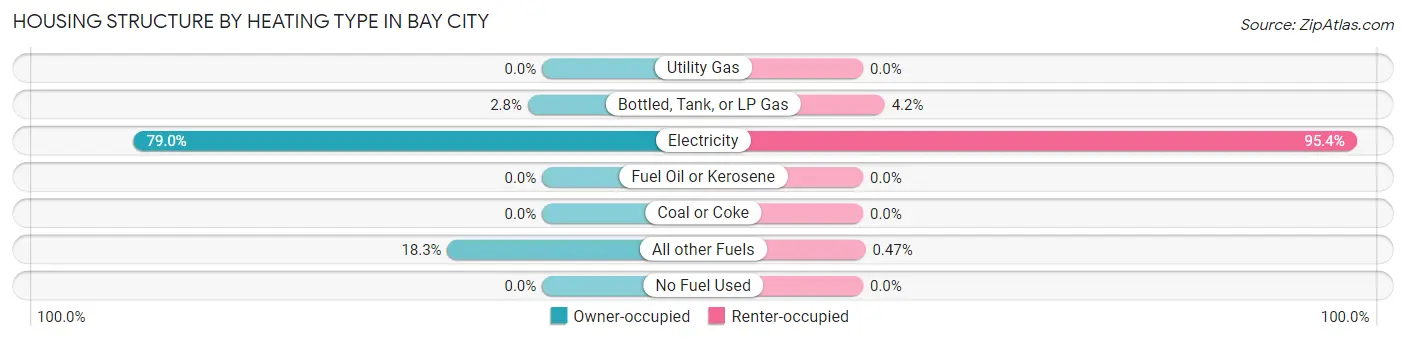
| Heating Type | Owner-occupied | Renter-occupied |
| Utility Gas | 0 (0.0%) | 0 (0.0%) |
| Bottled, Tank, or LP Gas | 19 (2.8%) | 9 (4.2%) |
| Electricity | 544 (79.0%) | 205 (95.4%) |
| Fuel Oil or Kerosene | 0 (0.0%) | 0 (0.0%) |
| Coal or Coke | 0 (0.0%) | 0 (0.0%) |
| All other Fuels | 126 (18.3%) | 1 (0.5%) |
| No Fuel Used | 0 (0.0%) | 0 (0.0%) |
| Total | 689 (100.0%) | 215 (100.0%) |
Household Vehicle Usage in Bay City
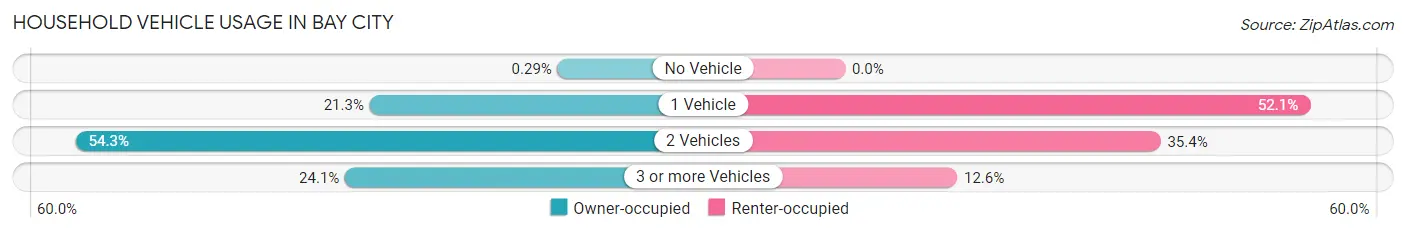
| Vehicles per Household | Owner-occupied | Renter-occupied |
| No Vehicle | 2 (0.3%) | 0 (0.0%) |
| 1 Vehicle | 147 (21.3%) | 112 (52.1%) |
| 2 Vehicles | 374 (54.3%) | 76 (35.3%) |
| 3 or more Vehicles | 166 (24.1%) | 27 (12.6%) |
| Total | 689 (100.0%) | 215 (100.0%) |
Real Estate & Mortgages in Bay City
Real Estate and Mortgage Overview in Bay City
| Characteristic | Without Mortgage | With Mortgage |
| Housing Units | 239 | 450 |
| Median Property Value | $322,500 | $308,900 |
| Median Household Income | $71,875 | $50 |
| Monthly Housing Costs | $466 | $0 |
| Real Estate Taxes | $2,010 | $0 |
Property Value by Mortgage Status in Bay City
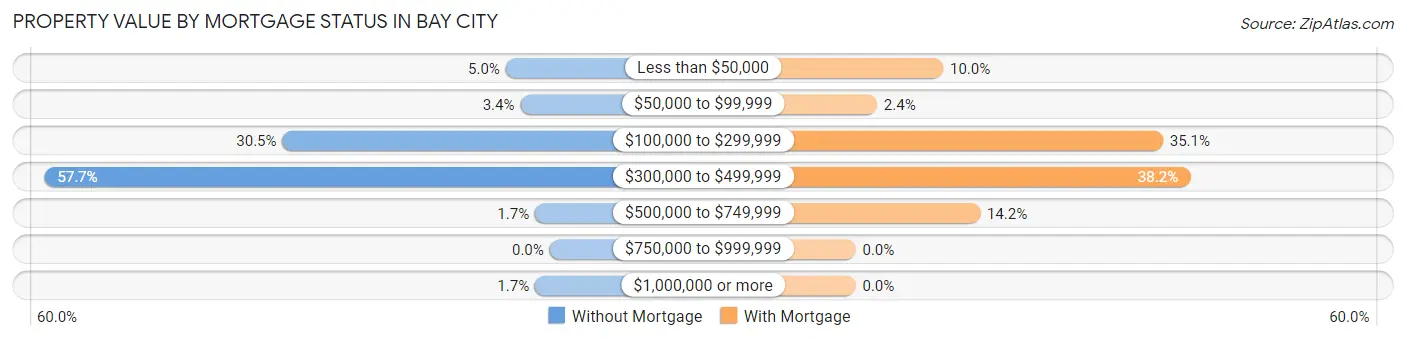
| Property Value | Without Mortgage | With Mortgage |
| Less than $50,000 | 12 (5.0%) | 45 (10.0%) |
| $50,000 to $99,999 | 8 (3.4%) | 11 (2.4%) |
| $100,000 to $299,999 | 73 (30.5%) | 158 (35.1%) |
| $300,000 to $499,999 | 138 (57.7%) | 172 (38.2%) |
| $500,000 to $749,999 | 4 (1.7%) | 64 (14.2%) |
| $750,000 to $999,999 | 0 (0.0%) | 0 (0.0%) |
| $1,000,000 or more | 4 (1.7%) | 0 (0.0%) |
| Total | 239 (100.0%) | 450 (100.0%) |
Household Income by Mortgage Status in Bay City
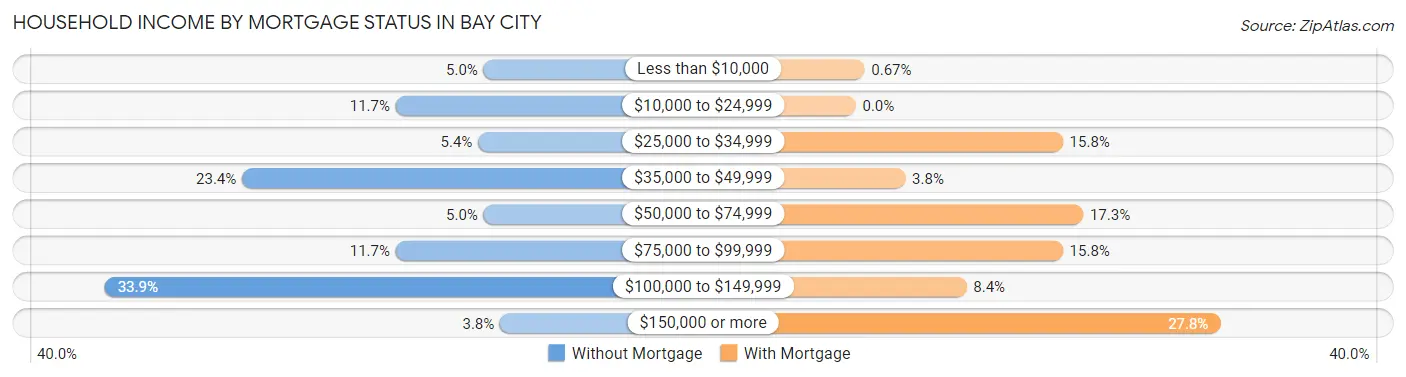
| Household Income | Without Mortgage | With Mortgage |
| Less than $10,000 | 12 (5.0%) | 3 (0.7%) |
| $10,000 to $24,999 | 28 (11.7%) | 0 (0.0%) |
| $25,000 to $34,999 | 13 (5.4%) | 71 (15.8%) |
| $35,000 to $49,999 | 56 (23.4%) | 17 (3.8%) |
| $50,000 to $74,999 | 12 (5.0%) | 78 (17.3%) |
| $75,000 to $99,999 | 28 (11.7%) | 71 (15.8%) |
| $100,000 to $149,999 | 81 (33.9%) | 38 (8.4%) |
| $150,000 or more | 9 (3.8%) | 125 (27.8%) |
| Total | 239 (100.0%) | 450 (100.0%) |
Property Value to Household Income Ratio in Bay City
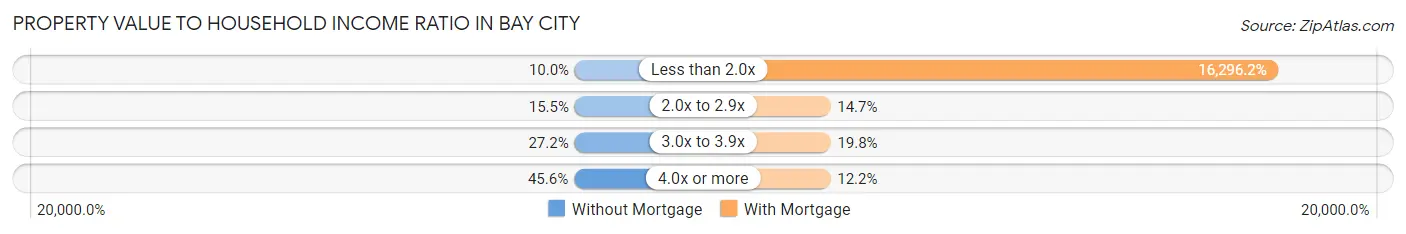
| Value-to-Income Ratio | Without Mortgage | With Mortgage |
| Less than 2.0x | 24 (10.0%) | 73,333 (16,296.2%) |
| 2.0x to 2.9x | 37 (15.5%) | 66 (14.7%) |
| 3.0x to 3.9x | 65 (27.2%) | 89 (19.8%) |
| 4.0x or more | 109 (45.6%) | 55 (12.2%) |
| Total | 239 (100.0%) | 450 (100.0%) |
Real Estate Taxes by Mortgage Status in Bay City
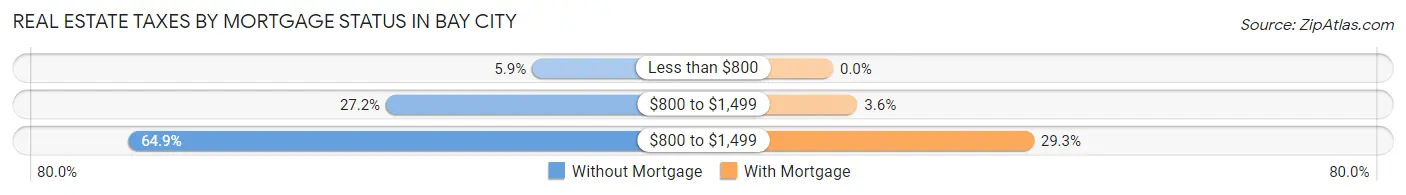
| Property Taxes | Without Mortgage | With Mortgage |
| Less than $800 | 14 (5.9%) | 0 (0.0%) |
| $800 to $1,499 | 65 (27.2%) | 16 (3.6%) |
| $800 to $1,499 | 155 (64.8%) | 132 (29.3%) |
| Total | 239 (100.0%) | 450 (100.0%) |
Health & Disability in Bay City
Health Insurance Coverage by Age in Bay City
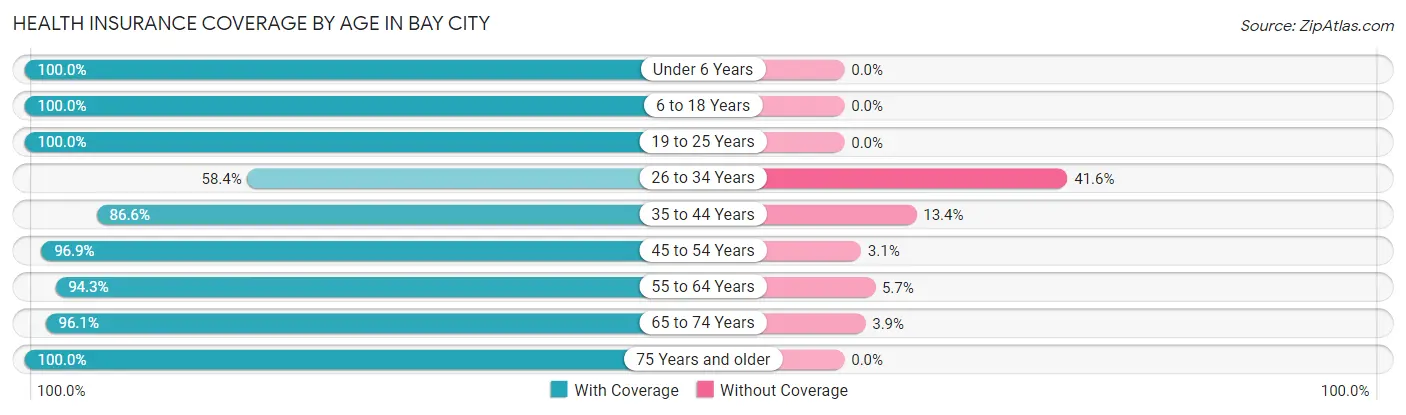
| Age Bracket | With Coverage | Without Coverage |
| Under 6 Years | 221 (100.0%) | 0 (0.0%) |
| 6 to 18 Years | 279 (100.0%) | 0 (0.0%) |
| 19 to 25 Years | 153 (100.0%) | 0 (0.0%) |
| 26 to 34 Years | 111 (58.4%) | 79 (41.6%) |
| 35 to 44 Years | 245 (86.6%) | 38 (13.4%) |
| 45 to 54 Years | 219 (96.9%) | 7 (3.1%) |
| 55 to 64 Years | 379 (94.3%) | 23 (5.7%) |
| 65 to 74 Years | 221 (96.1%) | 9 (3.9%) |
| 75 Years and older | 240 (100.0%) | 0 (0.0%) |
| Total | 2,068 (93.0%) | 156 (7.0%) |
Health Insurance Coverage by Citizenship Status in Bay City
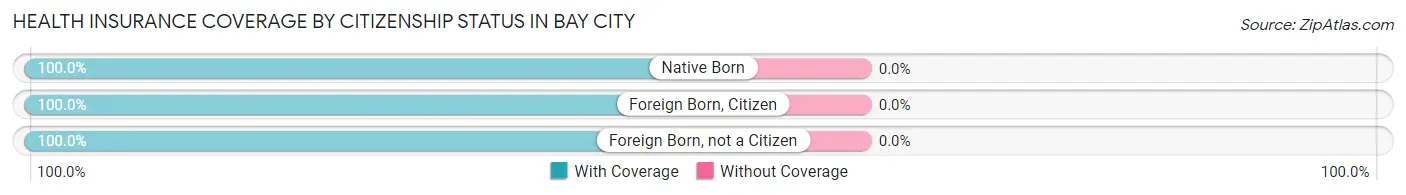
| Citizenship Status | With Coverage | Without Coverage |
| Native Born | 221 (100.0%) | 0 (0.0%) |
| Foreign Born, Citizen | 279 (100.0%) | 0 (0.0%) |
| Foreign Born, not a Citizen | 153 (100.0%) | 0 (0.0%) |
Health Insurance Coverage by Household Income in Bay City
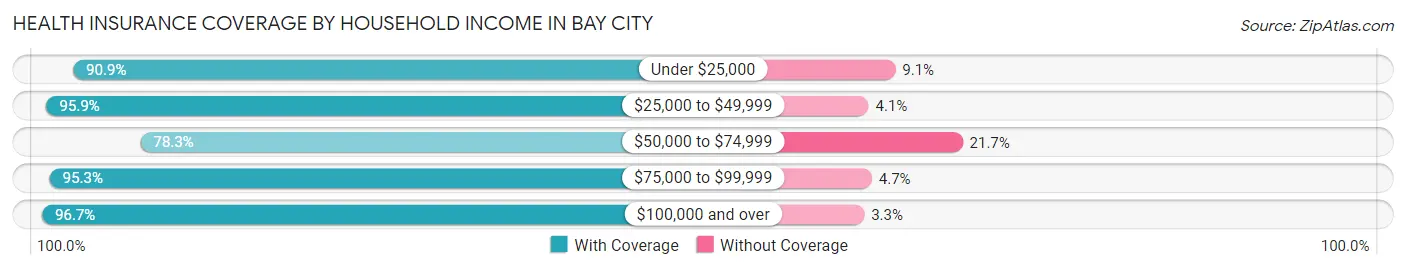
| Household Income | With Coverage | Without Coverage |
| Under $25,000 | 260 (90.9%) | 26 (9.1%) |
| $25,000 to $49,999 | 422 (95.9%) | 18 (4.1%) |
| $50,000 to $74,999 | 249 (78.3%) | 69 (21.7%) |
| $75,000 to $99,999 | 305 (95.3%) | 15 (4.7%) |
| $100,000 and over | 832 (96.7%) | 28 (3.3%) |
Public vs Private Health Insurance Coverage by Age in Bay City
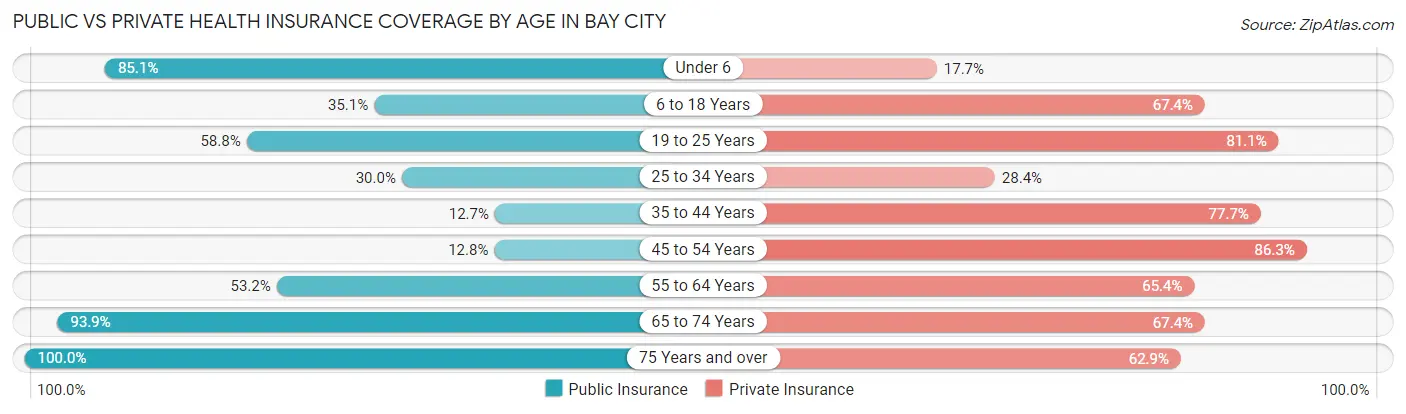
| Age Bracket | Public Insurance | Private Insurance |
| Under 6 | 188 (85.1%) | 39 (17.6%) |
| 6 to 18 Years | 98 (35.1%) | 188 (67.4%) |
| 19 to 25 Years | 90 (58.8%) | 124 (81.0%) |
| 25 to 34 Years | 57 (30.0%) | 54 (28.4%) |
| 35 to 44 Years | 36 (12.7%) | 220 (77.7%) |
| 45 to 54 Years | 29 (12.8%) | 195 (86.3%) |
| 55 to 64 Years | 214 (53.2%) | 263 (65.4%) |
| 65 to 74 Years | 216 (93.9%) | 155 (67.4%) |
| 75 Years and over | 240 (100.0%) | 151 (62.9%) |
| Total | 1,168 (52.5%) | 1,389 (62.5%) |
Disability Status by Sex by Age in Bay City
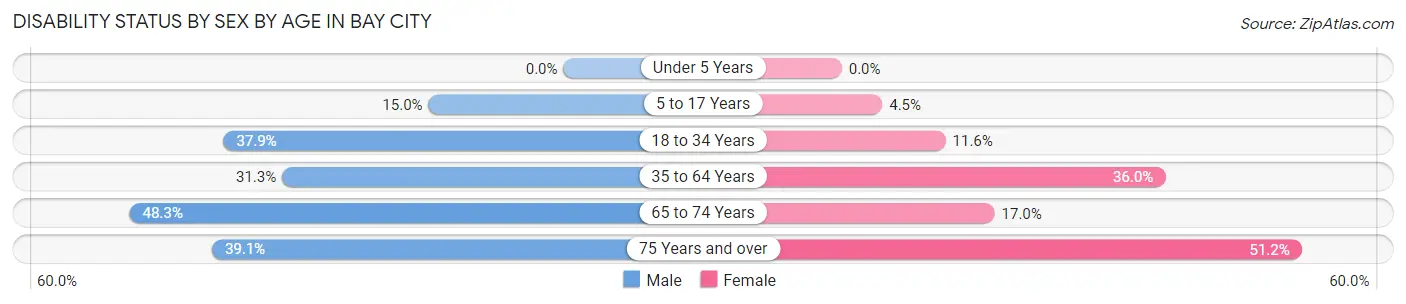
| Age Bracket | Male | Female |
| Under 5 Years | 0 (0.0%) | 0 (0.0%) |
| 5 to 17 Years | 29 (15.0%) | 6 (4.5%) |
| 18 to 34 Years | 67 (37.9%) | 20 (11.6%) |
| 35 to 64 Years | 141 (31.3%) | 166 (36.0%) |
| 65 to 74 Years | 43 (48.3%) | 24 (17.0%) |
| 75 Years and over | 45 (39.1%) | 64 (51.2%) |
Disability Class by Sex by Age in Bay City
Disability Class: Hearing Difficulty
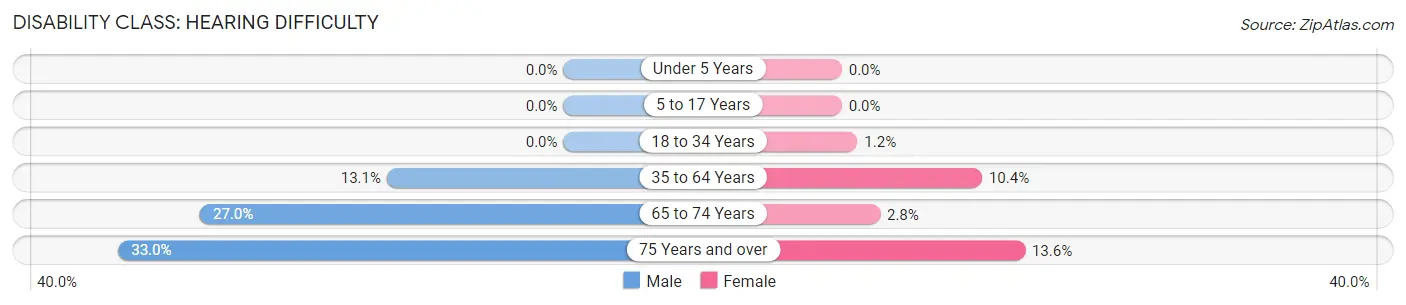
| Age Bracket | Male | Female |
| Under 5 Years | 0 (0.0%) | 0 (0.0%) |
| 5 to 17 Years | 0 (0.0%) | 0 (0.0%) |
| 18 to 34 Years | 0 (0.0%) | 2 (1.2%) |
| 35 to 64 Years | 59 (13.1%) | 48 (10.4%) |
| 65 to 74 Years | 24 (27.0%) | 4 (2.8%) |
| 75 Years and over | 38 (33.0%) | 17 (13.6%) |
Disability Class: Vision Difficulty
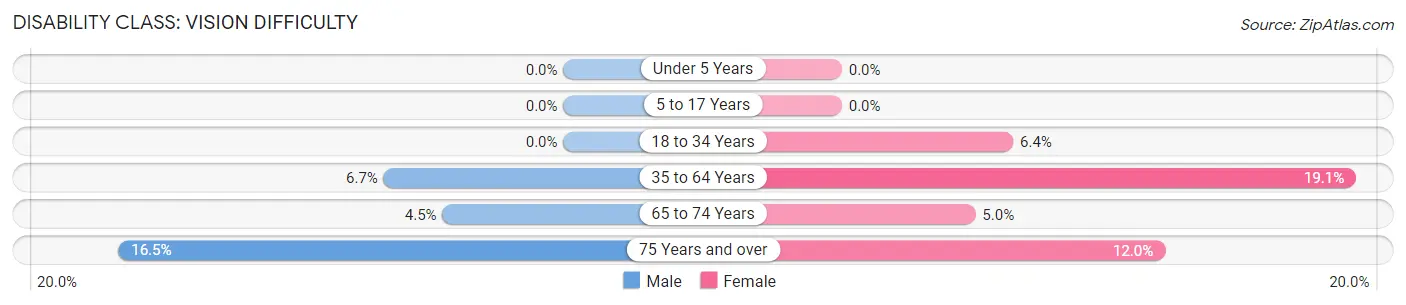
| Age Bracket | Male | Female |
| Under 5 Years | 0 (0.0%) | 0 (0.0%) |
| 5 to 17 Years | 0 (0.0%) | 0 (0.0%) |
| 18 to 34 Years | 0 (0.0%) | 11 (6.4%) |
| 35 to 64 Years | 30 (6.7%) | 88 (19.1%) |
| 65 to 74 Years | 4 (4.5%) | 7 (5.0%) |
| 75 Years and over | 19 (16.5%) | 15 (12.0%) |
Disability Class: Cognitive Difficulty
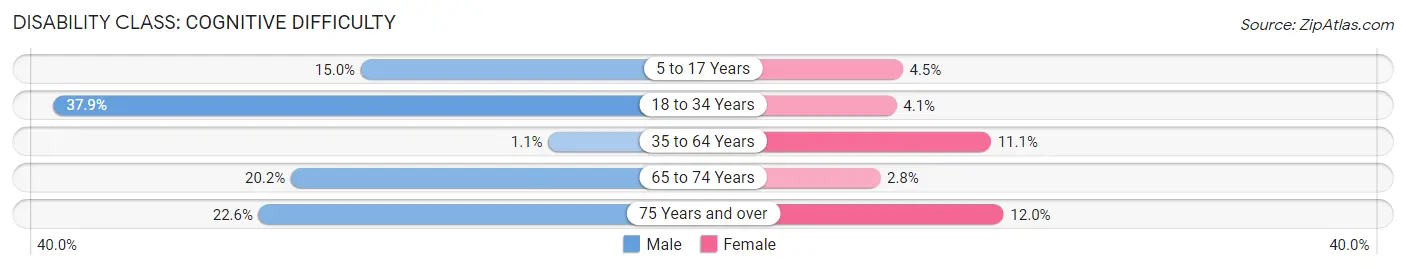
| Age Bracket | Male | Female |
| 5 to 17 Years | 29 (15.0%) | 6 (4.5%) |
| 18 to 34 Years | 67 (37.9%) | 7 (4.1%) |
| 35 to 64 Years | 5 (1.1%) | 51 (11.1%) |
| 65 to 74 Years | 18 (20.2%) | 4 (2.8%) |
| 75 Years and over | 26 (22.6%) | 15 (12.0%) |
Disability Class: Ambulatory Difficulty
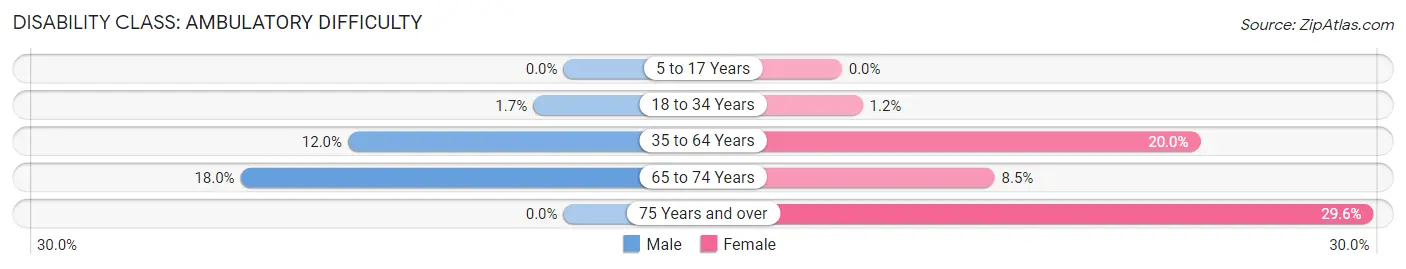
| Age Bracket | Male | Female |
| 5 to 17 Years | 0 (0.0%) | 0 (0.0%) |
| 18 to 34 Years | 3 (1.7%) | 2 (1.2%) |
| 35 to 64 Years | 54 (12.0%) | 92 (20.0%) |
| 65 to 74 Years | 16 (18.0%) | 12 (8.5%) |
| 75 Years and over | 0 (0.0%) | 37 (29.6%) |
Disability Class: Self-Care Difficulty
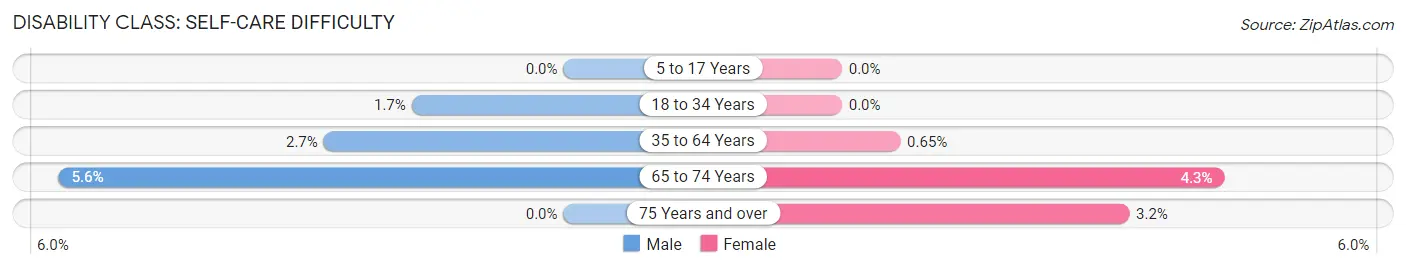
| Age Bracket | Male | Female |
| 5 to 17 Years | 0 (0.0%) | 0 (0.0%) |
| 18 to 34 Years | 3 (1.7%) | 0 (0.0%) |
| 35 to 64 Years | 12 (2.7%) | 3 (0.6%) |
| 65 to 74 Years | 5 (5.6%) | 6 (4.3%) |
| 75 Years and over | 0 (0.0%) | 4 (3.2%) |
Technology Access in Bay City
Computing Device Access in Bay City
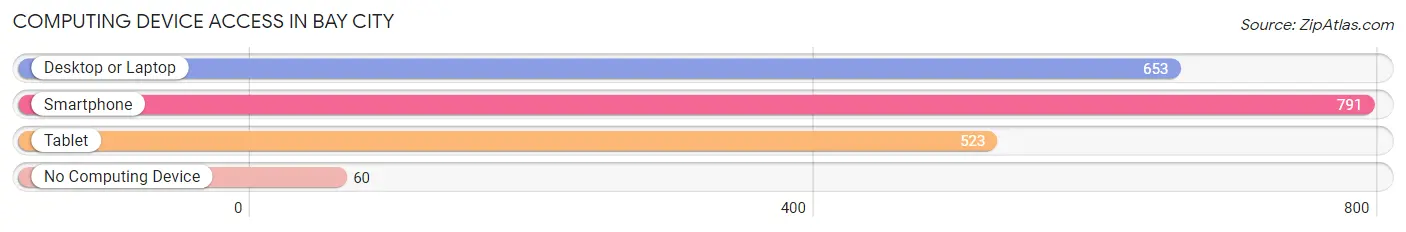
| Device Type | # Households | % Households |
| Desktop or Laptop | 653 | 72.2% |
| Smartphone | 791 | 87.5% |
| Tablet | 523 | 57.9% |
| No Computing Device | 60 | 6.6% |
| Total | 904 | 100.0% |
Internet Access in Bay City
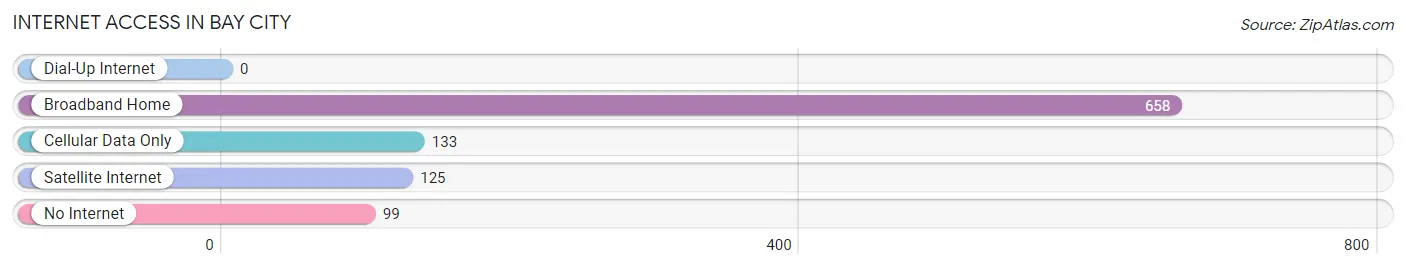
| Internet Type | # Households | % Households |
| Dial-Up Internet | 0 | 0.0% |
| Broadband Home | 658 | 72.8% |
| Cellular Data Only | 133 | 14.7% |
| Satellite Internet | 125 | 13.8% |
| No Internet | 99 | 11.0% |
| Total | 904 | 100.0% |
Bay City Summary
Bay City is a small city located in Tillamook County, Oregon, United States. It is situated on the north shore of Tillamook Bay, approximately 10 miles south of Tillamook and 40 miles west of Portland. The population was 1,717 at the 2010 census.
History
Bay City was founded in 1876 by a group of settlers from the Midwest. The town was originally called "New Chicago" due to its resemblance to the city of Chicago. The name was changed to Bay City in 1883.
The town was a major port for the lumber industry in the late 19th and early 20th centuries. The lumber industry was the main source of employment for the town's residents.
In the early 20th century, Bay City was a popular tourist destination. The town was known for its beaches, fishing, and other recreational activities.
Geography
Bay City is located at the mouth of Tillamook Bay, approximately 10 miles south of Tillamook and 40 miles west of Portland. The city has a total area of 1.3 square miles, all of which is land.
The city is located on the north shore of Tillamook Bay, which is part of the Pacific Ocean. The bay is a popular destination for fishing, boating, and other recreational activities.
Economy
The economy of Bay City is largely based on tourism and fishing. The city is a popular destination for fishing, boating, and other recreational activities.
The city is also home to several small businesses, including restaurants, retail stores, and other services.
Demographics
As of the 2010 census, there were 1,717 people, 745 households, and 463 families residing in the city. The population density was 1,312.7 people per square mile. The racial makeup of the city was 94.2% White, 0.2% African American, 0.7% Native American, 0.7% Asian, 0.1% Pacific Islander, 0.7% from other races, and 3.4% from two or more races. Hispanic or Latino of any race were 2.2% of the population.
The median income for a household in the city was $37,917, and the median income for a family was $45,000. Males had a median income of $35,000 versus $25,000 for females. The per capita income for the city was $19,845. About 8.3% of families and 11.2% of the population were below the poverty line, including 15.2% of those under age 18 and 8.3% of those age 65 or over.
Conclusion
Bay City is a small city located in Tillamook County, Oregon, United States. It is situated on the north shore of Tillamook Bay, approximately 10 miles south of Tillamook and 40 miles west of Portland. The population was 1,717 at the 2010 census. The economy of Bay City is largely based on tourism and fishing. The city is a popular destination for fishing, boating, and other recreational activities. The racial makeup of the city was 94.2% White, 0.2% African American, 0.7% Native American, 0.7% Asian, 0.1% Pacific Islander, 0.7% from other races, and 3.4% from two or more races. The median income for a household in the city was $37,917, and the median income for a family was $45,000. Bay City is a great place to live and visit, offering a variety of activities and attractions for all ages.
Common Questions
What is Per Capita Income in Bay City?
Per Capita income in Bay City is $30,814.
What is the Median Family Income in Bay City?
Median Family Income in Bay City is $75,417.
What is the Median Household income in Bay City?
Median Household Income in Bay City is $64,167.
What is Income or Wage Gap in Bay City?
Income or Wage Gap in Bay City is 31.4%.
Women in Bay City earn 68.6 cents for every dollar earned by a man.
What is Inequality or Gini Index in Bay City?
Inequality or Gini Index in Bay City is 0.38.
What is the Total Population of Bay City?
Total Population of Bay City is 2,224.
What is the Total Male Population of Bay City?
Total Male Population of Bay City is 1,068.
What is the Total Female Population of Bay City?
Total Female Population of Bay City is 1,156.
What is the Ratio of Males per 100 Females in Bay City?
There are 92.39 Males per 100 Females in Bay City.
What is the Ratio of Females per 100 Males in Bay City?
There are 108.24 Females per 100 Males in Bay City.
What is the Median Population Age in Bay City?
Median Population Age in Bay City is 44.5 Years.
What is the Average Family Size in Bay City
Average Family Size in Bay City is 3.0 People.
What is the Average Household Size in Bay City
Average Household Size in Bay City is 2.5 People.
How Large is the Labor Force in Bay City?
There are 985 People in the Labor Forcein in Bay City.
What is the Percentage of People in the Labor Force in Bay City?
56.2% of People are in the Labor Force in Bay City.
What is the Unemployment Rate in Bay City?
Unemployment Rate in Bay City is 3.6%.