Trail, OR Map & Demographics
Trail Map
Trail Overview
$17,325
PER CAPITA INCOME
$39,030
AVG FAMILY INCOME
9.6%
WAGE / INCOME GAP [ % ]
90.4¢/ $1
WAGE / INCOME GAP [ $ ]
0.51
INEQUALITY / GINI INDEX
644
TOTAL POPULATION
276
MALE POPULATION
368
FEMALE POPULATION
75.00
MALES / 100 FEMALES
133.33
FEMALES / 100 MALES
48.8
MEDIAN AGE
2.9
AVG FAMILY SIZE
2.2
AVG HOUSEHOLD SIZE
299
LABOR FORCE [ PEOPLE ]
52.5%
PERCENT IN LABOR FORCE
6.7%
UNEMPLOYMENT RATE
Trail Zip Codes
Trail Area Codes
Income in Trail
Income Overview in Trail
| Characteristic | Number | Measure |
| Per Capita Income | 644 | $17,325 |
| Median Family Income | 144 | $39,030 |
| Mean Family Income | 144 | $59,291 |
| Median Household Income | 291 | $0 |
| Mean Household Income | 291 | $38,727 |
| Income Deficit | 144 | $0 |
| Wage / Income Gap (%) | 644 | 9.59% |
| Wage / Income Gap ($) | 644 | 90.41¢ per $1 |
| Gini / Inequality Index | 644 | 0.51 |
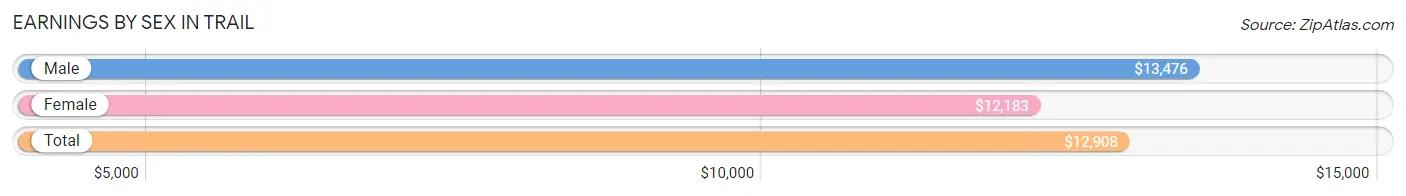
Earnings by Sex in Trail
Average Earnings in Trail are $12,908, $13,476 for men and $12,183 for women, a difference of 9.6%.
| Sex | Number | Average Earnings |
| Male | 138 (43.5%) | $13,476 |
| Female | 179 (56.5%) | $12,183 |
| Total | 317 (100.0%) | $12,908 |
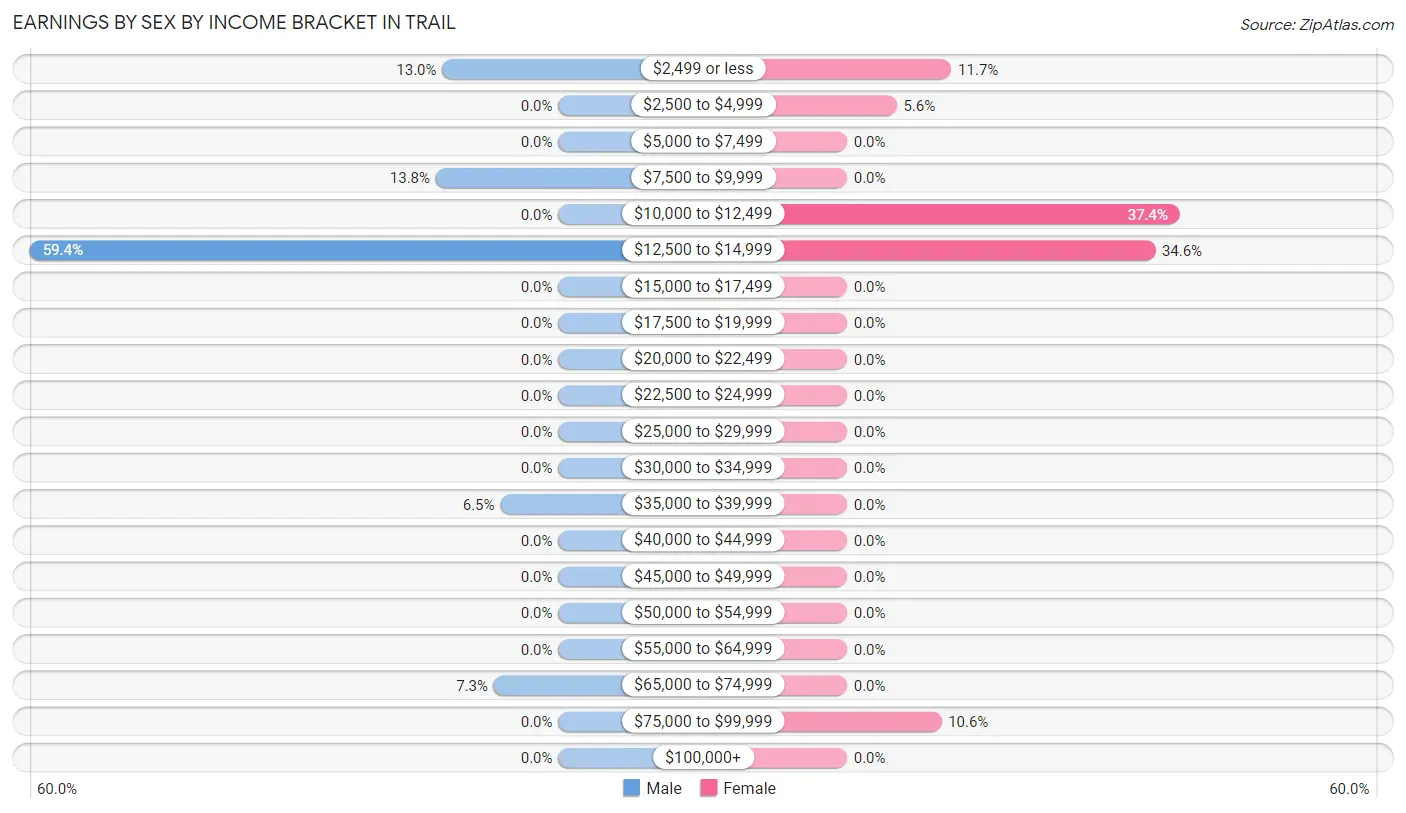
Earnings by Sex by Income Bracket in Trail
The most common earnings brackets in Trail are $12,500 to $14,999 for men (82 | 59.4%) and $10,000 to $12,499 for women (67 | 37.4%).
| Income | Male | Female |
| $2,499 or less | 18 (13.0%) | 21 (11.7%) |
| $2,500 to $4,999 | 0 (0.0%) | 10 (5.6%) |
| $5,000 to $7,499 | 0 (0.0%) | 0 (0.0%) |
| $7,500 to $9,999 | 19 (13.8%) | 0 (0.0%) |
| $10,000 to $12,499 | 0 (0.0%) | 67 (37.4%) |
| $12,500 to $14,999 | 82 (59.4%) | 62 (34.6%) |
| $15,000 to $17,499 | 0 (0.0%) | 0 (0.0%) |
| $17,500 to $19,999 | 0 (0.0%) | 0 (0.0%) |
| $20,000 to $22,499 | 0 (0.0%) | 0 (0.0%) |
| $22,500 to $24,999 | 0 (0.0%) | 0 (0.0%) |
| $25,000 to $29,999 | 0 (0.0%) | 0 (0.0%) |
| $30,000 to $34,999 | 0 (0.0%) | 0 (0.0%) |
| $35,000 to $39,999 | 9 (6.5%) | 0 (0.0%) |
| $40,000 to $44,999 | 0 (0.0%) | 0 (0.0%) |
| $45,000 to $49,999 | 0 (0.0%) | 0 (0.0%) |
| $50,000 to $54,999 | 0 (0.0%) | 0 (0.0%) |
| $55,000 to $64,999 | 0 (0.0%) | 0 (0.0%) |
| $65,000 to $74,999 | 10 (7.2%) | 0 (0.0%) |
| $75,000 to $99,999 | 0 (0.0%) | 19 (10.6%) |
| $100,000+ | 0 (0.0%) | 0 (0.0%) |
| Total | 138 (100.0%) | 179 (100.0%) |
Earnings by Sex by Educational Attainment in Trail
| Educational Attainment | Male Income | Female Income |
| Less than High School | - | - |
| High School Diploma | - | - |
| College or Associate's Degree | - | - |
| Bachelor's Degree | - | - |
| Graduate Degree | - | - |
| Total | $13,476 | $11,231 |
Family Income in Trail
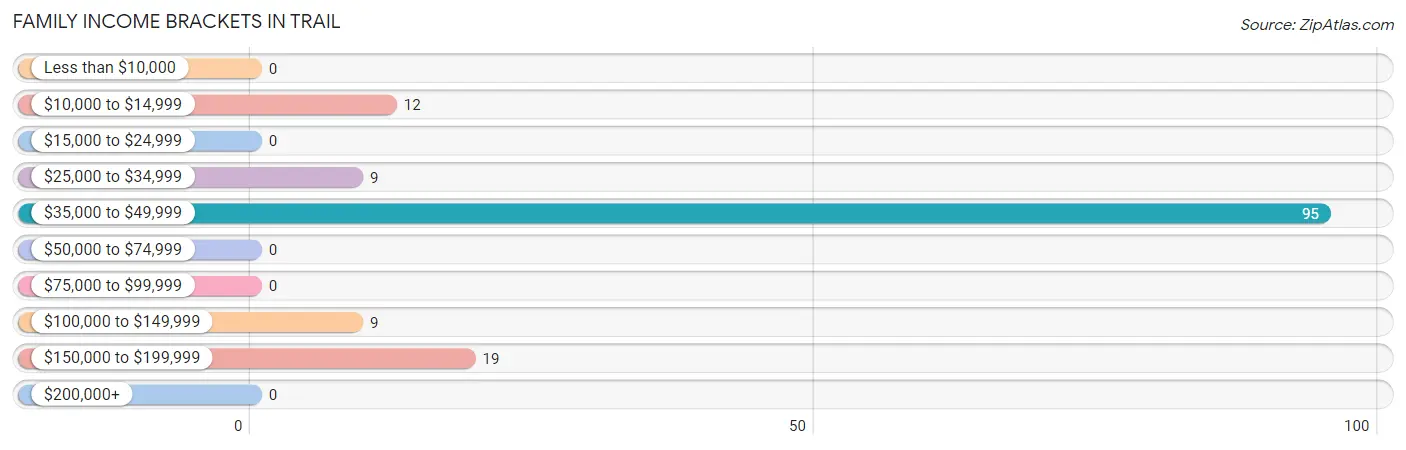
Family Income Brackets in Trail
According to the Trail family income data, there are 95 families falling into the $35,000 to $49,999 income range, which is the most common income bracket and makes up 66.0% of all families.
| Income Bracket | # Families | % Families |
| Less than $10,000 | 0 | 0.0% |
| $10,000 to $14,999 | 12 | 8.3% |
| $15,000 to $24,999 | 0 | 0.0% |
| $25,000 to $34,999 | 9 | 6.3% |
| $35,000 to $49,999 | 95 | 66.0% |
| $50,000 to $74,999 | 0 | 0.0% |
| $75,000 to $99,999 | 0 | 0.0% |
| $100,000 to $149,999 | 9 | 6.3% |
| $150,000 to $199,999 | 19 | 13.2% |
| $200,000+ | 0 | 0.0% |
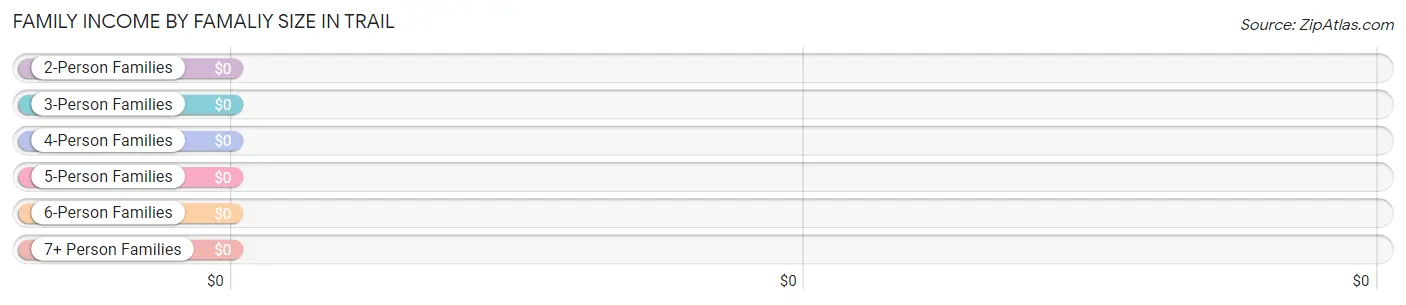
Family Income by Famaliy Size in Trail
| Income Bracket | # Families | Median Income |
| 2-Person Families | 68 (47.2%) | $0 |
| 3-Person Families | 0 (0.0%) | $0 |
| 4-Person Families | 76 (52.8%) | $0 |
| 5-Person Families | 0 (0.0%) | $0 |
| 6-Person Families | 0 (0.0%) | $0 |
| 7+ Person Families | 0 (0.0%) | $0 |
| Total | 144 (100.0%) | $39,030 |
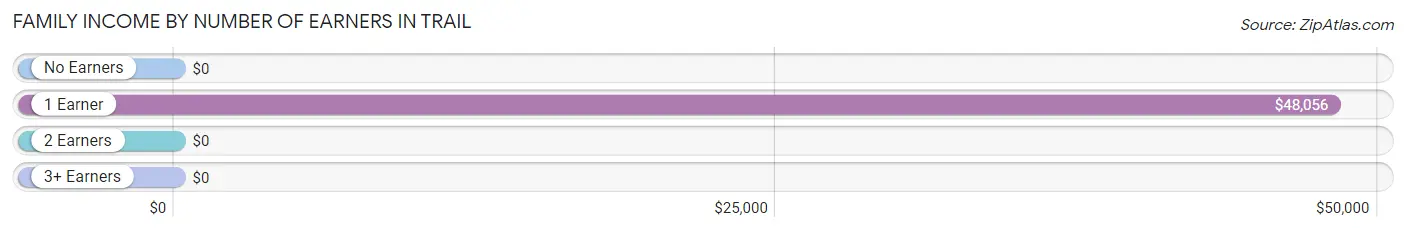
Family Income by Number of Earners in Trail
| Number of Earners | # Families | Median Income |
| No Earners | 12 (8.3%) | $0 |
| 1 Earner | 46 (31.9%) | $48,056 |
| 2 Earners | 19 (13.2%) | $0 |
| 3+ Earners | 67 (46.5%) | $0 |
| Total | 144 (100.0%) | $39,030 |
Household Income in Trail
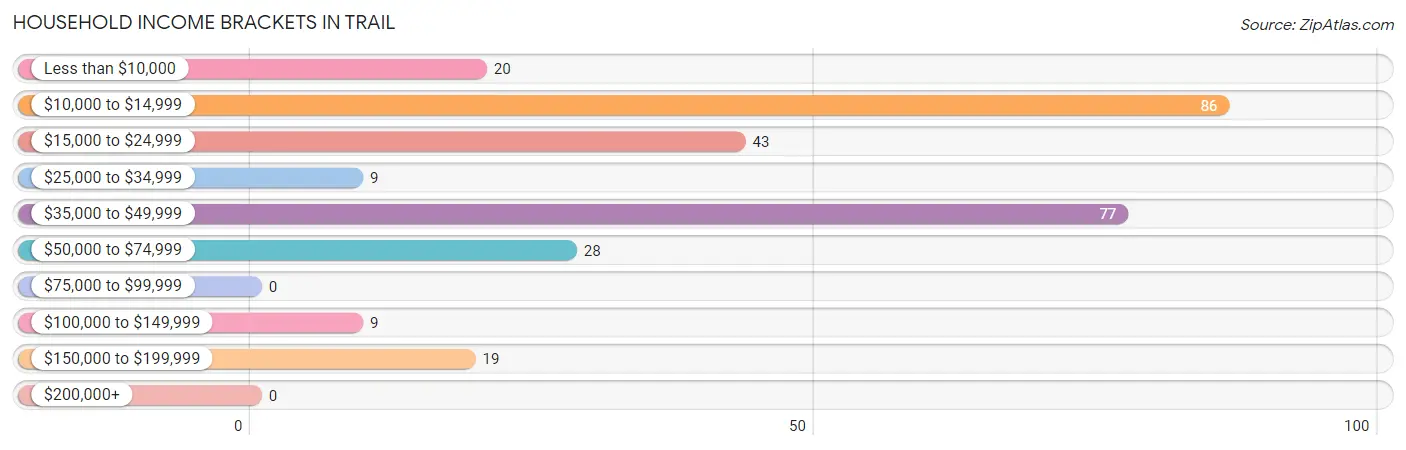
Household Income Brackets in Trail
With 86 households falling in the category, the $10,000 to $14,999 income range is the most frequent in Trail, accounting for 29.5% of all households.
| Income Bracket | # Households | % Households |
| Less than $10,000 | 20 | 6.9% |
| $10,000 to $14,999 | 86 | 29.6% |
| $15,000 to $24,999 | 43 | 14.8% |
| $25,000 to $34,999 | 9 | 3.1% |
| $35,000 to $49,999 | 77 | 26.5% |
| $50,000 to $74,999 | 28 | 9.6% |
| $75,000 to $99,999 | 0 | 0.0% |
| $100,000 to $149,999 | 9 | 3.1% |
| $150,000 to $199,999 | 19 | 6.5% |
| $200,000+ | 0 | 0.0% |
Household Income by Householder Age in Trail
| Income Bracket | # Households | Median Income |
| 15 to 24 Years | 0 (0.0%) | $0 |
| 25 to 44 Years | 67 (23.0%) | $0 |
| 45 to 64 Years | 186 (63.9%) | $0 |
| 65+ Years | 38 (13.1%) | $0 |
| Total | 291 (100.0%) | $0 |
Poverty in Trail
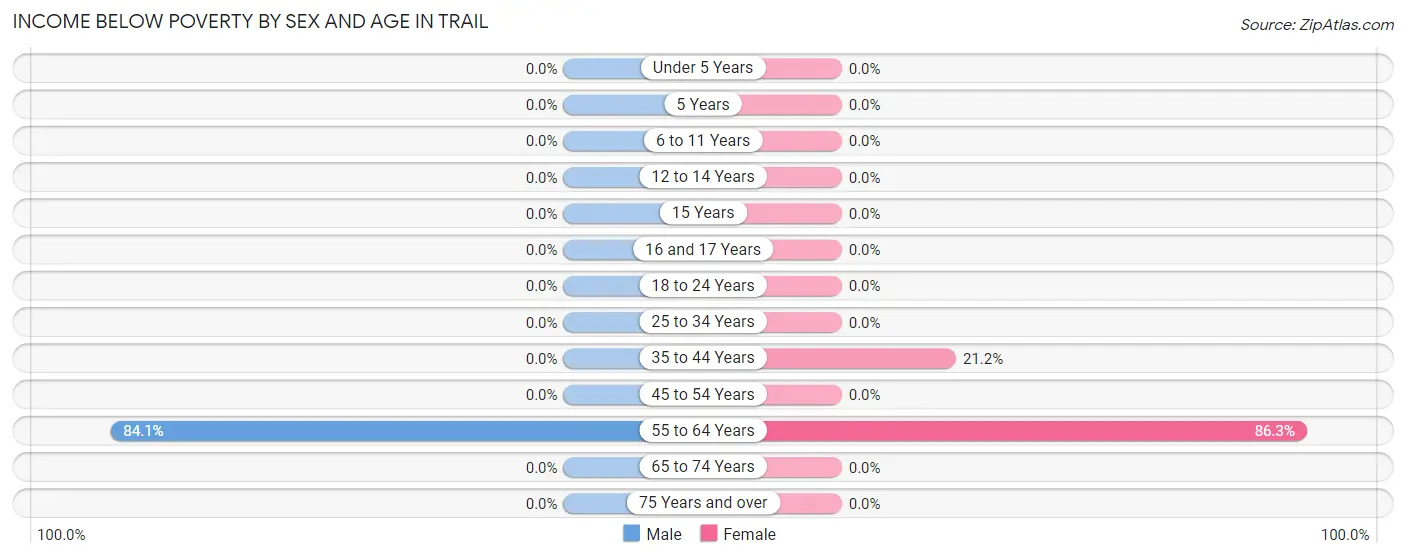
Income Below Poverty by Sex and Age in Trail
With 34.4% poverty level for males and 34.8% for females among the residents of Trail, 55 to 64 year old males and 55 to 64 year old females are the most vulnerable to poverty, with 95 males (84.1%) and 107 females (86.3%) in their respective age groups living below the poverty level.
| Age Bracket | Male | Female |
| Under 5 Years | 0 (0.0%) | 0 (0.0%) |
| 5 Years | 0 (0.0%) | 0 (0.0%) |
| 6 to 11 Years | 0 (0.0%) | 0 (0.0%) |
| 12 to 14 Years | 0 (0.0%) | 0 (0.0%) |
| 15 Years | 0 (0.0%) | 0 (0.0%) |
| 16 and 17 Years | 0 (0.0%) | 0 (0.0%) |
| 18 to 24 Years | 0 (0.0%) | 0 (0.0%) |
| 25 to 34 Years | 0 (0.0%) | 0 (0.0%) |
| 35 to 44 Years | 0 (0.0%) | 21 (21.2%) |
| 45 to 54 Years | 0 (0.0%) | 0 (0.0%) |
| 55 to 64 Years | 95 (84.1%) | 107 (86.3%) |
| 65 to 74 Years | 0 (0.0%) | 0 (0.0%) |
| 75 Years and over | 0 (0.0%) | 0 (0.0%) |
| Total | 95 (34.4%) | 128 (34.8%) |
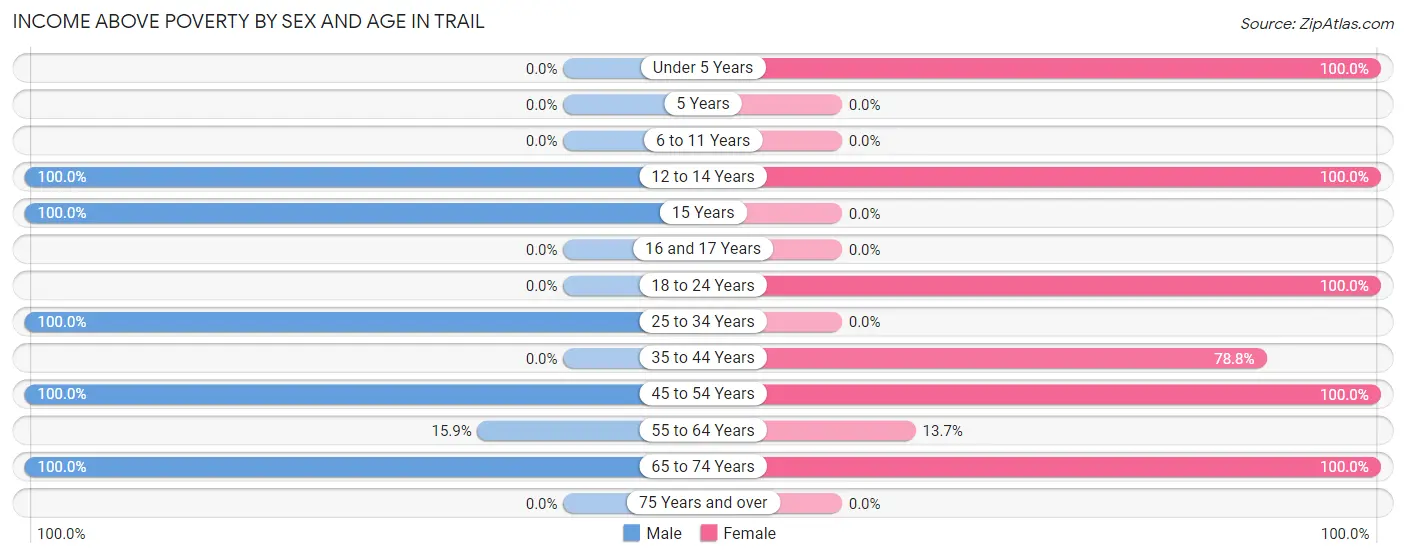
Income Above Poverty by Sex and Age in Trail
According to the poverty statistics in Trail, males aged 12 to 14 years and females aged under 5 years are the age groups that are most secure financially, with 100.0% of males and 100.0% of females in these age groups living above the poverty line.
| Age Bracket | Male | Female |
| Under 5 Years | 0 (0.0%) | 41 (100.0%) |
| 5 Years | 0 (0.0%) | 0 (0.0%) |
| 6 to 11 Years | 0 (0.0%) | 0 (0.0%) |
| 12 to 14 Years | 9 (100.0%) | 10 (100.0%) |
| 15 Years | 15 (100.0%) | 0 (0.0%) |
| 16 and 17 Years | 0 (0.0%) | 0 (0.0%) |
| 18 to 24 Years | 0 (0.0%) | 51 (100.0%) |
| 25 to 34 Years | 19 (100.0%) | 0 (0.0%) |
| 35 to 44 Years | 0 (0.0%) | 78 (78.8%) |
| 45 to 54 Years | 101 (100.0%) | 5 (100.0%) |
| 55 to 64 Years | 18 (15.9%) | 17 (13.7%) |
| 65 to 74 Years | 19 (100.0%) | 38 (100.0%) |
| 75 Years and over | 0 (0.0%) | 0 (0.0%) |
| Total | 181 (65.6%) | 240 (65.2%) |
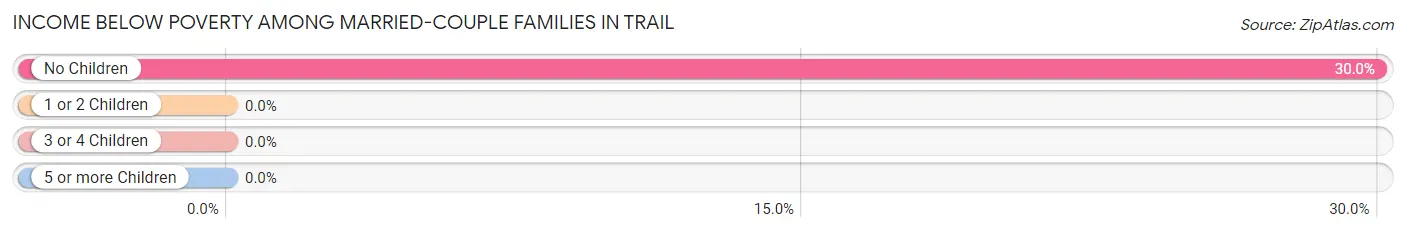
Income Below Poverty Among Married-Couple Families in Trail
The poverty statistics for married-couple families in Trail show that 11.2% or 12 of the total 107 families live below the poverty line. Families with no children have the highest poverty rate of 30.0%, comprising of 12 families. On the other hand, families with 1 or 2 children have the lowest poverty rate of 0.0%, which includes 0 families.
| Children | Above Poverty | Below Poverty |
| No Children | 28 (70.0%) | 12 (30.0%) |
| 1 or 2 Children | 67 (100.0%) | 0 (0.0%) |
| 3 or 4 Children | 0 (0.0%) | 0 (0.0%) |
| 5 or more Children | 0 (0.0%) | 0 (0.0%) |
| Total | 95 (88.8%) | 12 (11.2%) |
Income Below Poverty Among Single-Parent Households in Trail
| Children | Single Father | Single Mother |
| No Children | 0 (0.0%) | 0 (0.0%) |
| 1 or 2 Children | 0 (0.0%) | 0 (0.0%) |
| 3 or 4 Children | 0 (0.0%) | 0 (0.0%) |
| 5 or more Children | 0 (0.0%) | 0 (0.0%) |
| Total | 0 (0.0%) | 0 (0.0%) |
Income Below Poverty Among Married-Couple vs Single-Parent Households in Trail
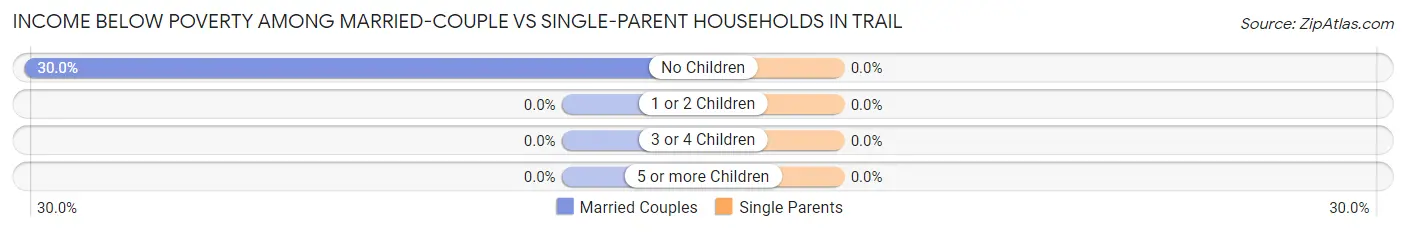
| Children | Married-Couple Families | Single-Parent Households |
| No Children | 12 (30.0%) | 0 (0.0%) |
| 1 or 2 Children | 0 (0.0%) | 0 (0.0%) |
| 3 or 4 Children | 0 (0.0%) | 0 (0.0%) |
| 5 or more Children | 0 (0.0%) | 0 (0.0%) |
| Total | 12 (11.2%) | 0 (0.0%) |
Race in Trail
The most populous races in Trail are White / Caucasian (623 | 96.7%), Two or more Races (14 | 2.2%), and Asian (7 | 1.1%).
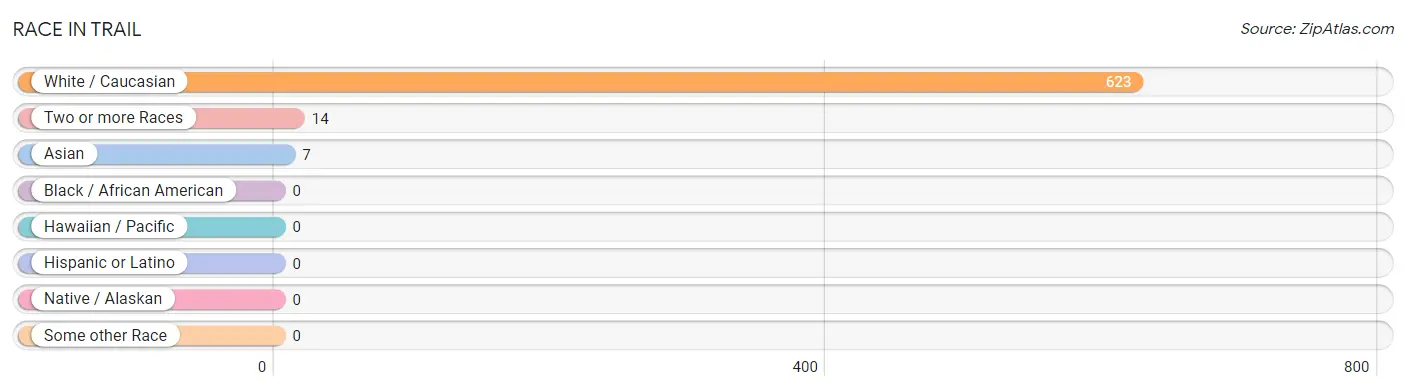
| Race | # Population | % Population |
| Asian | 7 | 1.1% |
| Black / African American | 0 | 0.0% |
| Hawaiian / Pacific | 0 | 0.0% |
| Hispanic or Latino | 0 | 0.0% |
| Native / Alaskan | 0 | 0.0% |
| White / Caucasian | 623 | 96.7% |
| Two or more Races | 14 | 2.2% |
| Some other Race | 0 | 0.0% |
| Total | 644 | 100.0% |
Ancestry in Trail
The most populous ancestries reported in Trail are Irish (204 | 31.7%), German (75 | 11.7%), English (19 | 2.9%), French (19 | 2.9%), and Scotch-Irish (19 | 2.9%), together accounting for 52.2% of all Trail residents.
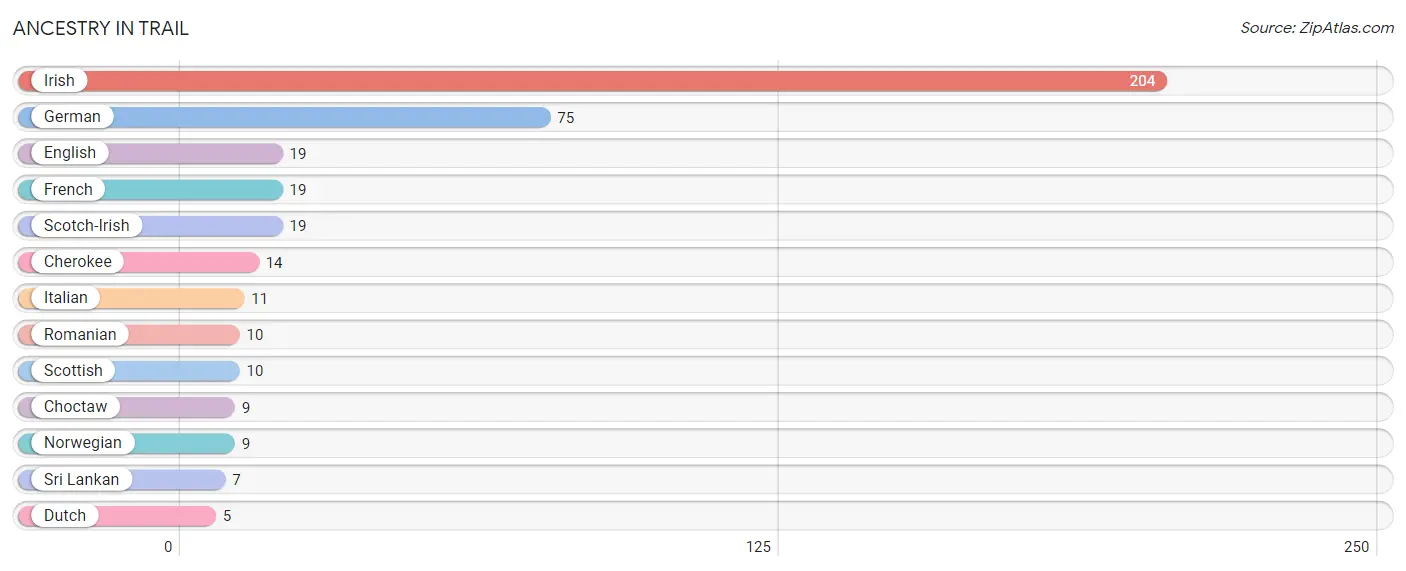
| Ancestry | # Population | % Population |
| Cherokee | 14 | 2.2% |
| Choctaw | 9 | 1.4% |
| Dutch | 5 | 0.8% |
| English | 19 | 2.9% |
| French | 19 | 2.9% |
| German | 75 | 11.7% |
| Irish | 204 | 31.7% |
| Italian | 11 | 1.7% |
| Norwegian | 9 | 1.4% |
| Romanian | 10 | 1.5% |
| Scotch-Irish | 19 | 2.9% |
| Scottish | 10 | 1.5% |
| Sri Lankan | 7 | 1.1% | View All 13 Rows |
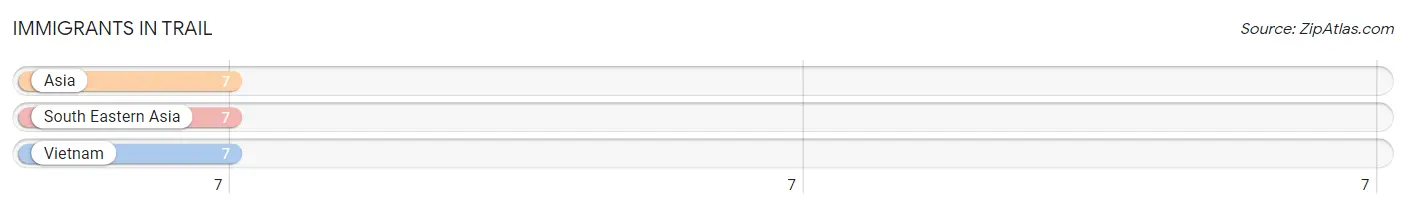
Immigrants in Trail
The most numerous immigrant groups reported in Trail came from Asia (7 | 1.1%), South Eastern Asia (7 | 1.1%), and Vietnam (7 | 1.1%), together accounting for 3.3% of all Trail residents.
| Immigration Origin | # Population | % Population |
| Asia | 7 | 1.1% |
| South Eastern Asia | 7 | 1.1% |
| Vietnam | 7 | 1.1% | View All 3 Rows |
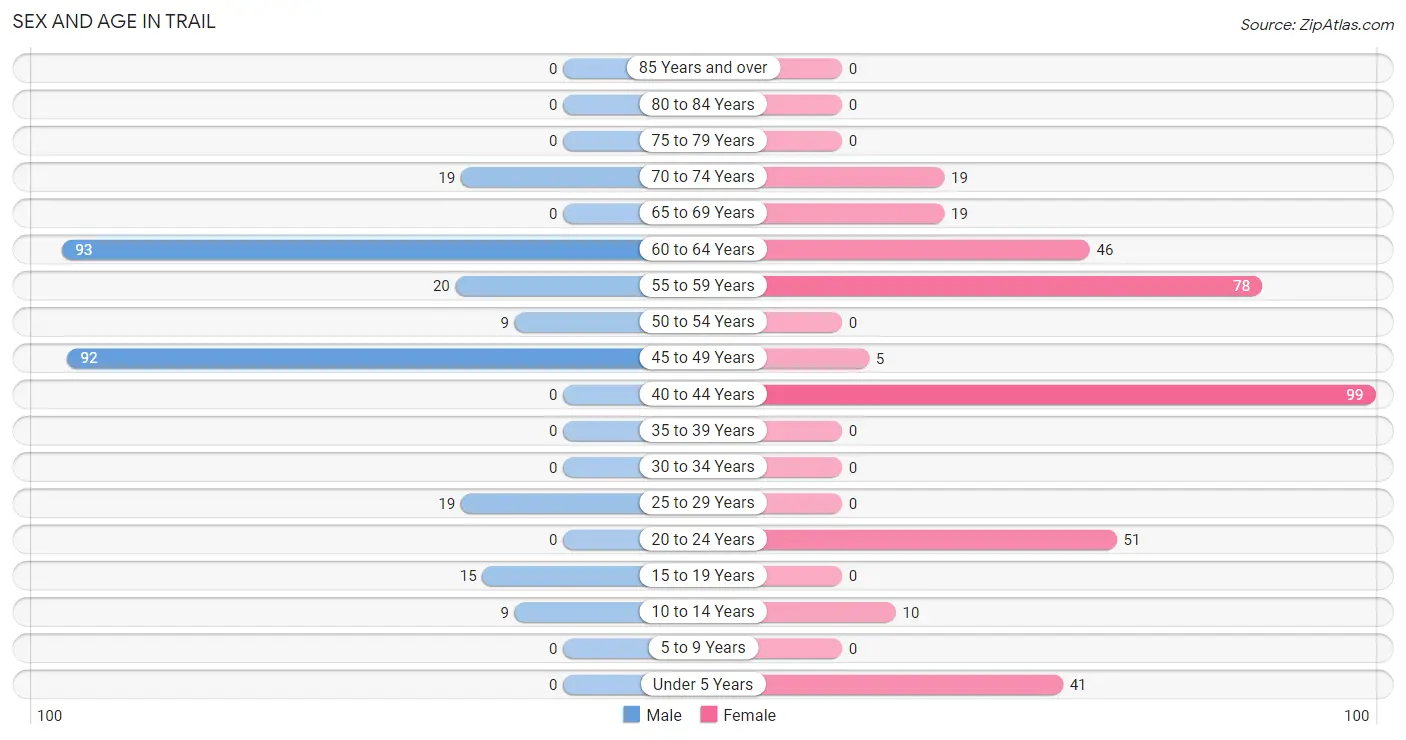
Sex and Age in Trail
Sex and Age in Trail
The most populous age groups in Trail are 60 to 64 Years (93 | 33.7%) for men and 40 to 44 Years (99 | 26.9%) for women.
| Age Bracket | Male | Female |
| Under 5 Years | 0 (0.0%) | 41 (11.1%) |
| 5 to 9 Years | 0 (0.0%) | 0 (0.0%) |
| 10 to 14 Years | 9 (3.3%) | 10 (2.7%) |
| 15 to 19 Years | 15 (5.4%) | 0 (0.0%) |
| 20 to 24 Years | 0 (0.0%) | 51 (13.9%) |
| 25 to 29 Years | 19 (6.9%) | 0 (0.0%) |
| 30 to 34 Years | 0 (0.0%) | 0 (0.0%) |
| 35 to 39 Years | 0 (0.0%) | 0 (0.0%) |
| 40 to 44 Years | 0 (0.0%) | 99 (26.9%) |
| 45 to 49 Years | 92 (33.3%) | 5 (1.4%) |
| 50 to 54 Years | 9 (3.3%) | 0 (0.0%) |
| 55 to 59 Years | 20 (7.2%) | 78 (21.2%) |
| 60 to 64 Years | 93 (33.7%) | 46 (12.5%) |
| 65 to 69 Years | 0 (0.0%) | 19 (5.2%) |
| 70 to 74 Years | 19 (6.9%) | 19 (5.2%) |
| 75 to 79 Years | 0 (0.0%) | 0 (0.0%) |
| 80 to 84 Years | 0 (0.0%) | 0 (0.0%) |
| 85 Years and over | 0 (0.0%) | 0 (0.0%) |
| Total | 276 (100.0%) | 368 (100.0%) |
Families and Households in Trail
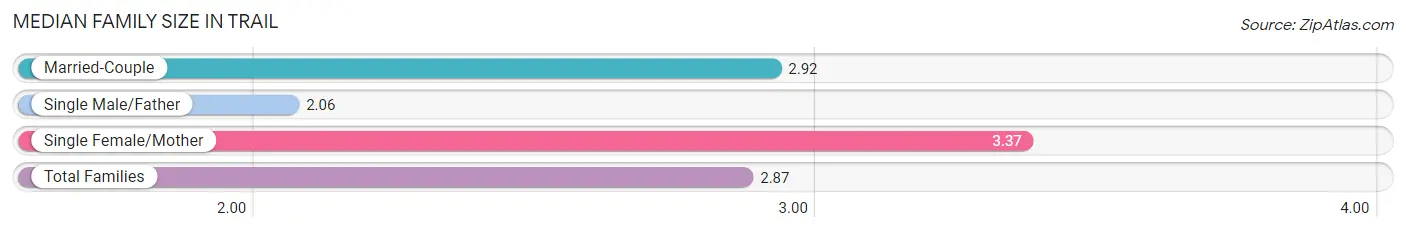
Median Family Size in Trail
The median family size in Trail is 2.87 persons per family, with single female/mother families (19 | 13.2%) accounting for the largest median family size of 3.37 persons per family. On the other hand, single male/father families (18 | 12.5%) represent the smallest median family size with 2.06 persons per family.
| Family Type | # Families | Family Size |
| Married-Couple | 107 (74.3%) | 2.92 |
| Single Male/Father | 18 (12.5%) | 2.06 |
| Single Female/Mother | 19 (13.2%) | 3.37 |
| Total Families | 144 (100.0%) | 2.87 |
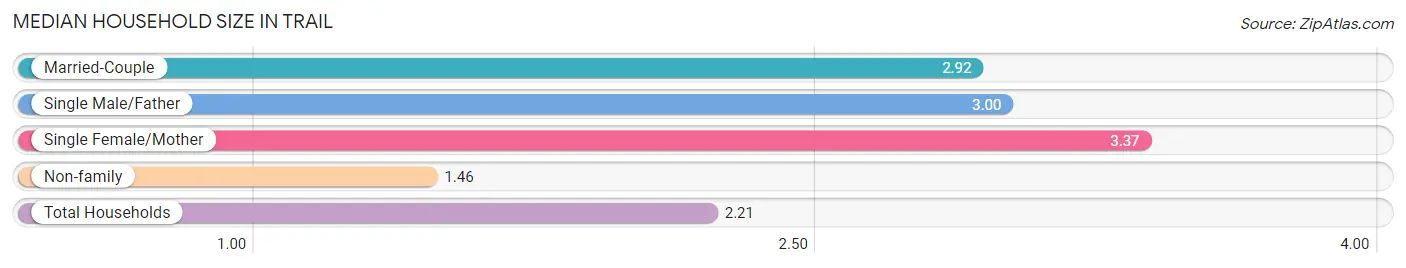
Median Household Size in Trail
The median household size in Trail is 2.21 persons per household, with single female/mother households (19 | 6.5%) accounting for the largest median household size of 3.37 persons per household. non-family households (147 | 50.5%) represent the smallest median household size with 1.46 persons per household.
| Household Type | # Households | Household Size |
| Married-Couple | 107 (36.8%) | 2.92 |
| Single Male/Father | 18 (6.2%) | 3.00 |
| Single Female/Mother | 19 (6.5%) | 3.37 |
| Non-family | 147 (50.5%) | 1.46 |
| Total Households | 291 (100.0%) | 2.21 |
Household Size by Marriage Status in Trail
Out of a total of 291 households in Trail, 144 (49.5%) are family households, while 147 (50.5%) are nonfamily households. The most numerous type of family households are 4-person households, comprising 76, and the most common type of nonfamily households are 1-person households, comprising 84.
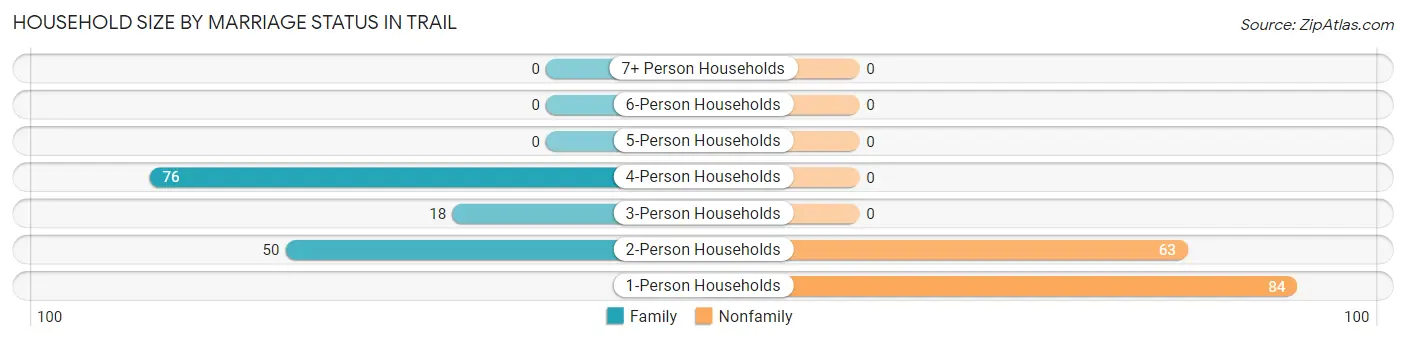
| Household Size | Family Households | Nonfamily Households |
| 1-Person Households | - | 84 (28.9%) |
| 2-Person Households | 50 (17.2%) | 63 (21.6%) |
| 3-Person Households | 18 (6.2%) | 0 (0.0%) |
| 4-Person Households | 76 (26.1%) | 0 (0.0%) |
| 5-Person Households | 0 (0.0%) | 0 (0.0%) |
| 6-Person Households | 0 (0.0%) | 0 (0.0%) |
| 7+ Person Households | 0 (0.0%) | 0 (0.0%) |
| Total | 144 (49.5%) | 147 (50.5%) |
Female Fertility in Trail
Fertility by Age in Trail
| Age Bracket | Women with Births | Births / 1,000 Women |
| 15 to 19 years | 0 (0.0%) | 0.0 |
| 20 to 34 years | 0 (0.0%) | 0.0 |
| 35 to 50 years | 0 (0.0%) | 0.0 |
| Total | 0 (0.0%) | 0.0 |
Fertility by Age by Marriage Status in Trail
| Age Bracket | Married | Unmarried |
| 15 to 19 years | 0 (0.0%) | 0 (0.0%) |
| 20 to 34 years | 0 (0.0%) | 0 (0.0%) |
| 35 to 50 years | 0 (0.0%) | 0 (0.0%) |
| Total | 0 (0.0%) | 0 (0.0%) |
Fertility by Education in Trail
| Educational Attainment | Women with Births | Births / 1,000 Women |
| Less than High School | 0 (0.0%) | 0.0 |
| High School Diploma | 0 (0.0%) | 0.0 |
| College or Associate's Degree | 0 (0.0%) | 0.0 |
| Bachelor's Degree | 0 (0.0%) | 0.0 |
| Graduate Degree | 0 (0.0%) | 0.0 |
| Total | 0 (0.0%) | 0.0 |
Fertility by Education by Marriage Status in Trail
| Educational Attainment | Married | Unmarried |
| Less than High School | 0 (0.0%) | 0 (0.0%) |
| High School Diploma | 0 (0.0%) | 0 (0.0%) |
| College or Associate's Degree | 0 (0.0%) | 0 (0.0%) |
| Bachelor's Degree | 0 (0.0%) | 0 (0.0%) |
| Graduate Degree | 0 (0.0%) | 0 (0.0%) |
| Total | 0 (0.0%) | 0 (0.0%) |
Employment Characteristics in Trail
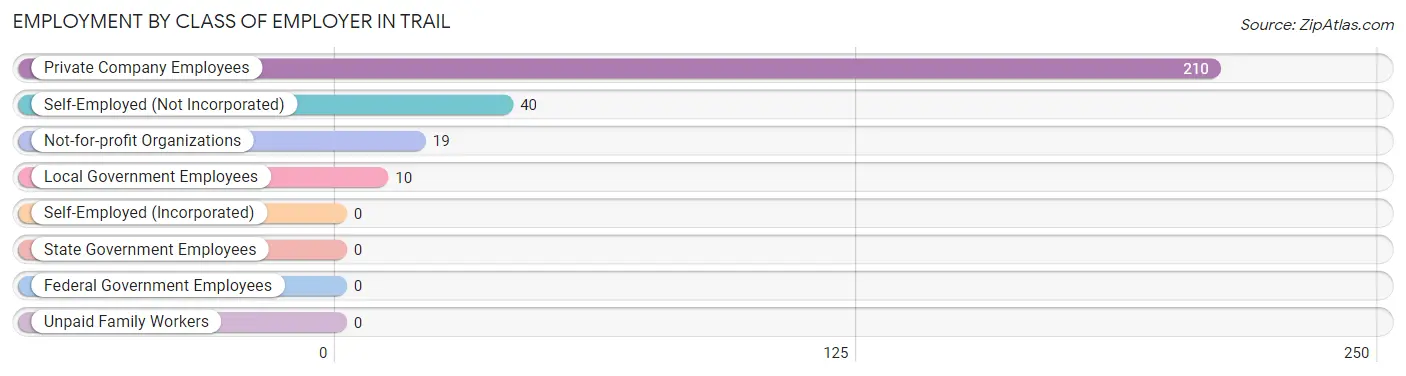
Employment by Class of Employer in Trail
Among the 279 employed individuals in Trail, private company employees (210 | 75.3%), self-employed (not incorporated) (40 | 14.3%), and not-for-profit organizations (19 | 6.8%) make up the most common classes of employment.
| Employer Class | # Employees | % Employees |
| Private Company Employees | 210 | 75.3% |
| Self-Employed (Incorporated) | 0 | 0.0% |
| Self-Employed (Not Incorporated) | 40 | 14.3% |
| Not-for-profit Organizations | 19 | 6.8% |
| Local Government Employees | 10 | 3.6% |
| State Government Employees | 0 | 0.0% |
| Federal Government Employees | 0 | 0.0% |
| Unpaid Family Workers | 0 | 0.0% |
| Total | 279 | 100.0% |
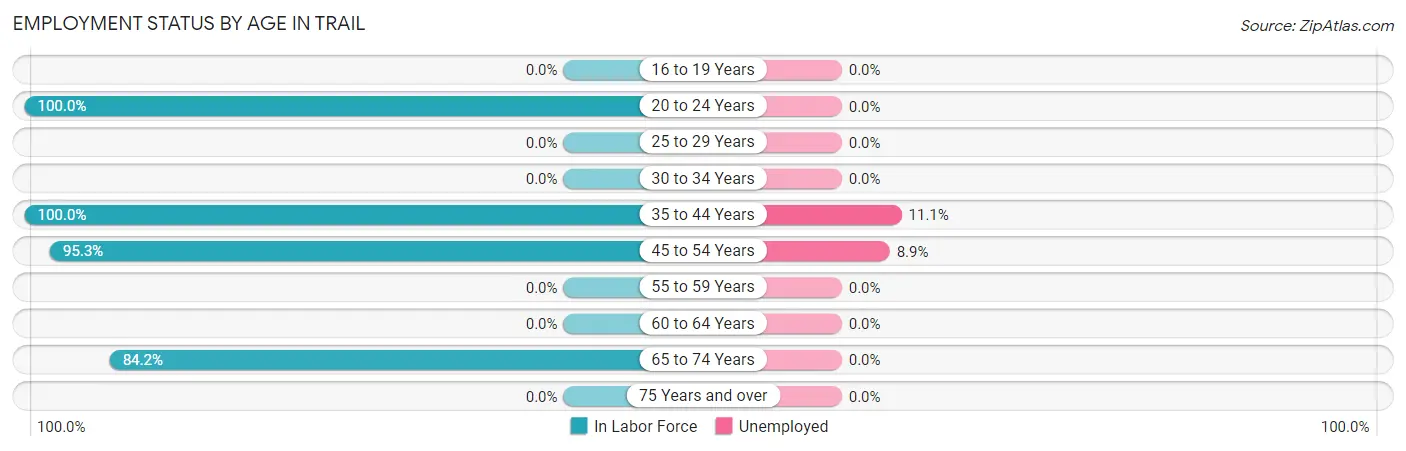
Employment Status by Age in Trail
According to the labor force statistics for Trail, out of the total population over 16 years of age (569), 52.5% or 299 individuals are in the labor force, with 6.7% or 20 of them unemployed. The age group with the highest labor force participation rate is 20 to 24 years, with 100.0% or 51 individuals in the labor force. Within the labor force, the 35 to 44 years age range has the highest percentage of unemployed individuals, with 11.1% or 11 of them being unemployed.
| Age Bracket | In Labor Force | Unemployed |
| 16 to 19 Years | 0 (0.0%) | 0 (0.0%) |
| 20 to 24 Years | 51 (100.0%) | 0 (0.0%) |
| 25 to 29 Years | 0 (0.0%) | 0 (0.0%) |
| 30 to 34 Years | 0 (0.0%) | 0 (0.0%) |
| 35 to 44 Years | 99 (100.0%) | 11 (11.1%) |
| 45 to 54 Years | 101 (95.3%) | 9 (8.9%) |
| 55 to 59 Years | 0 (0.0%) | 0 (0.0%) |
| 60 to 64 Years | 0 (0.0%) | 0 (0.0%) |
| 65 to 74 Years | 48 (84.2%) | 0 (0.0%) |
| 75 Years and over | 0 (0.0%) | 0 (0.0%) |
| Total | 299 (52.5%) | 20 (6.7%) |
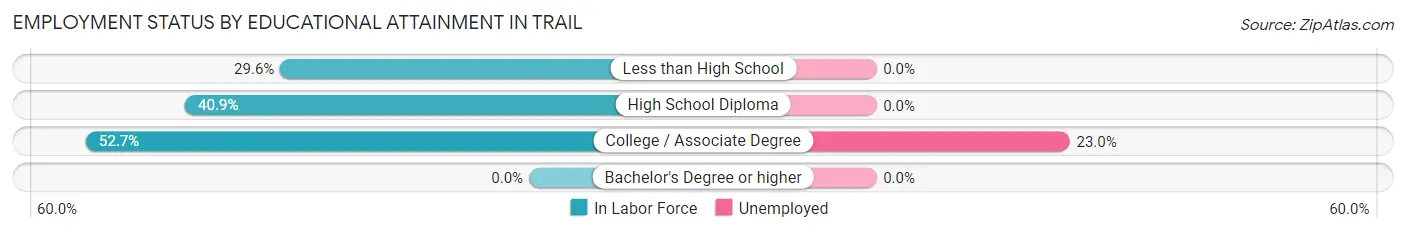
Employment Status by Educational Attainment in Trail
According to labor force statistics for Trail, 43.4% of individuals (200) out of the total population between 25 and 64 years of age (461) are in the labor force, with 10.0% or 20 of them being unemployed. The group with the highest labor force participation rate are those with the educational attainment of college / associate degree, with 52.7% or 87 individuals in the labor force. Within the labor force, individuals with college / associate degree education have the highest percentage of unemployment, with 23.0% or 20 of them being unemployed.
| Educational Attainment | In Labor Force | Unemployed |
| Less than High School | 21 (29.6%) | 0 (0.0%) |
| High School Diploma | 92 (40.9%) | 0 (0.0%) |
| College / Associate Degree | 87 (52.7%) | 38 (23.0%) |
| Bachelor's Degree or higher | 0 (0.0%) | 0 (0.0%) |
| Total | 200 (43.4%) | 46 (10.0%) |
Employment Occupations by Sex in Trail
Management, Business, Science and Arts Occupations
The most common Management, Business, Science and Arts occupations in Trail are Computers, Engineering & Science (19 | 6.8%), and Computers & Mathematics (19 | 6.8%).
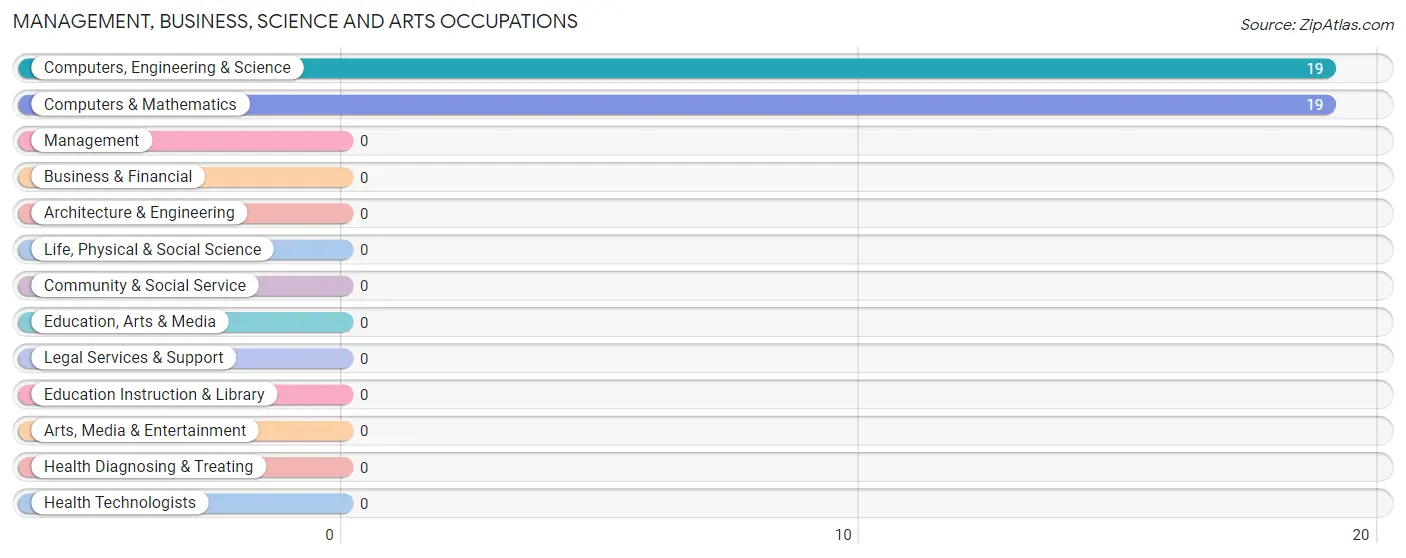
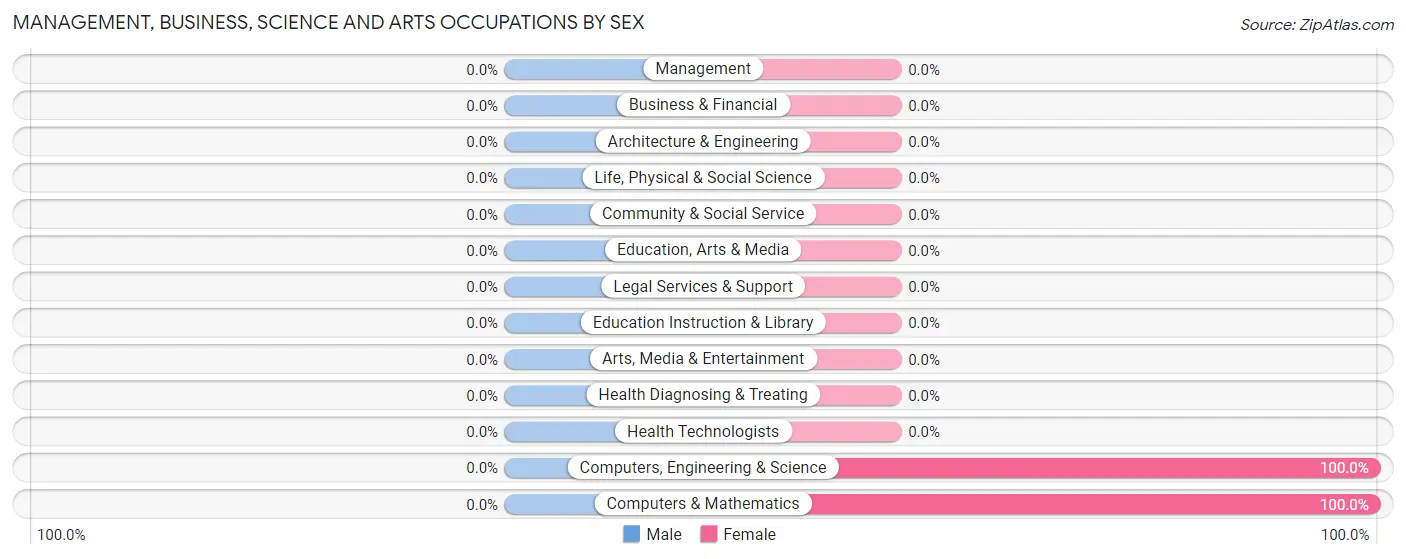
Management, Business, Science and Arts Occupations by Sex
| Occupation | Male | Female |
| Management | 0 (0.0%) | 0 (0.0%) |
| Business & Financial | 0 (0.0%) | 0 (0.0%) |
| Computers, Engineering & Science | 0 (0.0%) | 19 (100.0%) |
| Computers & Mathematics | 0 (0.0%) | 19 (100.0%) |
| Architecture & Engineering | 0 (0.0%) | 0 (0.0%) |
| Life, Physical & Social Science | 0 (0.0%) | 0 (0.0%) |
| Community & Social Service | 0 (0.0%) | 0 (0.0%) |
| Education, Arts & Media | 0 (0.0%) | 0 (0.0%) |
| Legal Services & Support | 0 (0.0%) | 0 (0.0%) |
| Education Instruction & Library | 0 (0.0%) | 0 (0.0%) |
| Arts, Media & Entertainment | 0 (0.0%) | 0 (0.0%) |
| Health Diagnosing & Treating | 0 (0.0%) | 0 (0.0%) |
| Health Technologists | 0 (0.0%) | 0 (0.0%) |
| Total (Category) | 0 (0.0%) | 19 (100.0%) |
| Total (Overall) | 111 (39.8%) | 168 (60.2%) |
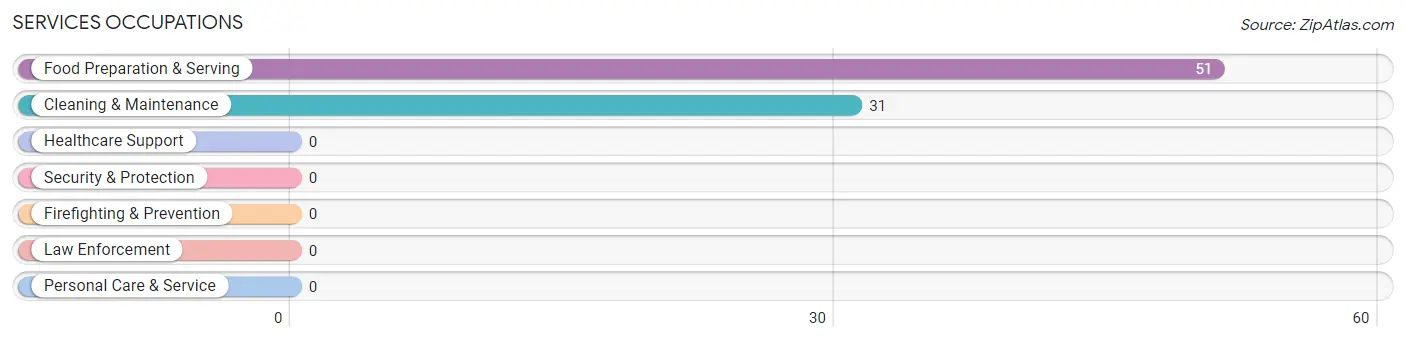
Services Occupations
The most common Services occupations in Trail are Food Preparation & Serving (51 | 18.3%), and Cleaning & Maintenance (31 | 11.1%).
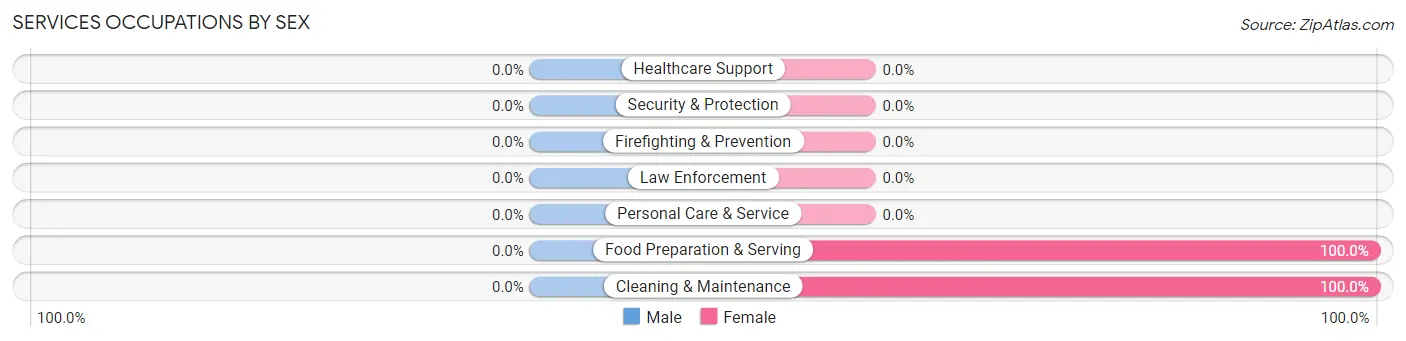
Services Occupations by Sex
| Occupation | Male | Female |
| Healthcare Support | 0 (0.0%) | 0 (0.0%) |
| Security & Protection | 0 (0.0%) | 0 (0.0%) |
| Firefighting & Prevention | 0 (0.0%) | 0 (0.0%) |
| Law Enforcement | 0 (0.0%) | 0 (0.0%) |
| Food Preparation & Serving | 0 (0.0%) | 51 (100.0%) |
| Cleaning & Maintenance | 0 (0.0%) | 31 (100.0%) |
| Personal Care & Service | 0 (0.0%) | 0 (0.0%) |
| Total (Category) | 0 (0.0%) | 82 (100.0%) |
| Total (Overall) | 111 (39.8%) | 168 (60.2%) |
Sales and Office Occupations
Sales and Office Occupations by Sex
| Occupation | Male | Female |
| Sales & Related | 0 (0.0%) | 0 (0.0%) |
| Office & Administration | 0 (0.0%) | 0 (0.0%) |
| Total (Category) | 0 (0.0%) | 0 (0.0%) |
| Total (Overall) | 111 (39.8%) | 168 (60.2%) |
Natural Resources, Construction and Maintenance Occupations
The most common Natural Resources, Construction and Maintenance occupations in Trail are Construction & Extraction (82 | 29.4%), and Installation, Maintenance & Repair (10 | 3.6%).
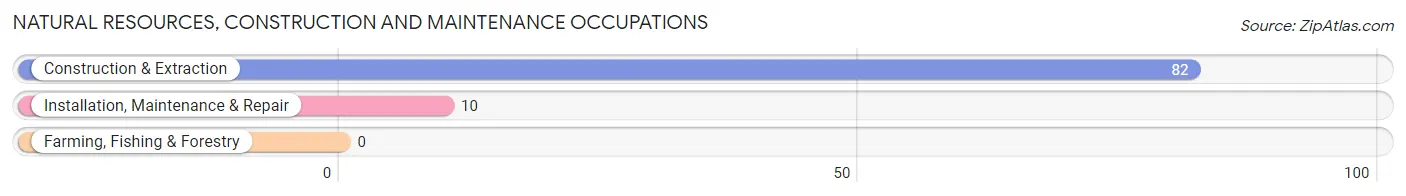
Natural Resources, Construction and Maintenance Occupations by Sex
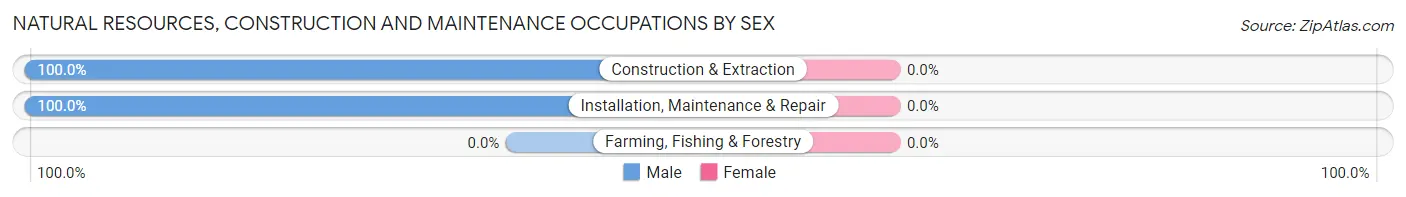
| Occupation | Male | Female |
| Farming, Fishing & Forestry | 0 (0.0%) | 0 (0.0%) |
| Construction & Extraction | 82 (100.0%) | 0 (0.0%) |
| Installation, Maintenance & Repair | 10 (100.0%) | 0 (0.0%) |
| Total (Category) | 92 (100.0%) | 0 (0.0%) |
| Total (Overall) | 111 (39.8%) | 168 (60.2%) |
Production, Transportation and Moving Occupations
The most common Production, Transportation and Moving occupations in Trail are Material Moving (67 | 24.0%), and Transportation (19 | 6.8%).
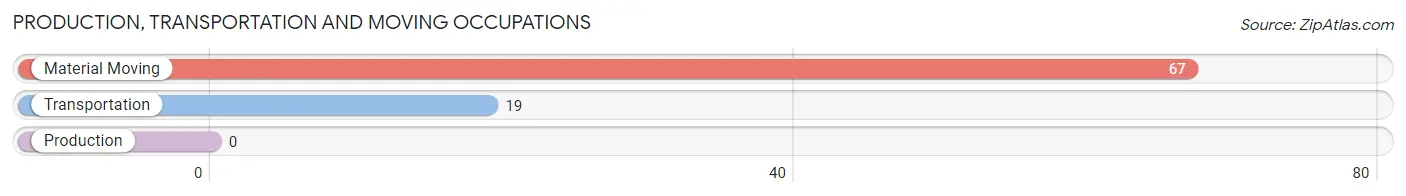
Production, Transportation and Moving Occupations by Sex
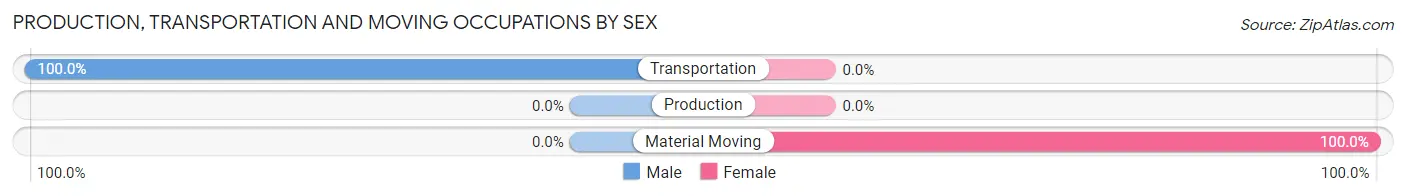
| Occupation | Male | Female |
| Production | 0 (0.0%) | 0 (0.0%) |
| Transportation | 19 (100.0%) | 0 (0.0%) |
| Material Moving | 0 (0.0%) | 67 (100.0%) |
| Total (Category) | 19 (22.1%) | 67 (77.9%) |
| Total (Overall) | 111 (39.8%) | 168 (60.2%) |
Employment Industries by Sex in Trail
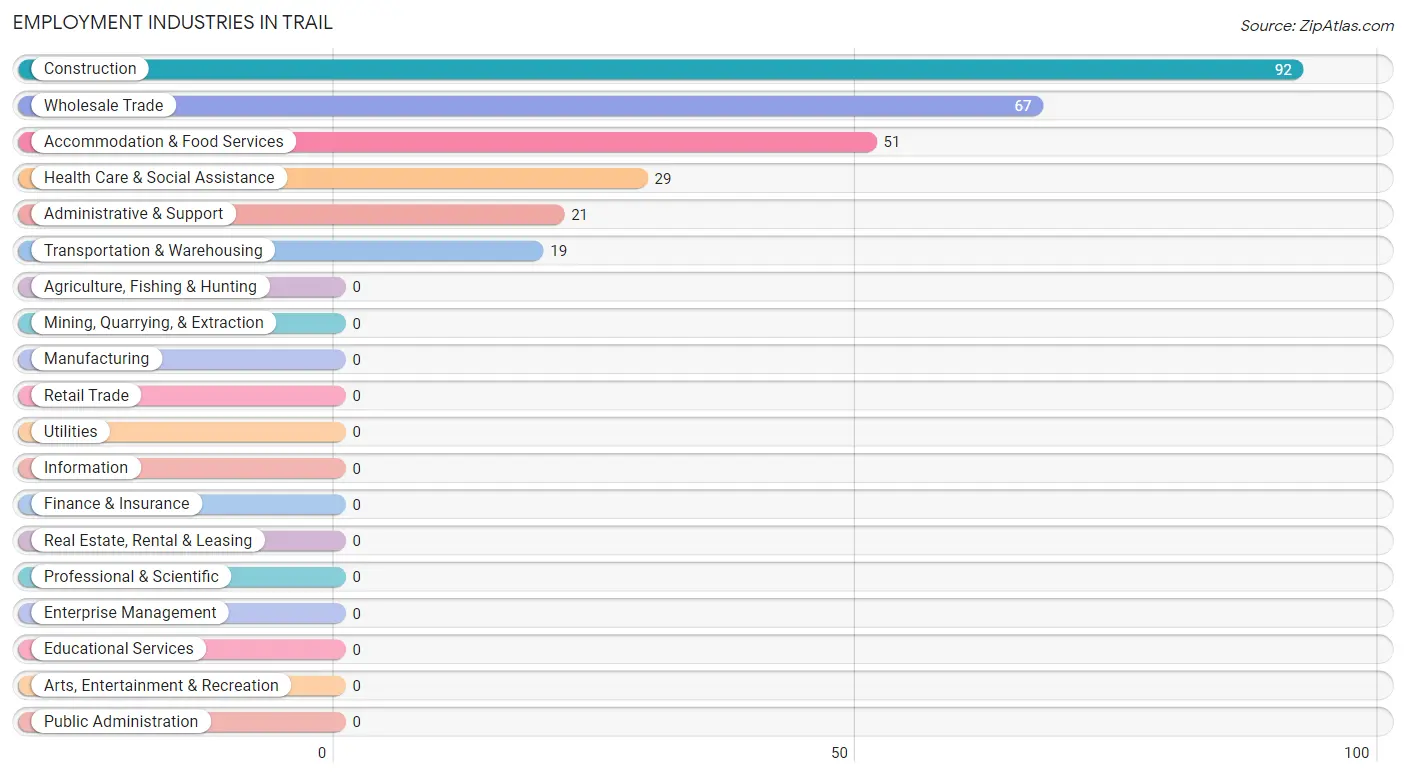
Employment Industries in Trail
The major employment industries in Trail include Construction (92 | 33.0%), Wholesale Trade (67 | 24.0%), Accommodation & Food Services (51 | 18.3%), Health Care & Social Assistance (29 | 10.4%), and Administrative & Support (21 | 7.5%).
Employment Industries by Sex in Trail
The Trail industries that see more men than women are Construction (100.0%), and Transportation & Warehousing (100.0%), whereas the industries that tend to have a higher number of women are Wholesale Trade (100.0%), Administrative & Support (100.0%), and Health Care & Social Assistance (100.0%).
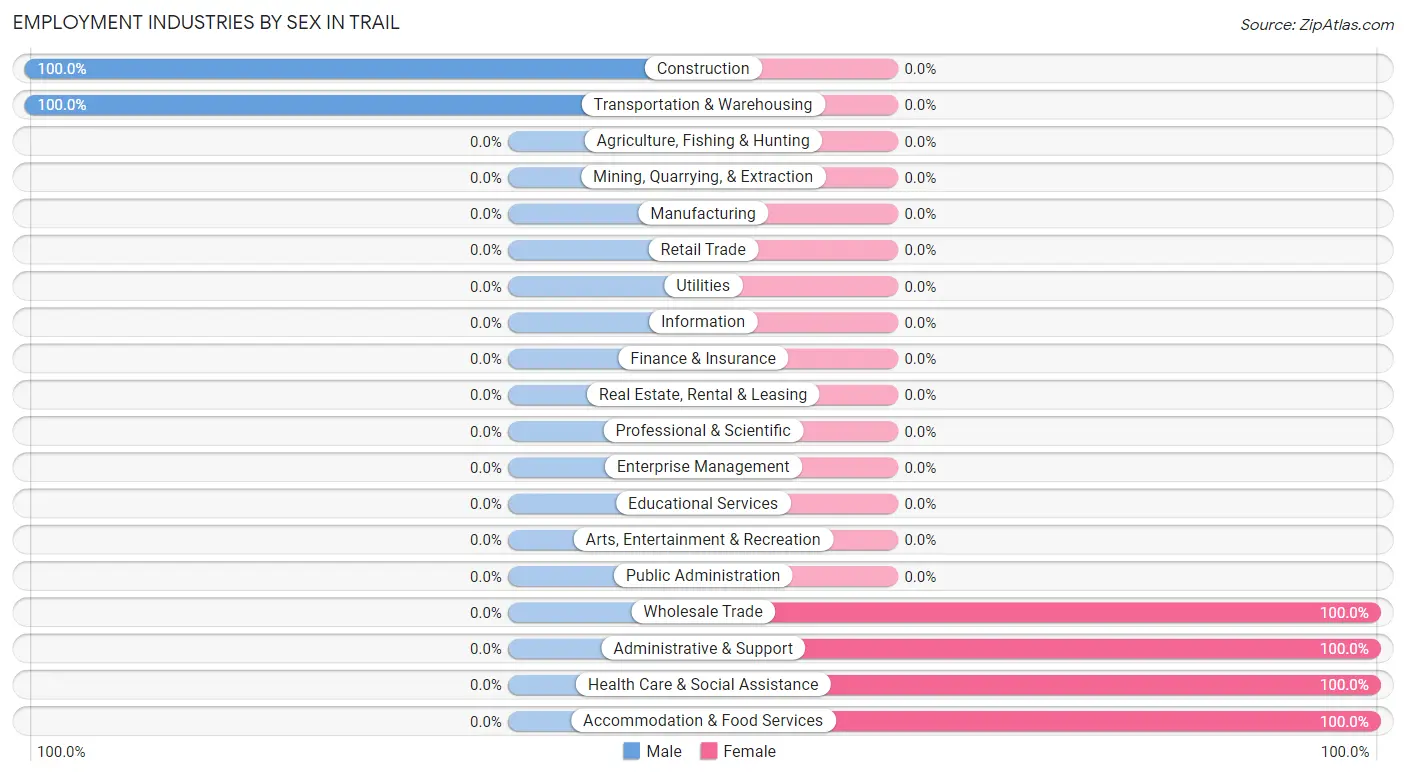
| Industry | Male | Female |
| Agriculture, Fishing & Hunting | 0 (0.0%) | 0 (0.0%) |
| Mining, Quarrying, & Extraction | 0 (0.0%) | 0 (0.0%) |
| Construction | 92 (100.0%) | 0 (0.0%) |
| Manufacturing | 0 (0.0%) | 0 (0.0%) |
| Wholesale Trade | 0 (0.0%) | 67 (100.0%) |
| Retail Trade | 0 (0.0%) | 0 (0.0%) |
| Transportation & Warehousing | 19 (100.0%) | 0 (0.0%) |
| Utilities | 0 (0.0%) | 0 (0.0%) |
| Information | 0 (0.0%) | 0 (0.0%) |
| Finance & Insurance | 0 (0.0%) | 0 (0.0%) |
| Real Estate, Rental & Leasing | 0 (0.0%) | 0 (0.0%) |
| Professional & Scientific | 0 (0.0%) | 0 (0.0%) |
| Enterprise Management | 0 (0.0%) | 0 (0.0%) |
| Administrative & Support | 0 (0.0%) | 21 (100.0%) |
| Educational Services | 0 (0.0%) | 0 (0.0%) |
| Health Care & Social Assistance | 0 (0.0%) | 29 (100.0%) |
| Arts, Entertainment & Recreation | 0 (0.0%) | 0 (0.0%) |
| Accommodation & Food Services | 0 (0.0%) | 51 (100.0%) |
| Public Administration | 0 (0.0%) | 0 (0.0%) |
| Total | 111 (39.8%) | 168 (60.2%) |
Education in Trail
School Enrollment in Trail
The most common levels of schooling among the 34 students in Trail are middle school (19 | 55.9%), and high school (15 | 44.1%).
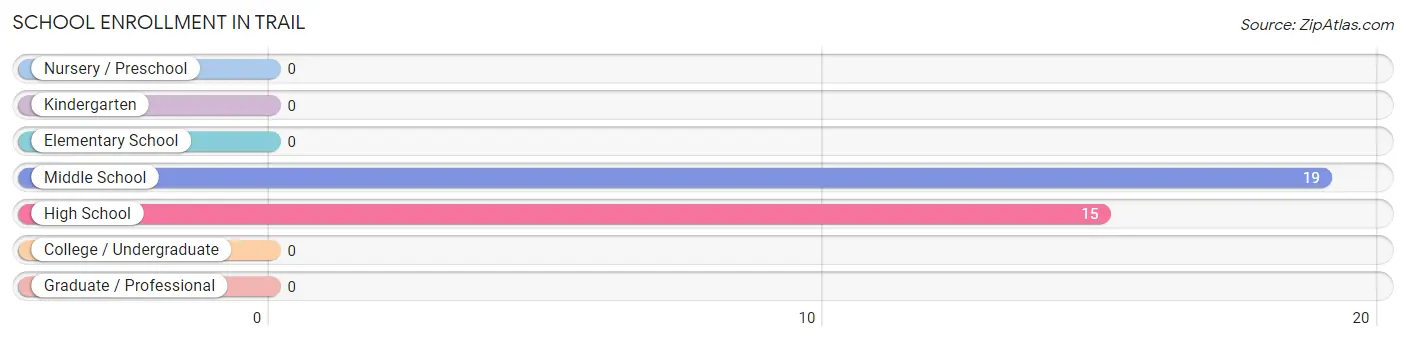
| School Level | # Students | % Students |
| Nursery / Preschool | 0 | 0.0% |
| Kindergarten | 0 | 0.0% |
| Elementary School | 0 | 0.0% |
| Middle School | 19 | 55.9% |
| High School | 15 | 44.1% |
| College / Undergraduate | 0 | 0.0% |
| Graduate / Professional | 0 | 0.0% |
| Total | 34 | 100.0% |
School Enrollment by Age by Funding Source in Trail
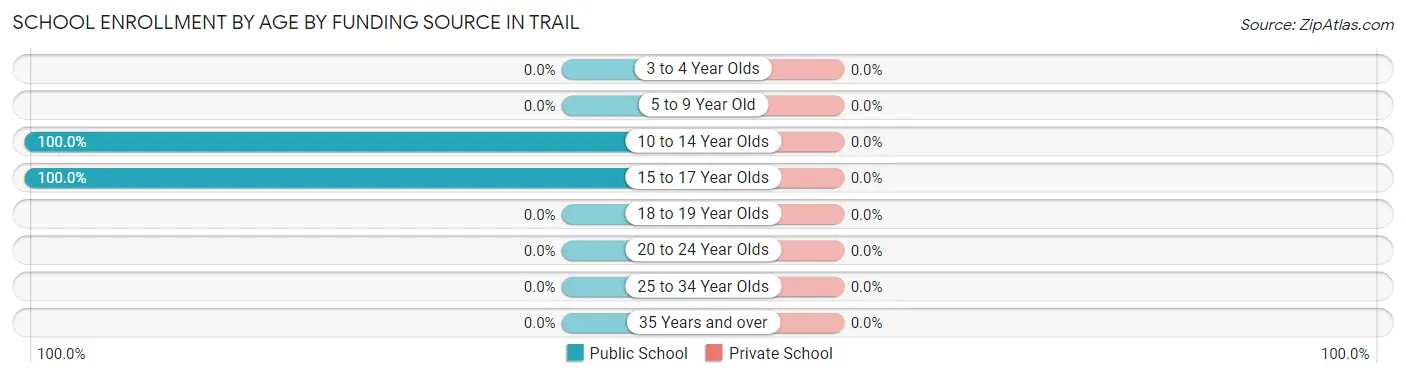
| Age Bracket | Public School | Private School |
| 3 to 4 Year Olds | 0 (0.0%) | 0 (0.0%) |
| 5 to 9 Year Old | 0 (0.0%) | 0 (0.0%) |
| 10 to 14 Year Olds | 19 (100.0%) | 0 (0.0%) |
| 15 to 17 Year Olds | 15 (100.0%) | 0 (0.0%) |
| 18 to 19 Year Olds | 0 (0.0%) | 0 (0.0%) |
| 20 to 24 Year Olds | 0 (0.0%) | 0 (0.0%) |
| 25 to 34 Year Olds | 0 (0.0%) | 0 (0.0%) |
| 35 Years and over | 0 (0.0%) | 0 (0.0%) |
| Total | 34 (100.0%) | 0 (0.0%) |
Educational Attainment by Field of Study in Trail
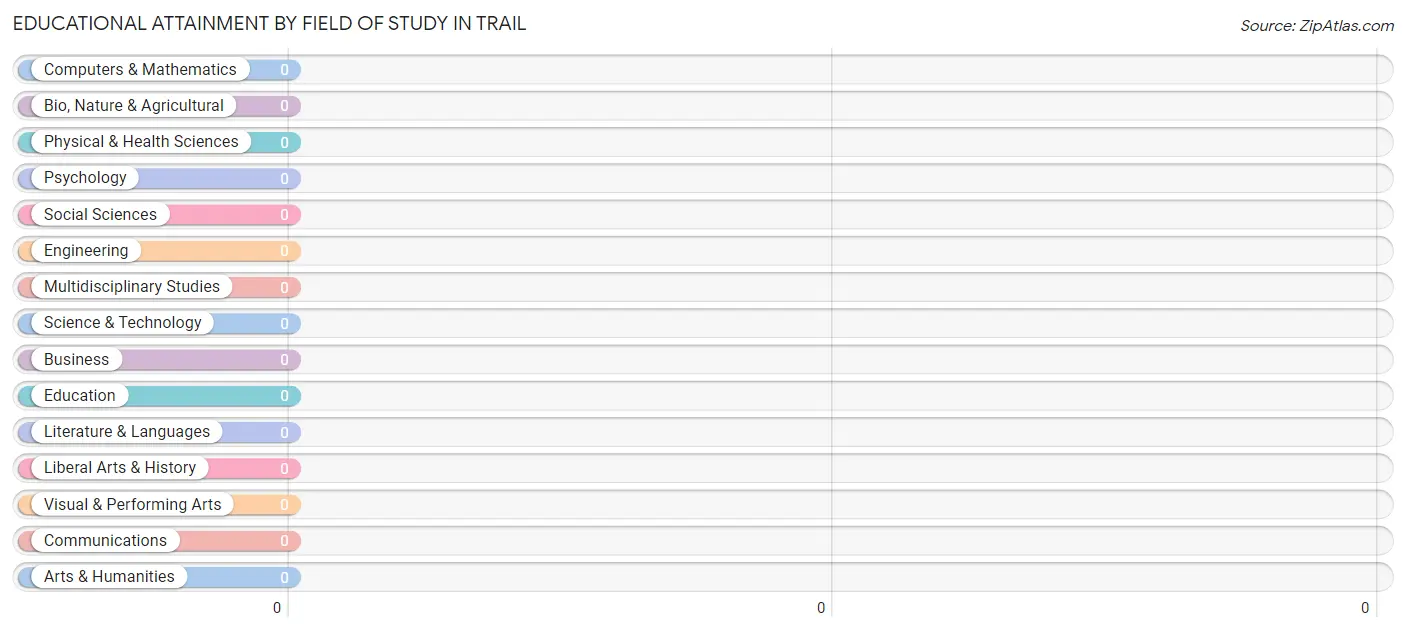
| Field of Study | # Graduates | % Graduates |
| Computers & Mathematics | 0 | 0.0% |
| Bio, Nature & Agricultural | 0 | 0.0% |
| Physical & Health Sciences | 0 | 0.0% |
| Psychology | 0 | 0.0% |
| Social Sciences | 0 | 0.0% |
| Engineering | 0 | 0.0% |
| Multidisciplinary Studies | 0 | 0.0% |
| Science & Technology | 0 | 0.0% |
| Business | 0 | 0.0% |
| Education | 0 | 0.0% |
| Literature & Languages | 0 | 0.0% |
| Liberal Arts & History | 0 | 0.0% |
| Visual & Performing Arts | 0 | 0.0% |
| Communications | 0 | 0.0% |
| Arts & Humanities | 0 | 0.0% |
| Total | 0 | 0.0% |
Transportation & Commute in Trail
Vehicle Availability by Sex in Trail
The most prevalent vehicle ownership categories in Trail are males with 4 vehicles (82, accounting for 73.9%) and females with 4 vehicles (118, making up 48.8%).
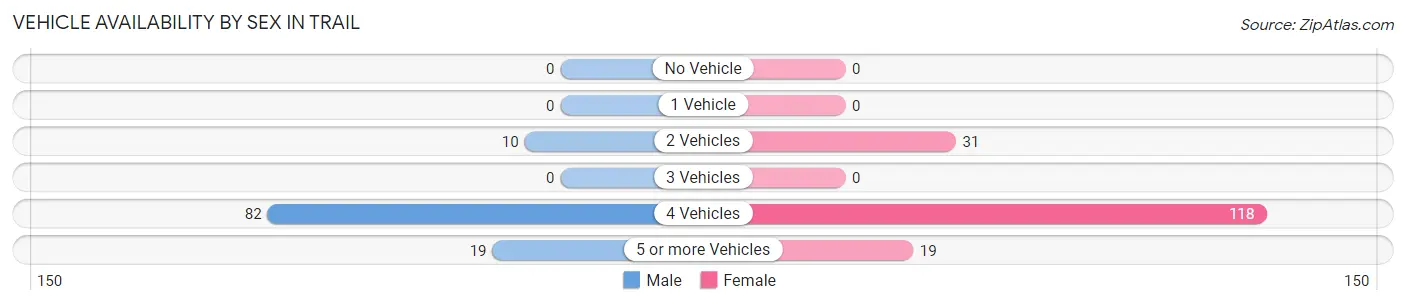
| Vehicles Available | Male | Female |
| No Vehicle | 0 (0.0%) | 0 (0.0%) |
| 1 Vehicle | 0 (0.0%) | 0 (0.0%) |
| 2 Vehicles | 10 (9.0%) | 31 (18.4%) |
| 3 Vehicles | 0 (0.0%) | 0 (0.0%) |
| 4 Vehicles | 82 (73.9%) | 118 (70.2%) |
| 5 or more Vehicles | 19 (17.1%) | 19 (11.3%) |
| Total | 111 (100.0%) | 168 (100.0%) |
Commute Time in Trail
The most frequently occuring commute durations in Trail are 20 to 24 minutes (86 commuters, 30.8%), 35 to 39 minutes (82 commuters, 29.4%), and 10 to 14 minutes (51 commuters, 18.3%).
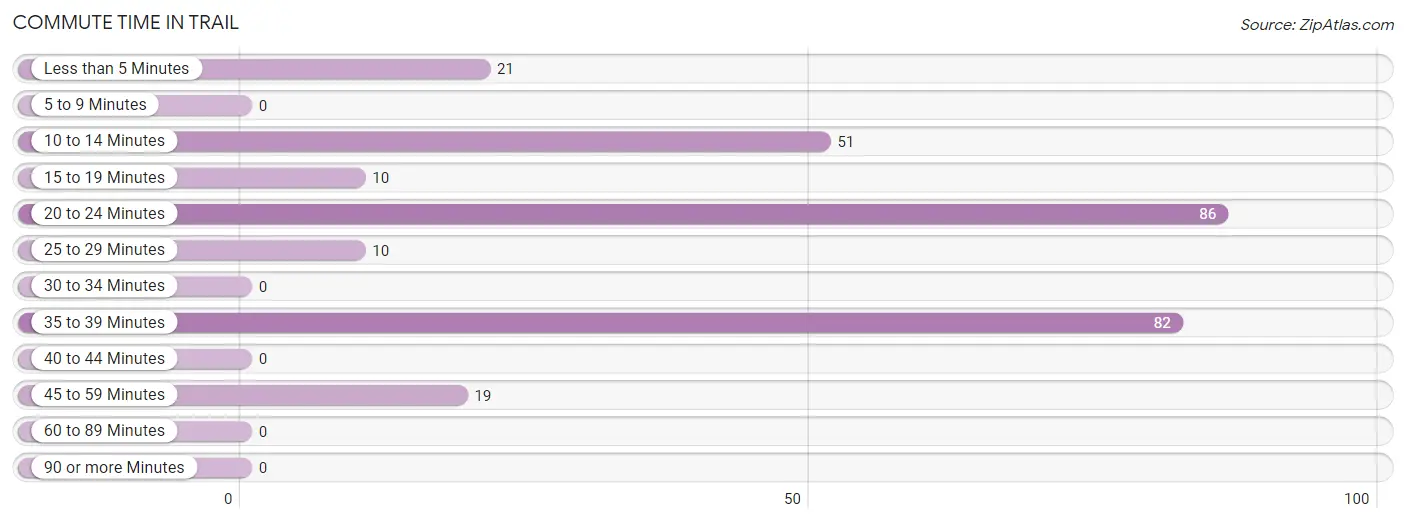
| Commute Time | # Commuters | % Commuters |
| Less than 5 Minutes | 21 | 7.5% |
| 5 to 9 Minutes | 0 | 0.0% |
| 10 to 14 Minutes | 51 | 18.3% |
| 15 to 19 Minutes | 10 | 3.6% |
| 20 to 24 Minutes | 86 | 30.8% |
| 25 to 29 Minutes | 10 | 3.6% |
| 30 to 34 Minutes | 0 | 0.0% |
| 35 to 39 Minutes | 82 | 29.4% |
| 40 to 44 Minutes | 0 | 0.0% |
| 45 to 59 Minutes | 19 | 6.8% |
| 60 to 89 Minutes | 0 | 0.0% |
| 90 or more Minutes | 0 | 0.0% |
Commute Time by Sex in Trail
The most common commute times in Trail are 35 to 39 minutes (82 commuters, 73.9%) for males and 20 to 24 minutes (67 commuters, 39.9%) for females.
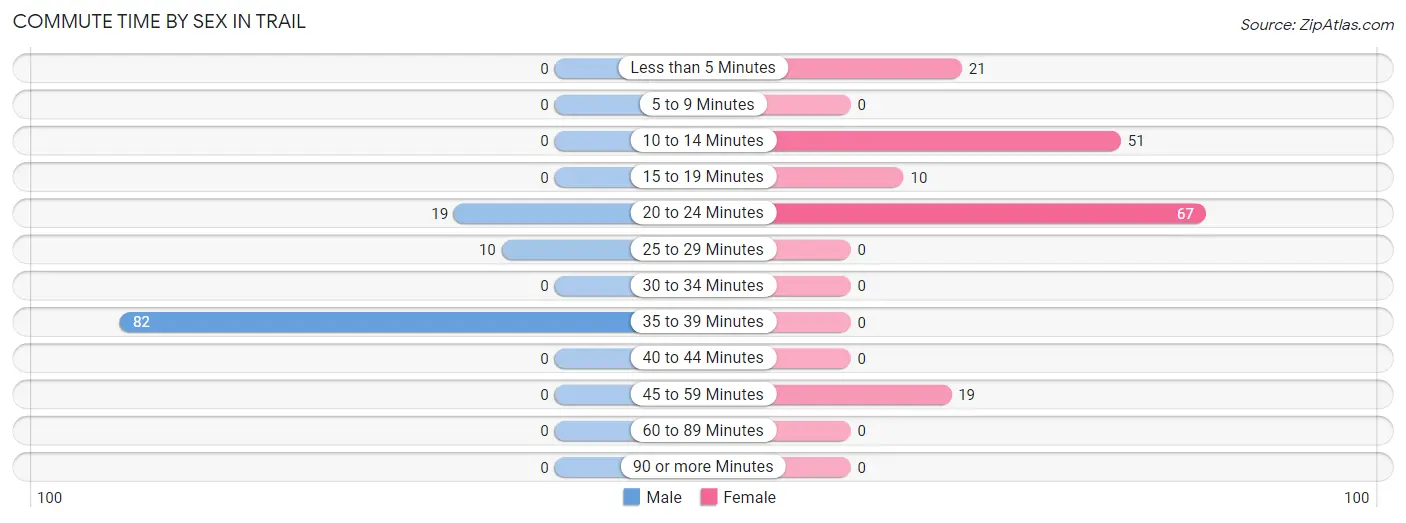
| Commute Time | Male | Female |
| Less than 5 Minutes | 0 (0.0%) | 21 (12.5%) |
| 5 to 9 Minutes | 0 (0.0%) | 0 (0.0%) |
| 10 to 14 Minutes | 0 (0.0%) | 51 (30.4%) |
| 15 to 19 Minutes | 0 (0.0%) | 10 (5.9%) |
| 20 to 24 Minutes | 19 (17.1%) | 67 (39.9%) |
| 25 to 29 Minutes | 10 (9.0%) | 0 (0.0%) |
| 30 to 34 Minutes | 0 (0.0%) | 0 (0.0%) |
| 35 to 39 Minutes | 82 (73.9%) | 0 (0.0%) |
| 40 to 44 Minutes | 0 (0.0%) | 0 (0.0%) |
| 45 to 59 Minutes | 0 (0.0%) | 19 (11.3%) |
| 60 to 89 Minutes | 0 (0.0%) | 0 (0.0%) |
| 90 or more Minutes | 0 (0.0%) | 0 (0.0%) |
Time of Departure to Work by Sex in Trail
The most frequent times of departure to work in Trail are 6:00 AM to 6:29 AM (82, 73.9%) for males and 7:00 AM to 7:29 AM (137, 81.6%) for females.
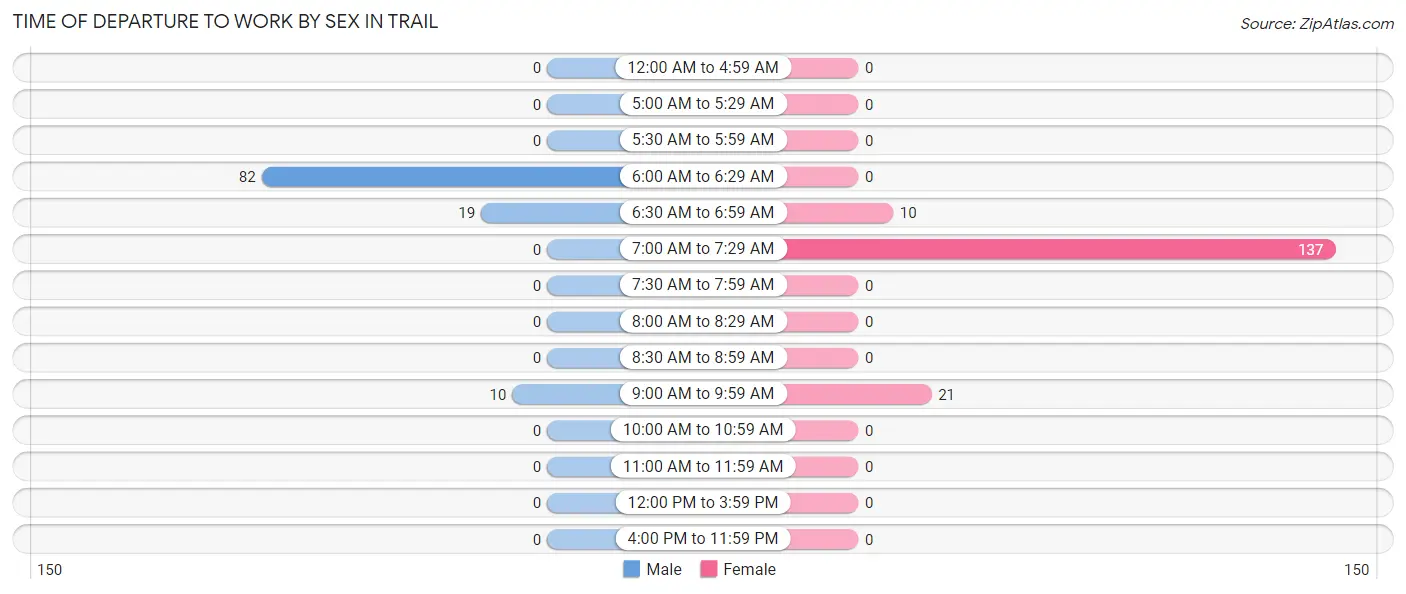
| Time of Departure | Male | Female |
| 12:00 AM to 4:59 AM | 0 (0.0%) | 0 (0.0%) |
| 5:00 AM to 5:29 AM | 0 (0.0%) | 0 (0.0%) |
| 5:30 AM to 5:59 AM | 0 (0.0%) | 0 (0.0%) |
| 6:00 AM to 6:29 AM | 82 (73.9%) | 0 (0.0%) |
| 6:30 AM to 6:59 AM | 19 (17.1%) | 10 (5.9%) |
| 7:00 AM to 7:29 AM | 0 (0.0%) | 137 (81.6%) |
| 7:30 AM to 7:59 AM | 0 (0.0%) | 0 (0.0%) |
| 8:00 AM to 8:29 AM | 0 (0.0%) | 0 (0.0%) |
| 8:30 AM to 8:59 AM | 0 (0.0%) | 0 (0.0%) |
| 9:00 AM to 9:59 AM | 10 (9.0%) | 21 (12.5%) |
| 10:00 AM to 10:59 AM | 0 (0.0%) | 0 (0.0%) |
| 11:00 AM to 11:59 AM | 0 (0.0%) | 0 (0.0%) |
| 12:00 PM to 3:59 PM | 0 (0.0%) | 0 (0.0%) |
| 4:00 PM to 11:59 PM | 0 (0.0%) | 0 (0.0%) |
| Total | 111 (100.0%) | 168 (100.0%) |
Housing Occupancy in Trail
Occupancy by Ownership in Trail
Of the total 291 dwellings in Trail, owner-occupied units account for 271 (93.1%), while renter-occupied units make up 20 (6.9%).
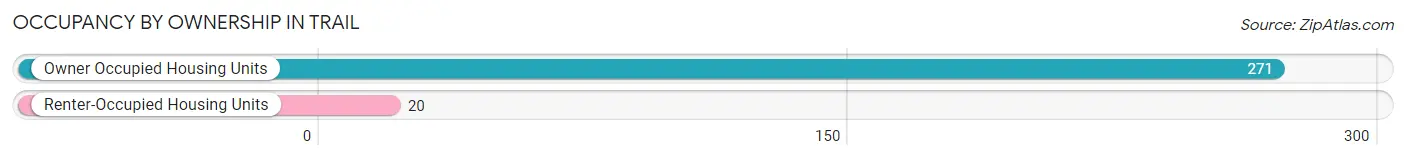
| Occupancy | # Housing Units | % Housing Units |
| Owner Occupied Housing Units | 271 | 93.1% |
| Renter-Occupied Housing Units | 20 | 6.9% |
| Total Occupied Housing Units | 291 | 100.0% |
Occupancy by Household Size in Trail
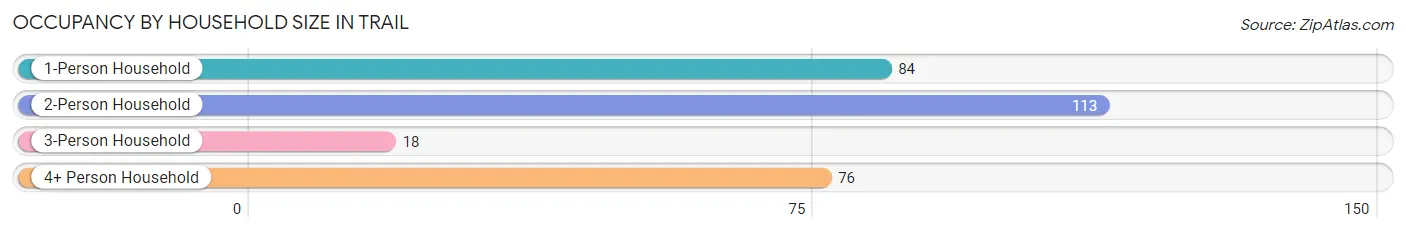
| Household Size | # Housing Units | % Housing Units |
| 1-Person Household | 84 | 28.9% |
| 2-Person Household | 113 | 38.8% |
| 3-Person Household | 18 | 6.2% |
| 4+ Person Household | 76 | 26.1% |
| Total Housing Units | 291 | 100.0% |
Occupancy by Ownership by Household Size in Trail
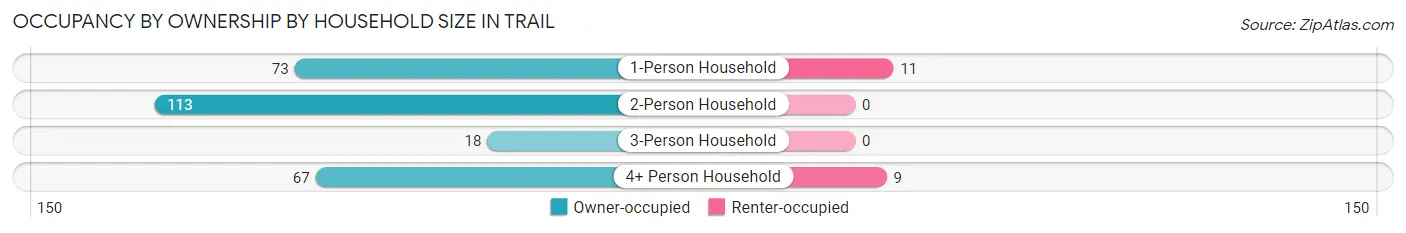
| Household Size | Owner-occupied | Renter-occupied |
| 1-Person Household | 73 (86.9%) | 11 (13.1%) |
| 2-Person Household | 113 (100.0%) | 0 (0.0%) |
| 3-Person Household | 18 (100.0%) | 0 (0.0%) |
| 4+ Person Household | 67 (88.2%) | 9 (11.8%) |
| Total Housing Units | 271 (93.1%) | 20 (6.9%) |
Occupancy by Educational Attainment in Trail
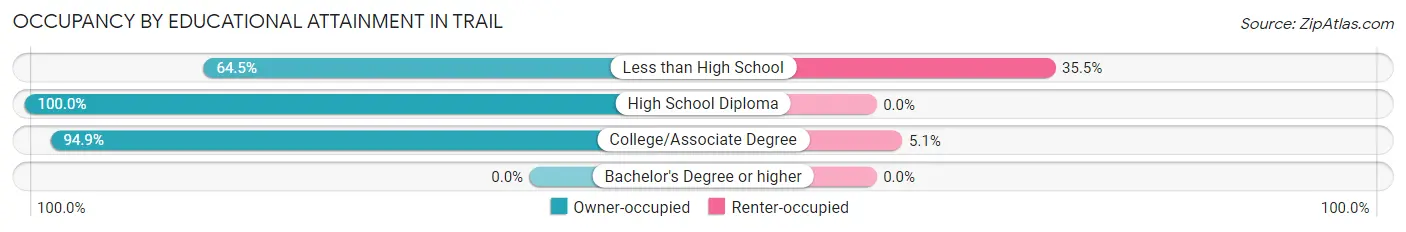
| Household Size | Owner-occupied | Renter-occupied |
| Less than High School | 20 (64.5%) | 11 (35.5%) |
| High School Diploma | 85 (100.0%) | 0 (0.0%) |
| College/Associate Degree | 166 (94.9%) | 9 (5.1%) |
| Bachelor's Degree or higher | 0 (0.0%) | 0 (0.0%) |
Occupancy by Age of Householder in Trail
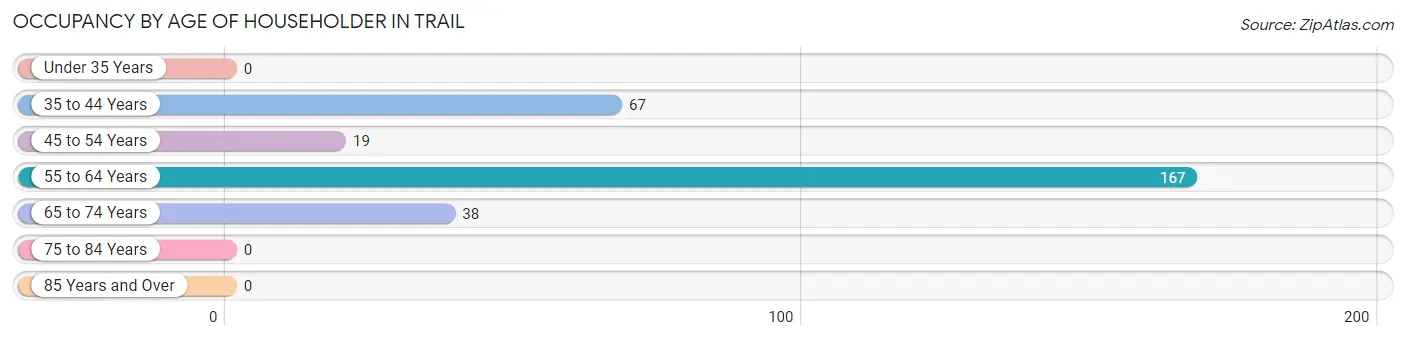
| Age Bracket | # Households | % Households |
| Under 35 Years | 0 | 0.0% |
| 35 to 44 Years | 67 | 23.0% |
| 45 to 54 Years | 19 | 6.5% |
| 55 to 64 Years | 167 | 57.4% |
| 65 to 74 Years | 38 | 13.1% |
| 75 to 84 Years | 0 | 0.0% |
| 85 Years and Over | 0 | 0.0% |
| Total | 291 | 100.0% |
Housing Finances in Trail
Median Income by Occupancy in Trail
| Occupancy Type | # Households | Median Income |
| Owner-Occupied | 271 (93.1%) | $0 |
| Renter-Occupied | 20 (6.9%) | $0 |
| Average | 291 (100.0%) | $0 |
Occupancy by Householder Income Bracket in Trail
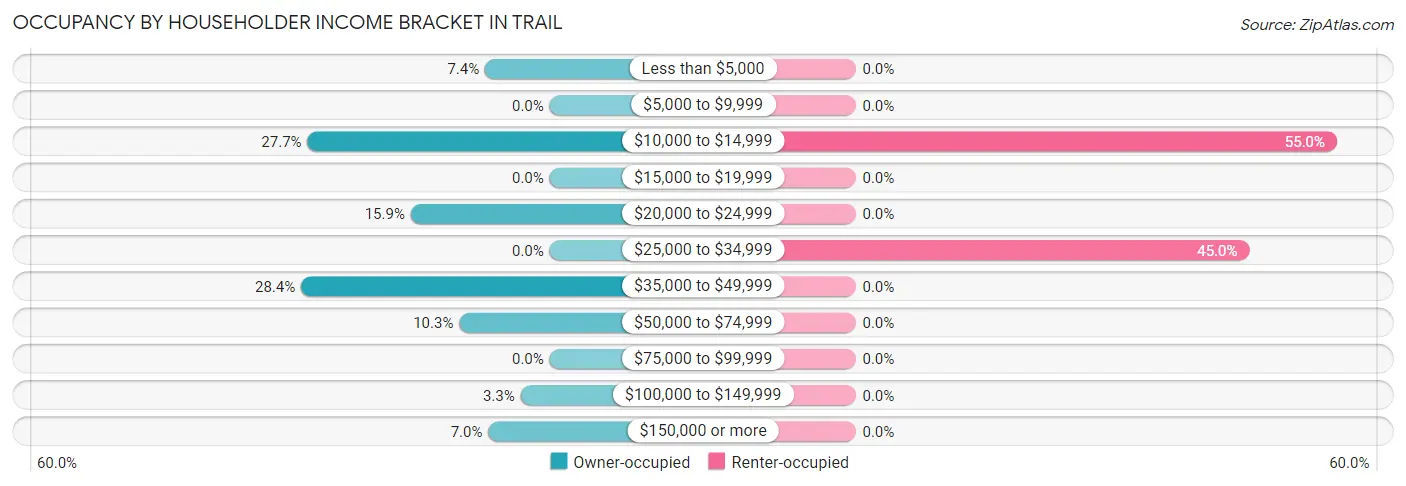
| Income Bracket | Owner-occupied | Renter-occupied |
| Less than $5,000 | 20 (7.4%) | 0 (0.0%) |
| $5,000 to $9,999 | 0 (0.0%) | 0 (0.0%) |
| $10,000 to $14,999 | 75 (27.7%) | 11 (55.0%) |
| $15,000 to $19,999 | 0 (0.0%) | 0 (0.0%) |
| $20,000 to $24,999 | 43 (15.9%) | 0 (0.0%) |
| $25,000 to $34,999 | 0 (0.0%) | 9 (45.0%) |
| $35,000 to $49,999 | 77 (28.4%) | 0 (0.0%) |
| $50,000 to $74,999 | 28 (10.3%) | 0 (0.0%) |
| $75,000 to $99,999 | 0 (0.0%) | 0 (0.0%) |
| $100,000 to $149,999 | 9 (3.3%) | 0 (0.0%) |
| $150,000 or more | 19 (7.0%) | 0 (0.0%) |
| Total | 271 (100.0%) | 20 (100.0%) |
Monthly Housing Cost Tiers in Trail
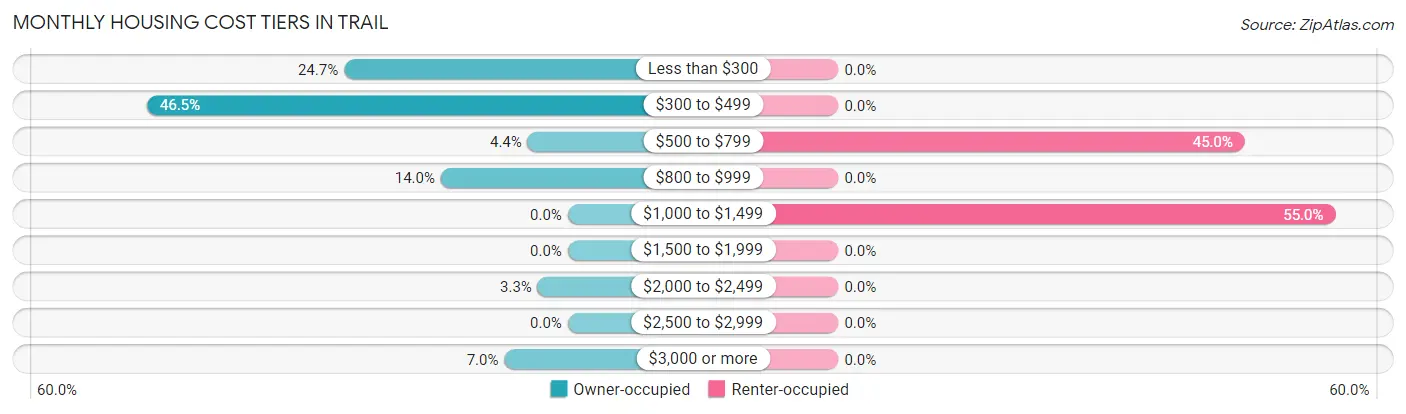
| Monthly Cost | Owner-occupied | Renter-occupied |
| Less than $300 | 67 (24.7%) | 0 (0.0%) |
| $300 to $499 | 126 (46.5%) | 0 (0.0%) |
| $500 to $799 | 12 (4.4%) | 9 (45.0%) |
| $800 to $999 | 38 (14.0%) | 0 (0.0%) |
| $1,000 to $1,499 | 0 (0.0%) | 11 (55.0%) |
| $1,500 to $1,999 | 0 (0.0%) | 0 (0.0%) |
| $2,000 to $2,499 | 9 (3.3%) | 0 (0.0%) |
| $2,500 to $2,999 | 0 (0.0%) | 0 (0.0%) |
| $3,000 or more | 19 (7.0%) | 0 (0.0%) |
| Total | 271 (100.0%) | 20 (100.0%) |
Physical Housing Characteristics in Trail
Housing Structures in Trail
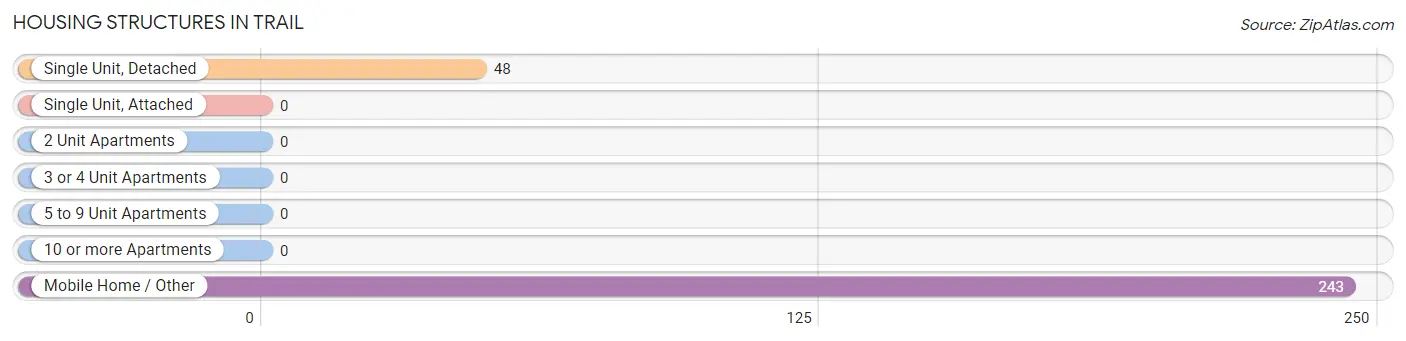
| Structure Type | # Housing Units | % Housing Units |
| Single Unit, Detached | 48 | 16.5% |
| Single Unit, Attached | 0 | 0.0% |
| 2 Unit Apartments | 0 | 0.0% |
| 3 or 4 Unit Apartments | 0 | 0.0% |
| 5 to 9 Unit Apartments | 0 | 0.0% |
| 10 or more Apartments | 0 | 0.0% |
| Mobile Home / Other | 243 | 83.5% |
| Total | 291 | 100.0% |
Housing Structures by Occupancy in Trail
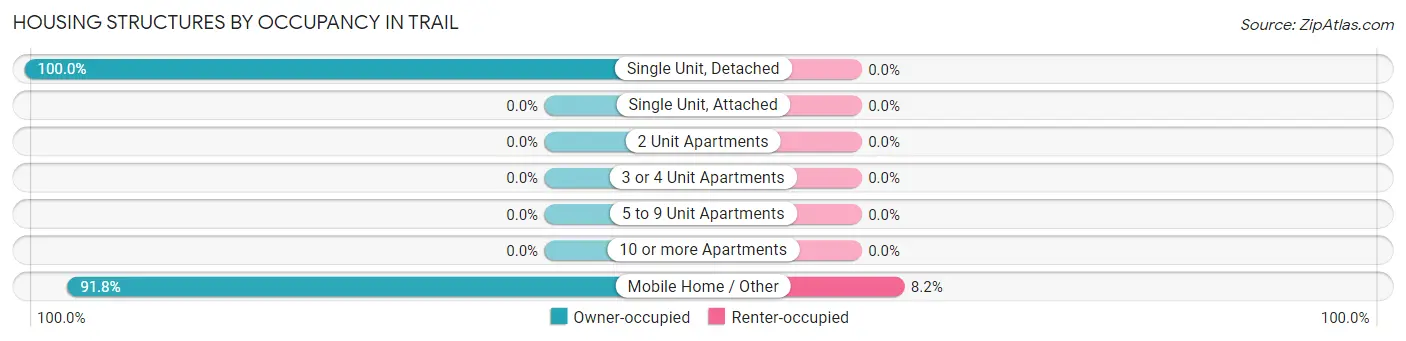
| Structure Type | Owner-occupied | Renter-occupied |
| Single Unit, Detached | 48 (100.0%) | 0 (0.0%) |
| Single Unit, Attached | 0 (0.0%) | 0 (0.0%) |
| 2 Unit Apartments | 0 (0.0%) | 0 (0.0%) |
| 3 or 4 Unit Apartments | 0 (0.0%) | 0 (0.0%) |
| 5 to 9 Unit Apartments | 0 (0.0%) | 0 (0.0%) |
| 10 or more Apartments | 0 (0.0%) | 0 (0.0%) |
| Mobile Home / Other | 223 (91.8%) | 20 (8.2%) |
| Total | 271 (93.1%) | 20 (6.9%) |
Housing Structures by Number of Rooms in Trail
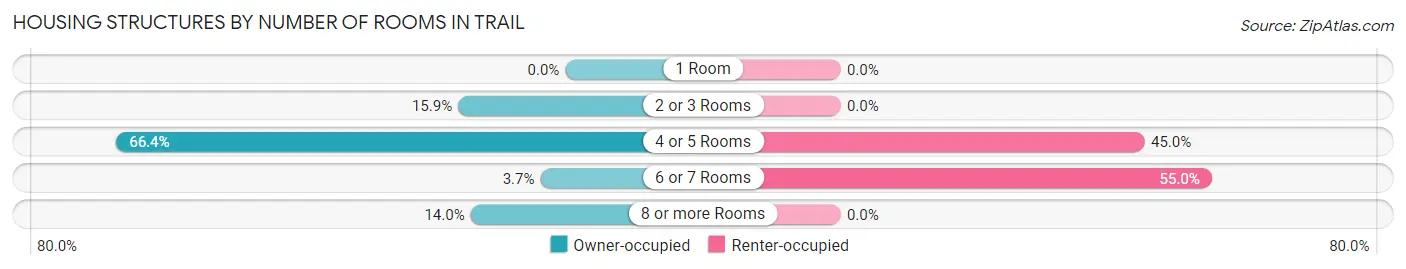
| Number of Rooms | Owner-occupied | Renter-occupied |
| 1 Room | 0 (0.0%) | 0 (0.0%) |
| 2 or 3 Rooms | 43 (15.9%) | 0 (0.0%) |
| 4 or 5 Rooms | 180 (66.4%) | 9 (45.0%) |
| 6 or 7 Rooms | 10 (3.7%) | 11 (55.0%) |
| 8 or more Rooms | 38 (14.0%) | 0 (0.0%) |
| Total | 271 (100.0%) | 20 (100.0%) |
Housing Structure by Heating Type in Trail
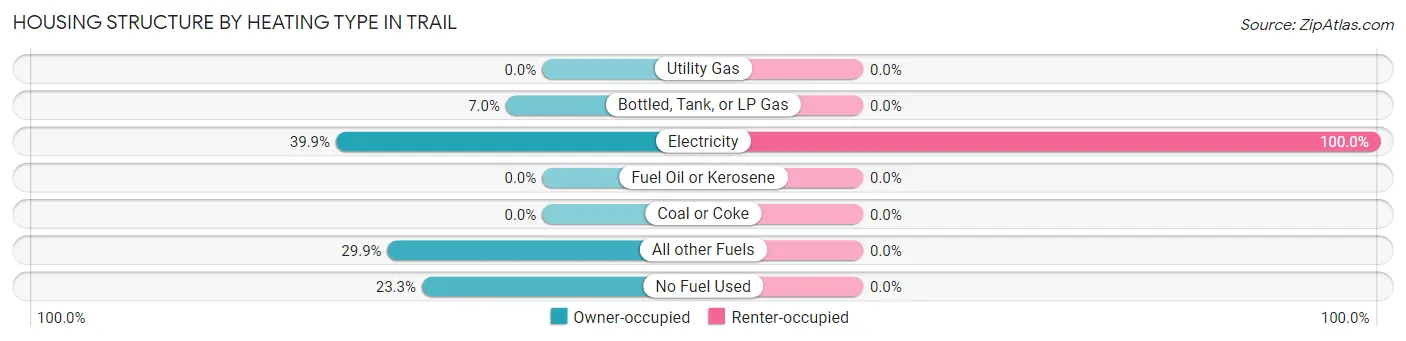
| Heating Type | Owner-occupied | Renter-occupied |
| Utility Gas | 0 (0.0%) | 0 (0.0%) |
| Bottled, Tank, or LP Gas | 19 (7.0%) | 0 (0.0%) |
| Electricity | 108 (39.9%) | 20 (100.0%) |
| Fuel Oil or Kerosene | 0 (0.0%) | 0 (0.0%) |
| Coal or Coke | 0 (0.0%) | 0 (0.0%) |
| All other Fuels | 81 (29.9%) | 0 (0.0%) |
| No Fuel Used | 63 (23.3%) | 0 (0.0%) |
| Total | 271 (100.0%) | 20 (100.0%) |
Household Vehicle Usage in Trail
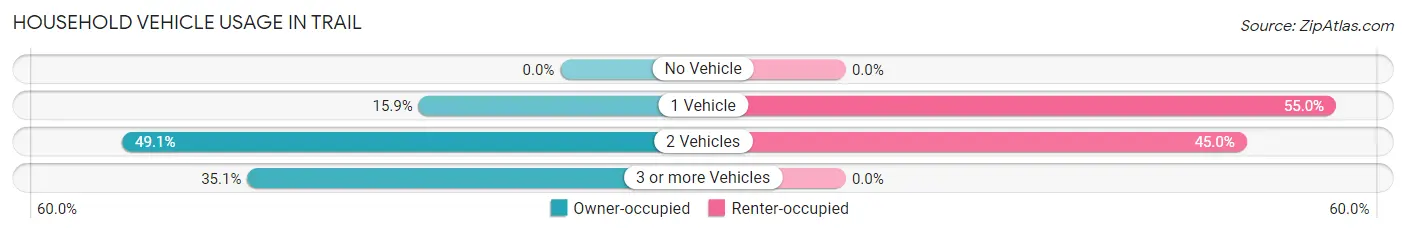
| Vehicles per Household | Owner-occupied | Renter-occupied |
| No Vehicle | 0 (0.0%) | 0 (0.0%) |
| 1 Vehicle | 43 (15.9%) | 11 (55.0%) |
| 2 Vehicles | 133 (49.1%) | 9 (45.0%) |
| 3 or more Vehicles | 95 (35.1%) | 0 (0.0%) |
| Total | 271 (100.0%) | 20 (100.0%) |
Real Estate & Mortgages in Trail
Real Estate and Mortgage Overview in Trail
| Characteristic | Without Mortgage | With Mortgage |
| Housing Units | 215 | 56 |
| Median Property Value | $9,999 | $0 |
| Median Household Income | - | - |
| Monthly Housing Costs | $338 | $19 |
| Real Estate Taxes | $199 | $10 |
Property Value by Mortgage Status in Trail
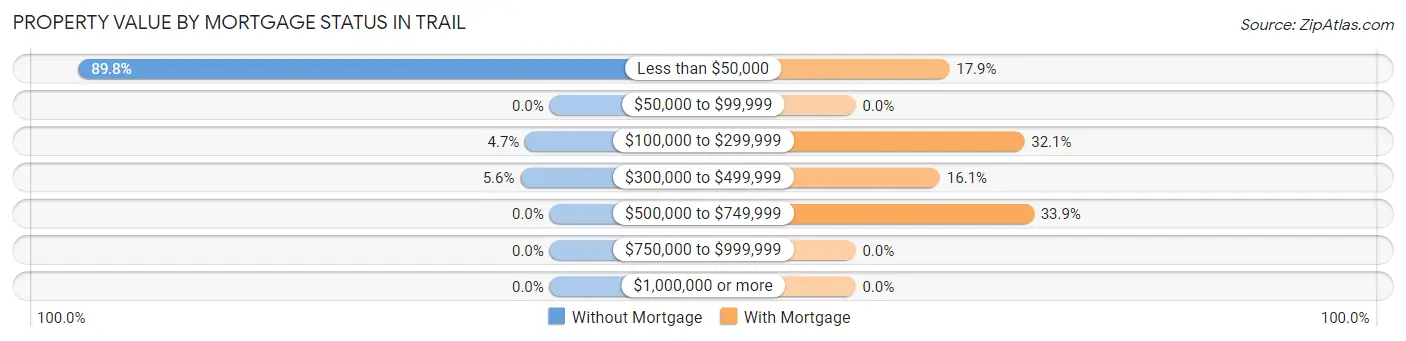
| Property Value | Without Mortgage | With Mortgage |
| Less than $50,000 | 193 (89.8%) | 10 (17.9%) |
| $50,000 to $99,999 | 0 (0.0%) | 0 (0.0%) |
| $100,000 to $299,999 | 10 (4.6%) | 18 (32.1%) |
| $300,000 to $499,999 | 12 (5.6%) | 9 (16.1%) |
| $500,000 to $749,999 | 0 (0.0%) | 19 (33.9%) |
| $750,000 to $999,999 | 0 (0.0%) | 0 (0.0%) |
| $1,000,000 or more | 0 (0.0%) | 0 (0.0%) |
| Total | 215 (100.0%) | 56 (100.0%) |
Household Income by Mortgage Status in Trail
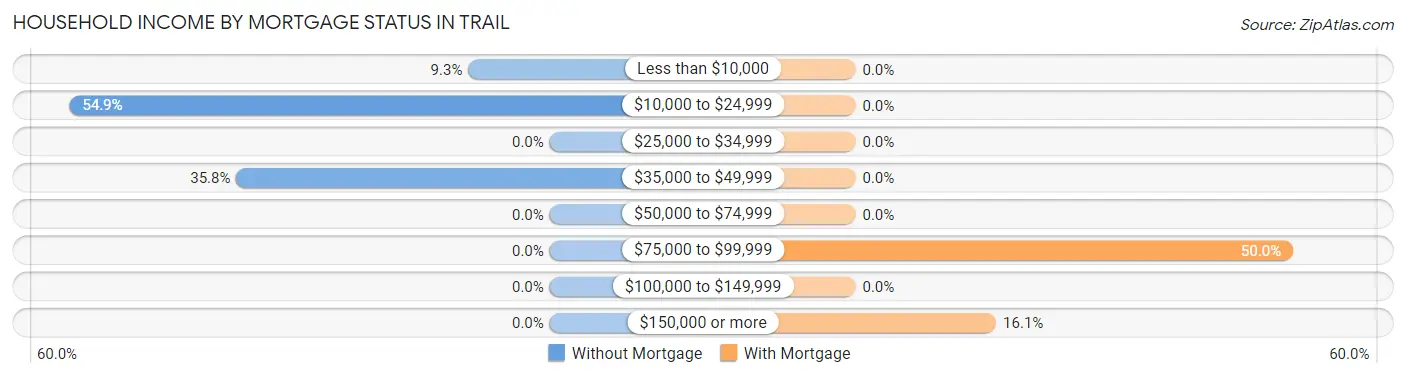
| Household Income | Without Mortgage | With Mortgage |
| Less than $10,000 | 20 (9.3%) | 0 (0.0%) |
| $10,000 to $24,999 | 118 (54.9%) | 0 (0.0%) |
| $25,000 to $34,999 | 0 (0.0%) | 0 (0.0%) |
| $35,000 to $49,999 | 77 (35.8%) | 0 (0.0%) |
| $50,000 to $74,999 | 0 (0.0%) | 0 (0.0%) |
| $75,000 to $99,999 | 0 (0.0%) | 28 (50.0%) |
| $100,000 to $149,999 | 0 (0.0%) | 0 (0.0%) |
| $150,000 or more | 0 (0.0%) | 9 (16.1%) |
| Total | 215 (100.0%) | 56 (100.0%) |
Property Value to Household Income Ratio in Trail
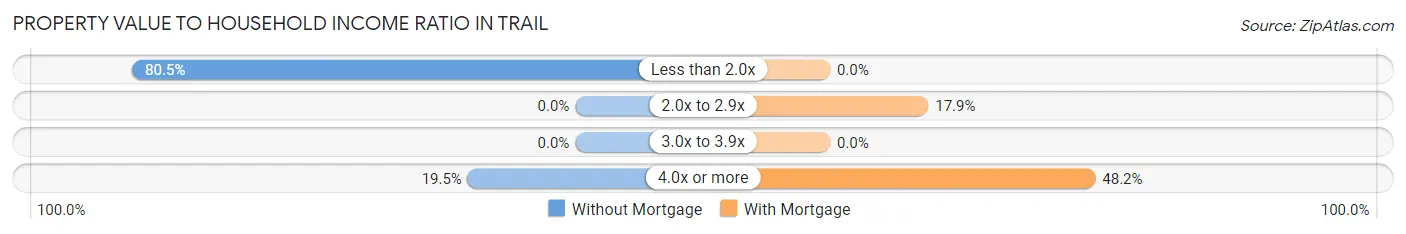
| Value-to-Income Ratio | Without Mortgage | With Mortgage |
| Less than 2.0x | 173 (80.5%) | 0 (0.0%) |
| 2.0x to 2.9x | 0 (0.0%) | 10 (17.9%) |
| 3.0x to 3.9x | 0 (0.0%) | 0 (0.0%) |
| 4.0x or more | 42 (19.5%) | 27 (48.2%) |
| Total | 215 (100.0%) | 56 (100.0%) |
Real Estate Taxes by Mortgage Status in Trail
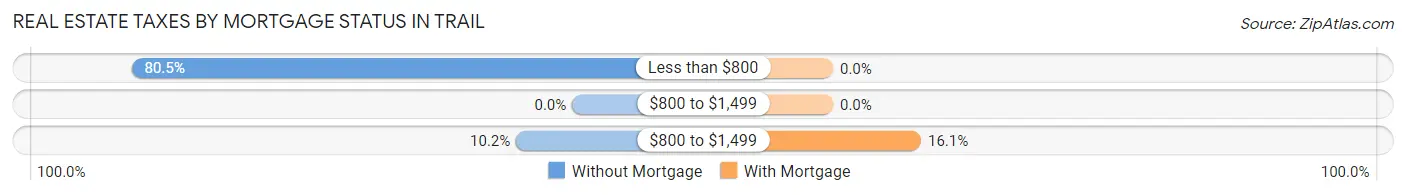
| Property Taxes | Without Mortgage | With Mortgage |
| Less than $800 | 173 (80.5%) | 0 (0.0%) |
| $800 to $1,499 | 0 (0.0%) | 0 (0.0%) |
| $800 to $1,499 | 22 (10.2%) | 9 (16.1%) |
| Total | 215 (100.0%) | 56 (100.0%) |
Health & Disability in Trail
Health Insurance Coverage by Age in Trail
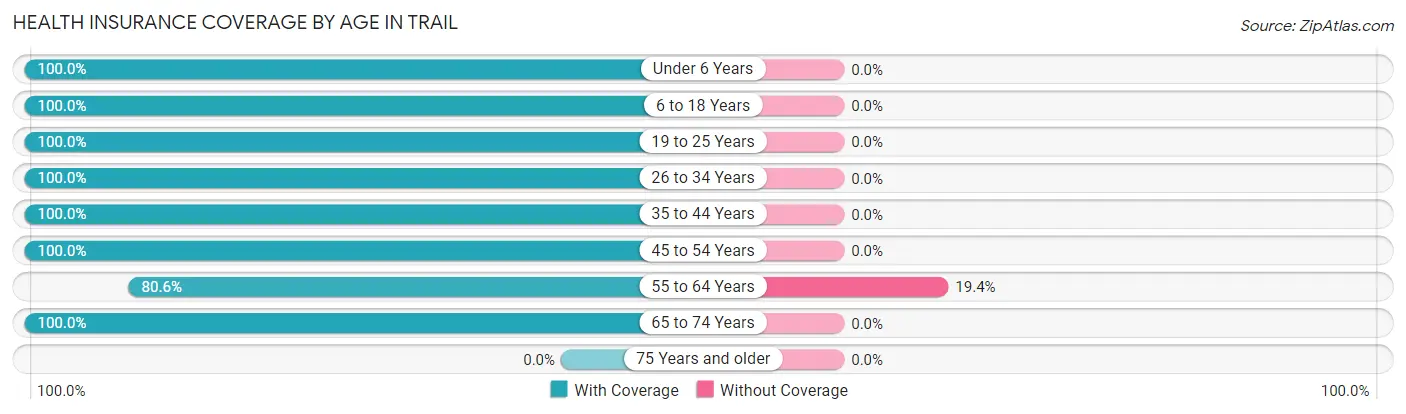
| Age Bracket | With Coverage | Without Coverage |
| Under 6 Years | 41 (100.0%) | 0 (0.0%) |
| 6 to 18 Years | 34 (100.0%) | 0 (0.0%) |
| 19 to 25 Years | 51 (100.0%) | 0 (0.0%) |
| 26 to 34 Years | 19 (100.0%) | 0 (0.0%) |
| 35 to 44 Years | 99 (100.0%) | 0 (0.0%) |
| 45 to 54 Years | 106 (100.0%) | 0 (0.0%) |
| 55 to 64 Years | 191 (80.6%) | 46 (19.4%) |
| 65 to 74 Years | 57 (100.0%) | 0 (0.0%) |
| 75 Years and older | 0 (0.0%) | 0 (0.0%) |
| Total | 598 (92.9%) | 46 (7.1%) |
Health Insurance Coverage by Citizenship Status in Trail
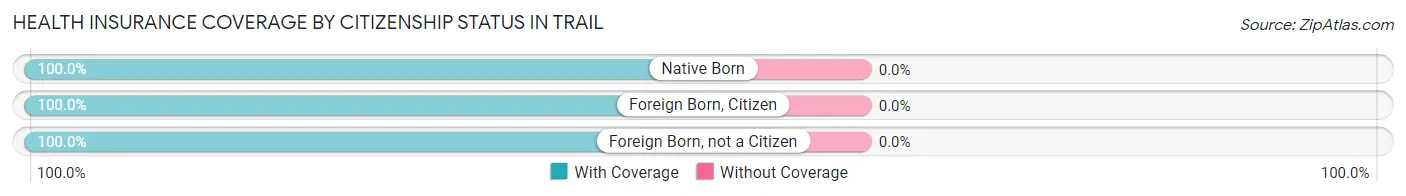
| Citizenship Status | With Coverage | Without Coverage |
| Native Born | 41 (100.0%) | 0 (0.0%) |
| Foreign Born, Citizen | 34 (100.0%) | 0 (0.0%) |
| Foreign Born, not a Citizen | 51 (100.0%) | 0 (0.0%) |
Health Insurance Coverage by Household Income in Trail
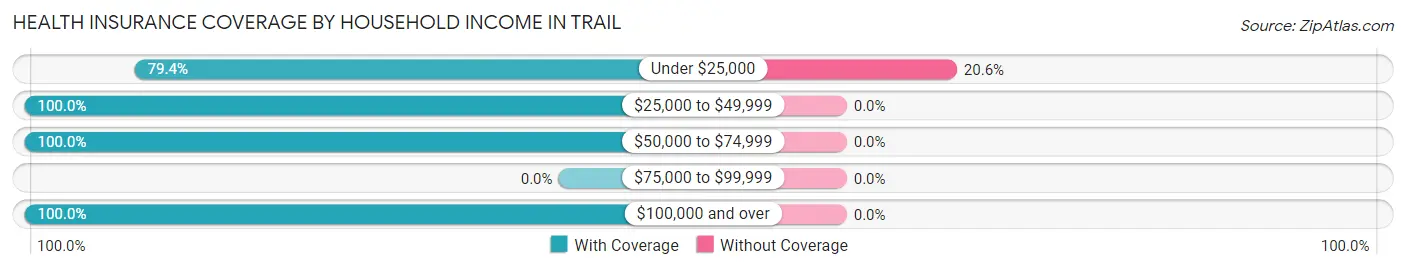
| Household Income | With Coverage | Without Coverage |
| Under $25,000 | 177 (79.4%) | 46 (20.6%) |
| $25,000 to $49,999 | 305 (100.0%) | 0 (0.0%) |
| $50,000 to $74,999 | 64 (100.0%) | 0 (0.0%) |
| $75,000 to $99,999 | 0 (0.0%) | 0 (0.0%) |
| $100,000 and over | 52 (100.0%) | 0 (0.0%) |
Public vs Private Health Insurance Coverage by Age in Trail
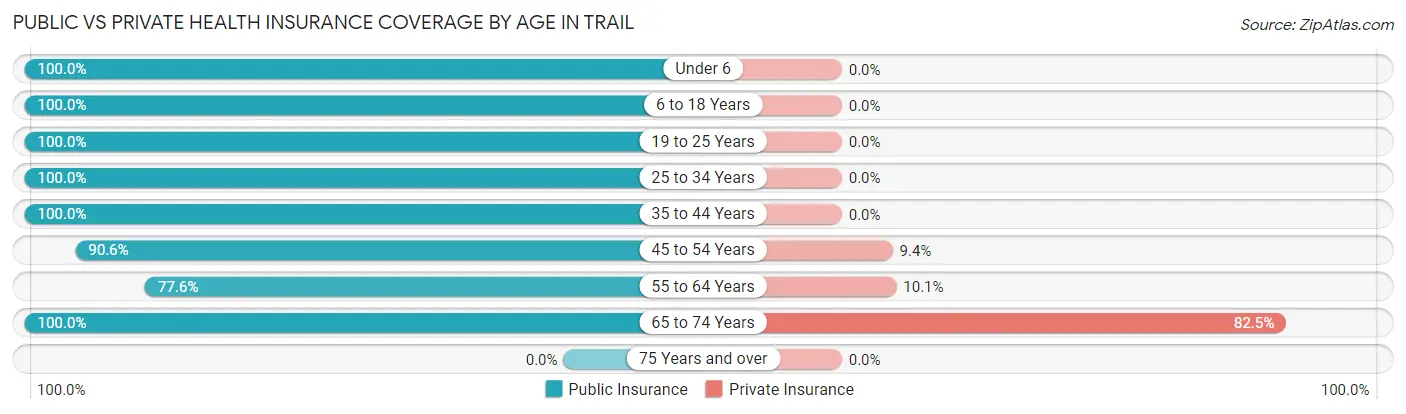
| Age Bracket | Public Insurance | Private Insurance |
| Under 6 | 41 (100.0%) | 0 (0.0%) |
| 6 to 18 Years | 34 (100.0%) | 0 (0.0%) |
| 19 to 25 Years | 51 (100.0%) | 0 (0.0%) |
| 25 to 34 Years | 19 (100.0%) | 0 (0.0%) |
| 35 to 44 Years | 99 (100.0%) | 0 (0.0%) |
| 45 to 54 Years | 96 (90.6%) | 10 (9.4%) |
| 55 to 64 Years | 184 (77.6%) | 24 (10.1%) |
| 65 to 74 Years | 57 (100.0%) | 47 (82.5%) |
| 75 Years and over | 0 (0.0%) | 0 (0.0%) |
| Total | 581 (90.2%) | 81 (12.6%) |
Disability Status by Sex by Age in Trail
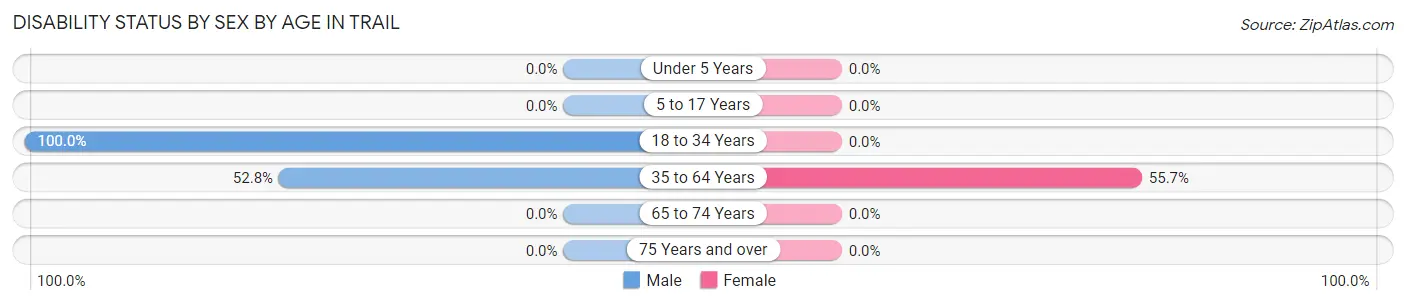
| Age Bracket | Male | Female |
| Under 5 Years | 0 (0.0%) | 0 (0.0%) |
| 5 to 17 Years | 0 (0.0%) | 0 (0.0%) |
| 18 to 34 Years | 19 (100.0%) | 0 (0.0%) |
| 35 to 64 Years | 113 (52.8%) | 127 (55.7%) |
| 65 to 74 Years | 0 (0.0%) | 0 (0.0%) |
| 75 Years and over | 0 (0.0%) | 0 (0.0%) |
Disability Class by Sex by Age in Trail
Disability Class: Hearing Difficulty
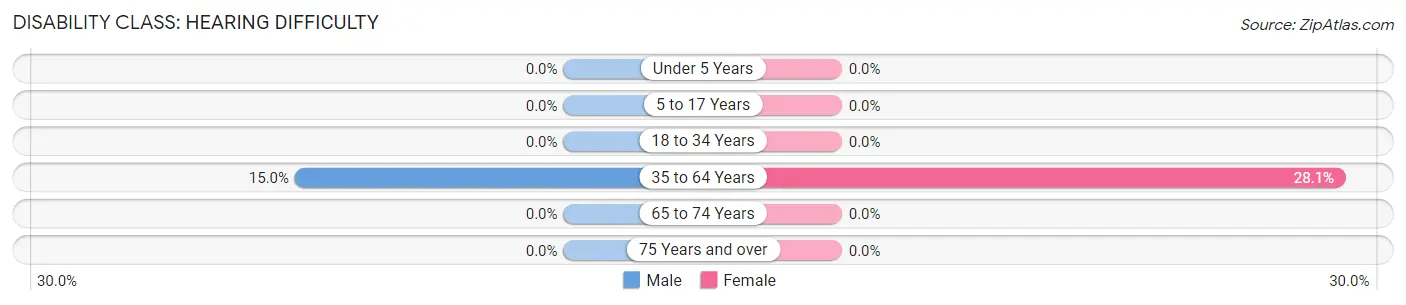
| Age Bracket | Male | Female |
| Under 5 Years | 0 (0.0%) | 0 (0.0%) |
| 5 to 17 Years | 0 (0.0%) | 0 (0.0%) |
| 18 to 34 Years | 0 (0.0%) | 0 (0.0%) |
| 35 to 64 Years | 32 (14.9%) | 64 (28.1%) |
| 65 to 74 Years | 0 (0.0%) | 0 (0.0%) |
| 75 Years and over | 0 (0.0%) | 0 (0.0%) |
Disability Class: Vision Difficulty
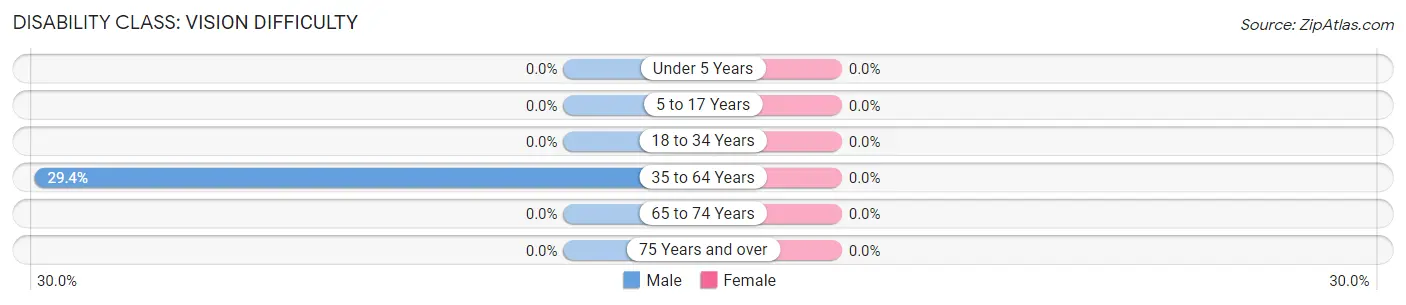
| Age Bracket | Male | Female |
| Under 5 Years | 0 (0.0%) | 0 (0.0%) |
| 5 to 17 Years | 0 (0.0%) | 0 (0.0%) |
| 18 to 34 Years | 0 (0.0%) | 0 (0.0%) |
| 35 to 64 Years | 63 (29.4%) | 0 (0.0%) |
| 65 to 74 Years | 0 (0.0%) | 0 (0.0%) |
| 75 Years and over | 0 (0.0%) | 0 (0.0%) |
Disability Class: Cognitive Difficulty
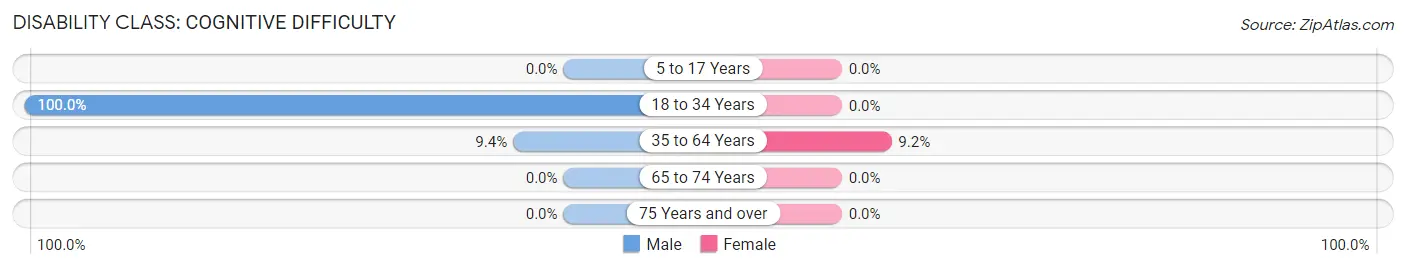
| Age Bracket | Male | Female |
| 5 to 17 Years | 0 (0.0%) | 0 (0.0%) |
| 18 to 34 Years | 19 (100.0%) | 0 (0.0%) |
| 35 to 64 Years | 20 (9.3%) | 21 (9.2%) |
| 65 to 74 Years | 0 (0.0%) | 0 (0.0%) |
| 75 Years and over | 0 (0.0%) | 0 (0.0%) |
Disability Class: Ambulatory Difficulty
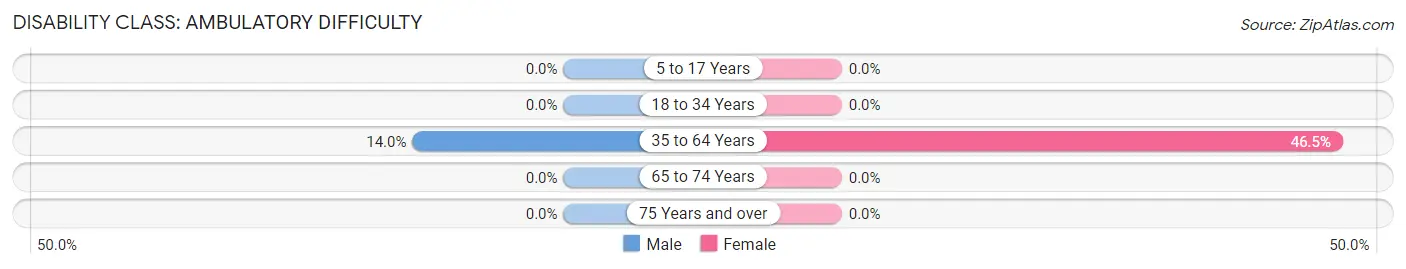
| Age Bracket | Male | Female |
| 5 to 17 Years | 0 (0.0%) | 0 (0.0%) |
| 18 to 34 Years | 0 (0.0%) | 0 (0.0%) |
| 35 to 64 Years | 30 (14.0%) | 106 (46.5%) |
| 65 to 74 Years | 0 (0.0%) | 0 (0.0%) |
| 75 Years and over | 0 (0.0%) | 0 (0.0%) |
Disability Class: Self-Care Difficulty
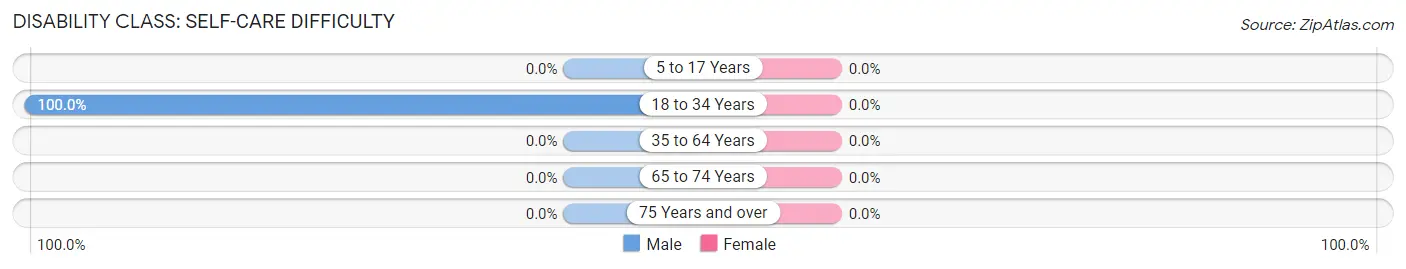
| Age Bracket | Male | Female |
| 5 to 17 Years | 0 (0.0%) | 0 (0.0%) |
| 18 to 34 Years | 19 (100.0%) | 0 (0.0%) |
| 35 to 64 Years | 0 (0.0%) | 0 (0.0%) |
| 65 to 74 Years | 0 (0.0%) | 0 (0.0%) |
| 75 Years and over | 0 (0.0%) | 0 (0.0%) |
Technology Access in Trail
Computing Device Access in Trail
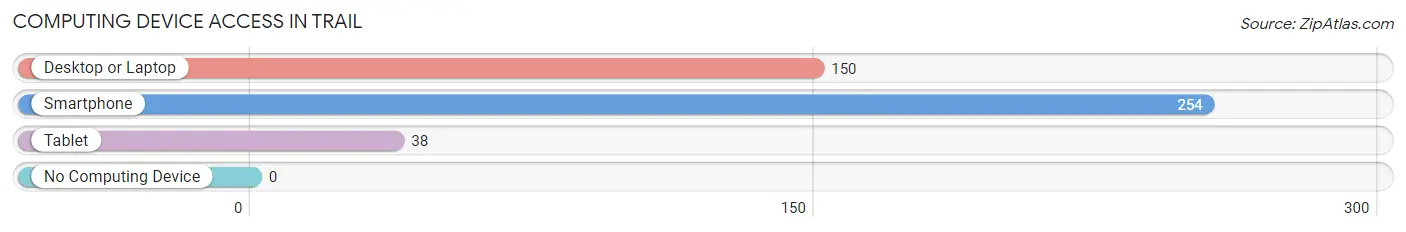
| Device Type | # Households | % Households |
| Desktop or Laptop | 150 | 51.5% |
| Smartphone | 254 | 87.3% |
| Tablet | 38 | 13.1% |
| No Computing Device | 0 | 0.0% |
| Total | 291 | 100.0% |
Internet Access in Trail
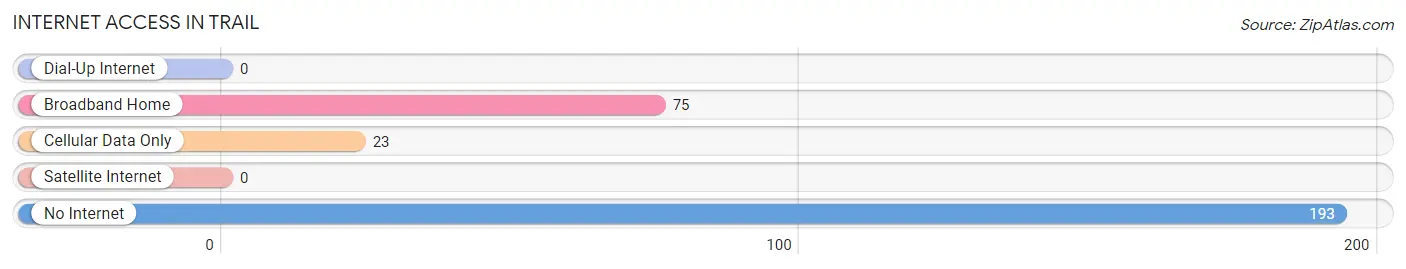
| Internet Type | # Households | % Households |
| Dial-Up Internet | 0 | 0.0% |
| Broadband Home | 75 | 25.8% |
| Cellular Data Only | 23 | 7.9% |
| Satellite Internet | 0 | 0.0% |
| No Internet | 193 | 66.3% |
| Total | 291 | 100.0% |
Trail Summary
History
The city of Bend, Oregon is located in the high desert of Central Oregon, and is the county seat of Deschutes County. The area was originally inhabited by the Northern Paiute and Warm Springs tribes, who were drawn to the area for its abundance of natural resources. The first non-native settlers arrived in the area in the late 1800s, and the city of Bend was officially incorporated in 1905.
The city of Bend was originally founded as a logging town, and the timber industry was the primary source of employment for the early settlers. The city quickly grew, and by the 1920s, Bend was the largest city in Central Oregon. The timber industry continued to be the primary source of employment for the city until the 1970s, when the industry began to decline.
In the late 1970s, Bend began to transition away from its reliance on the timber industry, and began to focus on tourism and recreation. The city was able to capitalize on its natural beauty and outdoor recreation opportunities, and Bend quickly became a popular destination for outdoor enthusiasts. The city has continued to grow and develop since then, and today Bend is a thriving city with a diverse economy.
Geography
Bend is located in the high desert of Central Oregon, and is situated at the base of the Cascade Mountains. The city is located at an elevation of 3,623 feet, and is surrounded by the Deschutes National Forest. The city is located on the Deschutes River, and is bordered by the Deschutes River to the north, the Crooked River to the east, and the Little Deschutes River to the south.
The city of Bend covers an area of approximately 33 square miles, and is located approximately 100 miles east of Eugene, Oregon. The city is located in a semi-arid climate, and experiences hot summers and cold winters. The average annual precipitation in Bend is approximately 11 inches, and the average annual temperature is approximately 50 degrees Fahrenheit.
Economy
The economy of Bend is diverse and includes a variety of industries. The city is home to a number of large employers, including St. Charles Health System, Deschutes Brewery, and Bend Research. The city is also home to a number of smaller businesses, including restaurants, retail stores, and service providers.
The city of Bend is also a popular tourist destination, and tourism is a major contributor to the local economy. The city is home to a number of attractions, including the High Desert Museum, the Deschutes National Forest, and the Cascade Lakes National Scenic Byway. The city also hosts a number of annual events, including the Bend Brewfest and the Bend Summer Festival.
Demographics
As of the 2020 census, the city of Bend had a population of 91,122. The population of Bend is diverse, and the city is home to a variety of ethnic and racial groups. The largest racial group in Bend is White (77.2%), followed by Hispanic or Latino (10.2%), Asian (4.2%), and African American (2.7%).
The median household income in Bend is $60,945, and the median home value is $372,400. The city has a high rate of homeownership, with approximately 70% of residents owning their own homes. The city also has a high rate of educational attainment, with approximately 90% of residents having at least a high school diploma.
Common Questions
What is Per Capita Income in Trail?
Per Capita income in Trail is $17,325.
What is the Median Family Income in Trail?
Median Family Income in Trail is $39,030.
What is Income or Wage Gap in Trail?
Income or Wage Gap in Trail is 9.6%.
Women in Trail earn 90.4 cents for every dollar earned by a man.
What is Inequality or Gini Index in Trail?
Inequality or Gini Index in Trail is 0.51.
What is the Total Population of Trail?
Total Population of Trail is 644.
What is the Total Male Population of Trail?
Total Male Population of Trail is 276.
What is the Total Female Population of Trail?
Total Female Population of Trail is 368.
What is the Ratio of Males per 100 Females in Trail?
There are 75.00 Males per 100 Females in Trail.
What is the Ratio of Females per 100 Males in Trail?
There are 133.33 Females per 100 Males in Trail.
What is the Median Population Age in Trail?
Median Population Age in Trail is 48.8 Years.
What is the Average Family Size in Trail
Average Family Size in Trail is 2.9 People.
What is the Average Household Size in Trail
Average Household Size in Trail is 2.2 People.
How Large is the Labor Force in Trail?
There are 299 People in the Labor Forcein in Trail.
What is the Percentage of People in the Labor Force in Trail?
52.5% of People are in the Labor Force in Trail.
What is the Unemployment Rate in Trail?
Unemployment Rate in Trail is 6.7%.