Lafayette, OR Map & Demographics
Lafayette Map
Lafayette Overview
$32,364
PER CAPITA INCOME
$95,292
AVG FAMILY INCOME
$93,243
AVG HOUSEHOLD INCOME
4.9%
WAGE / INCOME GAP [ % ]
95.1¢/ $1
WAGE / INCOME GAP [ $ ]
0.33
INEQUALITY / GINI INDEX
4,391
TOTAL POPULATION
2,327
MALE POPULATION
2,064
FEMALE POPULATION
112.74
MALES / 100 FEMALES
88.70
FEMALES / 100 MALES
34.0
MEDIAN AGE
3.4
AVG FAMILY SIZE
3.0
AVG HOUSEHOLD SIZE
2,429
LABOR FORCE [ PEOPLE ]
72.8%
PERCENT IN LABOR FORCE
4.7%
UNEMPLOYMENT RATE
Lafayette Zip Codes
Lafayette Area Codes
Income in Lafayette
Income Overview in Lafayette
Per Capita Income in Lafayette is $32,364, while median incomes of families and households are $95,292 and $93,243 respectively.
| Characteristic | Number | Measure |
| Per Capita Income | 4,391 | $32,364 |
| Median Family Income | 1,059 | $95,292 |
| Mean Family Income | 1,059 | $105,628 |
| Median Household Income | 1,440 | $93,243 |
| Mean Household Income | 1,440 | $95,263 |
| Income Deficit | 1,059 | $0 |
| Wage / Income Gap (%) | 4,391 | 4.88% |
| Wage / Income Gap ($) | 4,391 | 95.12¢ per $1 |
| Gini / Inequality Index | 4,391 | 0.33 |
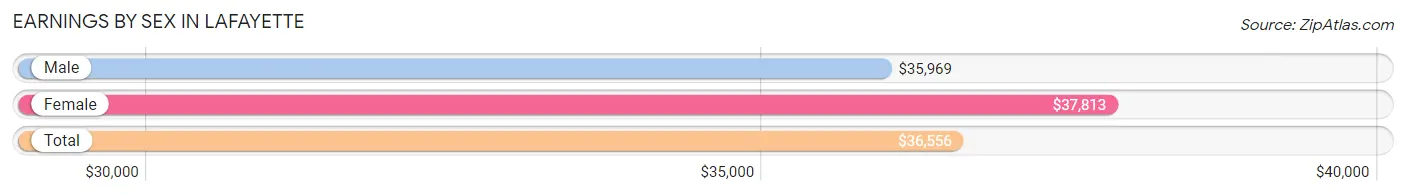
Earnings by Sex in Lafayette
Average Earnings in Lafayette are $36,556, $35,969 for men and $37,813 for women, a difference of 4.9%.
| Sex | Number | Average Earnings |
| Male | 1,448 (57.3%) | $35,969 |
| Female | 1,081 (42.7%) | $37,813 |
| Total | 2,529 (100.0%) | $36,556 |
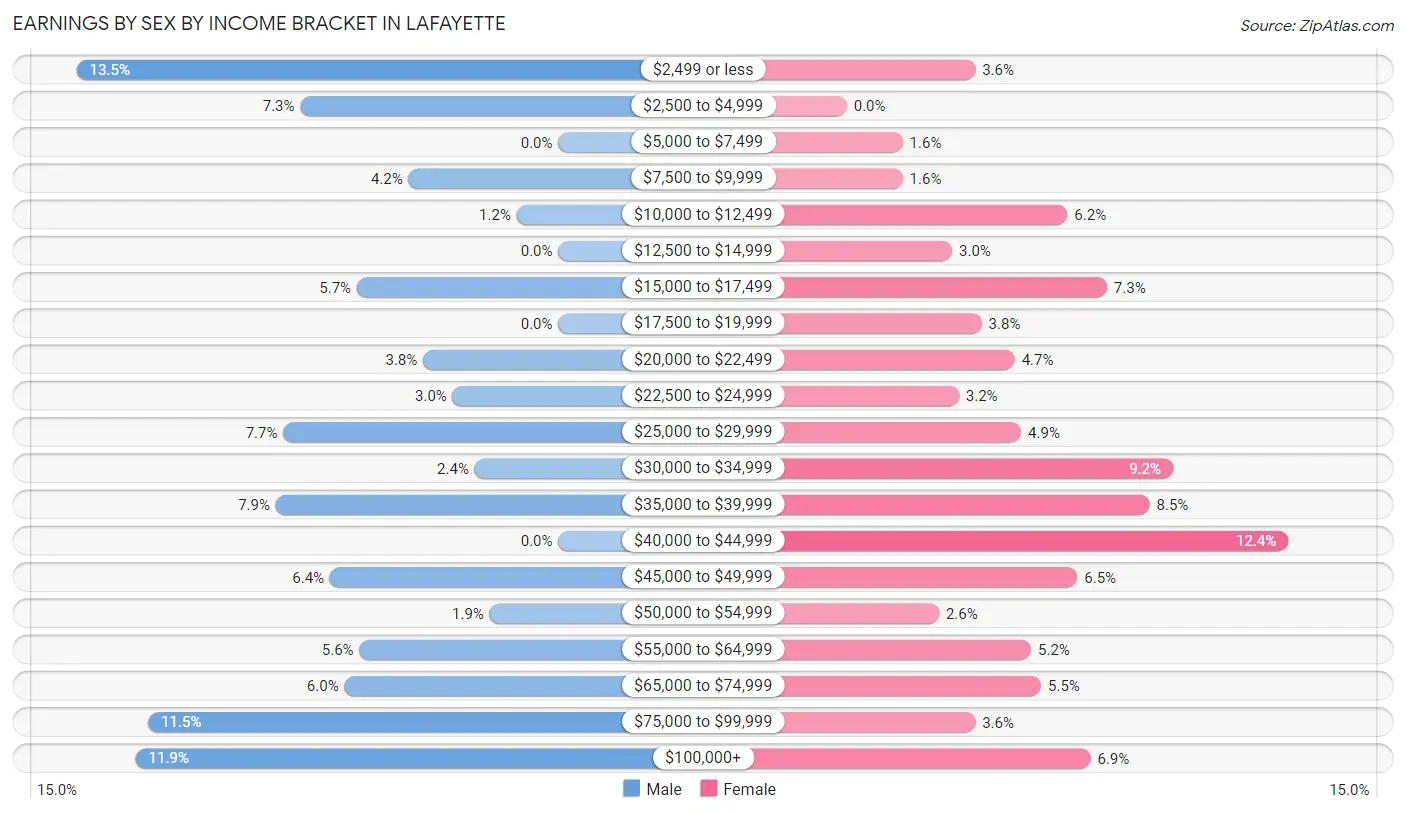
Earnings by Sex by Income Bracket in Lafayette
The most common earnings brackets in Lafayette are $2,499 or less for men (196 | 13.5%) and $40,000 to $44,999 for women (134 | 12.4%).
| Income | Male | Female |
| $2,499 or less | 196 (13.5%) | 39 (3.6%) |
| $2,500 to $4,999 | 105 (7.2%) | 0 (0.0%) |
| $5,000 to $7,499 | 0 (0.0%) | 17 (1.6%) |
| $7,500 to $9,999 | 61 (4.2%) | 17 (1.6%) |
| $10,000 to $12,499 | 17 (1.2%) | 67 (6.2%) |
| $12,500 to $14,999 | 0 (0.0%) | 32 (3.0%) |
| $15,000 to $17,499 | 82 (5.7%) | 79 (7.3%) |
| $17,500 to $19,999 | 0 (0.0%) | 41 (3.8%) |
| $20,000 to $22,499 | 55 (3.8%) | 51 (4.7%) |
| $22,500 to $24,999 | 43 (3.0%) | 34 (3.2%) |
| $25,000 to $29,999 | 112 (7.7%) | 53 (4.9%) |
| $30,000 to $34,999 | 34 (2.4%) | 99 (9.2%) |
| $35,000 to $39,999 | 115 (7.9%) | 92 (8.5%) |
| $40,000 to $44,999 | 0 (0.0%) | 134 (12.4%) |
| $45,000 to $49,999 | 93 (6.4%) | 70 (6.5%) |
| $50,000 to $54,999 | 28 (1.9%) | 28 (2.6%) |
| $55,000 to $64,999 | 81 (5.6%) | 56 (5.2%) |
| $65,000 to $74,999 | 87 (6.0%) | 59 (5.5%) |
| $75,000 to $99,999 | 167 (11.5%) | 39 (3.6%) |
| $100,000+ | 172 (11.9%) | 74 (6.9%) |
| Total | 1,448 (100.0%) | 1,081 (100.0%) |
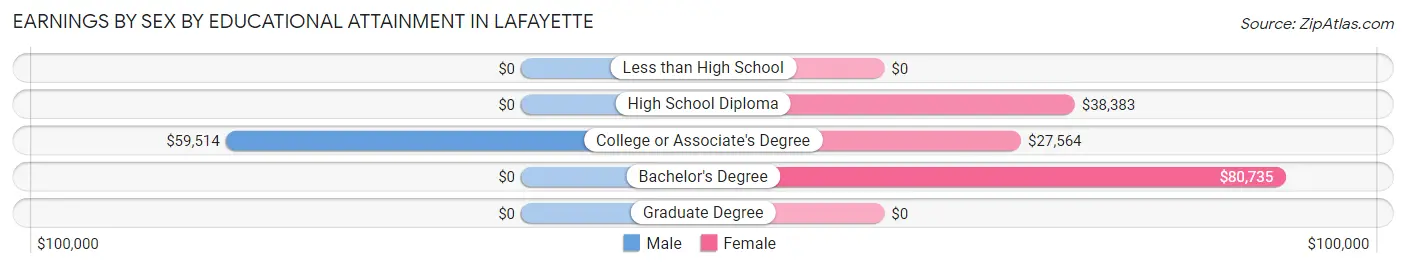
Earnings by Sex by Educational Attainment in Lafayette
Average earnings in Lafayette are $45,175 for men and $39,321 for women, a difference of 13.0%. Men with an educational attainment of college or associate's degree enjoy the highest average annual earnings of $59,514, while those with college or associate's degree education earn the least with $59,514. Women with an educational attainment of bachelor's degree earn the most with the average annual earnings of $80,735, while those with college or associate's degree education have the smallest earnings of $27,564.
| Educational Attainment | Male Income | Female Income |
| Less than High School | - | - |
| High School Diploma | - | - |
| College or Associate's Degree | $59,514 | $27,564 |
| Bachelor's Degree | - | - |
| Graduate Degree | - | - |
| Total | $45,175 | $39,321 |
Family Income in Lafayette
Family Income Brackets in Lafayette
According to the Lafayette family income data, there are 330 families falling into the $100,000 to $149,999 income range, which is the most common income bracket and makes up 31.2% of all families.
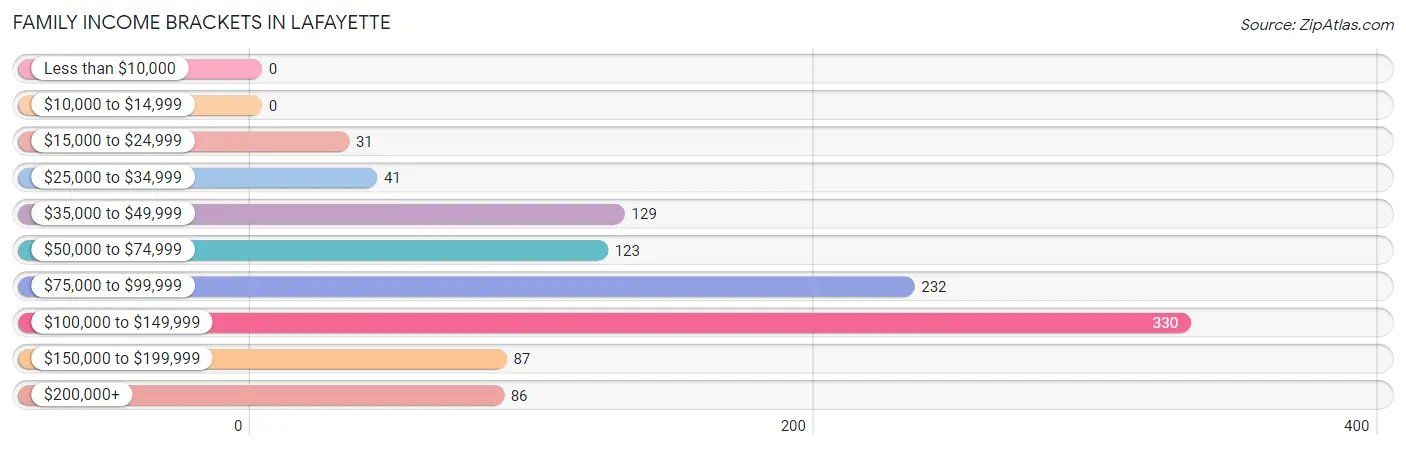
| Income Bracket | # Families | % Families |
| Less than $10,000 | 0 | 0.0% |
| $10,000 to $14,999 | 0 | 0.0% |
| $15,000 to $24,999 | 31 | 2.9% |
| $25,000 to $34,999 | 41 | 3.9% |
| $35,000 to $49,999 | 129 | 12.2% |
| $50,000 to $74,999 | 123 | 11.6% |
| $75,000 to $99,999 | 232 | 21.9% |
| $100,000 to $149,999 | 330 | 31.2% |
| $150,000 to $199,999 | 87 | 8.2% |
| $200,000+ | 86 | 8.1% |
Family Income by Famaliy Size in Lafayette
4-person families (282 | 26.6%) account for the highest median family income in Lafayette with $117,955 per family, while 2-person families (317 | 29.9%) have the highest median income of $48,438 per family member.
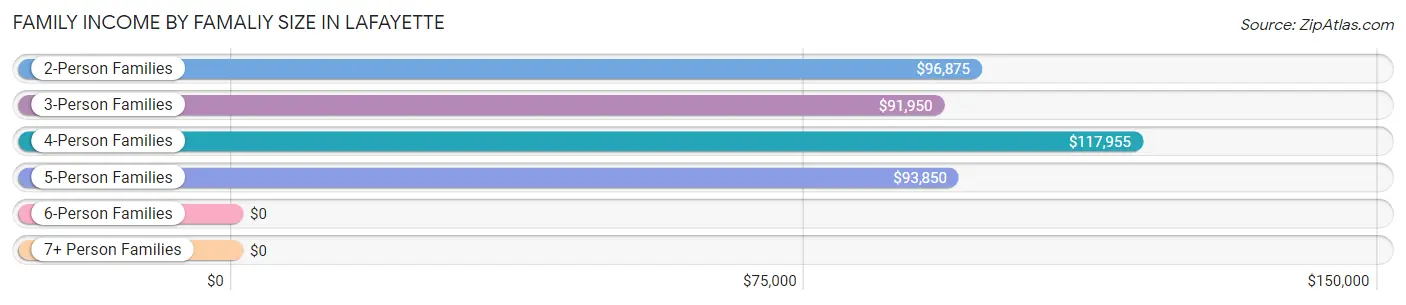
| Income Bracket | # Families | Median Income |
| 2-Person Families | 317 (29.9%) | $96,875 |
| 3-Person Families | 297 (28.1%) | $91,950 |
| 4-Person Families | 282 (26.6%) | $117,955 |
| 5-Person Families | 121 (11.4%) | $93,850 |
| 6-Person Families | 42 (4.0%) | $0 |
| 7+ Person Families | 0 (0.0%) | $0 |
| Total | 1,059 (100.0%) | $95,292 |
Family Income by Number of Earners in Lafayette
The median family income in Lafayette is $95,292, with families comprising 2 earners (426) having the highest median family income of $107,222, while families with no earners (98) have the lowest median family income of $52,250, accounting for 40.2% and 9.2% of families, respectively.
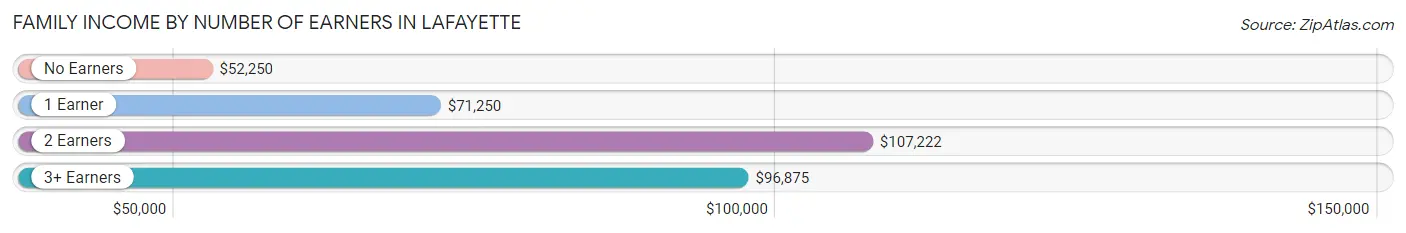
| Number of Earners | # Families | Median Income |
| No Earners | 98 (9.2%) | $52,250 |
| 1 Earner | 319 (30.1%) | $71,250 |
| 2 Earners | 426 (40.2%) | $107,222 |
| 3+ Earners | 216 (20.4%) | $96,875 |
| Total | 1,059 (100.0%) | $95,292 |
Household Income in Lafayette
Household Income Brackets in Lafayette
With 433 households falling in the category, the $100,000 to $149,999 income range is the most frequent in Lafayette, accounting for 30.1% of all households.
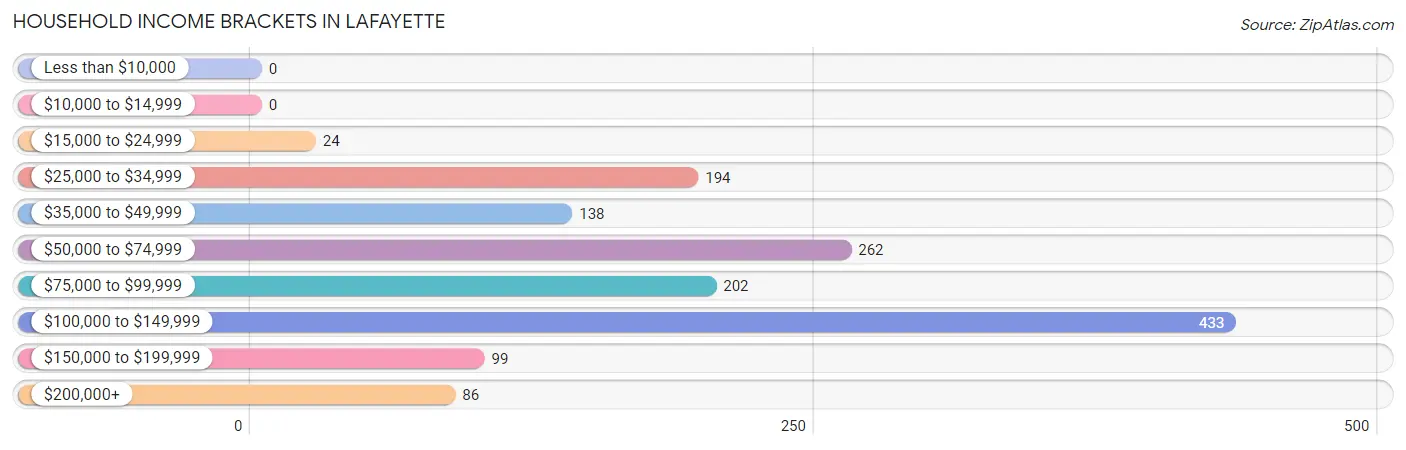
| Income Bracket | # Households | % Households |
| Less than $10,000 | 0 | 0.0% |
| $10,000 to $14,999 | 0 | 0.0% |
| $15,000 to $24,999 | 24 | 1.7% |
| $25,000 to $34,999 | 194 | 13.5% |
| $35,000 to $49,999 | 138 | 9.6% |
| $50,000 to $74,999 | 262 | 18.2% |
| $75,000 to $99,999 | 202 | 14.0% |
| $100,000 to $149,999 | 433 | 30.1% |
| $150,000 to $199,999 | 99 | 6.9% |
| $200,000+ | 86 | 6.0% |
Household Income by Householder Age in Lafayette
The median household income in Lafayette is $93,243, with the highest median household income of $101,970 found in the 25 to 44 years age bracket for the primary householder. A total of 564 households (39.2%) fall into this category. Meanwhile, the 15 to 24 years age bracket for the primary householder has the lowest median household income of $0, with 48 households (3.3%) in this group.
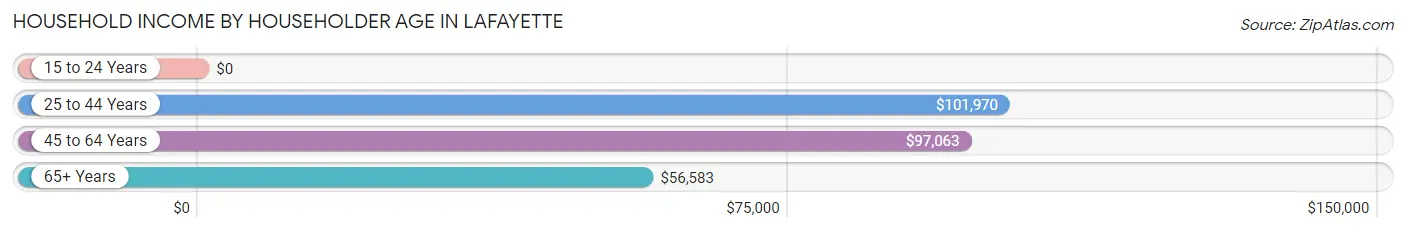
| Income Bracket | # Households | Median Income |
| 15 to 24 Years | 48 (3.3%) | $0 |
| 25 to 44 Years | 564 (39.2%) | $101,970 |
| 45 to 64 Years | 491 (34.1%) | $97,063 |
| 65+ Years | 337 (23.4%) | $56,583 |
| Total | 1,440 (100.0%) | $93,243 |
Poverty in Lafayette
Income Below Poverty by Sex and Age in Lafayette
With 8.8% poverty level for males and 3.7% for females among the residents of Lafayette, 55 to 64 year old males and 18 to 24 year old females are the most vulnerable to poverty, with 107 males (30.1%) and 76 females (33.3%) in their respective age groups living below the poverty level.
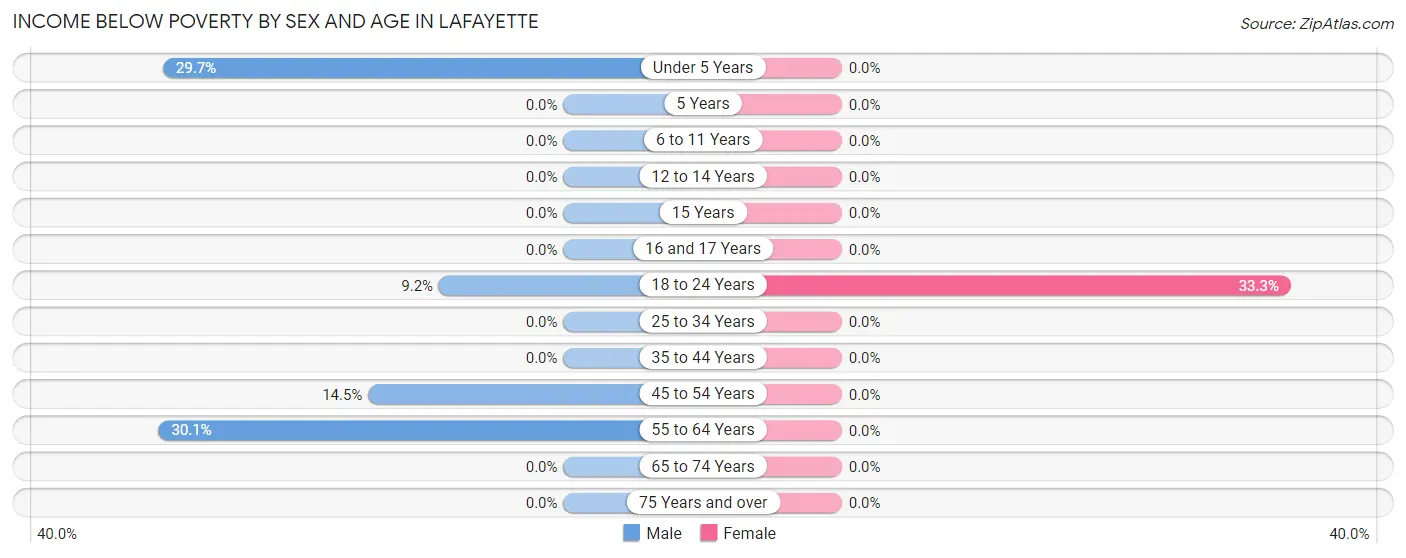
| Age Bracket | Male | Female |
| Under 5 Years | 44 (29.7%) | 0 (0.0%) |
| 5 Years | 0 (0.0%) | 0 (0.0%) |
| 6 to 11 Years | 0 (0.0%) | 0 (0.0%) |
| 12 to 14 Years | 0 (0.0%) | 0 (0.0%) |
| 15 Years | 0 (0.0%) | 0 (0.0%) |
| 16 and 17 Years | 0 (0.0%) | 0 (0.0%) |
| 18 to 24 Years | 22 (9.2%) | 76 (33.3%) |
| 25 to 34 Years | 0 (0.0%) | 0 (0.0%) |
| 35 to 44 Years | 0 (0.0%) | 0 (0.0%) |
| 45 to 54 Years | 31 (14.5%) | 0 (0.0%) |
| 55 to 64 Years | 107 (30.1%) | 0 (0.0%) |
| 65 to 74 Years | 0 (0.0%) | 0 (0.0%) |
| 75 Years and over | 0 (0.0%) | 0 (0.0%) |
| Total | 204 (8.8%) | 76 (3.7%) |
Income Above Poverty by Sex and Age in Lafayette
According to the poverty statistics in Lafayette, males aged 5 years and females aged under 5 years are the age groups that are most secure financially, with 100.0% of males and 100.0% of females in these age groups living above the poverty line.
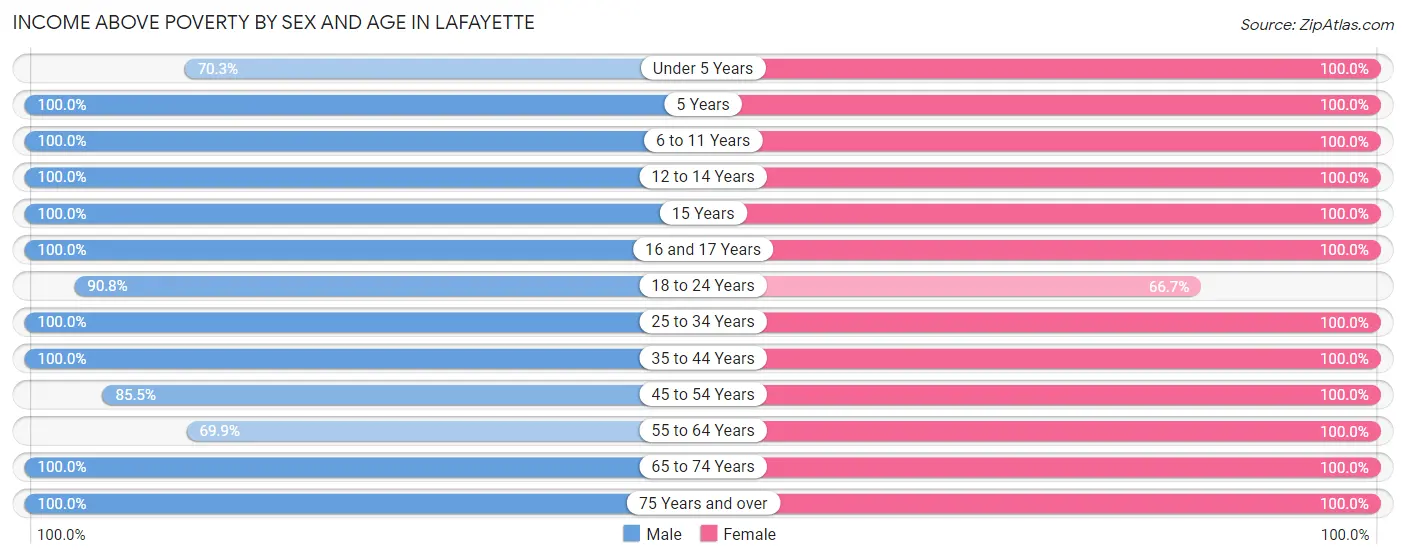
| Age Bracket | Male | Female |
| Under 5 Years | 104 (70.3%) | 147 (100.0%) |
| 5 Years | 16 (100.0%) | 15 (100.0%) |
| 6 to 11 Years | 324 (100.0%) | 186 (100.0%) |
| 12 to 14 Years | 44 (100.0%) | 59 (100.0%) |
| 15 Years | 58 (100.0%) | 58 (100.0%) |
| 16 and 17 Years | 21 (100.0%) | 10 (100.0%) |
| 18 to 24 Years | 216 (90.8%) | 152 (66.7%) |
| 25 to 34 Years | 353 (100.0%) | 339 (100.0%) |
| 35 to 44 Years | 297 (100.0%) | 283 (100.0%) |
| 45 to 54 Years | 183 (85.5%) | 321 (100.0%) |
| 55 to 64 Years | 249 (69.9%) | 173 (100.0%) |
| 65 to 74 Years | 176 (100.0%) | 202 (100.0%) |
| 75 Years and over | 82 (100.0%) | 43 (100.0%) |
| Total | 2,123 (91.2%) | 1,988 (96.3%) |
Income Below Poverty Among Married-Couple Families in Lafayette
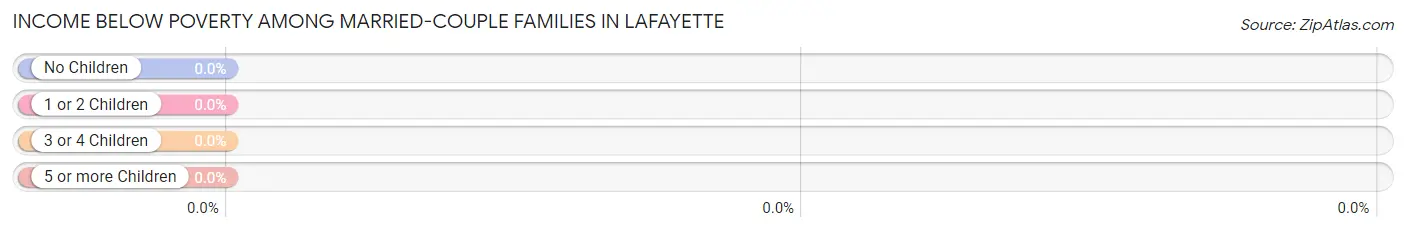
| Children | Above Poverty | Below Poverty |
| No Children | 341 (100.0%) | 0 (0.0%) |
| 1 or 2 Children | 454 (100.0%) | 0 (0.0%) |
| 3 or 4 Children | 83 (100.0%) | 0 (0.0%) |
| 5 or more Children | 0 (0.0%) | 0 (0.0%) |
| Total | 878 (100.0%) | 0 (0.0%) |
Income Below Poverty Among Single-Parent Households in Lafayette
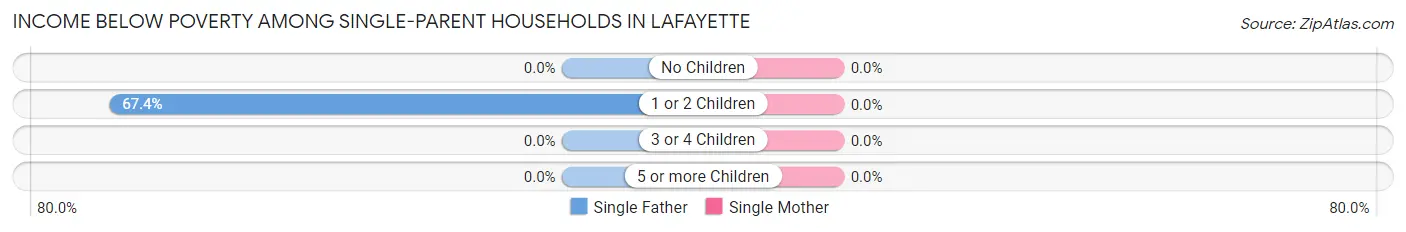
| Children | Single Father | Single Mother |
| No Children | 0 (0.0%) | 0 (0.0%) |
| 1 or 2 Children | 31 (67.4%) | 0 (0.0%) |
| 3 or 4 Children | 0 (0.0%) | 0 (0.0%) |
| 5 or more Children | 0 (0.0%) | 0 (0.0%) |
| Total | 31 (39.2%) | 0 (0.0%) |
Income Below Poverty Among Married-Couple vs Single-Parent Households in Lafayette
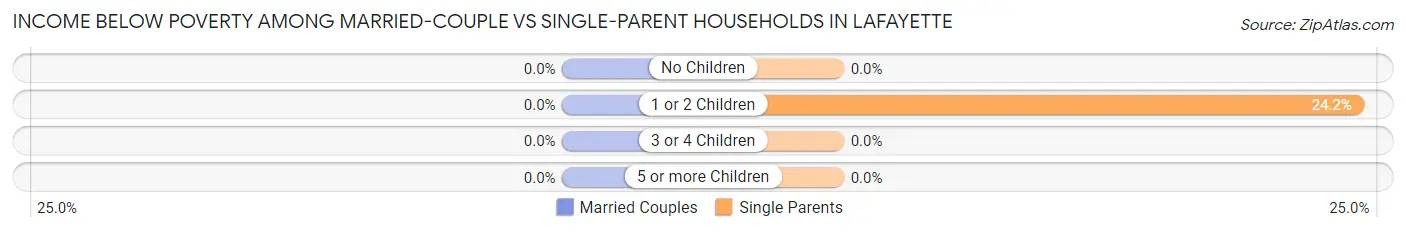
| Children | Married-Couple Families | Single-Parent Households |
| No Children | 0 (0.0%) | 0 (0.0%) |
| 1 or 2 Children | 0 (0.0%) | 31 (24.2%) |
| 3 or 4 Children | 0 (0.0%) | 0 (0.0%) |
| 5 or more Children | 0 (0.0%) | 0 (0.0%) |
| Total | 0 (0.0%) | 31 (17.1%) |
Race in Lafayette
The most populous races in Lafayette are White / Caucasian (3,156 | 71.9%), Hispanic or Latino (1,169 | 26.6%), and Some other Race (675 | 15.4%).
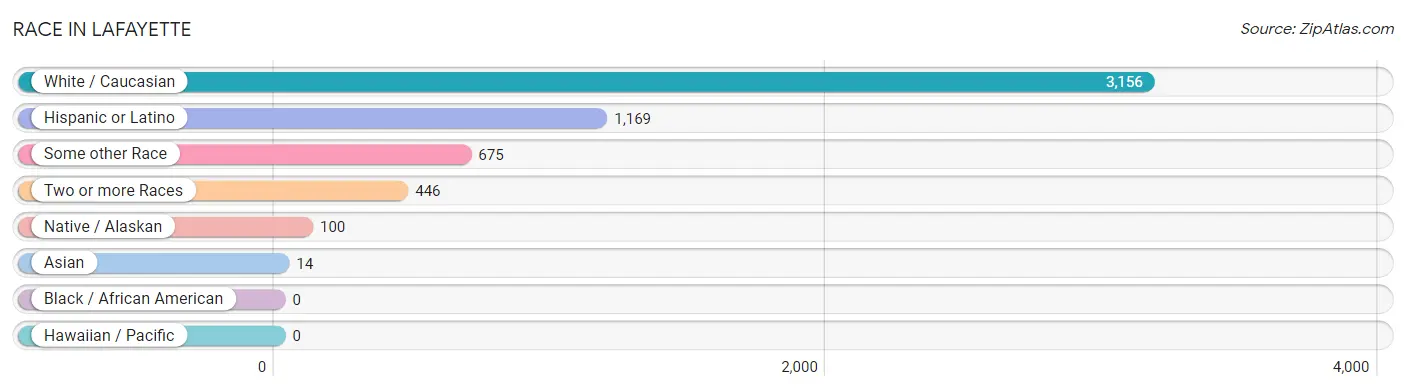
| Race | # Population | % Population |
| Asian | 14 | 0.3% |
| Black / African American | 0 | 0.0% |
| Hawaiian / Pacific | 0 | 0.0% |
| Hispanic or Latino | 1,169 | 26.6% |
| Native / Alaskan | 100 | 2.3% |
| White / Caucasian | 3,156 | 71.9% |
| Two or more Races | 446 | 10.2% |
| Some other Race | 675 | 15.4% |
| Total | 4,391 | 100.0% |
Ancestry in Lafayette
The most populous ancestries reported in Lafayette are Mexican (1,119 | 25.5%), English (829 | 18.9%), German (742 | 16.9%), Irish (514 | 11.7%), and American (269 | 6.1%), together accounting for 79.1% of all Lafayette residents.
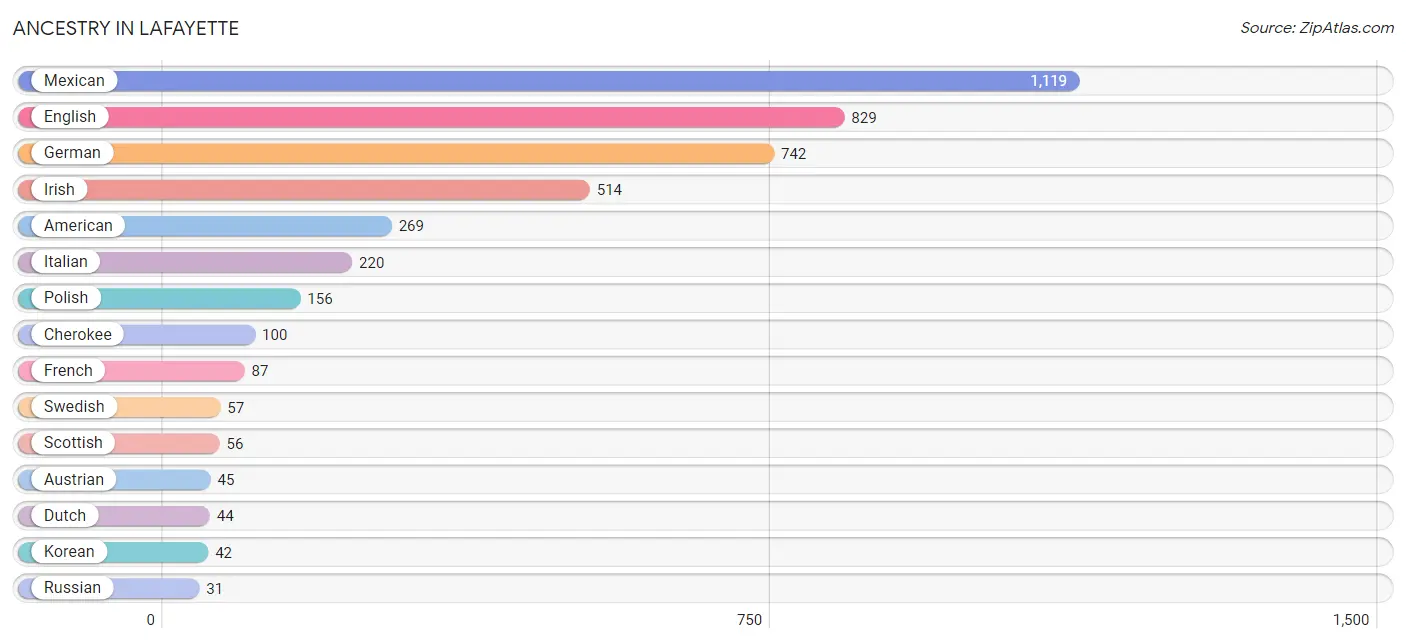
| Ancestry | # Population | % Population |
| American | 269 | 6.1% |
| Austrian | 45 | 1.0% |
| Bhutanese | 20 | 0.5% |
| Canadian | 15 | 0.3% |
| Cherokee | 100 | 2.3% |
| Danish | 27 | 0.6% |
| Dutch | 44 | 1.0% |
| English | 829 | 18.9% |
| French | 87 | 2.0% |
| German | 742 | 16.9% |
| Indian (Asian) | 20 | 0.5% |
| Irish | 514 | 11.7% |
| Italian | 220 | 5.0% |
| Korean | 42 | 1.0% |
| Laotian | 14 | 0.3% |
| Mexican | 1,119 | 25.5% |
| Navajo | 14 | 0.3% |
| Norwegian | 26 | 0.6% |
| Paiute | 10 | 0.2% |
| Polish | 156 | 3.5% |
| Puerto Rican | 28 | 0.6% |
| Russian | 31 | 0.7% |
| Scandinavian | 17 | 0.4% |
| Scotch-Irish | 25 | 0.6% |
| Scottish | 56 | 1.3% |
| Spaniard | 22 | 0.5% |
| Sri Lankan | 28 | 0.6% |
| Swedish | 57 | 1.3% |
| Welsh | 14 | 0.3% | View All 29 Rows |
Immigrants in Lafayette
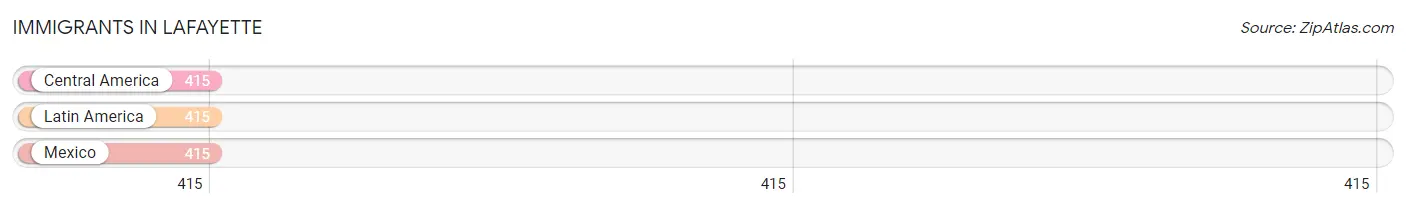
The most numerous immigrant groups reported in Lafayette came from Central America (415 | 9.5%), Latin America (415 | 9.5%), and Mexico (415 | 9.5%), together accounting for 28.3% of all Lafayette residents.
| Immigration Origin | # Population | % Population |
| Central America | 415 | 9.5% |
| Latin America | 415 | 9.5% |
| Mexico | 415 | 9.5% | View All 3 Rows |
Sex and Age in Lafayette
Sex and Age in Lafayette
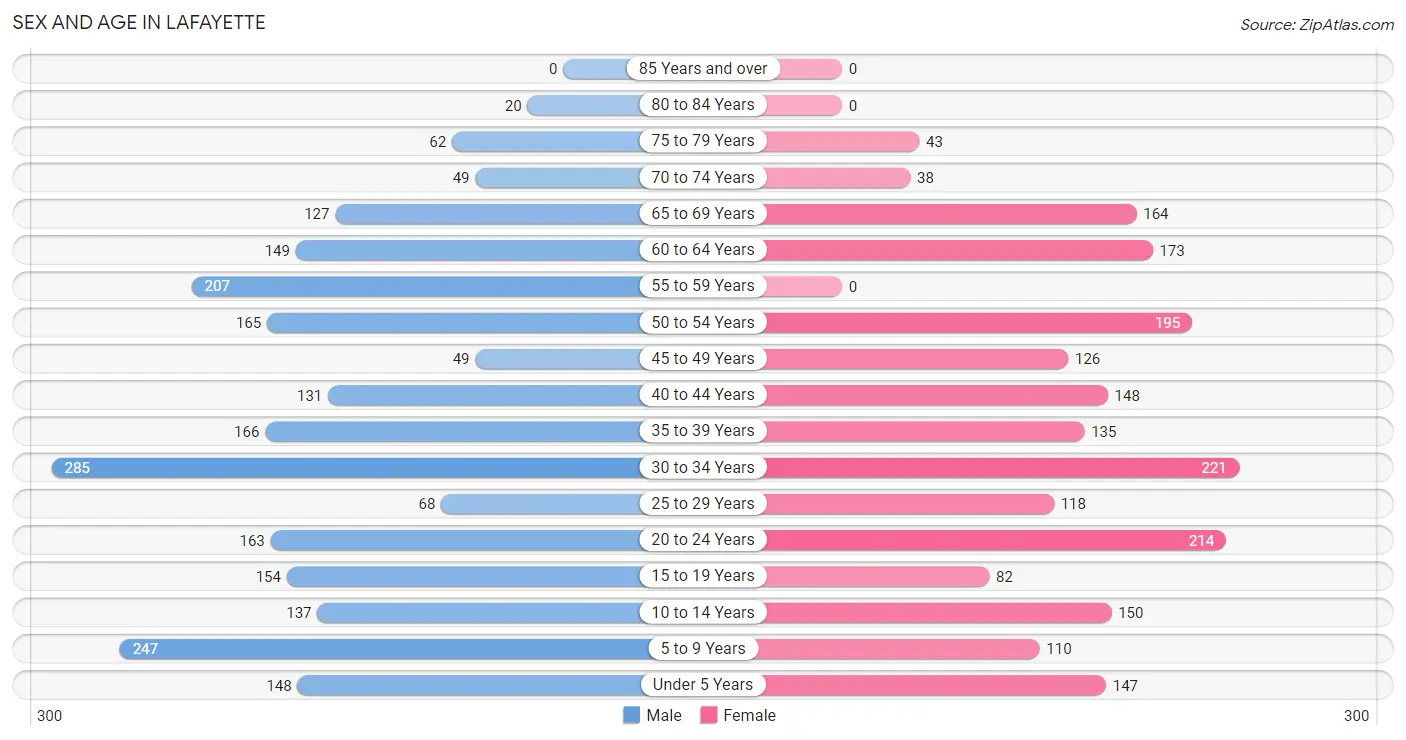
The most populous age groups in Lafayette are 30 to 34 Years (285 | 12.2%) for men and 30 to 34 Years (221 | 10.7%) for women.
| Age Bracket | Male | Female |
| Under 5 Years | 148 (6.4%) | 147 (7.1%) |
| 5 to 9 Years | 247 (10.6%) | 110 (5.3%) |
| 10 to 14 Years | 137 (5.9%) | 150 (7.3%) |
| 15 to 19 Years | 154 (6.6%) | 82 (4.0%) |
| 20 to 24 Years | 163 (7.0%) | 214 (10.4%) |
| 25 to 29 Years | 68 (2.9%) | 118 (5.7%) |
| 30 to 34 Years | 285 (12.2%) | 221 (10.7%) |
| 35 to 39 Years | 166 (7.1%) | 135 (6.5%) |
| 40 to 44 Years | 131 (5.6%) | 148 (7.2%) |
| 45 to 49 Years | 49 (2.1%) | 126 (6.1%) |
| 50 to 54 Years | 165 (7.1%) | 195 (9.5%) |
| 55 to 59 Years | 207 (8.9%) | 0 (0.0%) |
| 60 to 64 Years | 149 (6.4%) | 173 (8.4%) |
| 65 to 69 Years | 127 (5.5%) | 164 (8.0%) |
| 70 to 74 Years | 49 (2.1%) | 38 (1.8%) |
| 75 to 79 Years | 62 (2.7%) | 43 (2.1%) |
| 80 to 84 Years | 20 (0.9%) | 0 (0.0%) |
| 85 Years and over | 0 (0.0%) | 0 (0.0%) |
| Total | 2,327 (100.0%) | 2,064 (100.0%) |
Families and Households in Lafayette
Median Family Size in Lafayette
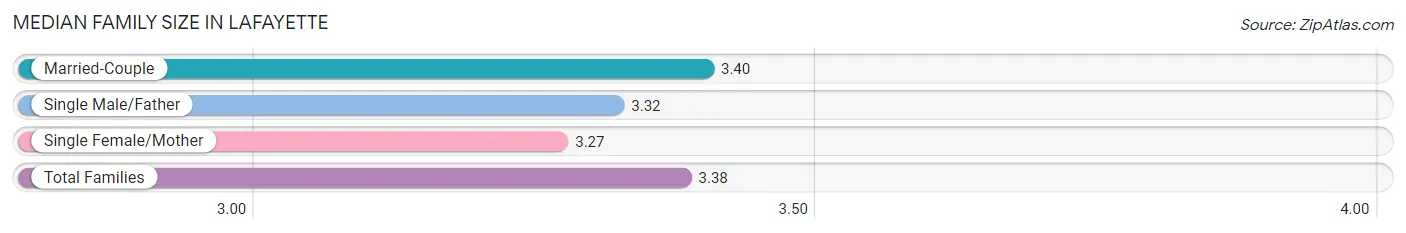
The median family size in Lafayette is 3.38 persons per family, with married-couple families (878 | 82.9%) accounting for the largest median family size of 3.4 persons per family. On the other hand, single female/mother families (102 | 9.6%) represent the smallest median family size with 3.27 persons per family.
| Family Type | # Families | Family Size |
| Married-Couple | 878 (82.9%) | 3.40 |
| Single Male/Father | 79 (7.5%) | 3.32 |
| Single Female/Mother | 102 (9.6%) | 3.27 |
| Total Families | 1,059 (100.0%) | 3.38 |
Median Household Size in Lafayette
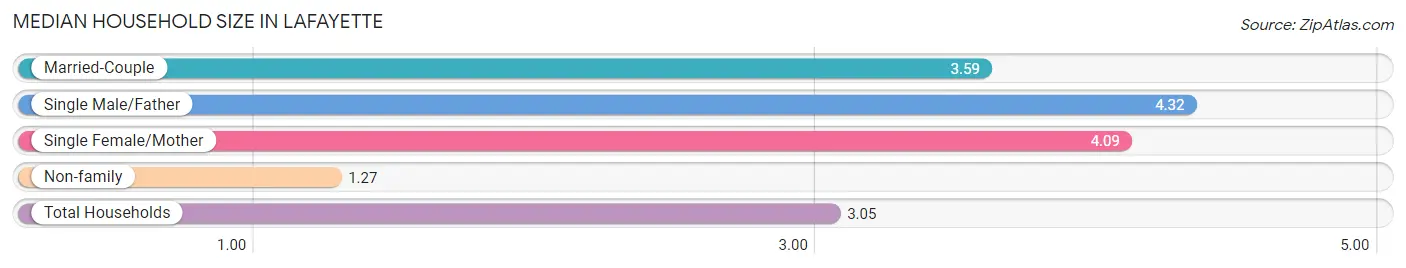
The median household size in Lafayette is 3.05 persons per household, with single male/father households (79 | 5.5%) accounting for the largest median household size of 4.32 persons per household. non-family households (381 | 26.5%) represent the smallest median household size with 1.27 persons per household.
| Household Type | # Households | Household Size |
| Married-Couple | 878 (61.0%) | 3.59 |
| Single Male/Father | 79 (5.5%) | 4.32 |
| Single Female/Mother | 102 (7.1%) | 4.09 |
| Non-family | 381 (26.5%) | 1.27 |
| Total Households | 1,440 (100.0%) | 3.05 |
Household Size by Marriage Status in Lafayette
Out of a total of 1,440 households in Lafayette, 1,059 (73.5%) are family households, while 381 (26.5%) are nonfamily households. The most numerous type of family households are 4-person households, comprising 390, and the most common type of nonfamily households are 1-person households, comprising 292.
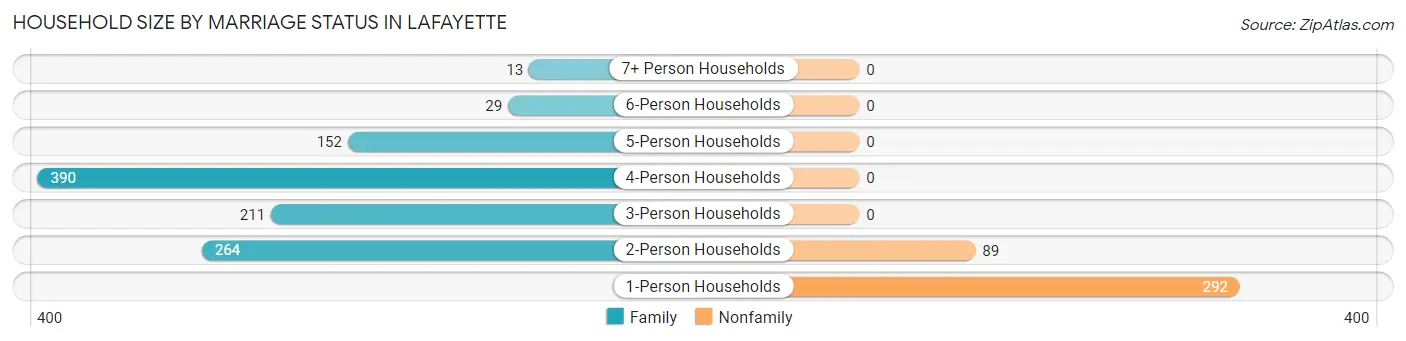
| Household Size | Family Households | Nonfamily Households |
| 1-Person Households | - | 292 (20.3%) |
| 2-Person Households | 264 (18.3%) | 89 (6.2%) |
| 3-Person Households | 211 (14.6%) | 0 (0.0%) |
| 4-Person Households | 390 (27.1%) | 0 (0.0%) |
| 5-Person Households | 152 (10.6%) | 0 (0.0%) |
| 6-Person Households | 29 (2.0%) | 0 (0.0%) |
| 7+ Person Households | 13 (0.9%) | 0 (0.0%) |
| Total | 1,059 (73.5%) | 381 (26.5%) |
Female Fertility in Lafayette
Fertility by Age in Lafayette
Average fertility rate in Lafayette is 17.0 births per 1,000 women. Women in the age bracket of 20 to 34 years have the highest fertility rate with 33.0 births per 1,000 women. Women in the age bracket of 20 to 34 years acount for 100.0% of all women with births.
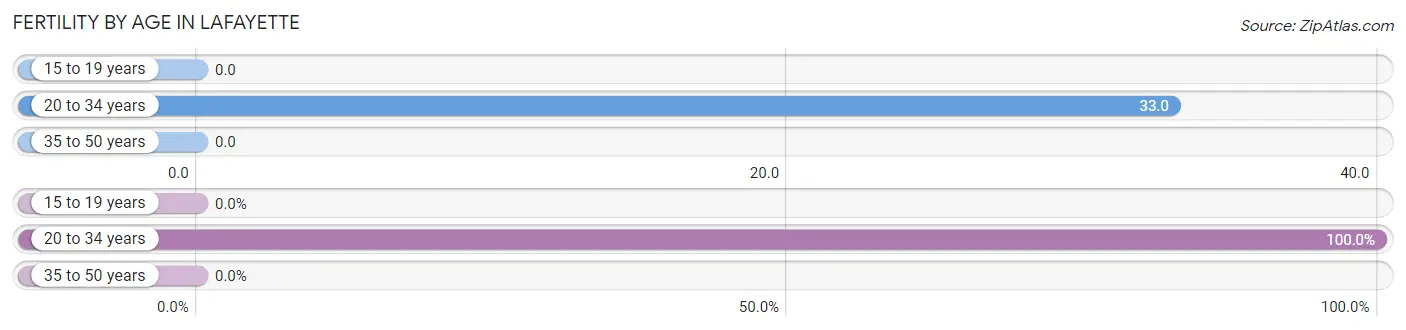
| Age Bracket | Women with Births | Births / 1,000 Women |
| 15 to 19 years | 0 (0.0%) | 0.0 |
| 20 to 34 years | 18 (100.0%) | 33.0 |
| 35 to 50 years | 0 (0.0%) | 0.0 |
| Total | 18 (100.0%) | 17.0 |
Fertility by Age by Marriage Status in Lafayette
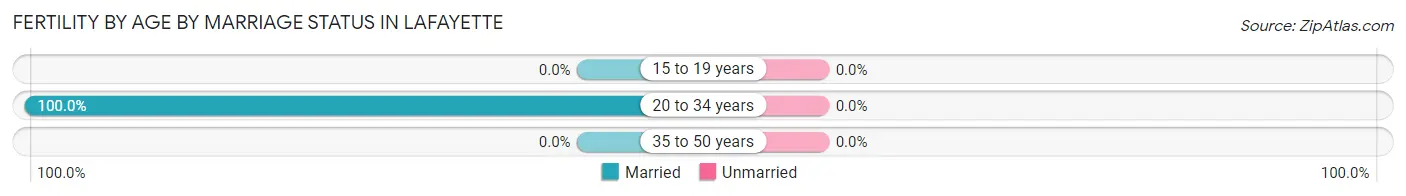
| Age Bracket | Married | Unmarried |
| 15 to 19 years | 0 (0.0%) | 0 (0.0%) |
| 20 to 34 years | 18 (100.0%) | 0 (0.0%) |
| 35 to 50 years | 0 (0.0%) | 0 (0.0%) |
| Total | 18 (100.0%) | 0 (0.0%) |
Fertility by Education in Lafayette
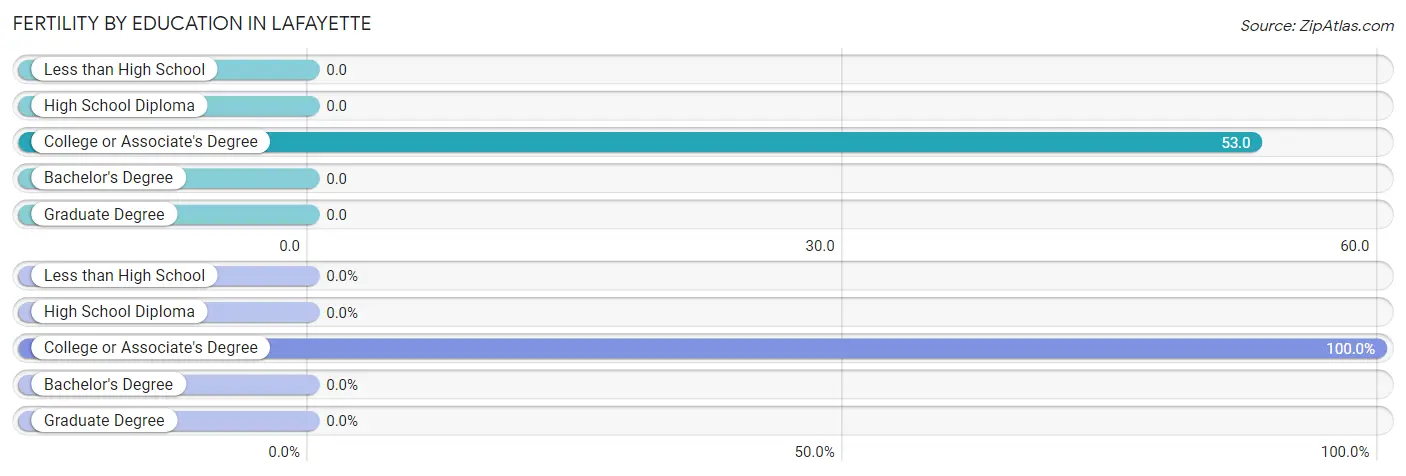
| Educational Attainment | Women with Births | Births / 1,000 Women |
| Less than High School | 0 (0.0%) | 0.0 |
| High School Diploma | 0 (0.0%) | 0.0 |
| College or Associate's Degree | 18 (100.0%) | 53.0 |
| Bachelor's Degree | 0 (0.0%) | 0.0 |
| Graduate Degree | 0 (0.0%) | 0.0 |
| Total | 18 (100.0%) | 17.0 |
Fertility by Education by Marriage Status in Lafayette
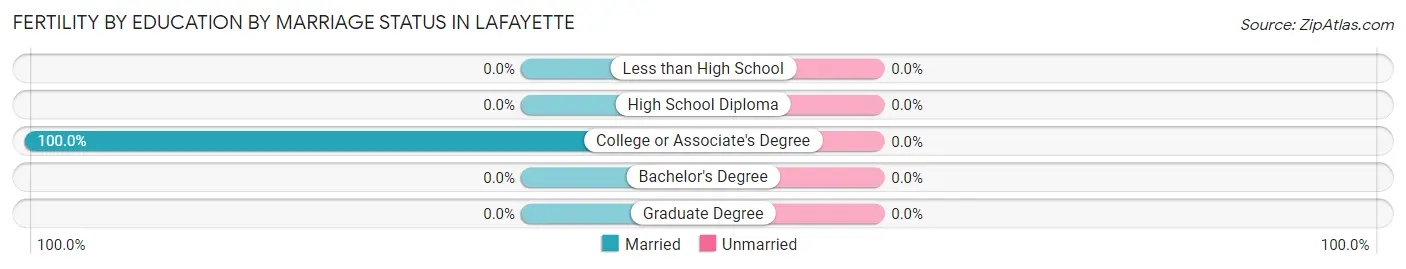
| Educational Attainment | Married | Unmarried |
| Less than High School | 0 (0.0%) | 0 (0.0%) |
| High School Diploma | 0 (0.0%) | 0 (0.0%) |
| College or Associate's Degree | 18 (100.0%) | 0 (0.0%) |
| Bachelor's Degree | 0 (0.0%) | 0 (0.0%) |
| Graduate Degree | 0 (0.0%) | 0 (0.0%) |
| Total | 18 (100.0%) | 0 (0.0%) |
Employment Characteristics in Lafayette
Employment by Class of Employer in Lafayette
Among the 2,297 employed individuals in Lafayette, private company employees (1,674 | 72.9%), not-for-profit organizations (244 | 10.6%), and local government employees (174 | 7.6%) make up the most common classes of employment.
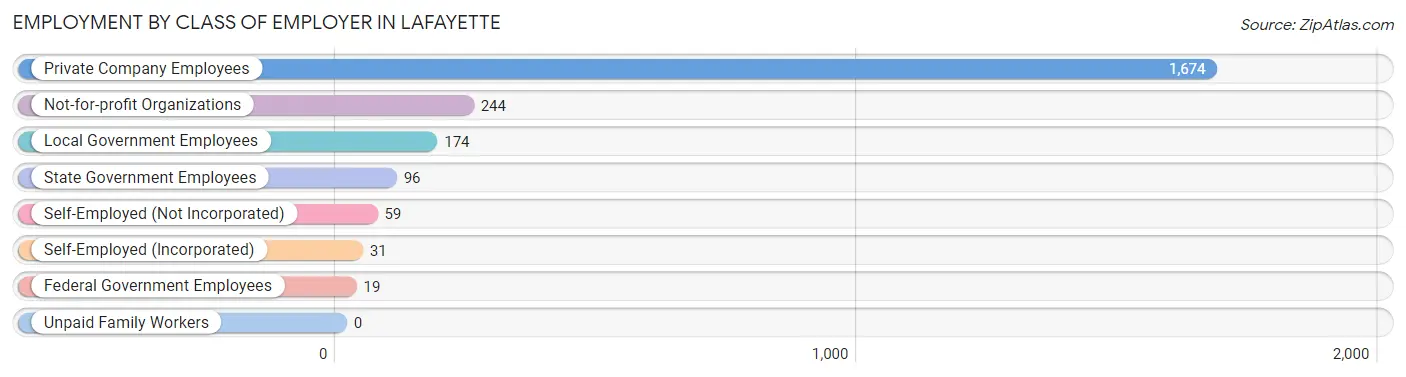
| Employer Class | # Employees | % Employees |
| Private Company Employees | 1,674 | 72.9% |
| Self-Employed (Incorporated) | 31 | 1.3% |
| Self-Employed (Not Incorporated) | 59 | 2.6% |
| Not-for-profit Organizations | 244 | 10.6% |
| Local Government Employees | 174 | 7.6% |
| State Government Employees | 96 | 4.2% |
| Federal Government Employees | 19 | 0.8% |
| Unpaid Family Workers | 0 | 0.0% |
| Total | 2,297 | 100.0% |
Employment Status by Age in Lafayette
According to the labor force statistics for Lafayette, out of the total population over 16 years of age (3,336), 72.8% or 2,429 individuals are in the labor force, with 4.7% or 114 of them unemployed. The age group with the highest labor force participation rate is 30 to 34 years, with 91.5% or 463 individuals in the labor force. Within the labor force, the 65 to 74 years age range has the highest percentage of unemployed individuals, with 50.0% or 88 of them being unemployed.
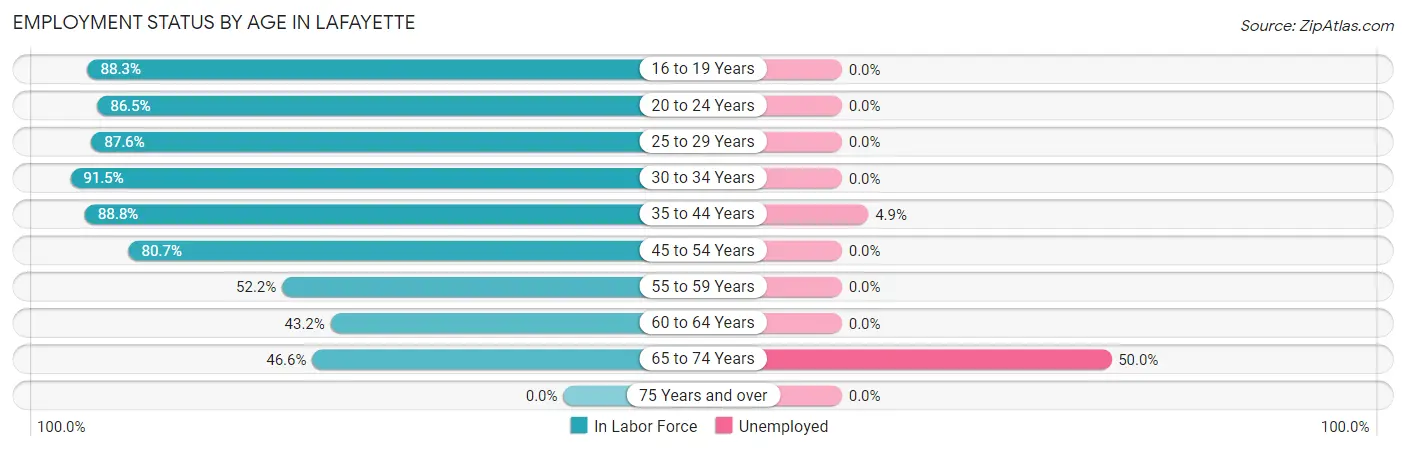
| Age Bracket | In Labor Force | Unemployed |
| 16 to 19 Years | 106 (88.3%) | 0 (0.0%) |
| 20 to 24 Years | 326 (86.5%) | 0 (0.0%) |
| 25 to 29 Years | 163 (87.6%) | 0 (0.0%) |
| 30 to 34 Years | 463 (91.5%) | 0 (0.0%) |
| 35 to 44 Years | 515 (88.8%) | 25 (4.9%) |
| 45 to 54 Years | 432 (80.7%) | 0 (0.0%) |
| 55 to 59 Years | 108 (52.2%) | 0 (0.0%) |
| 60 to 64 Years | 139 (43.2%) | 0 (0.0%) |
| 65 to 74 Years | 176 (46.6%) | 88 (50.0%) |
| 75 Years and over | 0 (0.0%) | 0 (0.0%) |
| Total | 2,429 (72.8%) | 114 (4.7%) |
Employment Status by Educational Attainment in Lafayette
According to labor force statistics for Lafayette, 77.9% of individuals (1,820) out of the total population between 25 and 64 years of age (2,336) are in the labor force, with 1.4% or 25 of them being unemployed. The group with the highest labor force participation rate are those with the educational attainment of college / associate degree, with 84.5% or 853 individuals in the labor force. Within the labor force, individuals with high school diploma education have the highest percentage of unemployment, with 4.4% or 25 of them being unemployed.
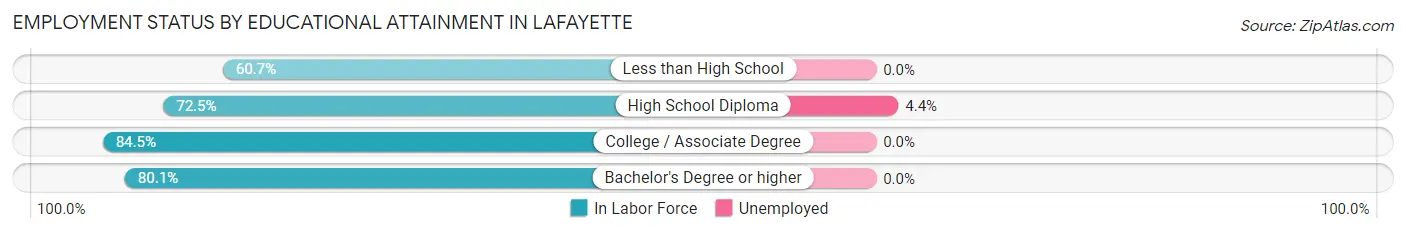
| Educational Attainment | In Labor Force | Unemployed |
| Less than High School | 116 (60.7%) | 0 (0.0%) |
| High School Diploma | 562 (72.5%) | 34 (4.4%) |
| College / Associate Degree | 853 (84.5%) | 0 (0.0%) |
| Bachelor's Degree or higher | 289 (80.1%) | 0 (0.0%) |
| Total | 1,820 (77.9%) | 33 (1.4%) |
Employment Occupations by Sex in Lafayette
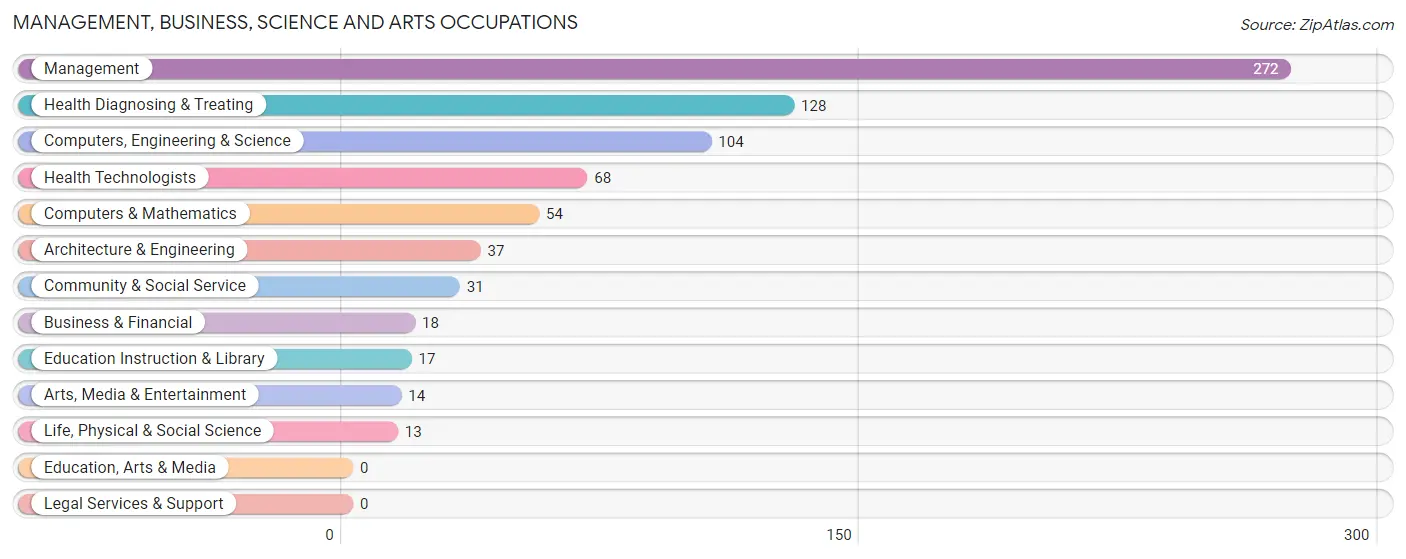
Management, Business, Science and Arts Occupations
The most common Management, Business, Science and Arts occupations in Lafayette are Management (272 | 11.7%), Health Diagnosing & Treating (128 | 5.5%), Computers, Engineering & Science (104 | 4.5%), Health Technologists (68 | 2.9%), and Computers & Mathematics (54 | 2.3%).
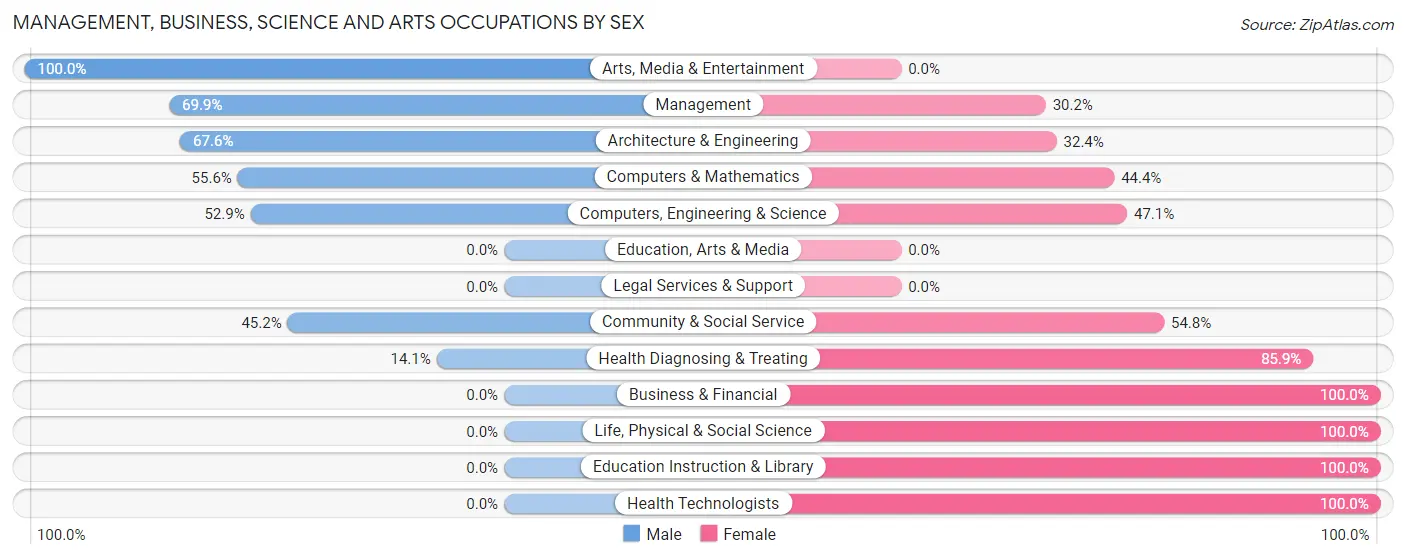
Management, Business, Science and Arts Occupations by Sex
Within the Management, Business, Science and Arts occupations in Lafayette, the most male-oriented occupations are Arts, Media & Entertainment (100.0%), Management (69.9%), and Architecture & Engineering (67.6%), while the most female-oriented occupations are Business & Financial (100.0%), Life, Physical & Social Science (100.0%), and Education Instruction & Library (100.0%).
| Occupation | Male | Female |
| Management | 190 (69.9%) | 82 (30.1%) |
| Business & Financial | 0 (0.0%) | 18 (100.0%) |
| Computers, Engineering & Science | 55 (52.9%) | 49 (47.1%) |
| Computers & Mathematics | 30 (55.6%) | 24 (44.4%) |
| Architecture & Engineering | 25 (67.6%) | 12 (32.4%) |
| Life, Physical & Social Science | 0 (0.0%) | 13 (100.0%) |
| Community & Social Service | 14 (45.2%) | 17 (54.8%) |
| Education, Arts & Media | 0 (0.0%) | 0 (0.0%) |
| Legal Services & Support | 0 (0.0%) | 0 (0.0%) |
| Education Instruction & Library | 0 (0.0%) | 17 (100.0%) |
| Arts, Media & Entertainment | 14 (100.0%) | 0 (0.0%) |
| Health Diagnosing & Treating | 18 (14.1%) | 110 (85.9%) |
| Health Technologists | 0 (0.0%) | 68 (100.0%) |
| Total (Category) | 277 (50.1%) | 276 (49.9%) |
| Total (Overall) | 1,269 (54.8%) | 1,046 (45.2%) |
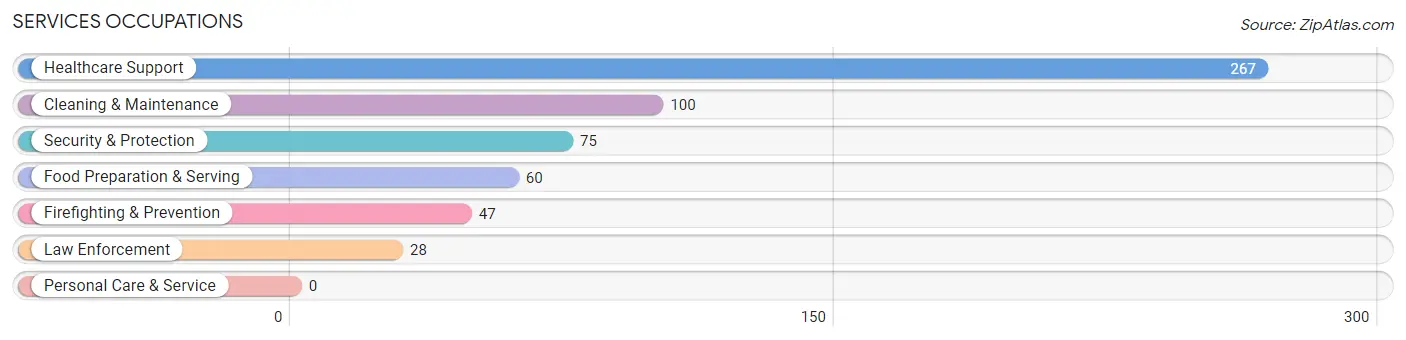
Services Occupations
The most common Services occupations in Lafayette are Healthcare Support (267 | 11.5%), Cleaning & Maintenance (100 | 4.3%), Security & Protection (75 | 3.2%), Food Preparation & Serving (60 | 2.6%), and Firefighting & Prevention (47 | 2.0%).
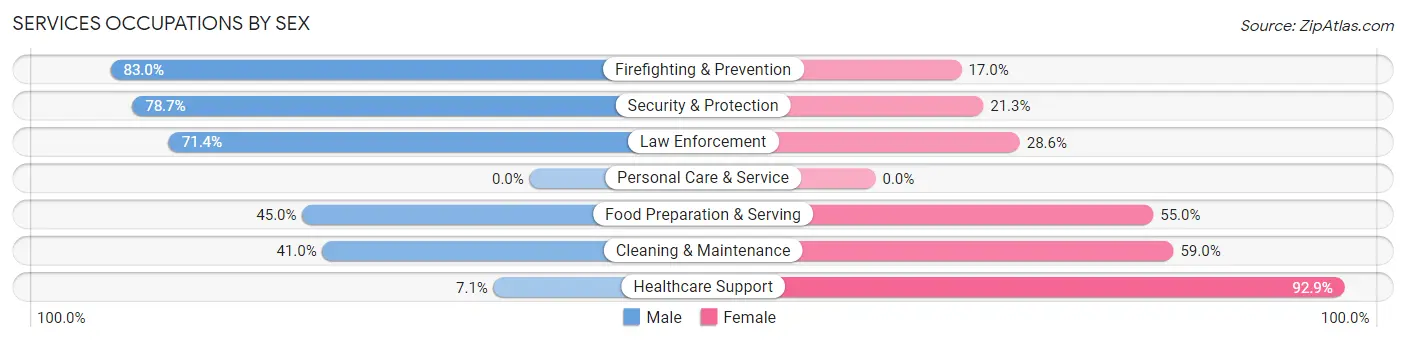
Services Occupations by Sex
Within the Services occupations in Lafayette, the most male-oriented occupations are Firefighting & Prevention (83.0%), Security & Protection (78.7%), and Law Enforcement (71.4%), while the most female-oriented occupations are Healthcare Support (92.9%), Cleaning & Maintenance (59.0%), and Food Preparation & Serving (55.0%).
| Occupation | Male | Female |
| Healthcare Support | 19 (7.1%) | 248 (92.9%) |
| Security & Protection | 59 (78.7%) | 16 (21.3%) |
| Firefighting & Prevention | 39 (83.0%) | 8 (17.0%) |
| Law Enforcement | 20 (71.4%) | 8 (28.6%) |
| Food Preparation & Serving | 27 (45.0%) | 33 (55.0%) |
| Cleaning & Maintenance | 41 (41.0%) | 59 (59.0%) |
| Personal Care & Service | 0 (0.0%) | 0 (0.0%) |
| Total (Category) | 146 (29.1%) | 356 (70.9%) |
| Total (Overall) | 1,269 (54.8%) | 1,046 (45.2%) |
Sales and Office Occupations
The most common Sales and Office occupations in Lafayette are Office & Administration (354 | 15.3%), and Sales & Related (142 | 6.1%).

Sales and Office Occupations by Sex
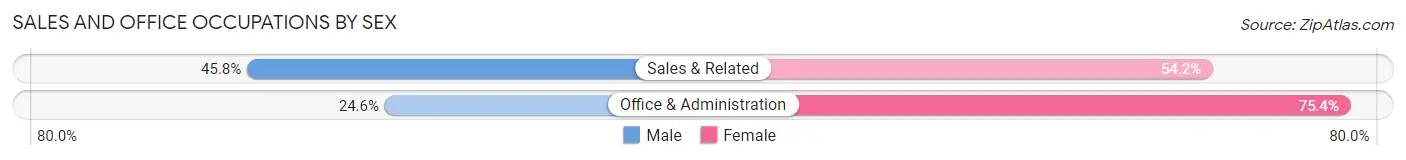
| Occupation | Male | Female |
| Sales & Related | 65 (45.8%) | 77 (54.2%) |
| Office & Administration | 87 (24.6%) | 267 (75.4%) |
| Total (Category) | 152 (30.6%) | 344 (69.4%) |
| Total (Overall) | 1,269 (54.8%) | 1,046 (45.2%) |
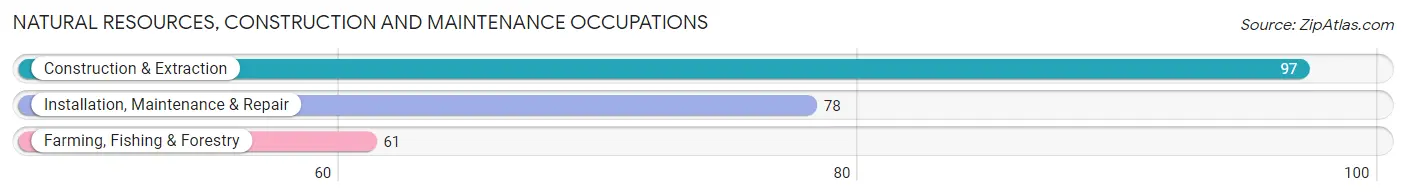
Natural Resources, Construction and Maintenance Occupations
The most common Natural Resources, Construction and Maintenance occupations in Lafayette are Construction & Extraction (97 | 4.2%), Installation, Maintenance & Repair (78 | 3.4%), and Farming, Fishing & Forestry (61 | 2.6%).
Natural Resources, Construction and Maintenance Occupations by Sex
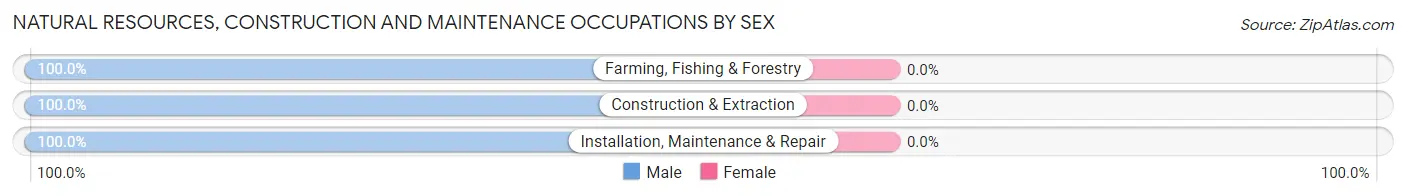
| Occupation | Male | Female |
| Farming, Fishing & Forestry | 61 (100.0%) | 0 (0.0%) |
| Construction & Extraction | 97 (100.0%) | 0 (0.0%) |
| Installation, Maintenance & Repair | 78 (100.0%) | 0 (0.0%) |
| Total (Category) | 236 (100.0%) | 0 (0.0%) |
| Total (Overall) | 1,269 (54.8%) | 1,046 (45.2%) |
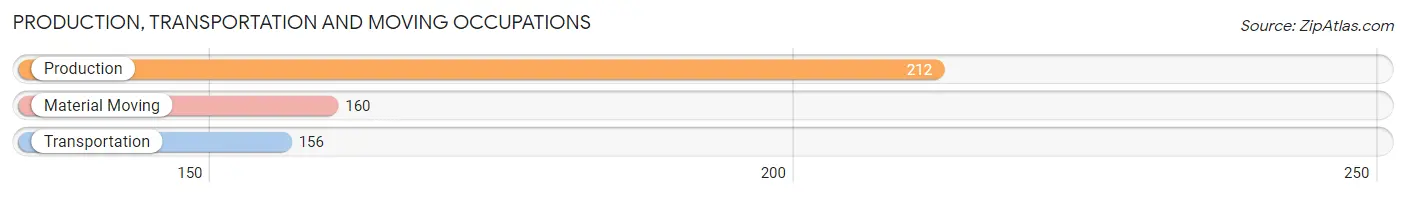
Production, Transportation and Moving Occupations
The most common Production, Transportation and Moving occupations in Lafayette are Production (212 | 9.2%), Material Moving (160 | 6.9%), and Transportation (156 | 6.7%).
Production, Transportation and Moving Occupations by Sex
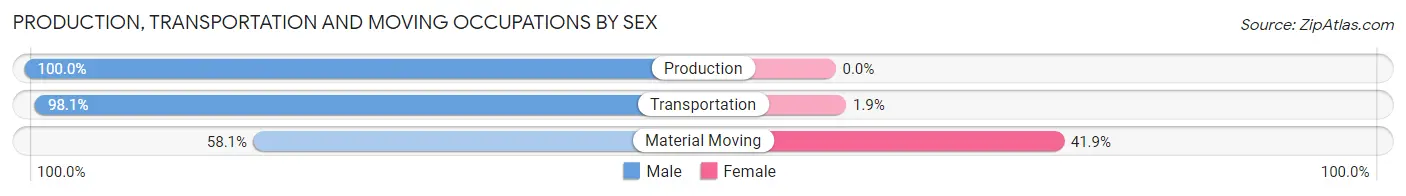
| Occupation | Male | Female |
| Production | 212 (100.0%) | 0 (0.0%) |
| Transportation | 153 (98.1%) | 3 (1.9%) |
| Material Moving | 93 (58.1%) | 67 (41.9%) |
| Total (Category) | 458 (86.7%) | 70 (13.3%) |
| Total (Overall) | 1,269 (54.8%) | 1,046 (45.2%) |
Employment Industries by Sex in Lafayette
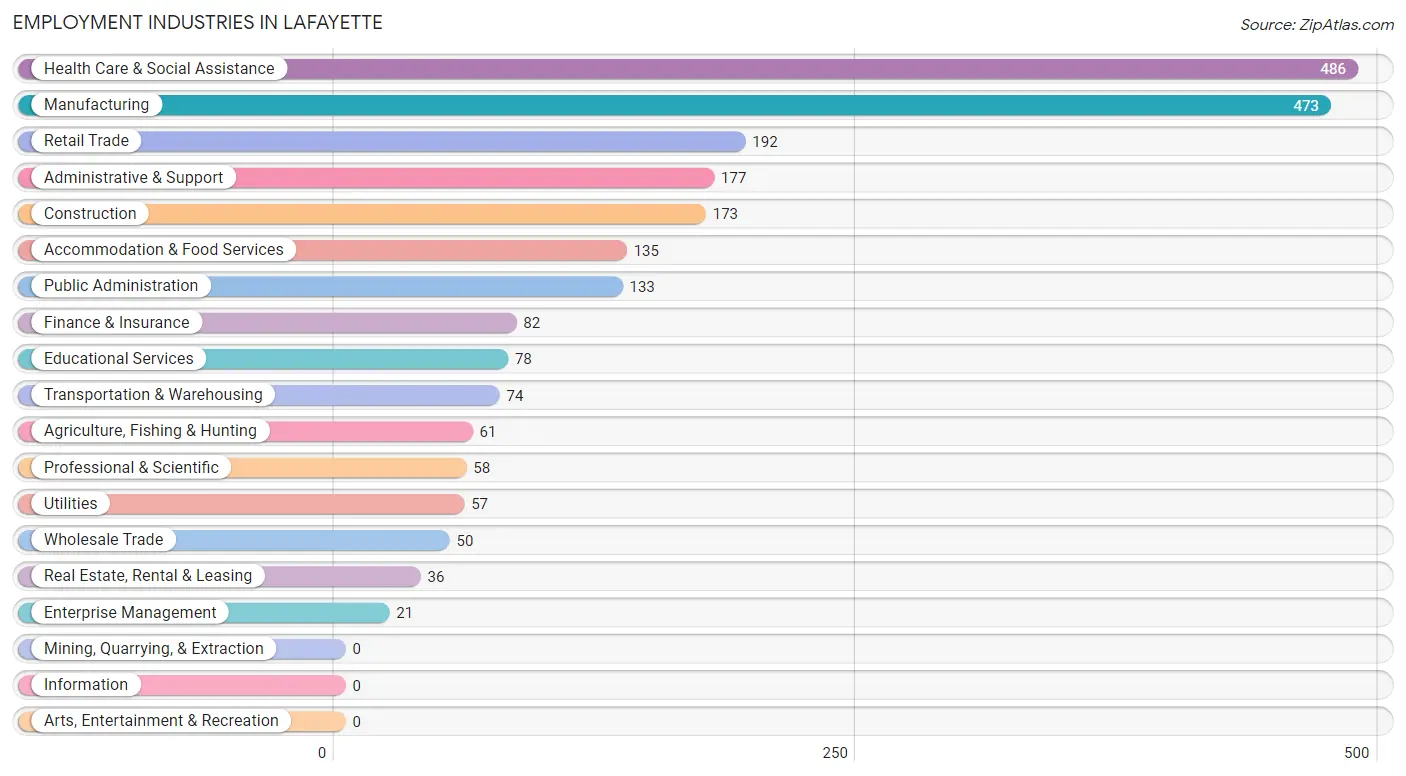
Employment Industries in Lafayette
The major employment industries in Lafayette include Health Care & Social Assistance (486 | 21.0%), Manufacturing (473 | 20.4%), Retail Trade (192 | 8.3%), Administrative & Support (177 | 7.6%), and Construction (173 | 7.5%).
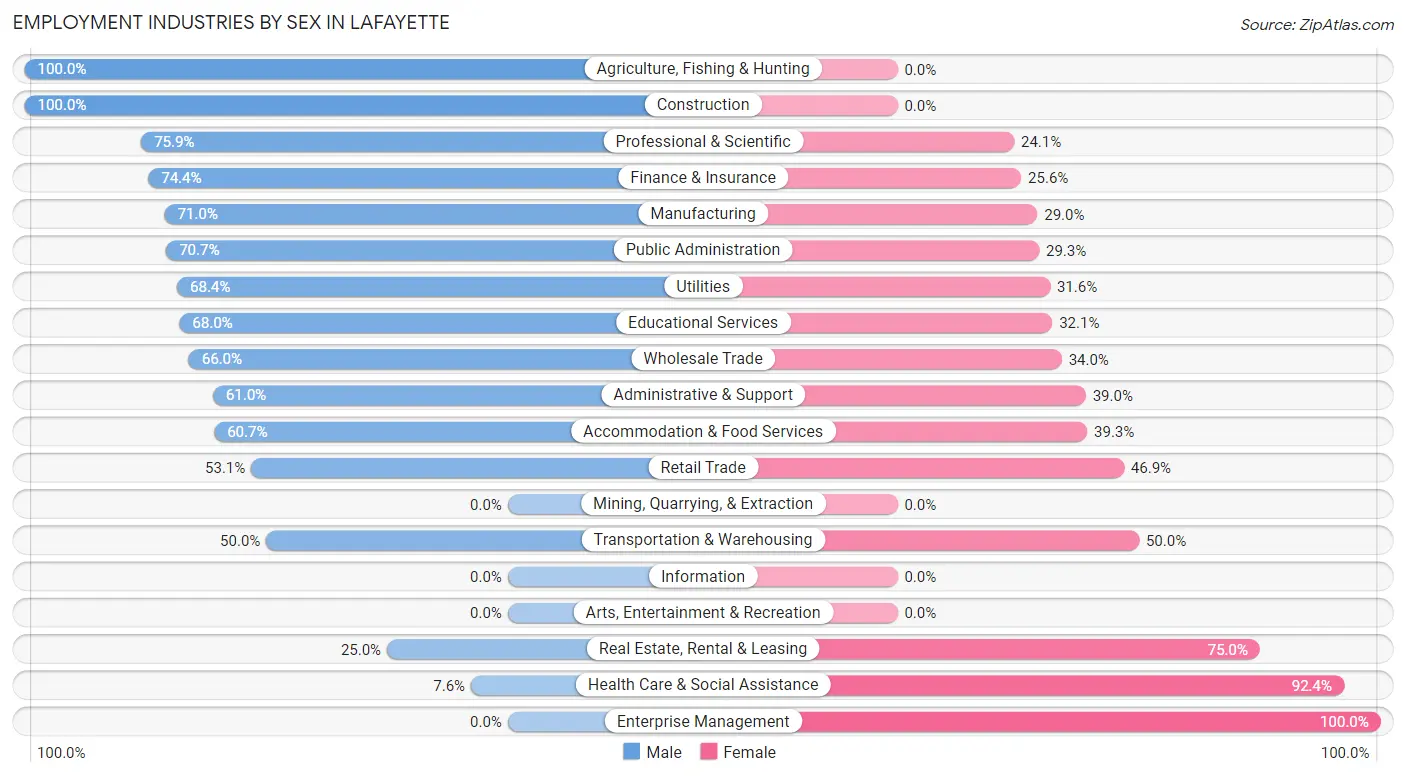
Employment Industries by Sex in Lafayette
The Lafayette industries that see more men than women are Agriculture, Fishing & Hunting (100.0%), Construction (100.0%), and Professional & Scientific (75.9%), whereas the industries that tend to have a higher number of women are Enterprise Management (100.0%), Health Care & Social Assistance (92.4%), and Real Estate, Rental & Leasing (75.0%).
| Industry | Male | Female |
| Agriculture, Fishing & Hunting | 61 (100.0%) | 0 (0.0%) |
| Mining, Quarrying, & Extraction | 0 (0.0%) | 0 (0.0%) |
| Construction | 173 (100.0%) | 0 (0.0%) |
| Manufacturing | 336 (71.0%) | 137 (29.0%) |
| Wholesale Trade | 33 (66.0%) | 17 (34.0%) |
| Retail Trade | 102 (53.1%) | 90 (46.9%) |
| Transportation & Warehousing | 37 (50.0%) | 37 (50.0%) |
| Utilities | 39 (68.4%) | 18 (31.6%) |
| Information | 0 (0.0%) | 0 (0.0%) |
| Finance & Insurance | 61 (74.4%) | 21 (25.6%) |
| Real Estate, Rental & Leasing | 9 (25.0%) | 27 (75.0%) |
| Professional & Scientific | 44 (75.9%) | 14 (24.1%) |
| Enterprise Management | 0 (0.0%) | 21 (100.0%) |
| Administrative & Support | 108 (61.0%) | 69 (39.0%) |
| Educational Services | 53 (67.9%) | 25 (32.1%) |
| Health Care & Social Assistance | 37 (7.6%) | 449 (92.4%) |
| Arts, Entertainment & Recreation | 0 (0.0%) | 0 (0.0%) |
| Accommodation & Food Services | 82 (60.7%) | 53 (39.3%) |
| Public Administration | 94 (70.7%) | 39 (29.3%) |
| Total | 1,269 (54.8%) | 1,046 (45.2%) |
Education in Lafayette
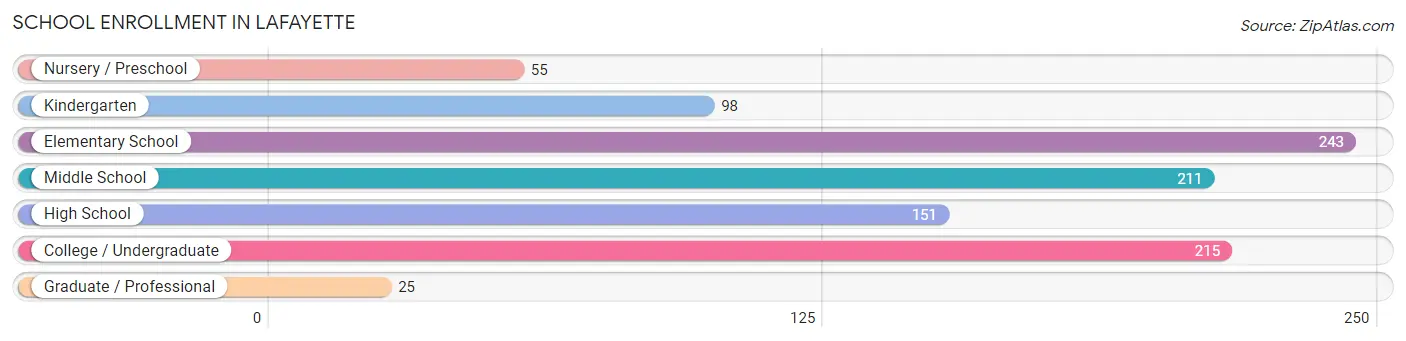
School Enrollment in Lafayette
The most common levels of schooling among the 998 students in Lafayette are elementary school (243 | 24.3%), college / undergraduate (215 | 21.5%), and middle school (211 | 21.1%).
| School Level | # Students | % Students |
| Nursery / Preschool | 55 | 5.5% |
| Kindergarten | 98 | 9.8% |
| Elementary School | 243 | 24.3% |
| Middle School | 211 | 21.1% |
| High School | 151 | 15.1% |
| College / Undergraduate | 215 | 21.5% |
| Graduate / Professional | 25 | 2.5% |
| Total | 998 | 100.0% |
School Enrollment by Age by Funding Source in Lafayette
Out of a total of 998 students who are enrolled in schools in Lafayette, 153 (15.3%) attend a private institution, while the remaining 845 (84.7%) are enrolled in public schools. The age group of 25 to 34 year olds has the highest likelihood of being enrolled in private schools, with 25 (100.0% in the age bracket) enrolled. Conversely, the age group of 3 to 4 year olds has the lowest likelihood of being enrolled in a private school, with 55 (100.0% in the age bracket) attending a public institution.
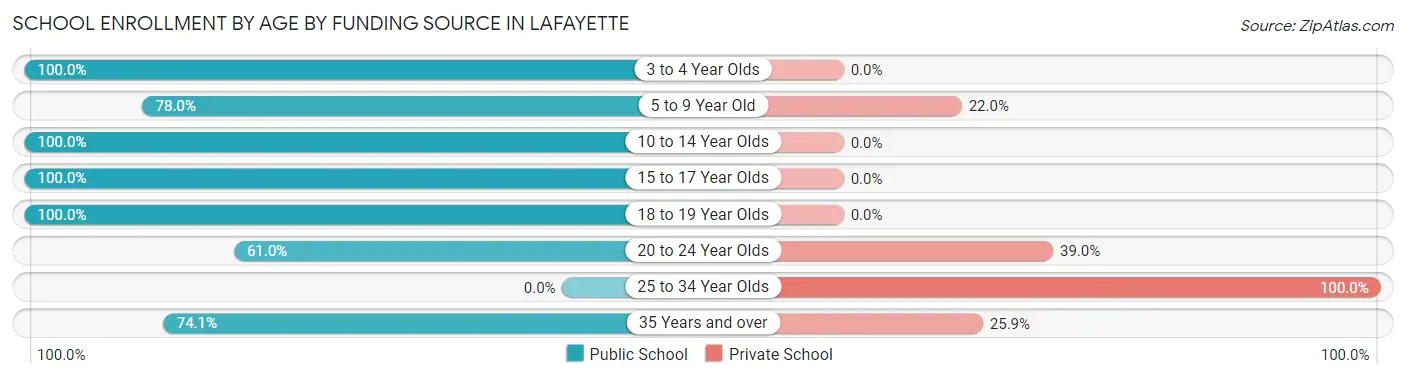
| Age Bracket | Public School | Private School |
| 3 to 4 Year Olds | 55 (100.0%) | 0 (0.0%) |
| 5 to 9 Year Old | 266 (78.0%) | 75 (22.0%) |
| 10 to 14 Year Olds | 215 (100.0%) | 0 (0.0%) |
| 15 to 17 Year Olds | 147 (100.0%) | 0 (0.0%) |
| 18 to 19 Year Olds | 61 (100.0%) | 0 (0.0%) |
| 20 to 24 Year Olds | 61 (61.0%) | 39 (39.0%) |
| 25 to 34 Year Olds | 0 (0.0%) | 25 (100.0%) |
| 35 Years and over | 40 (74.1%) | 14 (25.9%) |
| Total | 845 (84.7%) | 153 (15.3%) |
Educational Attainment by Field of Study in Lafayette
Business (156 | 28.9%), science & technology (98 | 18.1%), physical & health sciences (49 | 9.1%), visual & performing arts (45 | 8.3%), and social sciences (38 | 7.0%) are the most common fields of study among 540 individuals in Lafayette who have obtained a bachelor's degree or higher.
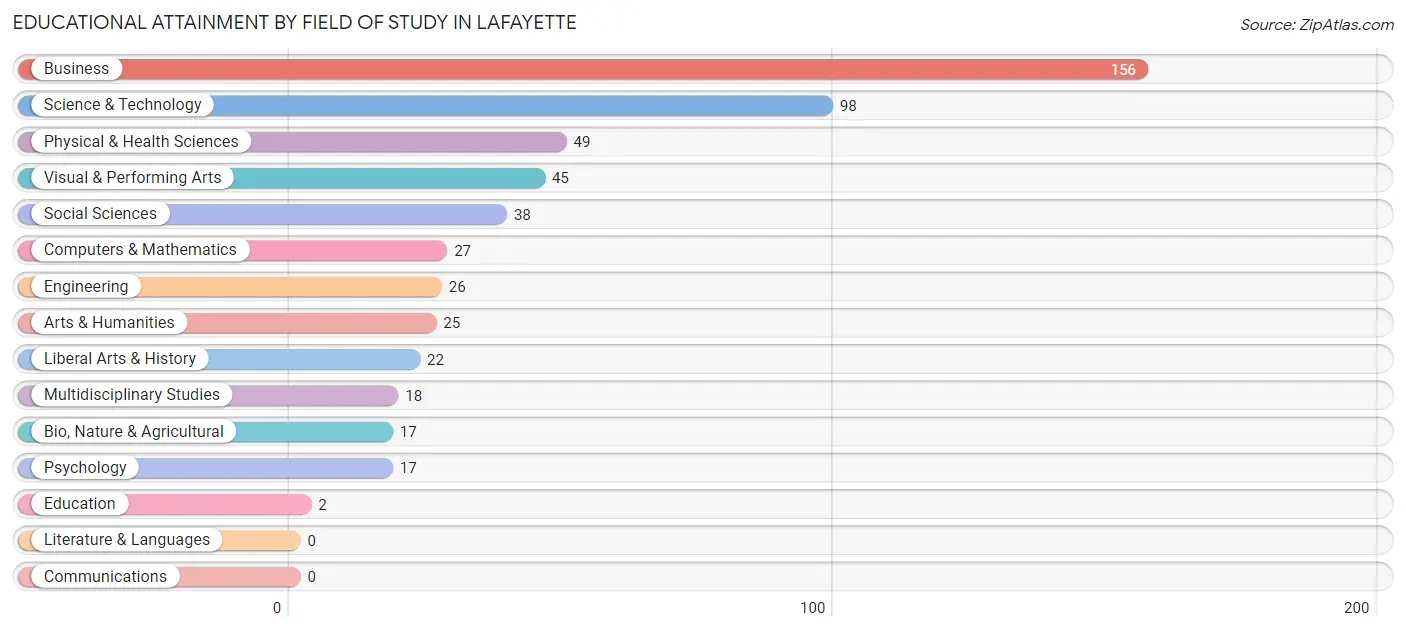
| Field of Study | # Graduates | % Graduates |
| Computers & Mathematics | 27 | 5.0% |
| Bio, Nature & Agricultural | 17 | 3.2% |
| Physical & Health Sciences | 49 | 9.1% |
| Psychology | 17 | 3.2% |
| Social Sciences | 38 | 7.0% |
| Engineering | 26 | 4.8% |
| Multidisciplinary Studies | 18 | 3.3% |
| Science & Technology | 98 | 18.1% |
| Business | 156 | 28.9% |
| Education | 2 | 0.4% |
| Literature & Languages | 0 | 0.0% |
| Liberal Arts & History | 22 | 4.1% |
| Visual & Performing Arts | 45 | 8.3% |
| Communications | 0 | 0.0% |
| Arts & Humanities | 25 | 4.6% |
| Total | 540 | 100.0% |
Transportation & Commute in Lafayette
Vehicle Availability by Sex in Lafayette
The most prevalent vehicle ownership categories in Lafayette are males with 2 vehicles (375, accounting for 30.0%) and females with 2 vehicles (265, making up 35.8%).
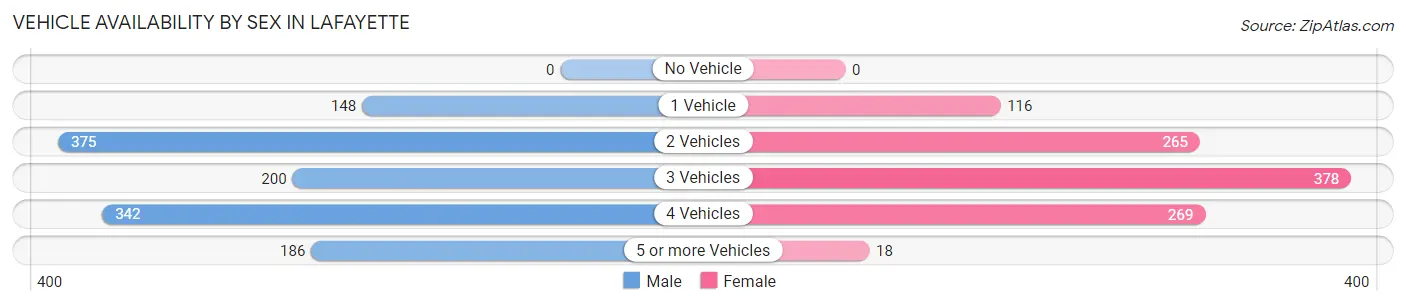
| Vehicles Available | Male | Female |
| No Vehicle | 0 (0.0%) | 0 (0.0%) |
| 1 Vehicle | 148 (11.8%) | 116 (11.1%) |
| 2 Vehicles | 375 (30.0%) | 265 (25.3%) |
| 3 Vehicles | 200 (16.0%) | 378 (36.1%) |
| 4 Vehicles | 342 (27.3%) | 269 (25.7%) |
| 5 or more Vehicles | 186 (14.9%) | 18 (1.7%) |
| Total | 1,251 (100.0%) | 1,046 (100.0%) |
Commute Time in Lafayette
The most frequently occuring commute durations in Lafayette are 60 to 89 minutes (369 commuters, 17.0%), 15 to 19 minutes (346 commuters, 15.9%), and 45 to 59 minutes (341 commuters, 15.7%).
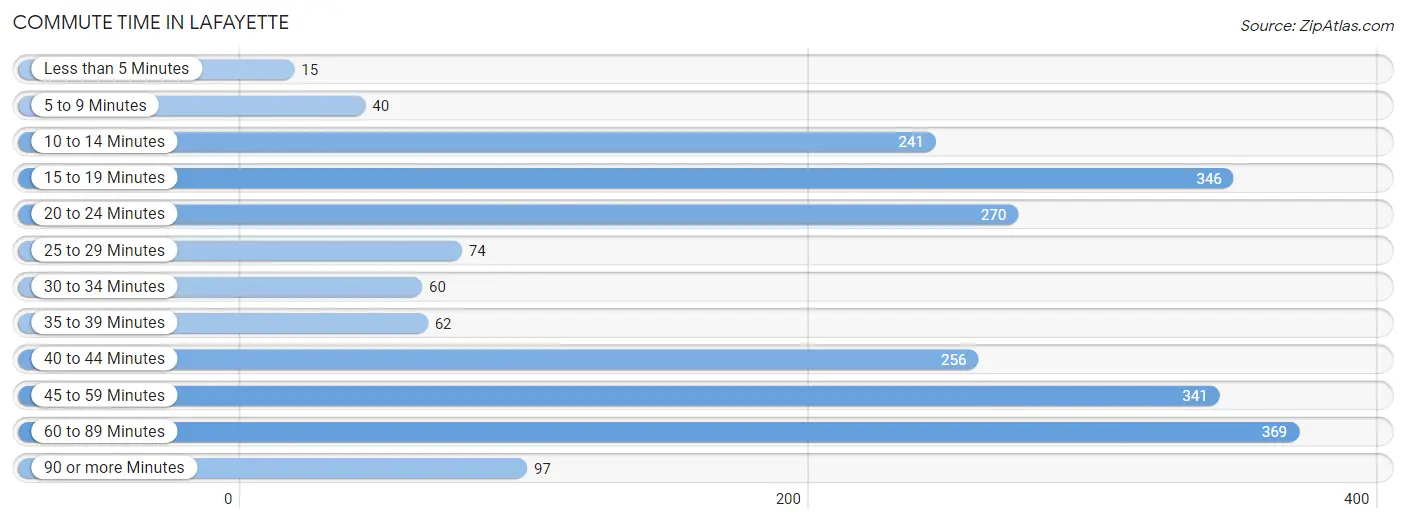
| Commute Time | # Commuters | % Commuters |
| Less than 5 Minutes | 15 | 0.7% |
| 5 to 9 Minutes | 40 | 1.8% |
| 10 to 14 Minutes | 241 | 11.1% |
| 15 to 19 Minutes | 346 | 15.9% |
| 20 to 24 Minutes | 270 | 12.4% |
| 25 to 29 Minutes | 74 | 3.4% |
| 30 to 34 Minutes | 60 | 2.8% |
| 35 to 39 Minutes | 62 | 2.9% |
| 40 to 44 Minutes | 256 | 11.8% |
| 45 to 59 Minutes | 341 | 15.7% |
| 60 to 89 Minutes | 369 | 17.0% |
| 90 or more Minutes | 97 | 4.5% |
Commute Time by Sex in Lafayette
The most common commute times in Lafayette are 60 to 89 minutes (267 commuters, 22.4%) for males and 15 to 19 minutes (227 commuters, 23.2%) for females.
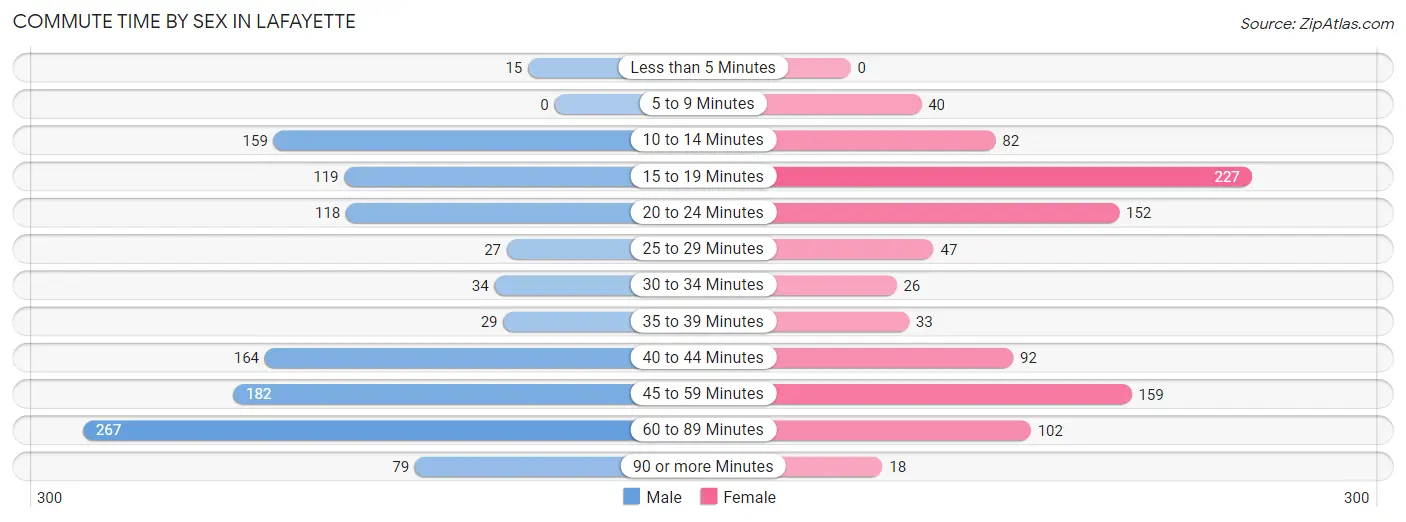
| Commute Time | Male | Female |
| Less than 5 Minutes | 15 (1.3%) | 0 (0.0%) |
| 5 to 9 Minutes | 0 (0.0%) | 40 (4.1%) |
| 10 to 14 Minutes | 159 (13.3%) | 82 (8.4%) |
| 15 to 19 Minutes | 119 (10.0%) | 227 (23.2%) |
| 20 to 24 Minutes | 118 (9.9%) | 152 (15.5%) |
| 25 to 29 Minutes | 27 (2.3%) | 47 (4.8%) |
| 30 to 34 Minutes | 34 (2.9%) | 26 (2.7%) |
| 35 to 39 Minutes | 29 (2.4%) | 33 (3.4%) |
| 40 to 44 Minutes | 164 (13.8%) | 92 (9.4%) |
| 45 to 59 Minutes | 182 (15.3%) | 159 (16.3%) |
| 60 to 89 Minutes | 267 (22.4%) | 102 (10.4%) |
| 90 or more Minutes | 79 (6.6%) | 18 (1.8%) |
Time of Departure to Work by Sex in Lafayette
The most frequent times of departure to work in Lafayette are 12:00 AM to 4:59 AM (240, 20.1%) for males and 6:30 AM to 6:59 AM (224, 22.9%) for females.
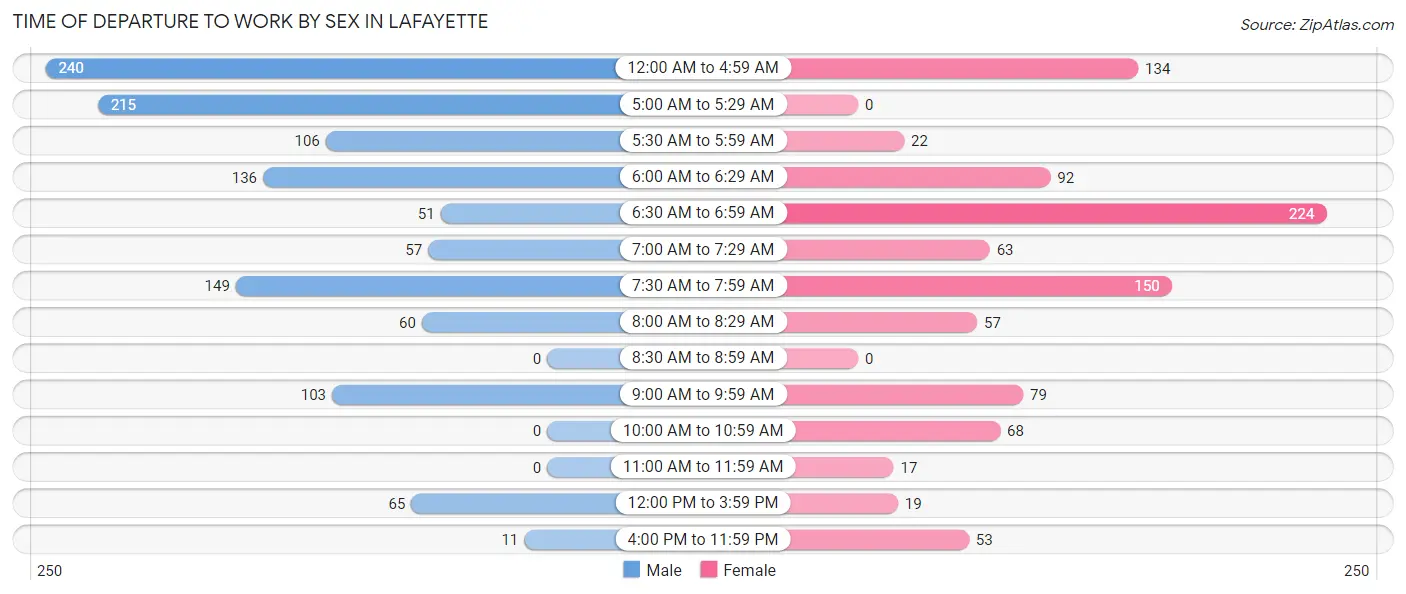
| Time of Departure | Male | Female |
| 12:00 AM to 4:59 AM | 240 (20.1%) | 134 (13.7%) |
| 5:00 AM to 5:29 AM | 215 (18.0%) | 0 (0.0%) |
| 5:30 AM to 5:59 AM | 106 (8.9%) | 22 (2.2%) |
| 6:00 AM to 6:29 AM | 136 (11.4%) | 92 (9.4%) |
| 6:30 AM to 6:59 AM | 51 (4.3%) | 224 (22.9%) |
| 7:00 AM to 7:29 AM | 57 (4.8%) | 63 (6.4%) |
| 7:30 AM to 7:59 AM | 149 (12.5%) | 150 (15.3%) |
| 8:00 AM to 8:29 AM | 60 (5.0%) | 57 (5.8%) |
| 8:30 AM to 8:59 AM | 0 (0.0%) | 0 (0.0%) |
| 9:00 AM to 9:59 AM | 103 (8.6%) | 79 (8.1%) |
| 10:00 AM to 10:59 AM | 0 (0.0%) | 68 (7.0%) |
| 11:00 AM to 11:59 AM | 0 (0.0%) | 17 (1.7%) |
| 12:00 PM to 3:59 PM | 65 (5.4%) | 19 (1.9%) |
| 4:00 PM to 11:59 PM | 11 (0.9%) | 53 (5.4%) |
| Total | 1,193 (100.0%) | 978 (100.0%) |
Housing Occupancy in Lafayette
Occupancy by Ownership in Lafayette
Of the total 1,440 dwellings in Lafayette, owner-occupied units account for 1,280 (88.9%), while renter-occupied units make up 160 (11.1%).
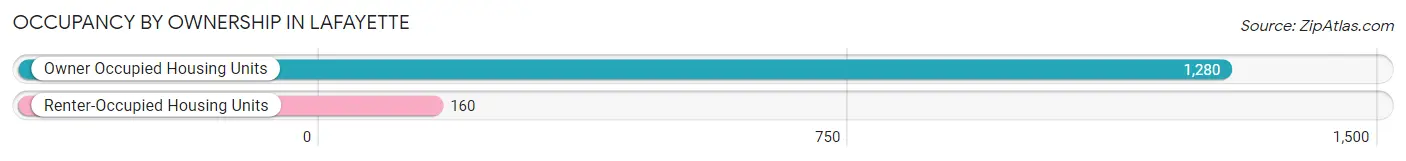
| Occupancy | # Housing Units | % Housing Units |
| Owner Occupied Housing Units | 1,280 | 88.9% |
| Renter-Occupied Housing Units | 160 | 11.1% |
| Total Occupied Housing Units | 1,440 | 100.0% |
Occupancy by Household Size in Lafayette
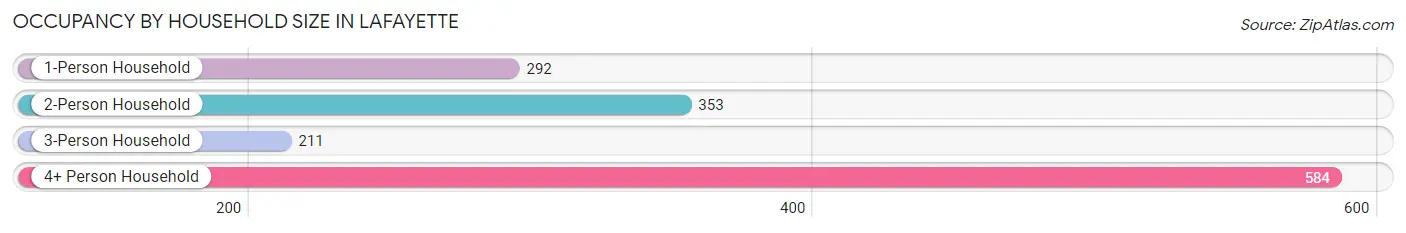
| Household Size | # Housing Units | % Housing Units |
| 1-Person Household | 292 | 20.3% |
| 2-Person Household | 353 | 24.5% |
| 3-Person Household | 211 | 14.6% |
| 4+ Person Household | 584 | 40.6% |
| Total Housing Units | 1,440 | 100.0% |
Occupancy by Ownership by Household Size in Lafayette
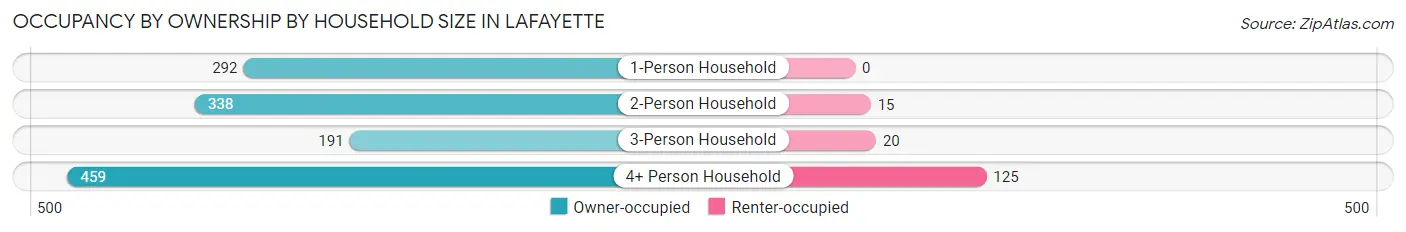
| Household Size | Owner-occupied | Renter-occupied |
| 1-Person Household | 292 (100.0%) | 0 (0.0%) |
| 2-Person Household | 338 (95.8%) | 15 (4.3%) |
| 3-Person Household | 191 (90.5%) | 20 (9.5%) |
| 4+ Person Household | 459 (78.6%) | 125 (21.4%) |
| Total Housing Units | 1,280 (88.9%) | 160 (11.1%) |
Occupancy by Educational Attainment in Lafayette
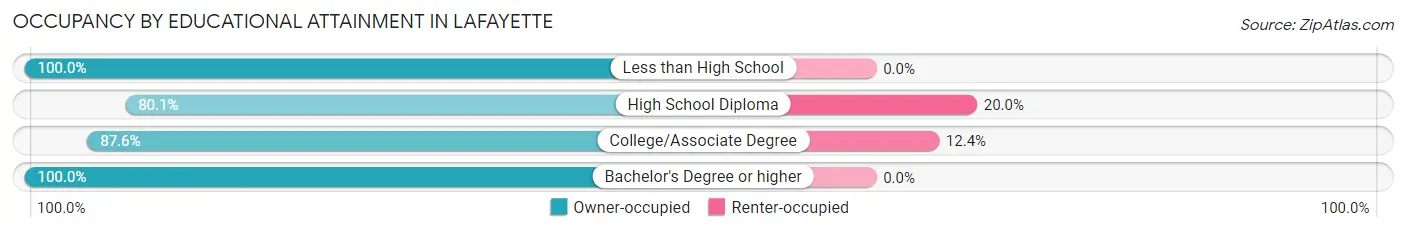
| Household Size | Owner-occupied | Renter-occupied |
| Less than High School | 21 (100.0%) | 0 (0.0%) |
| High School Diploma | 305 (80.0%) | 76 (20.0%) |
| College/Associate Degree | 591 (87.6%) | 84 (12.4%) |
| Bachelor's Degree or higher | 363 (100.0%) | 0 (0.0%) |
Occupancy by Age of Householder in Lafayette
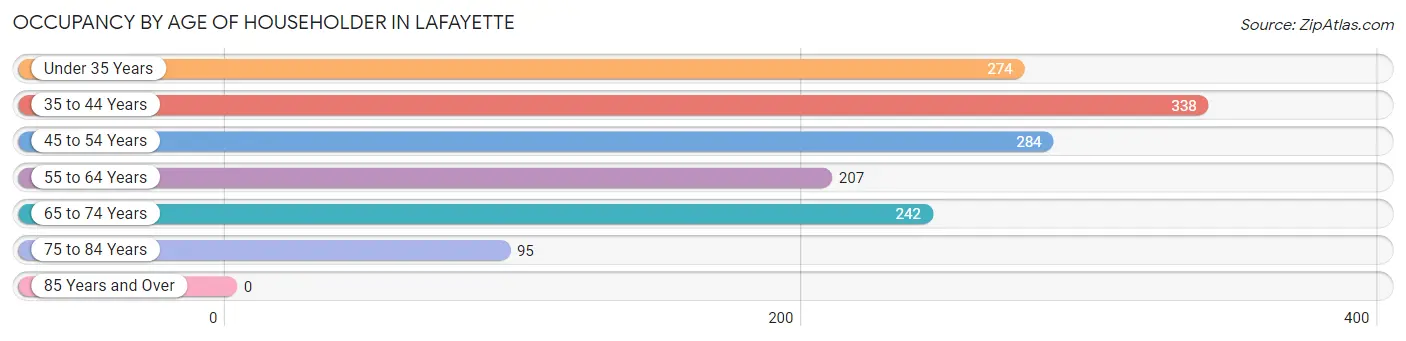
| Age Bracket | # Households | % Households |
| Under 35 Years | 274 | 19.0% |
| 35 to 44 Years | 338 | 23.5% |
| 45 to 54 Years | 284 | 19.7% |
| 55 to 64 Years | 207 | 14.4% |
| 65 to 74 Years | 242 | 16.8% |
| 75 to 84 Years | 95 | 6.6% |
| 85 Years and Over | 0 | 0.0% |
| Total | 1,440 | 100.0% |
Housing Finances in Lafayette
Median Income by Occupancy in Lafayette
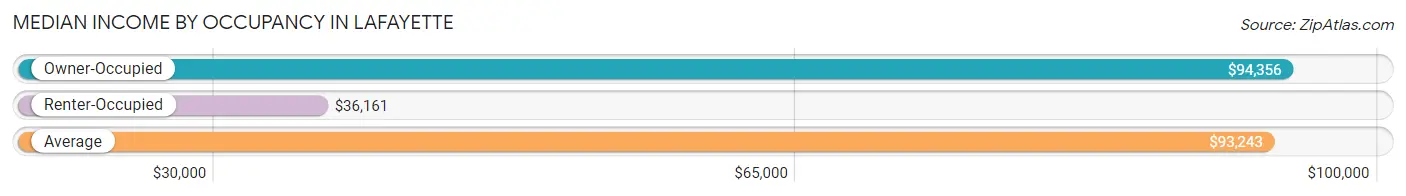
| Occupancy Type | # Households | Median Income |
| Owner-Occupied | 1,280 (88.9%) | $94,356 |
| Renter-Occupied | 160 (11.1%) | $36,161 |
| Average | 1,440 (100.0%) | $93,243 |
Occupancy by Householder Income Bracket in Lafayette
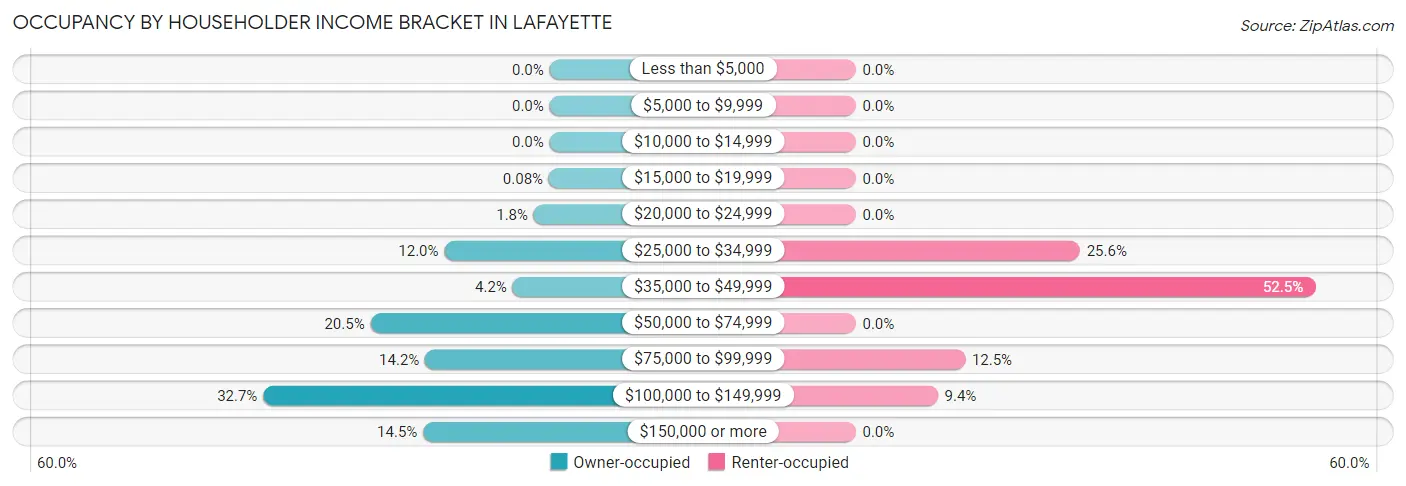
| Income Bracket | Owner-occupied | Renter-occupied |
| Less than $5,000 | 0 (0.0%) | 0 (0.0%) |
| $5,000 to $9,999 | 0 (0.0%) | 0 (0.0%) |
| $10,000 to $14,999 | 0 (0.0%) | 0 (0.0%) |
| $15,000 to $19,999 | 1 (0.1%) | 0 (0.0%) |
| $20,000 to $24,999 | 23 (1.8%) | 0 (0.0%) |
| $25,000 to $34,999 | 154 (12.0%) | 41 (25.6%) |
| $35,000 to $49,999 | 54 (4.2%) | 84 (52.5%) |
| $50,000 to $74,999 | 262 (20.5%) | 0 (0.0%) |
| $75,000 to $99,999 | 182 (14.2%) | 20 (12.5%) |
| $100,000 to $149,999 | 419 (32.7%) | 15 (9.4%) |
| $150,000 or more | 185 (14.4%) | 0 (0.0%) |
| Total | 1,280 (100.0%) | 160 (100.0%) |
Monthly Housing Cost Tiers in Lafayette
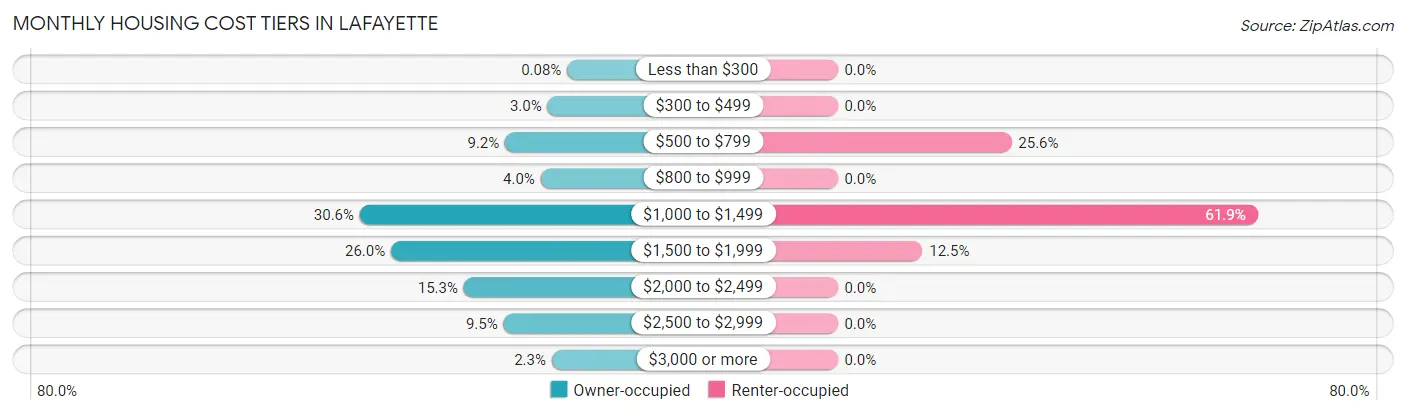
| Monthly Cost | Owner-occupied | Renter-occupied |
| Less than $300 | 1 (0.1%) | 0 (0.0%) |
| $300 to $499 | 38 (3.0%) | 0 (0.0%) |
| $500 to $799 | 118 (9.2%) | 41 (25.6%) |
| $800 to $999 | 51 (4.0%) | 0 (0.0%) |
| $1,000 to $1,499 | 392 (30.6%) | 99 (61.9%) |
| $1,500 to $1,999 | 333 (26.0%) | 20 (12.5%) |
| $2,000 to $2,499 | 196 (15.3%) | 0 (0.0%) |
| $2,500 to $2,999 | 121 (9.5%) | 0 (0.0%) |
| $3,000 or more | 30 (2.3%) | 0 (0.0%) |
| Total | 1,280 (100.0%) | 160 (100.0%) |
Physical Housing Characteristics in Lafayette
Housing Structures in Lafayette
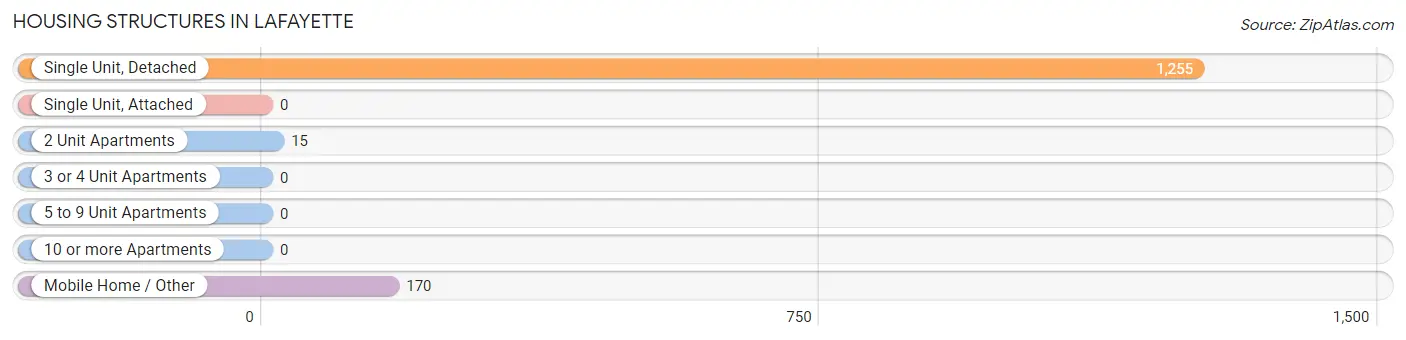
| Structure Type | # Housing Units | % Housing Units |
| Single Unit, Detached | 1,255 | 87.2% |
| Single Unit, Attached | 0 | 0.0% |
| 2 Unit Apartments | 15 | 1.0% |
| 3 or 4 Unit Apartments | 0 | 0.0% |
| 5 to 9 Unit Apartments | 0 | 0.0% |
| 10 or more Apartments | 0 | 0.0% |
| Mobile Home / Other | 170 | 11.8% |
| Total | 1,440 | 100.0% |
Housing Structures by Occupancy in Lafayette
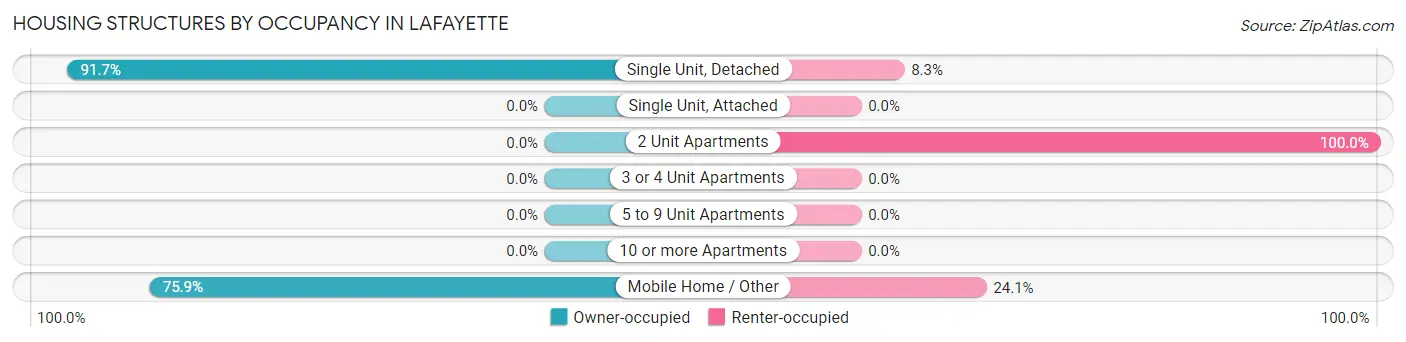
| Structure Type | Owner-occupied | Renter-occupied |
| Single Unit, Detached | 1,151 (91.7%) | 104 (8.3%) |
| Single Unit, Attached | 0 (0.0%) | 0 (0.0%) |
| 2 Unit Apartments | 0 (0.0%) | 15 (100.0%) |
| 3 or 4 Unit Apartments | 0 (0.0%) | 0 (0.0%) |
| 5 to 9 Unit Apartments | 0 (0.0%) | 0 (0.0%) |
| 10 or more Apartments | 0 (0.0%) | 0 (0.0%) |
| Mobile Home / Other | 129 (75.9%) | 41 (24.1%) |
| Total | 1,280 (88.9%) | 160 (11.1%) |
Housing Structures by Number of Rooms in Lafayette
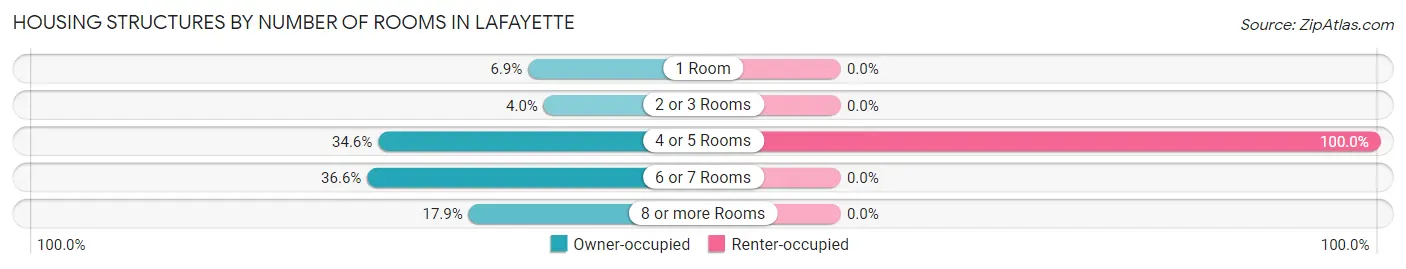
| Number of Rooms | Owner-occupied | Renter-occupied |
| 1 Room | 88 (6.9%) | 0 (0.0%) |
| 2 or 3 Rooms | 51 (4.0%) | 0 (0.0%) |
| 4 or 5 Rooms | 443 (34.6%) | 160 (100.0%) |
| 6 or 7 Rooms | 469 (36.6%) | 0 (0.0%) |
| 8 or more Rooms | 229 (17.9%) | 0 (0.0%) |
| Total | 1,280 (100.0%) | 160 (100.0%) |
Housing Structure by Heating Type in Lafayette
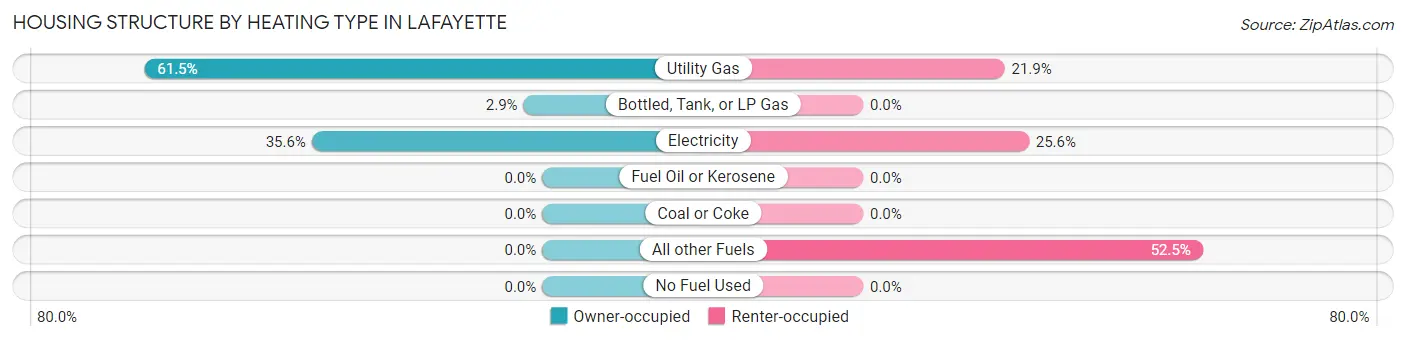
| Heating Type | Owner-occupied | Renter-occupied |
| Utility Gas | 787 (61.5%) | 35 (21.9%) |
| Bottled, Tank, or LP Gas | 37 (2.9%) | 0 (0.0%) |
| Electricity | 456 (35.6%) | 41 (25.6%) |
| Fuel Oil or Kerosene | 0 (0.0%) | 0 (0.0%) |
| Coal or Coke | 0 (0.0%) | 0 (0.0%) |
| All other Fuels | 0 (0.0%) | 84 (52.5%) |
| No Fuel Used | 0 (0.0%) | 0 (0.0%) |
| Total | 1,280 (100.0%) | 160 (100.0%) |
Household Vehicle Usage in Lafayette
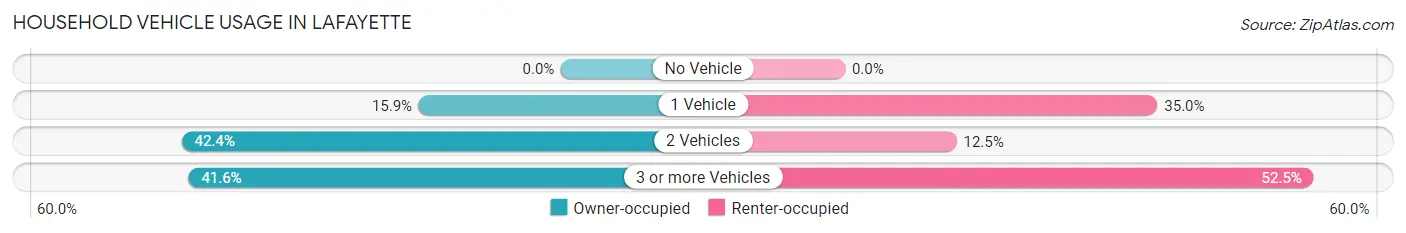
| Vehicles per Household | Owner-occupied | Renter-occupied |
| No Vehicle | 0 (0.0%) | 0 (0.0%) |
| 1 Vehicle | 204 (15.9%) | 56 (35.0%) |
| 2 Vehicles | 543 (42.4%) | 20 (12.5%) |
| 3 or more Vehicles | 533 (41.6%) | 84 (52.5%) |
| Total | 1,280 (100.0%) | 160 (100.0%) |
Real Estate & Mortgages in Lafayette
Real Estate and Mortgage Overview in Lafayette
| Characteristic | Without Mortgage | With Mortgage |
| Housing Units | 174 | 1,106 |
| Median Property Value | $181,300 | $373,700 |
| Median Household Income | $60,489 | $168 |
| Monthly Housing Costs | $635 | $30 |
| Real Estate Taxes | $1,717 | $0 |
Property Value by Mortgage Status in Lafayette
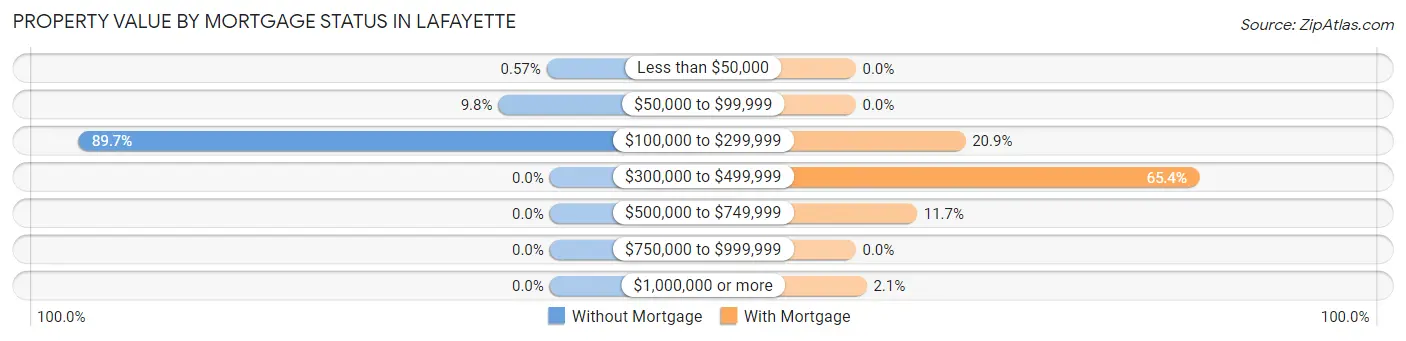
| Property Value | Without Mortgage | With Mortgage |
| Less than $50,000 | 1 (0.6%) | 0 (0.0%) |
| $50,000 to $99,999 | 17 (9.8%) | 0 (0.0%) |
| $100,000 to $299,999 | 156 (89.7%) | 231 (20.9%) |
| $300,000 to $499,999 | 0 (0.0%) | 723 (65.4%) |
| $500,000 to $749,999 | 0 (0.0%) | 129 (11.7%) |
| $750,000 to $999,999 | 0 (0.0%) | 0 (0.0%) |
| $1,000,000 or more | 0 (0.0%) | 23 (2.1%) |
| Total | 174 (100.0%) | 1,106 (100.0%) |
Household Income by Mortgage Status in Lafayette
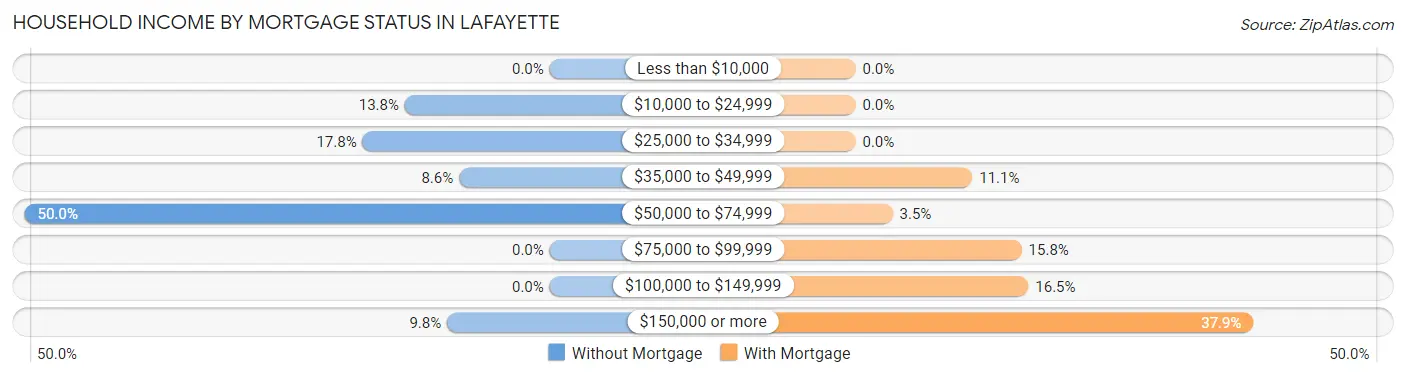
| Household Income | Without Mortgage | With Mortgage |
| Less than $10,000 | 0 (0.0%) | 0 (0.0%) |
| $10,000 to $24,999 | 24 (13.8%) | 0 (0.0%) |
| $25,000 to $34,999 | 31 (17.8%) | 0 (0.0%) |
| $35,000 to $49,999 | 15 (8.6%) | 123 (11.1%) |
| $50,000 to $74,999 | 87 (50.0%) | 39 (3.5%) |
| $75,000 to $99,999 | 0 (0.0%) | 175 (15.8%) |
| $100,000 to $149,999 | 0 (0.0%) | 182 (16.5%) |
| $150,000 or more | 17 (9.8%) | 419 (37.9%) |
| Total | 174 (100.0%) | 1,106 (100.0%) |
Property Value to Household Income Ratio in Lafayette
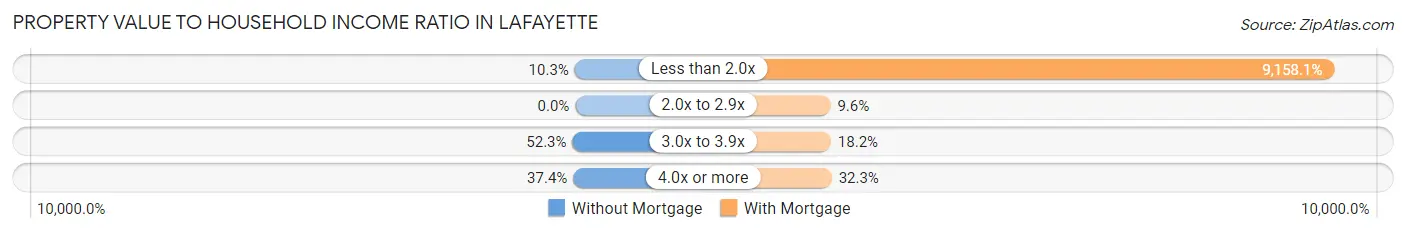
| Value-to-Income Ratio | Without Mortgage | With Mortgage |
| Less than 2.0x | 18 (10.3%) | 101,288 (9,158.1%) |
| 2.0x to 2.9x | 0 (0.0%) | 106 (9.6%) |
| 3.0x to 3.9x | 91 (52.3%) | 201 (18.2%) |
| 4.0x or more | 65 (37.4%) | 357 (32.3%) |
| Total | 174 (100.0%) | 1,106 (100.0%) |
Real Estate Taxes by Mortgage Status in Lafayette
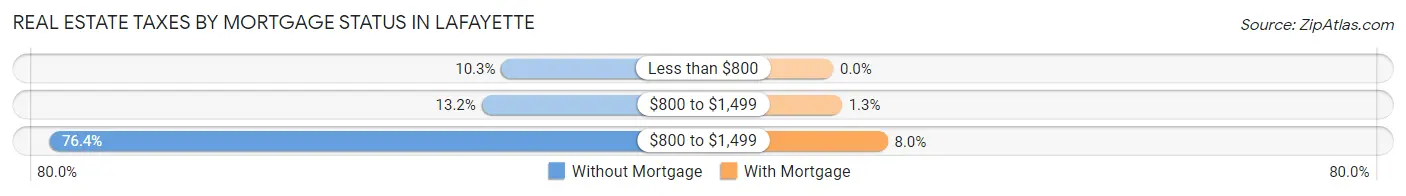
| Property Taxes | Without Mortgage | With Mortgage |
| Less than $800 | 18 (10.3%) | 0 (0.0%) |
| $800 to $1,499 | 23 (13.2%) | 14 (1.3%) |
| $800 to $1,499 | 133 (76.4%) | 88 (8.0%) |
| Total | 174 (100.0%) | 1,106 (100.0%) |
Health & Disability in Lafayette
Health Insurance Coverage by Age in Lafayette
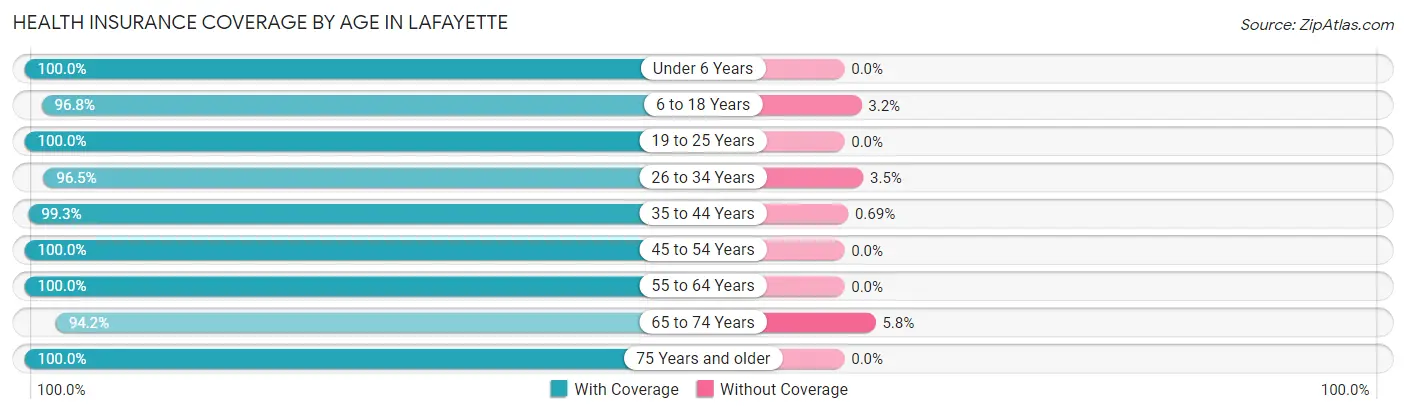
| Age Bracket | With Coverage | Without Coverage |
| Under 6 Years | 326 (100.0%) | 0 (0.0%) |
| 6 to 18 Years | 822 (96.8%) | 27 (3.2%) |
| 19 to 25 Years | 413 (100.0%) | 0 (0.0%) |
| 26 to 34 Years | 633 (96.5%) | 23 (3.5%) |
| 35 to 44 Years | 576 (99.3%) | 4 (0.7%) |
| 45 to 54 Years | 535 (100.0%) | 0 (0.0%) |
| 55 to 64 Years | 529 (100.0%) | 0 (0.0%) |
| 65 to 74 Years | 356 (94.2%) | 22 (5.8%) |
| 75 Years and older | 125 (100.0%) | 0 (0.0%) |
| Total | 4,315 (98.3%) | 76 (1.7%) |
Health Insurance Coverage by Citizenship Status in Lafayette
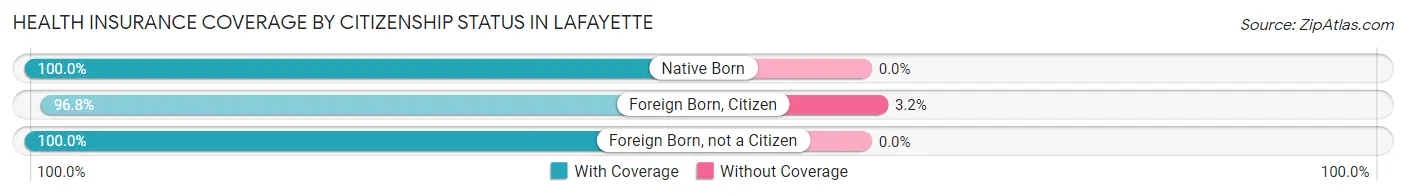
| Citizenship Status | With Coverage | Without Coverage |
| Native Born | 326 (100.0%) | 0 (0.0%) |
| Foreign Born, Citizen | 822 (96.8%) | 27 (3.2%) |
| Foreign Born, not a Citizen | 413 (100.0%) | 0 (0.0%) |
Health Insurance Coverage by Household Income in Lafayette
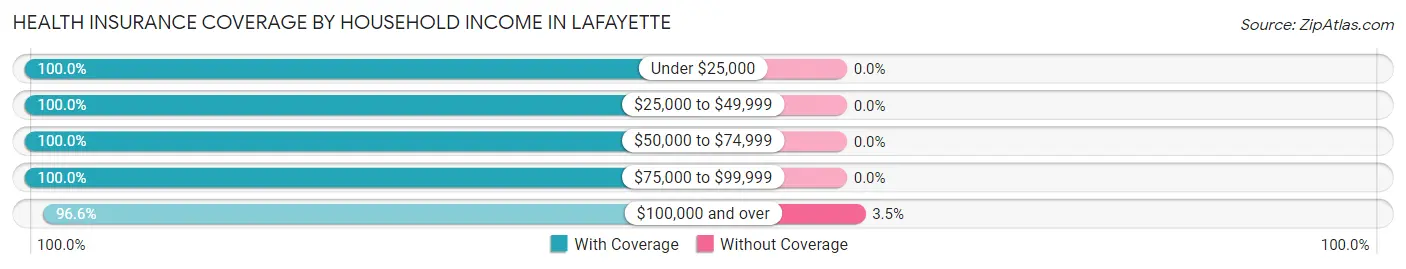
| Household Income | With Coverage | Without Coverage |
| Under $25,000 | 24 (100.0%) | 0 (0.0%) |
| $25,000 to $49,999 | 851 (100.0%) | 0 (0.0%) |
| $50,000 to $74,999 | 614 (100.0%) | 0 (0.0%) |
| $75,000 to $99,999 | 699 (100.0%) | 0 (0.0%) |
| $100,000 and over | 2,127 (96.6%) | 76 (3.5%) |
Public vs Private Health Insurance Coverage by Age in Lafayette
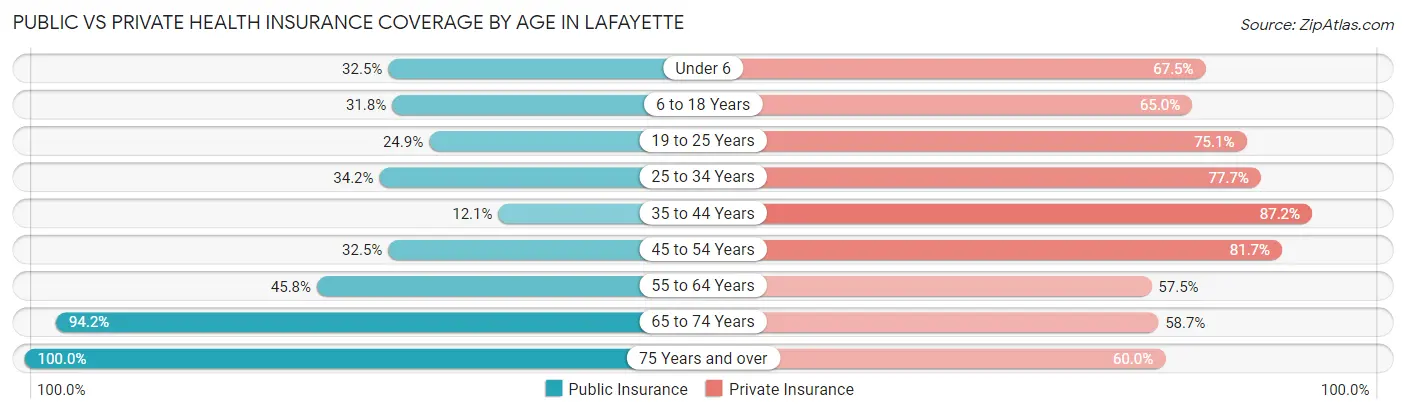
| Age Bracket | Public Insurance | Private Insurance |
| Under 6 | 106 (32.5%) | 220 (67.5%) |
| 6 to 18 Years | 270 (31.8%) | 552 (65.0%) |
| 19 to 25 Years | 103 (24.9%) | 310 (75.1%) |
| 25 to 34 Years | 224 (34.2%) | 510 (77.7%) |
| 35 to 44 Years | 70 (12.1%) | 506 (87.2%) |
| 45 to 54 Years | 174 (32.5%) | 437 (81.7%) |
| 55 to 64 Years | 242 (45.8%) | 304 (57.5%) |
| 65 to 74 Years | 356 (94.2%) | 222 (58.7%) |
| 75 Years and over | 125 (100.0%) | 75 (60.0%) |
| Total | 1,670 (38.0%) | 3,136 (71.4%) |
Disability Status by Sex by Age in Lafayette
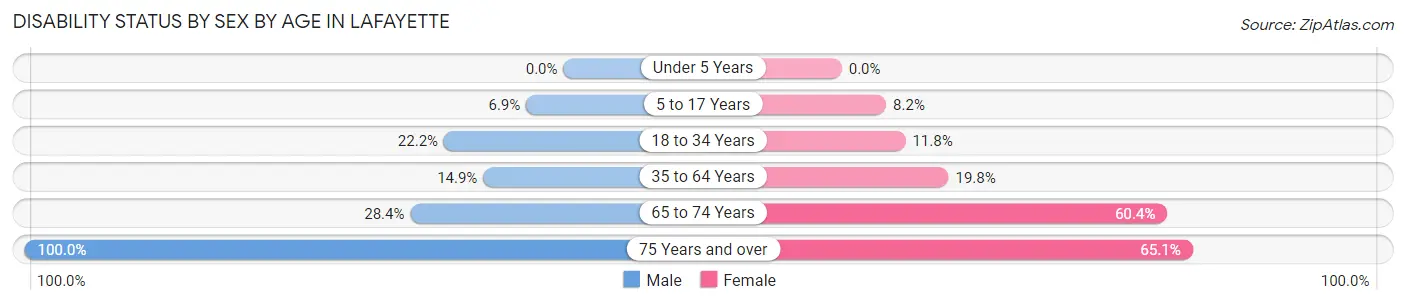
| Age Bracket | Male | Female |
| Under 5 Years | 0 (0.0%) | 0 (0.0%) |
| 5 to 17 Years | 32 (6.9%) | 27 (8.2%) |
| 18 to 34 Years | 131 (22.2%) | 67 (11.8%) |
| 35 to 64 Years | 129 (14.9%) | 154 (19.8%) |
| 65 to 74 Years | 50 (28.4%) | 122 (60.4%) |
| 75 Years and over | 82 (100.0%) | 28 (65.1%) |
Disability Class by Sex by Age in Lafayette
Disability Class: Hearing Difficulty
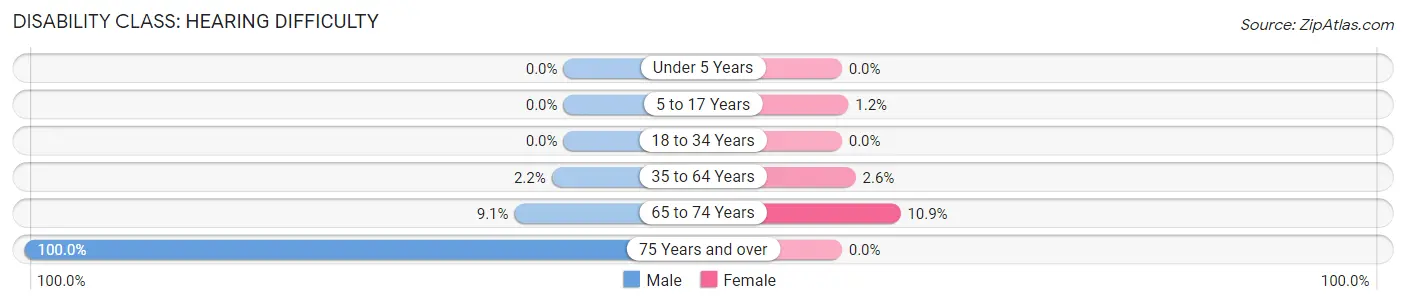
| Age Bracket | Male | Female |
| Under 5 Years | 0 (0.0%) | 0 (0.0%) |
| 5 to 17 Years | 0 (0.0%) | 4 (1.2%) |
| 18 to 34 Years | 0 (0.0%) | 0 (0.0%) |
| 35 to 64 Years | 19 (2.2%) | 20 (2.6%) |
| 65 to 74 Years | 16 (9.1%) | 22 (10.9%) |
| 75 Years and over | 82 (100.0%) | 0 (0.0%) |
Disability Class: Vision Difficulty
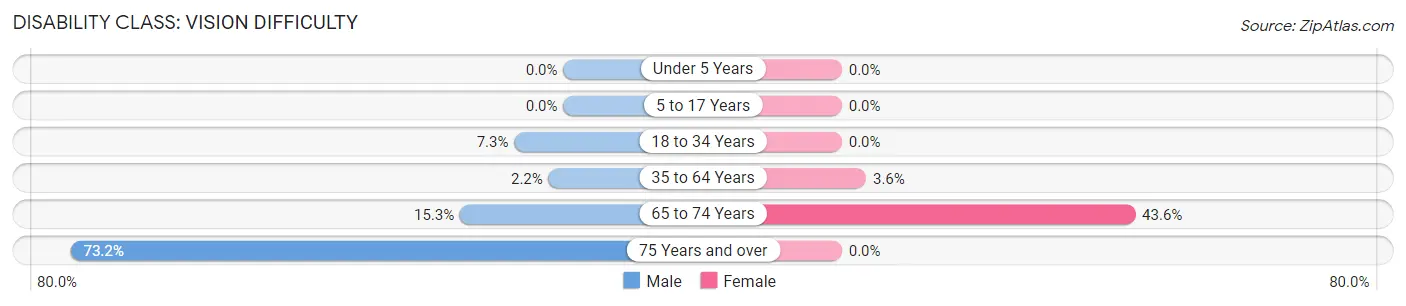
| Age Bracket | Male | Female |
| Under 5 Years | 0 (0.0%) | 0 (0.0%) |
| 5 to 17 Years | 0 (0.0%) | 0 (0.0%) |
| 18 to 34 Years | 43 (7.3%) | 0 (0.0%) |
| 35 to 64 Years | 19 (2.2%) | 28 (3.6%) |
| 65 to 74 Years | 27 (15.3%) | 88 (43.6%) |
| 75 Years and over | 60 (73.2%) | 0 (0.0%) |
Disability Class: Cognitive Difficulty
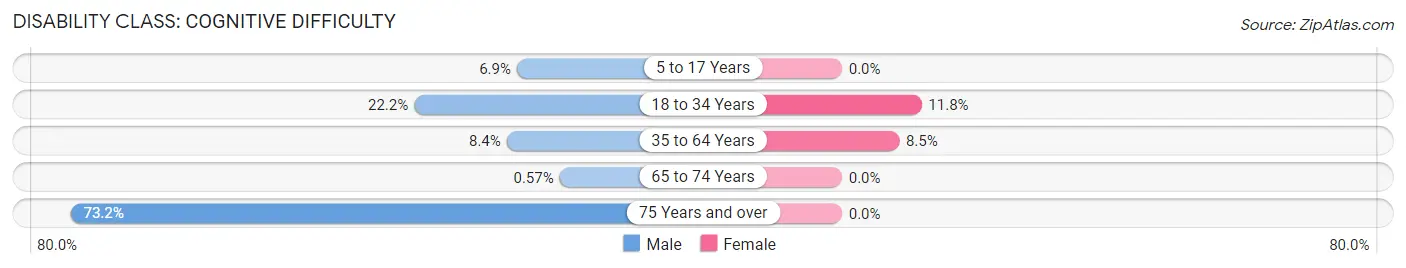
| Age Bracket | Male | Female |
| 5 to 17 Years | 32 (6.9%) | 0 (0.0%) |
| 18 to 34 Years | 131 (22.2%) | 67 (11.8%) |
| 35 to 64 Years | 73 (8.4%) | 66 (8.5%) |
| 65 to 74 Years | 1 (0.6%) | 0 (0.0%) |
| 75 Years and over | 60 (73.2%) | 0 (0.0%) |
Disability Class: Ambulatory Difficulty
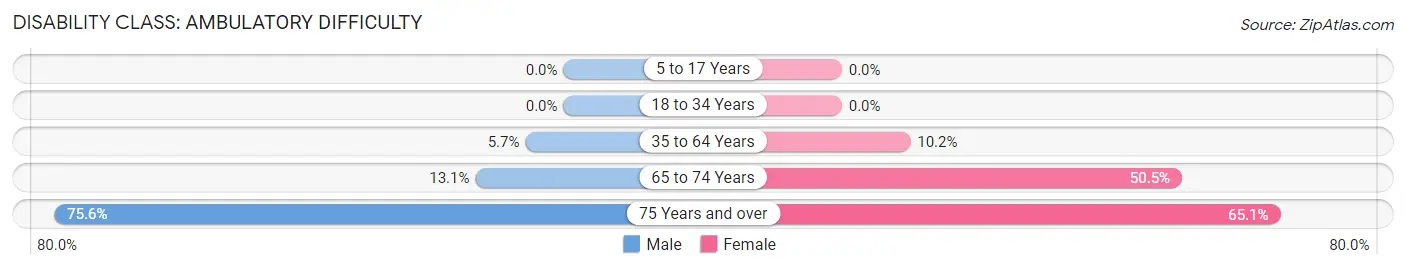
| Age Bracket | Male | Female |
| 5 to 17 Years | 0 (0.0%) | 0 (0.0%) |
| 18 to 34 Years | 0 (0.0%) | 0 (0.0%) |
| 35 to 64 Years | 49 (5.7%) | 79 (10.2%) |
| 65 to 74 Years | 23 (13.1%) | 102 (50.5%) |
| 75 Years and over | 62 (75.6%) | 28 (65.1%) |
Disability Class: Self-Care Difficulty
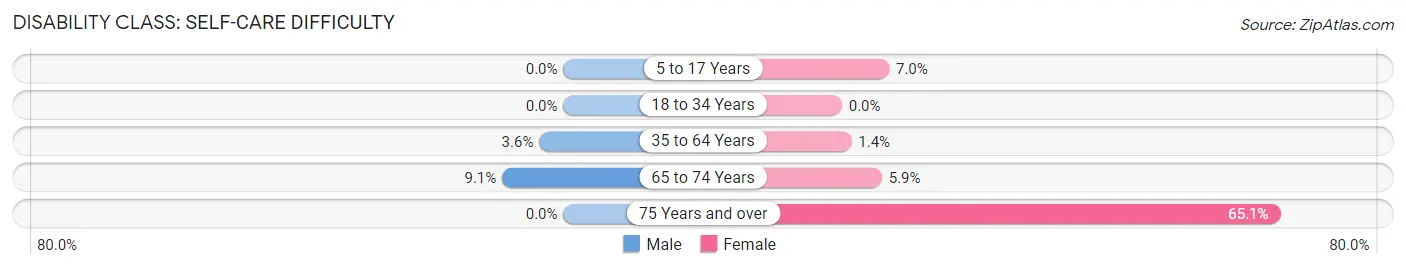
| Age Bracket | Male | Female |
| 5 to 17 Years | 0 (0.0%) | 23 (7.0%) |
| 18 to 34 Years | 0 (0.0%) | 0 (0.0%) |
| 35 to 64 Years | 31 (3.6%) | 11 (1.4%) |
| 65 to 74 Years | 16 (9.1%) | 12 (5.9%) |
| 75 Years and over | 0 (0.0%) | 28 (65.1%) |
Technology Access in Lafayette
Computing Device Access in Lafayette
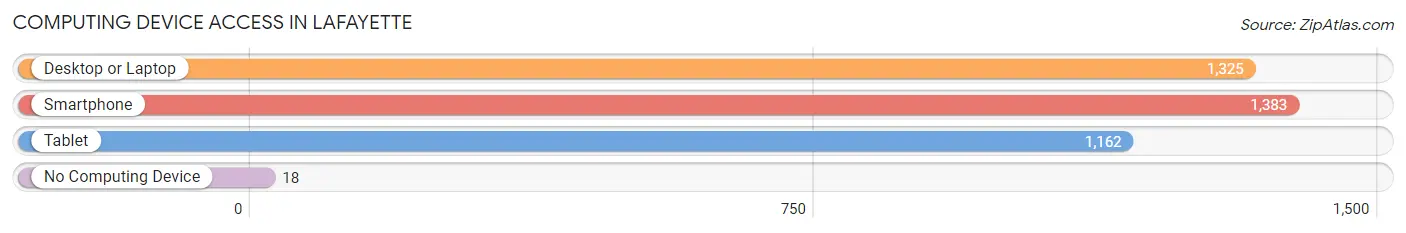
| Device Type | # Households | % Households |
| Desktop or Laptop | 1,325 | 92.0% |
| Smartphone | 1,383 | 96.0% |
| Tablet | 1,162 | 80.7% |
| No Computing Device | 18 | 1.3% |
| Total | 1,440 | 100.0% |
Internet Access in Lafayette
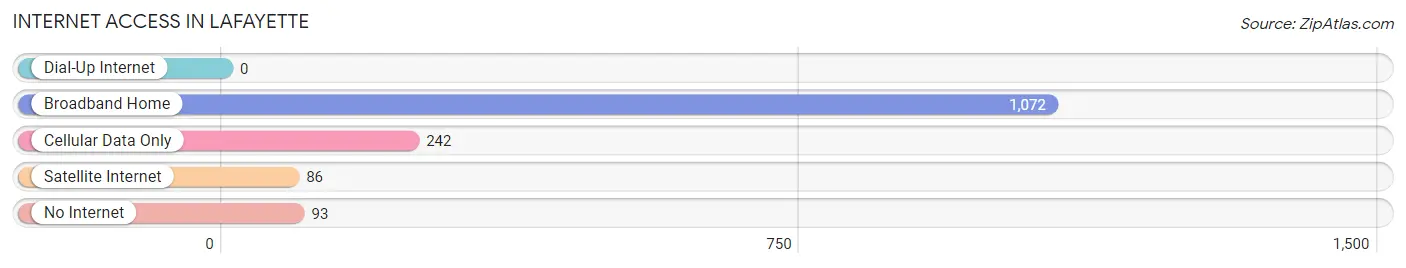
| Internet Type | # Households | % Households |
| Dial-Up Internet | 0 | 0.0% |
| Broadband Home | 1,072 | 74.4% |
| Cellular Data Only | 242 | 16.8% |
| Satellite Internet | 86 | 6.0% |
| No Internet | 93 | 6.5% |
| Total | 1,440 | 100.0% |
Lafayette Summary
Lafayette is a small city located in Yamhill County, Oregon, United States. It is situated in the Willamette Valley, approximately 25 miles southwest of Portland. The city is part of the Portland metropolitan area and has a population of approximately 4,000 people.
History
The area that is now Lafayette was first settled in the 1840s by pioneers from the Oregon Trail. The first post office was established in 1851 and the city was officially incorporated in 1891. The city was named after the Marquis de Lafayette, a French military leader who fought in the American Revolutionary War.
In the early 1900s, the city was a major center for the timber industry. The city was also home to a number of sawmills and lumber yards. The timber industry declined in the mid-1900s and the city shifted its focus to agriculture. Today, the city is home to a number of wineries and vineyards.
Geography
Lafayette is located in the Willamette Valley, approximately 25 miles southwest of Portland. The city is situated on the banks of the Yamhill River and is surrounded by rolling hills and forests. The city has a total area of 1.7 square miles, all of which is land.
The climate in Lafayette is mild and temperate. The average temperature in the summer is around 75 degrees Fahrenheit and the average temperature in the winter is around 40 degrees Fahrenheit. The city receives an average of 37 inches of precipitation per year.
Economy
The economy of Lafayette is largely based on agriculture. The city is home to a number of wineries and vineyards, as well as a number of farms that produce a variety of fruits and vegetables. The city is also home to a number of small businesses, including restaurants, retail stores, and professional services.
Demographics
As of the 2010 census, the population of Lafayette was 4,000. The racial makeup of the city was 94.3% White, 0.7% African American, 0.7% Native American, 0.7% Asian, 0.3% Pacific Islander, and 2.7% from other races. The median household income in the city was $50,000 and the median family income was $55,000. The per capita income in the city was $22,000.
Conclusion
Lafayette is a small city located in Yamhill County, Oregon. It is situated in the Willamette Valley, approximately 25 miles southwest of Portland. The city was first settled in the 1840s and was officially incorporated in 1891. The economy of Lafayette is largely based on agriculture, with a number of wineries and vineyards, as well as a number of small businesses. The population of the city was 4,000 as of the 2010 census.
Common Questions
What is Per Capita Income in Lafayette?
Per Capita income in Lafayette is $32,364.
What is the Median Family Income in Lafayette?
Median Family Income in Lafayette is $95,292.
What is the Median Household income in Lafayette?
Median Household Income in Lafayette is $93,243.
What is Income or Wage Gap in Lafayette?
Income or Wage Gap in Lafayette is 4.9%.
Women in Lafayette earn 95.1 cents for every dollar earned by a man.
What is Inequality or Gini Index in Lafayette?
Inequality or Gini Index in Lafayette is 0.33.
What is the Total Population of Lafayette?
Total Population of Lafayette is 4,391.
What is the Total Male Population of Lafayette?
Total Male Population of Lafayette is 2,327.
What is the Total Female Population of Lafayette?
Total Female Population of Lafayette is 2,064.
What is the Ratio of Males per 100 Females in Lafayette?
There are 112.74 Males per 100 Females in Lafayette.
What is the Ratio of Females per 100 Males in Lafayette?
There are 88.70 Females per 100 Males in Lafayette.
What is the Median Population Age in Lafayette?
Median Population Age in Lafayette is 34.0 Years.
What is the Average Family Size in Lafayette
Average Family Size in Lafayette is 3.4 People.
What is the Average Household Size in Lafayette
Average Household Size in Lafayette is 3.0 People.
How Large is the Labor Force in Lafayette?
There are 2,429 People in the Labor Forcein in Lafayette.
What is the Percentage of People in the Labor Force in Lafayette?
72.8% of People are in the Labor Force in Lafayette.
What is the Unemployment Rate in Lafayette?
Unemployment Rate in Lafayette is 4.7%.