Cascade Locks, OR Map & Demographics
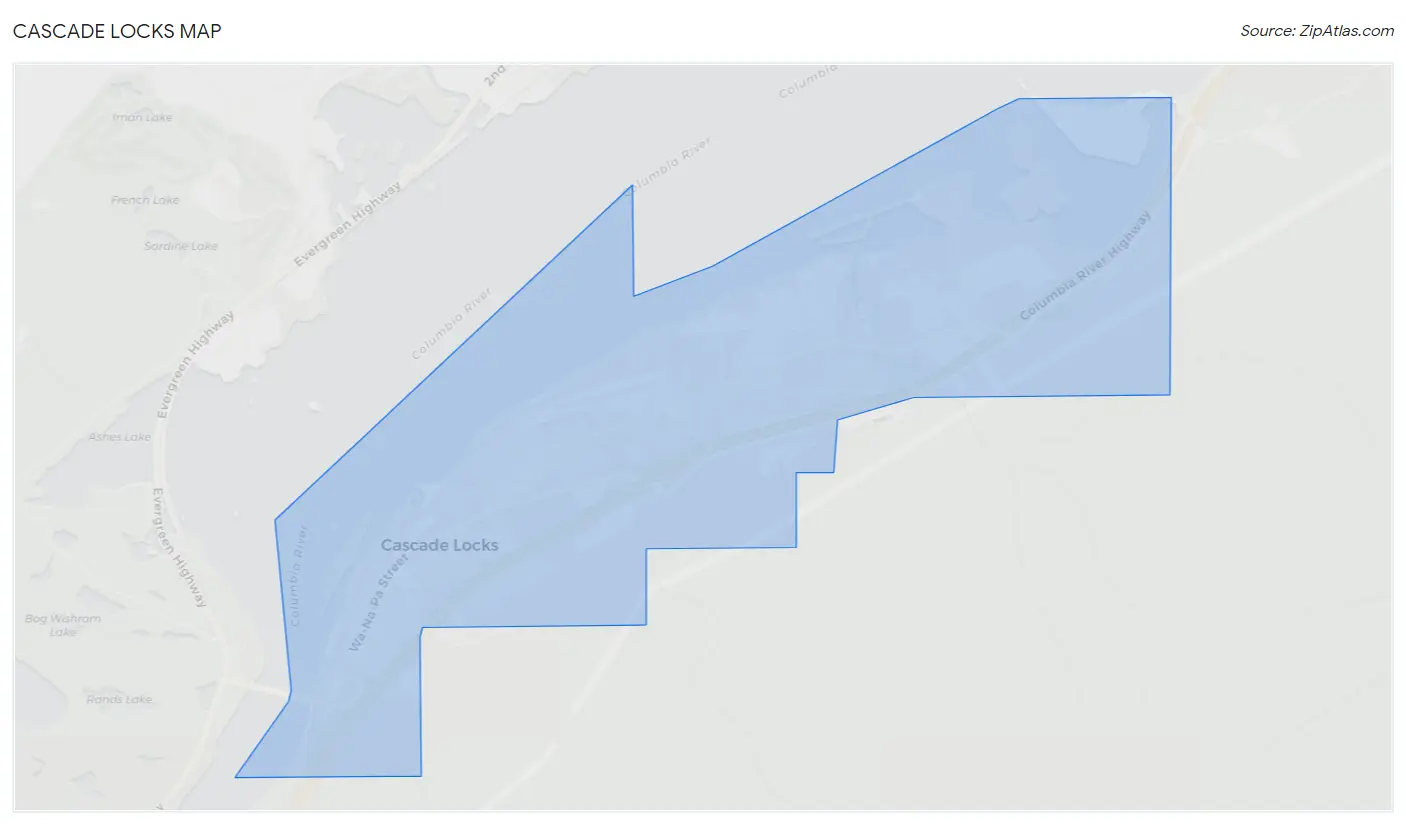
Cascade Locks Map
Cascade Locks Overview
$39,545
PER CAPITA INCOME
$69,318
AVG FAMILY INCOME
$62,195
AVG HOUSEHOLD INCOME
37.3%
WAGE / INCOME GAP [ % ]
62.7¢/ $1
WAGE / INCOME GAP [ $ ]
0.37
INEQUALITY / GINI INDEX
1,418
TOTAL POPULATION
713
MALE POPULATION
705
FEMALE POPULATION
101.13
MALES / 100 FEMALES
98.88
FEMALES / 100 MALES
46.9
MEDIAN AGE
2.7
AVG FAMILY SIZE
2.2
AVG HOUSEHOLD SIZE
786
LABOR FORCE [ PEOPLE ]
64.3%
PERCENT IN LABOR FORCE
3.8%
UNEMPLOYMENT RATE
Cascade Locks Zip Codes
Income in Cascade Locks
Income Overview in Cascade Locks
Per Capita Income in Cascade Locks is $39,545, while median incomes of families and households are $69,318 and $62,195 respectively.
| Characteristic | Number | Measure |
| Per Capita Income | 1,418 | $39,545 |
| Median Family Income | 418 | $69,318 |
| Mean Family Income | 418 | $95,731 |
| Median Household Income | 639 | $62,195 |
| Mean Household Income | 639 | $83,165 |
| Income Deficit | 418 | $0 |
| Wage / Income Gap (%) | 1,418 | 37.26% |
| Wage / Income Gap ($) | 1,418 | 62.74¢ per $1 |
| Gini / Inequality Index | 1,418 | 0.37 |
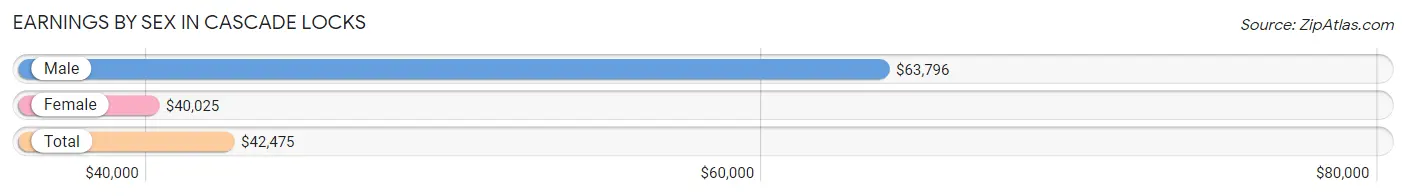
Earnings by Sex in Cascade Locks
Average Earnings in Cascade Locks are $42,475, $63,796 for men and $40,025 for women, a difference of 37.3%.
| Sex | Number | Average Earnings |
| Male | 372 (47.9%) | $63,796 |
| Female | 404 (52.1%) | $40,025 |
| Total | 776 (100.0%) | $42,475 |
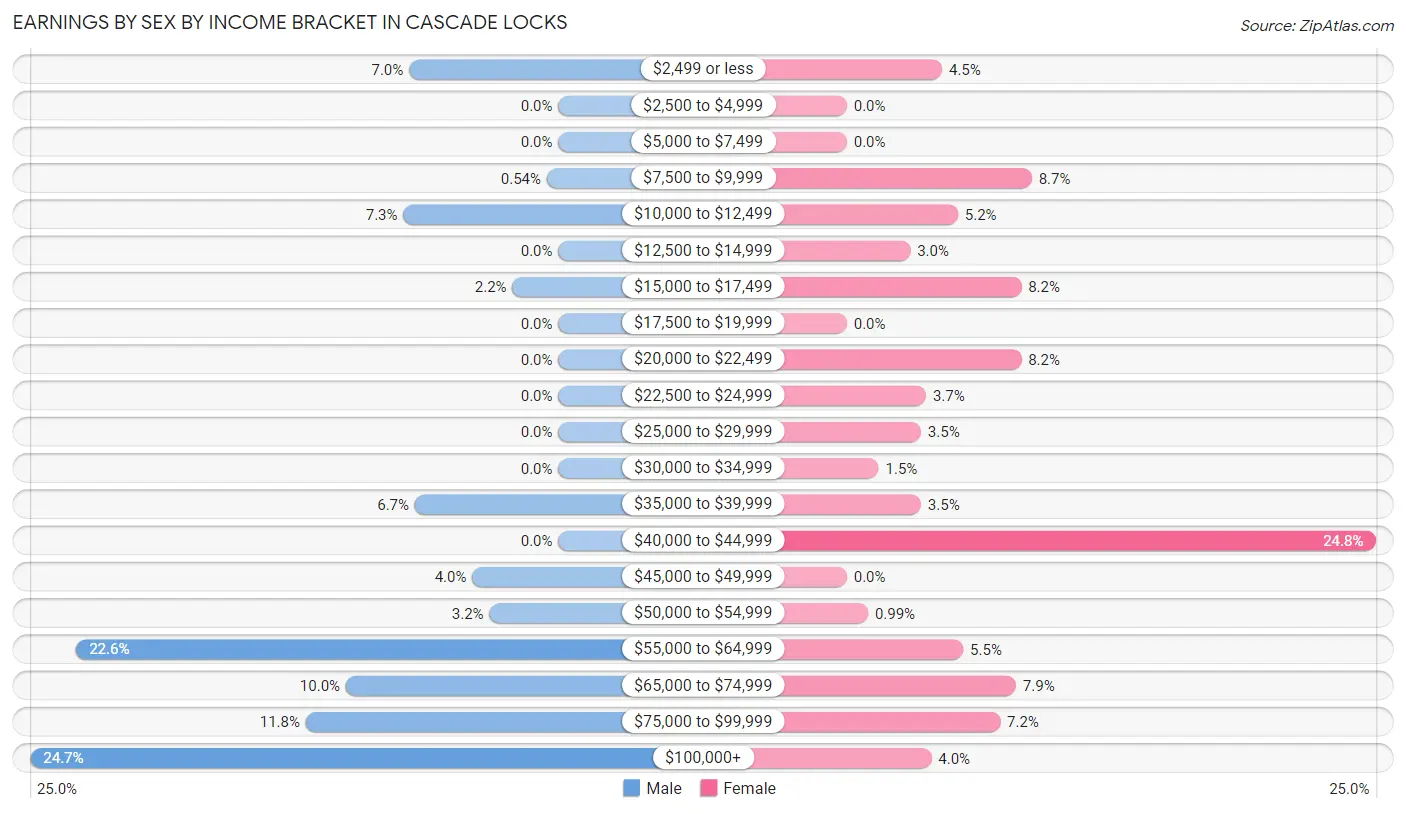
Earnings by Sex by Income Bracket in Cascade Locks
The most common earnings brackets in Cascade Locks are $100,000+ for men (92 | 24.7%) and $40,000 to $44,999 for women (100 | 24.7%).
| Income | Male | Female |
| $2,499 or less | 26 (7.0%) | 18 (4.5%) |
| $2,500 to $4,999 | 0 (0.0%) | 0 (0.0%) |
| $5,000 to $7,499 | 0 (0.0%) | 0 (0.0%) |
| $7,500 to $9,999 | 2 (0.5%) | 35 (8.7%) |
| $10,000 to $12,499 | 27 (7.3%) | 21 (5.2%) |
| $12,500 to $14,999 | 0 (0.0%) | 12 (3.0%) |
| $15,000 to $17,499 | 8 (2.1%) | 33 (8.2%) |
| $17,500 to $19,999 | 0 (0.0%) | 0 (0.0%) |
| $20,000 to $22,499 | 0 (0.0%) | 33 (8.2%) |
| $22,500 to $24,999 | 0 (0.0%) | 15 (3.7%) |
| $25,000 to $29,999 | 0 (0.0%) | 14 (3.5%) |
| $30,000 to $34,999 | 0 (0.0%) | 6 (1.5%) |
| $35,000 to $39,999 | 25 (6.7%) | 14 (3.5%) |
| $40,000 to $44,999 | 0 (0.0%) | 100 (24.7%) |
| $45,000 to $49,999 | 15 (4.0%) | 0 (0.0%) |
| $50,000 to $54,999 | 12 (3.2%) | 4 (1.0%) |
| $55,000 to $64,999 | 84 (22.6%) | 22 (5.4%) |
| $65,000 to $74,999 | 37 (10.0%) | 32 (7.9%) |
| $75,000 to $99,999 | 44 (11.8%) | 29 (7.2%) |
| $100,000+ | 92 (24.7%) | 16 (4.0%) |
| Total | 372 (100.0%) | 404 (100.0%) |
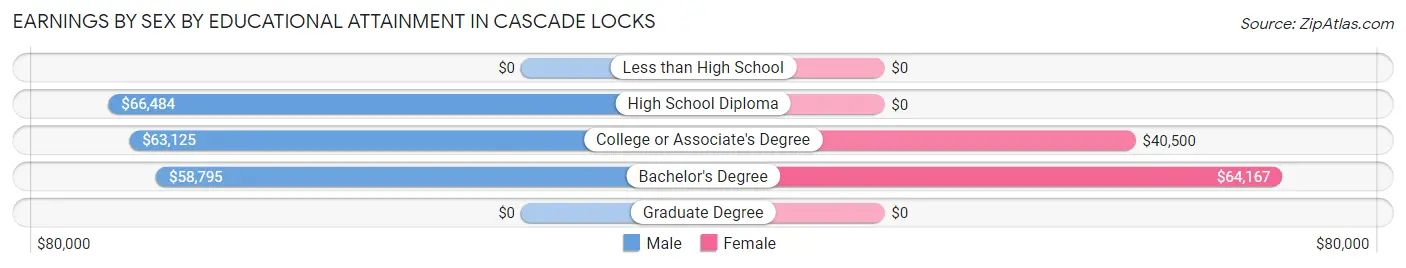
Earnings by Sex by Educational Attainment in Cascade Locks
Average earnings in Cascade Locks are $64,907 for men and $40,613 for women, a difference of 37.4%. Men with an educational attainment of high school diploma enjoy the highest average annual earnings of $66,484, while those with bachelor's degree education earn the least with $58,795. Women with an educational attainment of bachelor's degree earn the most with the average annual earnings of $64,167, while those with college or associate's degree education have the smallest earnings of $40,500.
| Educational Attainment | Male Income | Female Income |
| Less than High School | - | - |
| High School Diploma | $66,484 | $0 |
| College or Associate's Degree | $63,125 | $40,500 |
| Bachelor's Degree | $58,795 | $64,167 |
| Graduate Degree | - | - |
| Total | $64,907 | $40,613 |
Family Income in Cascade Locks
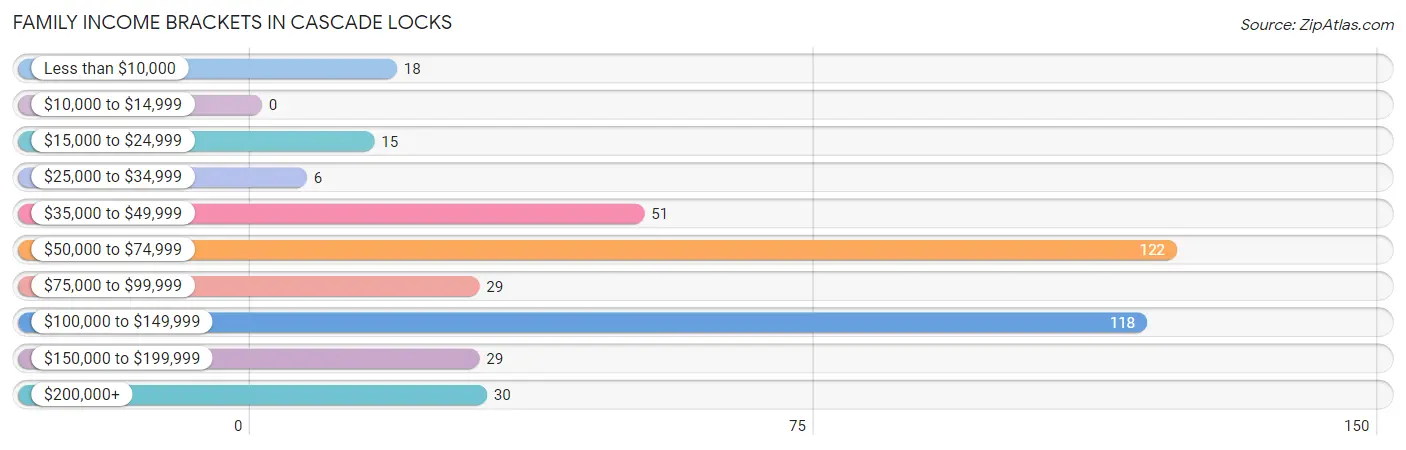
Family Income Brackets in Cascade Locks
According to the Cascade Locks family income data, there are 122 families falling into the $50,000 to $74,999 income range, which is the most common income bracket and makes up 29.2% of all families.
| Income Bracket | # Families | % Families |
| Less than $10,000 | 18 | 4.3% |
| $10,000 to $14,999 | 0 | 0.0% |
| $15,000 to $24,999 | 15 | 3.6% |
| $25,000 to $34,999 | 6 | 1.4% |
| $35,000 to $49,999 | 51 | 12.2% |
| $50,000 to $74,999 | 122 | 29.2% |
| $75,000 to $99,999 | 29 | 6.9% |
| $100,000 to $149,999 | 118 | 28.2% |
| $150,000 to $199,999 | 29 | 6.9% |
| $200,000+ | 30 | 7.2% |
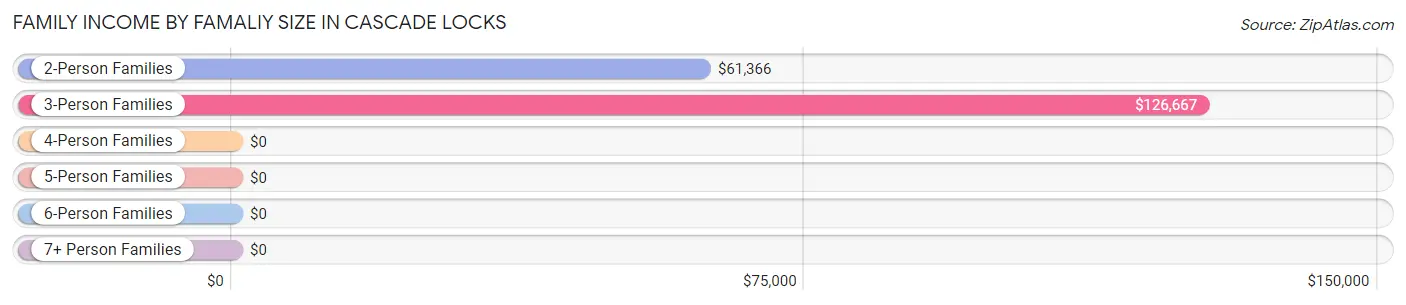
Family Income by Famaliy Size in Cascade Locks
3-person families (86 | 20.6%) account for the highest median family income in Cascade Locks with $126,667 per family, while 3-person families (86 | 20.6%) have the highest median income of $42,222 per family member.
| Income Bracket | # Families | Median Income |
| 2-Person Families | 260 (62.2%) | $61,366 |
| 3-Person Families | 86 (20.6%) | $126,667 |
| 4-Person Families | 48 (11.5%) | $0 |
| 5-Person Families | 24 (5.7%) | $0 |
| 6-Person Families | 0 (0.0%) | $0 |
| 7+ Person Families | 0 (0.0%) | $0 |
| Total | 418 (100.0%) | $69,318 |
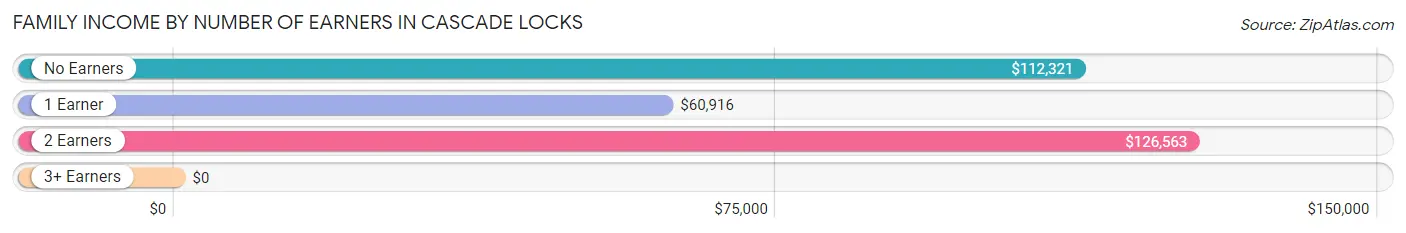
Family Income by Number of Earners in Cascade Locks
| Number of Earners | # Families | Median Income |
| No Earners | 30 (7.2%) | $112,321 |
| 1 Earner | 239 (57.2%) | $60,916 |
| 2 Earners | 119 (28.5%) | $126,563 |
| 3+ Earners | 30 (7.2%) | $0 |
| Total | 418 (100.0%) | $69,318 |
Household Income in Cascade Locks
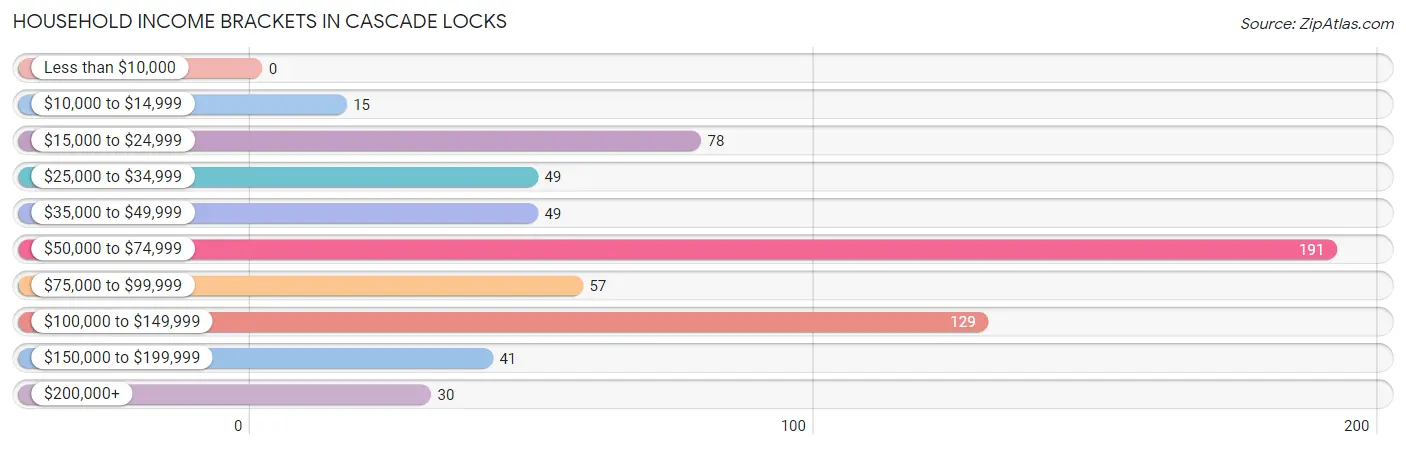
Household Income Brackets in Cascade Locks
With 191 households falling in the category, the $50,000 to $74,999 income range is the most frequent in Cascade Locks, accounting for 29.9% of all households.
| Income Bracket | # Households | % Households |
| Less than $10,000 | 0 | 0.0% |
| $10,000 to $14,999 | 15 | 2.3% |
| $15,000 to $24,999 | 78 | 12.2% |
| $25,000 to $34,999 | 49 | 7.7% |
| $35,000 to $49,999 | 49 | 7.7% |
| $50,000 to $74,999 | 191 | 29.9% |
| $75,000 to $99,999 | 57 | 8.9% |
| $100,000 to $149,999 | 129 | 20.2% |
| $150,000 to $199,999 | 41 | 6.4% |
| $200,000+ | 30 | 4.7% |
Household Income by Householder Age in Cascade Locks
The median household income in Cascade Locks is $62,195, with the highest median household income of $87,917 found in the 45 to 64 years age bracket for the primary householder. A total of 197 households (30.8%) fall into this category.
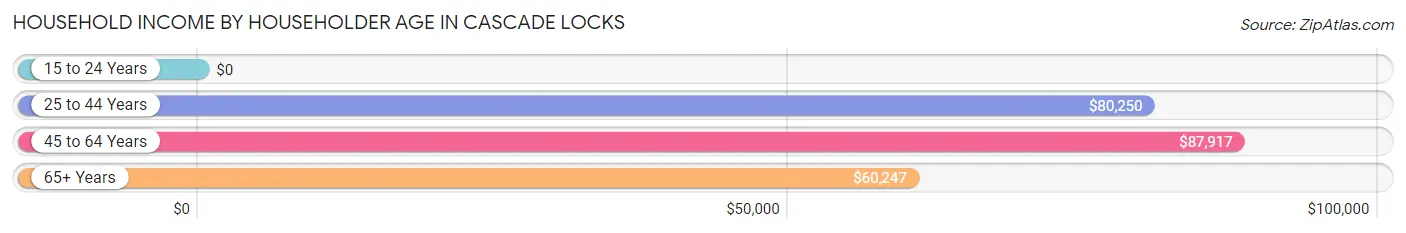
| Income Bracket | # Households | Median Income |
| 15 to 24 Years | 0 (0.0%) | $0 |
| 25 to 44 Years | 193 (30.2%) | $80,250 |
| 45 to 64 Years | 197 (30.8%) | $87,917 |
| 65+ Years | 249 (39.0%) | $60,247 |
| Total | 639 (100.0%) | $62,195 |
Poverty in Cascade Locks
Income Below Poverty by Sex and Age in Cascade Locks
With 5.3% poverty level for males and 8.2% for females among the residents of Cascade Locks, under 5 year old males and 18 to 24 year old females are the most vulnerable to poverty, with 20 males (83.3%) and 26 females (55.3%) in their respective age groups living below the poverty level.
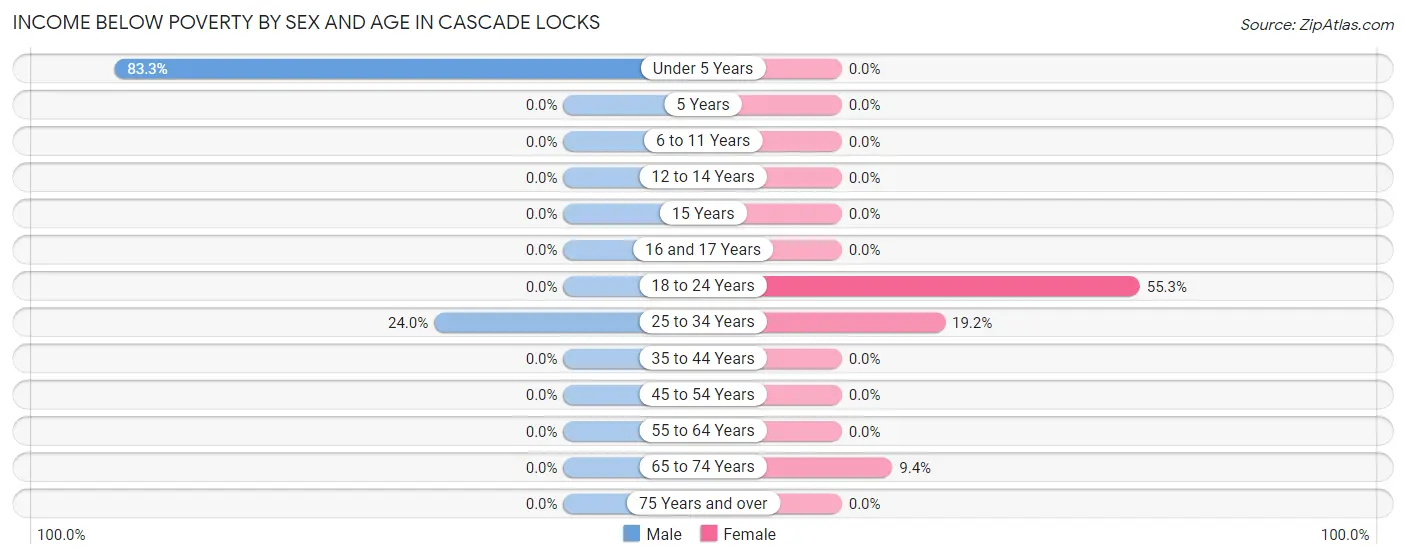
| Age Bracket | Male | Female |
| Under 5 Years | 20 (83.3%) | 0 (0.0%) |
| 5 Years | 0 (0.0%) | 0 (0.0%) |
| 6 to 11 Years | 0 (0.0%) | 0 (0.0%) |
| 12 to 14 Years | 0 (0.0%) | 0 (0.0%) |
| 15 Years | 0 (0.0%) | 0 (0.0%) |
| 16 and 17 Years | 0 (0.0%) | 0 (0.0%) |
| 18 to 24 Years | 0 (0.0%) | 26 (55.3%) |
| 25 to 34 Years | 18 (24.0%) | 23 (19.2%) |
| 35 to 44 Years | 0 (0.0%) | 0 (0.0%) |
| 45 to 54 Years | 0 (0.0%) | 0 (0.0%) |
| 55 to 64 Years | 0 (0.0%) | 0 (0.0%) |
| 65 to 74 Years | 0 (0.0%) | 9 (9.4%) |
| 75 Years and over | 0 (0.0%) | 0 (0.0%) |
| Total | 38 (5.3%) | 58 (8.2%) |
Income Above Poverty by Sex and Age in Cascade Locks
According to the poverty statistics in Cascade Locks, males aged 5 years and females aged under 5 years are the age groups that are most secure financially, with 100.0% of males and 100.0% of females in these age groups living above the poverty line.
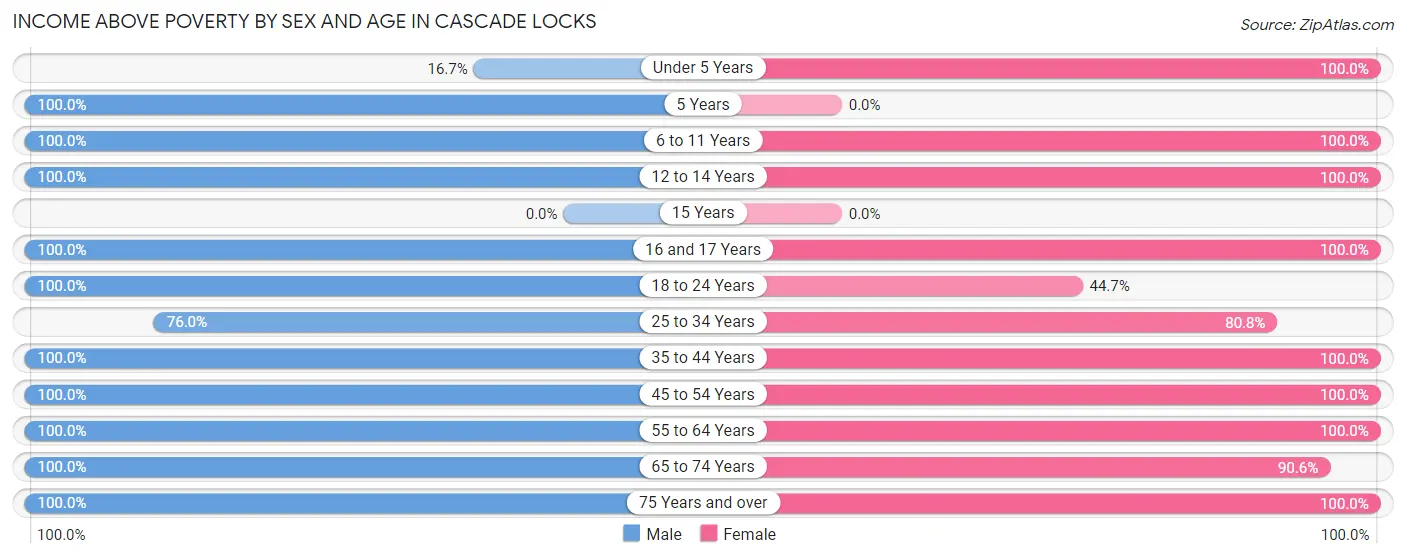
| Age Bracket | Male | Female |
| Under 5 Years | 4 (16.7%) | 36 (100.0%) |
| 5 Years | 29 (100.0%) | 0 (0.0%) |
| 6 to 11 Years | 51 (100.0%) | 8 (100.0%) |
| 12 to 14 Years | 18 (100.0%) | 29 (100.0%) |
| 15 Years | 0 (0.0%) | 0 (0.0%) |
| 16 and 17 Years | 6 (100.0%) | 16 (100.0%) |
| 18 to 24 Years | 37 (100.0%) | 21 (44.7%) |
| 25 to 34 Years | 57 (76.0%) | 97 (80.8%) |
| 35 to 44 Years | 103 (100.0%) | 59 (100.0%) |
| 45 to 54 Years | 63 (100.0%) | 83 (100.0%) |
| 55 to 64 Years | 137 (100.0%) | 160 (100.0%) |
| 65 to 74 Years | 144 (100.0%) | 87 (90.6%) |
| 75 Years and over | 26 (100.0%) | 51 (100.0%) |
| Total | 675 (94.7%) | 647 (91.8%) |
Income Below Poverty Among Married-Couple Families in Cascade Locks
The poverty statistics for married-couple families in Cascade Locks show that 7.4% or 18 of the total 244 families live below the poverty line. Families with 1 or 2 children have the highest poverty rate of 20.2%, comprising of 18 families. On the other hand, families with no children have the lowest poverty rate of 0.0%, which includes 0 families.
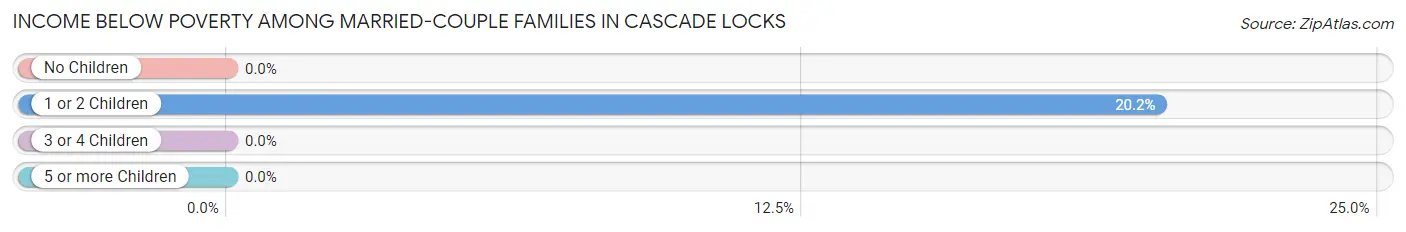
| Children | Above Poverty | Below Poverty |
| No Children | 149 (100.0%) | 0 (0.0%) |
| 1 or 2 Children | 71 (79.8%) | 18 (20.2%) |
| 3 or 4 Children | 6 (100.0%) | 0 (0.0%) |
| 5 or more Children | 0 (0.0%) | 0 (0.0%) |
| Total | 226 (92.6%) | 18 (7.4%) |
Income Below Poverty Among Single-Parent Households in Cascade Locks
| Children | Single Father | Single Mother |
| No Children | 0 (0.0%) | 0 (0.0%) |
| 1 or 2 Children | 0 (0.0%) | 0 (0.0%) |
| 3 or 4 Children | 0 (0.0%) | 0 (0.0%) |
| 5 or more Children | 0 (0.0%) | 0 (0.0%) |
| Total | 0 (0.0%) | 0 (0.0%) |
Income Below Poverty Among Married-Couple vs Single-Parent Households in Cascade Locks
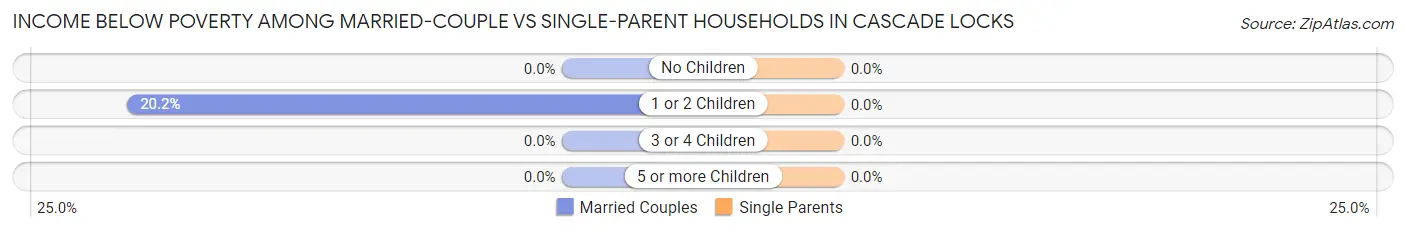
| Children | Married-Couple Families | Single-Parent Households |
| No Children | 0 (0.0%) | 0 (0.0%) |
| 1 or 2 Children | 18 (20.2%) | 0 (0.0%) |
| 3 or 4 Children | 0 (0.0%) | 0 (0.0%) |
| 5 or more Children | 0 (0.0%) | 0 (0.0%) |
| Total | 18 (7.4%) | 0 (0.0%) |
Race in Cascade Locks
The most populous races in Cascade Locks are White / Caucasian (1,237 | 87.2%), Hispanic or Latino (99 | 7.0%), and Two or more Races (67 | 4.7%).
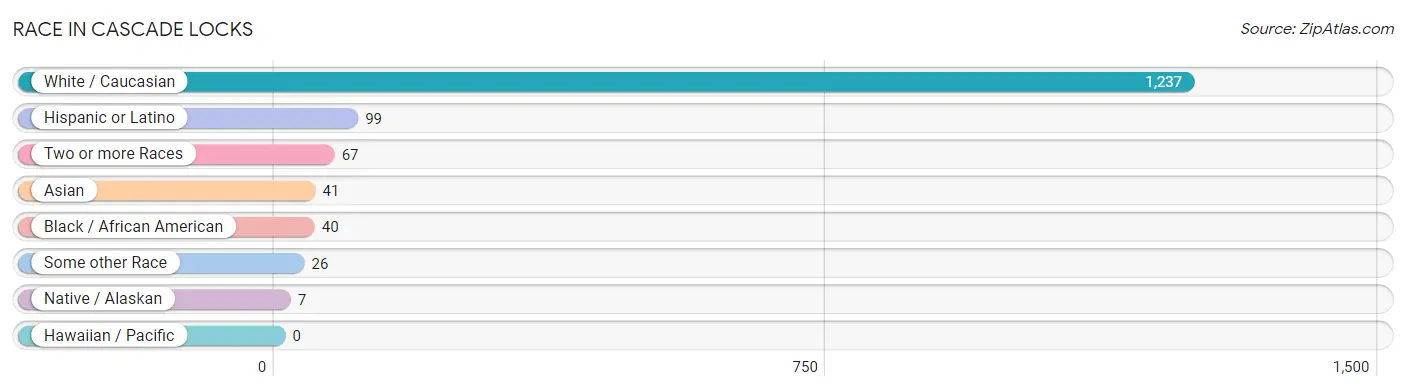
| Race | # Population | % Population |
| Asian | 41 | 2.9% |
| Black / African American | 40 | 2.8% |
| Hawaiian / Pacific | 0 | 0.0% |
| Hispanic or Latino | 99 | 7.0% |
| Native / Alaskan | 7 | 0.5% |
| White / Caucasian | 1,237 | 87.2% |
| Two or more Races | 67 | 4.7% |
| Some other Race | 26 | 1.8% |
| Total | 1,418 | 100.0% |
Ancestry in Cascade Locks
The most populous ancestries reported in Cascade Locks are English (350 | 24.7%), German (193 | 13.6%), Irish (190 | 13.4%), Scottish (127 | 9.0%), and French Canadian (86 | 6.1%), together accounting for 66.7% of all Cascade Locks residents.
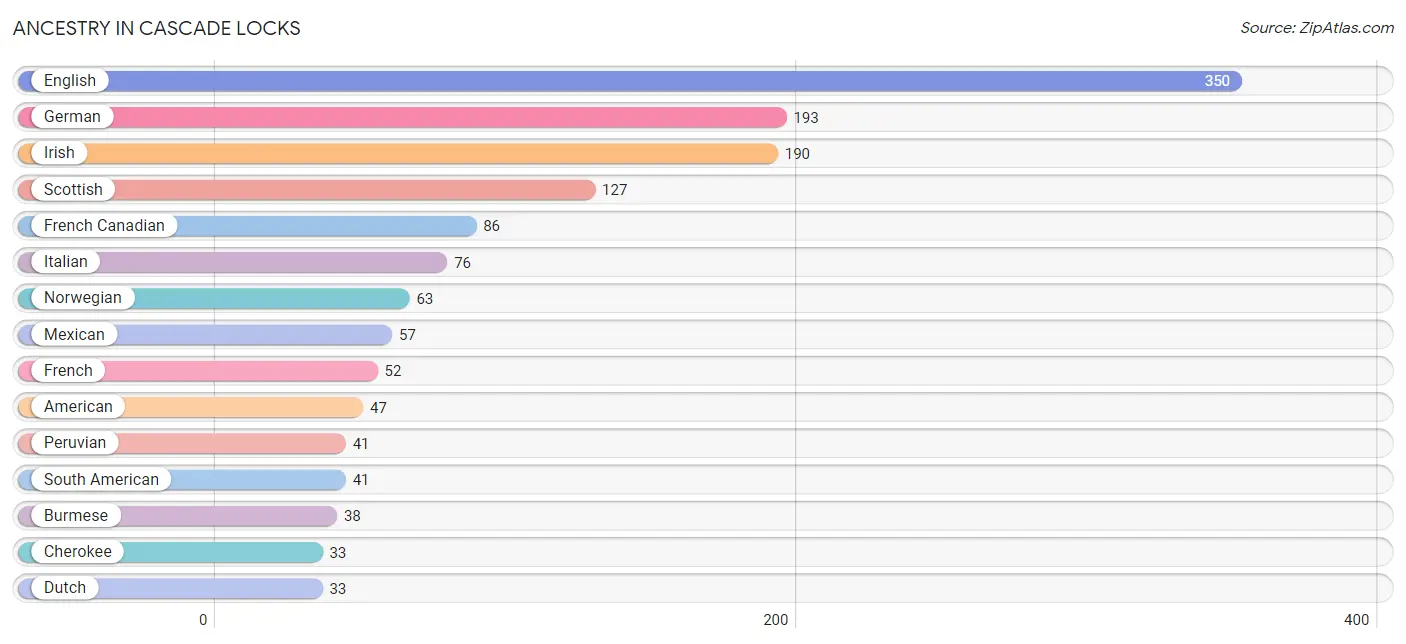
| Ancestry | # Population | % Population |
| American | 47 | 3.3% |
| Belgian | 17 | 1.2% |
| Bhutanese | 23 | 1.6% |
| Blackfeet | 10 | 0.7% |
| Brazilian | 11 | 0.8% |
| Burmese | 38 | 2.7% |
| Cherokee | 33 | 2.3% |
| Danish | 10 | 0.7% |
| Dutch | 33 | 2.3% |
| English | 350 | 24.7% |
| European | 10 | 0.7% |
| French | 52 | 3.7% |
| French Canadian | 86 | 6.1% |
| German | 193 | 13.6% |
| Hungarian | 1 | 0.1% |
| Irish | 190 | 13.4% |
| Italian | 76 | 5.4% |
| Mexican | 57 | 4.0% |
| Mexican American Indian | 7 | 0.5% |
| Norwegian | 63 | 4.4% |
| Peruvian | 41 | 2.9% |
| Scandinavian | 26 | 1.8% |
| Scotch-Irish | 18 | 1.3% |
| Scottish | 127 | 9.0% |
| Slavic | 3 | 0.2% |
| South American | 41 | 2.9% |
| Spanish | 1 | 0.1% |
| Swedish | 16 | 1.1% |
| Swiss | 9 | 0.6% | View All 29 Rows |
Immigrants in Cascade Locks
The most numerous immigrant groups reported in Cascade Locks came from Asia (15 | 1.1%), Central America (15 | 1.1%), Eastern Asia (15 | 1.1%), Japan (15 | 1.1%), and Latin America (15 | 1.1%), together accounting for 5.3% of all Cascade Locks residents.
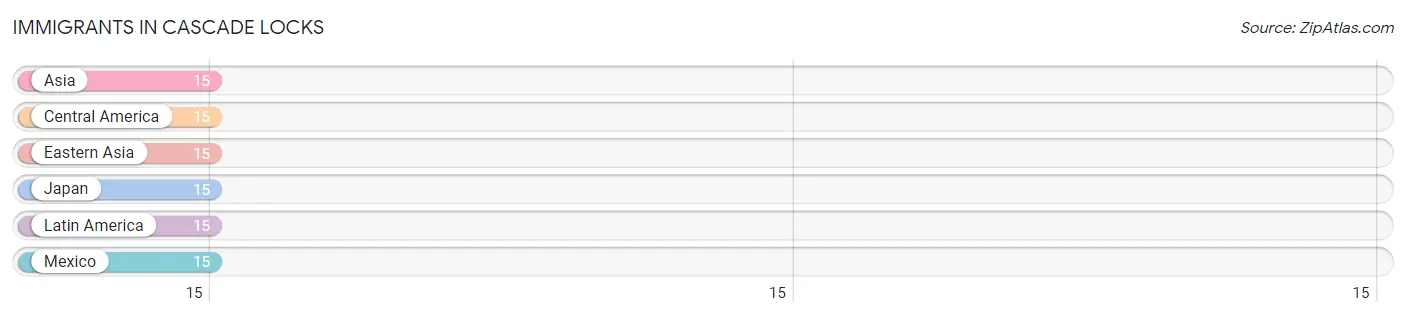
| Immigration Origin | # Population | % Population |
| Asia | 15 | 1.1% |
| Central America | 15 | 1.1% |
| Eastern Asia | 15 | 1.1% |
| Japan | 15 | 1.1% |
| Latin America | 15 | 1.1% |
| Mexico | 15 | 1.1% | View All 6 Rows |
Sex and Age in Cascade Locks
Sex and Age in Cascade Locks
The most populous age groups in Cascade Locks are 65 to 69 Years (131 | 18.4%) for men and 60 to 64 Years (148 | 21.0%) for women.
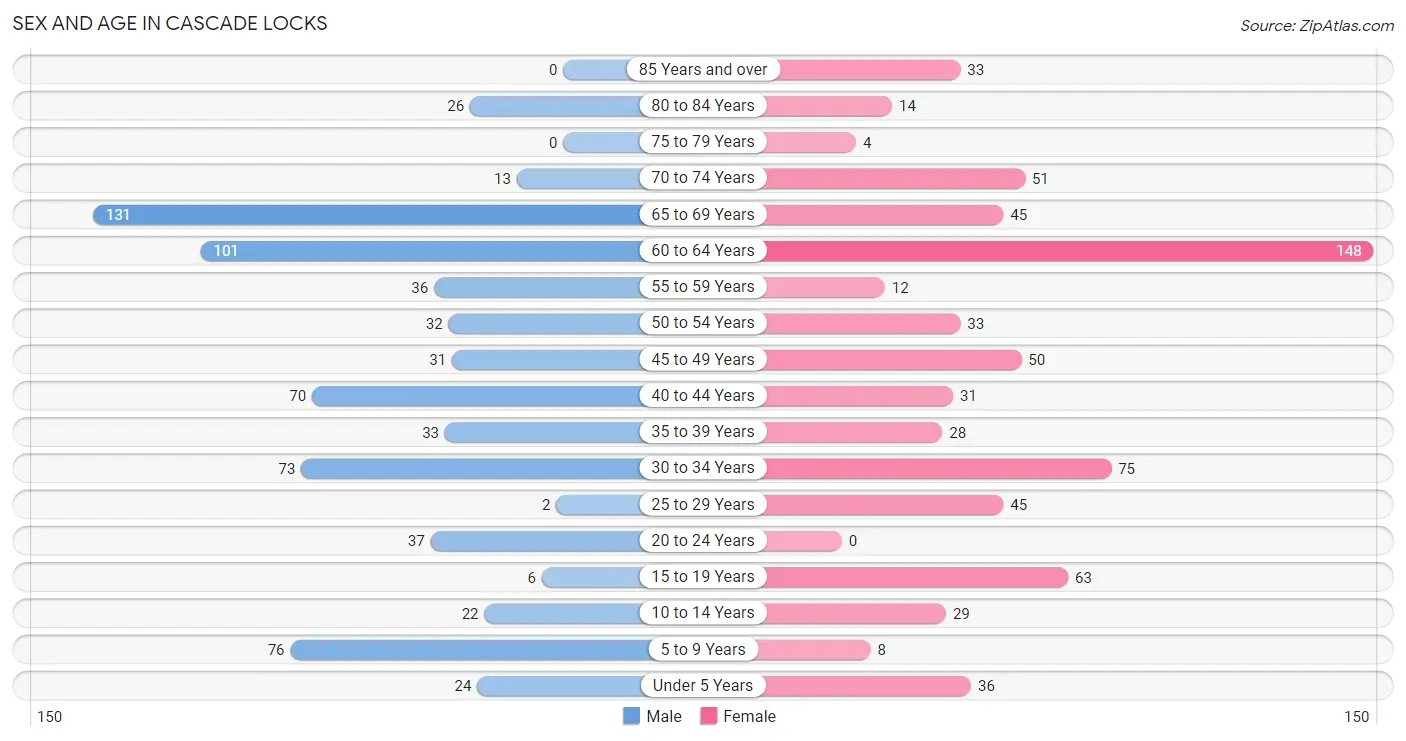
| Age Bracket | Male | Female |
| Under 5 Years | 24 (3.4%) | 36 (5.1%) |
| 5 to 9 Years | 76 (10.7%) | 8 (1.1%) |
| 10 to 14 Years | 22 (3.1%) | 29 (4.1%) |
| 15 to 19 Years | 6 (0.8%) | 63 (8.9%) |
| 20 to 24 Years | 37 (5.2%) | 0 (0.0%) |
| 25 to 29 Years | 2 (0.3%) | 45 (6.4%) |
| 30 to 34 Years | 73 (10.2%) | 75 (10.6%) |
| 35 to 39 Years | 33 (4.6%) | 28 (4.0%) |
| 40 to 44 Years | 70 (9.8%) | 31 (4.4%) |
| 45 to 49 Years | 31 (4.3%) | 50 (7.1%) |
| 50 to 54 Years | 32 (4.5%) | 33 (4.7%) |
| 55 to 59 Years | 36 (5.1%) | 12 (1.7%) |
| 60 to 64 Years | 101 (14.2%) | 148 (21.0%) |
| 65 to 69 Years | 131 (18.4%) | 45 (6.4%) |
| 70 to 74 Years | 13 (1.8%) | 51 (7.2%) |
| 75 to 79 Years | 0 (0.0%) | 4 (0.6%) |
| 80 to 84 Years | 26 (3.6%) | 14 (2.0%) |
| 85 Years and over | 0 (0.0%) | 33 (4.7%) |
| Total | 713 (100.0%) | 705 (100.0%) |
Families and Households in Cascade Locks
Median Family Size in Cascade Locks
The median family size in Cascade Locks is 2.70 persons per family, with married-couple families (244 | 58.4%) accounting for the largest median family size of 3.12 persons per family. On the other hand, single female/mother families (65 | 15.5%) represent the smallest median family size with 1.77 persons per family.
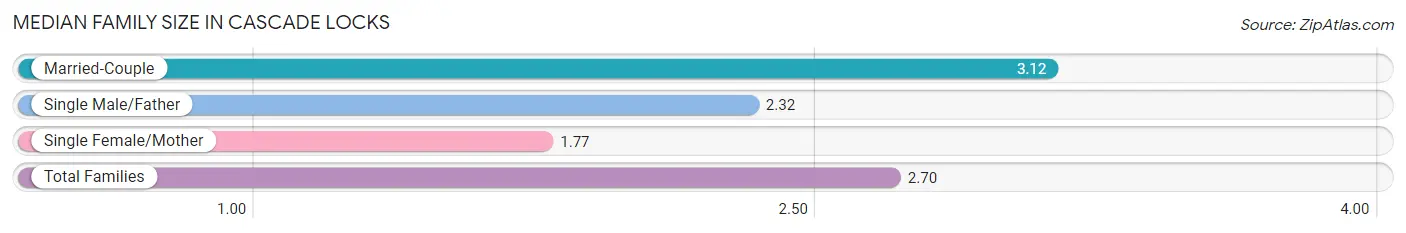
| Family Type | # Families | Family Size |
| Married-Couple | 244 (58.4%) | 3.12 |
| Single Male/Father | 109 (26.1%) | 2.32 |
| Single Female/Mother | 65 (15.5%) | 1.77 |
| Total Families | 418 (100.0%) | 2.70 |
Median Household Size in Cascade Locks
The median household size in Cascade Locks is 2.22 persons per household, with married-couple households (244 | 38.2%) accounting for the largest median household size of 3.22 persons per household. non-family households (221 | 34.6%) represent the smallest median household size with 1.12 persons per household.
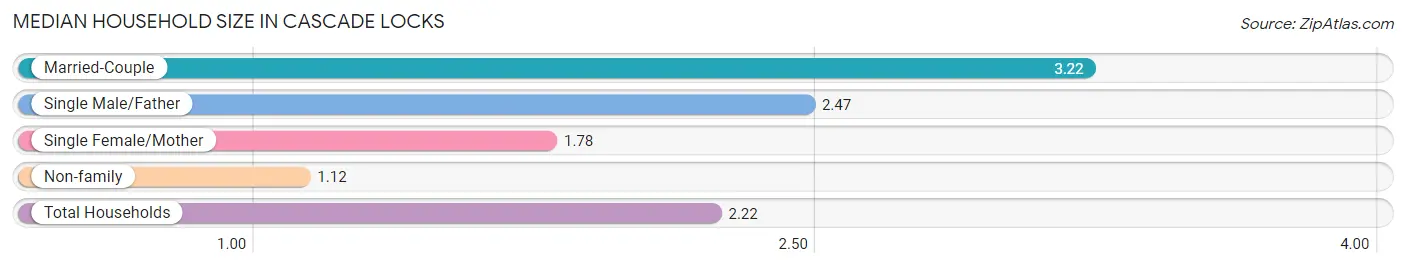
| Household Type | # Households | Household Size |
| Married-Couple | 244 (38.2%) | 3.22 |
| Single Male/Father | 109 (17.1%) | 2.47 |
| Single Female/Mother | 65 (10.2%) | 1.78 |
| Non-family | 221 (34.6%) | 1.12 |
| Total Households | 639 (100.0%) | 2.22 |
Household Size by Marriage Status in Cascade Locks
Out of a total of 639 households in Cascade Locks, 418 (65.4%) are family households, while 221 (34.6%) are nonfamily households. The most numerous type of family households are 2-person households, comprising 253, and the most common type of nonfamily households are 1-person households, comprising 193.
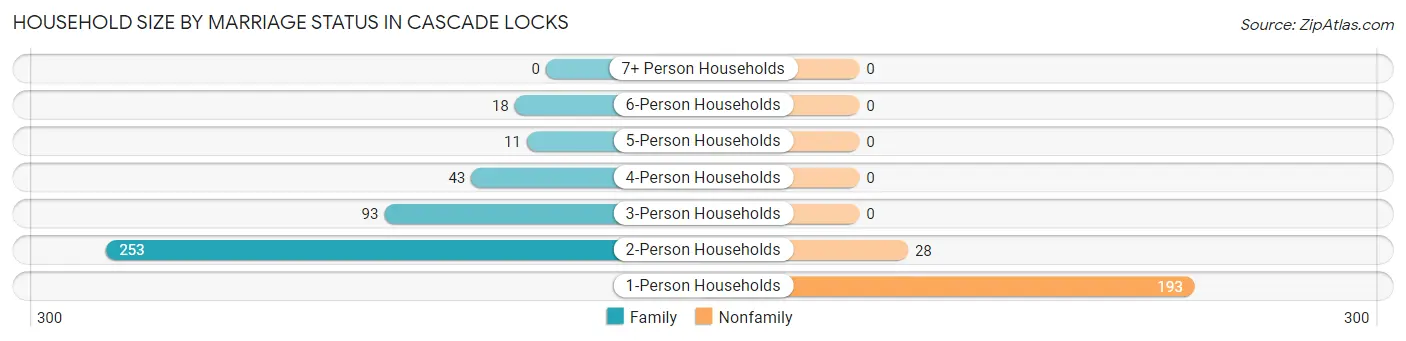
| Household Size | Family Households | Nonfamily Households |
| 1-Person Households | - | 193 (30.2%) |
| 2-Person Households | 253 (39.6%) | 28 (4.4%) |
| 3-Person Households | 93 (14.5%) | 0 (0.0%) |
| 4-Person Households | 43 (6.7%) | 0 (0.0%) |
| 5-Person Households | 11 (1.7%) | 0 (0.0%) |
| 6-Person Households | 18 (2.8%) | 0 (0.0%) |
| 7+ Person Households | 0 (0.0%) | 0 (0.0%) |
| Total | 418 (65.4%) | 221 (34.6%) |
Female Fertility in Cascade Locks
Fertility by Age in Cascade Locks
Average fertility rate in Cascade Locks is 51.0 births per 1,000 women. Women in the age bracket of 35 to 50 years have the highest fertility rate with 83.0 births per 1,000 women. Women in the age bracket of 35 to 50 years acount for 60.0% of all women with births.
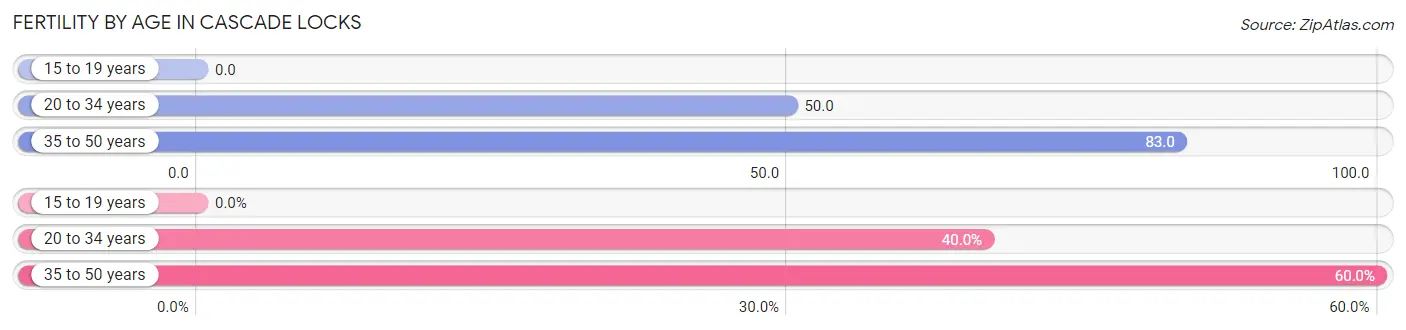
| Age Bracket | Women with Births | Births / 1,000 Women |
| 15 to 19 years | 0 (0.0%) | 0.0 |
| 20 to 34 years | 6 (40.0%) | 50.0 |
| 35 to 50 years | 9 (60.0%) | 83.0 |
| Total | 15 (100.0%) | 51.0 |
Fertility by Age by Marriage Status in Cascade Locks
60.0% of women with births (15) in Cascade Locks are married. The highest percentage of unmarried women with births falls into 20 to 34 years age bracket with 100.0% of them unmarried at the time of birth, while the lowest percentage of unmarried women with births belong to 35 to 50 years age bracket with 0.0% of them unmarried.
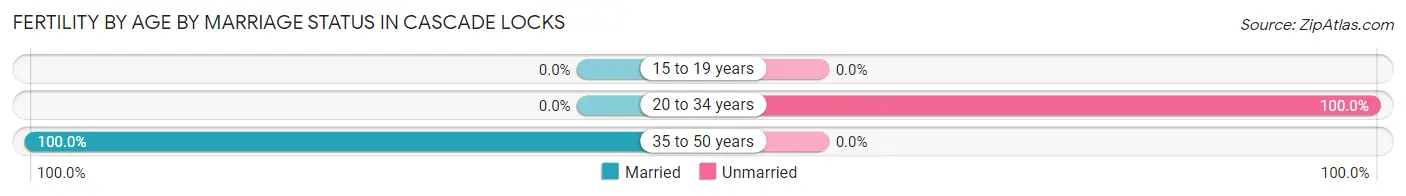
| Age Bracket | Married | Unmarried |
| 15 to 19 years | 0 (0.0%) | 0 (0.0%) |
| 20 to 34 years | 0 (0.0%) | 6 (100.0%) |
| 35 to 50 years | 9 (100.0%) | 0 (0.0%) |
| Total | 9 (60.0%) | 6 (40.0%) |
Fertility by Education in Cascade Locks
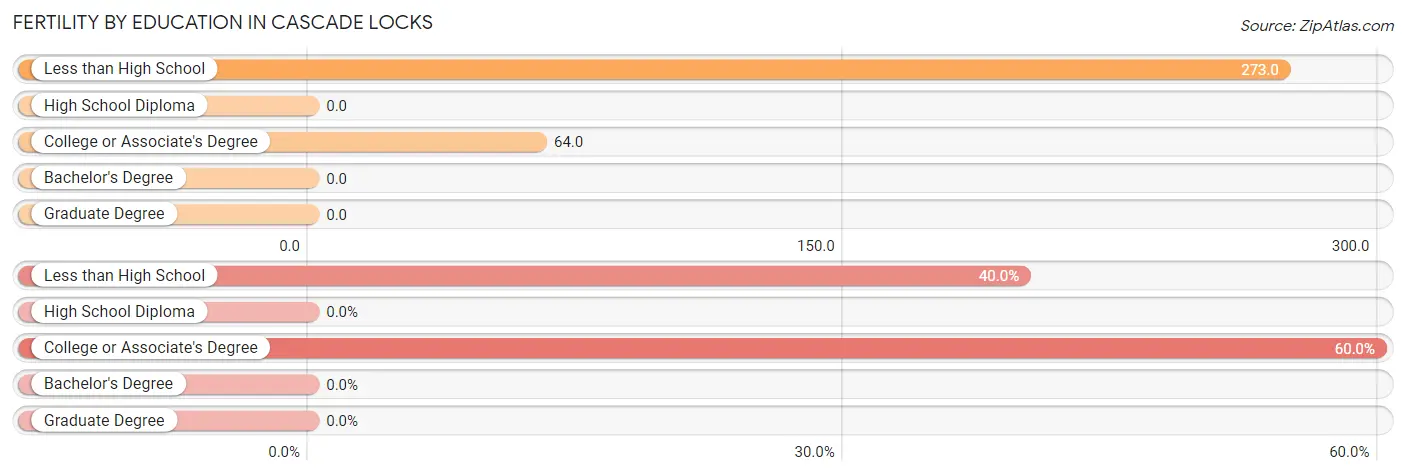
| Educational Attainment | Women with Births | Births / 1,000 Women |
| Less than High School | 6 (40.0%) | 273.0 |
| High School Diploma | 0 (0.0%) | 0.0 |
| College or Associate's Degree | 9 (60.0%) | 64.0 |
| Bachelor's Degree | 0 (0.0%) | 0.0 |
| Graduate Degree | 0 (0.0%) | 0.0 |
| Total | 15 (100.0%) | 51.0 |
Fertility by Education by Marriage Status in Cascade Locks
40.0% of women with births in Cascade Locks are unmarried. Women with the educational attainment of college or associate's degree are most likely to be married with 100.0% of them married at childbirth, while women with the educational attainment of less than high school are least likely to be married with 100.0% of them unmarried at childbirth.
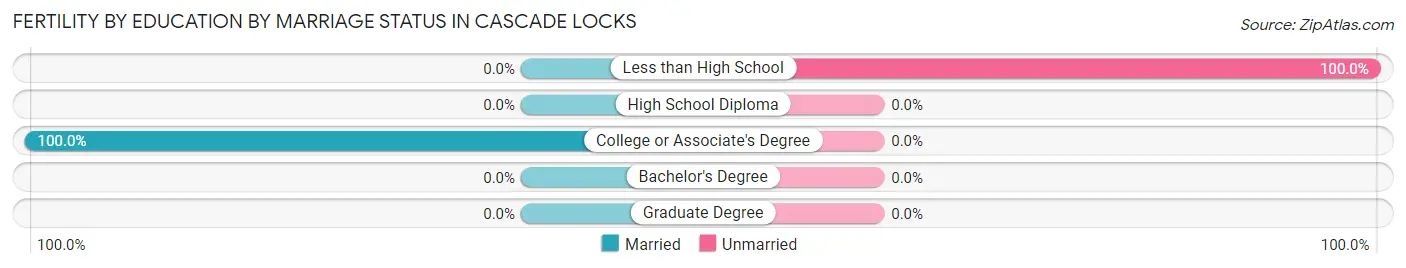
| Educational Attainment | Married | Unmarried |
| Less than High School | 0 (0.0%) | 6 (100.0%) |
| High School Diploma | 0 (0.0%) | 0 (0.0%) |
| College or Associate's Degree | 9 (100.0%) | 0 (0.0%) |
| Bachelor's Degree | 0 (0.0%) | 0 (0.0%) |
| Graduate Degree | 0 (0.0%) | 0 (0.0%) |
| Total | 9 (60.0%) | 6 (40.0%) |
Employment Characteristics in Cascade Locks
Employment by Class of Employer in Cascade Locks
Among the 757 employed individuals in Cascade Locks, private company employees (523 | 69.1%), local government employees (106 | 14.0%), and self-employed (not incorporated) (59 | 7.8%) make up the most common classes of employment.
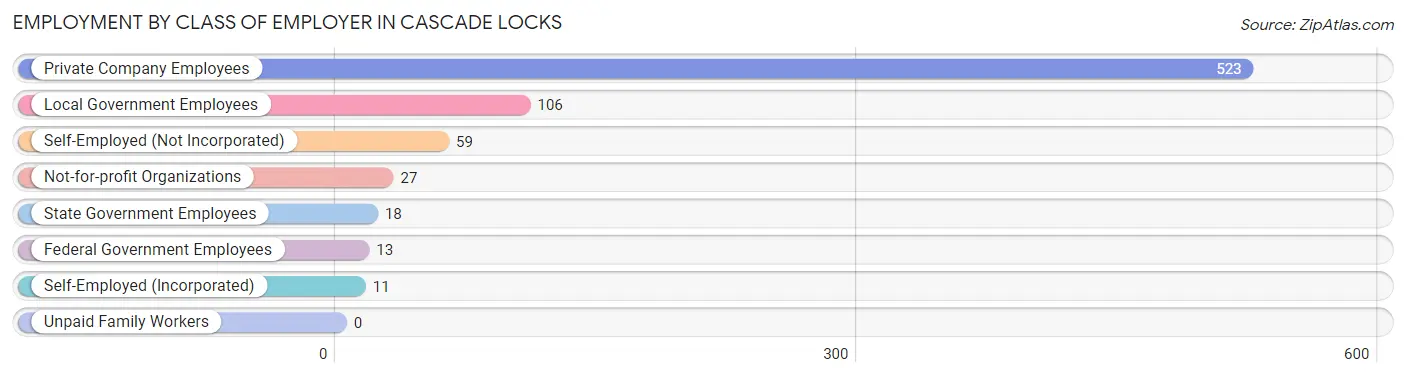
| Employer Class | # Employees | % Employees |
| Private Company Employees | 523 | 69.1% |
| Self-Employed (Incorporated) | 11 | 1.5% |
| Self-Employed (Not Incorporated) | 59 | 7.8% |
| Not-for-profit Organizations | 27 | 3.6% |
| Local Government Employees | 106 | 14.0% |
| State Government Employees | 18 | 2.4% |
| Federal Government Employees | 13 | 1.7% |
| Unpaid Family Workers | 0 | 0.0% |
| Total | 757 | 100.0% |
Employment Status by Age in Cascade Locks
According to the labor force statistics for Cascade Locks, out of the total population over 16 years of age (1,223), 64.3% or 786 individuals are in the labor force, with 3.8% or 30 of them unemployed. The age group with the highest labor force participation rate is 45 to 54 years, with 98.6% or 144 individuals in the labor force. Within the labor force, the 30 to 34 years age range has the highest percentage of unemployed individuals, with 21.0% or 30 of them being unemployed.
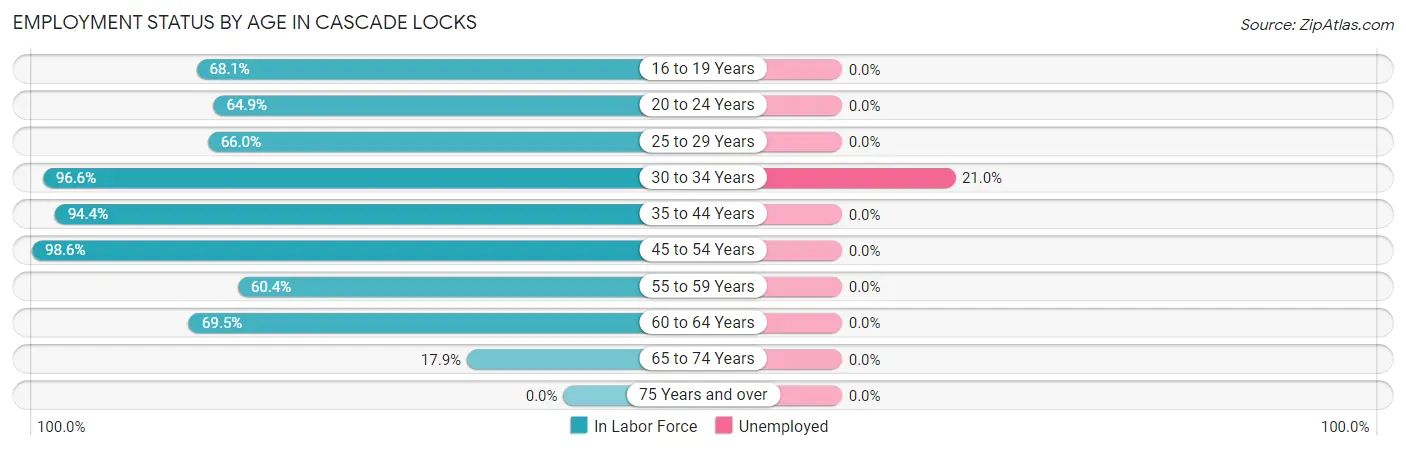
| Age Bracket | In Labor Force | Unemployed |
| 16 to 19 Years | 47 (68.1%) | 0 (0.0%) |
| 20 to 24 Years | 24 (64.9%) | 0 (0.0%) |
| 25 to 29 Years | 31 (66.0%) | 0 (0.0%) |
| 30 to 34 Years | 143 (96.6%) | 30 (21.0%) |
| 35 to 44 Years | 153 (94.4%) | 0 (0.0%) |
| 45 to 54 Years | 144 (98.6%) | 0 (0.0%) |
| 55 to 59 Years | 29 (60.4%) | 0 (0.0%) |
| 60 to 64 Years | 173 (69.5%) | 0 (0.0%) |
| 65 to 74 Years | 43 (17.9%) | 0 (0.0%) |
| 75 Years and over | 0 (0.0%) | 0 (0.0%) |
| Total | 786 (64.3%) | 30 (3.8%) |
Employment Status by Educational Attainment in Cascade Locks
According to labor force statistics for Cascade Locks, 84.1% of individuals (673) out of the total population between 25 and 64 years of age (800) are in the labor force, with 4.5% or 30 of them being unemployed. The group with the highest labor force participation rate are those with the educational attainment of high school diploma, with 95.6% or 152 individuals in the labor force. Within the labor force, individuals with high school diploma education have the highest percentage of unemployment, with 19.7% or 30 of them being unemployed.
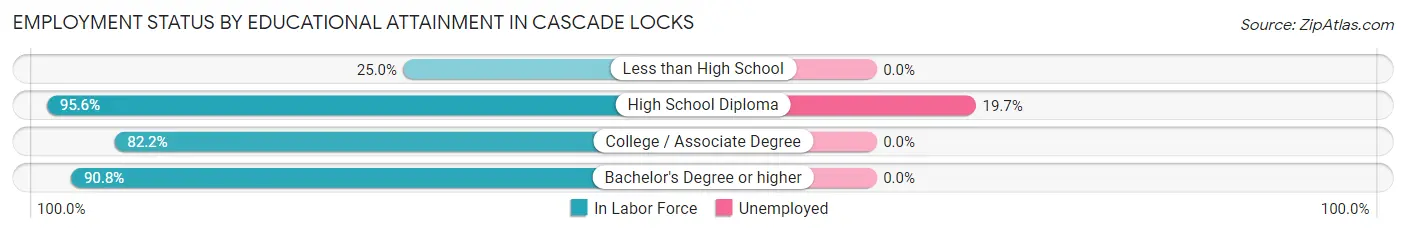
| Educational Attainment | In Labor Force | Unemployed |
| Less than High School | 9 (25.0%) | 0 (0.0%) |
| High School Diploma | 152 (95.6%) | 31 (19.7%) |
| College / Associate Degree | 355 (82.2%) | 0 (0.0%) |
| Bachelor's Degree or higher | 157 (90.8%) | 0 (0.0%) |
| Total | 673 (84.1%) | 36 (4.5%) |
Employment Occupations by Sex in Cascade Locks
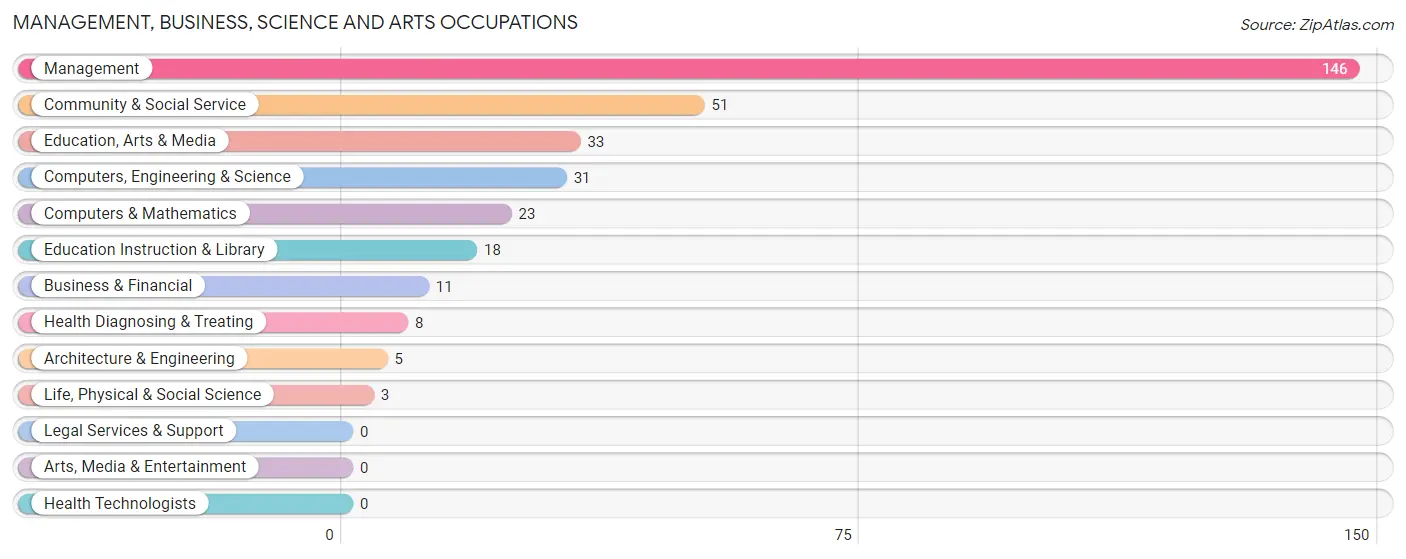
Management, Business, Science and Arts Occupations
The most common Management, Business, Science and Arts occupations in Cascade Locks are Management (146 | 19.3%), Community & Social Service (51 | 6.7%), Education, Arts & Media (33 | 4.4%), Computers, Engineering & Science (31 | 4.1%), and Computers & Mathematics (23 | 3.0%).
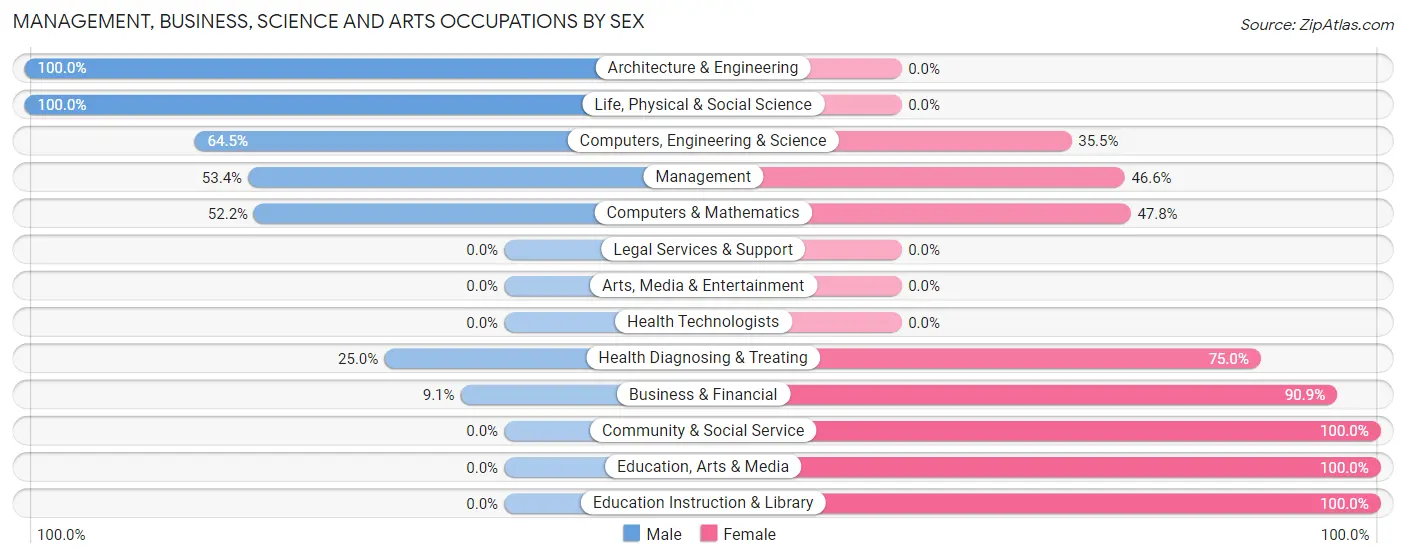
Management, Business, Science and Arts Occupations by Sex
Within the Management, Business, Science and Arts occupations in Cascade Locks, the most male-oriented occupations are Architecture & Engineering (100.0%), Life, Physical & Social Science (100.0%), and Computers, Engineering & Science (64.5%), while the most female-oriented occupations are Community & Social Service (100.0%), Education, Arts & Media (100.0%), and Education Instruction & Library (100.0%).
| Occupation | Male | Female |
| Management | 78 (53.4%) | 68 (46.6%) |
| Business & Financial | 1 (9.1%) | 10 (90.9%) |
| Computers, Engineering & Science | 20 (64.5%) | 11 (35.5%) |
| Computers & Mathematics | 12 (52.2%) | 11 (47.8%) |
| Architecture & Engineering | 5 (100.0%) | 0 (0.0%) |
| Life, Physical & Social Science | 3 (100.0%) | 0 (0.0%) |
| Community & Social Service | 0 (0.0%) | 51 (100.0%) |
| Education, Arts & Media | 0 (0.0%) | 33 (100.0%) |
| Legal Services & Support | 0 (0.0%) | 0 (0.0%) |
| Education Instruction & Library | 0 (0.0%) | 18 (100.0%) |
| Arts, Media & Entertainment | 0 (0.0%) | 0 (0.0%) |
| Health Diagnosing & Treating | 2 (25.0%) | 6 (75.0%) |
| Health Technologists | 0 (0.0%) | 0 (0.0%) |
| Total (Category) | 101 (40.9%) | 146 (59.1%) |
| Total (Overall) | 362 (47.8%) | 395 (52.2%) |
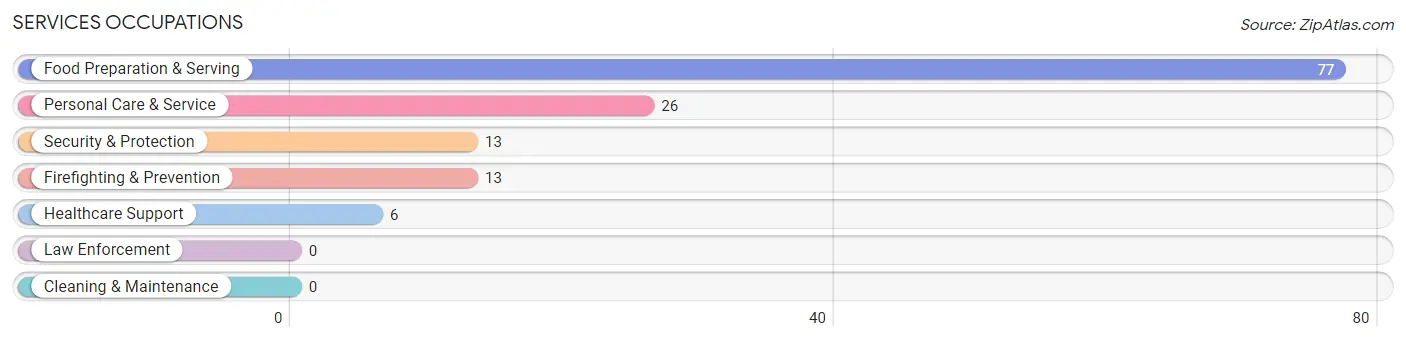
Services Occupations
The most common Services occupations in Cascade Locks are Food Preparation & Serving (77 | 10.2%), Personal Care & Service (26 | 3.4%), Security & Protection (13 | 1.7%), Firefighting & Prevention (13 | 1.7%), and Healthcare Support (6 | 0.8%).
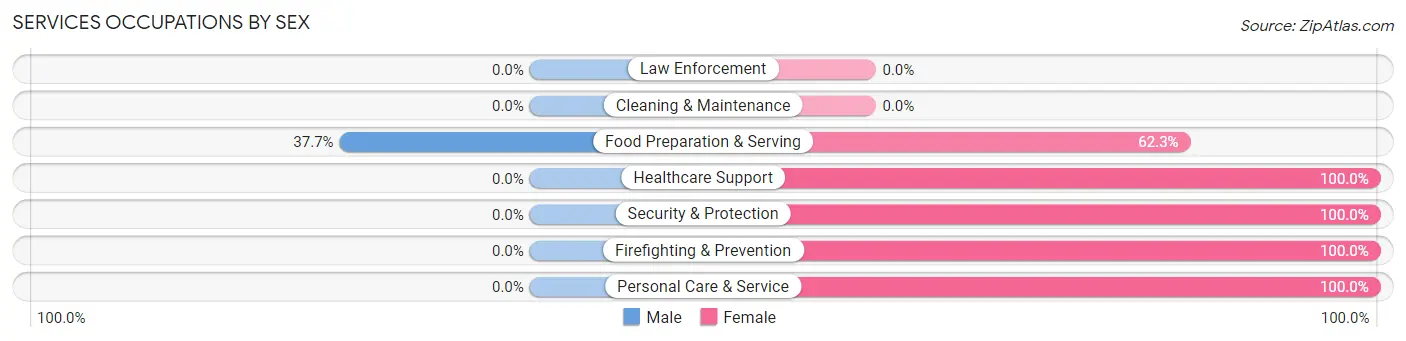
Services Occupations by Sex
| Occupation | Male | Female |
| Healthcare Support | 0 (0.0%) | 6 (100.0%) |
| Security & Protection | 0 (0.0%) | 13 (100.0%) |
| Firefighting & Prevention | 0 (0.0%) | 13 (100.0%) |
| Law Enforcement | 0 (0.0%) | 0 (0.0%) |
| Food Preparation & Serving | 29 (37.7%) | 48 (62.3%) |
| Cleaning & Maintenance | 0 (0.0%) | 0 (0.0%) |
| Personal Care & Service | 0 (0.0%) | 26 (100.0%) |
| Total (Category) | 29 (23.8%) | 93 (76.2%) |
| Total (Overall) | 362 (47.8%) | 395 (52.2%) |
Sales and Office Occupations
The most common Sales and Office occupations in Cascade Locks are Office & Administration (52 | 6.9%), and Sales & Related (29 | 3.8%).
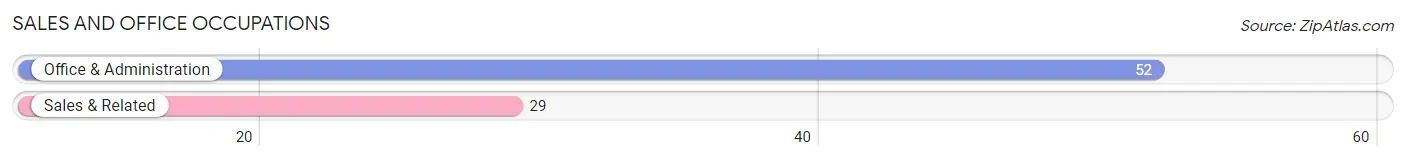
Sales and Office Occupations by Sex

| Occupation | Male | Female |
| Sales & Related | 29 (100.0%) | 0 (0.0%) |
| Office & Administration | 27 (51.9%) | 25 (48.1%) |
| Total (Category) | 56 (69.1%) | 25 (30.9%) |
| Total (Overall) | 362 (47.8%) | 395 (52.2%) |
Natural Resources, Construction and Maintenance Occupations
The most common Natural Resources, Construction and Maintenance occupations in Cascade Locks are Construction & Extraction (81 | 10.7%), and Installation, Maintenance & Repair (7 | 0.9%).
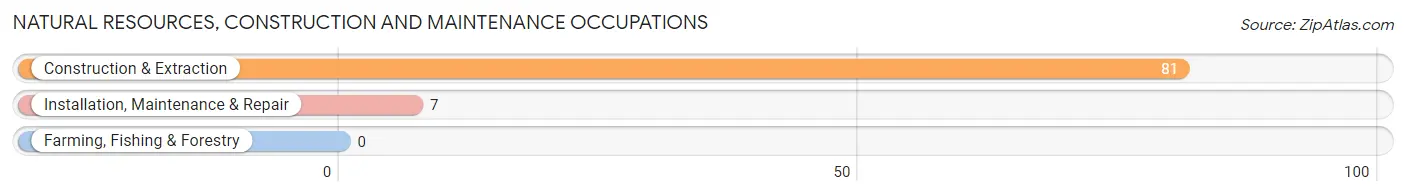
Natural Resources, Construction and Maintenance Occupations by Sex
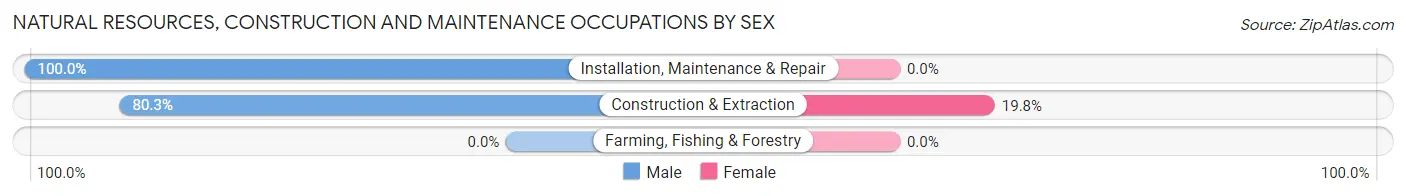
| Occupation | Male | Female |
| Farming, Fishing & Forestry | 0 (0.0%) | 0 (0.0%) |
| Construction & Extraction | 65 (80.2%) | 16 (19.8%) |
| Installation, Maintenance & Repair | 7 (100.0%) | 0 (0.0%) |
| Total (Category) | 72 (81.8%) | 16 (18.2%) |
| Total (Overall) | 362 (47.8%) | 395 (52.2%) |
Production, Transportation and Moving Occupations
The most common Production, Transportation and Moving occupations in Cascade Locks are Production (151 | 20.0%), Material Moving (64 | 8.5%), and Transportation (4 | 0.5%).
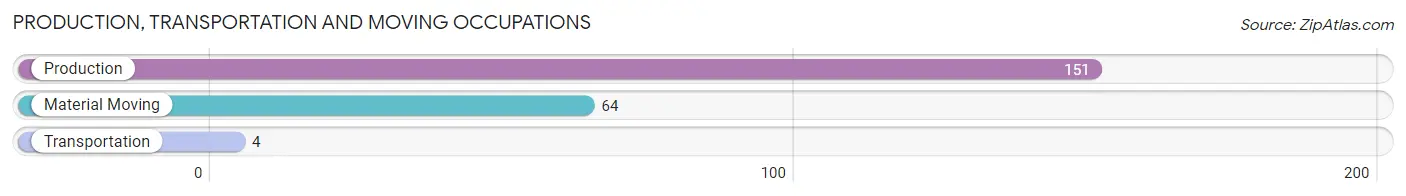
Production, Transportation and Moving Occupations by Sex
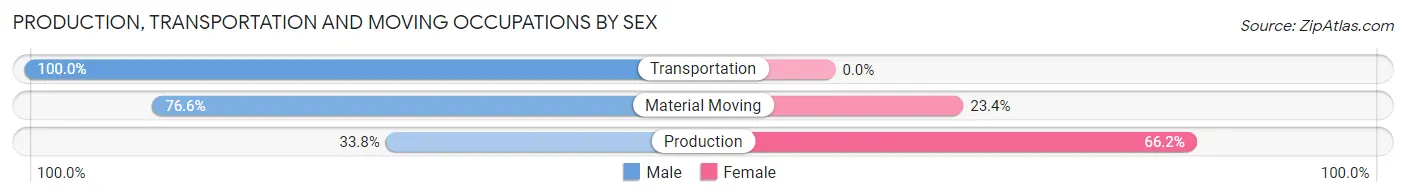
| Occupation | Male | Female |
| Production | 51 (33.8%) | 100 (66.2%) |
| Transportation | 4 (100.0%) | 0 (0.0%) |
| Material Moving | 49 (76.6%) | 15 (23.4%) |
| Total (Category) | 104 (47.5%) | 115 (52.5%) |
| Total (Overall) | 362 (47.8%) | 395 (52.2%) |
Employment Industries by Sex in Cascade Locks
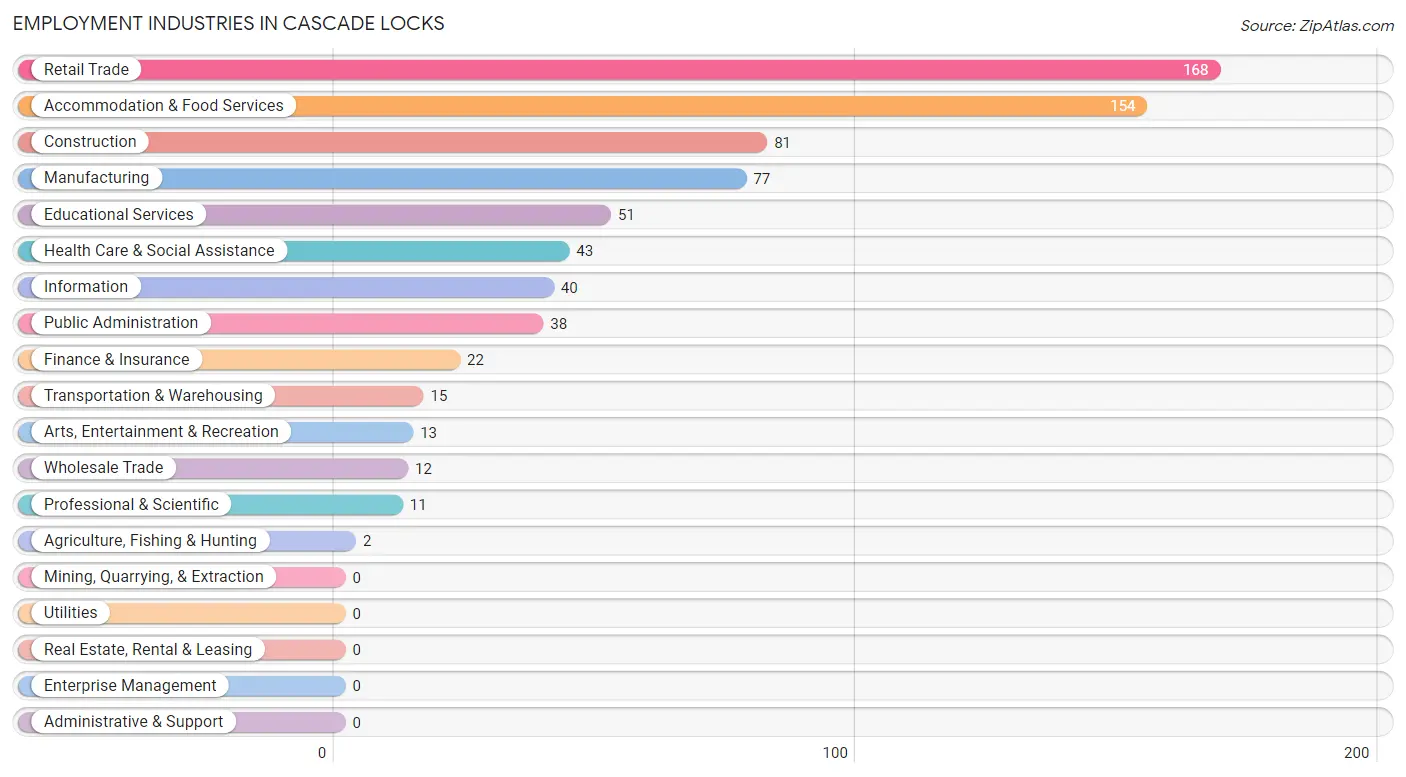
Employment Industries in Cascade Locks
The major employment industries in Cascade Locks include Retail Trade (168 | 22.2%), Accommodation & Food Services (154 | 20.3%), Construction (81 | 10.7%), Manufacturing (77 | 10.2%), and Educational Services (51 | 6.7%).
Employment Industries by Sex in Cascade Locks
The Cascade Locks industries that see more men than women are Agriculture, Fishing & Hunting (100.0%), Manufacturing (100.0%), and Wholesale Trade (100.0%), whereas the industries that tend to have a higher number of women are Professional & Scientific (100.0%), Educational Services (100.0%), and Arts, Entertainment & Recreation (100.0%).
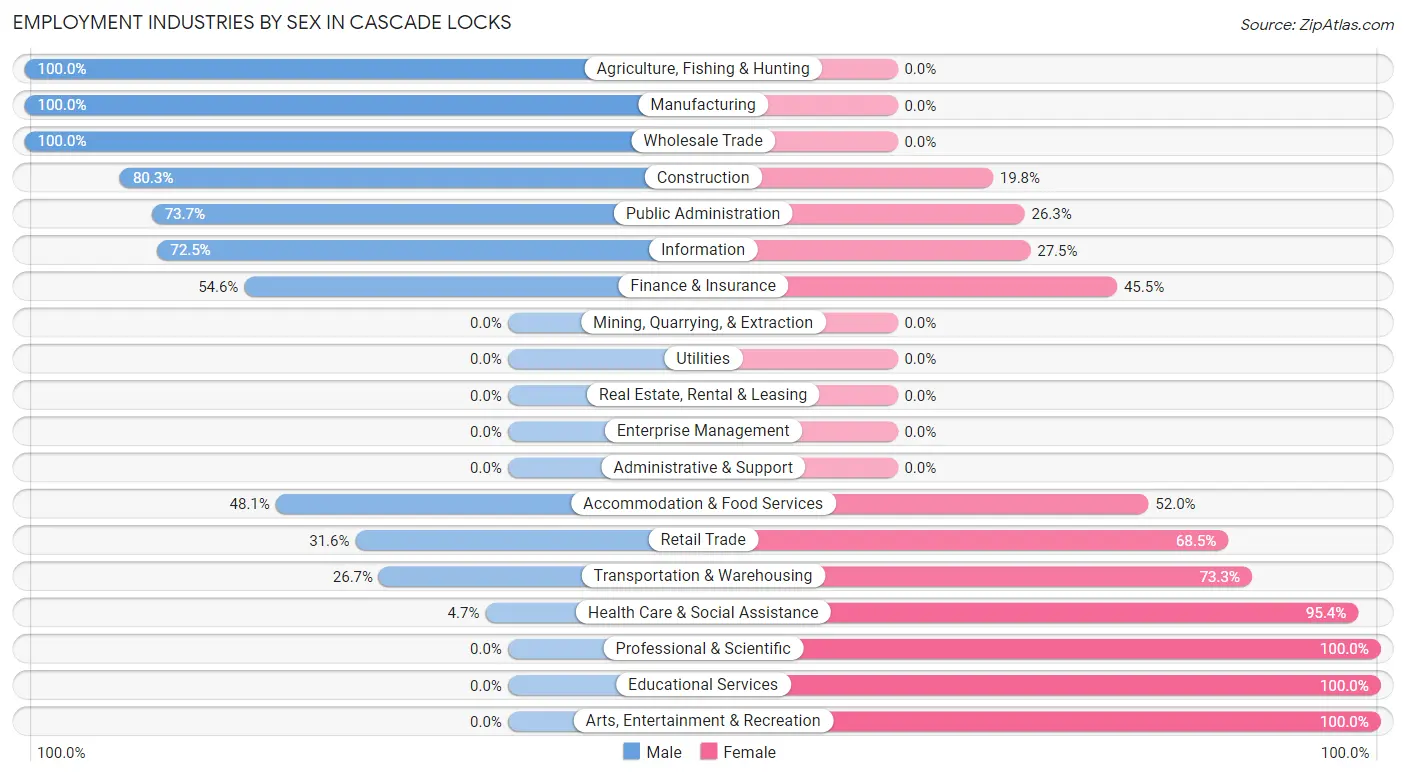
| Industry | Male | Female |
| Agriculture, Fishing & Hunting | 2 (100.0%) | 0 (0.0%) |
| Mining, Quarrying, & Extraction | 0 (0.0%) | 0 (0.0%) |
| Construction | 65 (80.2%) | 16 (19.8%) |
| Manufacturing | 77 (100.0%) | 0 (0.0%) |
| Wholesale Trade | 12 (100.0%) | 0 (0.0%) |
| Retail Trade | 53 (31.6%) | 115 (68.4%) |
| Transportation & Warehousing | 4 (26.7%) | 11 (73.3%) |
| Utilities | 0 (0.0%) | 0 (0.0%) |
| Information | 29 (72.5%) | 11 (27.5%) |
| Finance & Insurance | 12 (54.5%) | 10 (45.5%) |
| Real Estate, Rental & Leasing | 0 (0.0%) | 0 (0.0%) |
| Professional & Scientific | 0 (0.0%) | 11 (100.0%) |
| Enterprise Management | 0 (0.0%) | 0 (0.0%) |
| Administrative & Support | 0 (0.0%) | 0 (0.0%) |
| Educational Services | 0 (0.0%) | 51 (100.0%) |
| Health Care & Social Assistance | 2 (4.6%) | 41 (95.4%) |
| Arts, Entertainment & Recreation | 0 (0.0%) | 13 (100.0%) |
| Accommodation & Food Services | 74 (48.0%) | 80 (51.9%) |
| Public Administration | 28 (73.7%) | 10 (26.3%) |
| Total | 362 (47.8%) | 395 (52.2%) |
Education in Cascade Locks
School Enrollment in Cascade Locks
The most common levels of schooling among the 273 students in Cascade Locks are college / undergraduate (67 | 24.5%), elementary school (59 | 21.6%), and middle school (47 | 17.2%).
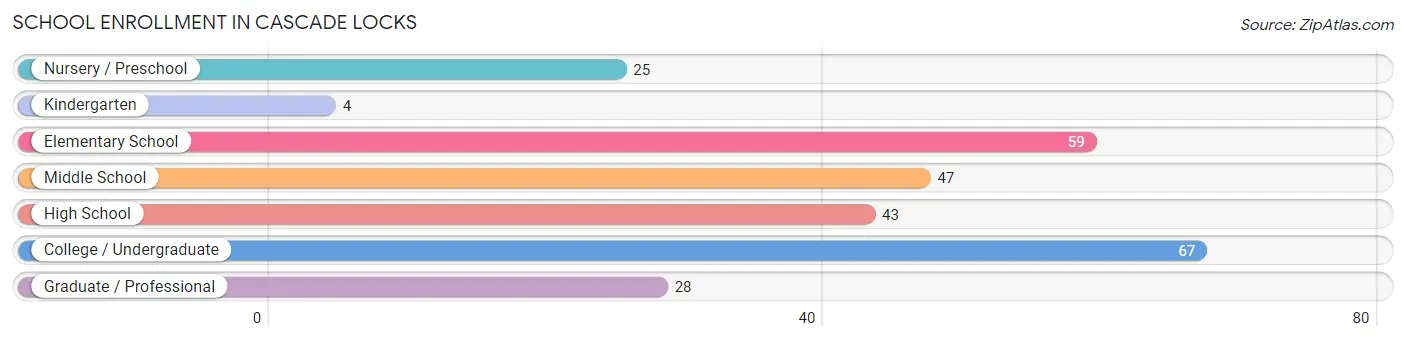
| School Level | # Students | % Students |
| Nursery / Preschool | 25 | 9.2% |
| Kindergarten | 4 | 1.5% |
| Elementary School | 59 | 21.6% |
| Middle School | 47 | 17.2% |
| High School | 43 | 15.8% |
| College / Undergraduate | 67 | 24.5% |
| Graduate / Professional | 28 | 10.3% |
| Total | 273 | 100.0% |
School Enrollment by Age by Funding Source in Cascade Locks
Out of a total of 273 students who are enrolled in schools in Cascade Locks, 72 (26.4%) attend a private institution, while the remaining 201 (73.6%) are enrolled in public schools. The age group of 35 years and over has the highest likelihood of being enrolled in private schools, with 51 (100.0% in the age bracket) enrolled. Conversely, the age group of 5 to 9 year old has the lowest likelihood of being enrolled in a private school, with 84 (100.0% in the age bracket) attending a public institution.
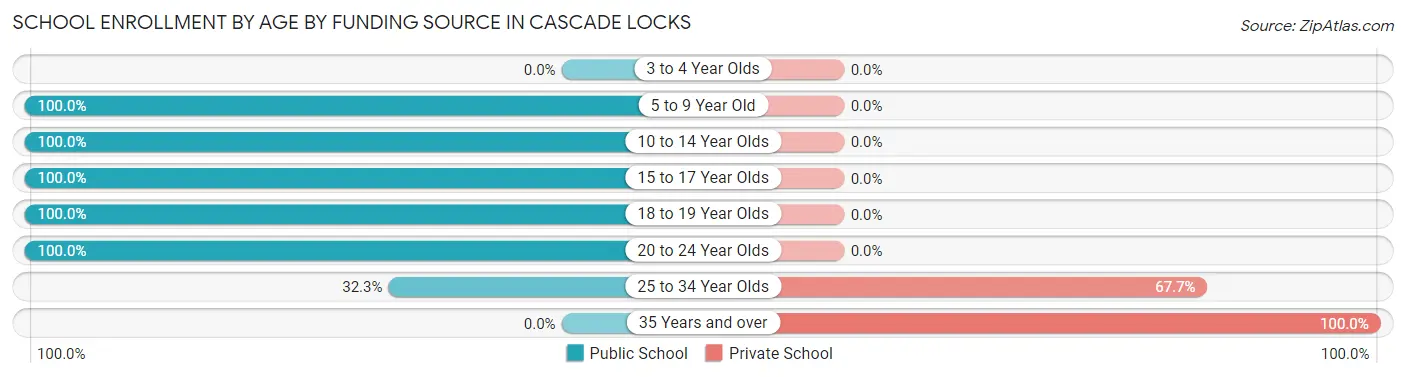
| Age Bracket | Public School | Private School |
| 3 to 4 Year Olds | 0 (0.0%) | 0 (0.0%) |
| 5 to 9 Year Old | 84 (100.0%) | 0 (0.0%) |
| 10 to 14 Year Olds | 51 (100.0%) | 0 (0.0%) |
| 15 to 17 Year Olds | 22 (100.0%) | 0 (0.0%) |
| 18 to 19 Year Olds | 21 (100.0%) | 0 (0.0%) |
| 20 to 24 Year Olds | 13 (100.0%) | 0 (0.0%) |
| 25 to 34 Year Olds | 10 (32.3%) | 21 (67.7%) |
| 35 Years and over | 0 (0.0%) | 51 (100.0%) |
| Total | 201 (73.6%) | 72 (26.4%) |
Educational Attainment by Field of Study in Cascade Locks
Business (61 | 23.4%), science & technology (38 | 14.6%), liberal arts & history (28 | 10.7%), social sciences (21 | 8.1%), and visual & performing arts (19 | 7.3%) are the most common fields of study among 261 individuals in Cascade Locks who have obtained a bachelor's degree or higher.
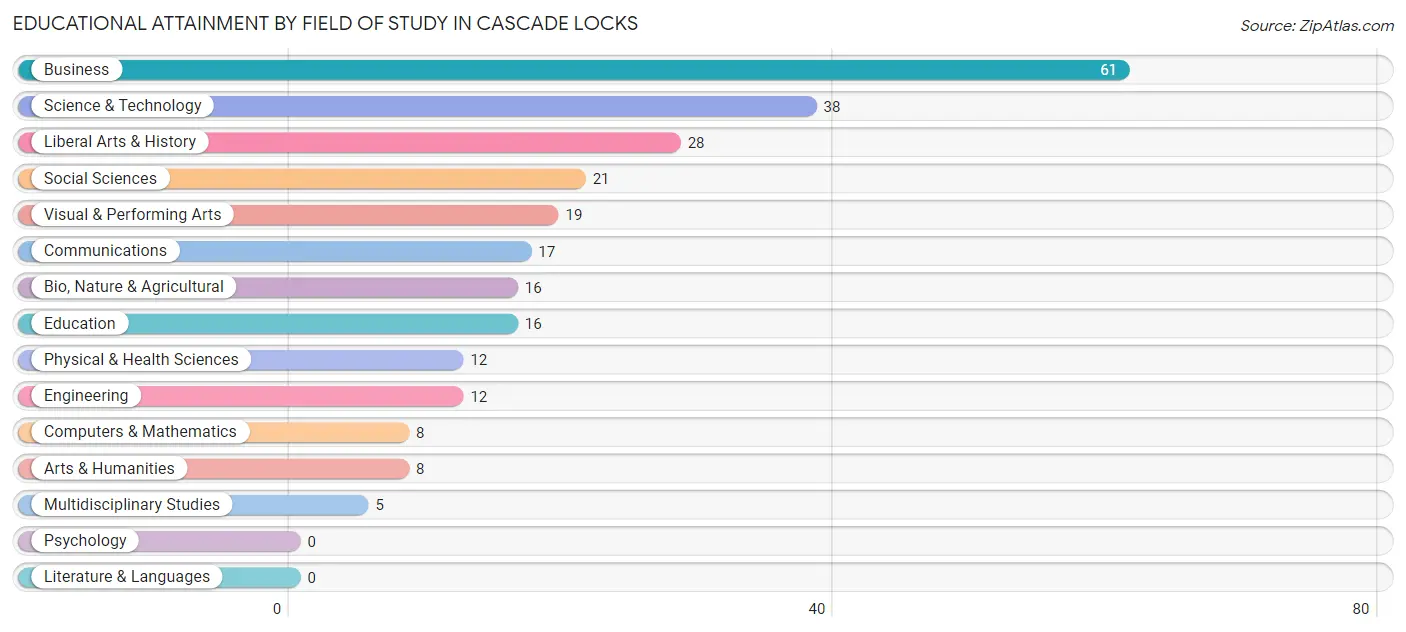
| Field of Study | # Graduates | % Graduates |
| Computers & Mathematics | 8 | 3.1% |
| Bio, Nature & Agricultural | 16 | 6.1% |
| Physical & Health Sciences | 12 | 4.6% |
| Psychology | 0 | 0.0% |
| Social Sciences | 21 | 8.1% |
| Engineering | 12 | 4.6% |
| Multidisciplinary Studies | 5 | 1.9% |
| Science & Technology | 38 | 14.6% |
| Business | 61 | 23.4% |
| Education | 16 | 6.1% |
| Literature & Languages | 0 | 0.0% |
| Liberal Arts & History | 28 | 10.7% |
| Visual & Performing Arts | 19 | 7.3% |
| Communications | 17 | 6.5% |
| Arts & Humanities | 8 | 3.1% |
| Total | 261 | 100.0% |
Transportation & Commute in Cascade Locks
Vehicle Availability by Sex in Cascade Locks
The most prevalent vehicle ownership categories in Cascade Locks are males with 2 vehicles (139, accounting for 38.4%) and females with 2 vehicles (195, making up 35.2%).
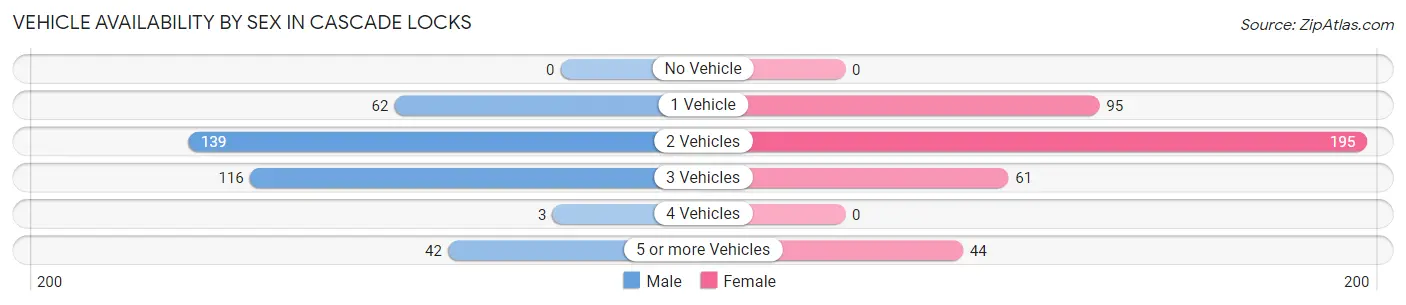
| Vehicles Available | Male | Female |
| No Vehicle | 0 (0.0%) | 0 (0.0%) |
| 1 Vehicle | 62 (17.1%) | 95 (24.0%) |
| 2 Vehicles | 139 (38.4%) | 195 (49.4%) |
| 3 Vehicles | 116 (32.0%) | 61 (15.4%) |
| 4 Vehicles | 3 (0.8%) | 0 (0.0%) |
| 5 or more Vehicles | 42 (11.6%) | 44 (11.1%) |
| Total | 362 (100.0%) | 395 (100.0%) |
Commute Time in Cascade Locks
The most frequently occuring commute durations in Cascade Locks are 25 to 29 minutes (129 commuters, 20.1%), 5 to 9 minutes (103 commuters, 16.1%), and 20 to 24 minutes (80 commuters, 12.5%).
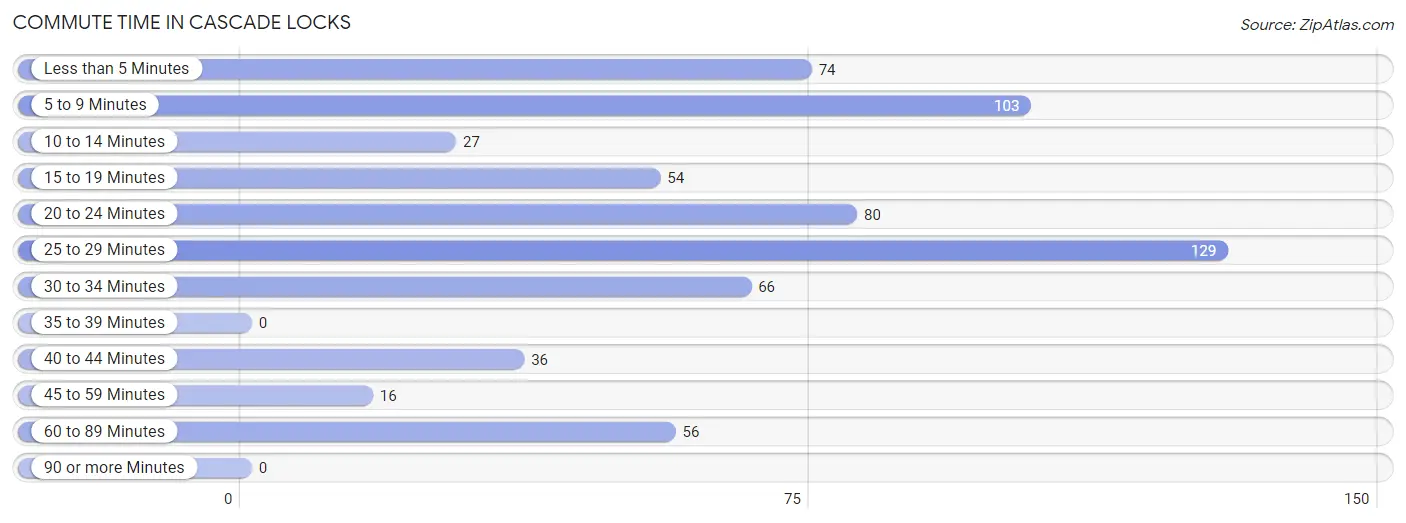
| Commute Time | # Commuters | % Commuters |
| Less than 5 Minutes | 74 | 11.5% |
| 5 to 9 Minutes | 103 | 16.1% |
| 10 to 14 Minutes | 27 | 4.2% |
| 15 to 19 Minutes | 54 | 8.4% |
| 20 to 24 Minutes | 80 | 12.5% |
| 25 to 29 Minutes | 129 | 20.1% |
| 30 to 34 Minutes | 66 | 10.3% |
| 35 to 39 Minutes | 0 | 0.0% |
| 40 to 44 Minutes | 36 | 5.6% |
| 45 to 59 Minutes | 16 | 2.5% |
| 60 to 89 Minutes | 56 | 8.7% |
| 90 or more Minutes | 0 | 0.0% |
Commute Time by Sex in Cascade Locks
The most common commute times in Cascade Locks are 5 to 9 minutes (79 commuters, 24.3%) for males and 25 to 29 minutes (115 commuters, 36.4%) for females.
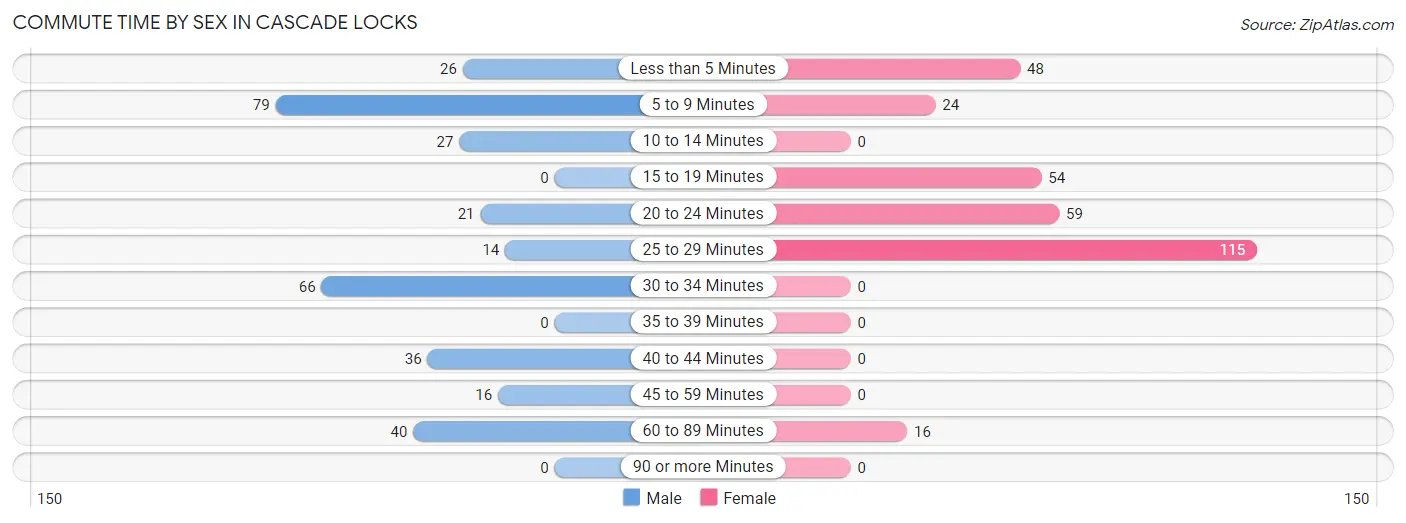
| Commute Time | Male | Female |
| Less than 5 Minutes | 26 (8.0%) | 48 (15.2%) |
| 5 to 9 Minutes | 79 (24.3%) | 24 (7.6%) |
| 10 to 14 Minutes | 27 (8.3%) | 0 (0.0%) |
| 15 to 19 Minutes | 0 (0.0%) | 54 (17.1%) |
| 20 to 24 Minutes | 21 (6.5%) | 59 (18.7%) |
| 25 to 29 Minutes | 14 (4.3%) | 115 (36.4%) |
| 30 to 34 Minutes | 66 (20.3%) | 0 (0.0%) |
| 35 to 39 Minutes | 0 (0.0%) | 0 (0.0%) |
| 40 to 44 Minutes | 36 (11.1%) | 0 (0.0%) |
| 45 to 59 Minutes | 16 (4.9%) | 0 (0.0%) |
| 60 to 89 Minutes | 40 (12.3%) | 16 (5.1%) |
| 90 or more Minutes | 0 (0.0%) | 0 (0.0%) |
Time of Departure to Work by Sex in Cascade Locks
The most frequent times of departure to work in Cascade Locks are 12:00 AM to 4:59 AM (65, 20.0%) for males and 5:00 AM to 5:29 AM (100, 31.7%) for females.
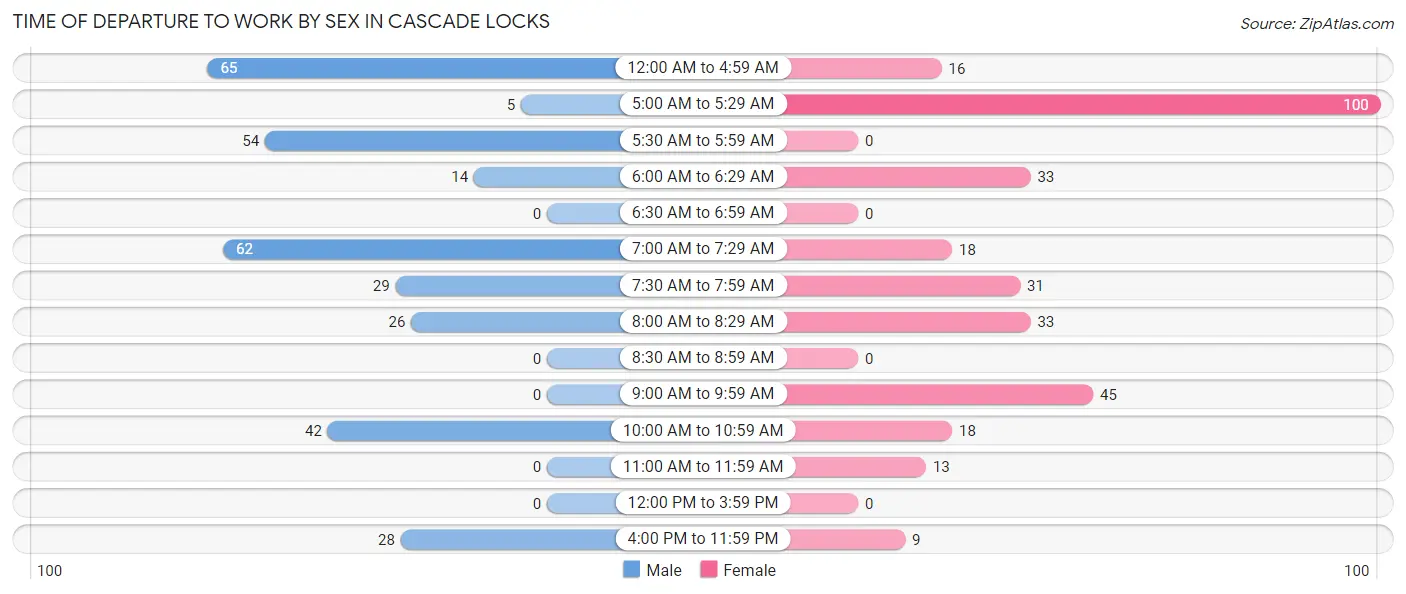
| Time of Departure | Male | Female |
| 12:00 AM to 4:59 AM | 65 (20.0%) | 16 (5.1%) |
| 5:00 AM to 5:29 AM | 5 (1.5%) | 100 (31.7%) |
| 5:30 AM to 5:59 AM | 54 (16.6%) | 0 (0.0%) |
| 6:00 AM to 6:29 AM | 14 (4.3%) | 33 (10.4%) |
| 6:30 AM to 6:59 AM | 0 (0.0%) | 0 (0.0%) |
| 7:00 AM to 7:29 AM | 62 (19.1%) | 18 (5.7%) |
| 7:30 AM to 7:59 AM | 29 (8.9%) | 31 (9.8%) |
| 8:00 AM to 8:29 AM | 26 (8.0%) | 33 (10.4%) |
| 8:30 AM to 8:59 AM | 0 (0.0%) | 0 (0.0%) |
| 9:00 AM to 9:59 AM | 0 (0.0%) | 45 (14.2%) |
| 10:00 AM to 10:59 AM | 42 (12.9%) | 18 (5.7%) |
| 11:00 AM to 11:59 AM | 0 (0.0%) | 13 (4.1%) |
| 12:00 PM to 3:59 PM | 0 (0.0%) | 0 (0.0%) |
| 4:00 PM to 11:59 PM | 28 (8.6%) | 9 (2.9%) |
| Total | 325 (100.0%) | 316 (100.0%) |
Housing Occupancy in Cascade Locks
Occupancy by Ownership in Cascade Locks
Of the total 639 dwellings in Cascade Locks, owner-occupied units account for 481 (75.3%), while renter-occupied units make up 158 (24.7%).
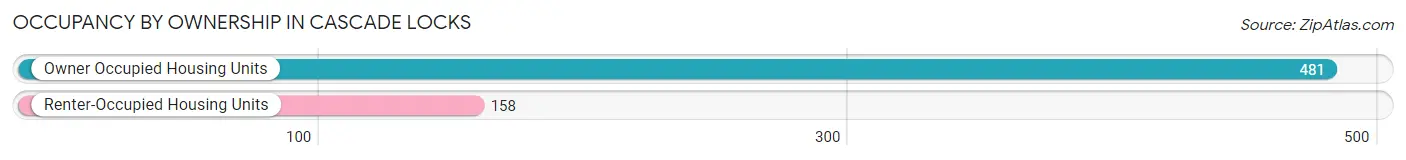
| Occupancy | # Housing Units | % Housing Units |
| Owner Occupied Housing Units | 481 | 75.3% |
| Renter-Occupied Housing Units | 158 | 24.7% |
| Total Occupied Housing Units | 639 | 100.0% |
Occupancy by Household Size in Cascade Locks
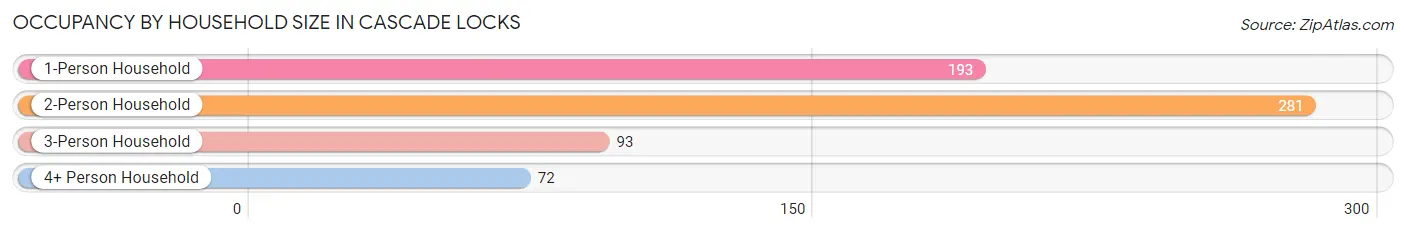
| Household Size | # Housing Units | % Housing Units |
| 1-Person Household | 193 | 30.2% |
| 2-Person Household | 281 | 44.0% |
| 3-Person Household | 93 | 14.5% |
| 4+ Person Household | 72 | 11.3% |
| Total Housing Units | 639 | 100.0% |
Occupancy by Ownership by Household Size in Cascade Locks
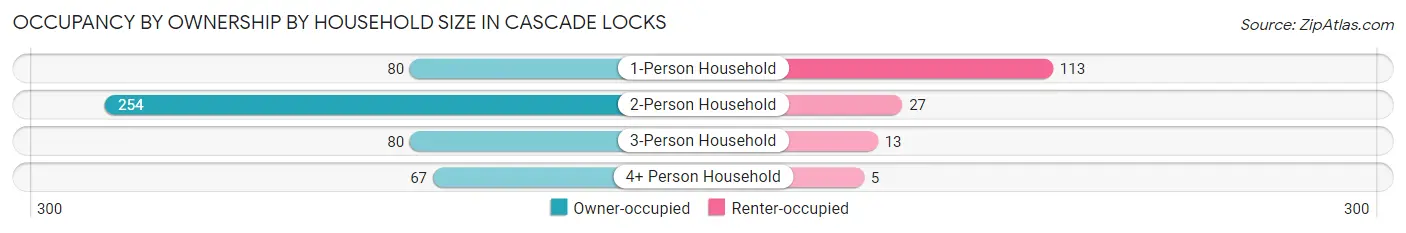
| Household Size | Owner-occupied | Renter-occupied |
| 1-Person Household | 80 (41.4%) | 113 (58.6%) |
| 2-Person Household | 254 (90.4%) | 27 (9.6%) |
| 3-Person Household | 80 (86.0%) | 13 (14.0%) |
| 4+ Person Household | 67 (93.1%) | 5 (6.9%) |
| Total Housing Units | 481 (75.3%) | 158 (24.7%) |
Occupancy by Educational Attainment in Cascade Locks
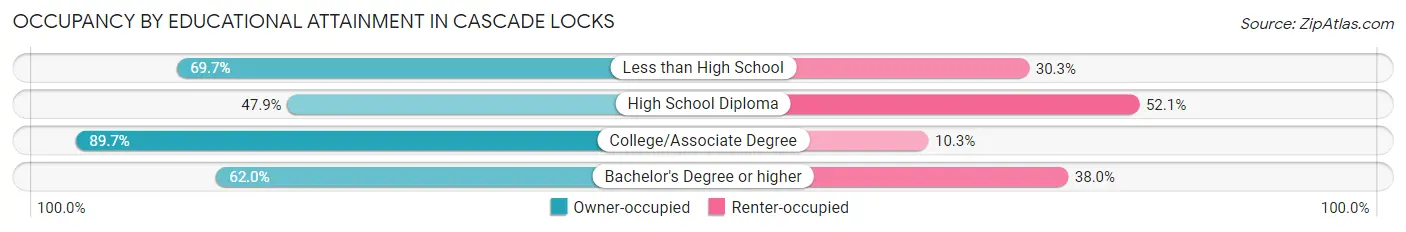
| Household Size | Owner-occupied | Renter-occupied |
| Less than High School | 53 (69.7%) | 23 (30.3%) |
| High School Diploma | 34 (47.9%) | 37 (52.1%) |
| College/Associate Degree | 288 (89.7%) | 33 (10.3%) |
| Bachelor's Degree or higher | 106 (62.0%) | 65 (38.0%) |
Occupancy by Age of Householder in Cascade Locks
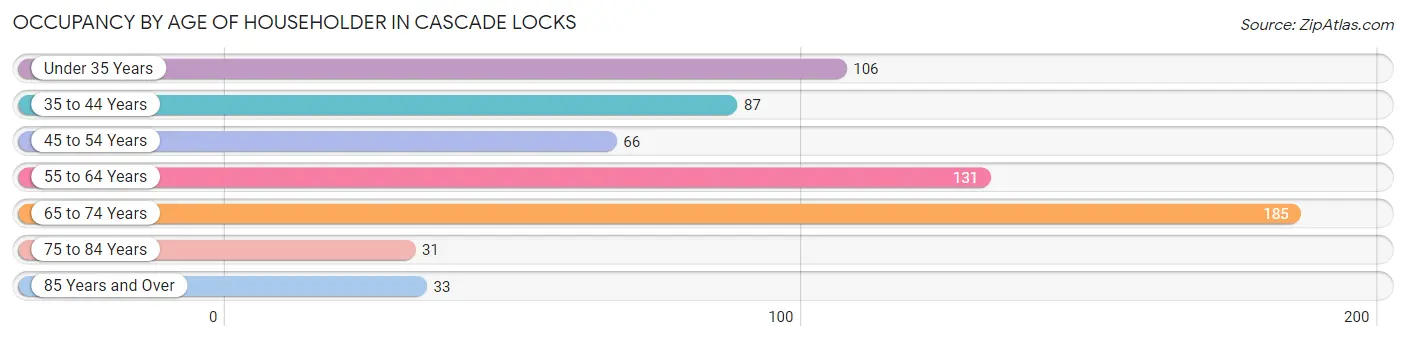
| Age Bracket | # Households | % Households |
| Under 35 Years | 106 | 16.6% |
| 35 to 44 Years | 87 | 13.6% |
| 45 to 54 Years | 66 | 10.3% |
| 55 to 64 Years | 131 | 20.5% |
| 65 to 74 Years | 185 | 28.9% |
| 75 to 84 Years | 31 | 4.9% |
| 85 Years and Over | 33 | 5.2% |
| Total | 639 | 100.0% |
Housing Finances in Cascade Locks
Median Income by Occupancy in Cascade Locks
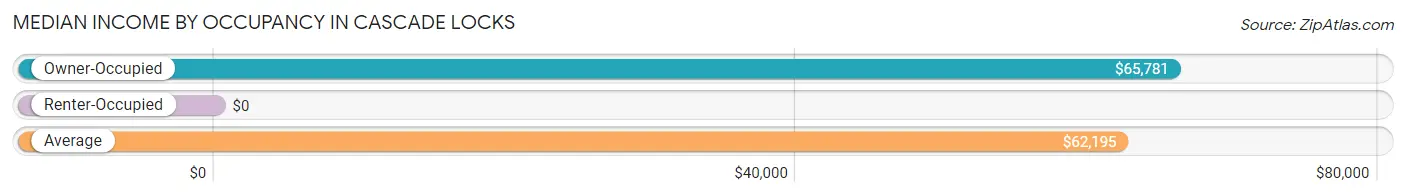
| Occupancy Type | # Households | Median Income |
| Owner-Occupied | 481 (75.3%) | $65,781 |
| Renter-Occupied | 158 (24.7%) | $0 |
| Average | 639 (100.0%) | $62,195 |
Occupancy by Householder Income Bracket in Cascade Locks
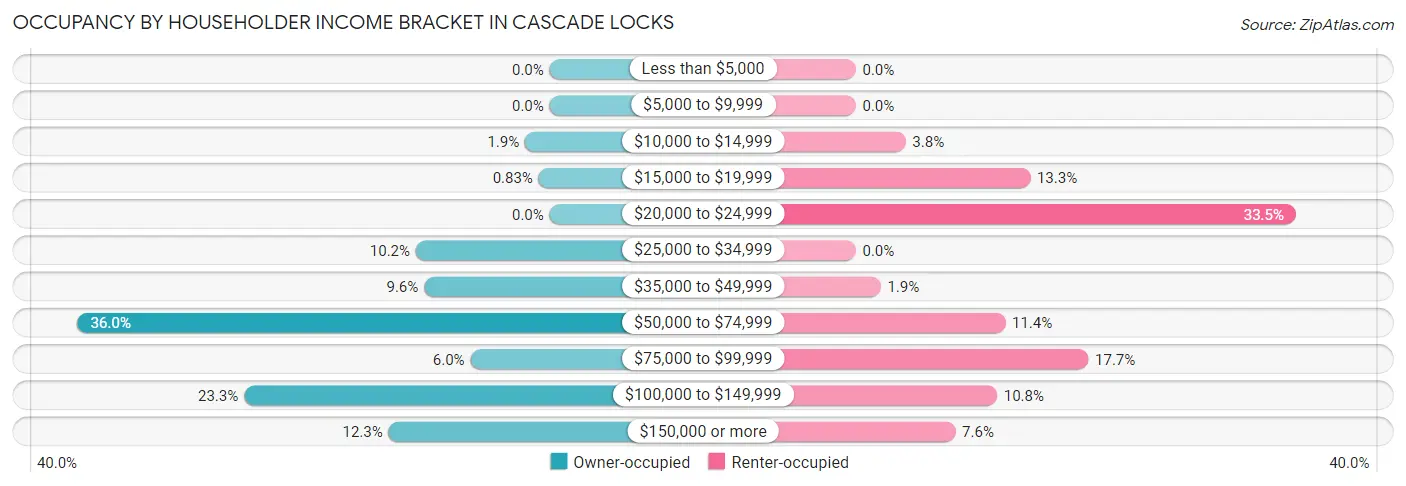
| Income Bracket | Owner-occupied | Renter-occupied |
| Less than $5,000 | 0 (0.0%) | 0 (0.0%) |
| $5,000 to $9,999 | 0 (0.0%) | 0 (0.0%) |
| $10,000 to $14,999 | 9 (1.9%) | 6 (3.8%) |
| $15,000 to $19,999 | 4 (0.8%) | 21 (13.3%) |
| $20,000 to $24,999 | 0 (0.0%) | 53 (33.5%) |
| $25,000 to $34,999 | 49 (10.2%) | 0 (0.0%) |
| $35,000 to $49,999 | 46 (9.6%) | 3 (1.9%) |
| $50,000 to $74,999 | 173 (36.0%) | 18 (11.4%) |
| $75,000 to $99,999 | 29 (6.0%) | 28 (17.7%) |
| $100,000 to $149,999 | 112 (23.3%) | 17 (10.8%) |
| $150,000 or more | 59 (12.3%) | 12 (7.6%) |
| Total | 481 (100.0%) | 158 (100.0%) |
Monthly Housing Cost Tiers in Cascade Locks
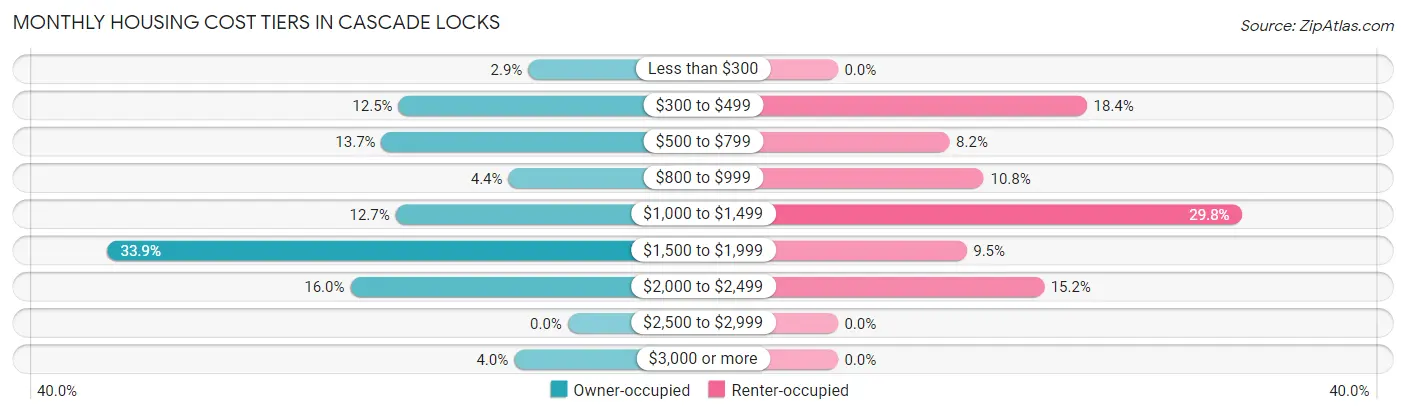
| Monthly Cost | Owner-occupied | Renter-occupied |
| Less than $300 | 14 (2.9%) | 0 (0.0%) |
| $300 to $499 | 60 (12.5%) | 29 (18.3%) |
| $500 to $799 | 66 (13.7%) | 13 (8.2%) |
| $800 to $999 | 21 (4.4%) | 17 (10.8%) |
| $1,000 to $1,499 | 61 (12.7%) | 47 (29.7%) |
| $1,500 to $1,999 | 163 (33.9%) | 15 (9.5%) |
| $2,000 to $2,499 | 77 (16.0%) | 24 (15.2%) |
| $2,500 to $2,999 | 0 (0.0%) | 0 (0.0%) |
| $3,000 or more | 19 (4.0%) | 0 (0.0%) |
| Total | 481 (100.0%) | 158 (100.0%) |
Physical Housing Characteristics in Cascade Locks
Housing Structures in Cascade Locks
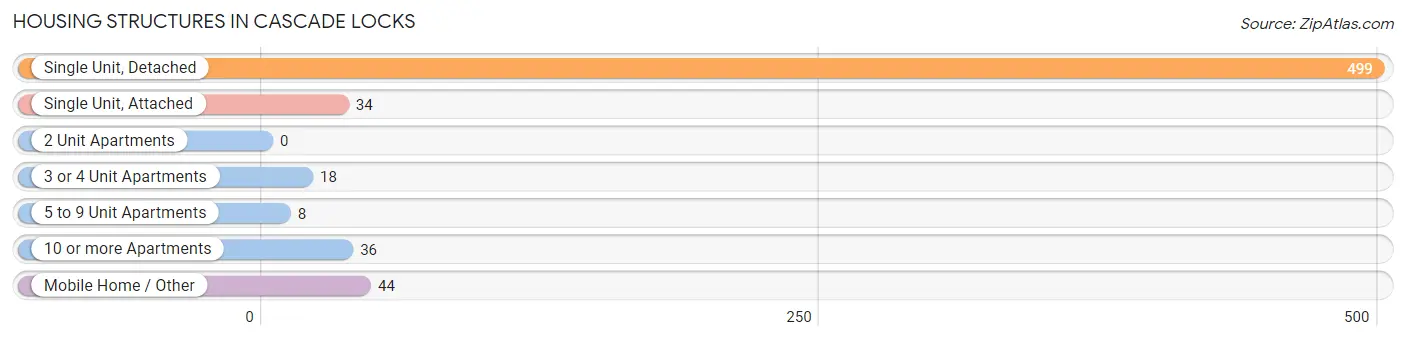
| Structure Type | # Housing Units | % Housing Units |
| Single Unit, Detached | 499 | 78.1% |
| Single Unit, Attached | 34 | 5.3% |
| 2 Unit Apartments | 0 | 0.0% |
| 3 or 4 Unit Apartments | 18 | 2.8% |
| 5 to 9 Unit Apartments | 8 | 1.3% |
| 10 or more Apartments | 36 | 5.6% |
| Mobile Home / Other | 44 | 6.9% |
| Total | 639 | 100.0% |
Housing Structures by Occupancy in Cascade Locks
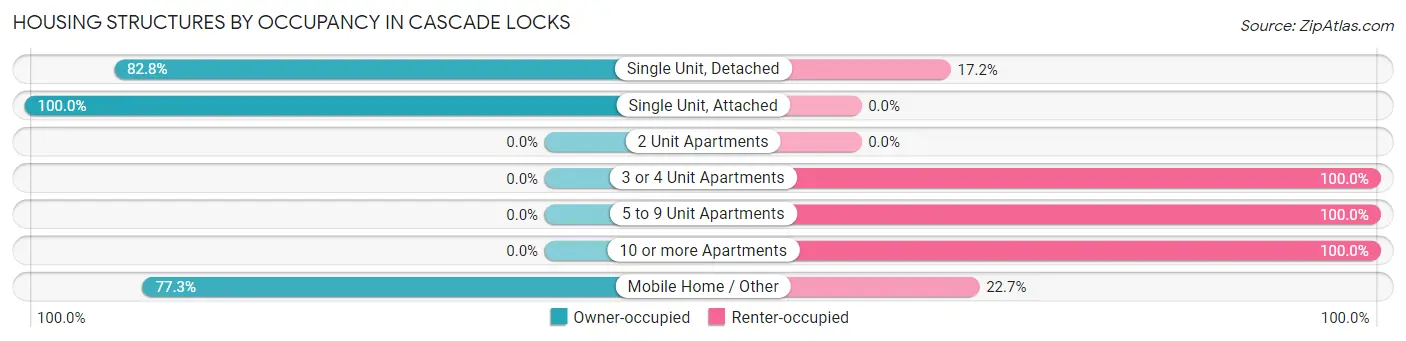
| Structure Type | Owner-occupied | Renter-occupied |
| Single Unit, Detached | 413 (82.8%) | 86 (17.2%) |
| Single Unit, Attached | 34 (100.0%) | 0 (0.0%) |
| 2 Unit Apartments | 0 (0.0%) | 0 (0.0%) |
| 3 or 4 Unit Apartments | 0 (0.0%) | 18 (100.0%) |
| 5 to 9 Unit Apartments | 0 (0.0%) | 8 (100.0%) |
| 10 or more Apartments | 0 (0.0%) | 36 (100.0%) |
| Mobile Home / Other | 34 (77.3%) | 10 (22.7%) |
| Total | 481 (75.3%) | 158 (24.7%) |
Housing Structures by Number of Rooms in Cascade Locks
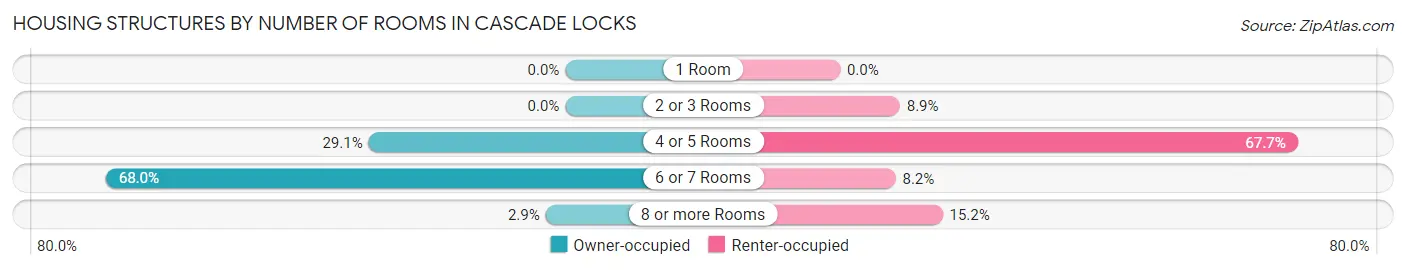
| Number of Rooms | Owner-occupied | Renter-occupied |
| 1 Room | 0 (0.0%) | 0 (0.0%) |
| 2 or 3 Rooms | 0 (0.0%) | 14 (8.9%) |
| 4 or 5 Rooms | 140 (29.1%) | 107 (67.7%) |
| 6 or 7 Rooms | 327 (68.0%) | 13 (8.2%) |
| 8 or more Rooms | 14 (2.9%) | 24 (15.2%) |
| Total | 481 (100.0%) | 158 (100.0%) |
Housing Structure by Heating Type in Cascade Locks
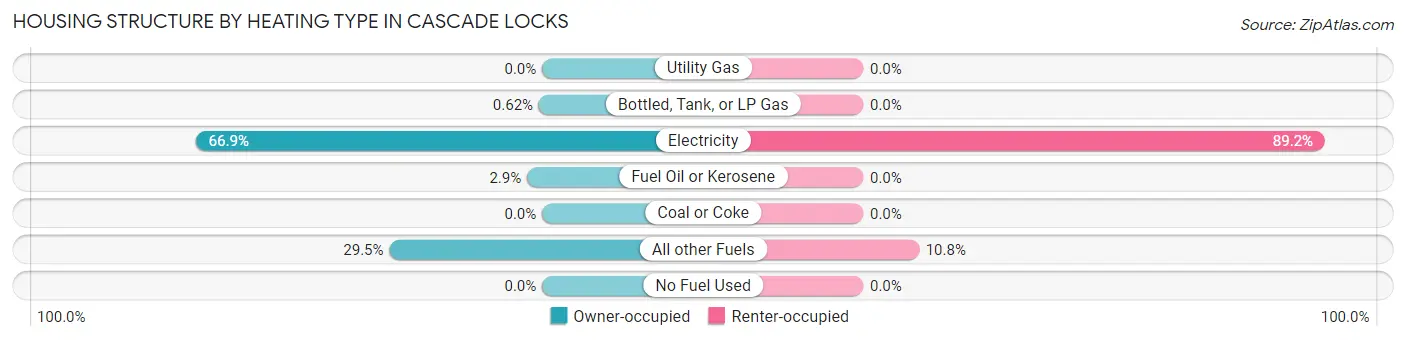
| Heating Type | Owner-occupied | Renter-occupied |
| Utility Gas | 0 (0.0%) | 0 (0.0%) |
| Bottled, Tank, or LP Gas | 3 (0.6%) | 0 (0.0%) |
| Electricity | 322 (66.9%) | 141 (89.2%) |
| Fuel Oil or Kerosene | 14 (2.9%) | 0 (0.0%) |
| Coal or Coke | 0 (0.0%) | 0 (0.0%) |
| All other Fuels | 142 (29.5%) | 17 (10.8%) |
| No Fuel Used | 0 (0.0%) | 0 (0.0%) |
| Total | 481 (100.0%) | 158 (100.0%) |
Household Vehicle Usage in Cascade Locks
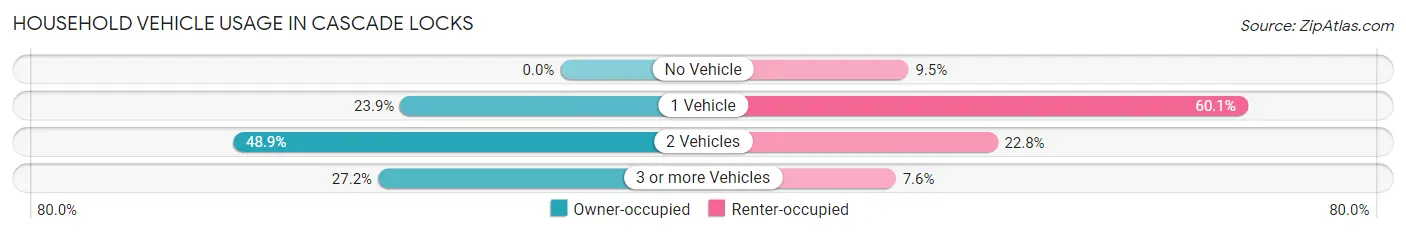
| Vehicles per Household | Owner-occupied | Renter-occupied |
| No Vehicle | 0 (0.0%) | 15 (9.5%) |
| 1 Vehicle | 115 (23.9%) | 95 (60.1%) |
| 2 Vehicles | 235 (48.9%) | 36 (22.8%) |
| 3 or more Vehicles | 131 (27.2%) | 12 (7.6%) |
| Total | 481 (100.0%) | 158 (100.0%) |
Real Estate & Mortgages in Cascade Locks
Real Estate and Mortgage Overview in Cascade Locks
| Characteristic | Without Mortgage | With Mortgage |
| Housing Units | 127 | 354 |
| Median Property Value | $400,800 | $313,100 |
| Median Household Income | $46,098 | $59 |
| Monthly Housing Costs | $478 | $19 |
| Real Estate Taxes | $2,308 | $0 |
Property Value by Mortgage Status in Cascade Locks
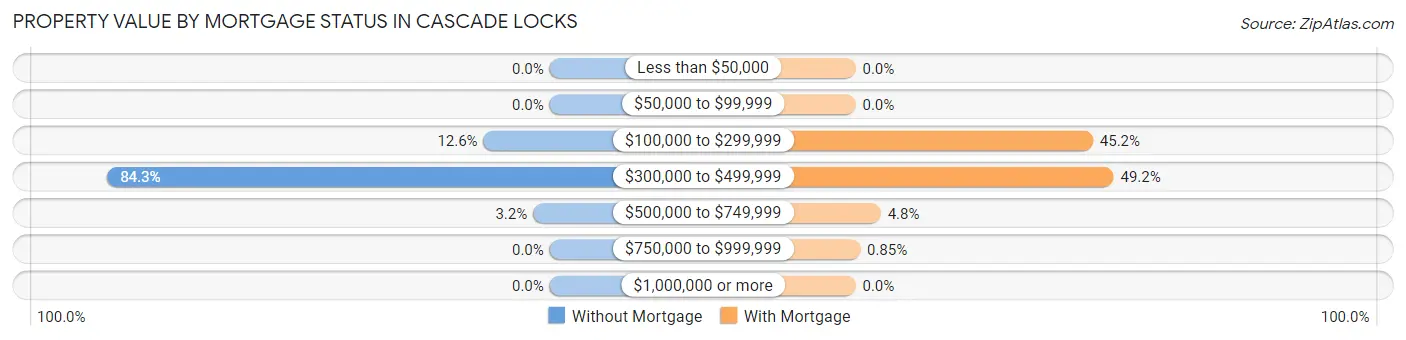
| Property Value | Without Mortgage | With Mortgage |
| Less than $50,000 | 0 (0.0%) | 0 (0.0%) |
| $50,000 to $99,999 | 0 (0.0%) | 0 (0.0%) |
| $100,000 to $299,999 | 16 (12.6%) | 160 (45.2%) |
| $300,000 to $499,999 | 107 (84.3%) | 174 (49.1%) |
| $500,000 to $749,999 | 4 (3.2%) | 17 (4.8%) |
| $750,000 to $999,999 | 0 (0.0%) | 3 (0.9%) |
| $1,000,000 or more | 0 (0.0%) | 0 (0.0%) |
| Total | 127 (100.0%) | 354 (100.0%) |
Household Income by Mortgage Status in Cascade Locks
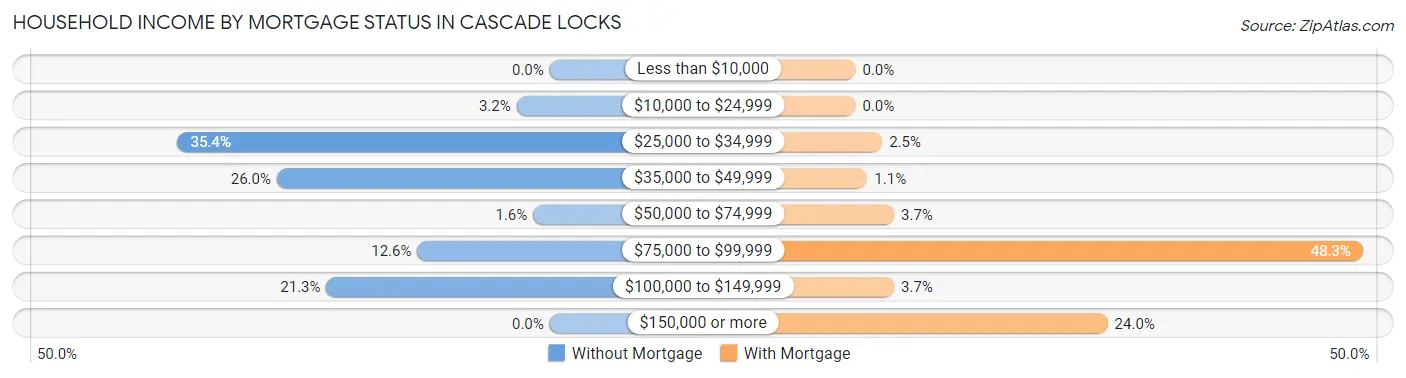
| Household Income | Without Mortgage | With Mortgage |
| Less than $10,000 | 0 (0.0%) | 0 (0.0%) |
| $10,000 to $24,999 | 4 (3.2%) | 0 (0.0%) |
| $25,000 to $34,999 | 45 (35.4%) | 9 (2.5%) |
| $35,000 to $49,999 | 33 (26.0%) | 4 (1.1%) |
| $50,000 to $74,999 | 2 (1.6%) | 13 (3.7%) |
| $75,000 to $99,999 | 16 (12.6%) | 171 (48.3%) |
| $100,000 to $149,999 | 27 (21.3%) | 13 (3.7%) |
| $150,000 or more | 0 (0.0%) | 85 (24.0%) |
| Total | 127 (100.0%) | 354 (100.0%) |
Property Value to Household Income Ratio in Cascade Locks
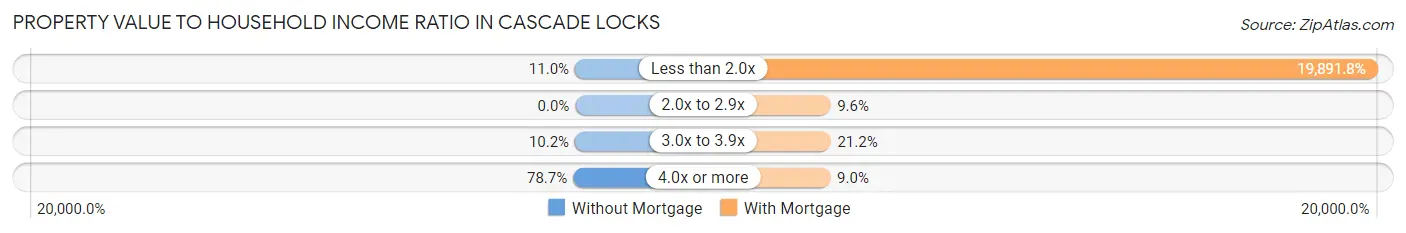
| Value-to-Income Ratio | Without Mortgage | With Mortgage |
| Less than 2.0x | 14 (11.0%) | 70,417 (19,891.8%) |
| 2.0x to 2.9x | 0 (0.0%) | 34 (9.6%) |
| 3.0x to 3.9x | 13 (10.2%) | 75 (21.2%) |
| 4.0x or more | 100 (78.7%) | 32 (9.0%) |
| Total | 127 (100.0%) | 354 (100.0%) |
Real Estate Taxes by Mortgage Status in Cascade Locks
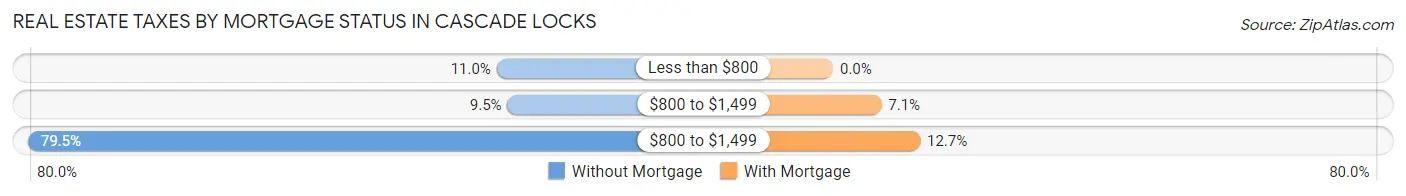
| Property Taxes | Without Mortgage | With Mortgage |
| Less than $800 | 14 (11.0%) | 0 (0.0%) |
| $800 to $1,499 | 12 (9.5%) | 25 (7.1%) |
| $800 to $1,499 | 101 (79.5%) | 45 (12.7%) |
| Total | 127 (100.0%) | 354 (100.0%) |
Health & Disability in Cascade Locks
Health Insurance Coverage by Age in Cascade Locks
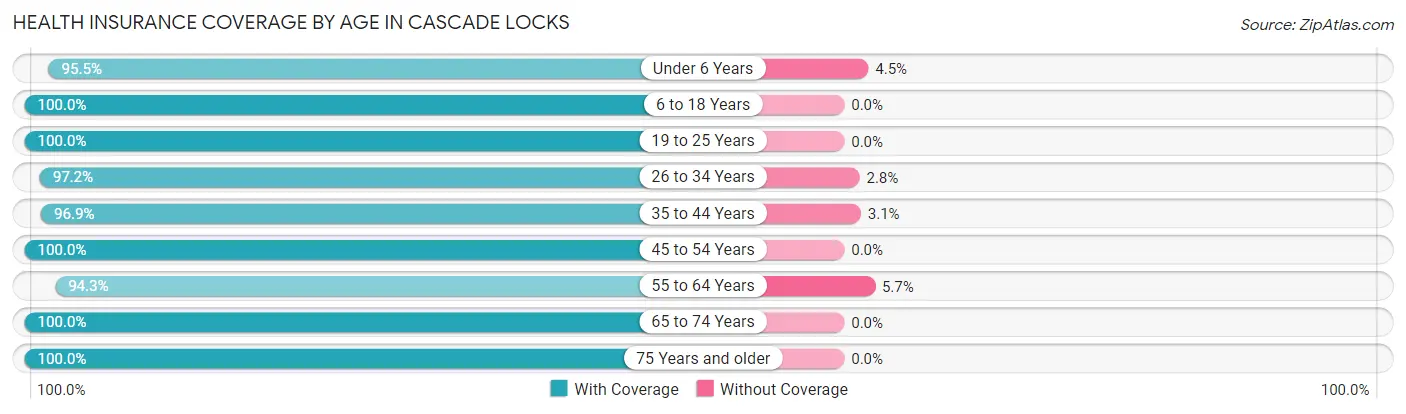
| Age Bracket | With Coverage | Without Coverage |
| Under 6 Years | 85 (95.5%) | 4 (4.5%) |
| 6 to 18 Years | 149 (100.0%) | 0 (0.0%) |
| 19 to 25 Years | 82 (100.0%) | 0 (0.0%) |
| 26 to 34 Years | 171 (97.2%) | 5 (2.8%) |
| 35 to 44 Years | 157 (96.9%) | 5 (3.1%) |
| 45 to 54 Years | 146 (100.0%) | 0 (0.0%) |
| 55 to 64 Years | 280 (94.3%) | 17 (5.7%) |
| 65 to 74 Years | 240 (100.0%) | 0 (0.0%) |
| 75 Years and older | 77 (100.0%) | 0 (0.0%) |
| Total | 1,387 (97.8%) | 31 (2.2%) |
Health Insurance Coverage by Citizenship Status in Cascade Locks

| Citizenship Status | With Coverage | Without Coverage |
| Native Born | 85 (95.5%) | 4 (4.5%) |
| Foreign Born, Citizen | 149 (100.0%) | 0 (0.0%) |
| Foreign Born, not a Citizen | 82 (100.0%) | 0 (0.0%) |
Health Insurance Coverage by Household Income in Cascade Locks
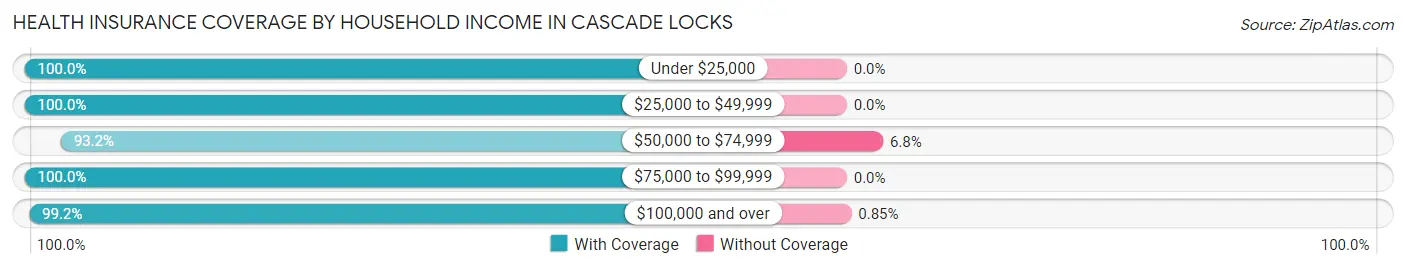
| Household Income | With Coverage | Without Coverage |
| Under $25,000 | 101 (100.0%) | 0 (0.0%) |
| $25,000 to $49,999 | 230 (100.0%) | 0 (0.0%) |
| $50,000 to $74,999 | 358 (93.2%) | 26 (6.8%) |
| $75,000 to $99,999 | 118 (100.0%) | 0 (0.0%) |
| $100,000 and over | 580 (99.2%) | 5 (0.9%) |
Public vs Private Health Insurance Coverage by Age in Cascade Locks
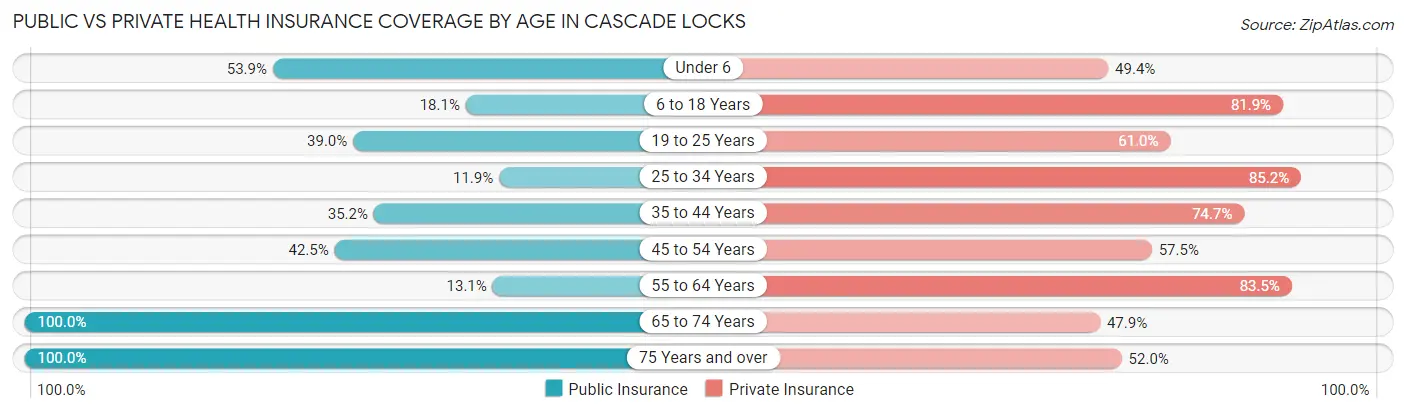
| Age Bracket | Public Insurance | Private Insurance |
| Under 6 | 48 (53.9%) | 44 (49.4%) |
| 6 to 18 Years | 27 (18.1%) | 122 (81.9%) |
| 19 to 25 Years | 32 (39.0%) | 50 (61.0%) |
| 25 to 34 Years | 21 (11.9%) | 150 (85.2%) |
| 35 to 44 Years | 57 (35.2%) | 121 (74.7%) |
| 45 to 54 Years | 62 (42.5%) | 84 (57.5%) |
| 55 to 64 Years | 39 (13.1%) | 248 (83.5%) |
| 65 to 74 Years | 240 (100.0%) | 115 (47.9%) |
| 75 Years and over | 77 (100.0%) | 40 (51.9%) |
| Total | 603 (42.5%) | 974 (68.7%) |
Disability Status by Sex by Age in Cascade Locks
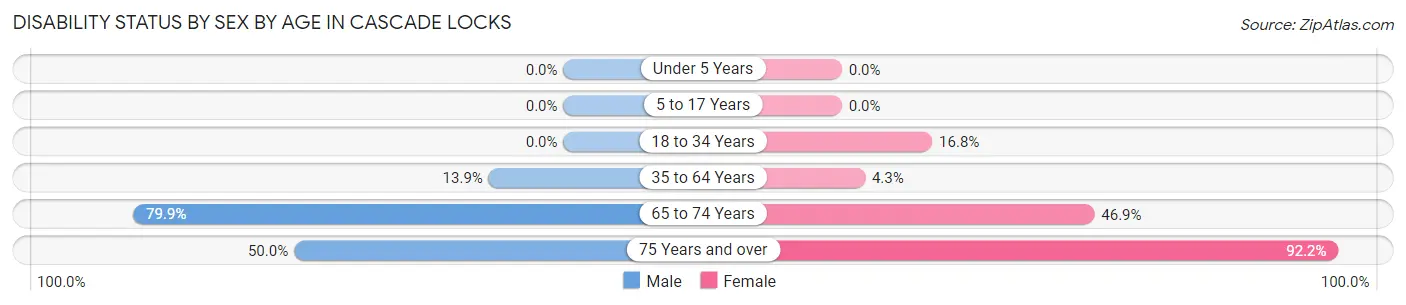
| Age Bracket | Male | Female |
| Under 5 Years | 0 (0.0%) | 0 (0.0%) |
| 5 to 17 Years | 0 (0.0%) | 0 (0.0%) |
| 18 to 34 Years | 0 (0.0%) | 28 (16.8%) |
| 35 to 64 Years | 42 (13.9%) | 13 (4.3%) |
| 65 to 74 Years | 115 (79.9%) | 45 (46.9%) |
| 75 Years and over | 13 (50.0%) | 47 (92.2%) |
Disability Class by Sex by Age in Cascade Locks
Disability Class: Hearing Difficulty
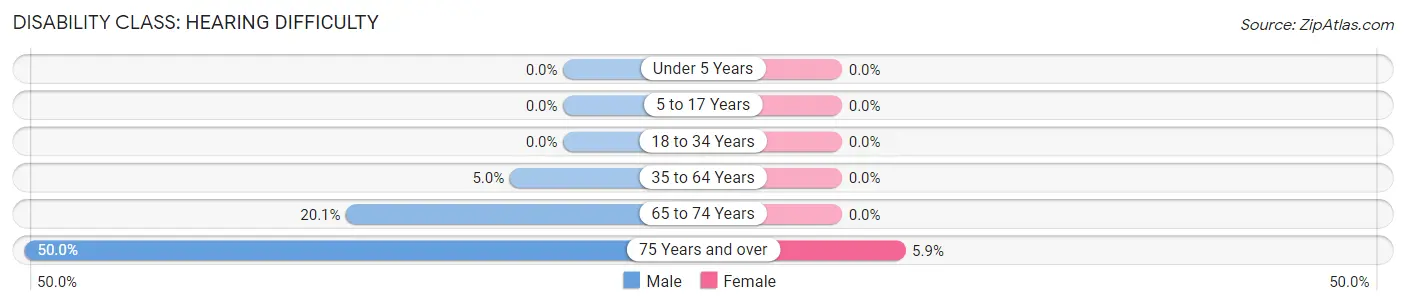
| Age Bracket | Male | Female |
| Under 5 Years | 0 (0.0%) | 0 (0.0%) |
| 5 to 17 Years | 0 (0.0%) | 0 (0.0%) |
| 18 to 34 Years | 0 (0.0%) | 0 (0.0%) |
| 35 to 64 Years | 15 (5.0%) | 0 (0.0%) |
| 65 to 74 Years | 29 (20.1%) | 0 (0.0%) |
| 75 Years and over | 13 (50.0%) | 3 (5.9%) |
Disability Class: Vision Difficulty
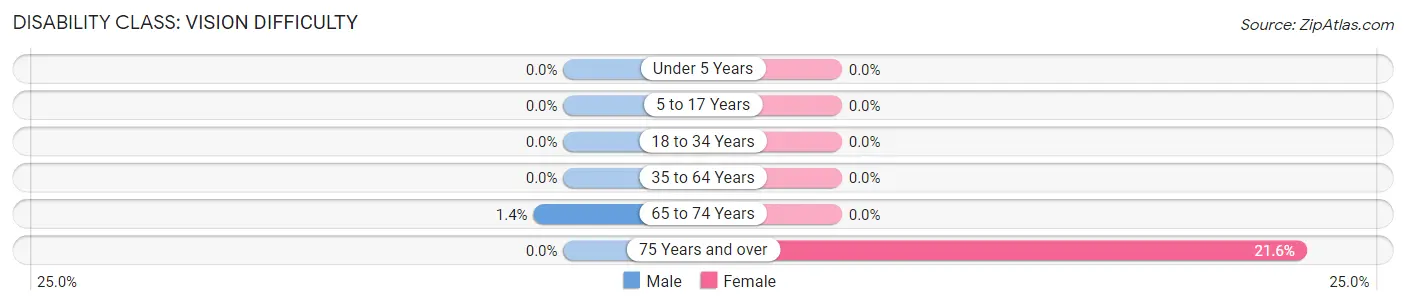
| Age Bracket | Male | Female |
| Under 5 Years | 0 (0.0%) | 0 (0.0%) |
| 5 to 17 Years | 0 (0.0%) | 0 (0.0%) |
| 18 to 34 Years | 0 (0.0%) | 0 (0.0%) |
| 35 to 64 Years | 0 (0.0%) | 0 (0.0%) |
| 65 to 74 Years | 2 (1.4%) | 0 (0.0%) |
| 75 Years and over | 0 (0.0%) | 11 (21.6%) |
Disability Class: Cognitive Difficulty
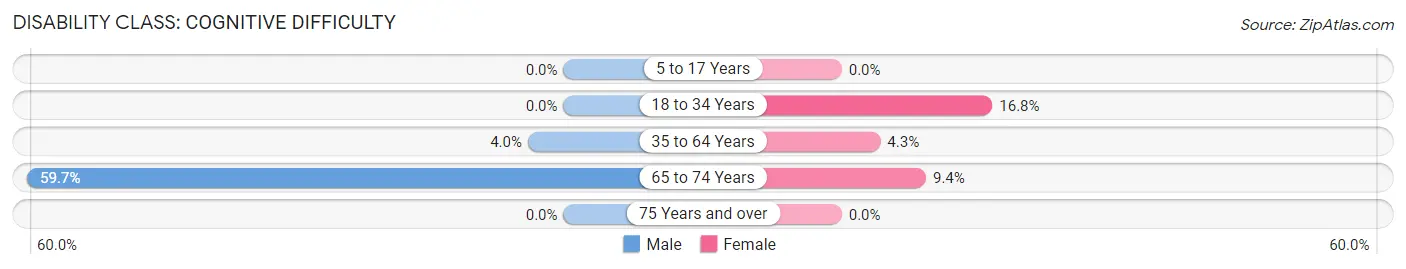
| Age Bracket | Male | Female |
| 5 to 17 Years | 0 (0.0%) | 0 (0.0%) |
| 18 to 34 Years | 0 (0.0%) | 28 (16.8%) |
| 35 to 64 Years | 12 (4.0%) | 13 (4.3%) |
| 65 to 74 Years | 86 (59.7%) | 9 (9.4%) |
| 75 Years and over | 0 (0.0%) | 0 (0.0%) |
Disability Class: Ambulatory Difficulty
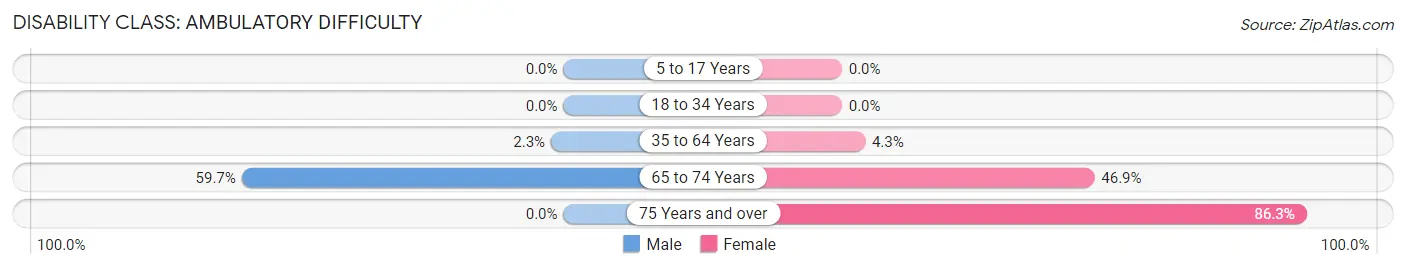
| Age Bracket | Male | Female |
| 5 to 17 Years | 0 (0.0%) | 0 (0.0%) |
| 18 to 34 Years | 0 (0.0%) | 0 (0.0%) |
| 35 to 64 Years | 7 (2.3%) | 13 (4.3%) |
| 65 to 74 Years | 86 (59.7%) | 45 (46.9%) |
| 75 Years and over | 0 (0.0%) | 44 (86.3%) |
Disability Class: Self-Care Difficulty
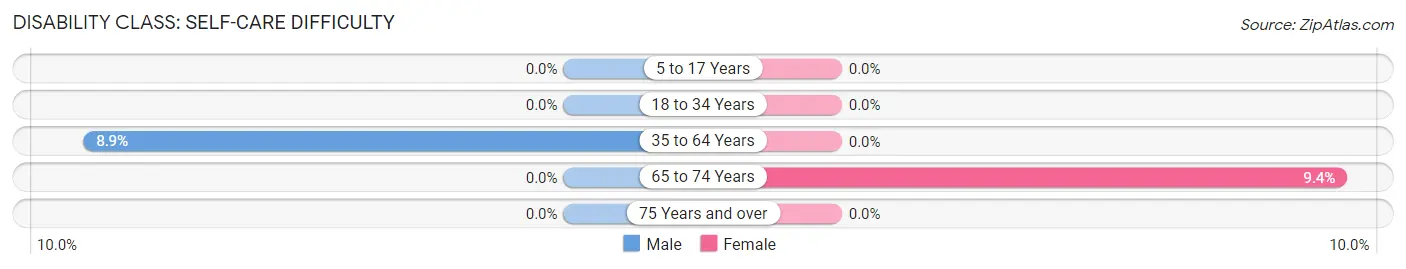
| Age Bracket | Male | Female |
| 5 to 17 Years | 0 (0.0%) | 0 (0.0%) |
| 18 to 34 Years | 0 (0.0%) | 0 (0.0%) |
| 35 to 64 Years | 27 (8.9%) | 0 (0.0%) |
| 65 to 74 Years | 0 (0.0%) | 9 (9.4%) |
| 75 Years and over | 0 (0.0%) | 0 (0.0%) |
Technology Access in Cascade Locks
Computing Device Access in Cascade Locks
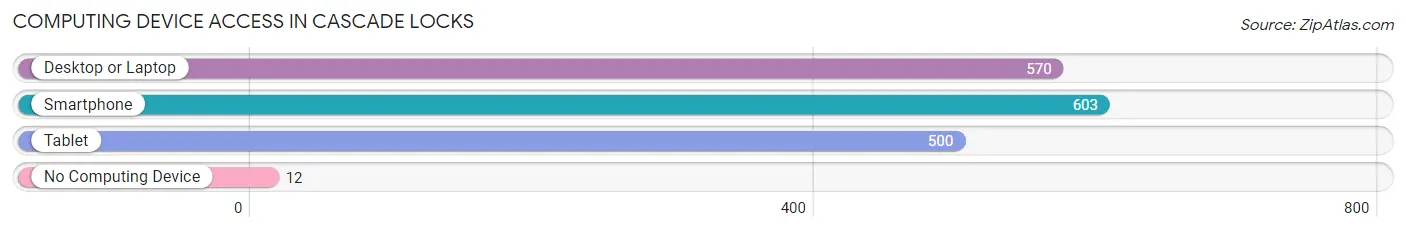
| Device Type | # Households | % Households |
| Desktop or Laptop | 570 | 89.2% |
| Smartphone | 603 | 94.4% |
| Tablet | 500 | 78.2% |
| No Computing Device | 12 | 1.9% |
| Total | 639 | 100.0% |
Internet Access in Cascade Locks
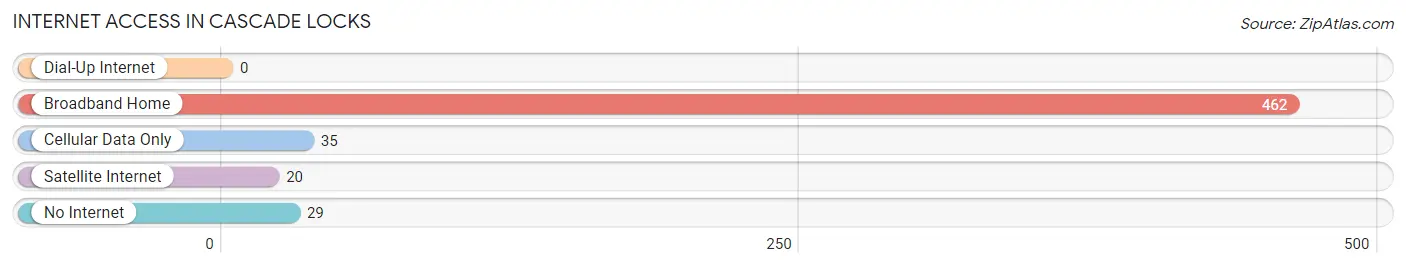
| Internet Type | # Households | % Households |
| Dial-Up Internet | 0 | 0.0% |
| Broadband Home | 462 | 72.3% |
| Cellular Data Only | 35 | 5.5% |
| Satellite Internet | 20 | 3.1% |
| No Internet | 29 | 4.5% |
| Total | 639 | 100.0% |
Cascade Locks Summary
Cascade Locks is a small city located in the Columbia River Gorge in the U.S. state of Oregon. It is situated in Hood River County, and is the only incorporated city in the county. The city is located on the Columbia River, just east of the Bridge of the Gods, a toll bridge that spans the river and connects Oregon and Washington. The city is named after a set of locks built in 1896 to bypass the Cascades Rapids of the Columbia River.
History
The area around Cascade Locks has been inhabited for thousands of years by Native American tribes, including the Multnomah, Wasco, and Chinook. The first European settlers arrived in the area in the early 1800s, and the first permanent settlement was established in 1845. The settlement was named Cascade Locks after the locks built in 1896 to bypass the Cascades Rapids of the Columbia River. The locks were built to facilitate navigation of the river and to provide access to the interior of the Columbia River Gorge.
The city was incorporated in 1915, and the population grew steadily throughout the 20th century. The city was a major transportation hub in the region, with the Columbia River providing access to the interior of the Columbia River Gorge and the Cascade Locks providing access to the Pacific Ocean. The city was also a major center for the timber industry, with several sawmills located in the area.
Geography
Cascade Locks is located in the Columbia River Gorge, a deep canyon carved by the Columbia River. The city is situated on the Oregon side of the river, just east of the Bridge of the Gods, a toll bridge that spans the river and connects Oregon and Washington. The city is surrounded by the Columbia River National Scenic Area, a protected area that encompasses the Columbia River Gorge.
The city has a total area of 1.2 square miles, all of which is land. The city is located at an elevation of 180 feet above sea level. The climate is mild and temperate, with warm summers and cool winters.
Economy
The economy of Cascade Locks is largely based on tourism and recreation. The city is a popular destination for outdoor enthusiasts, with the Columbia River Gorge providing a variety of activities, including fishing, boating, hiking, and camping. The city is also home to several businesses, including restaurants, hotels, and retail stores.
The city is also home to several industries, including timber, manufacturing, and transportation. The timber industry is the largest employer in the city, with several sawmills located in the area. The manufacturing industry is also important to the local economy, with several companies producing a variety of products, including furniture, clothing, and electronics. The transportation industry is also important to the local economy, with the Cascade Locks providing access to the Pacific Ocean.
Demographics
As of the 2010 census, the population of Cascade Locks was 1,144. The population is predominantly white (94.2%), with small percentages of other races, including Hispanic or Latino (2.2%), Asian (1.2%), and African American (0.7%). The median household income is $41,250, and the median age is 44.7 years. The city has a high rate of homeownership (77.2%), and the unemployment rate is 5.2%.
Conclusion
Cascade Locks is a small city located in the Columbia River Gorge in the U.S. state of Oregon. It is situated in Hood River County, and is the only incorporated city in the county. The city is named after a set of locks built in 1896 to bypass the Cascades Rapids of the Columbia River. The city has a long history of Native American habitation, and was first settled by Europeans in the early 1800s. The economy of Cascade Locks is largely based on tourism and recreation, with the timber industry being the largest employer in the city. The population of Cascade Locks is predominantly white, with a median household income of $41,250 and a median age of 44.7 years.
Common Questions
What is Per Capita Income in Cascade Locks?
Per Capita income in Cascade Locks is $39,545.
What is the Median Family Income in Cascade Locks?
Median Family Income in Cascade Locks is $69,318.
What is the Median Household income in Cascade Locks?
Median Household Income in Cascade Locks is $62,195.
What is Income or Wage Gap in Cascade Locks?
Income or Wage Gap in Cascade Locks is 37.3%.
Women in Cascade Locks earn 62.7 cents for every dollar earned by a man.
What is Inequality or Gini Index in Cascade Locks?
Inequality or Gini Index in Cascade Locks is 0.37.
What is the Total Population of Cascade Locks?
Total Population of Cascade Locks is 1,418.
What is the Total Male Population of Cascade Locks?
Total Male Population of Cascade Locks is 713.
What is the Total Female Population of Cascade Locks?
Total Female Population of Cascade Locks is 705.
What is the Ratio of Males per 100 Females in Cascade Locks?
There are 101.13 Males per 100 Females in Cascade Locks.
What is the Ratio of Females per 100 Males in Cascade Locks?
There are 98.88 Females per 100 Males in Cascade Locks.
What is the Median Population Age in Cascade Locks?
Median Population Age in Cascade Locks is 46.9 Years.
What is the Average Family Size in Cascade Locks
Average Family Size in Cascade Locks is 2.7 People.
What is the Average Household Size in Cascade Locks
Average Household Size in Cascade Locks is 2.2 People.
How Large is the Labor Force in Cascade Locks?
There are 786 People in the Labor Forcein in Cascade Locks.
What is the Percentage of People in the Labor Force in Cascade Locks?
64.3% of People are in the Labor Force in Cascade Locks.
What is the Unemployment Rate in Cascade Locks?
Unemployment Rate in Cascade Locks is 3.8%.