Hood River, OR Map & Demographics
Hood River Map
Hood River Overview
$45,642
PER CAPITA INCOME
$97,589
AVG FAMILY INCOME
$70,791
AVG HOUSEHOLD INCOME
14.5%
WAGE / INCOME GAP [ % ]
85.5¢/ $1
WAGE / INCOME GAP [ $ ]
0.48
INEQUALITY / GINI INDEX
8,292
TOTAL POPULATION
4,119
MALE POPULATION
4,173
FEMALE POPULATION
98.71
MALES / 100 FEMALES
101.31
FEMALES / 100 MALES
39.4
MEDIAN AGE
3.0
AVG FAMILY SIZE
2.2
AVG HOUSEHOLD SIZE
4,634
LABOR FORCE [ PEOPLE ]
70.0%
PERCENT IN LABOR FORCE
2.9%
UNEMPLOYMENT RATE
Hood River Zip Codes
Hood River Area Codes
Income in Hood River
Income Overview in Hood River
Per Capita Income in Hood River is $45,642, while median incomes of families and households are $97,589 and $70,791 respectively.
| Characteristic | Number | Measure |
| Per Capita Income | 8,292 | $45,642 |
| Median Family Income | 1,872 | $97,589 |
| Mean Family Income | 1,872 | $125,230 |
| Median Household Income | 3,640 | $70,791 |
| Mean Household Income | 3,640 | $105,399 |
| Income Deficit | 1,872 | $0 |
| Wage / Income Gap (%) | 8,292 | 14.51% |
| Wage / Income Gap ($) | 8,292 | 85.49¢ per $1 |
| Gini / Inequality Index | 8,292 | 0.48 |
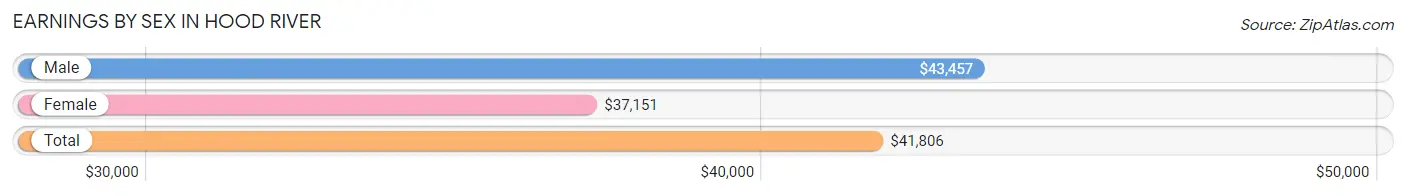
Earnings by Sex in Hood River
Average Earnings in Hood River are $41,806, $43,457 for men and $37,151 for women, a difference of 14.5%.
| Sex | Number | Average Earnings |
| Male | 2,547 (53.3%) | $43,457 |
| Female | 2,229 (46.7%) | $37,151 |
| Total | 4,776 (100.0%) | $41,806 |
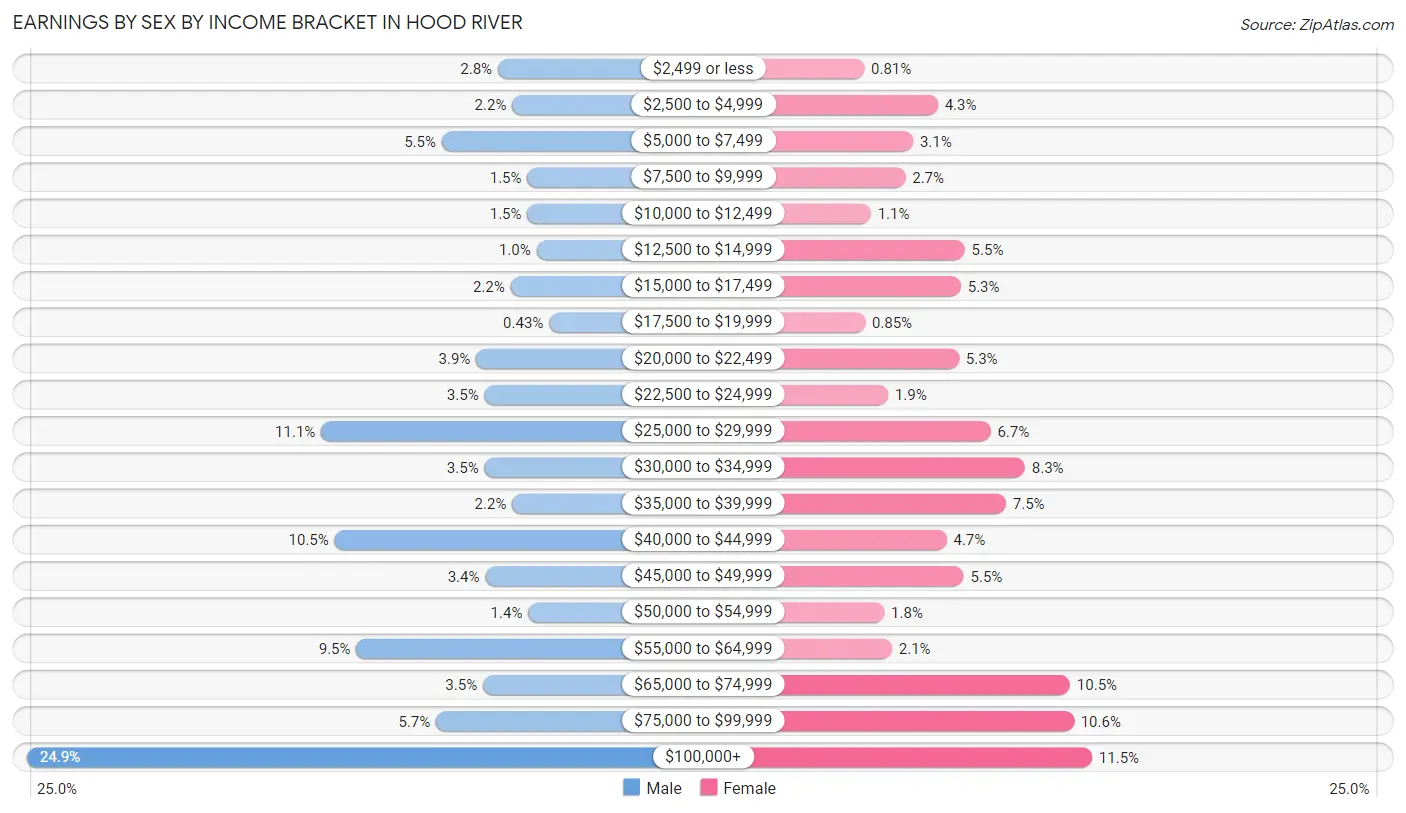
Earnings by Sex by Income Bracket in Hood River
The most common earnings brackets in Hood River are $100,000+ for men (634 | 24.9%) and $100,000+ for women (256 | 11.5%).
| Income | Male | Female |
| $2,499 or less | 72 (2.8%) | 18 (0.8%) |
| $2,500 to $4,999 | 55 (2.2%) | 95 (4.3%) |
| $5,000 to $7,499 | 139 (5.5%) | 69 (3.1%) |
| $7,500 to $9,999 | 37 (1.5%) | 61 (2.7%) |
| $10,000 to $12,499 | 37 (1.5%) | 25 (1.1%) |
| $12,500 to $14,999 | 26 (1.0%) | 123 (5.5%) |
| $15,000 to $17,499 | 57 (2.2%) | 119 (5.3%) |
| $17,500 to $19,999 | 11 (0.4%) | 19 (0.9%) |
| $20,000 to $22,499 | 98 (3.8%) | 117 (5.2%) |
| $22,500 to $24,999 | 88 (3.5%) | 43 (1.9%) |
| $25,000 to $29,999 | 283 (11.1%) | 150 (6.7%) |
| $30,000 to $34,999 | 88 (3.5%) | 186 (8.3%) |
| $35,000 to $39,999 | 55 (2.2%) | 166 (7.4%) |
| $40,000 to $44,999 | 267 (10.5%) | 104 (4.7%) |
| $45,000 to $49,999 | 87 (3.4%) | 122 (5.5%) |
| $50,000 to $54,999 | 36 (1.4%) | 39 (1.8%) |
| $55,000 to $64,999 | 241 (9.5%) | 47 (2.1%) |
| $65,000 to $74,999 | 90 (3.5%) | 233 (10.4%) |
| $75,000 to $99,999 | 146 (5.7%) | 237 (10.6%) |
| $100,000+ | 634 (24.9%) | 256 (11.5%) |
| Total | 2,547 (100.0%) | 2,229 (100.0%) |
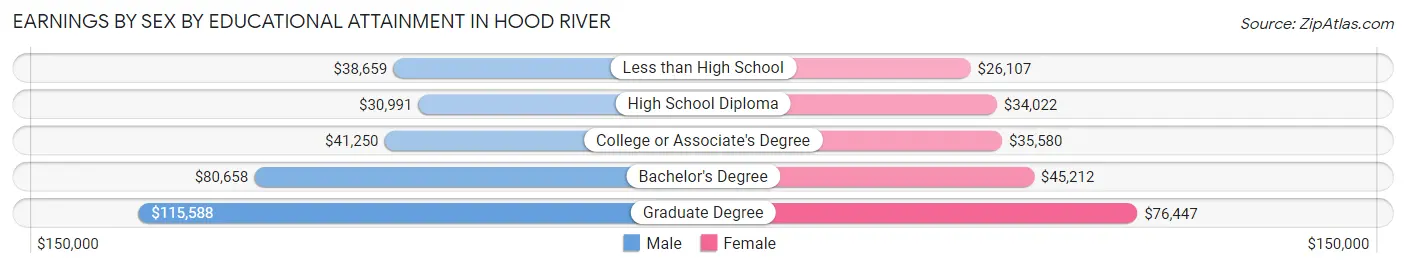
Earnings by Sex by Educational Attainment in Hood River
Average earnings in Hood River are $53,125 for men and $43,176 for women, a difference of 18.7%. Men with an educational attainment of graduate degree enjoy the highest average annual earnings of $115,588, while those with high school diploma education earn the least with $30,991. Women with an educational attainment of graduate degree earn the most with the average annual earnings of $76,447, while those with less than high school education have the smallest earnings of $26,107.
| Educational Attainment | Male Income | Female Income |
| Less than High School | $38,659 | $26,107 |
| High School Diploma | $30,991 | $34,022 |
| College or Associate's Degree | $41,250 | $35,580 |
| Bachelor's Degree | $80,658 | $45,212 |
| Graduate Degree | $115,588 | $76,447 |
| Total | $53,125 | $43,176 |
Family Income in Hood River
Family Income Brackets in Hood River
According to the Hood River family income data, there are 373 families falling into the $100,000 to $149,999 income range, which is the most common income bracket and makes up 19.9% of all families. Conversely, the $10,000 to $14,999 income bracket is the least frequent group with only 7 families (0.4%) belonging to this category.
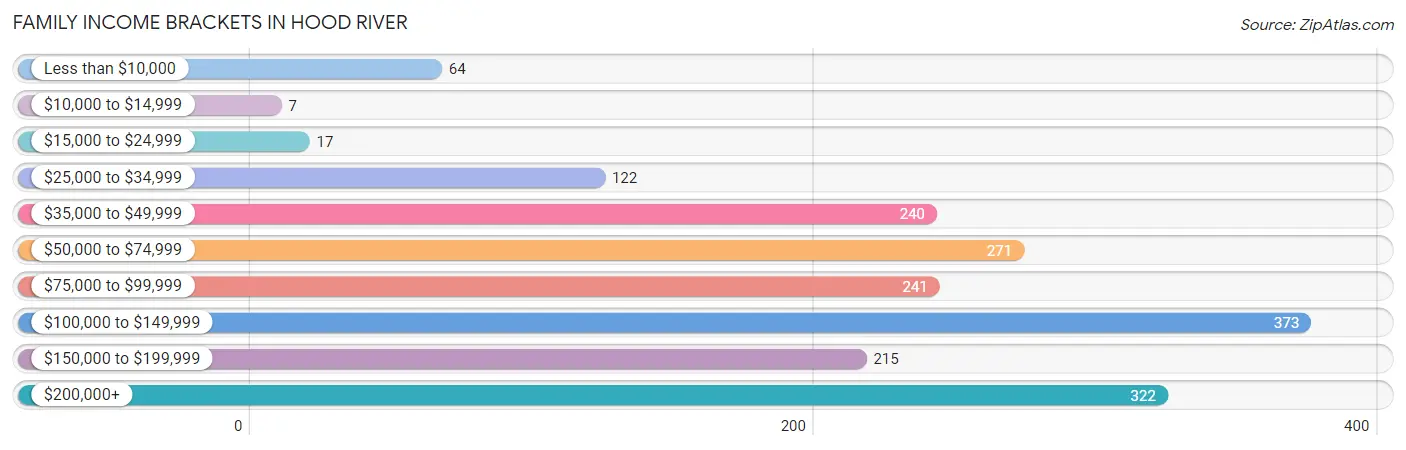
| Income Bracket | # Families | % Families |
| Less than $10,000 | 64 | 3.4% |
| $10,000 to $14,999 | 7 | 0.4% |
| $15,000 to $24,999 | 17 | 0.9% |
| $25,000 to $34,999 | 122 | 6.5% |
| $35,000 to $49,999 | 240 | 12.8% |
| $50,000 to $74,999 | 271 | 14.5% |
| $75,000 to $99,999 | 241 | 12.9% |
| $100,000 to $149,999 | 373 | 19.9% |
| $150,000 to $199,999 | 215 | 11.5% |
| $200,000+ | 322 | 17.2% |
Family Income by Famaliy Size in Hood River
6-person families (37 | 2.0%) account for the highest median family income in Hood River with $161,696 per family, while 3-person families (529 | 28.3%) have the highest median income of $51,250 per family member.
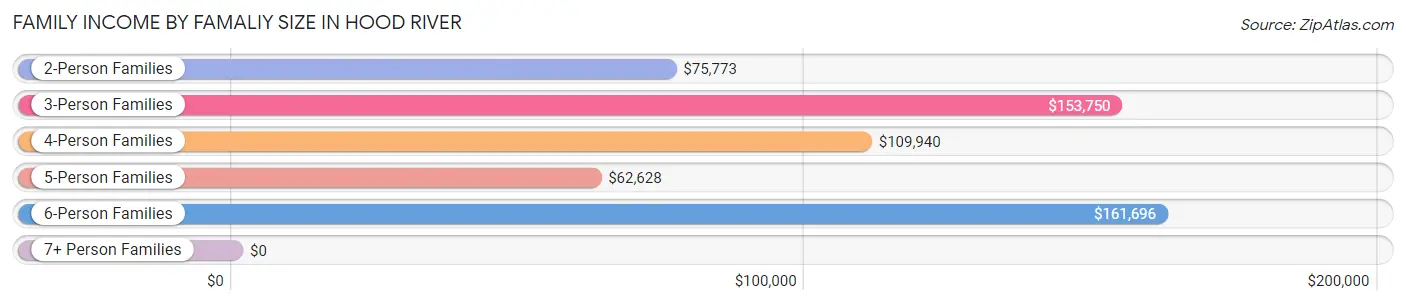
| Income Bracket | # Families | Median Income |
| 2-Person Families | 891 (47.6%) | $75,773 |
| 3-Person Families | 529 (28.3%) | $153,750 |
| 4-Person Families | 301 (16.1%) | $109,940 |
| 5-Person Families | 90 (4.8%) | $62,628 |
| 6-Person Families | 37 (2.0%) | $161,696 |
| 7+ Person Families | 24 (1.3%) | $0 |
| Total | 1,872 (100.0%) | $97,589 |
Family Income by Number of Earners in Hood River
The median family income in Hood River is $97,589, with families comprising 2 earners (945) having the highest median family income of $124,896, while families with 1 earner (588) have the lowest median family income of $60,938, accounting for 50.5% and 31.4% of families, respectively.
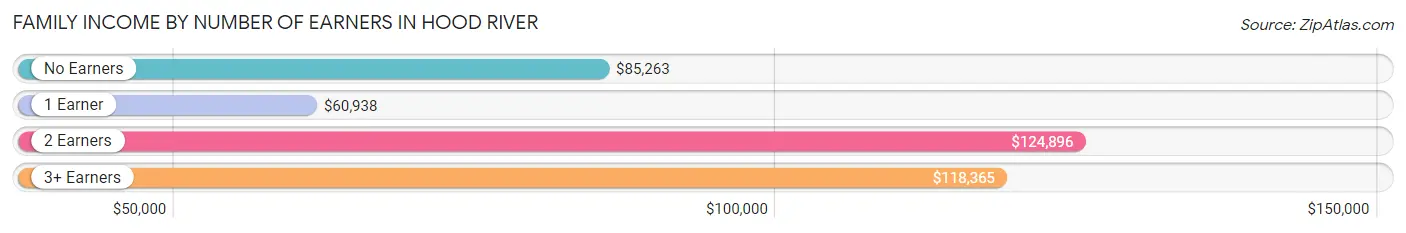
| Number of Earners | # Families | Median Income |
| No Earners | 174 (9.3%) | $85,263 |
| 1 Earner | 588 (31.4%) | $60,938 |
| 2 Earners | 945 (50.5%) | $124,896 |
| 3+ Earners | 165 (8.8%) | $118,365 |
| Total | 1,872 (100.0%) | $97,589 |
Household Income in Hood River
Household Income Brackets in Hood River
With 601 households falling in the category, the $50,000 to $74,999 income range is the most frequent in Hood River, accounting for 16.5% of all households. In contrast, only 120 households (3.3%) fall into the $15,000 to $24,999 income bracket, making it the least populous group.
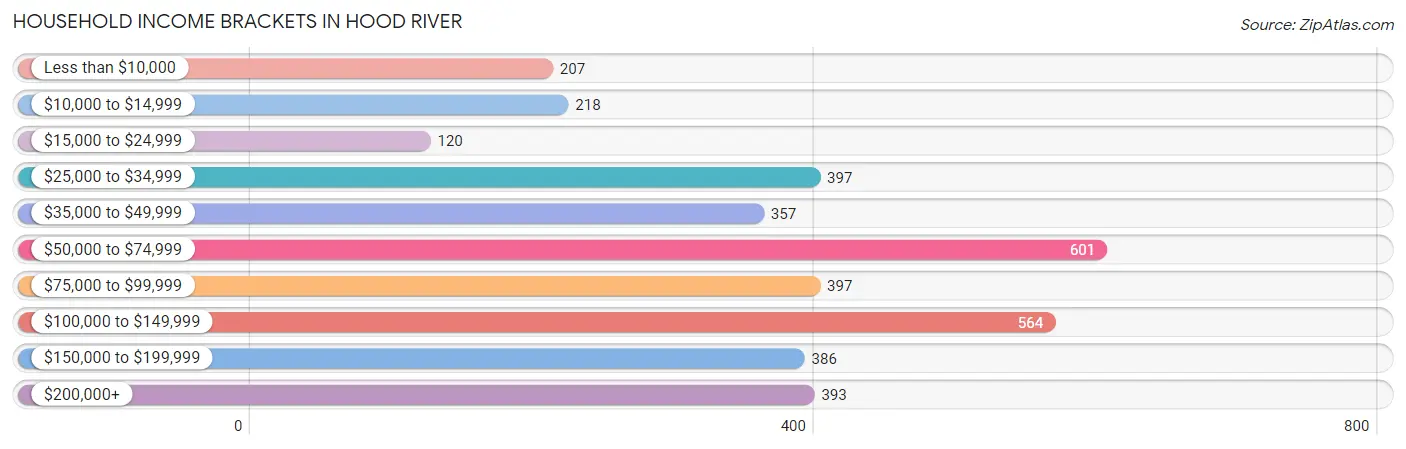
| Income Bracket | # Households | % Households |
| Less than $10,000 | 207 | 5.7% |
| $10,000 to $14,999 | 218 | 6.0% |
| $15,000 to $24,999 | 120 | 3.3% |
| $25,000 to $34,999 | 397 | 10.9% |
| $35,000 to $49,999 | 357 | 9.8% |
| $50,000 to $74,999 | 601 | 16.5% |
| $75,000 to $99,999 | 397 | 10.9% |
| $100,000 to $149,999 | 564 | 15.5% |
| $150,000 to $199,999 | 386 | 10.6% |
| $200,000+ | 393 | 10.8% |
Household Income by Householder Age in Hood River
The median household income in Hood River is $70,791, with the highest median household income of $94,598 found in the 25 to 44 years age bracket for the primary householder. A total of 1,199 households (32.9%) fall into this category. Meanwhile, the 15 to 24 years age bracket for the primary householder has the lowest median household income of $0, with 125 households (3.4%) in this group.
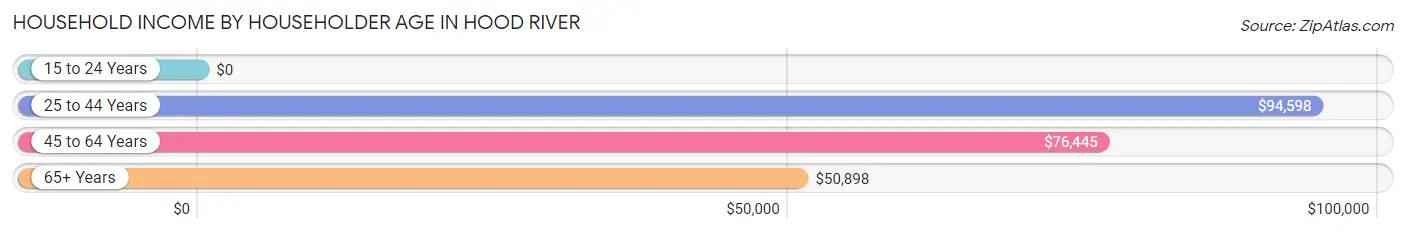
| Income Bracket | # Households | Median Income |
| 15 to 24 Years | 125 (3.4%) | $0 |
| 25 to 44 Years | 1,199 (32.9%) | $94,598 |
| 45 to 64 Years | 1,573 (43.2%) | $76,445 |
| 65+ Years | 743 (20.4%) | $50,898 |
| Total | 3,640 (100.0%) | $70,791 |
Poverty in Hood River
Income Below Poverty by Sex and Age in Hood River
With 8.2% poverty level for males and 11.2% for females among the residents of Hood River, 15 year old males and 75 year old and over females are the most vulnerable to poverty, with 19 males (42.2%) and 92 females (25.6%) in their respective age groups living below the poverty level.
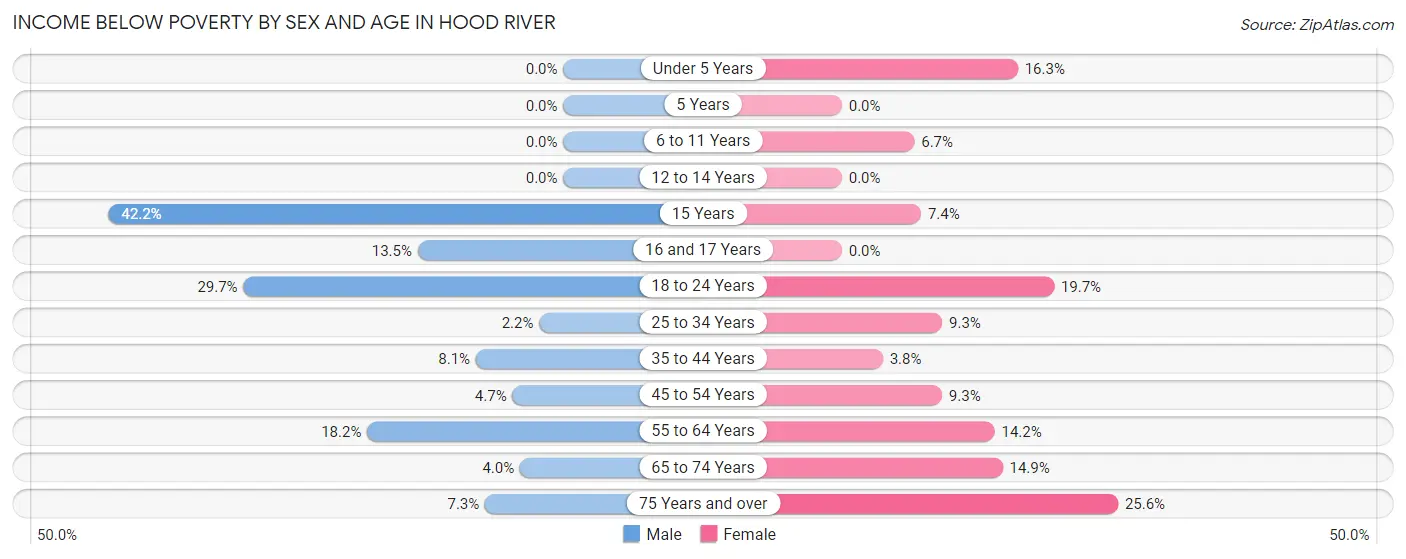
| Age Bracket | Male | Female |
| Under 5 Years | 0 (0.0%) | 49 (16.3%) |
| 5 Years | 0 (0.0%) | 0 (0.0%) |
| 6 to 11 Years | 0 (0.0%) | 23 (6.7%) |
| 12 to 14 Years | 0 (0.0%) | 0 (0.0%) |
| 15 Years | 19 (42.2%) | 5 (7.3%) |
| 16 and 17 Years | 15 (13.5%) | 0 (0.0%) |
| 18 to 24 Years | 87 (29.7%) | 50 (19.7%) |
| 25 to 34 Years | 18 (2.2%) | 46 (9.3%) |
| 35 to 44 Years | 42 (8.1%) | 21 (3.8%) |
| 45 to 54 Years | 32 (4.7%) | 60 (9.3%) |
| 55 to 64 Years | 97 (18.2%) | 79 (14.2%) |
| 65 to 74 Years | 9 (4.0%) | 37 (14.9%) |
| 75 Years and over | 17 (7.3%) | 92 (25.6%) |
| Total | 336 (8.2%) | 462 (11.2%) |
Income Above Poverty by Sex and Age in Hood River
According to the poverty statistics in Hood River, males aged under 5 years and females aged 5 years are the age groups that are most secure financially, with 100.0% of males and 100.0% of females in these age groups living above the poverty line.
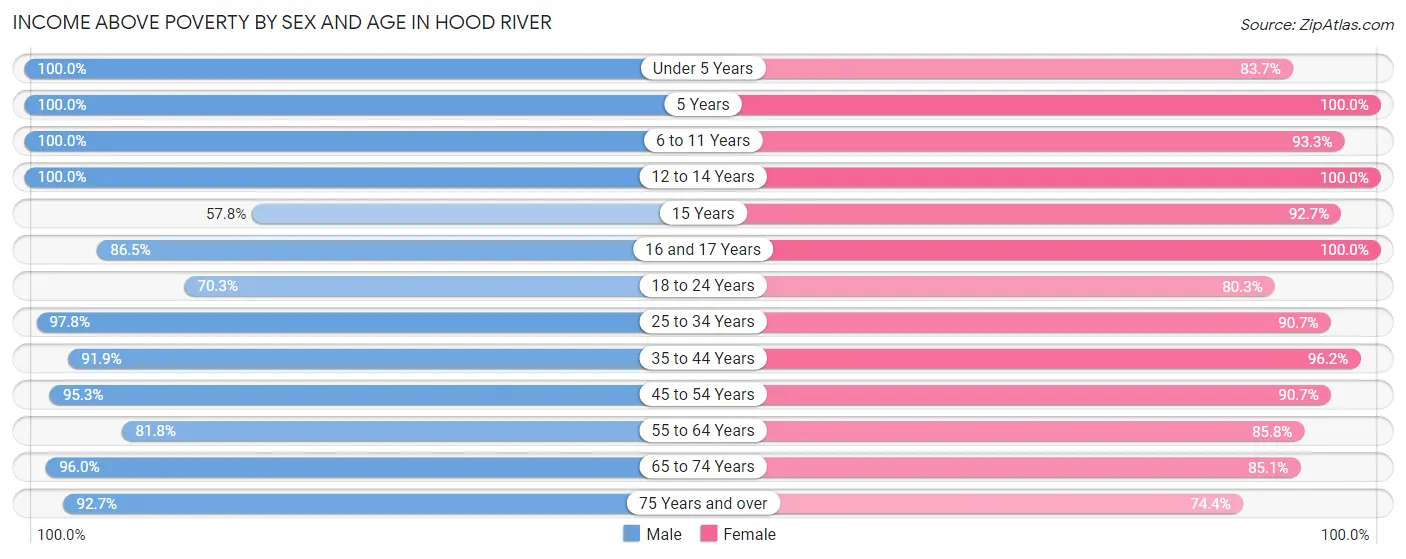
| Age Bracket | Male | Female |
| Under 5 Years | 211 (100.0%) | 251 (83.7%) |
| 5 Years | 34 (100.0%) | 81 (100.0%) |
| 6 to 11 Years | 366 (100.0%) | 319 (93.3%) |
| 12 to 14 Years | 51 (100.0%) | 167 (100.0%) |
| 15 Years | 26 (57.8%) | 63 (92.6%) |
| 16 and 17 Years | 96 (86.5%) | 60 (100.0%) |
| 18 to 24 Years | 206 (70.3%) | 204 (80.3%) |
| 25 to 34 Years | 789 (97.8%) | 448 (90.7%) |
| 35 to 44 Years | 476 (91.9%) | 532 (96.2%) |
| 45 to 54 Years | 646 (95.3%) | 586 (90.7%) |
| 55 to 64 Years | 436 (81.8%) | 478 (85.8%) |
| 65 to 74 Years | 215 (96.0%) | 211 (85.1%) |
| 75 Years and over | 217 (92.7%) | 267 (74.4%) |
| Total | 3,769 (91.8%) | 3,667 (88.8%) |
Income Below Poverty Among Married-Couple Families in Hood River
The poverty statistics for married-couple families in Hood River show that 1.9% or 24 of the total 1,230 families live below the poverty line. Families with 1 or 2 children have the highest poverty rate of 5.2%, comprising of 24 families. On the other hand, families with no children have the lowest poverty rate of 0.0%, which includes 0 families.
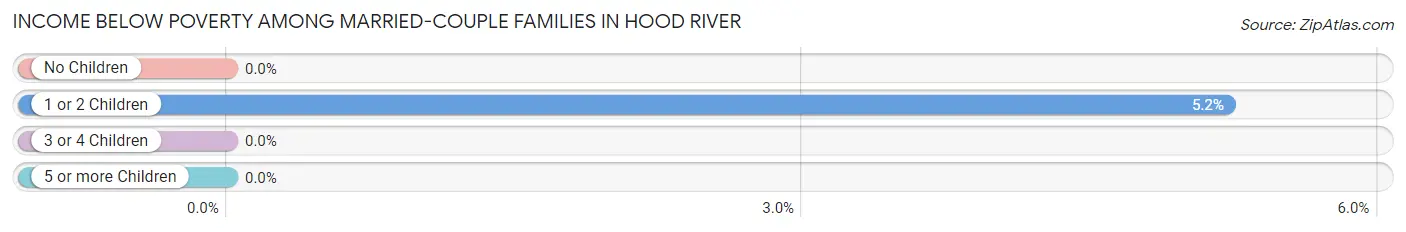
| Children | Above Poverty | Below Poverty |
| No Children | 663 (100.0%) | 0 (0.0%) |
| 1 or 2 Children | 437 (94.8%) | 24 (5.2%) |
| 3 or 4 Children | 106 (100.0%) | 0 (0.0%) |
| 5 or more Children | 0 (0.0%) | 0 (0.0%) |
| Total | 1,206 (98.1%) | 24 (1.9%) |
Income Below Poverty Among Single-Parent Households in Hood River
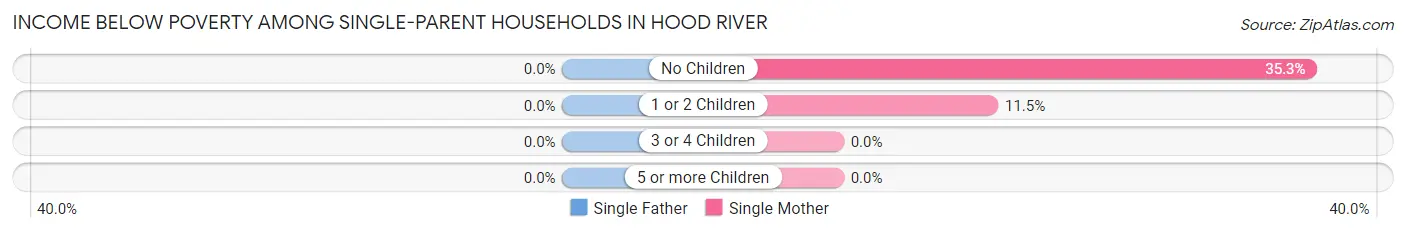
| Children | Single Father | Single Mother |
| No Children | 0 (0.0%) | 18 (35.3%) |
| 1 or 2 Children | 0 (0.0%) | 46 (11.5%) |
| 3 or 4 Children | 0 (0.0%) | 0 (0.0%) |
| 5 or more Children | 0 (0.0%) | 0 (0.0%) |
| Total | 0 (0.0%) | 64 (14.2%) |
Income Below Poverty Among Married-Couple vs Single-Parent Households in Hood River
The poverty data for Hood River shows that 24 of the married-couple family households (1.9%) and 64 of the single-parent households (10.0%) are living below the poverty level. Within the married-couple family households, those with 1 or 2 children have the highest poverty rate, with 24 households (5.2%) falling below the poverty line. Among the single-parent households, those with no children have the highest poverty rate, with 18 household (14.9%) living below poverty.
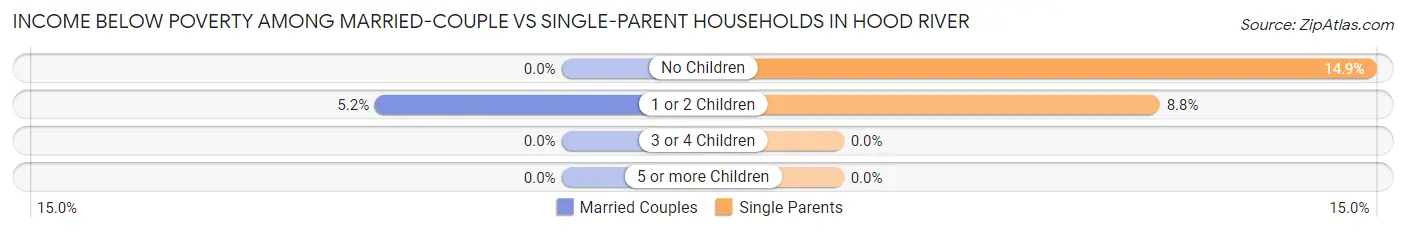
| Children | Married-Couple Families | Single-Parent Households |
| No Children | 0 (0.0%) | 18 (14.9%) |
| 1 or 2 Children | 24 (5.2%) | 46 (8.8%) |
| 3 or 4 Children | 0 (0.0%) | 0 (0.0%) |
| 5 or more Children | 0 (0.0%) | 0 (0.0%) |
| Total | 24 (1.9%) | 64 (10.0%) |
Race in Hood River
The most populous races in Hood River are White / Caucasian (6,551 | 79.0%), Hispanic or Latino (2,006 | 24.2%), and Two or more Races (1,023 | 12.3%).
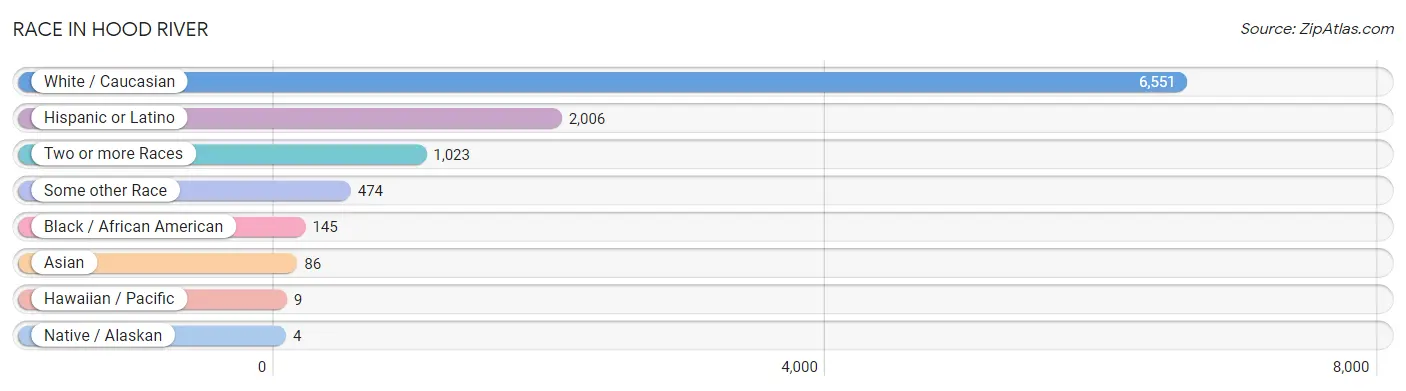
| Race | # Population | % Population |
| Asian | 86 | 1.0% |
| Black / African American | 145 | 1.8% |
| Hawaiian / Pacific | 9 | 0.1% |
| Hispanic or Latino | 2,006 | 24.2% |
| Native / Alaskan | 4 | 0.1% |
| White / Caucasian | 6,551 | 79.0% |
| Two or more Races | 1,023 | 12.3% |
| Some other Race | 474 | 5.7% |
| Total | 8,292 | 100.0% |
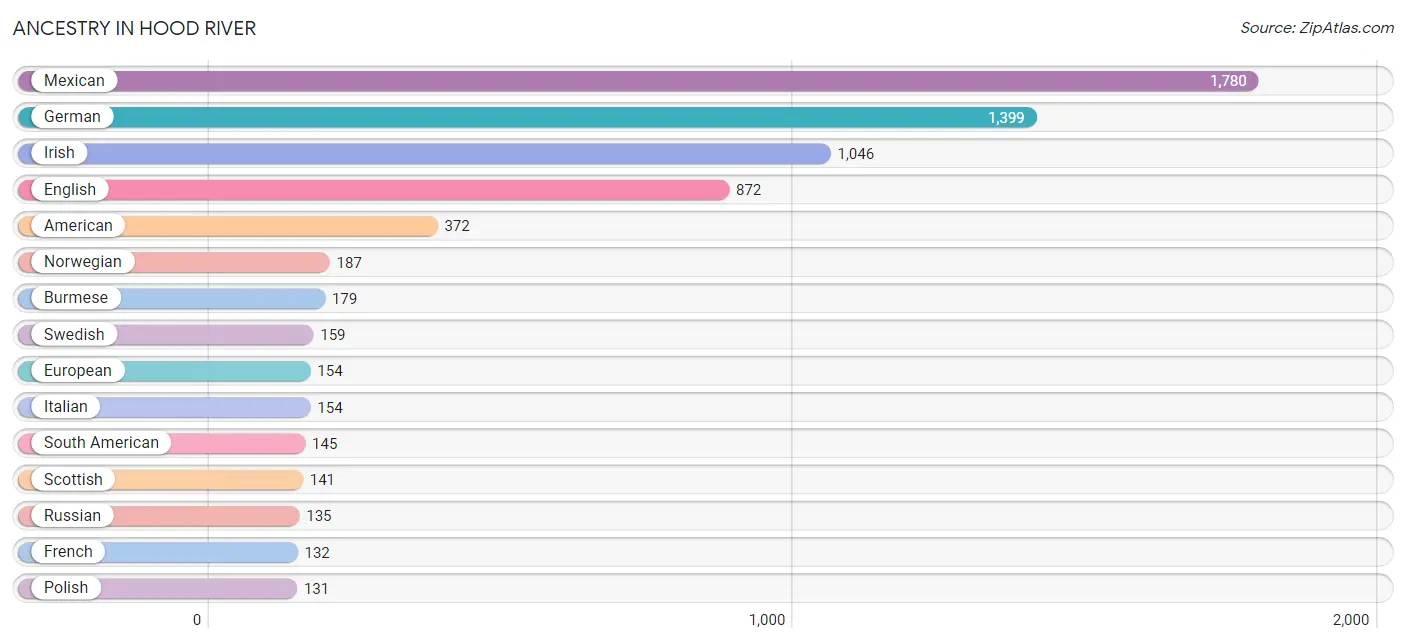
Ancestry in Hood River
The most populous ancestries reported in Hood River are Mexican (1,780 | 21.5%), German (1,399 | 16.9%), Irish (1,046 | 12.6%), English (872 | 10.5%), and American (372 | 4.5%), together accounting for 66.0% of all Hood River residents.
| Ancestry | # Population | % Population |
| American | 372 | 4.5% |
| Arab | 10 | 0.1% |
| Austrian | 128 | 1.5% |
| Basque | 25 | 0.3% |
| Bolivian | 13 | 0.2% |
| Brazilian | 26 | 0.3% |
| British | 92 | 1.1% |
| Burmese | 179 | 2.2% |
| Cajun | 22 | 0.3% |
| Canadian | 6 | 0.1% |
| Central American | 55 | 0.7% |
| Central American Indian | 9 | 0.1% |
| Cherokee | 82 | 1.0% |
| Chilean | 10 | 0.1% |
| Colombian | 45 | 0.5% |
| Czech | 62 | 0.7% |
| Danish | 54 | 0.6% |
| Eastern European | 30 | 0.4% |
| English | 872 | 10.5% |
| European | 154 | 1.9% |
| Finnish | 4 | 0.1% |
| French | 132 | 1.6% |
| French Canadian | 23 | 0.3% |
| German | 1,399 | 16.9% |
| Greek | 25 | 0.3% |
| Guatemalan | 14 | 0.2% |
| Icelander | 14 | 0.2% |
| Indian (Asian) | 28 | 0.3% |
| Irish | 1,046 | 12.6% |
| Italian | 154 | 1.9% |
| Korean | 38 | 0.5% |
| Lithuanian | 49 | 0.6% |
| Mexican | 1,780 | 21.5% |
| Mexican American Indian | 15 | 0.2% |
| Native Hawaiian | 9 | 0.1% |
| Northern European | 91 | 1.1% |
| Norwegian | 187 | 2.3% |
| Peruvian | 30 | 0.4% |
| Polish | 131 | 1.6% |
| Puerto Rican | 4 | 0.1% |
| Romanian | 44 | 0.5% |
| Russian | 135 | 1.6% |
| Salvadoran | 41 | 0.5% |
| Scotch-Irish | 16 | 0.2% |
| Scottish | 141 | 1.7% |
| Sioux | 21 | 0.3% |
| Slovene | 40 | 0.5% |
| South American | 145 | 1.8% |
| Spanish | 22 | 0.3% |
| Swedish | 159 | 1.9% |
| Swiss | 5 | 0.1% |
| Thai | 20 | 0.2% |
| Ukrainian | 21 | 0.3% |
| Venezuelan | 47 | 0.6% |
| Welsh | 70 | 0.8% | View All 55 Rows |
Immigrants in Hood River
The most numerous immigrant groups reported in Hood River came from Latin America (776 | 9.4%), Central America (725 | 8.7%), Mexico (711 | 8.6%), Europe (62 | 0.7%), and South America (51 | 0.6%), together accounting for 28.0% of all Hood River residents.
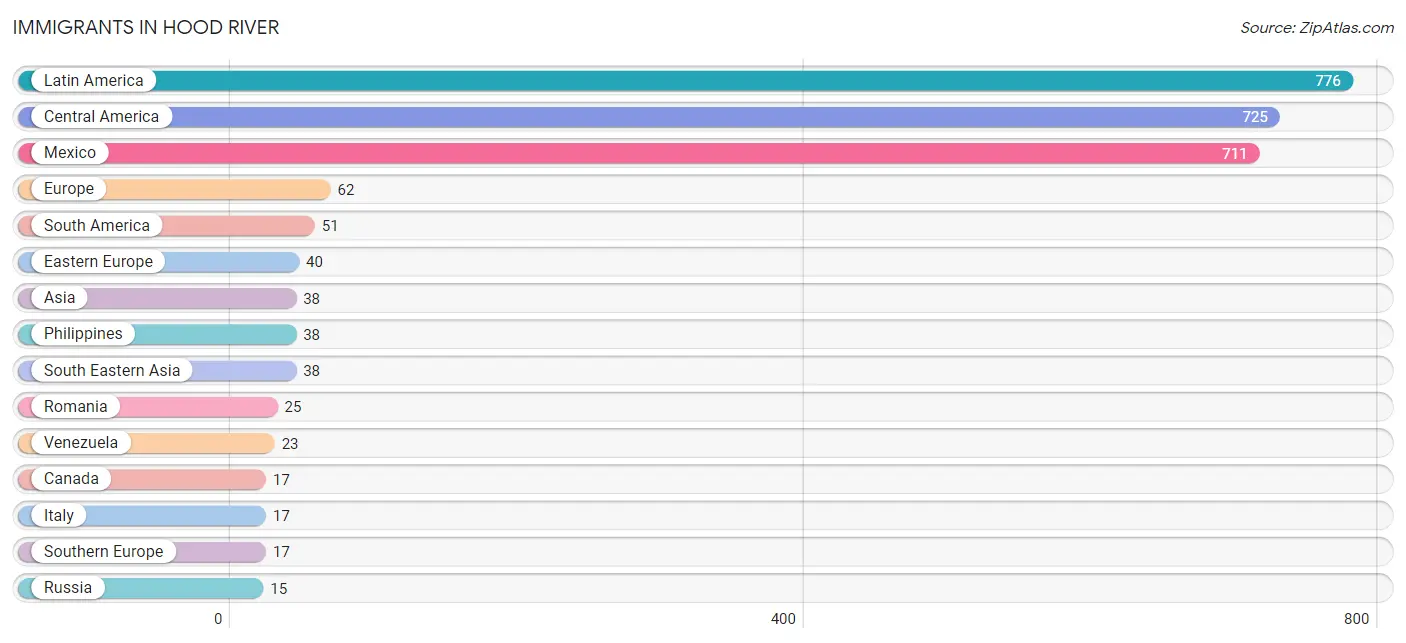
| Immigration Origin | # Population | % Population |
| Asia | 38 | 0.5% |
| Bolivia | 13 | 0.2% |
| Canada | 17 | 0.2% |
| Central America | 725 | 8.7% |
| Chile | 10 | 0.1% |
| Eastern Europe | 40 | 0.5% |
| Europe | 62 | 0.7% |
| Germany | 5 | 0.1% |
| Guatemala | 14 | 0.2% |
| Italy | 17 | 0.2% |
| Latin America | 776 | 9.4% |
| Mexico | 711 | 8.6% |
| Peru | 5 | 0.1% |
| Philippines | 38 | 0.5% |
| Romania | 25 | 0.3% |
| Russia | 15 | 0.2% |
| South America | 51 | 0.6% |
| South Eastern Asia | 38 | 0.5% |
| Southern Europe | 17 | 0.2% |
| Venezuela | 23 | 0.3% |
| Western Europe | 5 | 0.1% | View All 21 Rows |
Sex and Age in Hood River
Sex and Age in Hood River
The most populous age groups in Hood River are 25 to 29 Years (469 | 11.4%) for men and 50 to 54 Years (363 | 8.7%) for women.
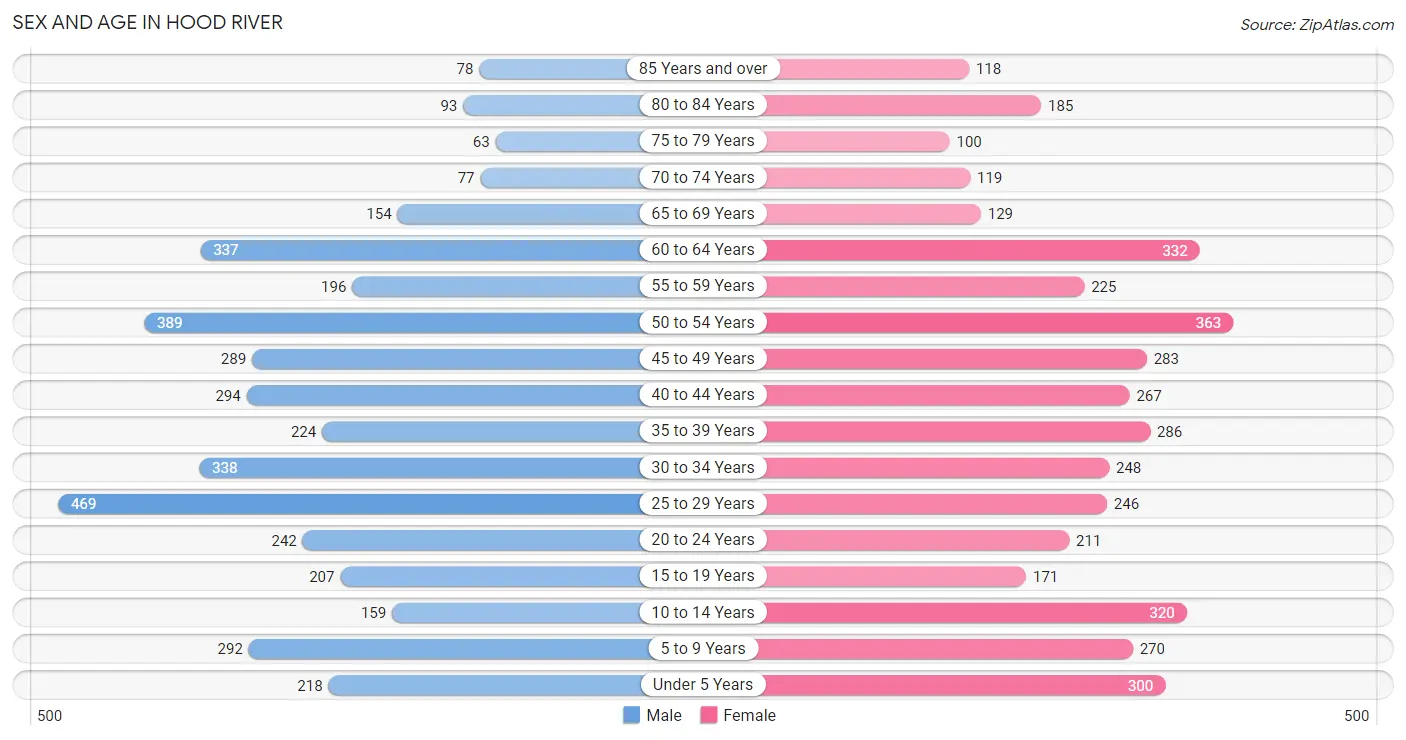
| Age Bracket | Male | Female |
| Under 5 Years | 218 (5.3%) | 300 (7.2%) |
| 5 to 9 Years | 292 (7.1%) | 270 (6.5%) |
| 10 to 14 Years | 159 (3.9%) | 320 (7.7%) |
| 15 to 19 Years | 207 (5.0%) | 171 (4.1%) |
| 20 to 24 Years | 242 (5.9%) | 211 (5.1%) |
| 25 to 29 Years | 469 (11.4%) | 246 (5.9%) |
| 30 to 34 Years | 338 (8.2%) | 248 (5.9%) |
| 35 to 39 Years | 224 (5.4%) | 286 (6.9%) |
| 40 to 44 Years | 294 (7.1%) | 267 (6.4%) |
| 45 to 49 Years | 289 (7.0%) | 283 (6.8%) |
| 50 to 54 Years | 389 (9.4%) | 363 (8.7%) |
| 55 to 59 Years | 196 (4.8%) | 225 (5.4%) |
| 60 to 64 Years | 337 (8.2%) | 332 (8.0%) |
| 65 to 69 Years | 154 (3.7%) | 129 (3.1%) |
| 70 to 74 Years | 77 (1.9%) | 119 (2.9%) |
| 75 to 79 Years | 63 (1.5%) | 100 (2.4%) |
| 80 to 84 Years | 93 (2.3%) | 185 (4.4%) |
| 85 Years and over | 78 (1.9%) | 118 (2.8%) |
| Total | 4,119 (100.0%) | 4,173 (100.0%) |
Families and Households in Hood River
Median Family Size in Hood River
The median family size in Hood River is 2.97 persons per family, with married-couple families (1,230 | 65.7%) accounting for the largest median family size of 3.16 persons per family. On the other hand, single male/father families (191 | 10.2%) represent the smallest median family size with 2.42 persons per family.
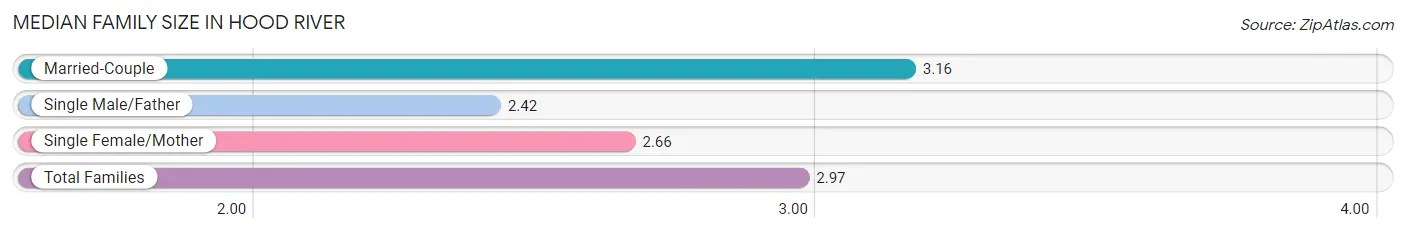
| Family Type | # Families | Family Size |
| Married-Couple | 1,230 (65.7%) | 3.16 |
| Single Male/Father | 191 (10.2%) | 2.42 |
| Single Female/Mother | 451 (24.1%) | 2.66 |
| Total Families | 1,872 (100.0%) | 2.97 |
Median Household Size in Hood River
The median household size in Hood River is 2.24 persons per household, with married-couple households (1,230 | 33.8%) accounting for the largest median household size of 3.25 persons per household. non-family households (1,768 | 48.6%) represent the smallest median household size with 1.29 persons per household.
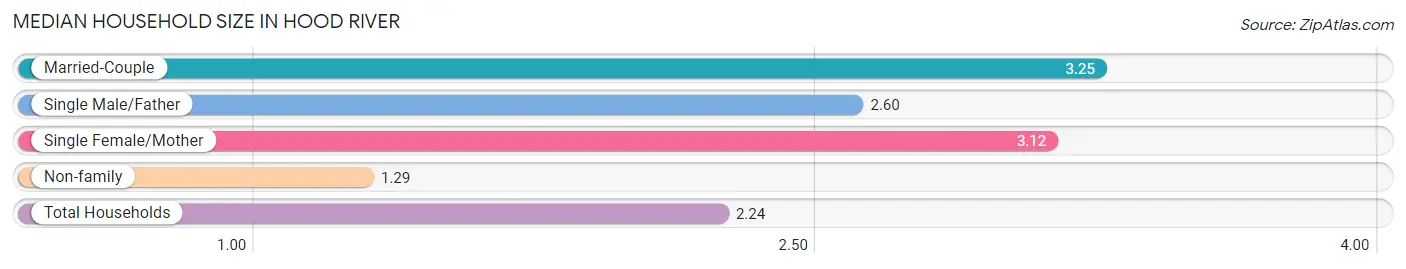
| Household Type | # Households | Household Size |
| Married-Couple | 1,230 (33.8%) | 3.25 |
| Single Male/Father | 191 (5.2%) | 2.60 |
| Single Female/Mother | 451 (12.4%) | 3.12 |
| Non-family | 1,768 (48.6%) | 1.29 |
| Total Households | 3,640 (100.0%) | 2.24 |
Household Size by Marriage Status in Hood River
Out of a total of 3,640 households in Hood River, 1,872 (51.4%) are family households, while 1,768 (48.6%) are nonfamily households. The most numerous type of family households are 2-person households, comprising 774, and the most common type of nonfamily households are 1-person households, comprising 1,357.
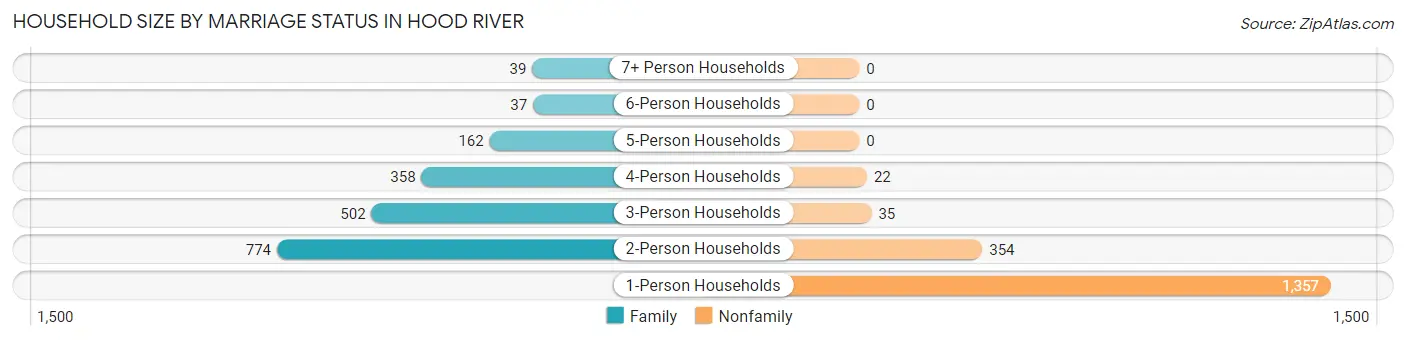
| Household Size | Family Households | Nonfamily Households |
| 1-Person Households | - | 1,357 (37.3%) |
| 2-Person Households | 774 (21.3%) | 354 (9.7%) |
| 3-Person Households | 502 (13.8%) | 35 (1.0%) |
| 4-Person Households | 358 (9.8%) | 22 (0.6%) |
| 5-Person Households | 162 (4.4%) | 0 (0.0%) |
| 6-Person Households | 37 (1.0%) | 0 (0.0%) |
| 7+ Person Households | 39 (1.1%) | 0 (0.0%) |
| Total | 1,872 (51.4%) | 1,768 (48.6%) |
Female Fertility in Hood River
Fertility by Age in Hood River
Average fertility rate in Hood River is 67.0 births per 1,000 women. Women in the age bracket of 20 to 34 years have the highest fertility rate with 135.0 births per 1,000 women. Women in the age bracket of 20 to 34 years acount for 79.8% of all women with births.
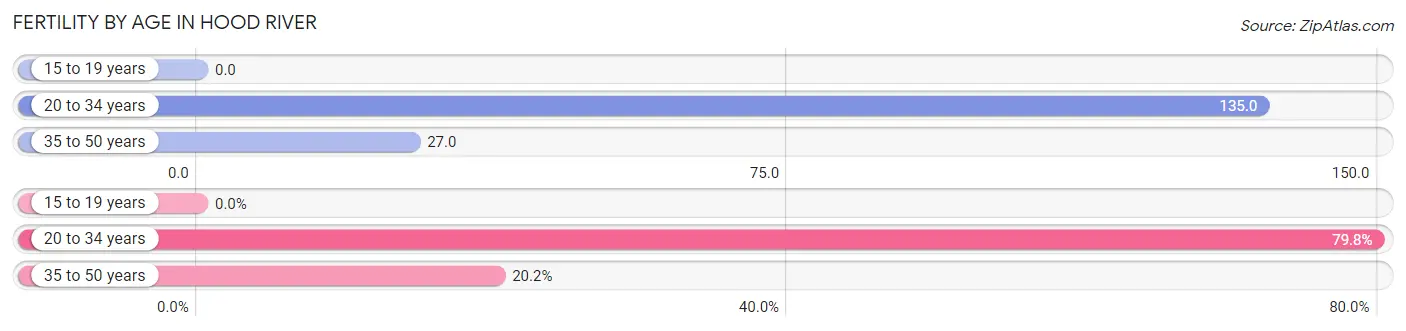
| Age Bracket | Women with Births | Births / 1,000 Women |
| 15 to 19 years | 0 (0.0%) | 0.0 |
| 20 to 34 years | 95 (79.8%) | 135.0 |
| 35 to 50 years | 24 (20.2%) | 27.0 |
| Total | 119 (100.0%) | 67.0 |
Fertility by Age by Marriage Status in Hood River
77.3% of women with births (119) in Hood River are married. The highest percentage of unmarried women with births falls into 20 to 34 years age bracket with 28.4% of them unmarried at the time of birth, while the lowest percentage of unmarried women with births belong to 35 to 50 years age bracket with 0.0% of them unmarried.
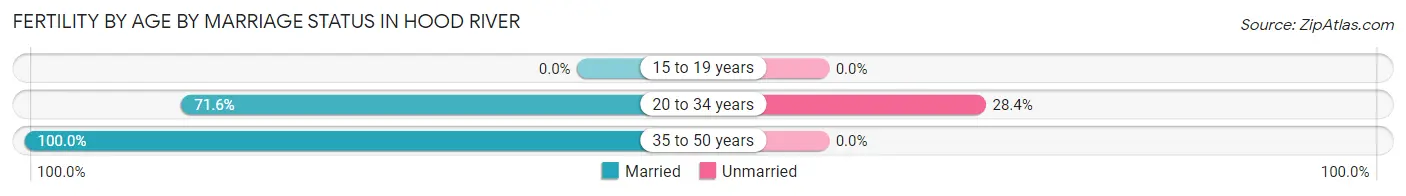
| Age Bracket | Married | Unmarried |
| 15 to 19 years | 0 (0.0%) | 0 (0.0%) |
| 20 to 34 years | 68 (71.6%) | 27 (28.4%) |
| 35 to 50 years | 24 (100.0%) | 0 (0.0%) |
| Total | 92 (77.3%) | 27 (22.7%) |
Fertility by Education in Hood River
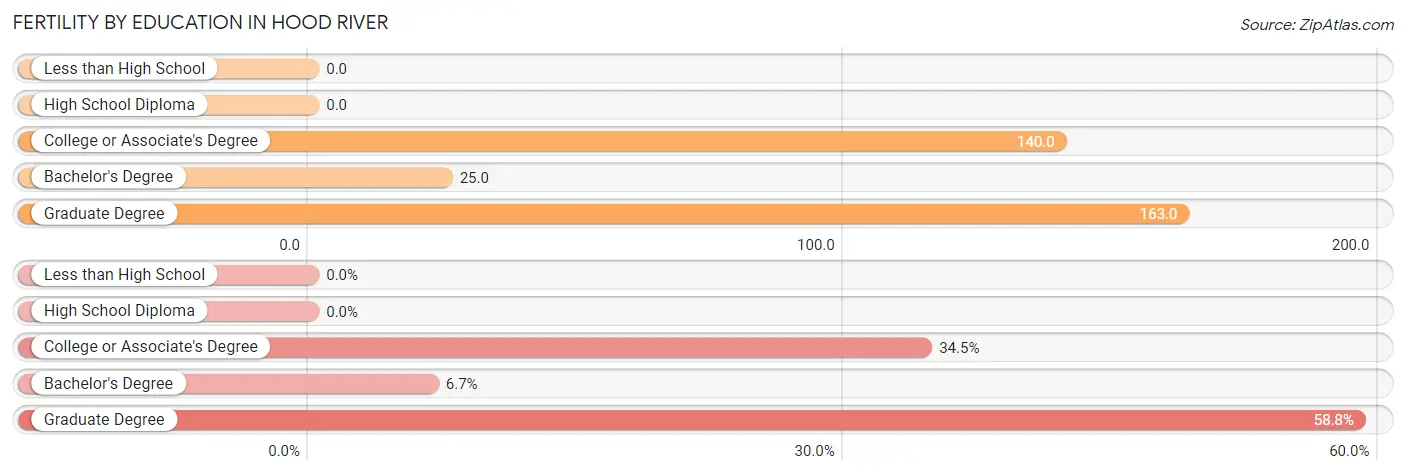
| Educational Attainment | Women with Births | Births / 1,000 Women |
| Less than High School | 0 (0.0%) | 0.0 |
| High School Diploma | 0 (0.0%) | 0.0 |
| College or Associate's Degree | 41 (34.4%) | 140.0 |
| Bachelor's Degree | 8 (6.7%) | 25.0 |
| Graduate Degree | 70 (58.8%) | 163.0 |
| Total | 119 (100.0%) | 67.0 |
Fertility by Education by Marriage Status in Hood River
22.7% of women with births in Hood River are unmarried. Women with the educational attainment of bachelor's degree are most likely to be married with 100.0% of them married at childbirth, while women with the educational attainment of college or associate's degree are least likely to be married with 65.8% of them unmarried at childbirth.
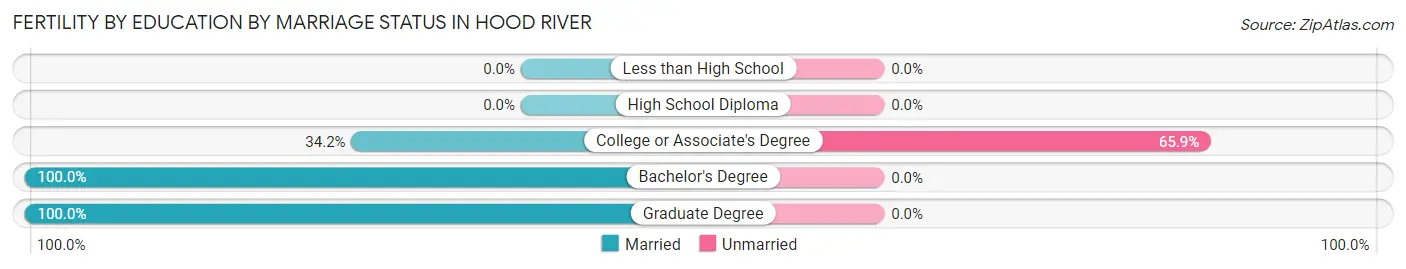
| Educational Attainment | Married | Unmarried |
| Less than High School | 0 (0.0%) | 0 (0.0%) |
| High School Diploma | 0 (0.0%) | 0 (0.0%) |
| College or Associate's Degree | 14 (34.2%) | 27 (65.8%) |
| Bachelor's Degree | 8 (100.0%) | 0 (0.0%) |
| Graduate Degree | 70 (100.0%) | 0 (0.0%) |
| Total | 92 (77.3%) | 27 (22.7%) |
Employment Characteristics in Hood River
Employment by Class of Employer in Hood River
Among the 4,395 employed individuals in Hood River, private company employees (2,885 | 65.6%), not-for-profit organizations (537 | 12.2%), and self-employed (incorporated) (320 | 7.3%) make up the most common classes of employment.
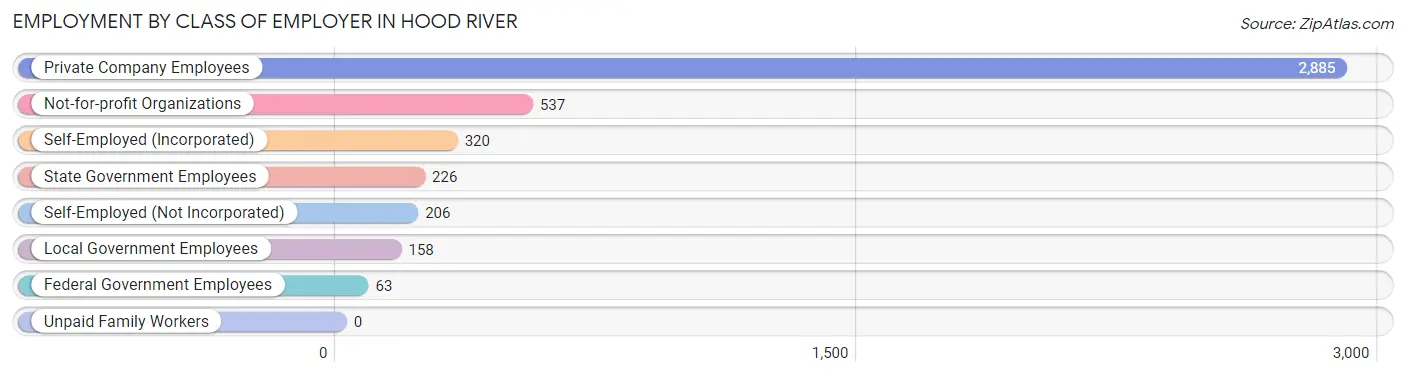
| Employer Class | # Employees | % Employees |
| Private Company Employees | 2,885 | 65.6% |
| Self-Employed (Incorporated) | 320 | 7.3% |
| Self-Employed (Not Incorporated) | 206 | 4.7% |
| Not-for-profit Organizations | 537 | 12.2% |
| Local Government Employees | 158 | 3.6% |
| State Government Employees | 226 | 5.1% |
| Federal Government Employees | 63 | 1.4% |
| Unpaid Family Workers | 0 | 0.0% |
| Total | 4,395 | 100.0% |
Employment Status by Age in Hood River
According to the labor force statistics for Hood River, out of the total population over 16 years of age (6,620), 70.0% or 4,634 individuals are in the labor force, with 2.9% or 134 of them unemployed. The age group with the highest labor force participation rate is 30 to 34 years, with 99.7% or 584 individuals in the labor force. Within the labor force, the 60 to 64 years age range has the highest percentage of unemployed individuals, with 11.4% or 36 of them being unemployed.
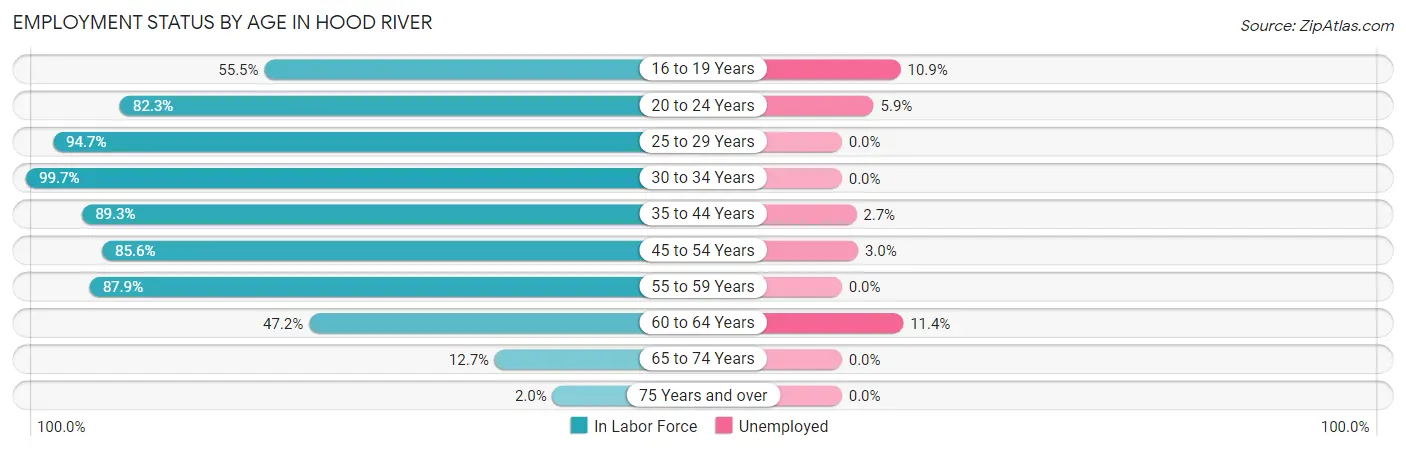
| Age Bracket | In Labor Force | Unemployed |
| 16 to 19 Years | 147 (55.5%) | 16 (10.9%) |
| 20 to 24 Years | 373 (82.3%) | 22 (5.9%) |
| 25 to 29 Years | 677 (94.7%) | 0 (0.0%) |
| 30 to 34 Years | 584 (99.7%) | 0 (0.0%) |
| 35 to 44 Years | 956 (89.3%) | 26 (2.7%) |
| 45 to 54 Years | 1,133 (85.6%) | 34 (3.0%) |
| 55 to 59 Years | 370 (87.9%) | 0 (0.0%) |
| 60 to 64 Years | 316 (47.2%) | 36 (11.4%) |
| 65 to 74 Years | 61 (12.7%) | 0 (0.0%) |
| 75 Years and over | 13 (2.0%) | 0 (0.0%) |
| Total | 4,634 (70.0%) | 134 (2.9%) |
Employment Status by Educational Attainment in Hood River
According to labor force statistics for Hood River, 84.4% of individuals (4,039) out of the total population between 25 and 64 years of age (4,786) are in the labor force, with 2.4% or 97 of them being unemployed. The group with the highest labor force participation rate are those with the educational attainment of bachelor's degree or higher, with 87.6% or 1,896 individuals in the labor force. Within the labor force, individuals with less than high school education have the highest percentage of unemployment, with 13.5% or 79 of them being unemployed.
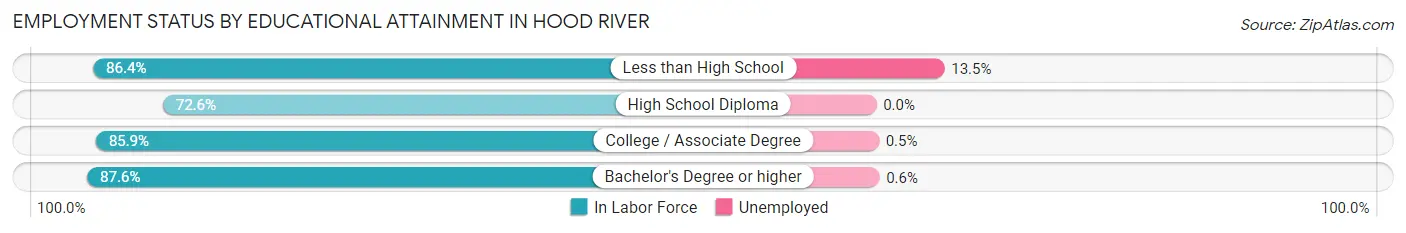
| Educational Attainment | In Labor Force | Unemployed |
| Less than High School | 584 (86.4%) | 91 (13.5%) |
| High School Diploma | 629 (72.6%) | 0 (0.0%) |
| College / Associate Degree | 928 (85.9%) | 5 (0.5%) |
| Bachelor's Degree or higher | 1,896 (87.6%) | 13 (0.6%) |
| Total | 4,039 (84.4%) | 115 (2.4%) |
Employment Occupations by Sex in Hood River
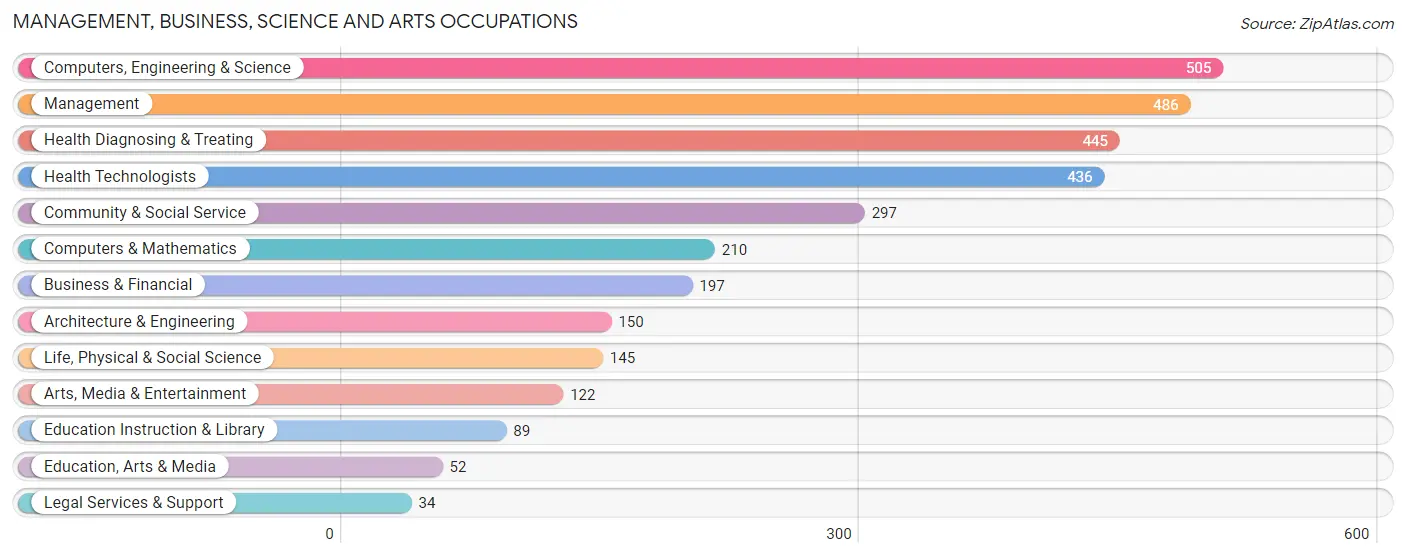
Management, Business, Science and Arts Occupations
The most common Management, Business, Science and Arts occupations in Hood River are Computers, Engineering & Science (505 | 11.2%), Management (486 | 10.8%), Health Diagnosing & Treating (445 | 9.9%), Health Technologists (436 | 9.7%), and Community & Social Service (297 | 6.6%).
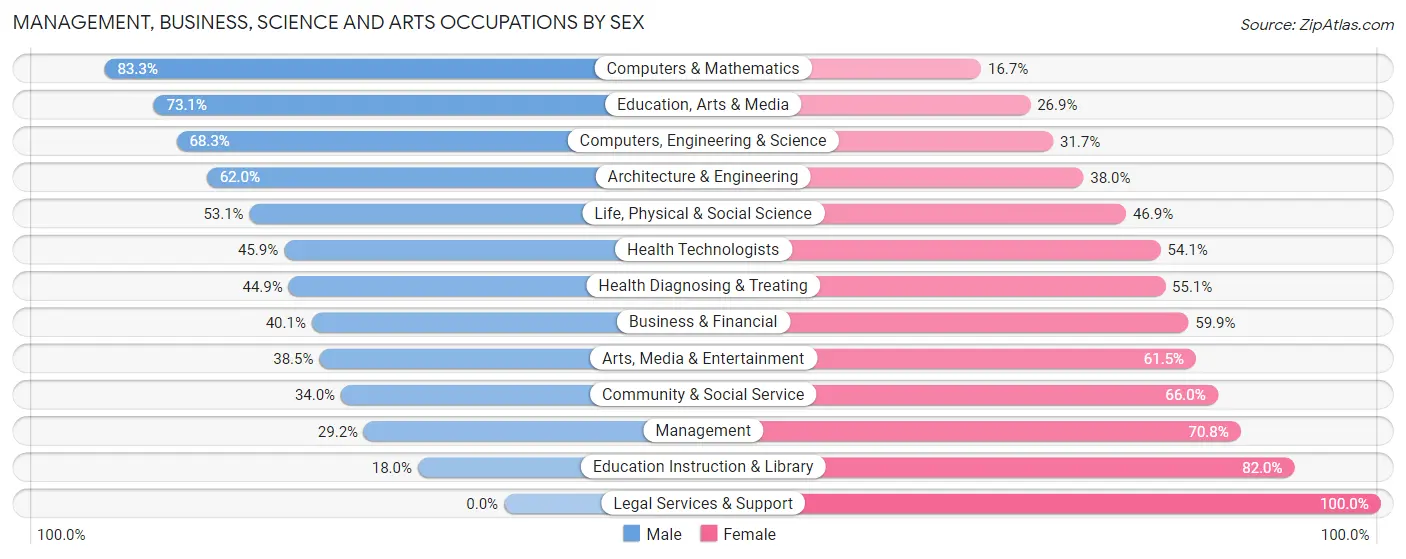
Management, Business, Science and Arts Occupations by Sex
Within the Management, Business, Science and Arts occupations in Hood River, the most male-oriented occupations are Computers & Mathematics (83.3%), Education, Arts & Media (73.1%), and Computers, Engineering & Science (68.3%), while the most female-oriented occupations are Legal Services & Support (100.0%), Education Instruction & Library (82.0%), and Management (70.8%).
| Occupation | Male | Female |
| Management | 142 (29.2%) | 344 (70.8%) |
| Business & Financial | 79 (40.1%) | 118 (59.9%) |
| Computers, Engineering & Science | 345 (68.3%) | 160 (31.7%) |
| Computers & Mathematics | 175 (83.3%) | 35 (16.7%) |
| Architecture & Engineering | 93 (62.0%) | 57 (38.0%) |
| Life, Physical & Social Science | 77 (53.1%) | 68 (46.9%) |
| Community & Social Service | 101 (34.0%) | 196 (66.0%) |
| Education, Arts & Media | 38 (73.1%) | 14 (26.9%) |
| Legal Services & Support | 0 (0.0%) | 34 (100.0%) |
| Education Instruction & Library | 16 (18.0%) | 73 (82.0%) |
| Arts, Media & Entertainment | 47 (38.5%) | 75 (61.5%) |
| Health Diagnosing & Treating | 200 (44.9%) | 245 (55.1%) |
| Health Technologists | 200 (45.9%) | 236 (54.1%) |
| Total (Category) | 867 (44.9%) | 1,063 (55.1%) |
| Total (Overall) | 2,372 (52.7%) | 2,125 (47.2%) |
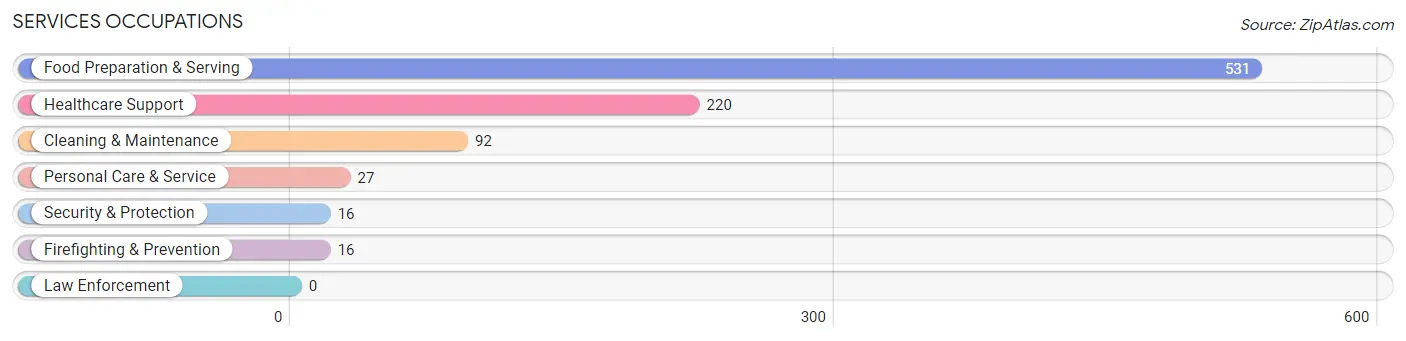
Services Occupations
The most common Services occupations in Hood River are Food Preparation & Serving (531 | 11.8%), Healthcare Support (220 | 4.9%), Cleaning & Maintenance (92 | 2.1%), Personal Care & Service (27 | 0.6%), and Security & Protection (16 | 0.4%).
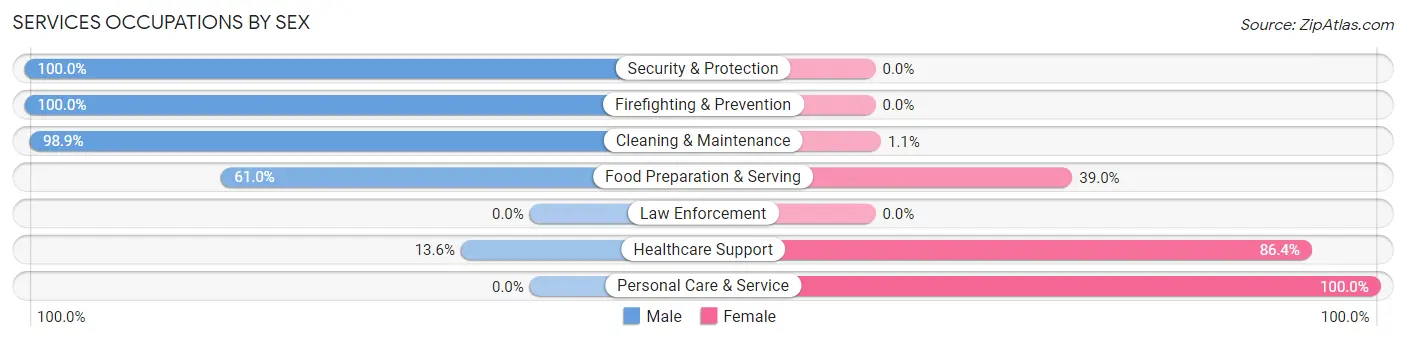
Services Occupations by Sex
Within the Services occupations in Hood River, the most male-oriented occupations are Security & Protection (100.0%), Firefighting & Prevention (100.0%), and Cleaning & Maintenance (98.9%), while the most female-oriented occupations are Personal Care & Service (100.0%), Healthcare Support (86.4%), and Food Preparation & Serving (39.0%).
| Occupation | Male | Female |
| Healthcare Support | 30 (13.6%) | 190 (86.4%) |
| Security & Protection | 16 (100.0%) | 0 (0.0%) |
| Firefighting & Prevention | 16 (100.0%) | 0 (0.0%) |
| Law Enforcement | 0 (0.0%) | 0 (0.0%) |
| Food Preparation & Serving | 324 (61.0%) | 207 (39.0%) |
| Cleaning & Maintenance | 91 (98.9%) | 1 (1.1%) |
| Personal Care & Service | 0 (0.0%) | 27 (100.0%) |
| Total (Category) | 461 (52.0%) | 425 (48.0%) |
| Total (Overall) | 2,372 (52.7%) | 2,125 (47.2%) |
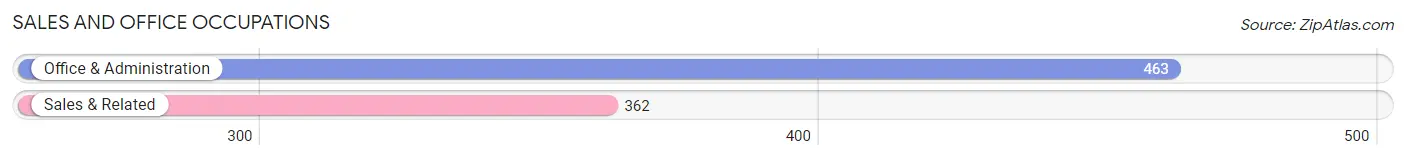
Sales and Office Occupations
The most common Sales and Office occupations in Hood River are Office & Administration (463 | 10.3%), and Sales & Related (362 | 8.1%).
Sales and Office Occupations by Sex
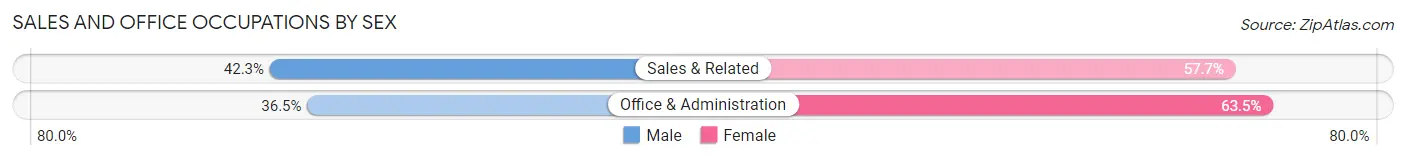
| Occupation | Male | Female |
| Sales & Related | 153 (42.3%) | 209 (57.7%) |
| Office & Administration | 169 (36.5%) | 294 (63.5%) |
| Total (Category) | 322 (39.0%) | 503 (61.0%) |
| Total (Overall) | 2,372 (52.7%) | 2,125 (47.2%) |
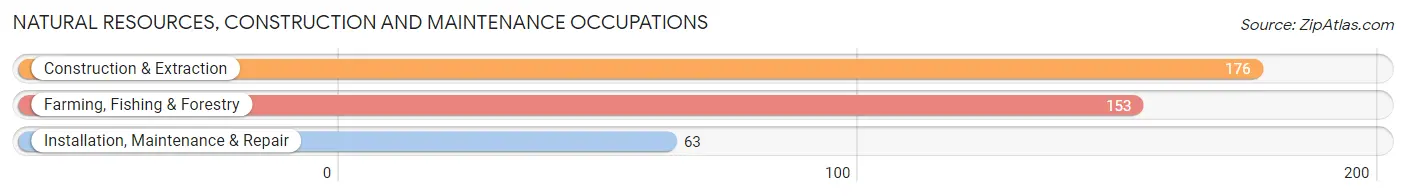
Natural Resources, Construction and Maintenance Occupations
The most common Natural Resources, Construction and Maintenance occupations in Hood River are Construction & Extraction (176 | 3.9%), Farming, Fishing & Forestry (153 | 3.4%), and Installation, Maintenance & Repair (63 | 1.4%).
Natural Resources, Construction and Maintenance Occupations by Sex
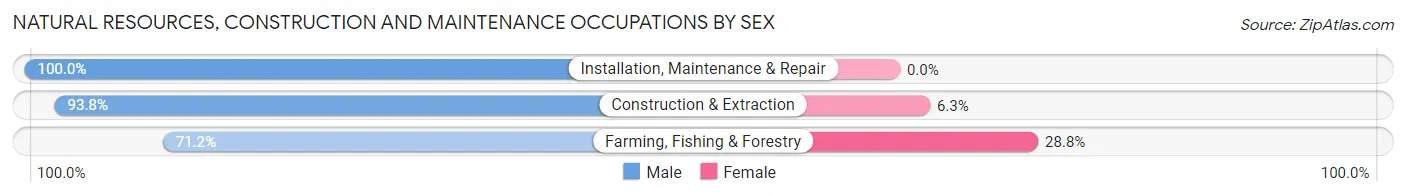
| Occupation | Male | Female |
| Farming, Fishing & Forestry | 109 (71.2%) | 44 (28.8%) |
| Construction & Extraction | 165 (93.8%) | 11 (6.2%) |
| Installation, Maintenance & Repair | 63 (100.0%) | 0 (0.0%) |
| Total (Category) | 337 (86.0%) | 55 (14.0%) |
| Total (Overall) | 2,372 (52.7%) | 2,125 (47.2%) |
Production, Transportation and Moving Occupations
The most common Production, Transportation and Moving occupations in Hood River are Transportation (169 | 3.8%), Production (160 | 3.6%), and Material Moving (135 | 3.0%).
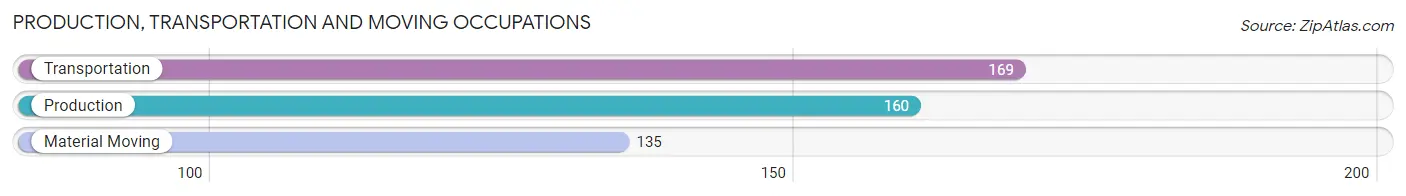
Production, Transportation and Moving Occupations by Sex
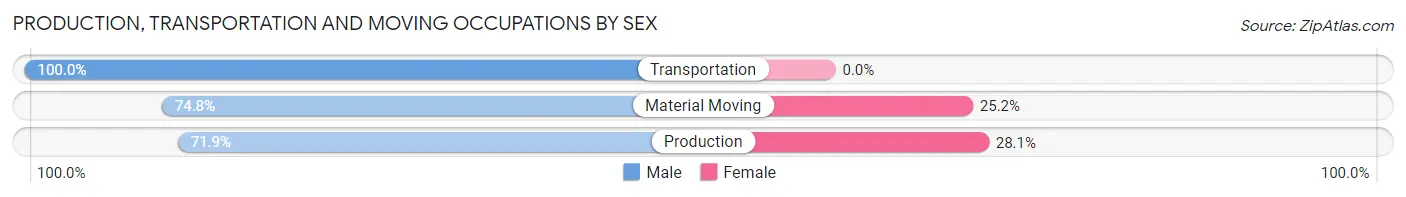
| Occupation | Male | Female |
| Production | 115 (71.9%) | 45 (28.1%) |
| Transportation | 169 (100.0%) | 0 (0.0%) |
| Material Moving | 101 (74.8%) | 34 (25.2%) |
| Total (Category) | 385 (83.0%) | 79 (17.0%) |
| Total (Overall) | 2,372 (52.7%) | 2,125 (47.2%) |
Employment Industries by Sex in Hood River
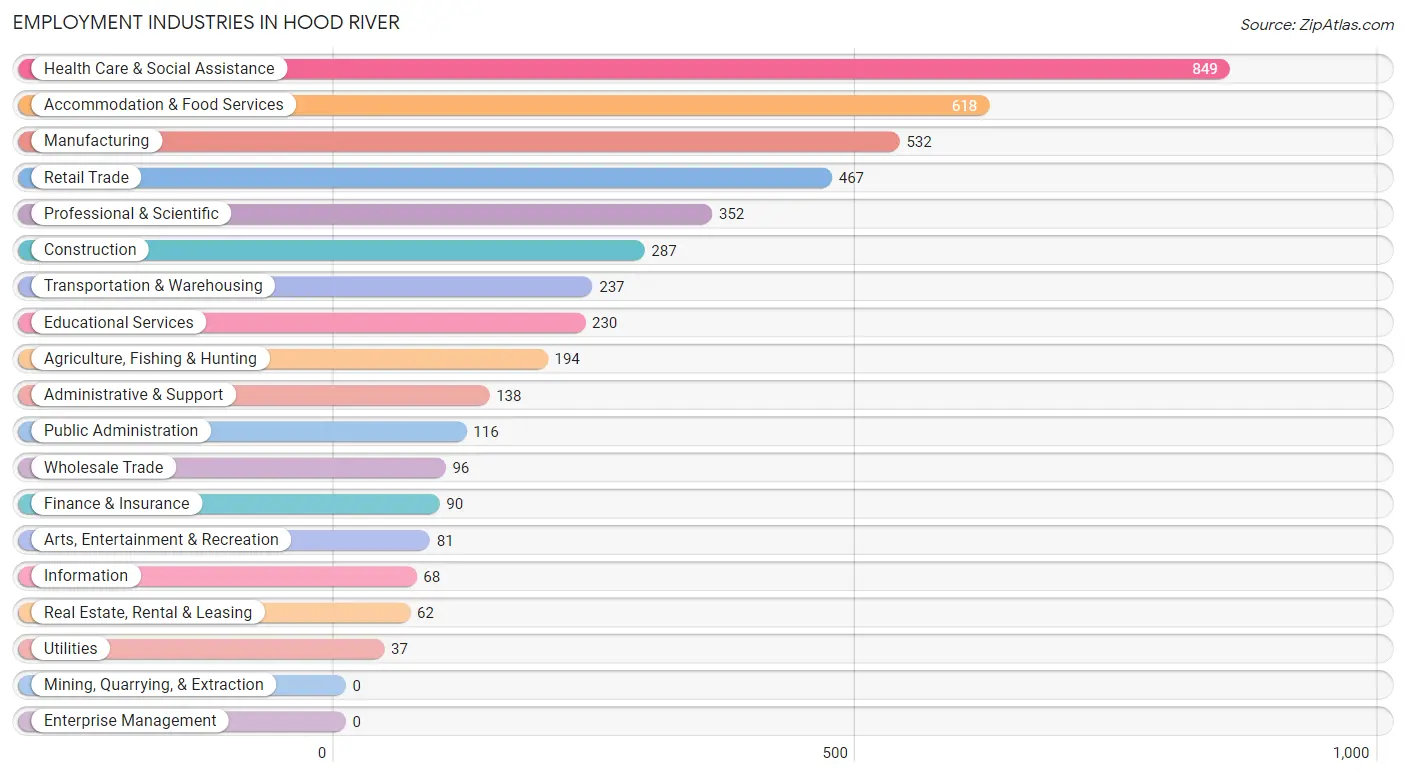
Employment Industries in Hood River
The major employment industries in Hood River include Health Care & Social Assistance (849 | 18.9%), Accommodation & Food Services (618 | 13.7%), Manufacturing (532 | 11.8%), Retail Trade (467 | 10.4%), and Professional & Scientific (352 | 7.8%).
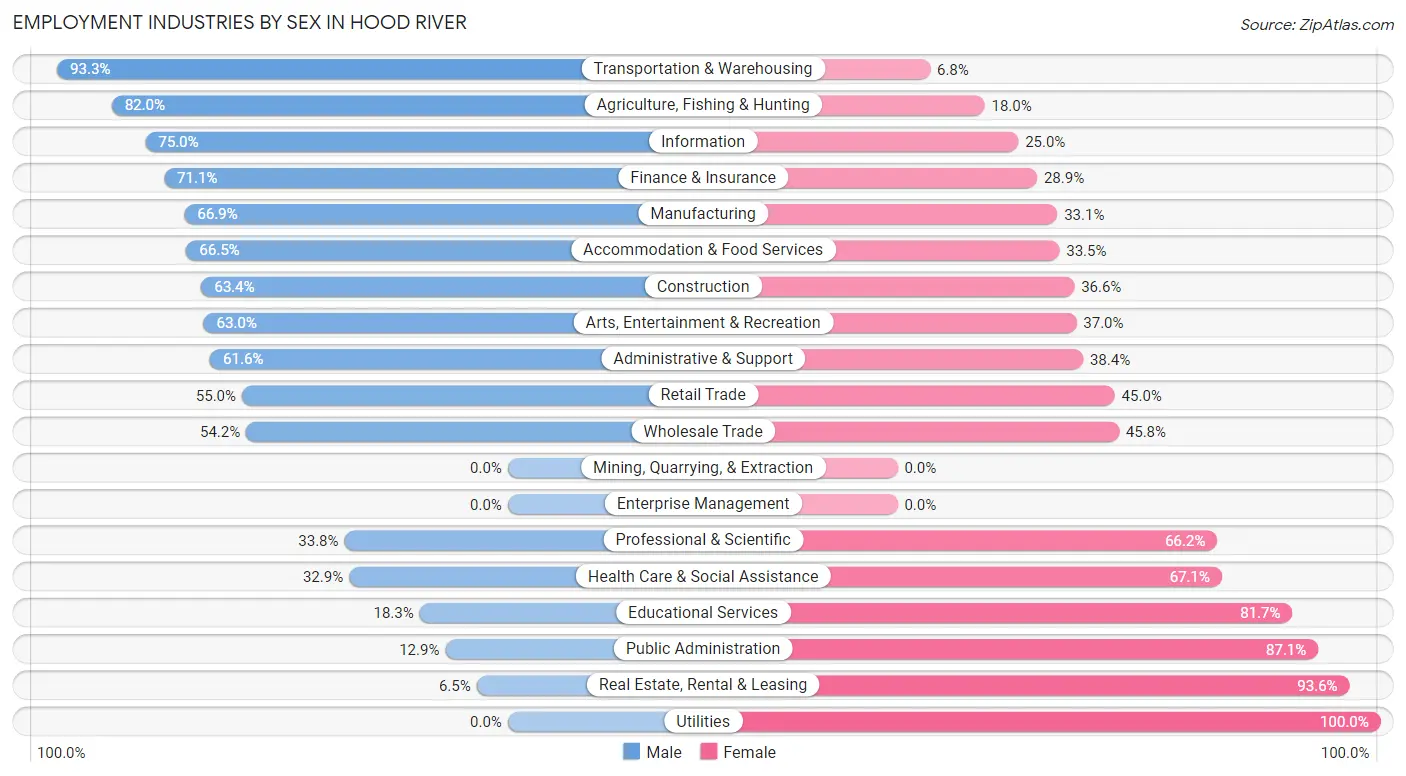
Employment Industries by Sex in Hood River
The Hood River industries that see more men than women are Transportation & Warehousing (93.2%), Agriculture, Fishing & Hunting (82.0%), and Information (75.0%), whereas the industries that tend to have a higher number of women are Utilities (100.0%), Real Estate, Rental & Leasing (93.5%), and Public Administration (87.1%).
| Industry | Male | Female |
| Agriculture, Fishing & Hunting | 159 (82.0%) | 35 (18.0%) |
| Mining, Quarrying, & Extraction | 0 (0.0%) | 0 (0.0%) |
| Construction | 182 (63.4%) | 105 (36.6%) |
| Manufacturing | 356 (66.9%) | 176 (33.1%) |
| Wholesale Trade | 52 (54.2%) | 44 (45.8%) |
| Retail Trade | 257 (55.0%) | 210 (45.0%) |
| Transportation & Warehousing | 221 (93.2%) | 16 (6.8%) |
| Utilities | 0 (0.0%) | 37 (100.0%) |
| Information | 51 (75.0%) | 17 (25.0%) |
| Finance & Insurance | 64 (71.1%) | 26 (28.9%) |
| Real Estate, Rental & Leasing | 4 (6.5%) | 58 (93.5%) |
| Professional & Scientific | 119 (33.8%) | 233 (66.2%) |
| Enterprise Management | 0 (0.0%) | 0 (0.0%) |
| Administrative & Support | 85 (61.6%) | 53 (38.4%) |
| Educational Services | 42 (18.3%) | 188 (81.7%) |
| Health Care & Social Assistance | 279 (32.9%) | 570 (67.1%) |
| Arts, Entertainment & Recreation | 51 (63.0%) | 30 (37.0%) |
| Accommodation & Food Services | 411 (66.5%) | 207 (33.5%) |
| Public Administration | 15 (12.9%) | 101 (87.1%) |
| Total | 2,372 (52.7%) | 2,125 (47.2%) |
Education in Hood River
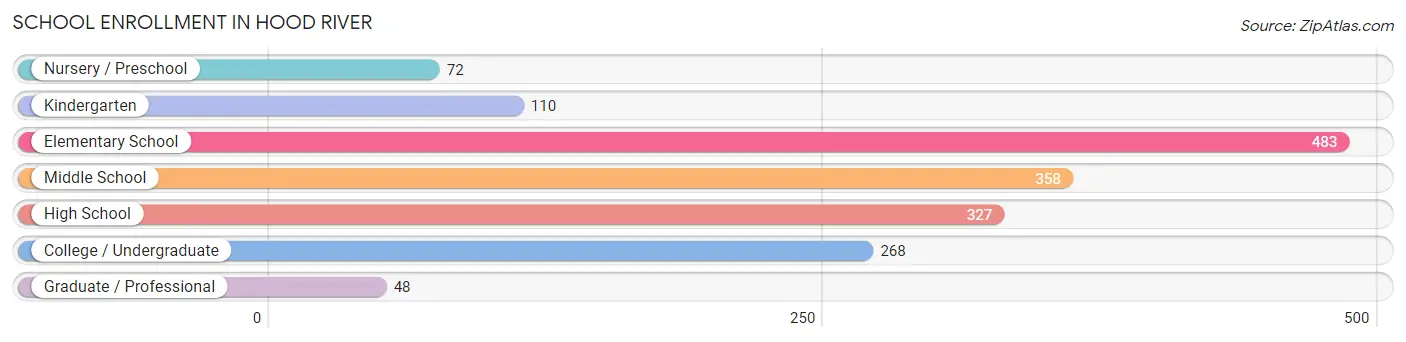
School Enrollment in Hood River
The most common levels of schooling among the 1,666 students in Hood River are elementary school (483 | 29.0%), middle school (358 | 21.5%), and high school (327 | 19.6%).
| School Level | # Students | % Students |
| Nursery / Preschool | 72 | 4.3% |
| Kindergarten | 110 | 6.6% |
| Elementary School | 483 | 29.0% |
| Middle School | 358 | 21.5% |
| High School | 327 | 19.6% |
| College / Undergraduate | 268 | 16.1% |
| Graduate / Professional | 48 | 2.9% |
| Total | 1,666 | 100.0% |
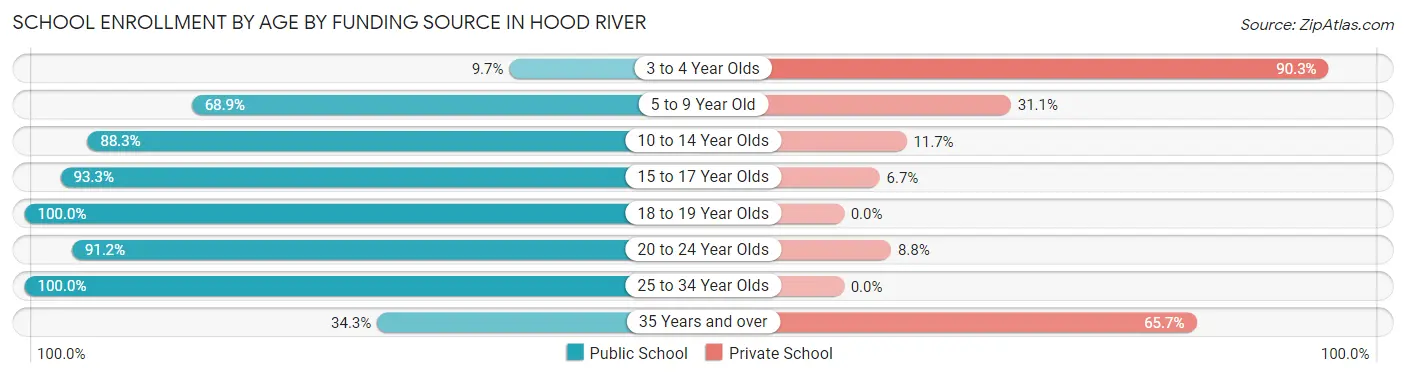
School Enrollment by Age by Funding Source in Hood River
Out of a total of 1,666 students who are enrolled in schools in Hood River, 370 (22.2%) attend a private institution, while the remaining 1,296 (77.8%) are enrolled in public schools. The age group of 3 to 4 year olds has the highest likelihood of being enrolled in private schools, with 65 (90.3% in the age bracket) enrolled. Conversely, the age group of 18 to 19 year olds has the lowest likelihood of being enrolled in a private school, with 72 (100.0% in the age bracket) attending a public institution.
| Age Bracket | Public School | Private School |
| 3 to 4 Year Olds | 7 (9.7%) | 65 (90.3%) |
| 5 to 9 Year Old | 334 (68.9%) | 151 (31.1%) |
| 10 to 14 Year Olds | 423 (88.3%) | 56 (11.7%) |
| 15 to 17 Year Olds | 265 (93.3%) | 19 (6.7%) |
| 18 to 19 Year Olds | 72 (100.0%) | 0 (0.0%) |
| 20 to 24 Year Olds | 145 (91.2%) | 14 (8.8%) |
| 25 to 34 Year Olds | 16 (100.0%) | 0 (0.0%) |
| 35 Years and over | 34 (34.3%) | 65 (65.7%) |
| Total | 1,296 (77.8%) | 370 (22.2%) |
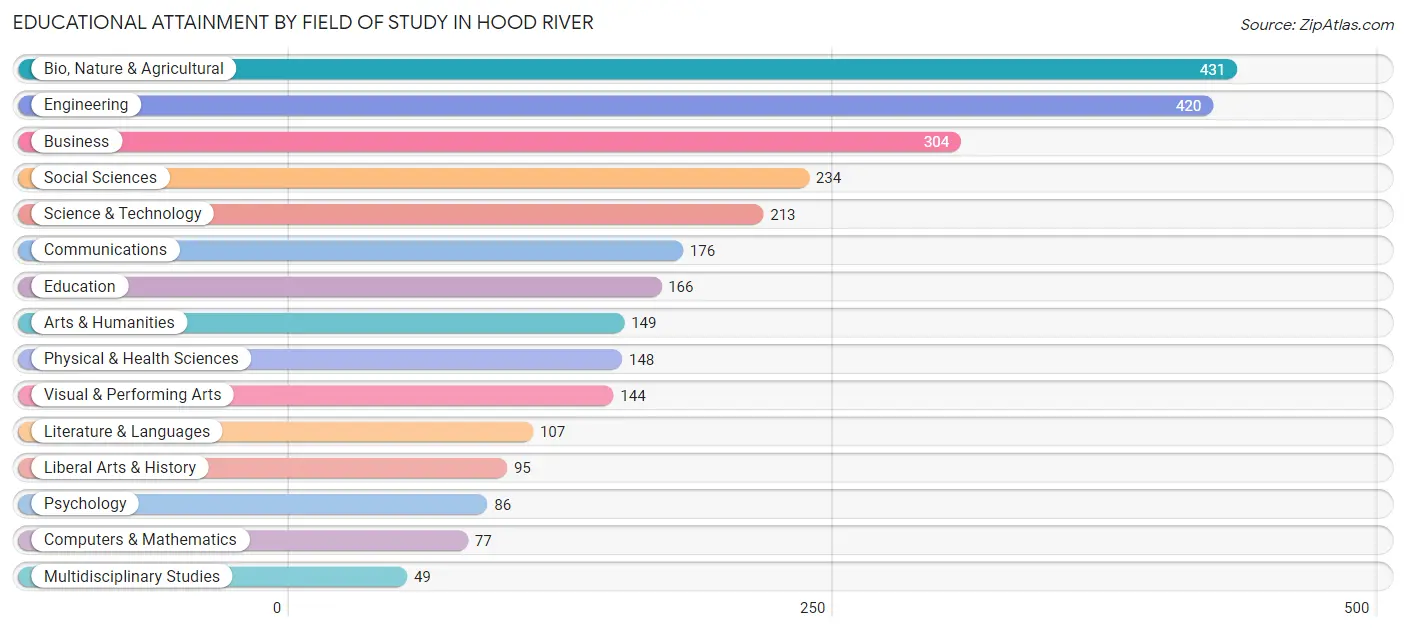
Educational Attainment by Field of Study in Hood River
Bio, nature & agricultural (431 | 15.4%), engineering (420 | 15.0%), business (304 | 10.9%), social sciences (234 | 8.4%), and science & technology (213 | 7.6%) are the most common fields of study among 2,799 individuals in Hood River who have obtained a bachelor's degree or higher.
| Field of Study | # Graduates | % Graduates |
| Computers & Mathematics | 77 | 2.8% |
| Bio, Nature & Agricultural | 431 | 15.4% |
| Physical & Health Sciences | 148 | 5.3% |
| Psychology | 86 | 3.1% |
| Social Sciences | 234 | 8.4% |
| Engineering | 420 | 15.0% |
| Multidisciplinary Studies | 49 | 1.8% |
| Science & Technology | 213 | 7.6% |
| Business | 304 | 10.9% |
| Education | 166 | 5.9% |
| Literature & Languages | 107 | 3.8% |
| Liberal Arts & History | 95 | 3.4% |
| Visual & Performing Arts | 144 | 5.1% |
| Communications | 176 | 6.3% |
| Arts & Humanities | 149 | 5.3% |
| Total | 2,799 | 100.0% |
Transportation & Commute in Hood River
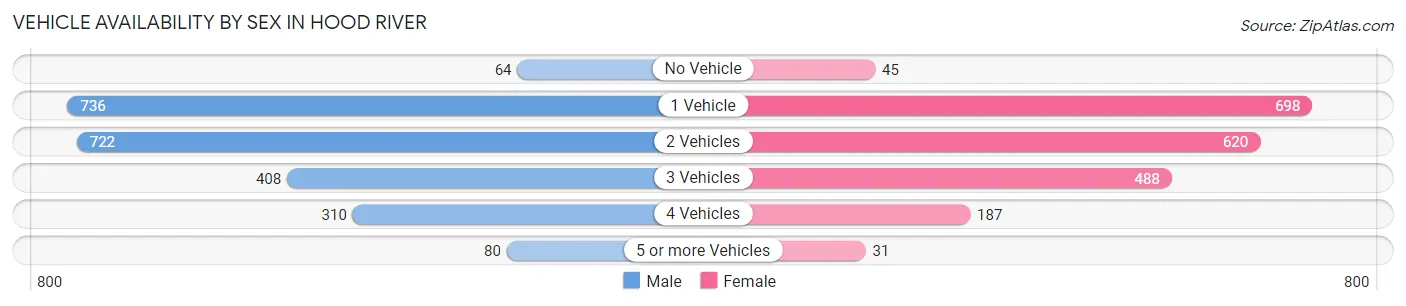
Vehicle Availability by Sex in Hood River
The most prevalent vehicle ownership categories in Hood River are males with 1 vehicle (736, accounting for 31.7%) and females with 1 vehicle (698, making up 35.6%).
| Vehicles Available | Male | Female |
| No Vehicle | 64 (2.8%) | 45 (2.2%) |
| 1 Vehicle | 736 (31.7%) | 698 (33.7%) |
| 2 Vehicles | 722 (31.1%) | 620 (30.0%) |
| 3 Vehicles | 408 (17.6%) | 488 (23.6%) |
| 4 Vehicles | 310 (13.4%) | 187 (9.0%) |
| 5 or more Vehicles | 80 (3.5%) | 31 (1.5%) |
| Total | 2,320 (100.0%) | 2,069 (100.0%) |
Commute Time in Hood River
The most frequently occuring commute durations in Hood River are 5 to 9 minutes (1,213 commuters, 33.3%), less than 5 minutes (468 commuters, 12.8%), and 10 to 14 minutes (460 commuters, 12.6%).
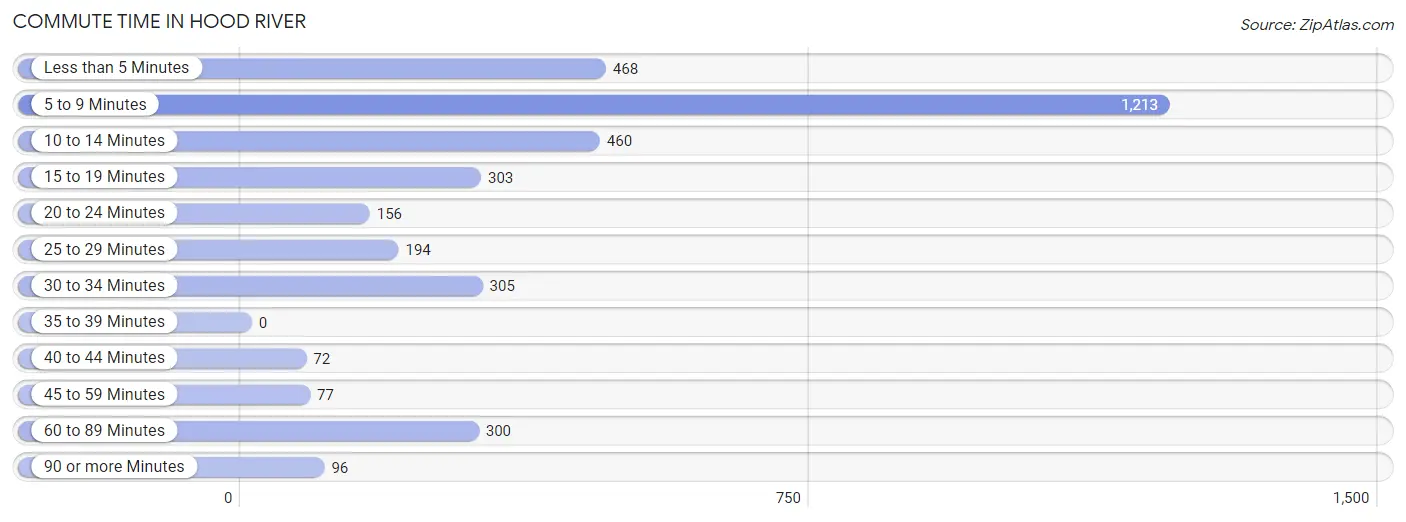
| Commute Time | # Commuters | % Commuters |
| Less than 5 Minutes | 468 | 12.8% |
| 5 to 9 Minutes | 1,213 | 33.3% |
| 10 to 14 Minutes | 460 | 12.6% |
| 15 to 19 Minutes | 303 | 8.3% |
| 20 to 24 Minutes | 156 | 4.3% |
| 25 to 29 Minutes | 194 | 5.3% |
| 30 to 34 Minutes | 305 | 8.4% |
| 35 to 39 Minutes | 0 | 0.0% |
| 40 to 44 Minutes | 72 | 2.0% |
| 45 to 59 Minutes | 77 | 2.1% |
| 60 to 89 Minutes | 300 | 8.2% |
| 90 or more Minutes | 96 | 2.6% |
Commute Time by Sex in Hood River
The most common commute times in Hood River are 5 to 9 minutes (431 commuters, 22.5%) for males and 5 to 9 minutes (782 commuters, 45.2%) for females.
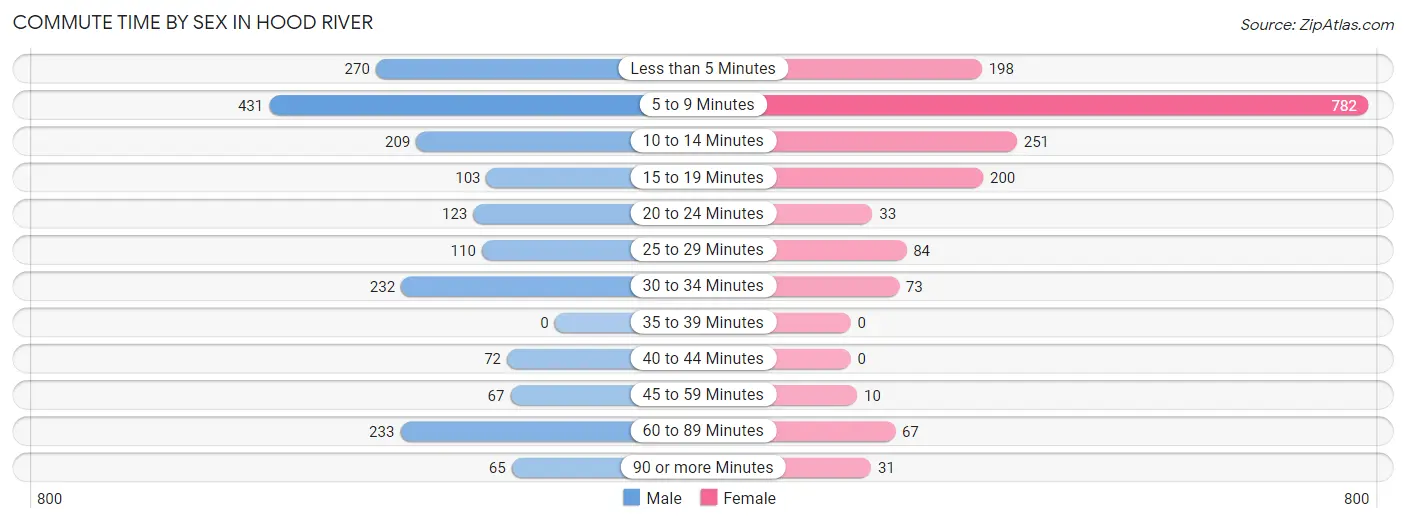
| Commute Time | Male | Female |
| Less than 5 Minutes | 270 (14.1%) | 198 (11.5%) |
| 5 to 9 Minutes | 431 (22.5%) | 782 (45.2%) |
| 10 to 14 Minutes | 209 (10.9%) | 251 (14.5%) |
| 15 to 19 Minutes | 103 (5.4%) | 200 (11.6%) |
| 20 to 24 Minutes | 123 (6.4%) | 33 (1.9%) |
| 25 to 29 Minutes | 110 (5.7%) | 84 (4.9%) |
| 30 to 34 Minutes | 232 (12.1%) | 73 (4.2%) |
| 35 to 39 Minutes | 0 (0.0%) | 0 (0.0%) |
| 40 to 44 Minutes | 72 (3.8%) | 0 (0.0%) |
| 45 to 59 Minutes | 67 (3.5%) | 10 (0.6%) |
| 60 to 89 Minutes | 233 (12.2%) | 67 (3.9%) |
| 90 or more Minutes | 65 (3.4%) | 31 (1.8%) |
Time of Departure to Work by Sex in Hood River
The most frequent times of departure to work in Hood River are 6:30 AM to 6:59 AM (348, 18.2%) for males and 8:00 AM to 8:29 AM (248, 14.3%) for females.
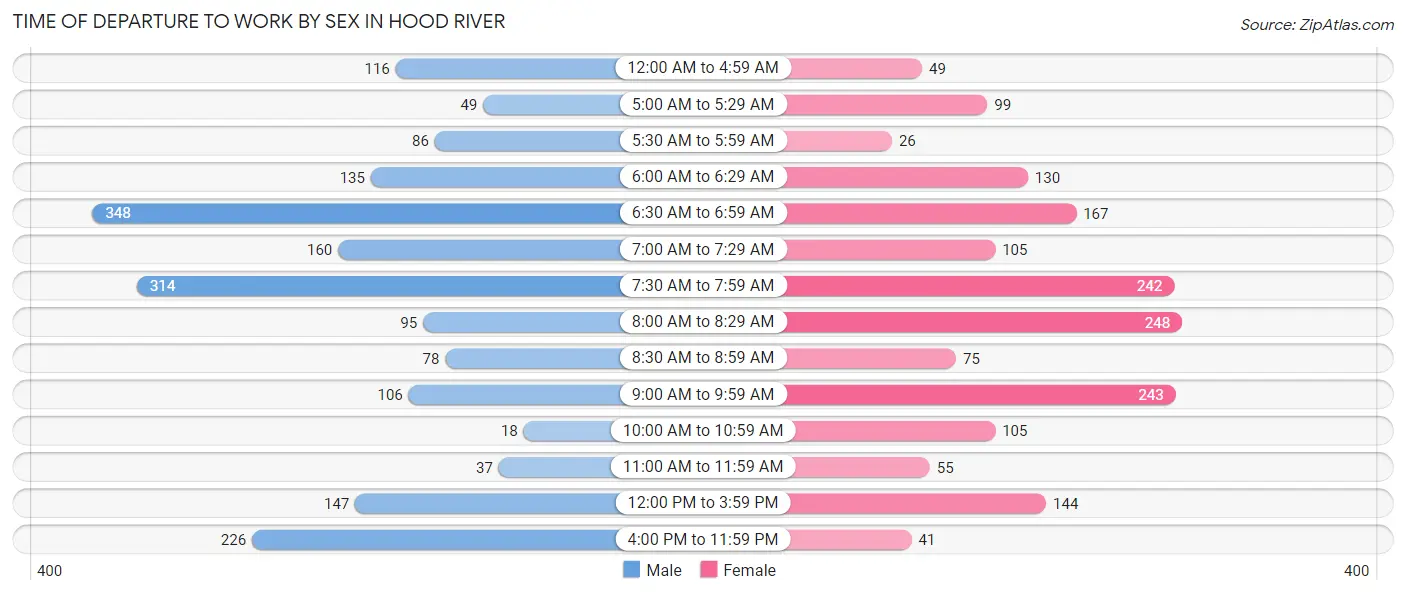
| Time of Departure | Male | Female |
| 12:00 AM to 4:59 AM | 116 (6.1%) | 49 (2.8%) |
| 5:00 AM to 5:29 AM | 49 (2.6%) | 99 (5.7%) |
| 5:30 AM to 5:59 AM | 86 (4.5%) | 26 (1.5%) |
| 6:00 AM to 6:29 AM | 135 (7.0%) | 130 (7.5%) |
| 6:30 AM to 6:59 AM | 348 (18.2%) | 167 (9.7%) |
| 7:00 AM to 7:29 AM | 160 (8.4%) | 105 (6.1%) |
| 7:30 AM to 7:59 AM | 314 (16.4%) | 242 (14.0%) |
| 8:00 AM to 8:29 AM | 95 (5.0%) | 248 (14.3%) |
| 8:30 AM to 8:59 AM | 78 (4.1%) | 75 (4.3%) |
| 9:00 AM to 9:59 AM | 106 (5.5%) | 243 (14.1%) |
| 10:00 AM to 10:59 AM | 18 (0.9%) | 105 (6.1%) |
| 11:00 AM to 11:59 AM | 37 (1.9%) | 55 (3.2%) |
| 12:00 PM to 3:59 PM | 147 (7.7%) | 144 (8.3%) |
| 4:00 PM to 11:59 PM | 226 (11.8%) | 41 (2.4%) |
| Total | 1,915 (100.0%) | 1,729 (100.0%) |
Housing Occupancy in Hood River
Occupancy by Ownership in Hood River
Of the total 3,640 dwellings in Hood River, owner-occupied units account for 1,904 (52.3%), while renter-occupied units make up 1,736 (47.7%).
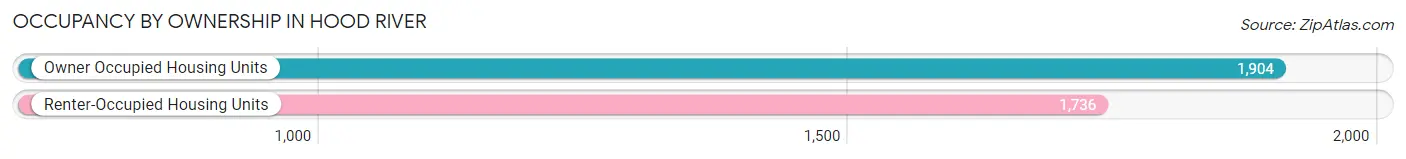
| Occupancy | # Housing Units | % Housing Units |
| Owner Occupied Housing Units | 1,904 | 52.3% |
| Renter-Occupied Housing Units | 1,736 | 47.7% |
| Total Occupied Housing Units | 3,640 | 100.0% |
Occupancy by Household Size in Hood River
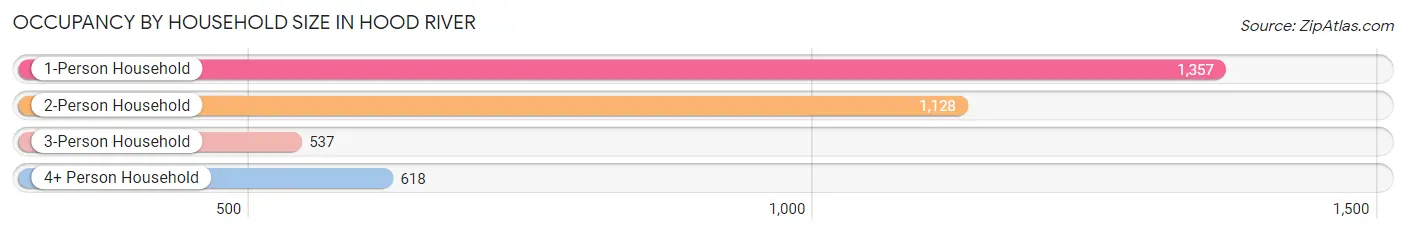
| Household Size | # Housing Units | % Housing Units |
| 1-Person Household | 1,357 | 37.3% |
| 2-Person Household | 1,128 | 31.0% |
| 3-Person Household | 537 | 14.7% |
| 4+ Person Household | 618 | 17.0% |
| Total Housing Units | 3,640 | 100.0% |
Occupancy by Ownership by Household Size in Hood River
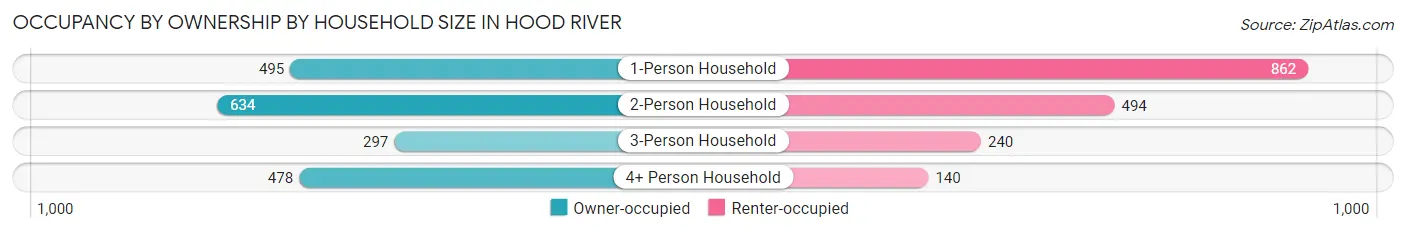
| Household Size | Owner-occupied | Renter-occupied |
| 1-Person Household | 495 (36.5%) | 862 (63.5%) |
| 2-Person Household | 634 (56.2%) | 494 (43.8%) |
| 3-Person Household | 297 (55.3%) | 240 (44.7%) |
| 4+ Person Household | 478 (77.3%) | 140 (22.7%) |
| Total Housing Units | 1,904 (52.3%) | 1,736 (47.7%) |
Occupancy by Educational Attainment in Hood River
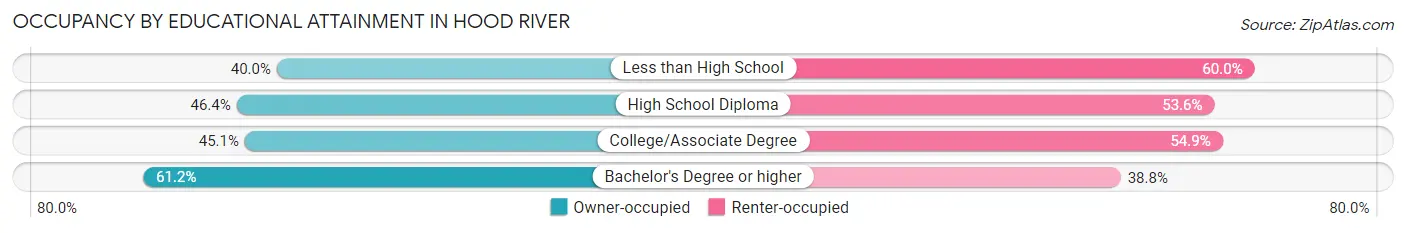
| Household Size | Owner-occupied | Renter-occupied |
| Less than High School | 176 (40.0%) | 264 (60.0%) |
| High School Diploma | 327 (46.4%) | 378 (53.6%) |
| College/Associate Degree | 353 (45.1%) | 430 (54.9%) |
| Bachelor's Degree or higher | 1,048 (61.2%) | 664 (38.8%) |
Occupancy by Age of Householder in Hood River
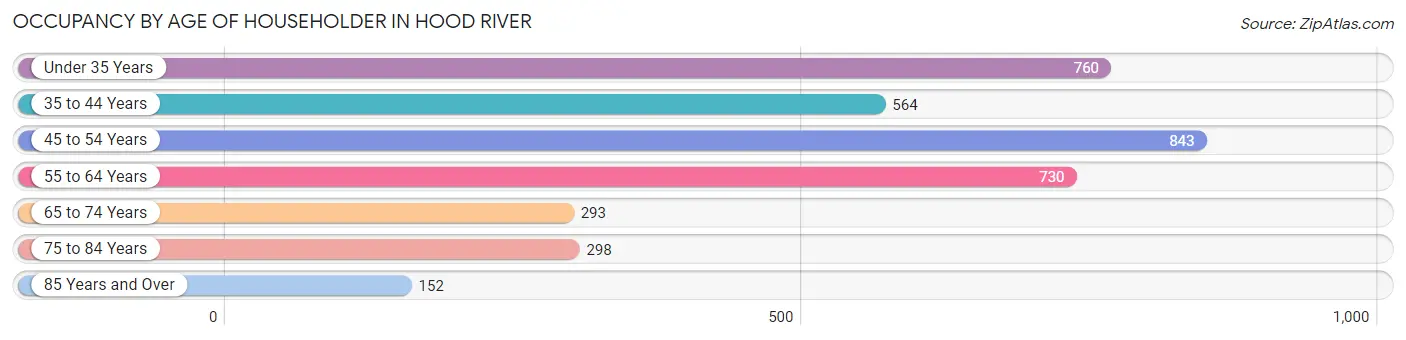
| Age Bracket | # Households | % Households |
| Under 35 Years | 760 | 20.9% |
| 35 to 44 Years | 564 | 15.5% |
| 45 to 54 Years | 843 | 23.2% |
| 55 to 64 Years | 730 | 20.1% |
| 65 to 74 Years | 293 | 8.1% |
| 75 to 84 Years | 298 | 8.2% |
| 85 Years and Over | 152 | 4.2% |
| Total | 3,640 | 100.0% |
Housing Finances in Hood River
Median Income by Occupancy in Hood River
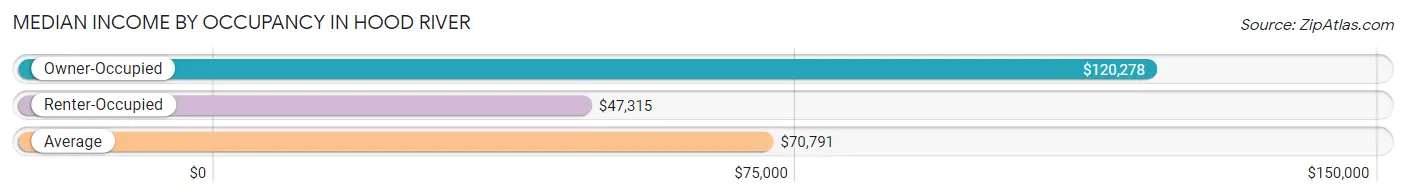
| Occupancy Type | # Households | Median Income |
| Owner-Occupied | 1,904 (52.3%) | $120,278 |
| Renter-Occupied | 1,736 (47.7%) | $47,315 |
| Average | 3,640 (100.0%) | $70,791 |
Occupancy by Householder Income Bracket in Hood River
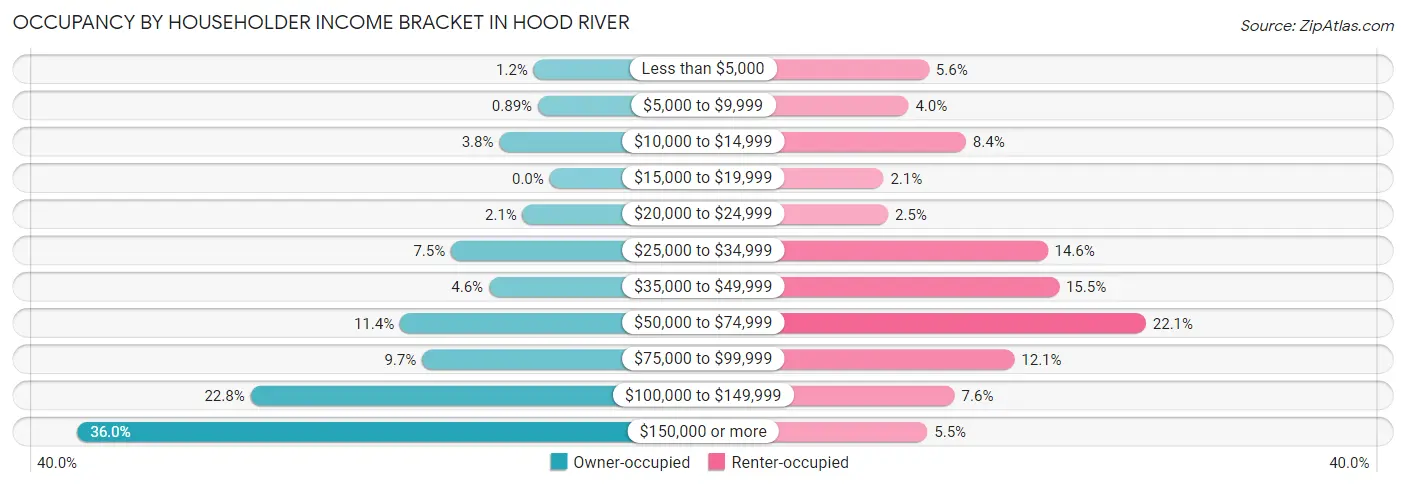
| Income Bracket | Owner-occupied | Renter-occupied |
| Less than $5,000 | 23 (1.2%) | 97 (5.6%) |
| $5,000 to $9,999 | 17 (0.9%) | 70 (4.0%) |
| $10,000 to $14,999 | 73 (3.8%) | 146 (8.4%) |
| $15,000 to $19,999 | 0 (0.0%) | 37 (2.1%) |
| $20,000 to $24,999 | 39 (2.1%) | 43 (2.5%) |
| $25,000 to $34,999 | 143 (7.5%) | 254 (14.6%) |
| $35,000 to $49,999 | 88 (4.6%) | 269 (15.5%) |
| $50,000 to $74,999 | 217 (11.4%) | 384 (22.1%) |
| $75,000 to $99,999 | 185 (9.7%) | 210 (12.1%) |
| $100,000 to $149,999 | 434 (22.8%) | 131 (7.5%) |
| $150,000 or more | 685 (36.0%) | 95 (5.5%) |
| Total | 1,904 (100.0%) | 1,736 (100.0%) |
Monthly Housing Cost Tiers in Hood River
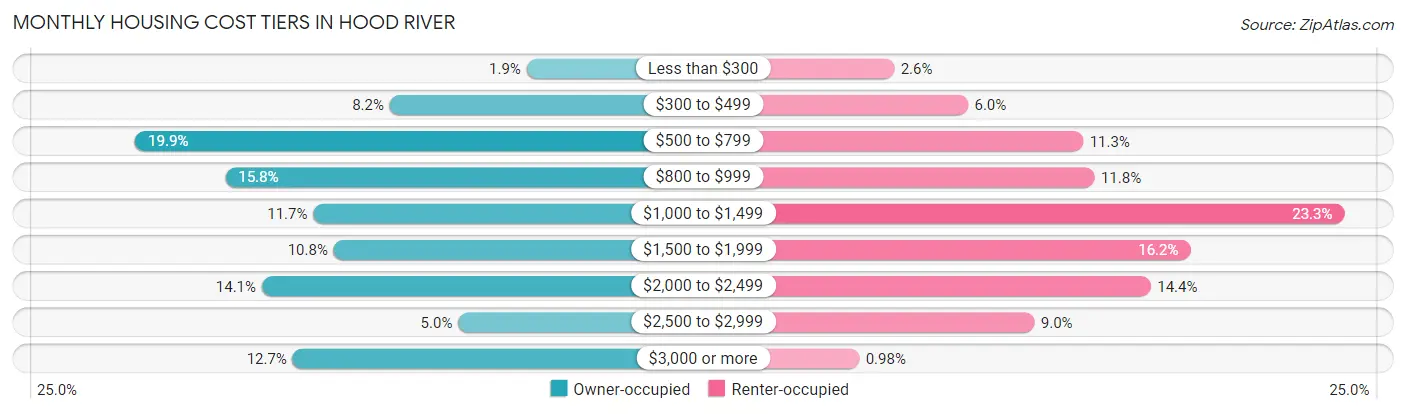
| Monthly Cost | Owner-occupied | Renter-occupied |
| Less than $300 | 36 (1.9%) | 45 (2.6%) |
| $300 to $499 | 156 (8.2%) | 104 (6.0%) |
| $500 to $799 | 379 (19.9%) | 196 (11.3%) |
| $800 to $999 | 300 (15.8%) | 205 (11.8%) |
| $1,000 to $1,499 | 223 (11.7%) | 405 (23.3%) |
| $1,500 to $1,999 | 205 (10.8%) | 282 (16.2%) |
| $2,000 to $2,499 | 268 (14.1%) | 250 (14.4%) |
| $2,500 to $2,999 | 96 (5.0%) | 157 (9.0%) |
| $3,000 or more | 241 (12.7%) | 17 (1.0%) |
| Total | 1,904 (100.0%) | 1,736 (100.0%) |
Physical Housing Characteristics in Hood River
Housing Structures in Hood River
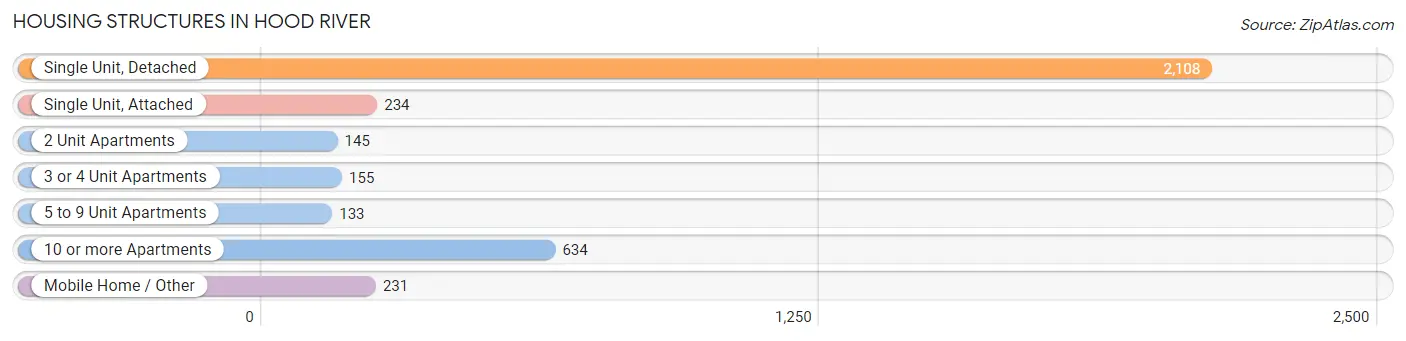
| Structure Type | # Housing Units | % Housing Units |
| Single Unit, Detached | 2,108 | 57.9% |
| Single Unit, Attached | 234 | 6.4% |
| 2 Unit Apartments | 145 | 4.0% |
| 3 or 4 Unit Apartments | 155 | 4.3% |
| 5 to 9 Unit Apartments | 133 | 3.6% |
| 10 or more Apartments | 634 | 17.4% |
| Mobile Home / Other | 231 | 6.4% |
| Total | 3,640 | 100.0% |
Housing Structures by Occupancy in Hood River
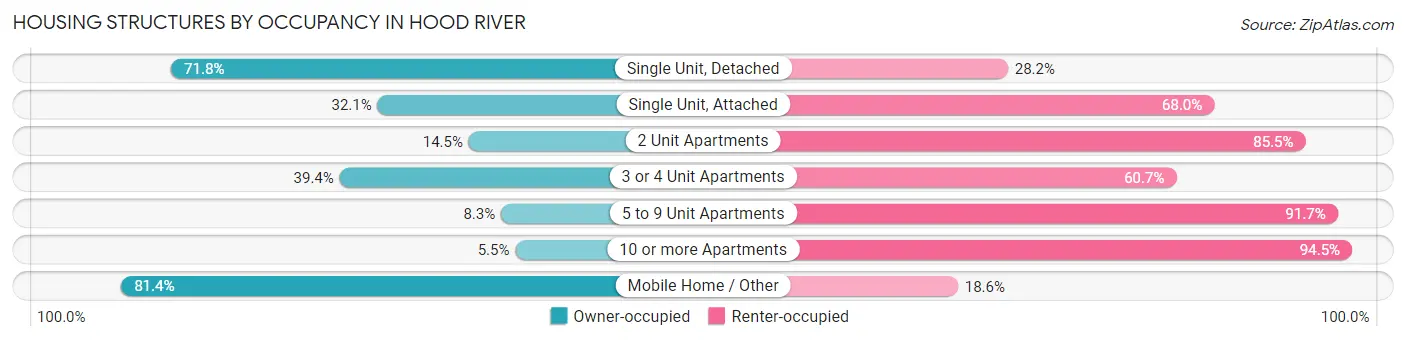
| Structure Type | Owner-occupied | Renter-occupied |
| Single Unit, Detached | 1,513 (71.8%) | 595 (28.2%) |
| Single Unit, Attached | 75 (32.1%) | 159 (67.9%) |
| 2 Unit Apartments | 21 (14.5%) | 124 (85.5%) |
| 3 or 4 Unit Apartments | 61 (39.4%) | 94 (60.7%) |
| 5 to 9 Unit Apartments | 11 (8.3%) | 122 (91.7%) |
| 10 or more Apartments | 35 (5.5%) | 599 (94.5%) |
| Mobile Home / Other | 188 (81.4%) | 43 (18.6%) |
| Total | 1,904 (52.3%) | 1,736 (47.7%) |
Housing Structures by Number of Rooms in Hood River
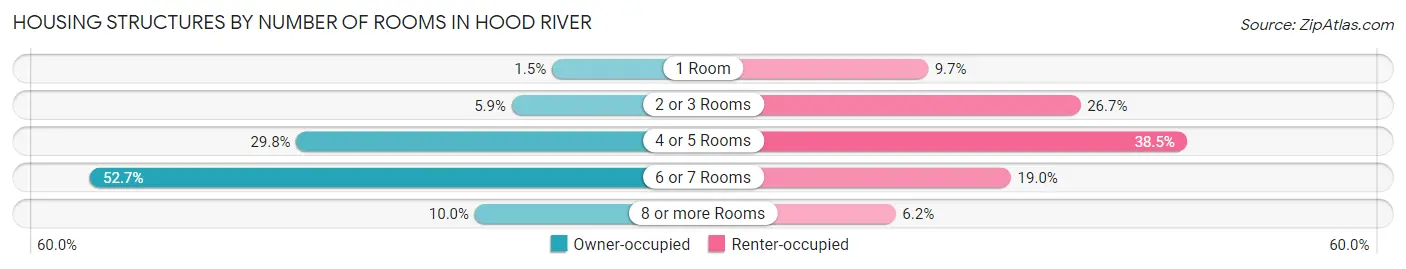
| Number of Rooms | Owner-occupied | Renter-occupied |
| 1 Room | 28 (1.5%) | 169 (9.7%) |
| 2 or 3 Rooms | 113 (5.9%) | 463 (26.7%) |
| 4 or 5 Rooms | 568 (29.8%) | 668 (38.5%) |
| 6 or 7 Rooms | 1,004 (52.7%) | 329 (19.0%) |
| 8 or more Rooms | 191 (10.0%) | 107 (6.2%) |
| Total | 1,904 (100.0%) | 1,736 (100.0%) |
Housing Structure by Heating Type in Hood River
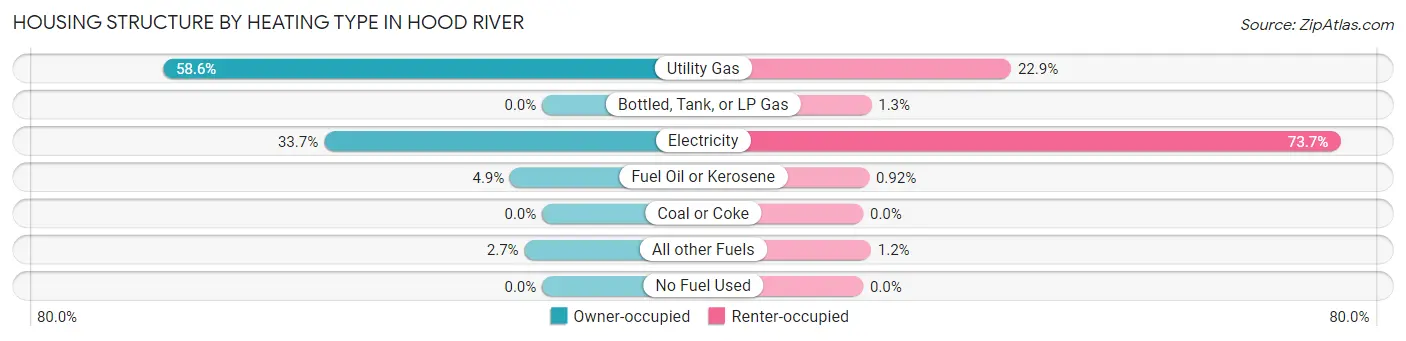
| Heating Type | Owner-occupied | Renter-occupied |
| Utility Gas | 1,116 (58.6%) | 397 (22.9%) |
| Bottled, Tank, or LP Gas | 0 (0.0%) | 22 (1.3%) |
| Electricity | 642 (33.7%) | 1,280 (73.7%) |
| Fuel Oil or Kerosene | 94 (4.9%) | 16 (0.9%) |
| Coal or Coke | 0 (0.0%) | 0 (0.0%) |
| All other Fuels | 52 (2.7%) | 21 (1.2%) |
| No Fuel Used | 0 (0.0%) | 0 (0.0%) |
| Total | 1,904 (100.0%) | 1,736 (100.0%) |
Household Vehicle Usage in Hood River
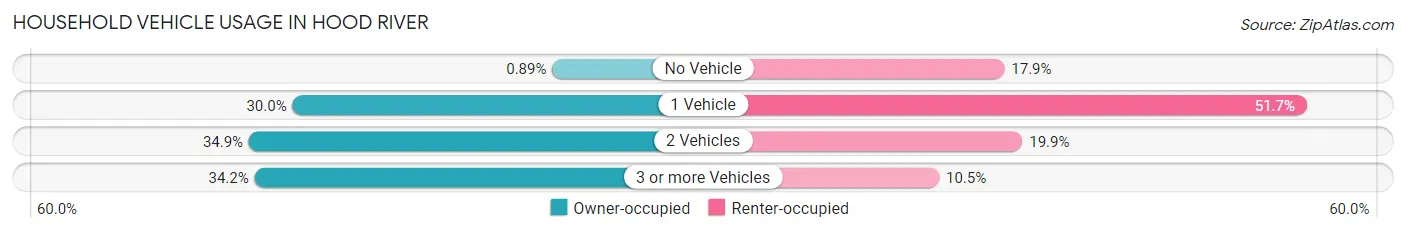
| Vehicles per Household | Owner-occupied | Renter-occupied |
| No Vehicle | 17 (0.9%) | 310 (17.9%) |
| 1 Vehicle | 571 (30.0%) | 898 (51.7%) |
| 2 Vehicles | 664 (34.9%) | 345 (19.9%) |
| 3 or more Vehicles | 652 (34.2%) | 183 (10.5%) |
| Total | 1,904 (100.0%) | 1,736 (100.0%) |
Real Estate & Mortgages in Hood River
Real Estate and Mortgage Overview in Hood River
| Characteristic | Without Mortgage | With Mortgage |
| Housing Units | 837 | 1,067 |
| Median Property Value | $447,600 | $558,100 |
| Median Household Income | $86,339 | $530 |
| Monthly Housing Costs | $657 | $241 |
| Real Estate Taxes | $3,614 | $16 |
Property Value by Mortgage Status in Hood River
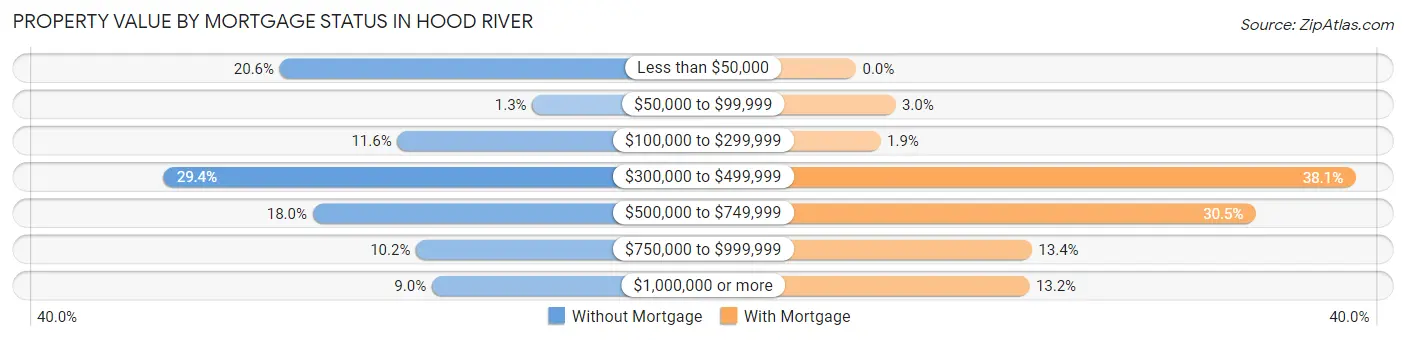
| Property Value | Without Mortgage | With Mortgage |
| Less than $50,000 | 172 (20.5%) | 0 (0.0%) |
| $50,000 to $99,999 | 11 (1.3%) | 32 (3.0%) |
| $100,000 to $299,999 | 97 (11.6%) | 20 (1.9%) |
| $300,000 to $499,999 | 246 (29.4%) | 406 (38.1%) |
| $500,000 to $749,999 | 151 (18.0%) | 325 (30.5%) |
| $750,000 to $999,999 | 85 (10.2%) | 143 (13.4%) |
| $1,000,000 or more | 75 (9.0%) | 141 (13.2%) |
| Total | 837 (100.0%) | 1,067 (100.0%) |
Household Income by Mortgage Status in Hood River
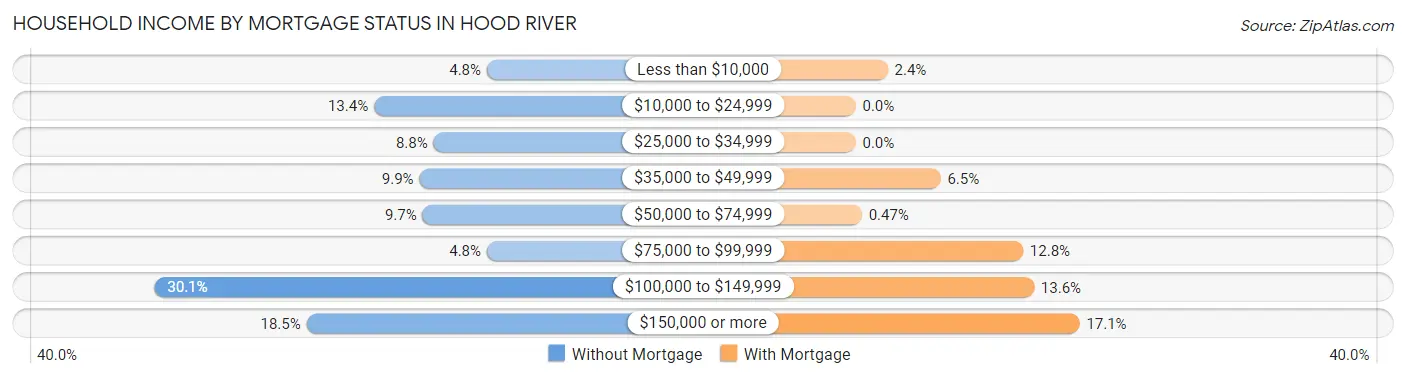
| Household Income | Without Mortgage | With Mortgage |
| Less than $10,000 | 40 (4.8%) | 26 (2.4%) |
| $10,000 to $24,999 | 112 (13.4%) | 0 (0.0%) |
| $25,000 to $34,999 | 74 (8.8%) | 0 (0.0%) |
| $35,000 to $49,999 | 83 (9.9%) | 69 (6.5%) |
| $50,000 to $74,999 | 81 (9.7%) | 5 (0.5%) |
| $75,000 to $99,999 | 40 (4.8%) | 136 (12.8%) |
| $100,000 to $149,999 | 252 (30.1%) | 145 (13.6%) |
| $150,000 or more | 155 (18.5%) | 182 (17.1%) |
| Total | 837 (100.0%) | 1,067 (100.0%) |
Property Value to Household Income Ratio in Hood River
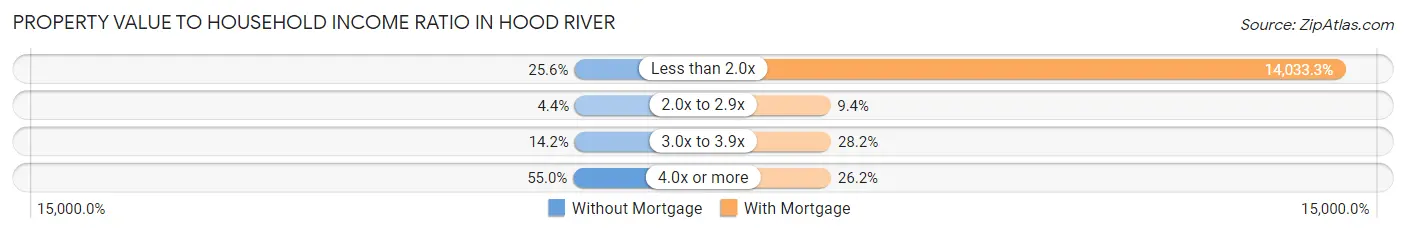
| Value-to-Income Ratio | Without Mortgage | With Mortgage |
| Less than 2.0x | 214 (25.6%) | 149,735 (14,033.3%) |
| 2.0x to 2.9x | 37 (4.4%) | 100 (9.4%) |
| 3.0x to 3.9x | 119 (14.2%) | 301 (28.2%) |
| 4.0x or more | 460 (55.0%) | 280 (26.2%) |
| Total | 837 (100.0%) | 1,067 (100.0%) |
Real Estate Taxes by Mortgage Status in Hood River
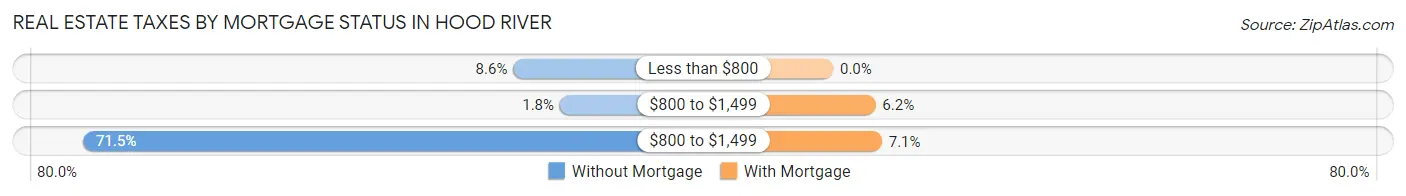
| Property Taxes | Without Mortgage | With Mortgage |
| Less than $800 | 72 (8.6%) | 0 (0.0%) |
| $800 to $1,499 | 15 (1.8%) | 66 (6.2%) |
| $800 to $1,499 | 598 (71.5%) | 76 (7.1%) |
| Total | 837 (100.0%) | 1,067 (100.0%) |
Health & Disability in Hood River
Health Insurance Coverage by Age in Hood River
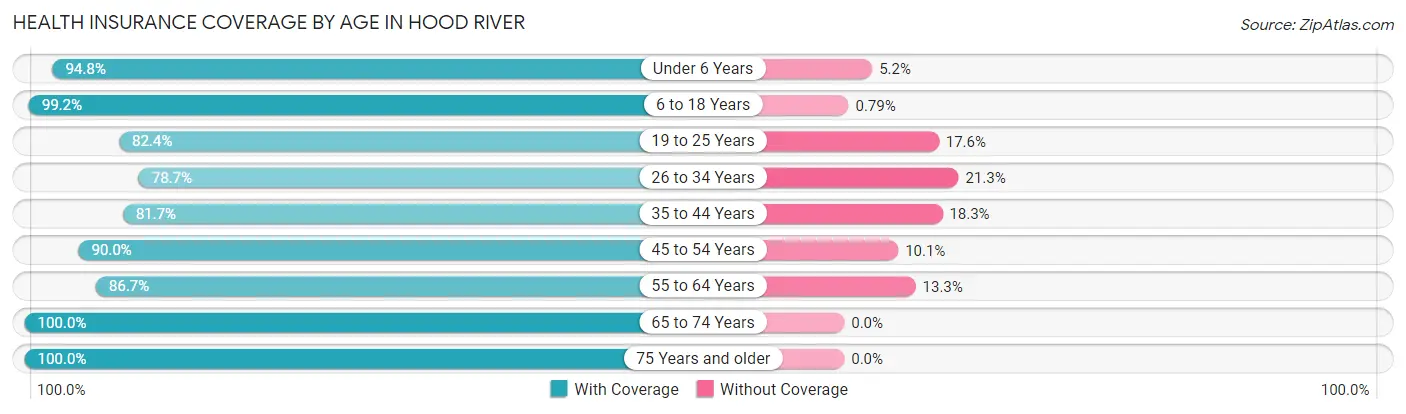
| Age Bracket | With Coverage | Without Coverage |
| Under 6 Years | 600 (94.8%) | 33 (5.2%) |
| 6 to 18 Years | 1,255 (99.2%) | 10 (0.8%) |
| 19 to 25 Years | 491 (82.4%) | 105 (17.6%) |
| 26 to 34 Years | 942 (78.7%) | 255 (21.3%) |
| 35 to 44 Years | 875 (81.7%) | 196 (18.3%) |
| 45 to 54 Years | 1,191 (89.9%) | 133 (10.1%) |
| 55 to 64 Years | 945 (86.7%) | 145 (13.3%) |
| 65 to 74 Years | 472 (100.0%) | 0 (0.0%) |
| 75 Years and older | 593 (100.0%) | 0 (0.0%) |
| Total | 7,364 (89.4%) | 877 (10.6%) |
Health Insurance Coverage by Citizenship Status in Hood River
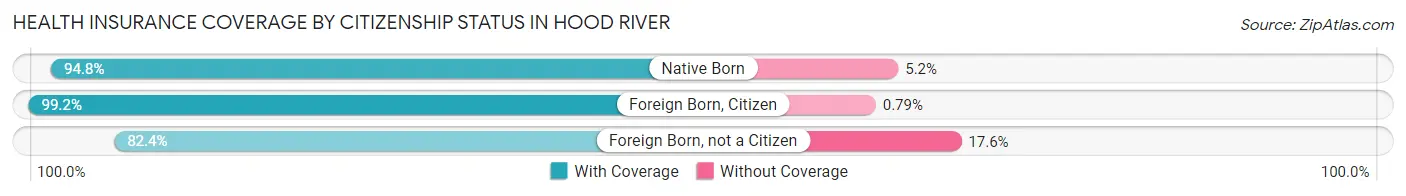
| Citizenship Status | With Coverage | Without Coverage |
| Native Born | 600 (94.8%) | 33 (5.2%) |
| Foreign Born, Citizen | 1,255 (99.2%) | 10 (0.8%) |
| Foreign Born, not a Citizen | 491 (82.4%) | 105 (17.6%) |
Health Insurance Coverage by Household Income in Hood River
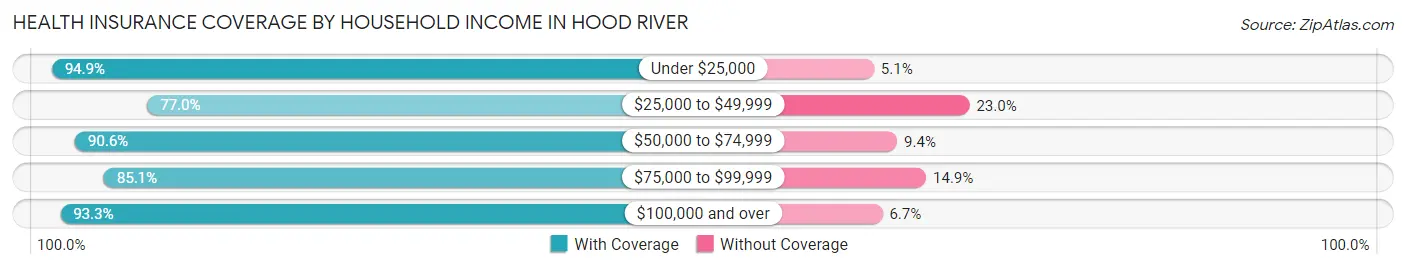
| Household Income | With Coverage | Without Coverage |
| Under $25,000 | 617 (94.9%) | 33 (5.1%) |
| $25,000 to $49,999 | 1,112 (77.0%) | 332 (23.0%) |
| $50,000 to $74,999 | 1,076 (90.6%) | 112 (9.4%) |
| $75,000 to $99,999 | 722 (85.1%) | 126 (14.9%) |
| $100,000 and over | 3,770 (93.3%) | 270 (6.7%) |
Public vs Private Health Insurance Coverage by Age in Hood River
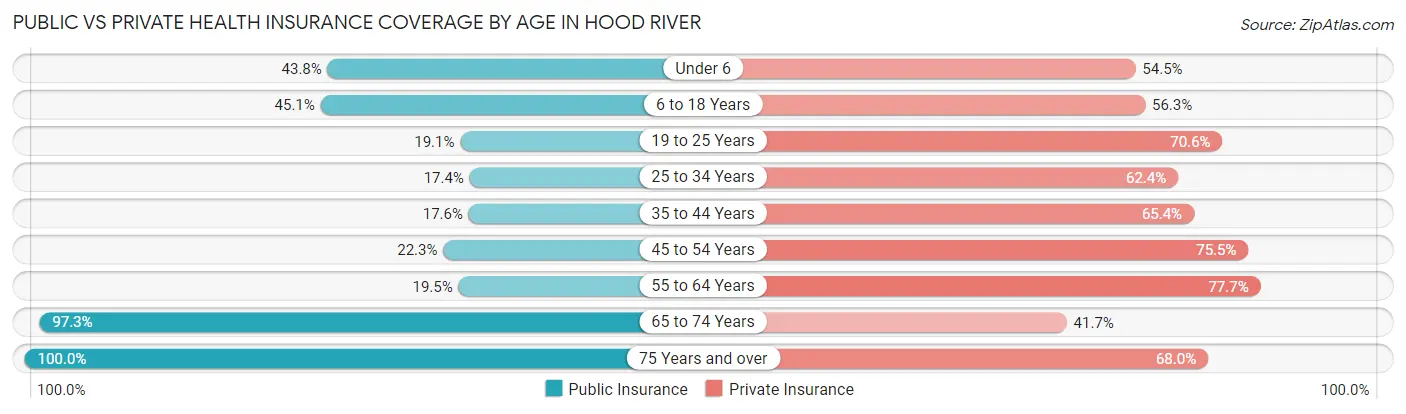
| Age Bracket | Public Insurance | Private Insurance |
| Under 6 | 277 (43.8%) | 345 (54.5%) |
| 6 to 18 Years | 570 (45.1%) | 712 (56.3%) |
| 19 to 25 Years | 114 (19.1%) | 421 (70.6%) |
| 25 to 34 Years | 208 (17.4%) | 747 (62.4%) |
| 35 to 44 Years | 188 (17.5%) | 700 (65.4%) |
| 45 to 54 Years | 295 (22.3%) | 999 (75.4%) |
| 55 to 64 Years | 212 (19.5%) | 847 (77.7%) |
| 65 to 74 Years | 459 (97.3%) | 197 (41.7%) |
| 75 Years and over | 593 (100.0%) | 403 (68.0%) |
| Total | 2,916 (35.4%) | 5,371 (65.2%) |
Disability Status by Sex by Age in Hood River
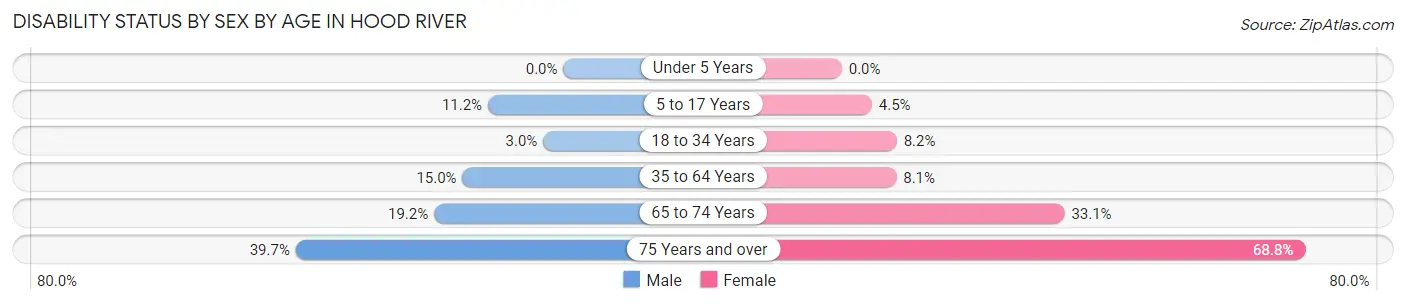
| Age Bracket | Male | Female |
| Under 5 Years | 0 (0.0%) | 0 (0.0%) |
| 5 to 17 Years | 68 (11.2%) | 32 (4.5%) |
| 18 to 34 Years | 33 (3.0%) | 61 (8.2%) |
| 35 to 64 Years | 259 (15.0%) | 142 (8.1%) |
| 65 to 74 Years | 43 (19.2%) | 82 (33.1%) |
| 75 Years and over | 93 (39.7%) | 247 (68.8%) |
Disability Class by Sex by Age in Hood River
Disability Class: Hearing Difficulty
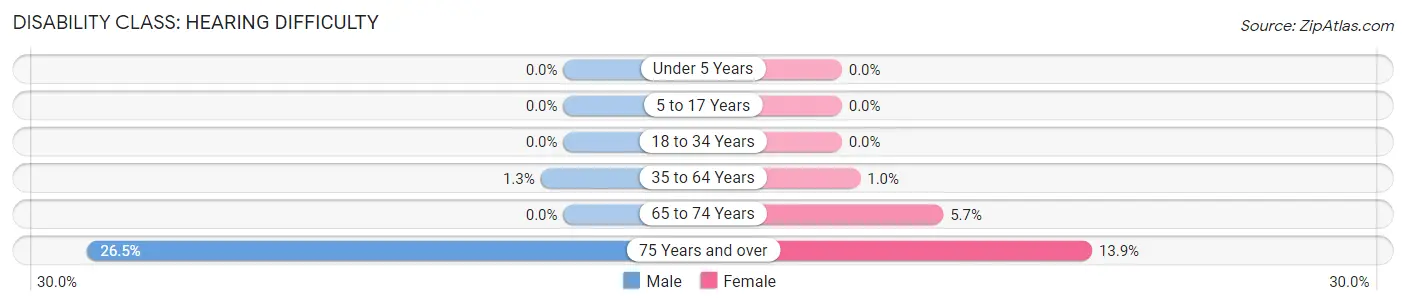
| Age Bracket | Male | Female |
| Under 5 Years | 0 (0.0%) | 0 (0.0%) |
| 5 to 17 Years | 0 (0.0%) | 0 (0.0%) |
| 18 to 34 Years | 0 (0.0%) | 0 (0.0%) |
| 35 to 64 Years | 22 (1.3%) | 18 (1.0%) |
| 65 to 74 Years | 0 (0.0%) | 14 (5.7%) |
| 75 Years and over | 62 (26.5%) | 50 (13.9%) |
Disability Class: Vision Difficulty
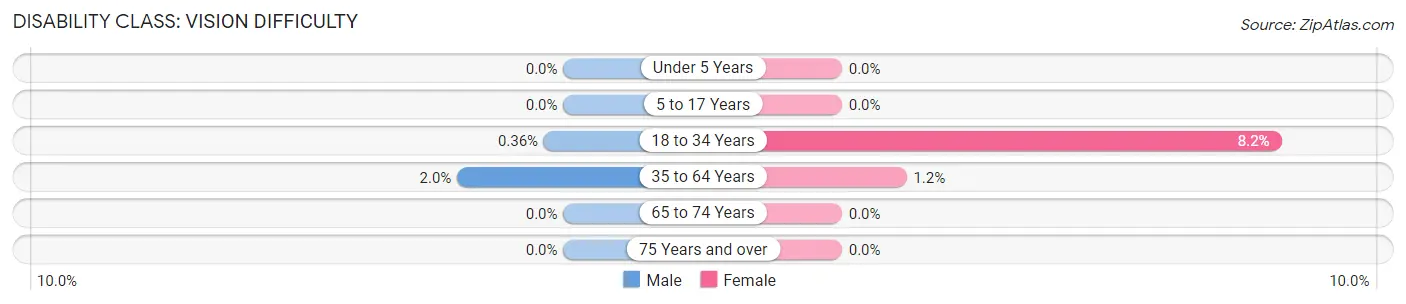
| Age Bracket | Male | Female |
| Under 5 Years | 0 (0.0%) | 0 (0.0%) |
| 5 to 17 Years | 0 (0.0%) | 0 (0.0%) |
| 18 to 34 Years | 4 (0.4%) | 61 (8.2%) |
| 35 to 64 Years | 34 (2.0%) | 21 (1.2%) |
| 65 to 74 Years | 0 (0.0%) | 0 (0.0%) |
| 75 Years and over | 0 (0.0%) | 0 (0.0%) |
Disability Class: Cognitive Difficulty
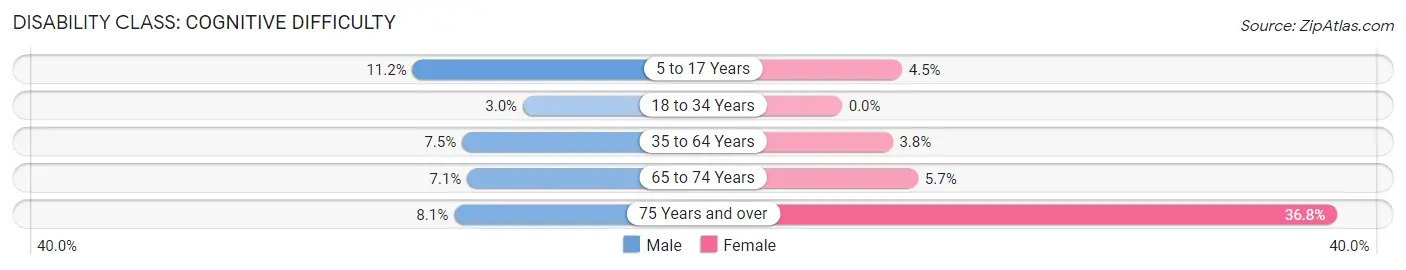
| Age Bracket | Male | Female |
| 5 to 17 Years | 68 (11.2%) | 32 (4.5%) |
| 18 to 34 Years | 33 (3.0%) | 0 (0.0%) |
| 35 to 64 Years | 130 (7.5%) | 66 (3.8%) |
| 65 to 74 Years | 16 (7.1%) | 14 (5.7%) |
| 75 Years and over | 19 (8.1%) | 132 (36.8%) |
Disability Class: Ambulatory Difficulty
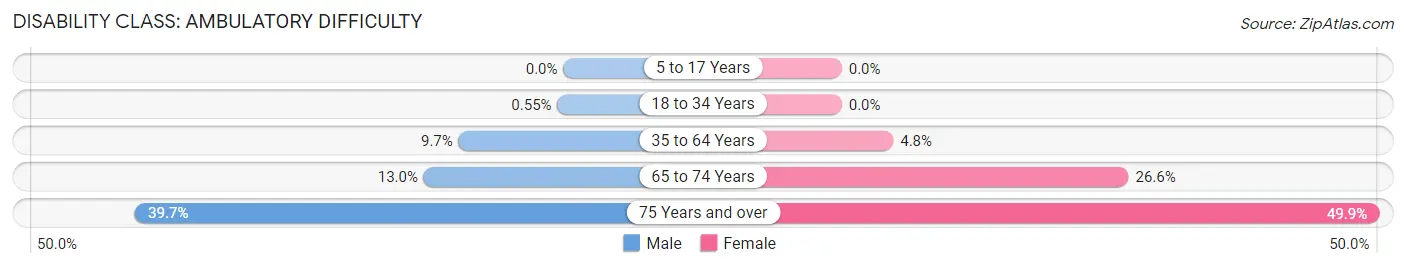
| Age Bracket | Male | Female |
| 5 to 17 Years | 0 (0.0%) | 0 (0.0%) |
| 18 to 34 Years | 6 (0.5%) | 0 (0.0%) |
| 35 to 64 Years | 168 (9.7%) | 84 (4.8%) |
| 65 to 74 Years | 29 (13.0%) | 66 (26.6%) |
| 75 Years and over | 93 (39.7%) | 179 (49.9%) |
Disability Class: Self-Care Difficulty
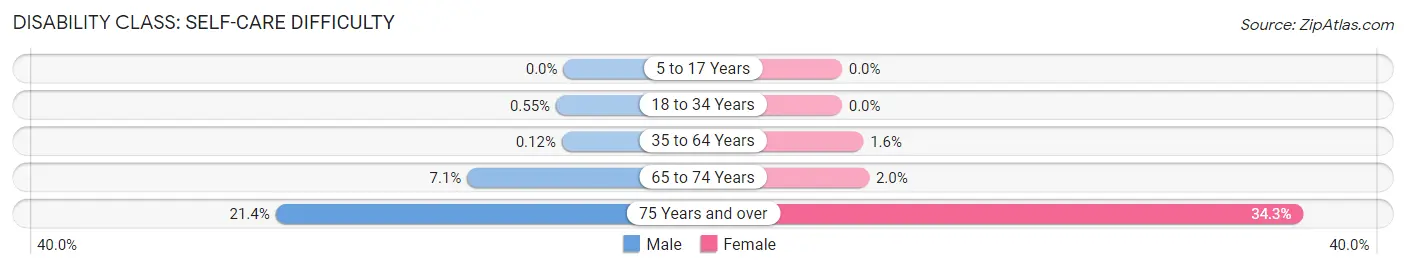
| Age Bracket | Male | Female |
| 5 to 17 Years | 0 (0.0%) | 0 (0.0%) |
| 18 to 34 Years | 6 (0.5%) | 0 (0.0%) |
| 35 to 64 Years | 2 (0.1%) | 28 (1.6%) |
| 65 to 74 Years | 16 (7.1%) | 5 (2.0%) |
| 75 Years and over | 50 (21.4%) | 123 (34.3%) |
Technology Access in Hood River
Computing Device Access in Hood River
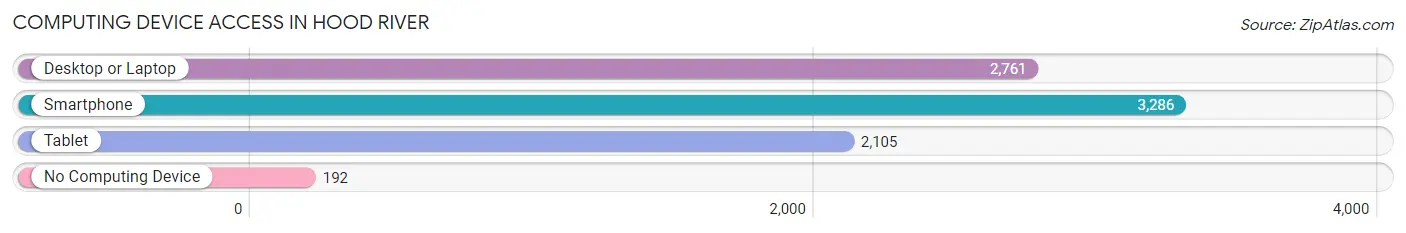
| Device Type | # Households | % Households |
| Desktop or Laptop | 2,761 | 75.8% |
| Smartphone | 3,286 | 90.3% |
| Tablet | 2,105 | 57.8% |
| No Computing Device | 192 | 5.3% |
| Total | 3,640 | 100.0% |
Internet Access in Hood River
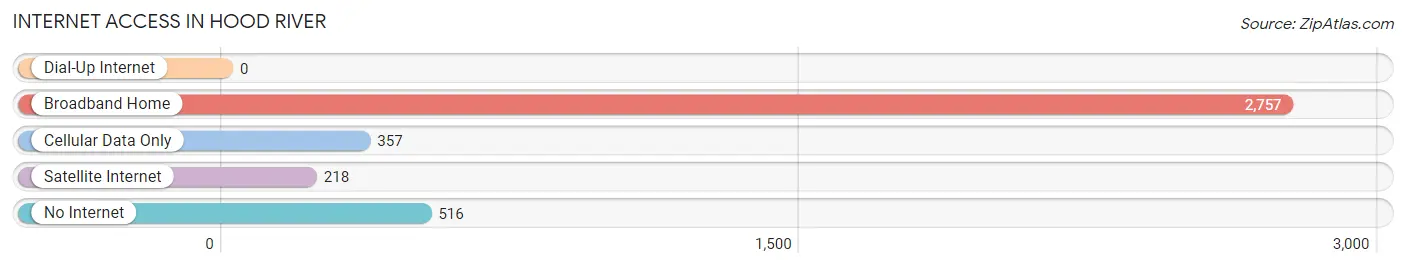
| Internet Type | # Households | % Households |
| Dial-Up Internet | 0 | 0.0% |
| Broadband Home | 2,757 | 75.7% |
| Cellular Data Only | 357 | 9.8% |
| Satellite Internet | 218 | 6.0% |
| No Internet | 516 | 14.2% |
| Total | 3,640 | 100.0% |
Hood River Summary
Hood River is a city located in the Columbia River Gorge in the state of Oregon. It is situated on the south side of the Columbia River, approximately 60 miles east of Portland. The city is the county seat of Hood River County and is home to a population of approximately 7,000 people.
History
The area that is now Hood River was first inhabited by the Multnomah tribe of Native Americans. The first European settlers arrived in the area in the early 1800s, and the city was officially incorporated in 1895. The city was named after the nearby Hood River, which was named after the British explorer, Captain George Vancouver, who explored the area in 1792.
The city was initially a logging and agricultural center, but in the early 1900s, the economy shifted to focus on fruit production. The city was known for its apples, pears, and cherries, and the Hood River Valley was known as the “Fruit Bowl of the Nation.” The city also became a popular tourist destination, with visitors coming to enjoy the scenery and outdoor activities.
Geography
Hood River is located in the Columbia River Gorge, a deep canyon that was carved by the Columbia River. The city is situated on the south side of the river, approximately 60 miles east of Portland. The city is surrounded by the Cascade Mountains to the east and the Columbia River to the west. The city is located at an elevation of approximately 500 feet above sea level.
The climate in Hood River is mild and temperate, with warm summers and cool winters. The average high temperature in the summer is around 80 degrees Fahrenheit, and the average low temperature in the winter is around 30 degrees Fahrenheit. The city receives an average of approximately 30 inches of precipitation per year.
Economy
The economy of Hood River is largely based on tourism and agriculture. The city is a popular tourist destination, with visitors coming to enjoy the scenery and outdoor activities. The city is also home to several wineries and breweries, which attract visitors from all over the region.
Agriculture is also an important part of the economy. The Hood River Valley is known for its apples, pears, and cherries, and the area is home to several fruit orchards and farms. The city is also home to several manufacturing companies, including a wind turbine manufacturer and a wood products company.
Demographics
As of the 2010 census, the population of Hood River was 7,167. The racial makeup of the city was 87.3% White, 0.7% African American, 0.7% Native American, 4.2% Asian, 0.2% Pacific Islander, 3.3% from other races, and 3.7% from two or more races. Hispanic or Latino of any race were 8.2% of the population.
The median household income in Hood River was $50,845, and the median family income was $60,938. The per capita income for the city was $27,845. About 11.2% of the population was below the poverty line.
Hood River is a vibrant and diverse city with a rich history and a bright future. The city is home to a thriving economy, with a focus on tourism and agriculture, and a population that is diverse and welcoming. The city is a great place to live, work, and play, and is sure to continue to be a great place to call home for many years to come.
Common Questions
What is Per Capita Income in Hood River?
Per Capita income in Hood River is $45,642.
What is the Median Family Income in Hood River?
Median Family Income in Hood River is $97,589.
What is the Median Household income in Hood River?
Median Household Income in Hood River is $70,791.
What is Income or Wage Gap in Hood River?
Income or Wage Gap in Hood River is 14.5%.
Women in Hood River earn 85.5 cents for every dollar earned by a man.
What is Inequality or Gini Index in Hood River?
Inequality or Gini Index in Hood River is 0.48.
What is the Total Population of Hood River?
Total Population of Hood River is 8,292.
What is the Total Male Population of Hood River?
Total Male Population of Hood River is 4,119.
What is the Total Female Population of Hood River?
Total Female Population of Hood River is 4,173.
What is the Ratio of Males per 100 Females in Hood River?
There are 98.71 Males per 100 Females in Hood River.
What is the Ratio of Females per 100 Males in Hood River?
There are 101.31 Females per 100 Males in Hood River.
What is the Median Population Age in Hood River?
Median Population Age in Hood River is 39.4 Years.
What is the Average Family Size in Hood River
Average Family Size in Hood River is 3.0 People.
What is the Average Household Size in Hood River
Average Household Size in Hood River is 2.2 People.
How Large is the Labor Force in Hood River?
There are 4,634 People in the Labor Forcein in Hood River.
What is the Percentage of People in the Labor Force in Hood River?
70.0% of People are in the Labor Force in Hood River.
What is the Unemployment Rate in Hood River?
Unemployment Rate in Hood River is 2.9%.