Junction City, OR Map & Demographics
Junction City Map
Junction City Overview
$32,459
PER CAPITA INCOME
$87,880
AVG FAMILY INCOME
$70,411
AVG HOUSEHOLD INCOME
26.7%
WAGE / INCOME GAP [ % ]
73.3¢/ $1
WAGE / INCOME GAP [ $ ]
$13,954
FAMILY INCOME DEFICIT
0.37
INEQUALITY / GINI INDEX
6,831
TOTAL POPULATION
3,435
MALE POPULATION
3,396
FEMALE POPULATION
101.15
MALES / 100 FEMALES
98.86
FEMALES / 100 MALES
38.5
MEDIAN AGE
2.9
AVG FAMILY SIZE
2.4
AVG HOUSEHOLD SIZE
3,760
LABOR FORCE [ PEOPLE ]
67.9%
PERCENT IN LABOR FORCE
6.0%
UNEMPLOYMENT RATE
Junction City Zip Codes
Junction City Area Codes
Income in Junction City
Income Overview in Junction City
Per Capita Income in Junction City is $32,459, while median incomes of families and households are $87,880 and $70,411 respectively.
| Characteristic | Number | Measure |
| Per Capita Income | 6,831 | $32,459 |
| Median Family Income | 1,804 | $87,880 |
| Mean Family Income | 1,804 | $88,175 |
| Median Household Income | 2,772 | $70,411 |
| Mean Household Income | 2,772 | $77,849 |
| Income Deficit | 1,804 | $13,954 |
| Wage / Income Gap (%) | 6,831 | 26.66% |
| Wage / Income Gap ($) | 6,831 | 73.34¢ per $1 |
| Gini / Inequality Index | 6,831 | 0.37 |
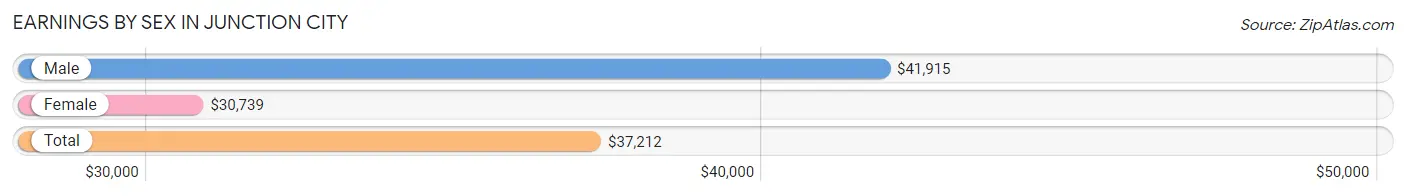
Earnings by Sex in Junction City
Average Earnings in Junction City are $37,212, $41,915 for men and $30,739 for women, a difference of 26.7%.
| Sex | Number | Average Earnings |
| Male | 2,009 (52.7%) | $41,915 |
| Female | 1,806 (47.3%) | $30,739 |
| Total | 3,815 (100.0%) | $37,212 |
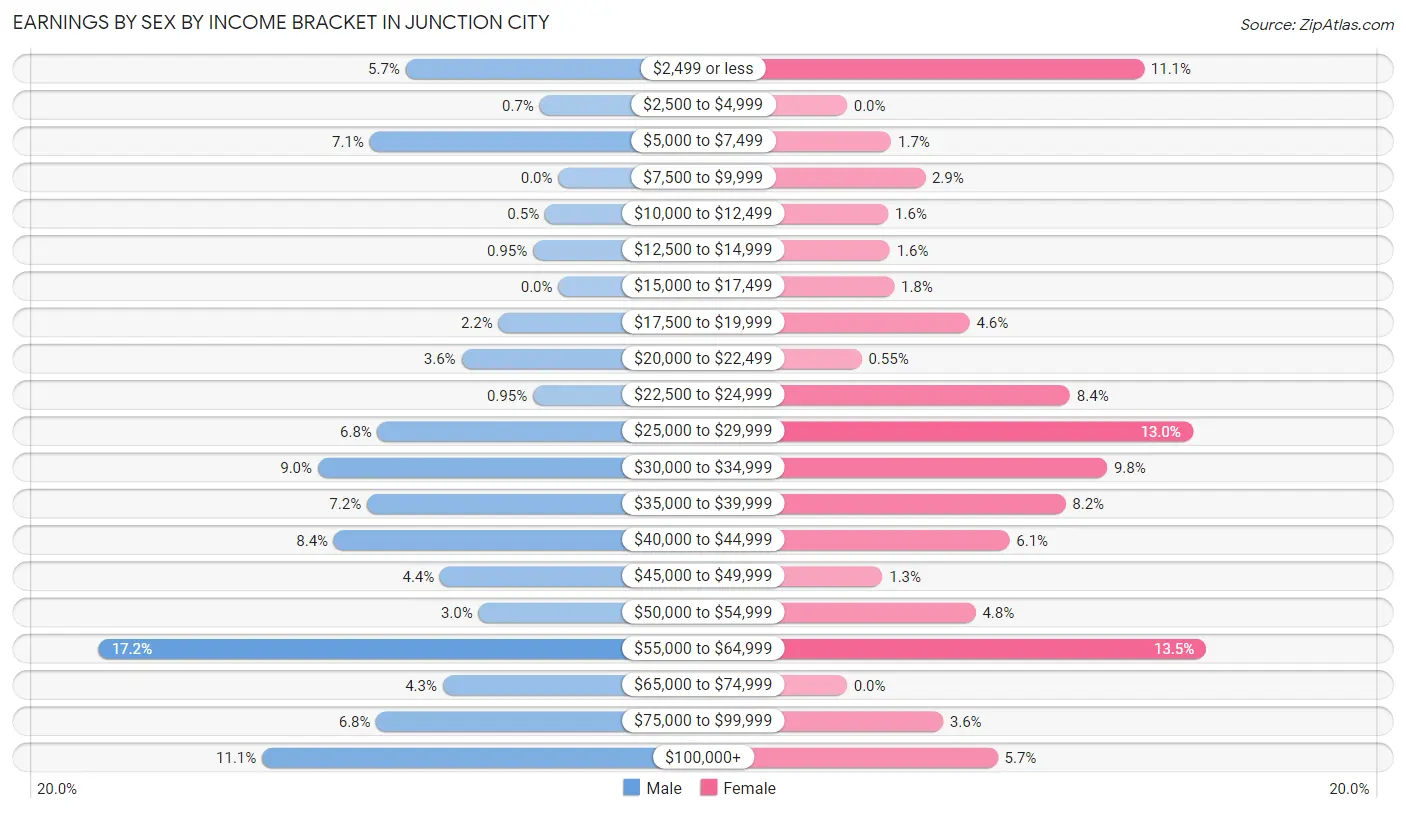
Earnings by Sex by Income Bracket in Junction City
The most common earnings brackets in Junction City are $55,000 to $64,999 for men (346 | 17.2%) and $55,000 to $64,999 for women (243 | 13.5%).
| Income | Male | Female |
| $2,499 or less | 115 (5.7%) | 201 (11.1%) |
| $2,500 to $4,999 | 14 (0.7%) | 0 (0.0%) |
| $5,000 to $7,499 | 142 (7.1%) | 30 (1.7%) |
| $7,500 to $9,999 | 0 (0.0%) | 53 (2.9%) |
| $10,000 to $12,499 | 10 (0.5%) | 28 (1.5%) |
| $12,500 to $14,999 | 19 (0.9%) | 29 (1.6%) |
| $15,000 to $17,499 | 0 (0.0%) | 32 (1.8%) |
| $17,500 to $19,999 | 45 (2.2%) | 83 (4.6%) |
| $20,000 to $22,499 | 73 (3.6%) | 10 (0.5%) |
| $22,500 to $24,999 | 19 (0.9%) | 151 (8.4%) |
| $25,000 to $29,999 | 136 (6.8%) | 234 (13.0%) |
| $30,000 to $34,999 | 181 (9.0%) | 176 (9.8%) |
| $35,000 to $39,999 | 144 (7.2%) | 148 (8.2%) |
| $40,000 to $44,999 | 169 (8.4%) | 110 (6.1%) |
| $45,000 to $49,999 | 89 (4.4%) | 24 (1.3%) |
| $50,000 to $54,999 | 60 (3.0%) | 87 (4.8%) |
| $55,000 to $64,999 | 346 (17.2%) | 243 (13.5%) |
| $65,000 to $74,999 | 87 (4.3%) | 0 (0.0%) |
| $75,000 to $99,999 | 137 (6.8%) | 65 (3.6%) |
| $100,000+ | 223 (11.1%) | 102 (5.7%) |
| Total | 2,009 (100.0%) | 1,806 (100.0%) |
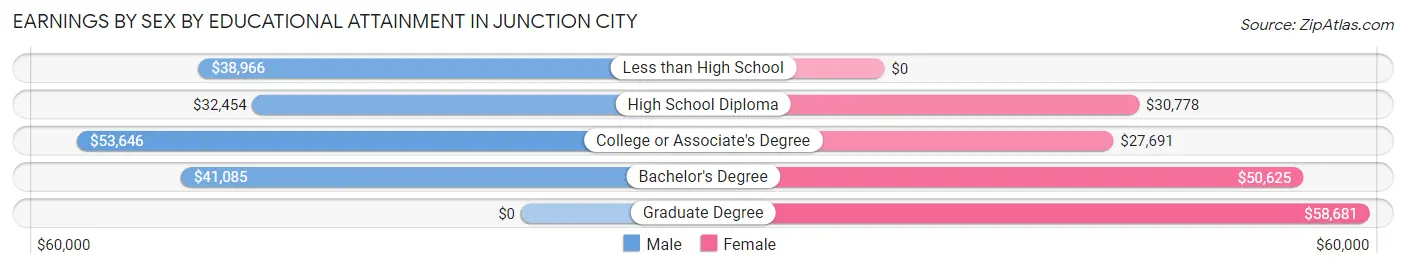
Earnings by Sex by Educational Attainment in Junction City
Average earnings in Junction City are $42,542 for men and $30,932 for women, a difference of 27.3%. Men with an educational attainment of college or associate's degree enjoy the highest average annual earnings of $53,646, while those with high school diploma education earn the least with $32,454. Women with an educational attainment of graduate degree earn the most with the average annual earnings of $58,681, while those with college or associate's degree education have the smallest earnings of $27,691.
| Educational Attainment | Male Income | Female Income |
| Less than High School | $38,966 | $0 |
| High School Diploma | $32,454 | $30,778 |
| College or Associate's Degree | $53,646 | $27,691 |
| Bachelor's Degree | $41,085 | $50,625 |
| Graduate Degree | - | - |
| Total | $42,542 | $30,932 |
Family Income in Junction City
Family Income Brackets in Junction City
According to the Junction City family income data, there are 532 families falling into the $100,000 to $149,999 income range, which is the most common income bracket and makes up 29.5% of all families. Conversely, the $15,000 to $24,999 income bracket is the least frequent group with only 11 families (0.6%) belonging to this category.
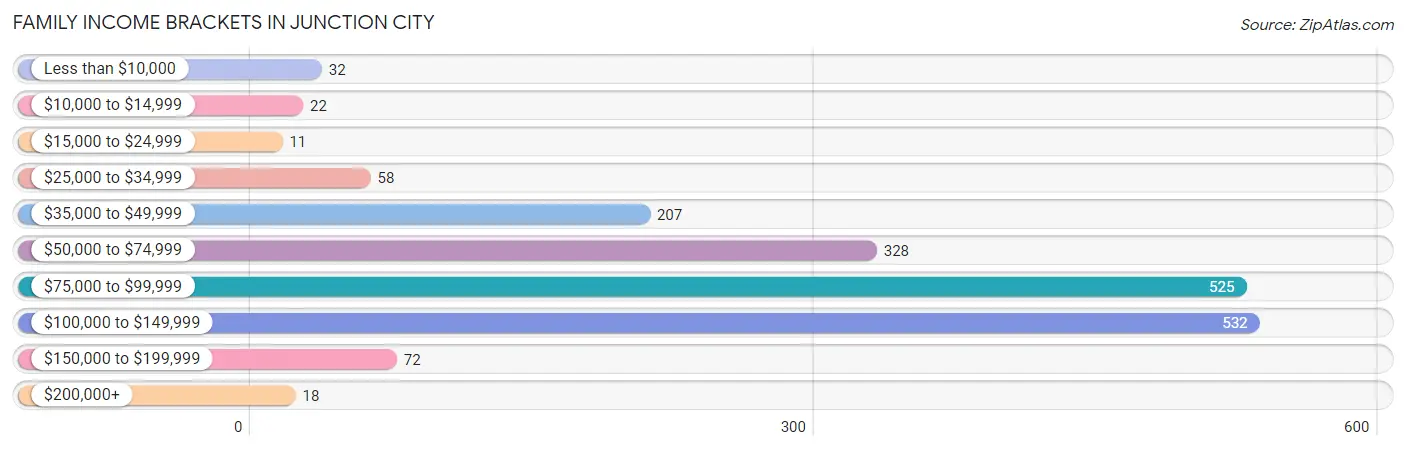
| Income Bracket | # Families | % Families |
| Less than $10,000 | 32 | 1.8% |
| $10,000 to $14,999 | 22 | 1.2% |
| $15,000 to $24,999 | 11 | 0.6% |
| $25,000 to $34,999 | 58 | 3.2% |
| $35,000 to $49,999 | 207 | 11.5% |
| $50,000 to $74,999 | 328 | 18.2% |
| $75,000 to $99,999 | 525 | 29.1% |
| $100,000 to $149,999 | 532 | 29.5% |
| $150,000 to $199,999 | 72 | 4.0% |
| $200,000+ | 18 | 1.0% |
Family Income by Famaliy Size in Junction City
4-person families (383 | 21.2%) account for the highest median family income in Junction City with $103,007 per family, while 2-person families (838 | 46.5%) have the highest median income of $38,400 per family member.
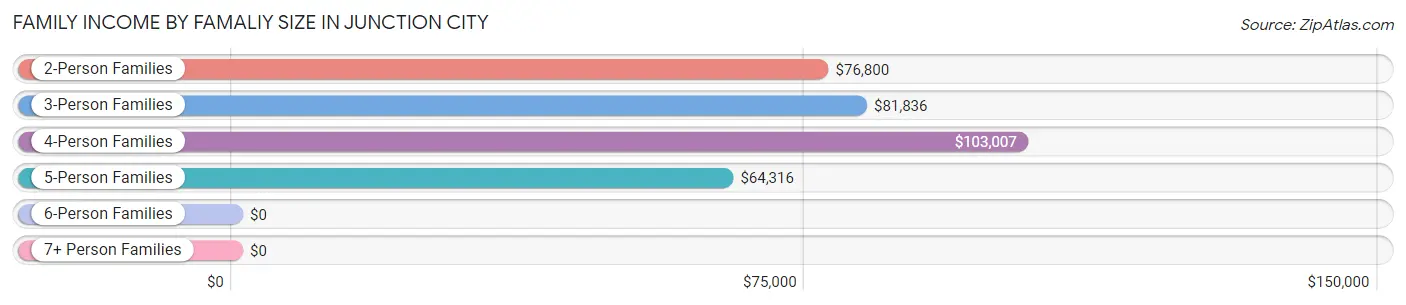
| Income Bracket | # Families | Median Income |
| 2-Person Families | 838 (46.5%) | $76,800 |
| 3-Person Families | 470 (26.1%) | $81,836 |
| 4-Person Families | 383 (21.2%) | $103,007 |
| 5-Person Families | 97 (5.4%) | $64,316 |
| 6-Person Families | 6 (0.3%) | $0 |
| 7+ Person Families | 10 (0.5%) | $0 |
| Total | 1,804 (100.0%) | $87,880 |
Family Income by Number of Earners in Junction City
The median family income in Junction City is $87,880, with families comprising 2 earners (1,042) having the highest median family income of $99,763, while families with 1 earner (322) have the lowest median family income of $46,713, accounting for 57.8% and 17.8% of families, respectively.
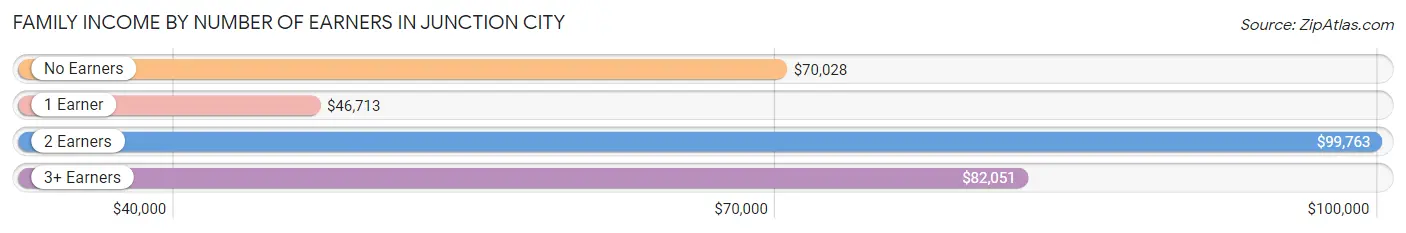
| Number of Earners | # Families | Median Income |
| No Earners | 195 (10.8%) | $70,028 |
| 1 Earner | 322 (17.8%) | $46,713 |
| 2 Earners | 1,042 (57.8%) | $99,763 |
| 3+ Earners | 245 (13.6%) | $82,051 |
| Total | 1,804 (100.0%) | $87,880 |
Household Income in Junction City
Household Income Brackets in Junction City
With 571 households falling in the category, the $75,000 to $99,999 income range is the most frequent in Junction City, accounting for 20.6% of all households. In contrast, only 64 households (2.3%) fall into the less than $10,000 income bracket, making it the least populous group.
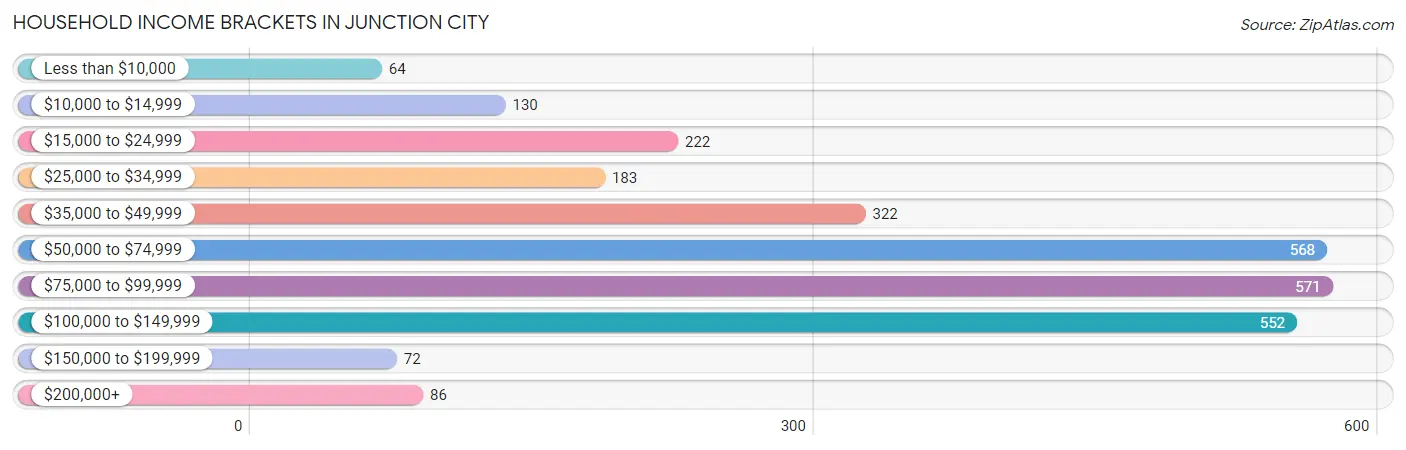
| Income Bracket | # Households | % Households |
| Less than $10,000 | 64 | 2.3% |
| $10,000 to $14,999 | 130 | 4.7% |
| $15,000 to $24,999 | 222 | 8.0% |
| $25,000 to $34,999 | 183 | 6.6% |
| $35,000 to $49,999 | 322 | 11.6% |
| $50,000 to $74,999 | 568 | 20.5% |
| $75,000 to $99,999 | 571 | 20.6% |
| $100,000 to $149,999 | 552 | 19.9% |
| $150,000 to $199,999 | 72 | 2.6% |
| $200,000+ | 86 | 3.1% |
Household Income by Householder Age in Junction City
The median household income in Junction City is $70,411, with the highest median household income of $250,001 found in the 15 to 24 years age bracket for the primary householder. A total of 103 households (3.7%) fall into this category. Meanwhile, the 65+ years age bracket for the primary householder has the lowest median household income of $46,690, with 799 households (28.8%) in this group.
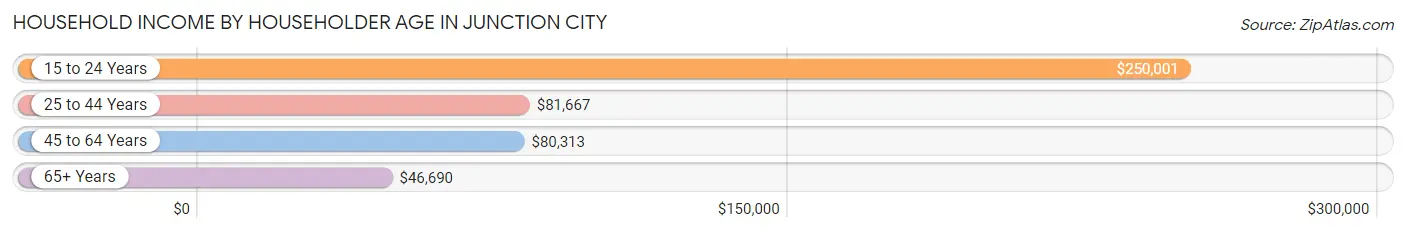
| Income Bracket | # Households | Median Income |
| 15 to 24 Years | 103 (3.7%) | $250,001 |
| 25 to 44 Years | 962 (34.7%) | $81,667 |
| 45 to 64 Years | 908 (32.8%) | $80,313 |
| 65+ Years | 799 (28.8%) | $46,690 |
| Total | 2,772 (100.0%) | $70,411 |
Poverty in Junction City
Income Below Poverty by Sex and Age in Junction City
With 5.8% poverty level for males and 11.6% for females among the residents of Junction City, 15 year old males and 5 year old females are the most vulnerable to poverty, with 44 males (52.4%) and 10 females (100.0%) in their respective age groups living below the poverty level.
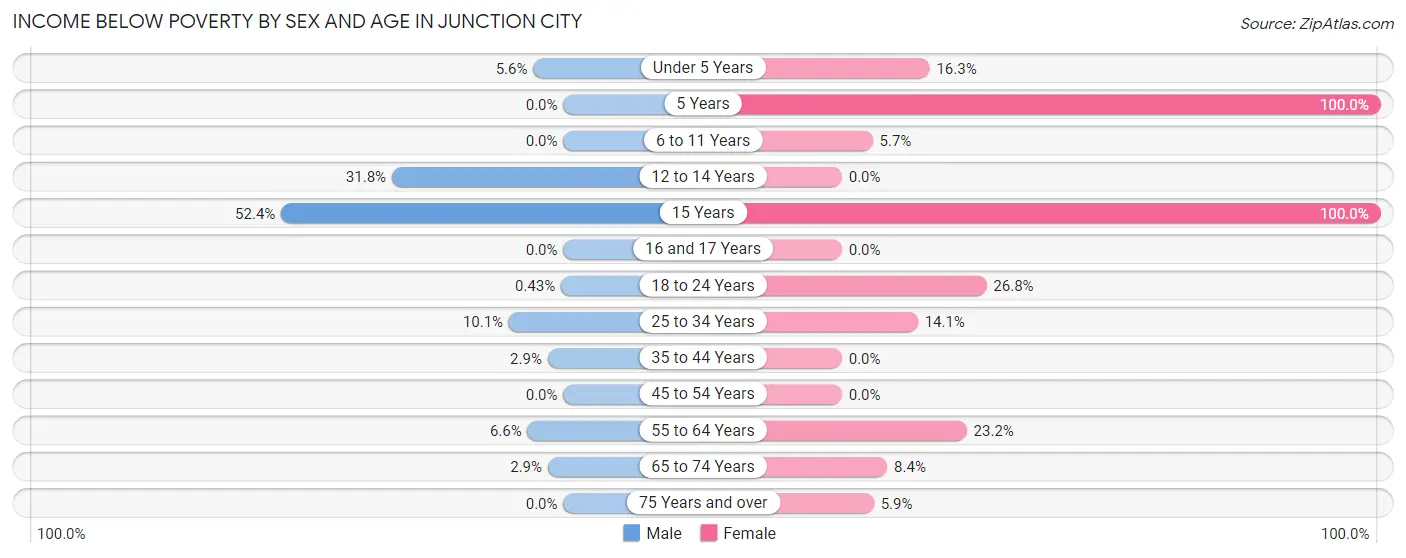
| Age Bracket | Male | Female |
| Under 5 Years | 13 (5.6%) | 14 (16.3%) |
| 5 Years | 0 (0.0%) | 10 (100.0%) |
| 6 to 11 Years | 0 (0.0%) | 10 (5.7%) |
| 12 to 14 Years | 21 (31.8%) | 0 (0.0%) |
| 15 Years | 44 (52.4%) | 56 (100.0%) |
| 16 and 17 Years | 0 (0.0%) | 0 (0.0%) |
| 18 to 24 Years | 1 (0.4%) | 51 (26.8%) |
| 25 to 34 Years | 61 (10.1%) | 92 (14.1%) |
| 35 to 44 Years | 14 (2.9%) | 0 (0.0%) |
| 45 to 54 Years | 0 (0.0%) | 0 (0.0%) |
| 55 to 64 Years | 29 (6.6%) | 105 (23.2%) |
| 65 to 74 Years | 9 (2.9%) | 25 (8.4%) |
| 75 Years and over | 0 (0.0%) | 21 (5.9%) |
| Total | 192 (5.8%) | 384 (11.6%) |
Income Above Poverty by Sex and Age in Junction City
According to the poverty statistics in Junction City, males aged 5 years and females aged 12 to 14 years are the age groups that are most secure financially, with 100.0% of males and 100.0% of females in these age groups living above the poverty line.
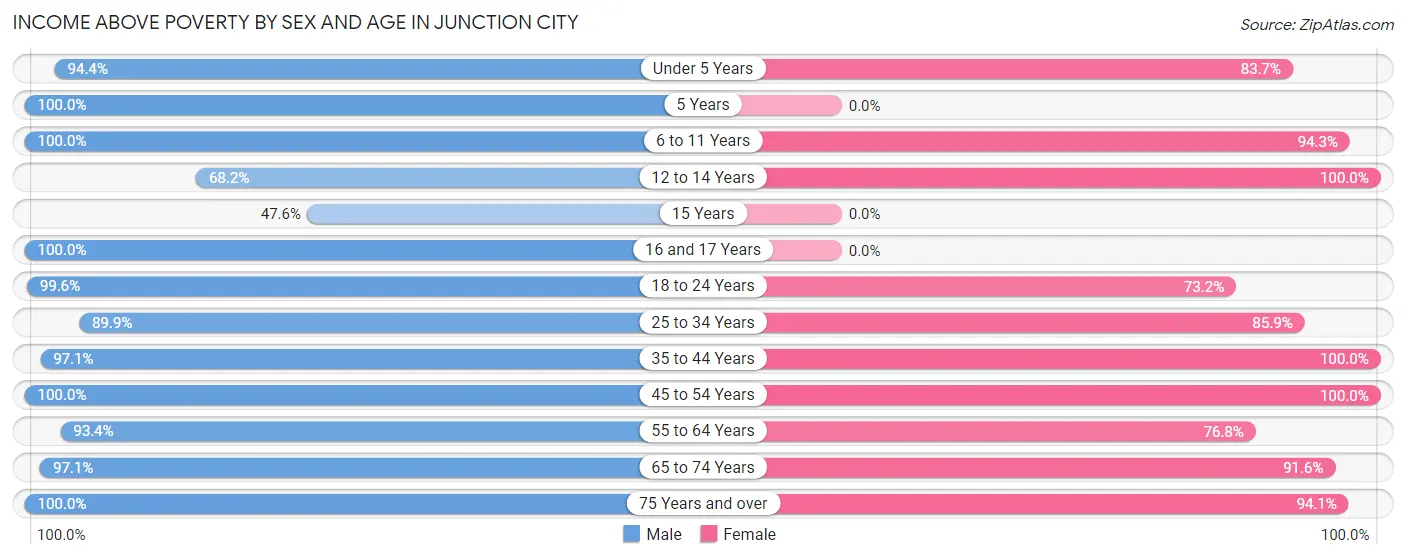
| Age Bracket | Male | Female |
| Under 5 Years | 220 (94.4%) | 72 (83.7%) |
| 5 Years | 101 (100.0%) | 0 (0.0%) |
| 6 to 11 Years | 202 (100.0%) | 165 (94.3%) |
| 12 to 14 Years | 45 (68.2%) | 181 (100.0%) |
| 15 Years | 40 (47.6%) | 0 (0.0%) |
| 16 and 17 Years | 99 (100.0%) | 0 (0.0%) |
| 18 to 24 Years | 234 (99.6%) | 139 (73.2%) |
| 25 to 34 Years | 543 (89.9%) | 561 (85.9%) |
| 35 to 44 Years | 468 (97.1%) | 459 (100.0%) |
| 45 to 54 Years | 300 (100.0%) | 406 (100.0%) |
| 55 to 64 Years | 408 (93.4%) | 348 (76.8%) |
| 65 to 74 Years | 305 (97.1%) | 272 (91.6%) |
| 75 Years and over | 158 (100.0%) | 334 (94.1%) |
| Total | 3,123 (94.2%) | 2,937 (88.4%) |
Income Below Poverty Among Married-Couple Families in Junction City
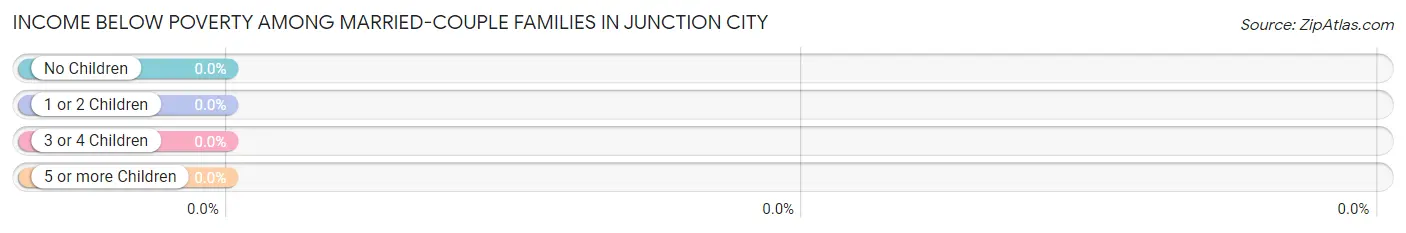
| Children | Above Poverty | Below Poverty |
| No Children | 727 (100.0%) | 0 (0.0%) |
| 1 or 2 Children | 541 (100.0%) | 0 (0.0%) |
| 3 or 4 Children | 20 (100.0%) | 0 (0.0%) |
| 5 or more Children | 0 (0.0%) | 0 (0.0%) |
| Total | 1,288 (100.0%) | 0 (0.0%) |
Income Below Poverty Among Single-Parent Households in Junction City
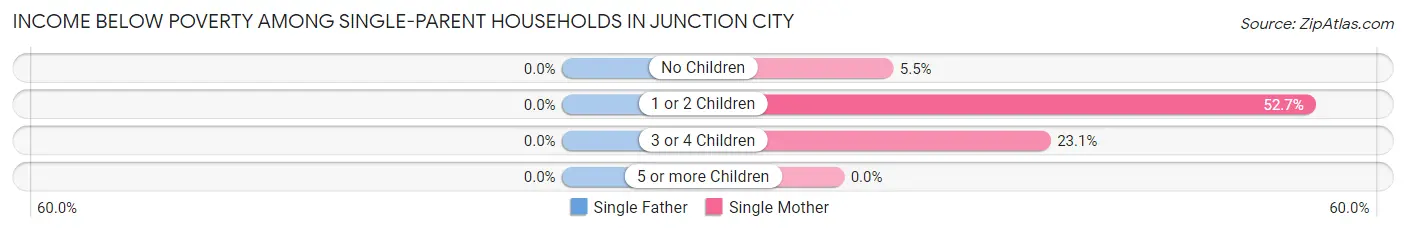
| Children | Single Father | Single Mother |
| No Children | 0 (0.0%) | 16 (5.5%) |
| 1 or 2 Children | 0 (0.0%) | 29 (52.7%) |
| 3 or 4 Children | 0 (0.0%) | 9 (23.1%) |
| 5 or more Children | 0 (0.0%) | 0 (0.0%) |
| Total | 0 (0.0%) | 54 (14.0%) |
Income Below Poverty Among Married-Couple vs Single-Parent Households in Junction City
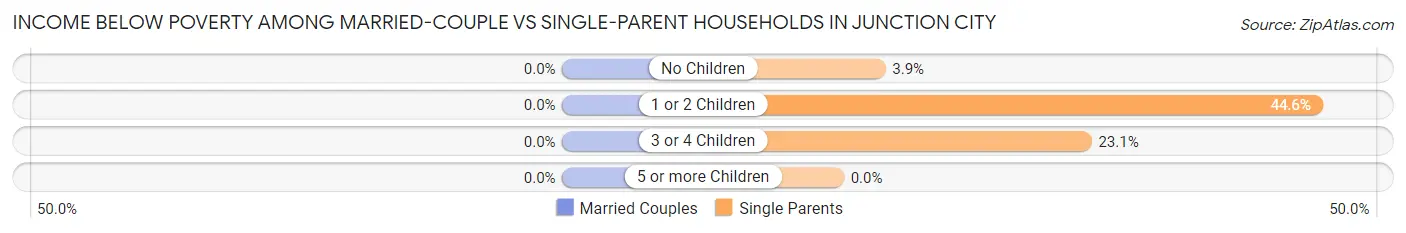
| Children | Married-Couple Families | Single-Parent Households |
| No Children | 0 (0.0%) | 16 (3.9%) |
| 1 or 2 Children | 0 (0.0%) | 29 (44.6%) |
| 3 or 4 Children | 0 (0.0%) | 9 (23.1%) |
| 5 or more Children | 0 (0.0%) | 0 (0.0%) |
| Total | 0 (0.0%) | 54 (10.5%) |
Race in Junction City
The most populous races in Junction City are White / Caucasian (6,217 | 91.0%), Hispanic or Latino (807 | 11.8%), and Two or more Races (433 | 6.3%).
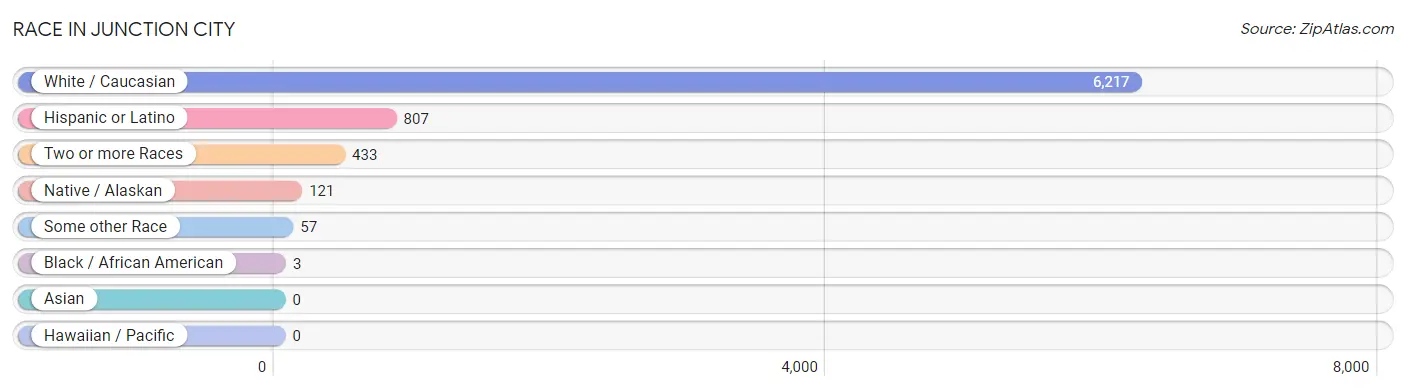
| Race | # Population | % Population |
| Asian | 0 | 0.0% |
| Black / African American | 3 | 0.0% |
| Hawaiian / Pacific | 0 | 0.0% |
| Hispanic or Latino | 807 | 11.8% |
| Native / Alaskan | 121 | 1.8% |
| White / Caucasian | 6,217 | 91.0% |
| Two or more Races | 433 | 6.3% |
| Some other Race | 57 | 0.8% |
| Total | 6,831 | 100.0% |
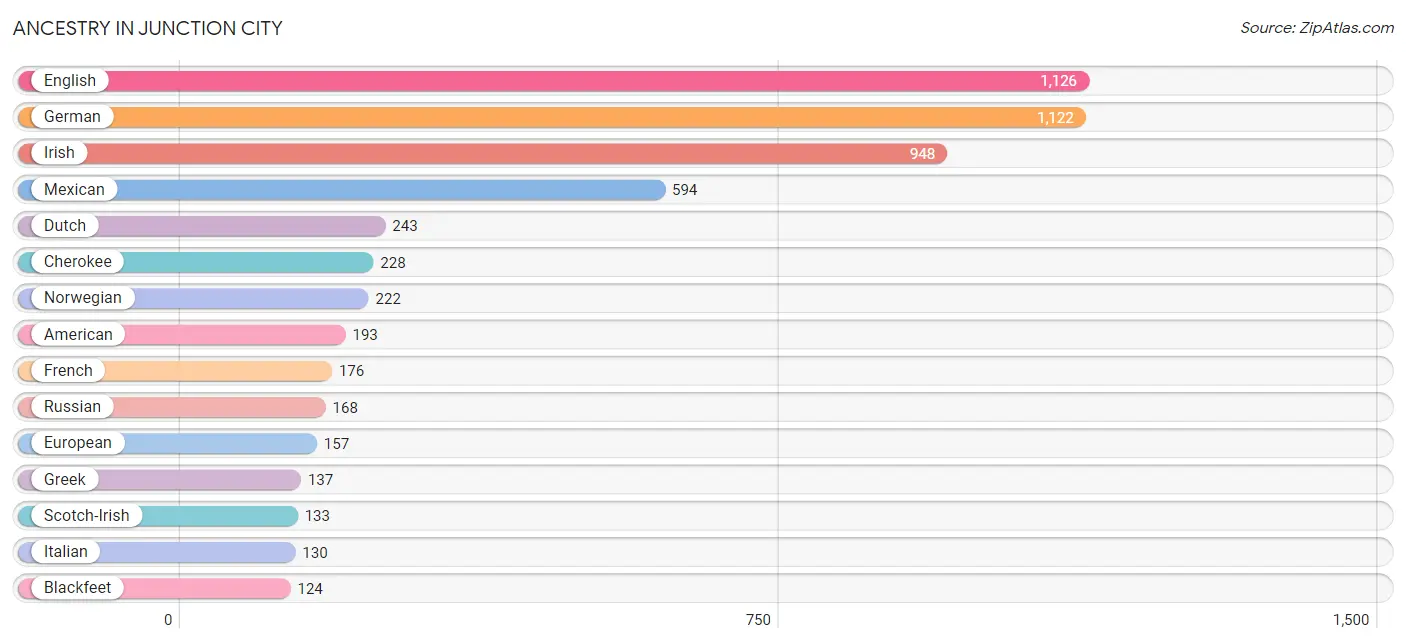
Ancestry in Junction City
The most populous ancestries reported in Junction City are English (1,126 | 16.5%), German (1,122 | 16.4%), Irish (948 | 13.9%), Mexican (594 | 8.7%), and Dutch (243 | 3.6%), together accounting for 59.0% of all Junction City residents.
| Ancestry | # Population | % Population |
| American | 193 | 2.8% |
| Arab | 1 | 0.0% |
| Austrian | 73 | 1.1% |
| Bhutanese | 1 | 0.0% |
| Blackfeet | 124 | 1.8% |
| British | 120 | 1.8% |
| Burmese | 1 | 0.0% |
| Canadian | 14 | 0.2% |
| Cherokee | 228 | 3.3% |
| Chippewa | 23 | 0.3% |
| Choctaw | 48 | 0.7% |
| Czechoslovakian | 27 | 0.4% |
| Danish | 35 | 0.5% |
| Dutch | 243 | 3.6% |
| Egyptian | 1 | 0.0% |
| English | 1,126 | 16.5% |
| European | 157 | 2.3% |
| Finnish | 24 | 0.4% |
| French | 176 | 2.6% |
| French Canadian | 20 | 0.3% |
| German | 1,122 | 16.4% |
| Greek | 137 | 2.0% |
| Hungarian | 72 | 1.1% |
| Irish | 948 | 13.9% |
| Italian | 130 | 1.9% |
| Mexican | 594 | 8.7% |
| Mexican American Indian | 116 | 1.7% |
| Northern European | 21 | 0.3% |
| Norwegian | 222 | 3.3% |
| Polish | 86 | 1.3% |
| Portuguese | 97 | 1.4% |
| Puerto Rican | 37 | 0.5% |
| Romanian | 23 | 0.3% |
| Russian | 168 | 2.5% |
| Scandinavian | 99 | 1.5% |
| Scotch-Irish | 133 | 1.9% |
| Scottish | 59 | 0.9% |
| Spaniard | 117 | 1.7% |
| Spanish | 49 | 0.7% |
| Sri Lankan | 2 | 0.0% |
| Swedish | 97 | 1.4% |
| Swiss | 15 | 0.2% |
| Ukrainian | 37 | 0.5% |
| Welsh | 15 | 0.2% | View All 44 Rows |
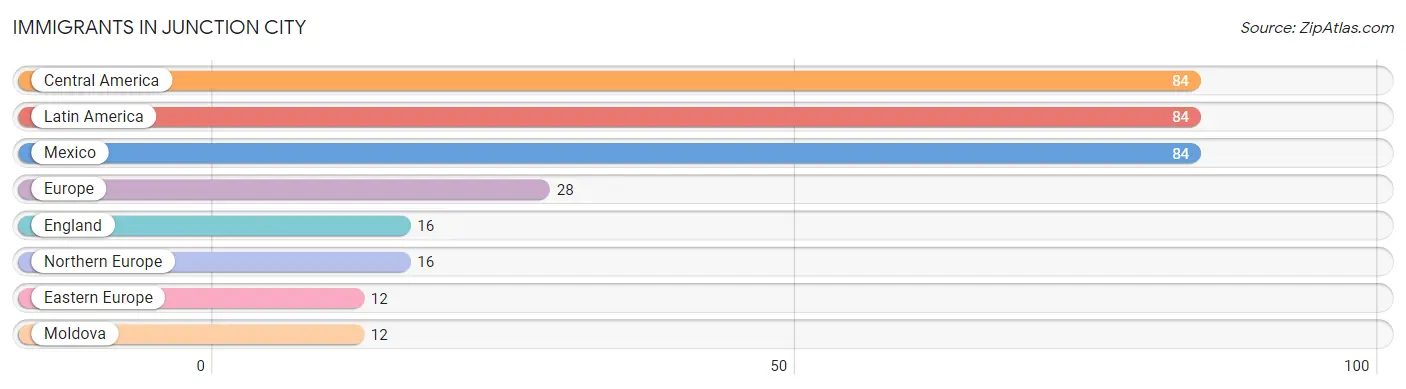
Immigrants in Junction City
The most numerous immigrant groups reported in Junction City came from Central America (84 | 1.2%), Latin America (84 | 1.2%), Mexico (84 | 1.2%), Europe (28 | 0.4%), and England (16 | 0.2%), together accounting for 4.3% of all Junction City residents.
| Immigration Origin | # Population | % Population |
| Central America | 84 | 1.2% |
| Eastern Europe | 12 | 0.2% |
| England | 16 | 0.2% |
| Europe | 28 | 0.4% |
| Latin America | 84 | 1.2% |
| Mexico | 84 | 1.2% |
| Moldova | 12 | 0.2% |
| Northern Europe | 16 | 0.2% | View All 8 Rows |
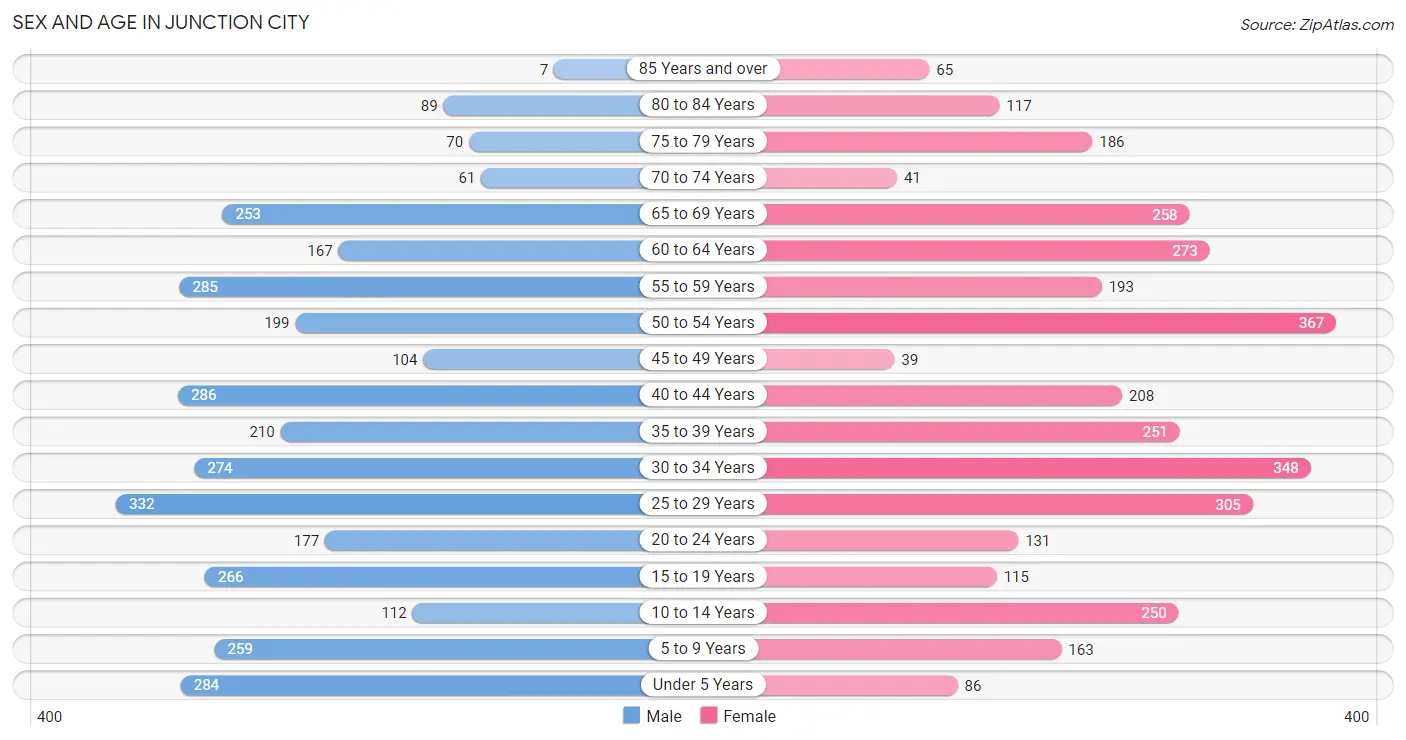
Sex and Age in Junction City
Sex and Age in Junction City
The most populous age groups in Junction City are 25 to 29 Years (332 | 9.7%) for men and 50 to 54 Years (367 | 10.8%) for women.
| Age Bracket | Male | Female |
| Under 5 Years | 284 (8.3%) | 86 (2.5%) |
| 5 to 9 Years | 259 (7.5%) | 163 (4.8%) |
| 10 to 14 Years | 112 (3.3%) | 250 (7.4%) |
| 15 to 19 Years | 266 (7.7%) | 115 (3.4%) |
| 20 to 24 Years | 177 (5.1%) | 131 (3.9%) |
| 25 to 29 Years | 332 (9.7%) | 305 (9.0%) |
| 30 to 34 Years | 274 (8.0%) | 348 (10.2%) |
| 35 to 39 Years | 210 (6.1%) | 251 (7.4%) |
| 40 to 44 Years | 286 (8.3%) | 208 (6.1%) |
| 45 to 49 Years | 104 (3.0%) | 39 (1.1%) |
| 50 to 54 Years | 199 (5.8%) | 367 (10.8%) |
| 55 to 59 Years | 285 (8.3%) | 193 (5.7%) |
| 60 to 64 Years | 167 (4.9%) | 273 (8.0%) |
| 65 to 69 Years | 253 (7.4%) | 258 (7.6%) |
| 70 to 74 Years | 61 (1.8%) | 41 (1.2%) |
| 75 to 79 Years | 70 (2.0%) | 186 (5.5%) |
| 80 to 84 Years | 89 (2.6%) | 117 (3.5%) |
| 85 Years and over | 7 (0.2%) | 65 (1.9%) |
| Total | 3,435 (100.0%) | 3,396 (100.0%) |
Families and Households in Junction City
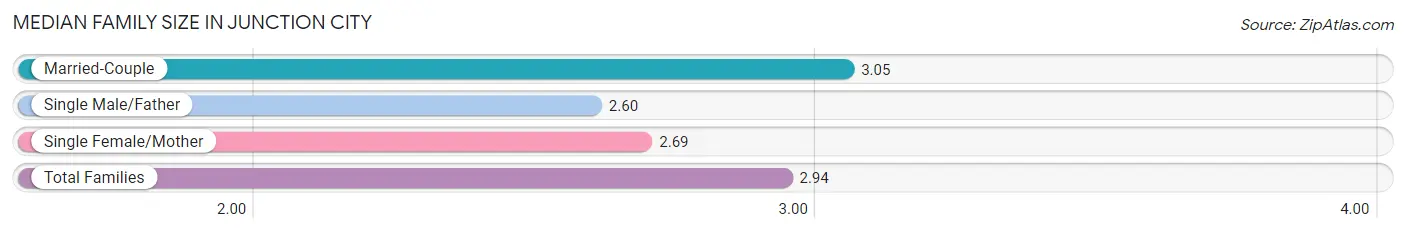
Median Family Size in Junction City
The median family size in Junction City is 2.94 persons per family, with married-couple families (1,288 | 71.4%) accounting for the largest median family size of 3.05 persons per family. On the other hand, single male/father families (131 | 7.3%) represent the smallest median family size with 2.60 persons per family.
| Family Type | # Families | Family Size |
| Married-Couple | 1,288 (71.4%) | 3.05 |
| Single Male/Father | 131 (7.3%) | 2.60 |
| Single Female/Mother | 385 (21.3%) | 2.69 |
| Total Families | 1,804 (100.0%) | 2.94 |
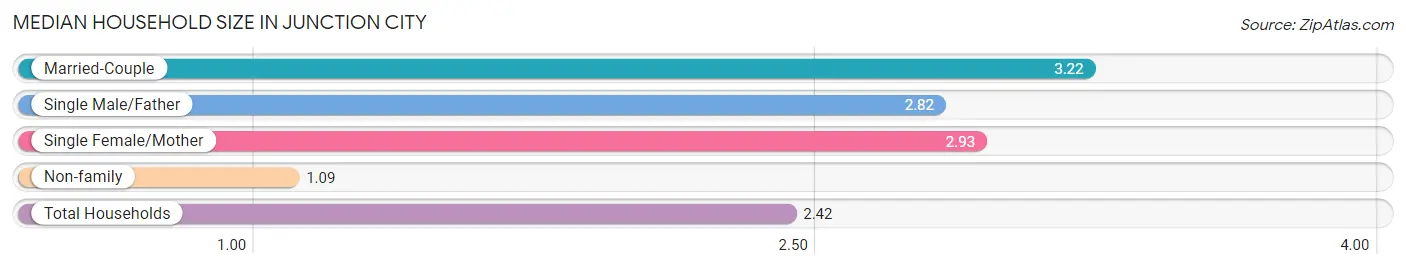
Median Household Size in Junction City
The median household size in Junction City is 2.42 persons per household, with married-couple households (1,288 | 46.5%) accounting for the largest median household size of 3.22 persons per household. non-family households (968 | 34.9%) represent the smallest median household size with 1.09 persons per household.
| Household Type | # Households | Household Size |
| Married-Couple | 1,288 (46.5%) | 3.22 |
| Single Male/Father | 131 (4.7%) | 2.82 |
| Single Female/Mother | 385 (13.9%) | 2.93 |
| Non-family | 968 (34.9%) | 1.09 |
| Total Households | 2,772 (100.0%) | 2.42 |
Household Size by Marriage Status in Junction City
Out of a total of 2,772 households in Junction City, 1,804 (65.1%) are family households, while 968 (34.9%) are nonfamily households. The most numerous type of family households are 2-person households, comprising 797, and the most common type of nonfamily households are 1-person households, comprising 877.
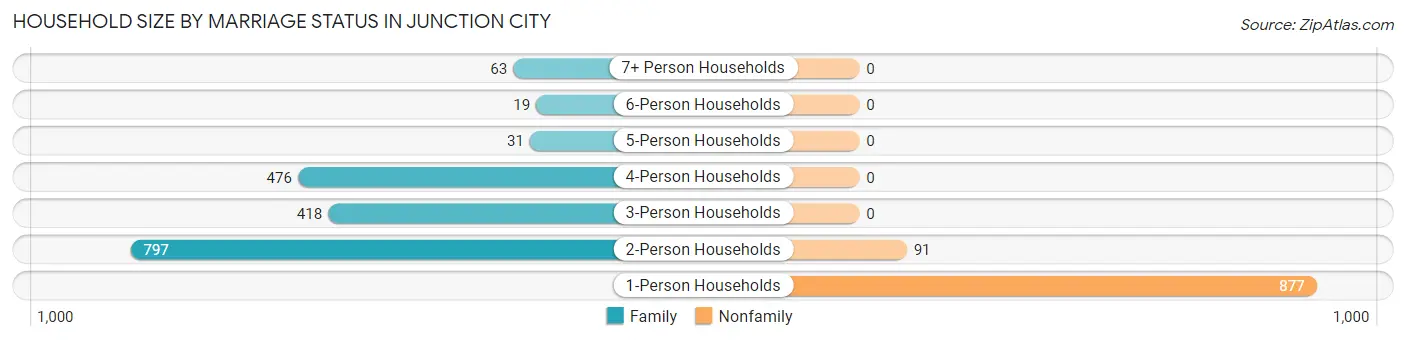
| Household Size | Family Households | Nonfamily Households |
| 1-Person Households | - | 877 (31.6%) |
| 2-Person Households | 797 (28.7%) | 91 (3.3%) |
| 3-Person Households | 418 (15.1%) | 0 (0.0%) |
| 4-Person Households | 476 (17.2%) | 0 (0.0%) |
| 5-Person Households | 31 (1.1%) | 0 (0.0%) |
| 6-Person Households | 19 (0.7%) | 0 (0.0%) |
| 7+ Person Households | 63 (2.3%) | 0 (0.0%) |
| Total | 1,804 (65.1%) | 968 (34.9%) |
Female Fertility in Junction City
Fertility by Age in Junction City
Average fertility rate in Junction City is 11.0 births per 1,000 women. Women in the age bracket of 20 to 34 years have the highest fertility rate with 19.0 births per 1,000 women. Women in the age bracket of 20 to 34 years acount for 100.0% of all women with births.
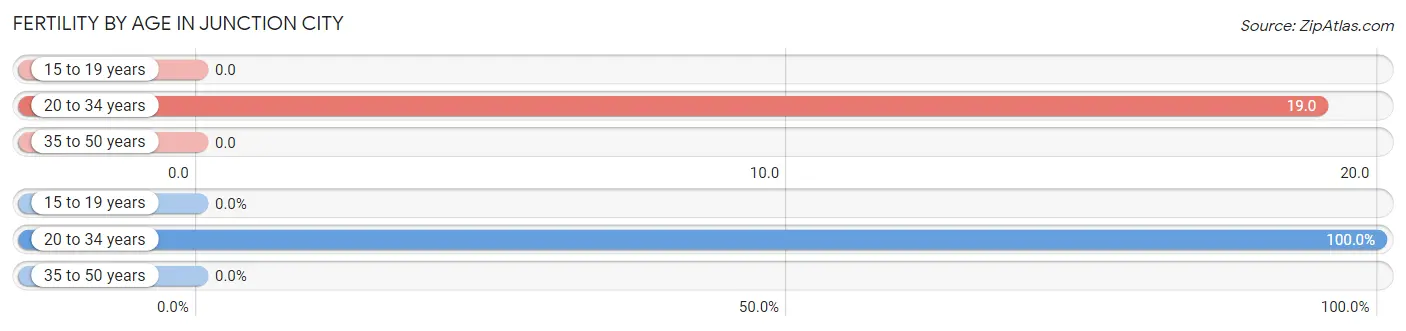
| Age Bracket | Women with Births | Births / 1,000 Women |
| 15 to 19 years | 0 (0.0%) | 0.0 |
| 20 to 34 years | 15 (100.0%) | 19.0 |
| 35 to 50 years | 0 (0.0%) | 0.0 |
| Total | 15 (100.0%) | 11.0 |
Fertility by Age by Marriage Status in Junction City
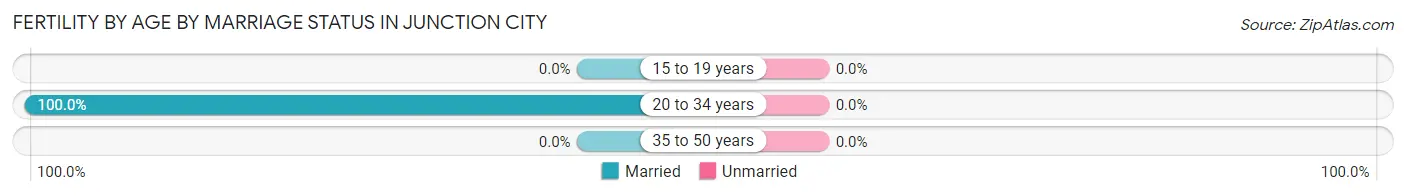
| Age Bracket | Married | Unmarried |
| 15 to 19 years | 0 (0.0%) | 0 (0.0%) |
| 20 to 34 years | 15 (100.0%) | 0 (0.0%) |
| 35 to 50 years | 0 (0.0%) | 0 (0.0%) |
| Total | 15 (100.0%) | 0 (0.0%) |
Fertility by Education in Junction City
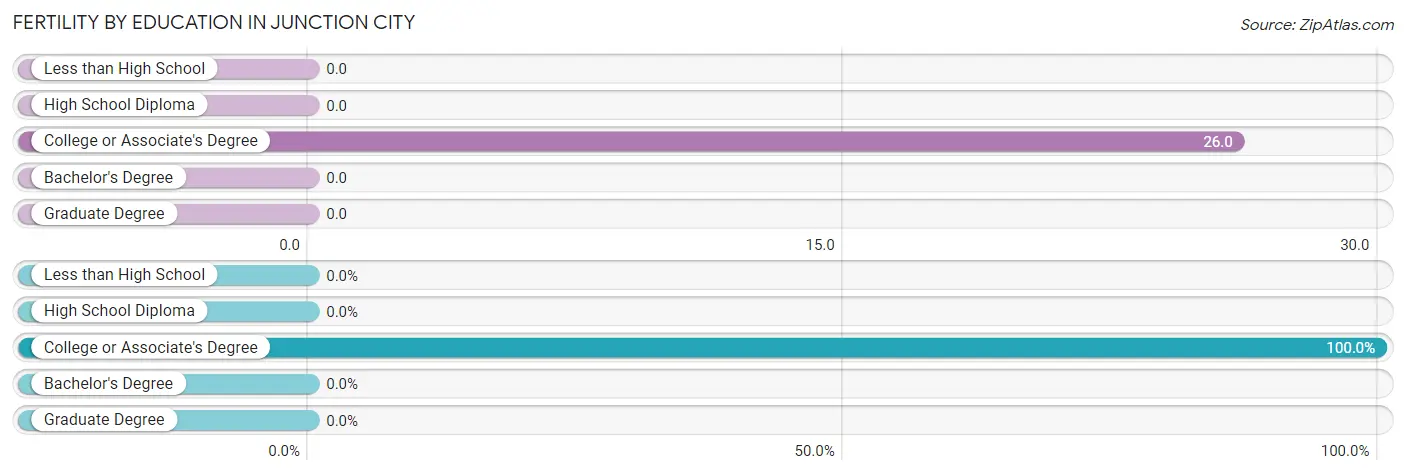
| Educational Attainment | Women with Births | Births / 1,000 Women |
| Less than High School | 0 (0.0%) | 0.0 |
| High School Diploma | 0 (0.0%) | 0.0 |
| College or Associate's Degree | 15 (100.0%) | 26.0 |
| Bachelor's Degree | 0 (0.0%) | 0.0 |
| Graduate Degree | 0 (0.0%) | 0.0 |
| Total | 15 (100.0%) | 11.0 |
Fertility by Education by Marriage Status in Junction City
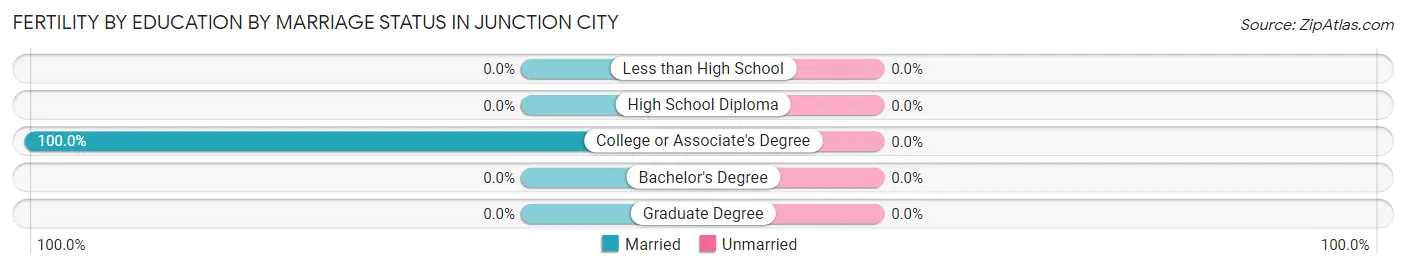
| Educational Attainment | Married | Unmarried |
| Less than High School | 0 (0.0%) | 0 (0.0%) |
| High School Diploma | 0 (0.0%) | 0 (0.0%) |
| College or Associate's Degree | 15 (100.0%) | 0 (0.0%) |
| Bachelor's Degree | 0 (0.0%) | 0 (0.0%) |
| Graduate Degree | 0 (0.0%) | 0 (0.0%) |
| Total | 15 (100.0%) | 0 (0.0%) |
Employment Characteristics in Junction City
Employment by Class of Employer in Junction City
Among the 3,536 employed individuals in Junction City, private company employees (2,074 | 58.7%), state government employees (355 | 10.0%), and local government employees (343 | 9.7%) make up the most common classes of employment.
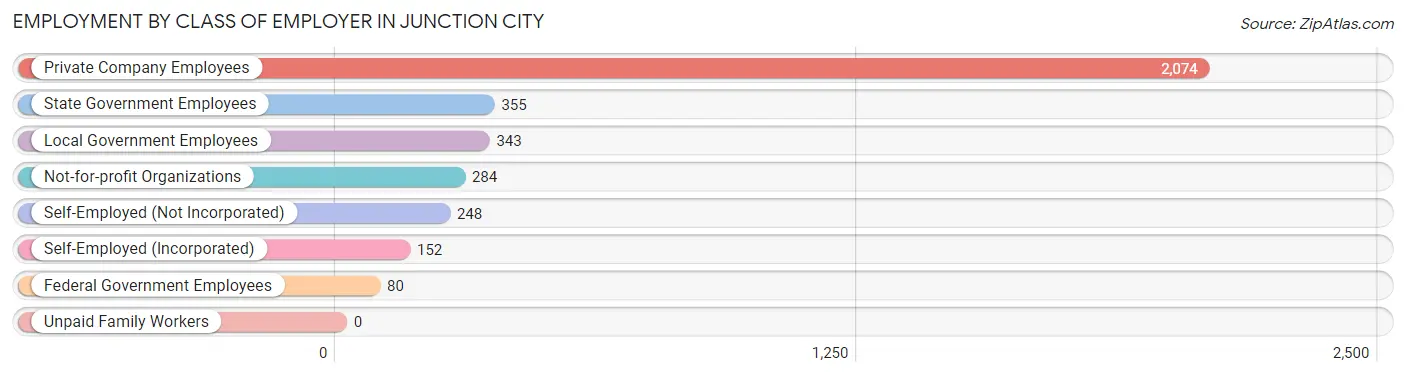
| Employer Class | # Employees | % Employees |
| Private Company Employees | 2,074 | 58.7% |
| Self-Employed (Incorporated) | 152 | 4.3% |
| Self-Employed (Not Incorporated) | 248 | 7.0% |
| Not-for-profit Organizations | 284 | 8.0% |
| Local Government Employees | 343 | 9.7% |
| State Government Employees | 355 | 10.0% |
| Federal Government Employees | 80 | 2.3% |
| Unpaid Family Workers | 0 | 0.0% |
| Total | 3,536 | 100.0% |
Employment Status by Age in Junction City
According to the labor force statistics for Junction City, out of the total population over 16 years of age (5,537), 67.9% or 3,760 individuals are in the labor force, with 6.0% or 226 of them unemployed. The age group with the highest labor force participation rate is 55 to 59 years, with 97.5% or 466 individuals in the labor force. Within the labor force, the 30 to 34 years age range has the highest percentage of unemployed individuals, with 24.0% or 116 of them being unemployed.
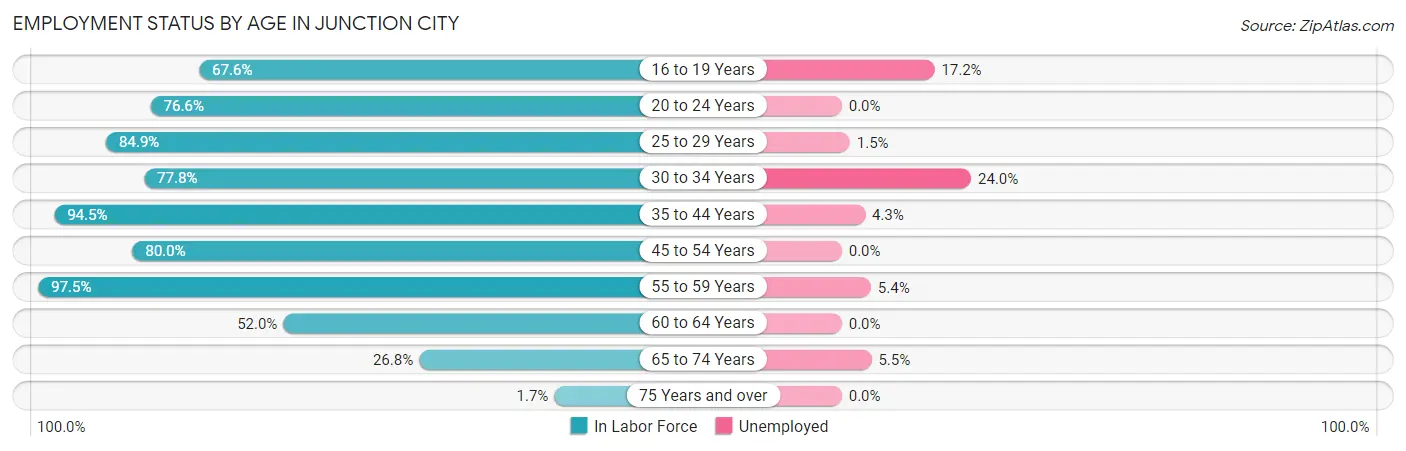
| Age Bracket | In Labor Force | Unemployed |
| 16 to 19 Years | 163 (67.6%) | 28 (17.2%) |
| 20 to 24 Years | 236 (76.6%) | 0 (0.0%) |
| 25 to 29 Years | 541 (84.9%) | 8 (1.5%) |
| 30 to 34 Years | 484 (77.8%) | 116 (24.0%) |
| 35 to 44 Years | 902 (94.5%) | 39 (4.3%) |
| 45 to 54 Years | 567 (80.0%) | 0 (0.0%) |
| 55 to 59 Years | 466 (97.5%) | 25 (5.4%) |
| 60 to 64 Years | 229 (52.0%) | 0 (0.0%) |
| 65 to 74 Years | 164 (26.8%) | 9 (5.5%) |
| 75 Years and over | 9 (1.7%) | 0 (0.0%) |
| Total | 3,760 (67.9%) | 226 (6.0%) |
Employment Status by Educational Attainment in Junction City
According to labor force statistics for Junction City, 83.0% of individuals (3,188) out of the total population between 25 and 64 years of age (3,841) are in the labor force, with 5.9% or 188 of them being unemployed. The group with the highest labor force participation rate are those with the educational attainment of bachelor's degree or higher, with 88.6% or 653 individuals in the labor force. Within the labor force, individuals with bachelor's degree or higher education have the highest percentage of unemployment, with 8.9% or 58 of them being unemployed.
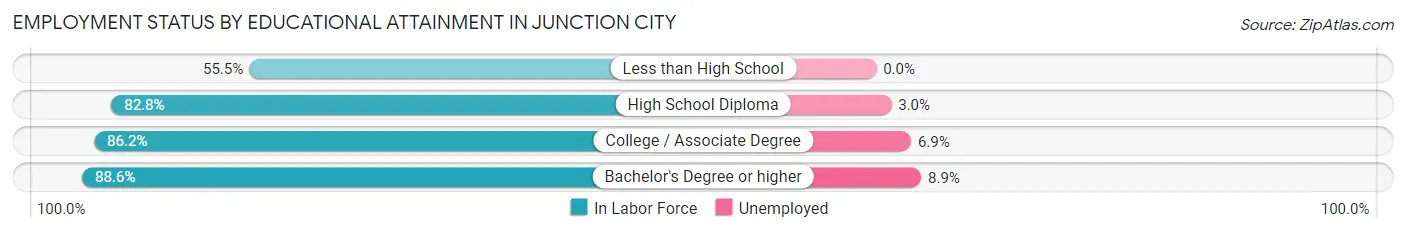
| Educational Attainment | In Labor Force | Unemployed |
| Less than High School | 192 (55.5%) | 0 (0.0%) |
| High School Diploma | 807 (82.8%) | 29 (3.0%) |
| College / Associate Degree | 1,537 (86.2%) | 123 (6.9%) |
| Bachelor's Degree or higher | 653 (88.6%) | 66 (8.9%) |
| Total | 3,188 (83.0%) | 227 (5.9%) |
Employment Occupations by Sex in Junction City
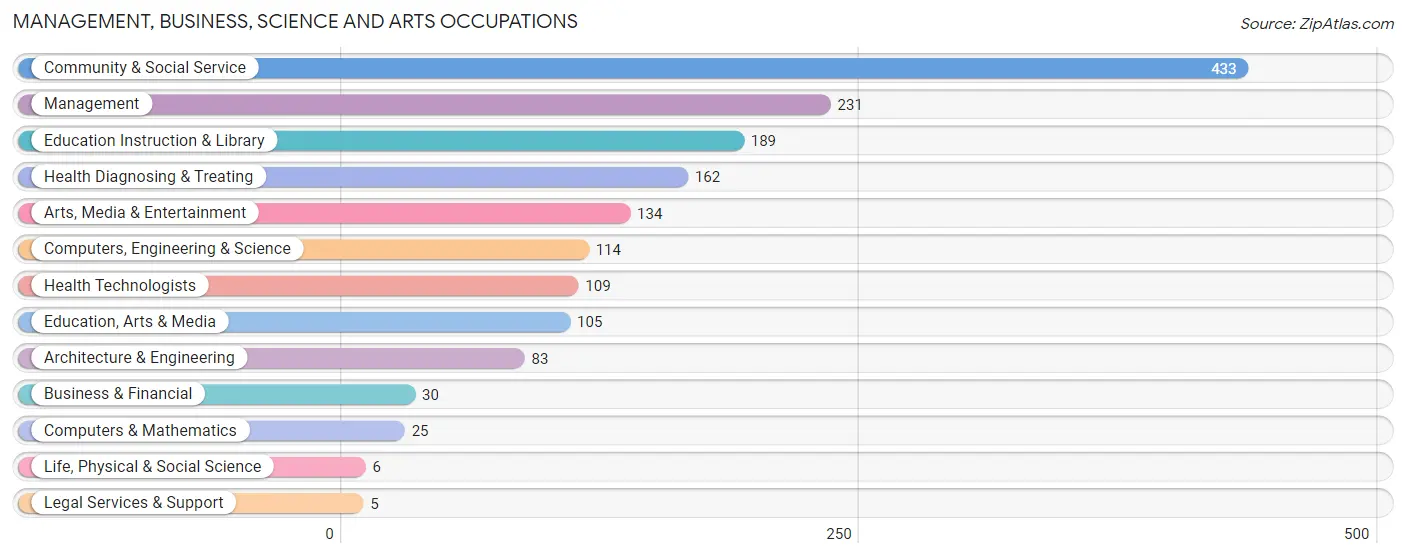
Management, Business, Science and Arts Occupations
The most common Management, Business, Science and Arts occupations in Junction City are Community & Social Service (433 | 12.2%), Management (231 | 6.5%), Education Instruction & Library (189 | 5.3%), Health Diagnosing & Treating (162 | 4.6%), and Arts, Media & Entertainment (134 | 3.8%).
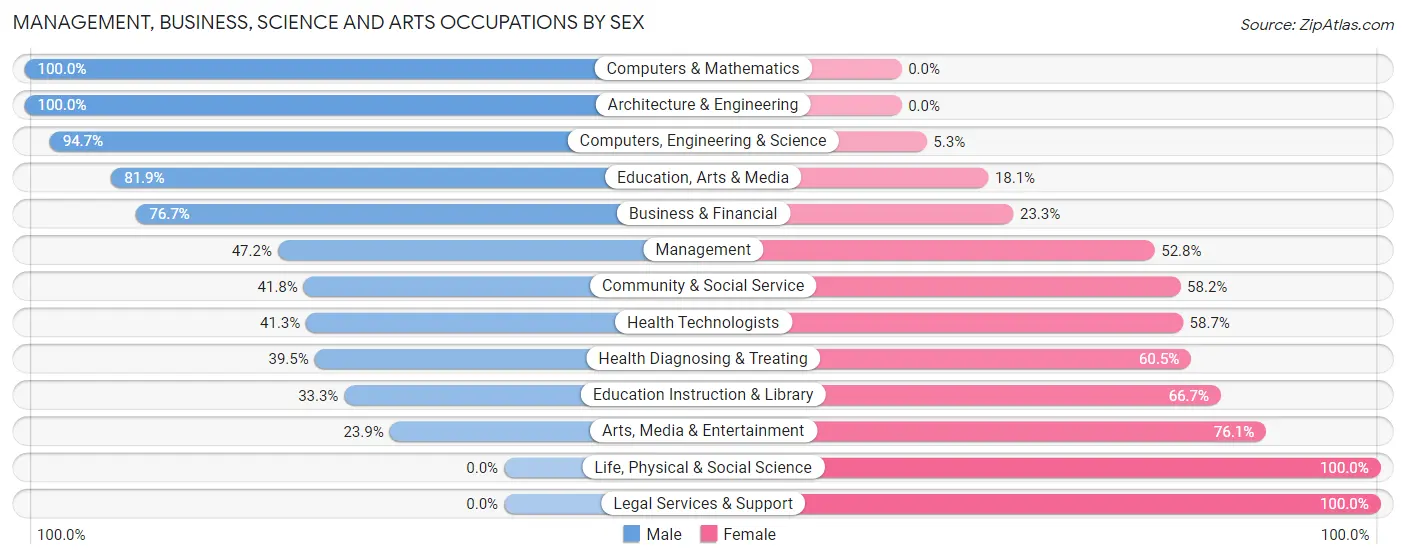
Management, Business, Science and Arts Occupations by Sex
Within the Management, Business, Science and Arts occupations in Junction City, the most male-oriented occupations are Computers & Mathematics (100.0%), Architecture & Engineering (100.0%), and Computers, Engineering & Science (94.7%), while the most female-oriented occupations are Life, Physical & Social Science (100.0%), Legal Services & Support (100.0%), and Arts, Media & Entertainment (76.1%).
| Occupation | Male | Female |
| Management | 109 (47.2%) | 122 (52.8%) |
| Business & Financial | 23 (76.7%) | 7 (23.3%) |
| Computers, Engineering & Science | 108 (94.7%) | 6 (5.3%) |
| Computers & Mathematics | 25 (100.0%) | 0 (0.0%) |
| Architecture & Engineering | 83 (100.0%) | 0 (0.0%) |
| Life, Physical & Social Science | 0 (0.0%) | 6 (100.0%) |
| Community & Social Service | 181 (41.8%) | 252 (58.2%) |
| Education, Arts & Media | 86 (81.9%) | 19 (18.1%) |
| Legal Services & Support | 0 (0.0%) | 5 (100.0%) |
| Education Instruction & Library | 63 (33.3%) | 126 (66.7%) |
| Arts, Media & Entertainment | 32 (23.9%) | 102 (76.1%) |
| Health Diagnosing & Treating | 64 (39.5%) | 98 (60.5%) |
| Health Technologists | 45 (41.3%) | 64 (58.7%) |
| Total (Category) | 485 (50.0%) | 485 (50.0%) |
| Total (Overall) | 1,842 (52.1%) | 1,694 (47.9%) |
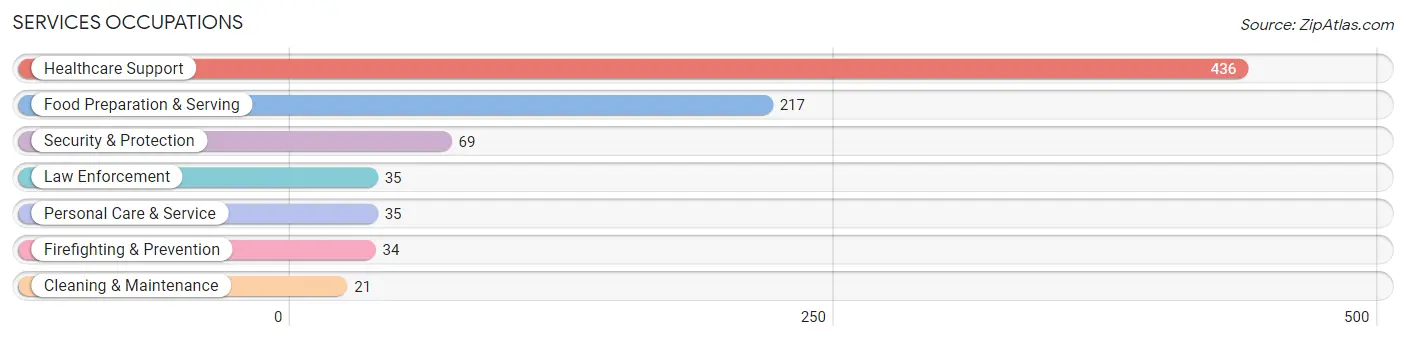
Services Occupations
The most common Services occupations in Junction City are Healthcare Support (436 | 12.3%), Food Preparation & Serving (217 | 6.1%), Security & Protection (69 | 1.9%), Law Enforcement (35 | 1.0%), and Personal Care & Service (35 | 1.0%).
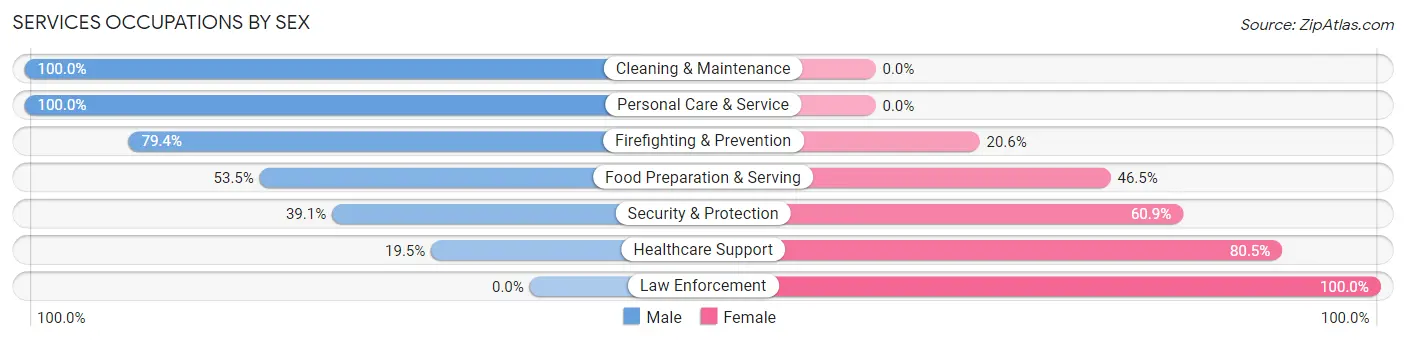
Services Occupations by Sex
Within the Services occupations in Junction City, the most male-oriented occupations are Cleaning & Maintenance (100.0%), Personal Care & Service (100.0%), and Firefighting & Prevention (79.4%), while the most female-oriented occupations are Law Enforcement (100.0%), Healthcare Support (80.5%), and Security & Protection (60.9%).
| Occupation | Male | Female |
| Healthcare Support | 85 (19.5%) | 351 (80.5%) |
| Security & Protection | 27 (39.1%) | 42 (60.9%) |
| Firefighting & Prevention | 27 (79.4%) | 7 (20.6%) |
| Law Enforcement | 0 (0.0%) | 35 (100.0%) |
| Food Preparation & Serving | 116 (53.5%) | 101 (46.5%) |
| Cleaning & Maintenance | 21 (100.0%) | 0 (0.0%) |
| Personal Care & Service | 35 (100.0%) | 0 (0.0%) |
| Total (Category) | 284 (36.5%) | 494 (63.5%) |
| Total (Overall) | 1,842 (52.1%) | 1,694 (47.9%) |
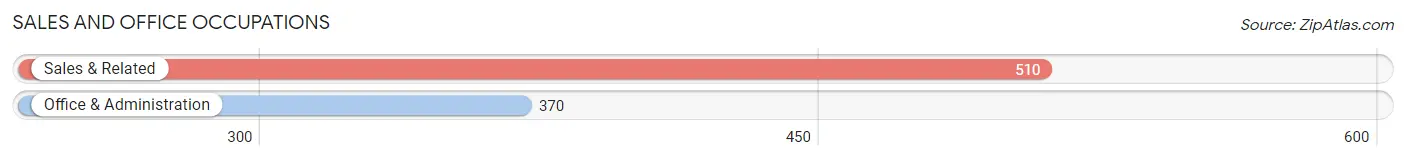
Sales and Office Occupations
The most common Sales and Office occupations in Junction City are Sales & Related (510 | 14.4%), and Office & Administration (370 | 10.5%).
Sales and Office Occupations by Sex
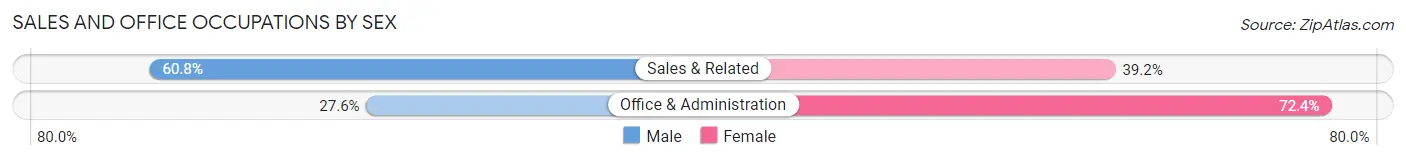
| Occupation | Male | Female |
| Sales & Related | 310 (60.8%) | 200 (39.2%) |
| Office & Administration | 102 (27.6%) | 268 (72.4%) |
| Total (Category) | 412 (46.8%) | 468 (53.2%) |
| Total (Overall) | 1,842 (52.1%) | 1,694 (47.9%) |
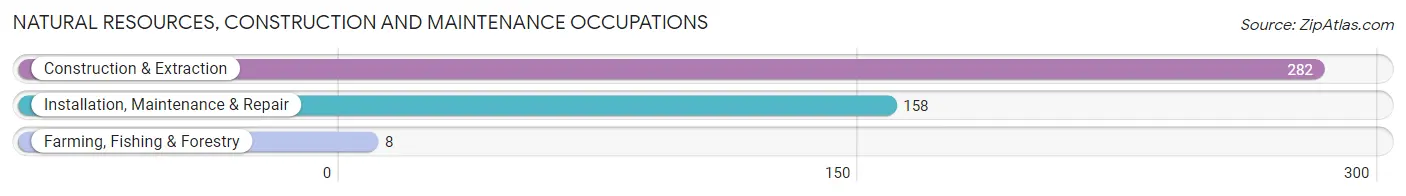
Natural Resources, Construction and Maintenance Occupations
The most common Natural Resources, Construction and Maintenance occupations in Junction City are Construction & Extraction (282 | 8.0%), Installation, Maintenance & Repair (158 | 4.5%), and Farming, Fishing & Forestry (8 | 0.2%).
Natural Resources, Construction and Maintenance Occupations by Sex
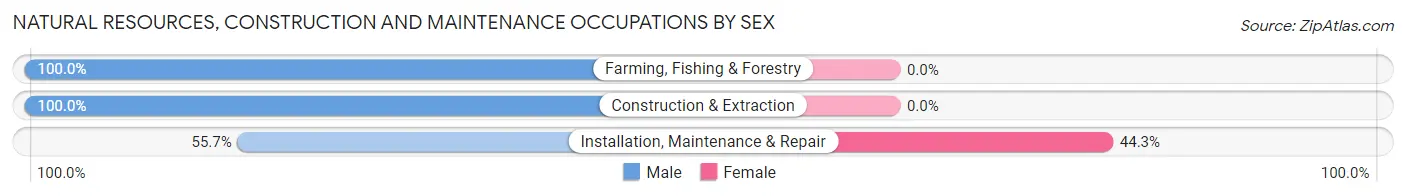
| Occupation | Male | Female |
| Farming, Fishing & Forestry | 8 (100.0%) | 0 (0.0%) |
| Construction & Extraction | 282 (100.0%) | 0 (0.0%) |
| Installation, Maintenance & Repair | 88 (55.7%) | 70 (44.3%) |
| Total (Category) | 378 (84.4%) | 70 (15.6%) |
| Total (Overall) | 1,842 (52.1%) | 1,694 (47.9%) |
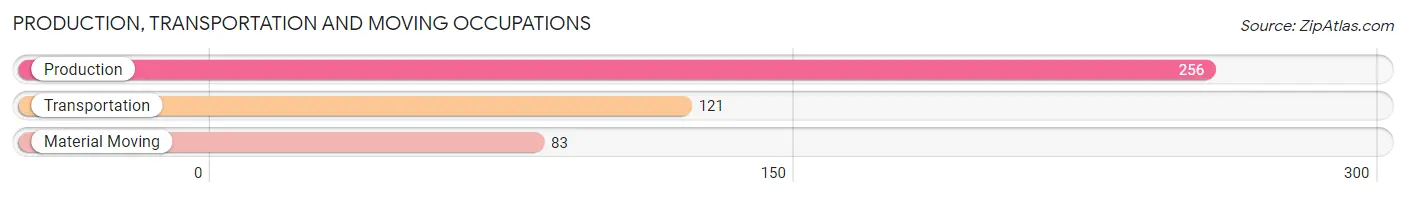
Production, Transportation and Moving Occupations
The most common Production, Transportation and Moving occupations in Junction City are Production (256 | 7.2%), Transportation (121 | 3.4%), and Material Moving (83 | 2.4%).
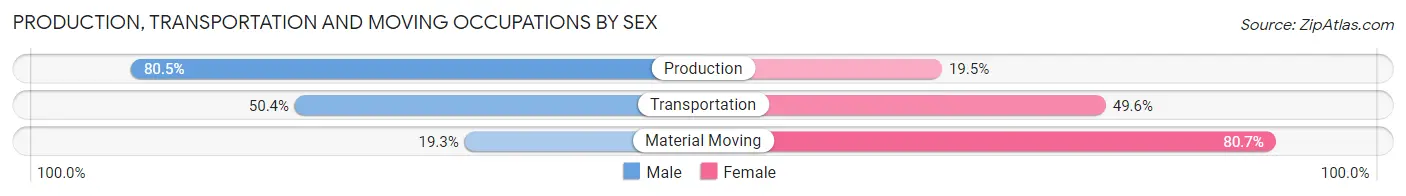
Production, Transportation and Moving Occupations by Sex
| Occupation | Male | Female |
| Production | 206 (80.5%) | 50 (19.5%) |
| Transportation | 61 (50.4%) | 60 (49.6%) |
| Material Moving | 16 (19.3%) | 67 (80.7%) |
| Total (Category) | 283 (61.5%) | 177 (38.5%) |
| Total (Overall) | 1,842 (52.1%) | 1,694 (47.9%) |
Employment Industries by Sex in Junction City
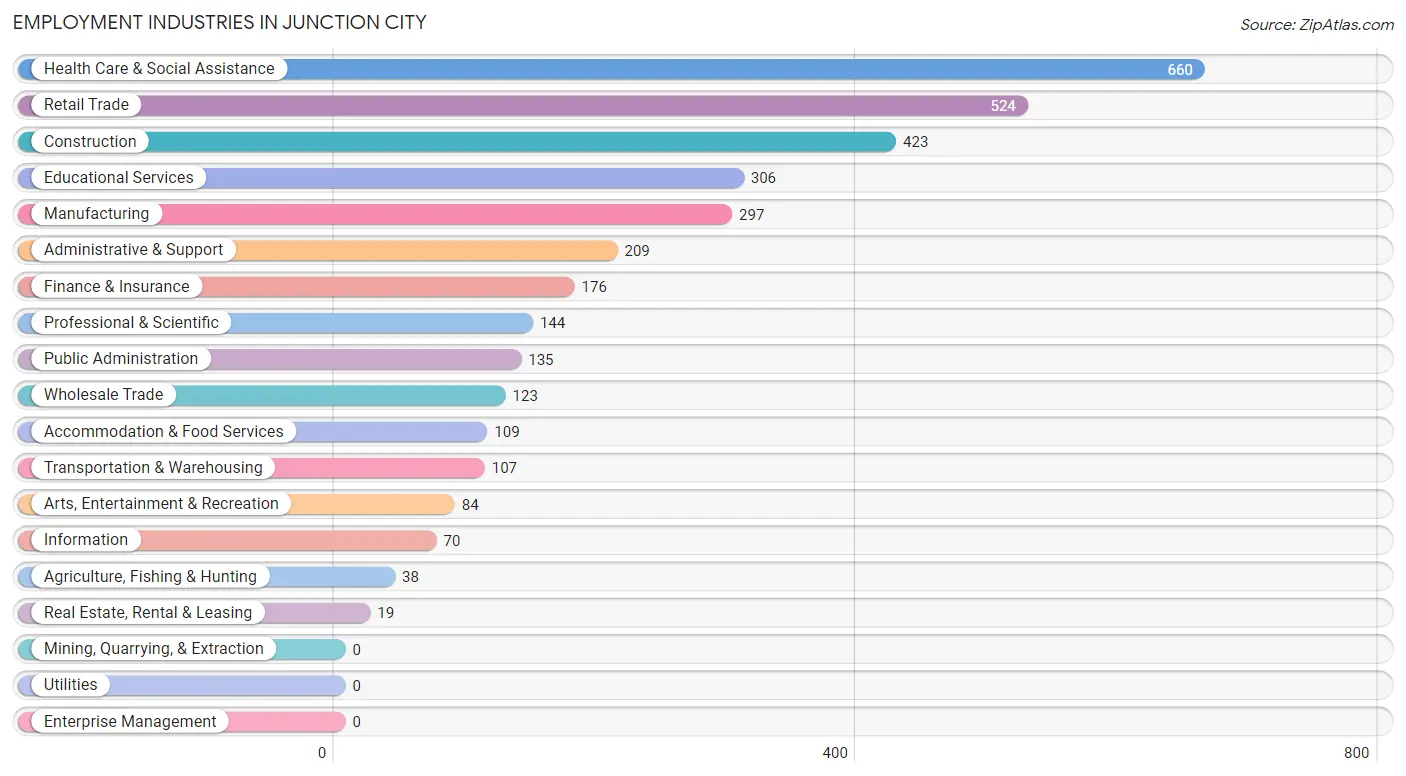
Employment Industries in Junction City
The major employment industries in Junction City include Health Care & Social Assistance (660 | 18.7%), Retail Trade (524 | 14.8%), Construction (423 | 12.0%), Educational Services (306 | 8.6%), and Manufacturing (297 | 8.4%).
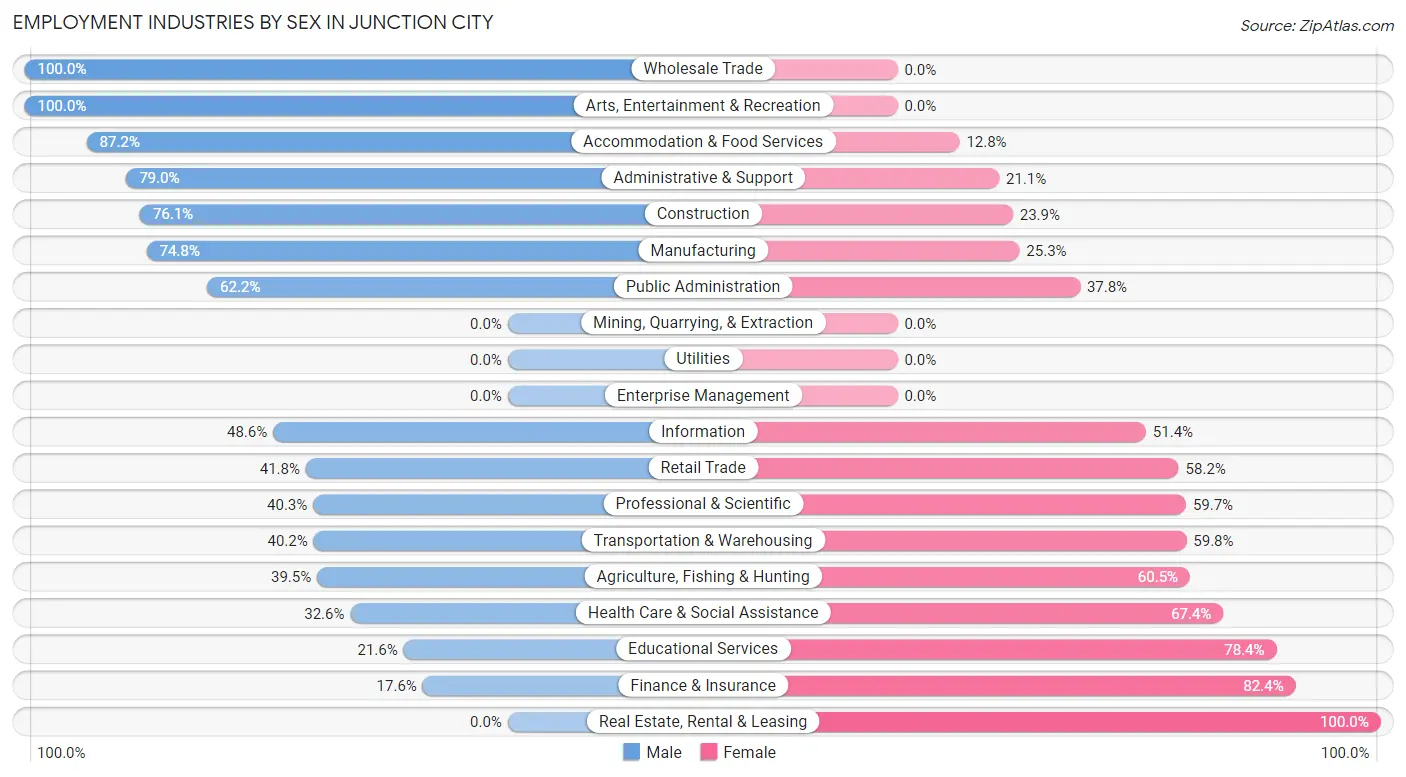
Employment Industries by Sex in Junction City
The Junction City industries that see more men than women are Wholesale Trade (100.0%), Arts, Entertainment & Recreation (100.0%), and Accommodation & Food Services (87.2%), whereas the industries that tend to have a higher number of women are Real Estate, Rental & Leasing (100.0%), Finance & Insurance (82.4%), and Educational Services (78.4%).
| Industry | Male | Female |
| Agriculture, Fishing & Hunting | 15 (39.5%) | 23 (60.5%) |
| Mining, Quarrying, & Extraction | 0 (0.0%) | 0 (0.0%) |
| Construction | 322 (76.1%) | 101 (23.9%) |
| Manufacturing | 222 (74.8%) | 75 (25.3%) |
| Wholesale Trade | 123 (100.0%) | 0 (0.0%) |
| Retail Trade | 219 (41.8%) | 305 (58.2%) |
| Transportation & Warehousing | 43 (40.2%) | 64 (59.8%) |
| Utilities | 0 (0.0%) | 0 (0.0%) |
| Information | 34 (48.6%) | 36 (51.4%) |
| Finance & Insurance | 31 (17.6%) | 145 (82.4%) |
| Real Estate, Rental & Leasing | 0 (0.0%) | 19 (100.0%) |
| Professional & Scientific | 58 (40.3%) | 86 (59.7%) |
| Enterprise Management | 0 (0.0%) | 0 (0.0%) |
| Administrative & Support | 165 (78.9%) | 44 (21.0%) |
| Educational Services | 66 (21.6%) | 240 (78.4%) |
| Health Care & Social Assistance | 215 (32.6%) | 445 (67.4%) |
| Arts, Entertainment & Recreation | 84 (100.0%) | 0 (0.0%) |
| Accommodation & Food Services | 95 (87.2%) | 14 (12.8%) |
| Public Administration | 84 (62.2%) | 51 (37.8%) |
| Total | 1,842 (52.1%) | 1,694 (47.9%) |
Education in Junction City
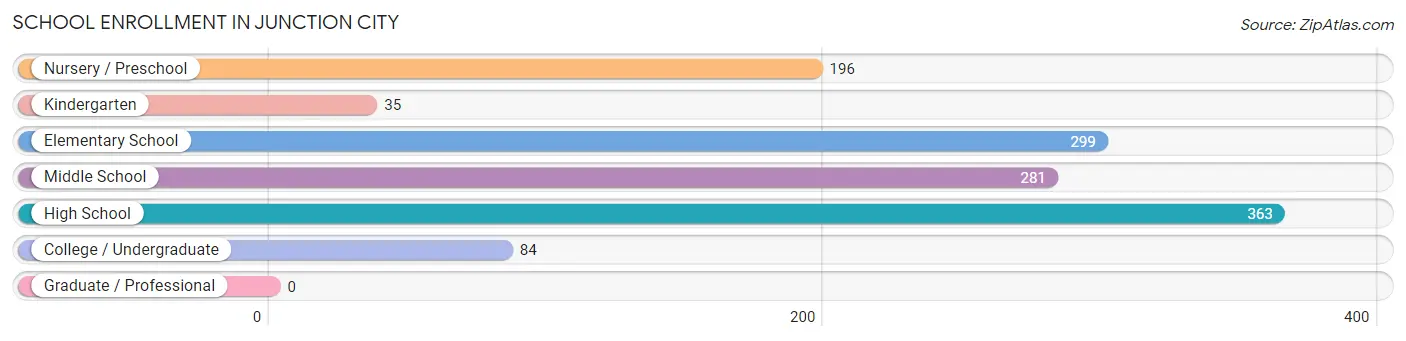
School Enrollment in Junction City
The most common levels of schooling among the 1,258 students in Junction City are high school (363 | 28.9%), elementary school (299 | 23.8%), and middle school (281 | 22.3%).
| School Level | # Students | % Students |
| Nursery / Preschool | 196 | 15.6% |
| Kindergarten | 35 | 2.8% |
| Elementary School | 299 | 23.8% |
| Middle School | 281 | 22.3% |
| High School | 363 | 28.9% |
| College / Undergraduate | 84 | 6.7% |
| Graduate / Professional | 0 | 0.0% |
| Total | 1,258 | 100.0% |
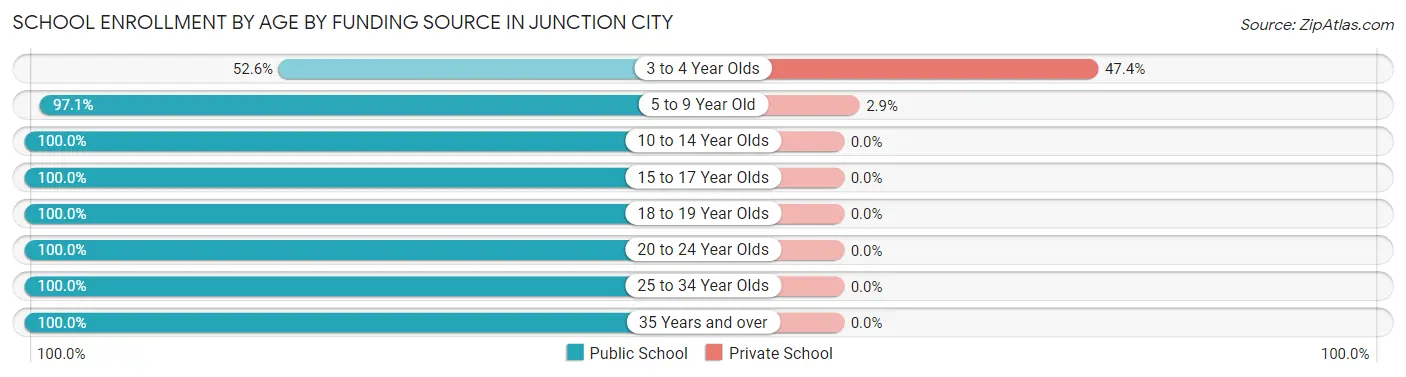
School Enrollment by Age by Funding Source in Junction City
Out of a total of 1,258 students who are enrolled in schools in Junction City, 57 (4.5%) attend a private institution, while the remaining 1,201 (95.5%) are enrolled in public schools. The age group of 3 to 4 year olds has the highest likelihood of being enrolled in private schools, with 45 (47.4% in the age bracket) enrolled. Conversely, the age group of 10 to 14 year olds has the lowest likelihood of being enrolled in a private school, with 362 (100.0% in the age bracket) attending a public institution.
| Age Bracket | Public School | Private School |
| 3 to 4 Year Olds | 50 (52.6%) | 45 (47.4%) |
| 5 to 9 Year Old | 369 (97.1%) | 11 (2.9%) |
| 10 to 14 Year Olds | 362 (100.0%) | 0 (0.0%) |
| 15 to 17 Year Olds | 241 (100.0%) | 0 (0.0%) |
| 18 to 19 Year Olds | 96 (100.0%) | 0 (0.0%) |
| 20 to 24 Year Olds | 3 (100.0%) | 0 (0.0%) |
| 25 to 34 Year Olds | 68 (100.0%) | 0 (0.0%) |
| 35 Years and over | 13 (100.0%) | 0 (0.0%) |
| Total | 1,201 (95.5%) | 57 (4.5%) |
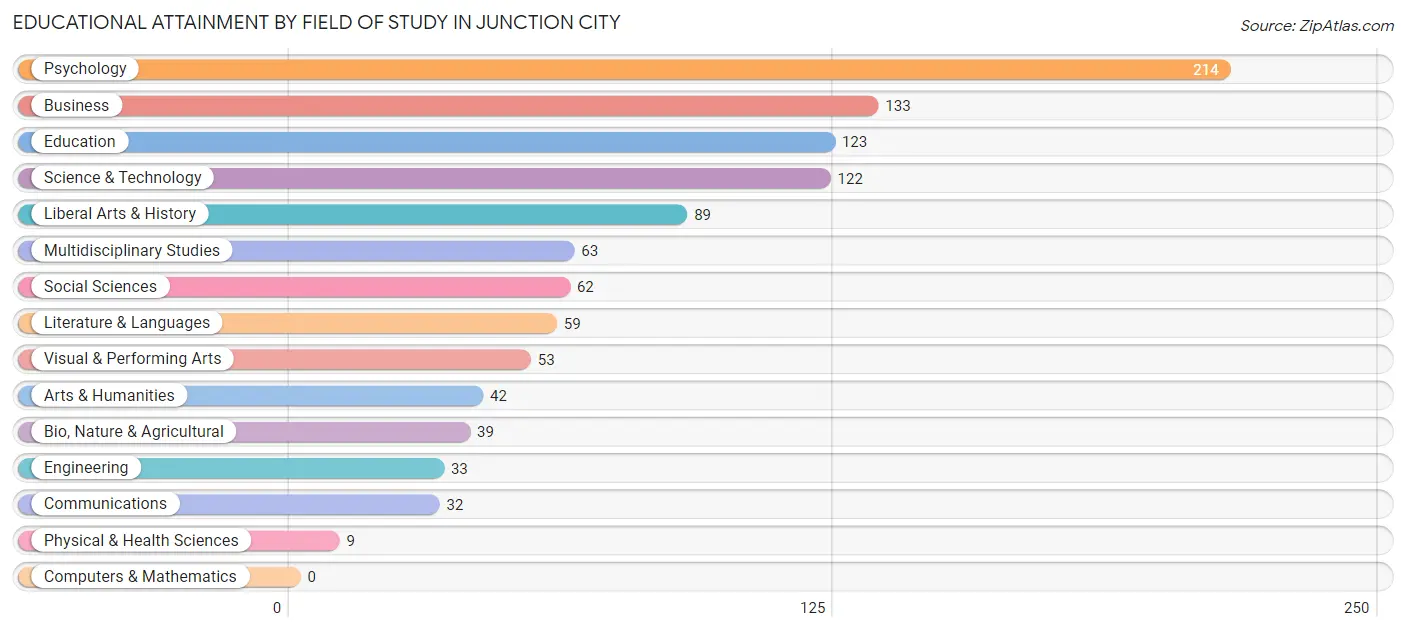
Educational Attainment by Field of Study in Junction City
Psychology (214 | 19.9%), business (133 | 12.4%), education (123 | 11.5%), science & technology (122 | 11.4%), and liberal arts & history (89 | 8.3%) are the most common fields of study among 1,073 individuals in Junction City who have obtained a bachelor's degree or higher.
| Field of Study | # Graduates | % Graduates |
| Computers & Mathematics | 0 | 0.0% |
| Bio, Nature & Agricultural | 39 | 3.6% |
| Physical & Health Sciences | 9 | 0.8% |
| Psychology | 214 | 19.9% |
| Social Sciences | 62 | 5.8% |
| Engineering | 33 | 3.1% |
| Multidisciplinary Studies | 63 | 5.9% |
| Science & Technology | 122 | 11.4% |
| Business | 133 | 12.4% |
| Education | 123 | 11.5% |
| Literature & Languages | 59 | 5.5% |
| Liberal Arts & History | 89 | 8.3% |
| Visual & Performing Arts | 53 | 4.9% |
| Communications | 32 | 3.0% |
| Arts & Humanities | 42 | 3.9% |
| Total | 1,073 | 100.0% |
Transportation & Commute in Junction City
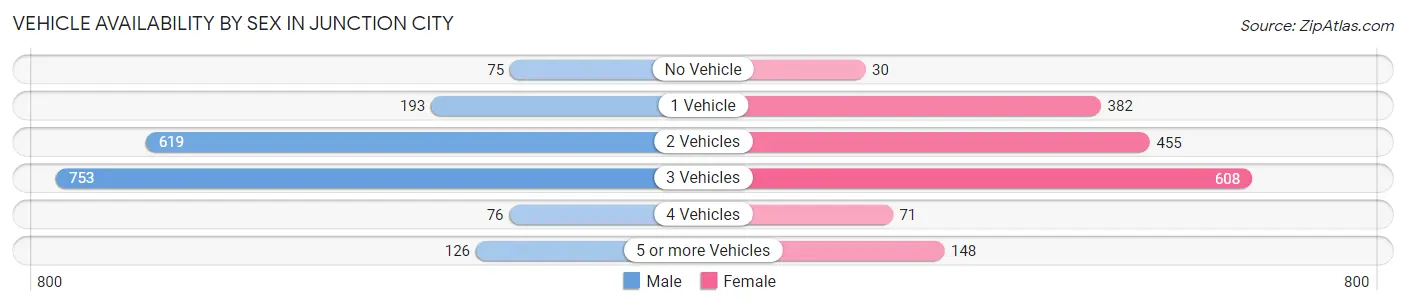
Vehicle Availability by Sex in Junction City
The most prevalent vehicle ownership categories in Junction City are males with 3 vehicles (753, accounting for 40.9%) and females with 3 vehicles (608, making up 44.5%).
| Vehicles Available | Male | Female |
| No Vehicle | 75 (4.1%) | 30 (1.8%) |
| 1 Vehicle | 193 (10.5%) | 382 (22.6%) |
| 2 Vehicles | 619 (33.6%) | 455 (26.9%) |
| 3 Vehicles | 753 (40.9%) | 608 (35.9%) |
| 4 Vehicles | 76 (4.1%) | 71 (4.2%) |
| 5 or more Vehicles | 126 (6.8%) | 148 (8.7%) |
| Total | 1,842 (100.0%) | 1,694 (100.0%) |
Commute Time in Junction City
The most frequently occuring commute durations in Junction City are 30 to 34 minutes (592 commuters, 17.1%), 20 to 24 minutes (499 commuters, 14.4%), and less than 5 minutes (442 commuters, 12.8%).
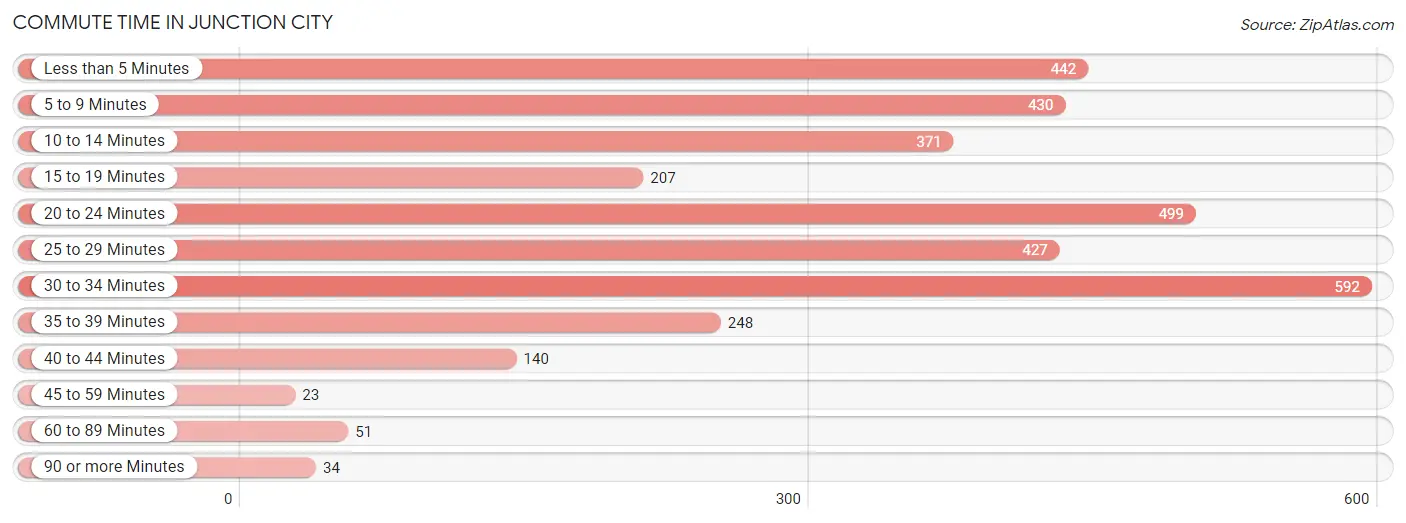
| Commute Time | # Commuters | % Commuters |
| Less than 5 Minutes | 442 | 12.8% |
| 5 to 9 Minutes | 430 | 12.4% |
| 10 to 14 Minutes | 371 | 10.7% |
| 15 to 19 Minutes | 207 | 6.0% |
| 20 to 24 Minutes | 499 | 14.4% |
| 25 to 29 Minutes | 427 | 12.3% |
| 30 to 34 Minutes | 592 | 17.1% |
| 35 to 39 Minutes | 248 | 7.2% |
| 40 to 44 Minutes | 140 | 4.0% |
| 45 to 59 Minutes | 23 | 0.7% |
| 60 to 89 Minutes | 51 | 1.5% |
| 90 or more Minutes | 34 | 1.0% |
Commute Time by Sex in Junction City
The most common commute times in Junction City are 25 to 29 minutes (305 commuters, 17.0%) for males and 30 to 34 minutes (369 commuters, 22.1%) for females.
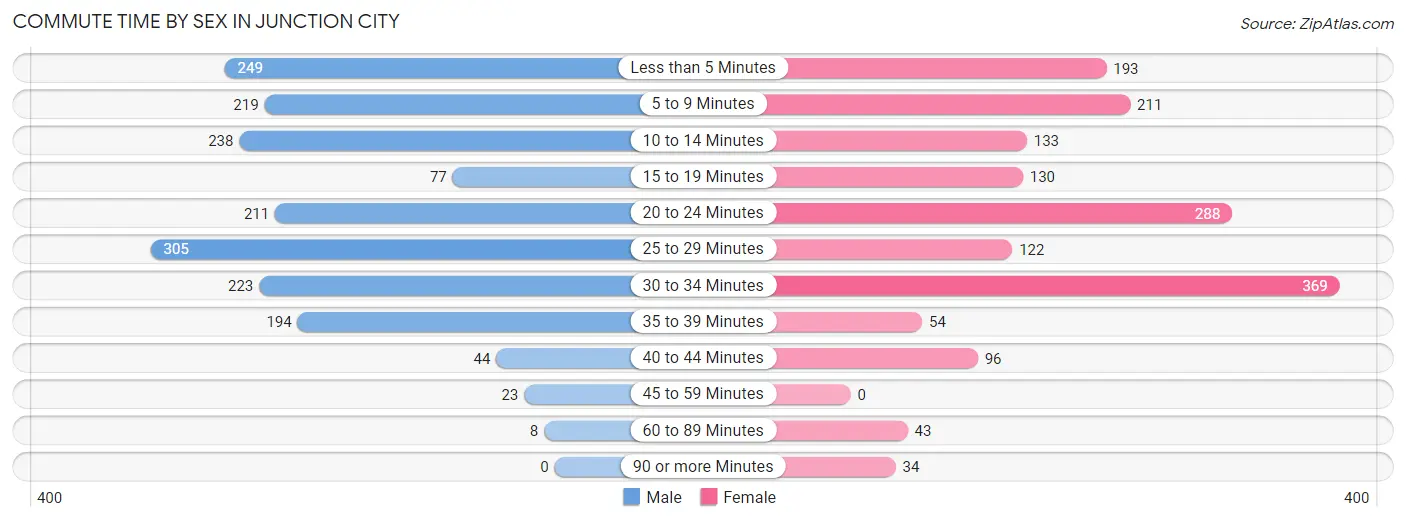
| Commute Time | Male | Female |
| Less than 5 Minutes | 249 (13.9%) | 193 (11.5%) |
| 5 to 9 Minutes | 219 (12.2%) | 211 (12.6%) |
| 10 to 14 Minutes | 238 (13.3%) | 133 (8.0%) |
| 15 to 19 Minutes | 77 (4.3%) | 130 (7.8%) |
| 20 to 24 Minutes | 211 (11.8%) | 288 (17.2%) |
| 25 to 29 Minutes | 305 (17.0%) | 122 (7.3%) |
| 30 to 34 Minutes | 223 (12.4%) | 369 (22.1%) |
| 35 to 39 Minutes | 194 (10.8%) | 54 (3.2%) |
| 40 to 44 Minutes | 44 (2.5%) | 96 (5.7%) |
| 45 to 59 Minutes | 23 (1.3%) | 0 (0.0%) |
| 60 to 89 Minutes | 8 (0.4%) | 43 (2.6%) |
| 90 or more Minutes | 0 (0.0%) | 34 (2.0%) |
Time of Departure to Work by Sex in Junction City
The most frequent times of departure to work in Junction City are 7:00 AM to 7:29 AM (407, 22.7%) for males and 7:30 AM to 7:59 AM (271, 16.2%) for females.
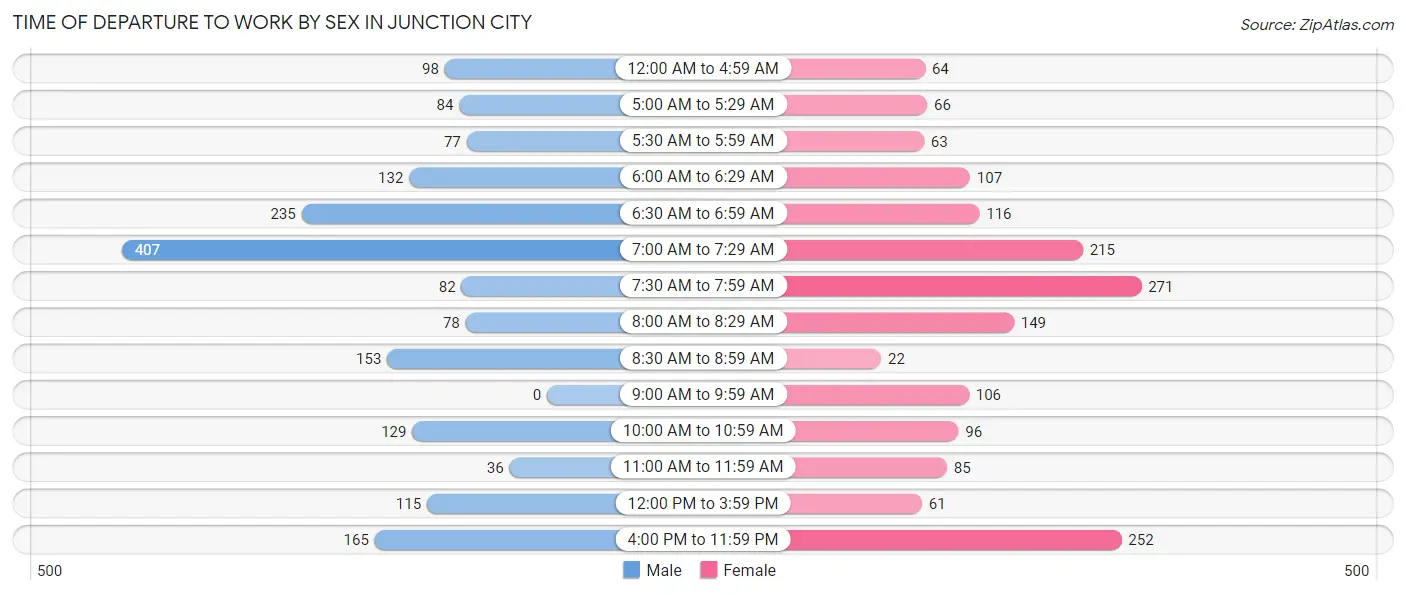
| Time of Departure | Male | Female |
| 12:00 AM to 4:59 AM | 98 (5.5%) | 64 (3.8%) |
| 5:00 AM to 5:29 AM | 84 (4.7%) | 66 (4.0%) |
| 5:30 AM to 5:59 AM | 77 (4.3%) | 63 (3.8%) |
| 6:00 AM to 6:29 AM | 132 (7.4%) | 107 (6.4%) |
| 6:30 AM to 6:59 AM | 235 (13.1%) | 116 (6.9%) |
| 7:00 AM to 7:29 AM | 407 (22.7%) | 215 (12.9%) |
| 7:30 AM to 7:59 AM | 82 (4.6%) | 271 (16.2%) |
| 8:00 AM to 8:29 AM | 78 (4.4%) | 149 (8.9%) |
| 8:30 AM to 8:59 AM | 153 (8.5%) | 22 (1.3%) |
| 9:00 AM to 9:59 AM | 0 (0.0%) | 106 (6.3%) |
| 10:00 AM to 10:59 AM | 129 (7.2%) | 96 (5.7%) |
| 11:00 AM to 11:59 AM | 36 (2.0%) | 85 (5.1%) |
| 12:00 PM to 3:59 PM | 115 (6.4%) | 61 (3.6%) |
| 4:00 PM to 11:59 PM | 165 (9.2%) | 252 (15.1%) |
| Total | 1,791 (100.0%) | 1,673 (100.0%) |
Housing Occupancy in Junction City
Occupancy by Ownership in Junction City
Of the total 2,772 dwellings in Junction City, owner-occupied units account for 1,642 (59.2%), while renter-occupied units make up 1,130 (40.8%).
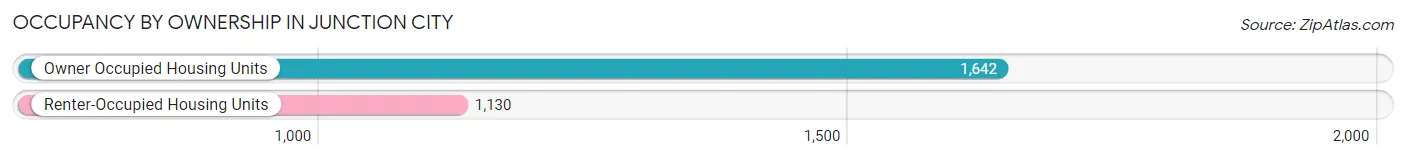
| Occupancy | # Housing Units | % Housing Units |
| Owner Occupied Housing Units | 1,642 | 59.2% |
| Renter-Occupied Housing Units | 1,130 | 40.8% |
| Total Occupied Housing Units | 2,772 | 100.0% |
Occupancy by Household Size in Junction City
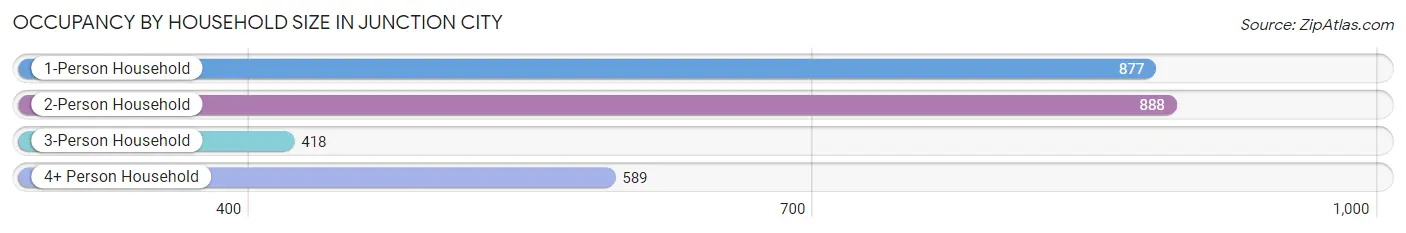
| Household Size | # Housing Units | % Housing Units |
| 1-Person Household | 877 | 31.6% |
| 2-Person Household | 888 | 32.0% |
| 3-Person Household | 418 | 15.1% |
| 4+ Person Household | 589 | 21.2% |
| Total Housing Units | 2,772 | 100.0% |
Occupancy by Ownership by Household Size in Junction City
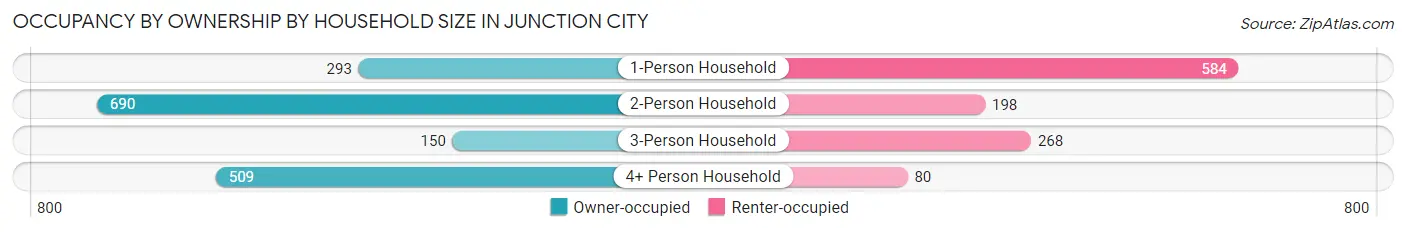
| Household Size | Owner-occupied | Renter-occupied |
| 1-Person Household | 293 (33.4%) | 584 (66.6%) |
| 2-Person Household | 690 (77.7%) | 198 (22.3%) |
| 3-Person Household | 150 (35.9%) | 268 (64.1%) |
| 4+ Person Household | 509 (86.4%) | 80 (13.6%) |
| Total Housing Units | 1,642 (59.2%) | 1,130 (40.8%) |
Occupancy by Educational Attainment in Junction City
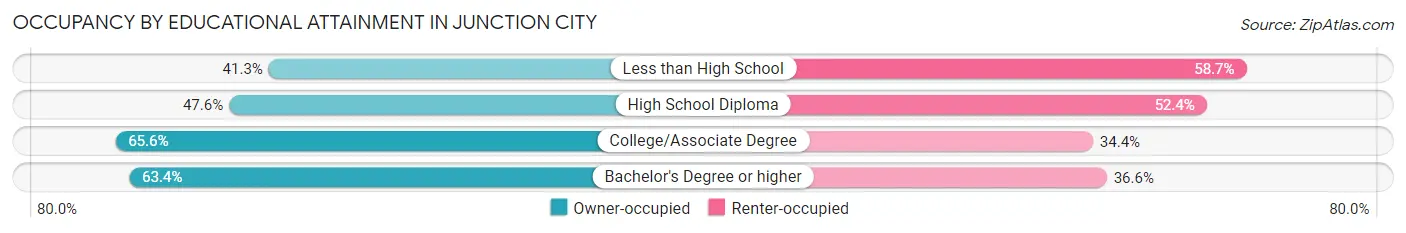
| Household Size | Owner-occupied | Renter-occupied |
| Less than High School | 64 (41.3%) | 91 (58.7%) |
| High School Diploma | 334 (47.6%) | 368 (52.4%) |
| College/Associate Degree | 878 (65.6%) | 460 (34.4%) |
| Bachelor's Degree or higher | 366 (63.4%) | 211 (36.6%) |
Occupancy by Age of Householder in Junction City
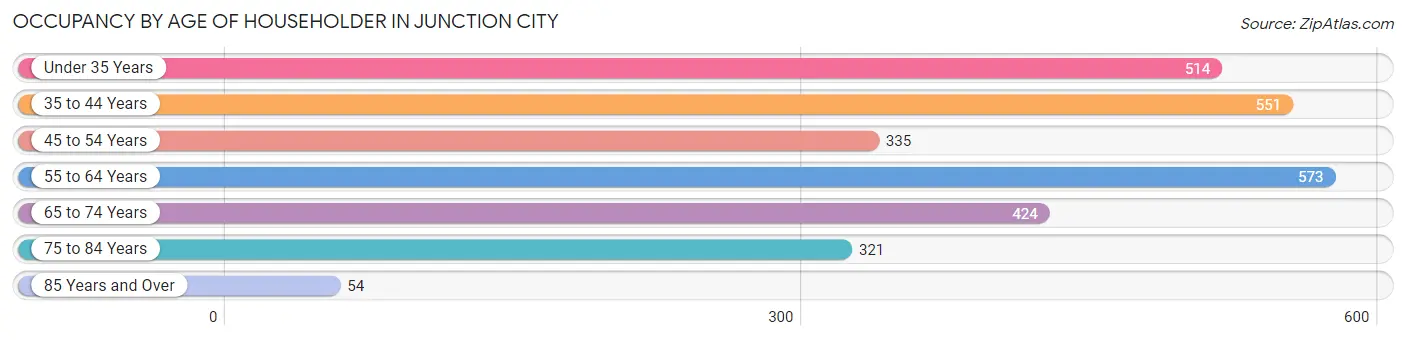
| Age Bracket | # Households | % Households |
| Under 35 Years | 514 | 18.5% |
| 35 to 44 Years | 551 | 19.9% |
| 45 to 54 Years | 335 | 12.1% |
| 55 to 64 Years | 573 | 20.7% |
| 65 to 74 Years | 424 | 15.3% |
| 75 to 84 Years | 321 | 11.6% |
| 85 Years and Over | 54 | 1.9% |
| Total | 2,772 | 100.0% |
Housing Finances in Junction City
Median Income by Occupancy in Junction City
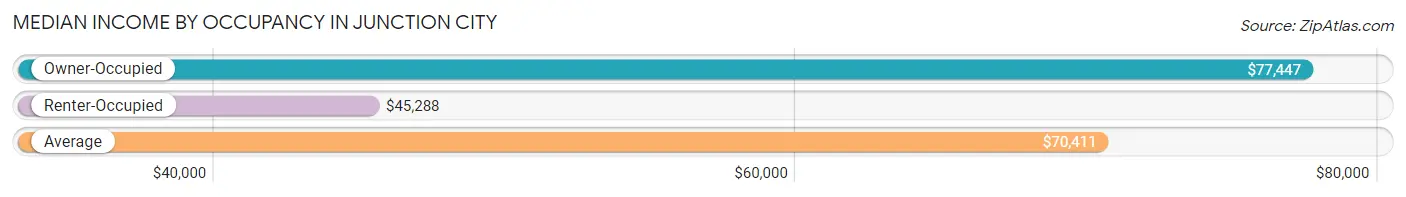
| Occupancy Type | # Households | Median Income |
| Owner-Occupied | 1,642 (59.2%) | $77,447 |
| Renter-Occupied | 1,130 (40.8%) | $45,288 |
| Average | 2,772 (100.0%) | $70,411 |
Occupancy by Householder Income Bracket in Junction City
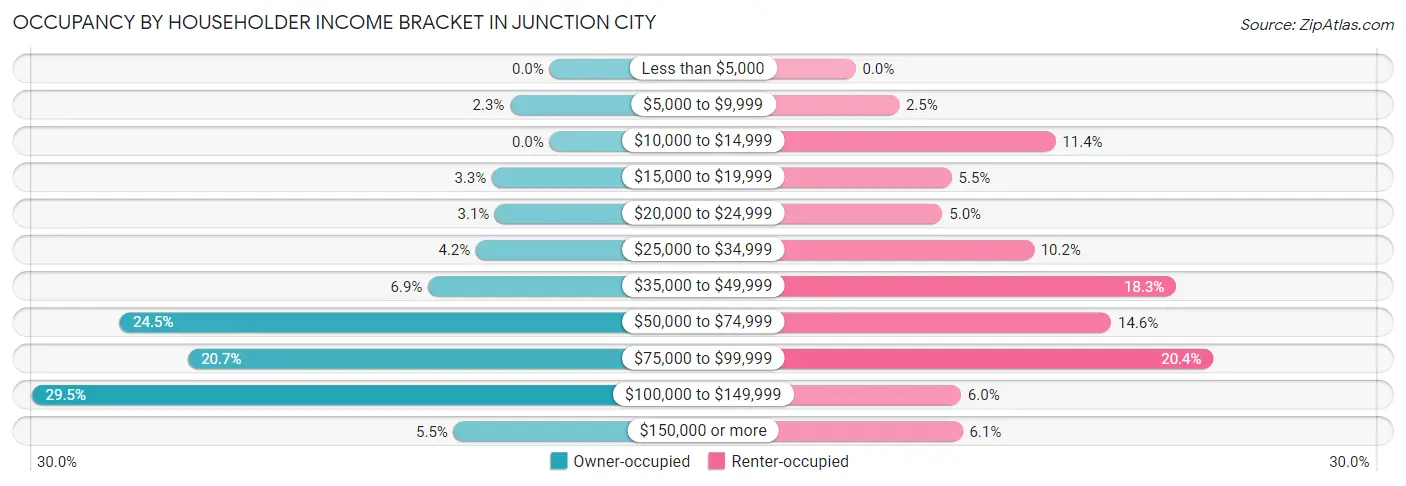
| Income Bracket | Owner-occupied | Renter-occupied |
| Less than $5,000 | 0 (0.0%) | 0 (0.0%) |
| $5,000 to $9,999 | 37 (2.2%) | 28 (2.5%) |
| $10,000 to $14,999 | 0 (0.0%) | 129 (11.4%) |
| $15,000 to $19,999 | 54 (3.3%) | 62 (5.5%) |
| $20,000 to $24,999 | 51 (3.1%) | 56 (5.0%) |
| $25,000 to $34,999 | 69 (4.2%) | 115 (10.2%) |
| $35,000 to $49,999 | 114 (6.9%) | 207 (18.3%) |
| $50,000 to $74,999 | 403 (24.5%) | 165 (14.6%) |
| $75,000 to $99,999 | 339 (20.6%) | 231 (20.4%) |
| $100,000 to $149,999 | 485 (29.5%) | 68 (6.0%) |
| $150,000 or more | 90 (5.5%) | 69 (6.1%) |
| Total | 1,642 (100.0%) | 1,130 (100.0%) |
Monthly Housing Cost Tiers in Junction City
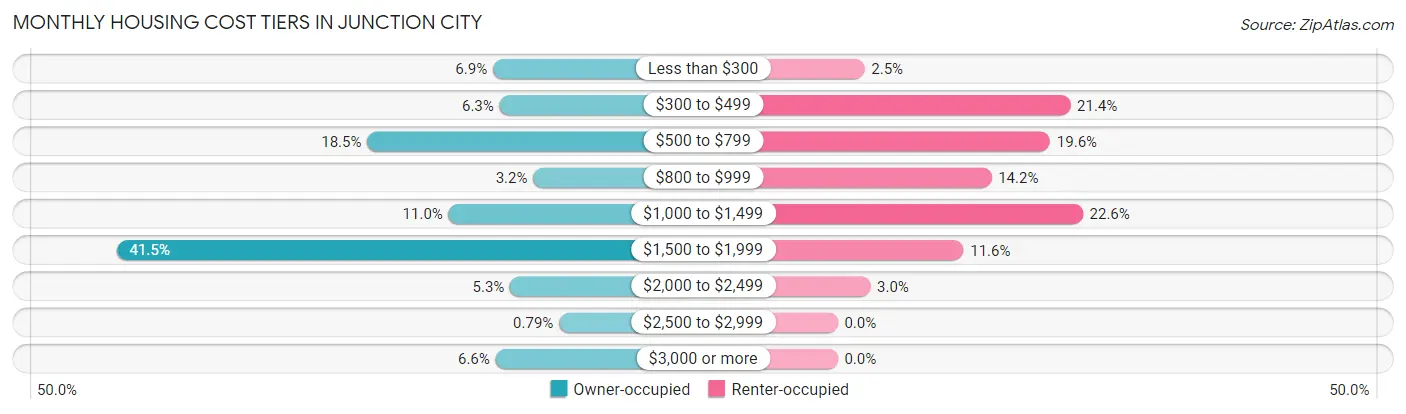
| Monthly Cost | Owner-occupied | Renter-occupied |
| Less than $300 | 113 (6.9%) | 28 (2.5%) |
| $300 to $499 | 103 (6.3%) | 242 (21.4%) |
| $500 to $799 | 303 (18.4%) | 221 (19.6%) |
| $800 to $999 | 52 (3.2%) | 160 (14.2%) |
| $1,000 to $1,499 | 180 (11.0%) | 255 (22.6%) |
| $1,500 to $1,999 | 682 (41.5%) | 131 (11.6%) |
| $2,000 to $2,499 | 87 (5.3%) | 34 (3.0%) |
| $2,500 to $2,999 | 13 (0.8%) | 0 (0.0%) |
| $3,000 or more | 109 (6.6%) | 0 (0.0%) |
| Total | 1,642 (100.0%) | 1,130 (100.0%) |
Physical Housing Characteristics in Junction City
Housing Structures in Junction City
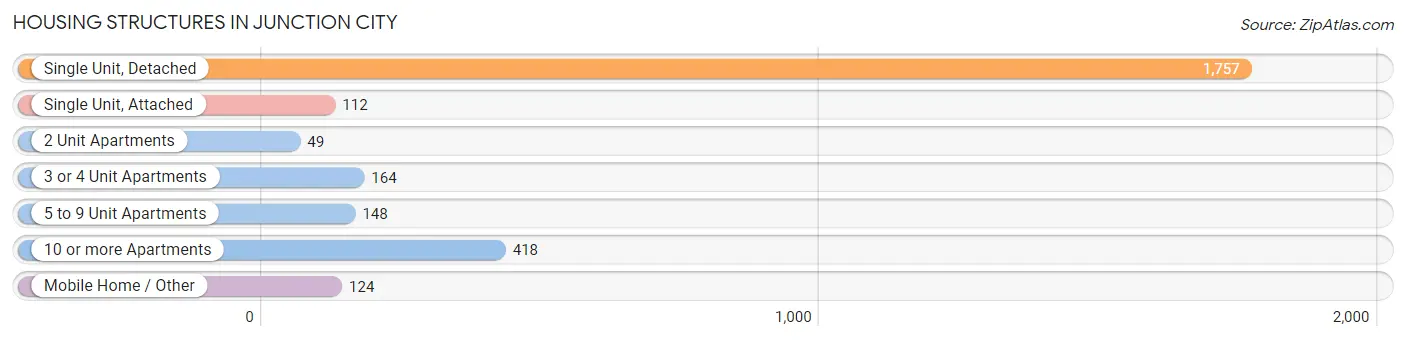
| Structure Type | # Housing Units | % Housing Units |
| Single Unit, Detached | 1,757 | 63.4% |
| Single Unit, Attached | 112 | 4.0% |
| 2 Unit Apartments | 49 | 1.8% |
| 3 or 4 Unit Apartments | 164 | 5.9% |
| 5 to 9 Unit Apartments | 148 | 5.3% |
| 10 or more Apartments | 418 | 15.1% |
| Mobile Home / Other | 124 | 4.5% |
| Total | 2,772 | 100.0% |
Housing Structures by Occupancy in Junction City
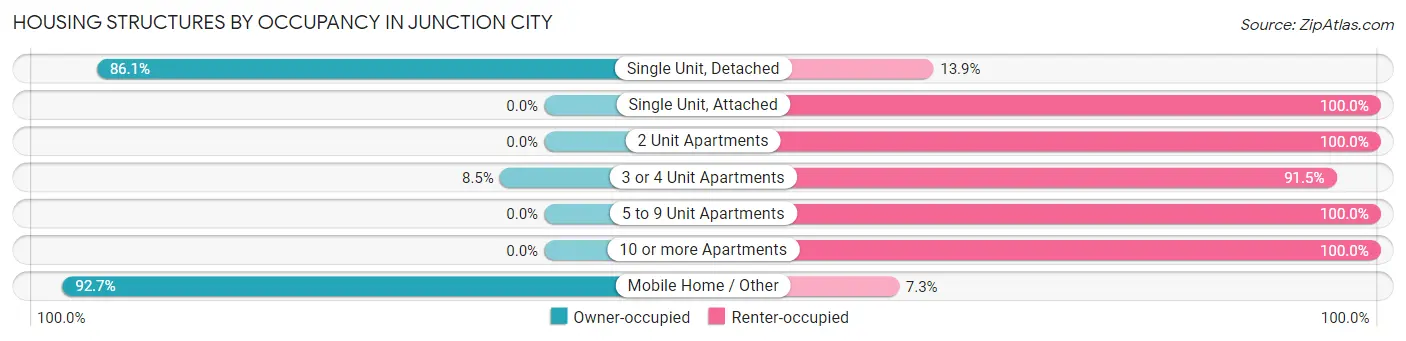
| Structure Type | Owner-occupied | Renter-occupied |
| Single Unit, Detached | 1,513 (86.1%) | 244 (13.9%) |
| Single Unit, Attached | 0 (0.0%) | 112 (100.0%) |
| 2 Unit Apartments | 0 (0.0%) | 49 (100.0%) |
| 3 or 4 Unit Apartments | 14 (8.5%) | 150 (91.5%) |
| 5 to 9 Unit Apartments | 0 (0.0%) | 148 (100.0%) |
| 10 or more Apartments | 0 (0.0%) | 418 (100.0%) |
| Mobile Home / Other | 115 (92.7%) | 9 (7.3%) |
| Total | 1,642 (59.2%) | 1,130 (40.8%) |
Housing Structures by Number of Rooms in Junction City
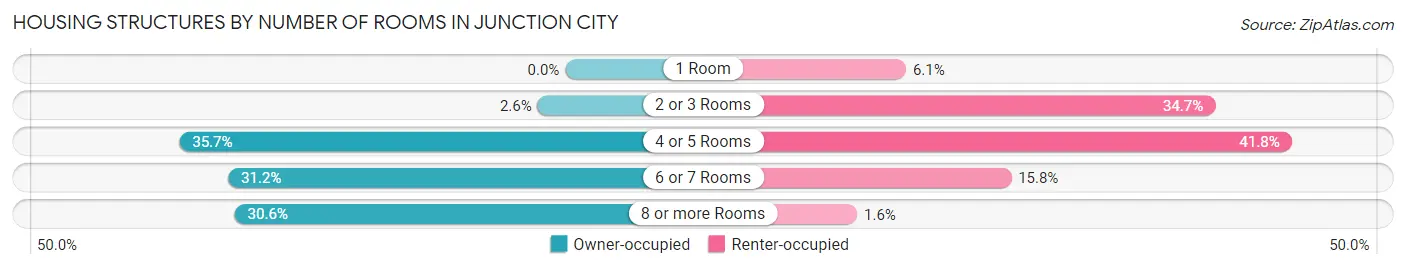
| Number of Rooms | Owner-occupied | Renter-occupied |
| 1 Room | 0 (0.0%) | 69 (6.1%) |
| 2 or 3 Rooms | 42 (2.6%) | 392 (34.7%) |
| 4 or 5 Rooms | 586 (35.7%) | 472 (41.8%) |
| 6 or 7 Rooms | 512 (31.2%) | 179 (15.8%) |
| 8 or more Rooms | 502 (30.6%) | 18 (1.6%) |
| Total | 1,642 (100.0%) | 1,130 (100.0%) |
Housing Structure by Heating Type in Junction City
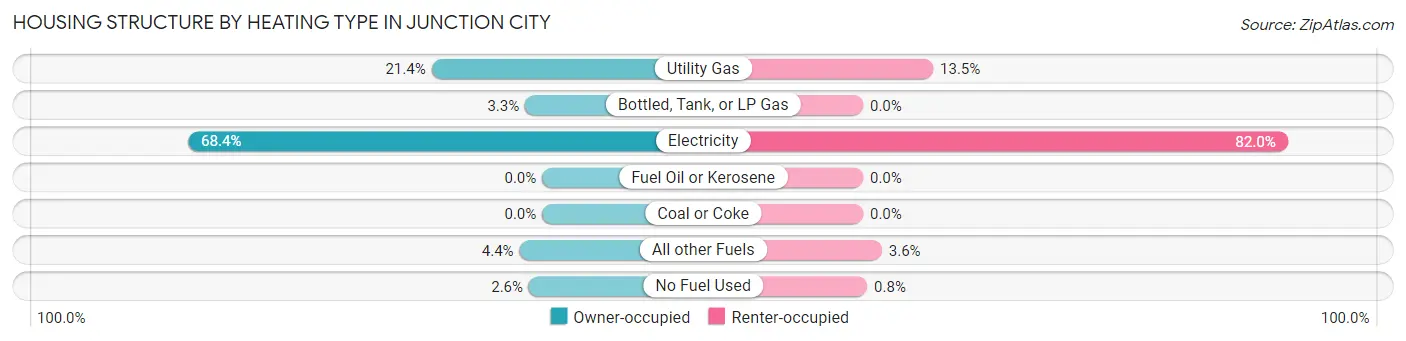
| Heating Type | Owner-occupied | Renter-occupied |
| Utility Gas | 351 (21.4%) | 153 (13.5%) |
| Bottled, Tank, or LP Gas | 54 (3.3%) | 0 (0.0%) |
| Electricity | 1,123 (68.4%) | 927 (82.0%) |
| Fuel Oil or Kerosene | 0 (0.0%) | 0 (0.0%) |
| Coal or Coke | 0 (0.0%) | 0 (0.0%) |
| All other Fuels | 72 (4.4%) | 41 (3.6%) |
| No Fuel Used | 42 (2.6%) | 9 (0.8%) |
| Total | 1,642 (100.0%) | 1,130 (100.0%) |
Household Vehicle Usage in Junction City
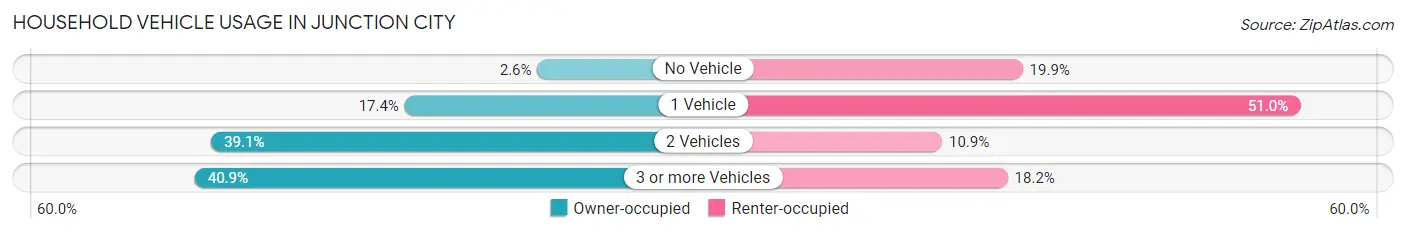
| Vehicles per Household | Owner-occupied | Renter-occupied |
| No Vehicle | 42 (2.6%) | 225 (19.9%) |
| 1 Vehicle | 286 (17.4%) | 576 (51.0%) |
| 2 Vehicles | 642 (39.1%) | 123 (10.9%) |
| 3 or more Vehicles | 672 (40.9%) | 206 (18.2%) |
| Total | 1,642 (100.0%) | 1,130 (100.0%) |
Real Estate & Mortgages in Junction City
Real Estate and Mortgage Overview in Junction City
| Characteristic | Without Mortgage | With Mortgage |
| Housing Units | 494 | 1,148 |
| Median Property Value | $257,100 | $332,700 |
| Median Household Income | $59,643 | $64 |
| Monthly Housing Costs | $564 | $109 |
| Real Estate Taxes | $2,514 | $0 |
Property Value by Mortgage Status in Junction City
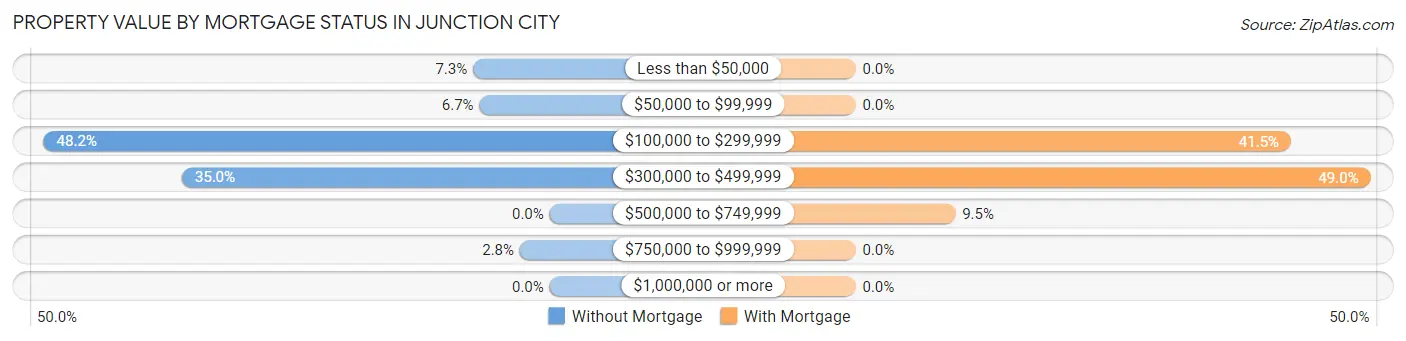
| Property Value | Without Mortgage | With Mortgage |
| Less than $50,000 | 36 (7.3%) | 0 (0.0%) |
| $50,000 to $99,999 | 33 (6.7%) | 0 (0.0%) |
| $100,000 to $299,999 | 238 (48.2%) | 476 (41.5%) |
| $300,000 to $499,999 | 173 (35.0%) | 563 (49.0%) |
| $500,000 to $749,999 | 0 (0.0%) | 109 (9.5%) |
| $750,000 to $999,999 | 14 (2.8%) | 0 (0.0%) |
| $1,000,000 or more | 0 (0.0%) | 0 (0.0%) |
| Total | 494 (100.0%) | 1,148 (100.0%) |
Household Income by Mortgage Status in Junction City
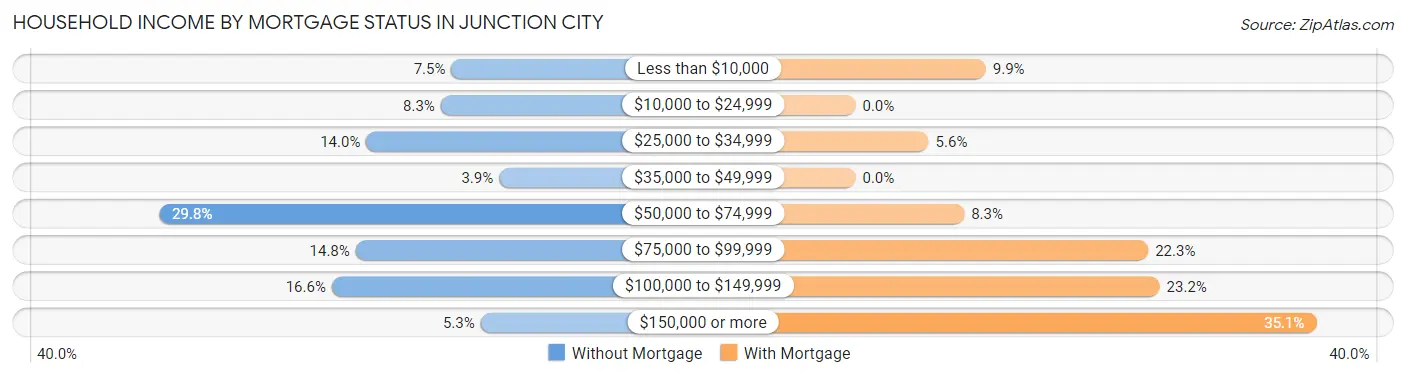
| Household Income | Without Mortgage | With Mortgage |
| Less than $10,000 | 37 (7.5%) | 114 (9.9%) |
| $10,000 to $24,999 | 41 (8.3%) | 0 (0.0%) |
| $25,000 to $34,999 | 69 (14.0%) | 64 (5.6%) |
| $35,000 to $49,999 | 19 (3.8%) | 0 (0.0%) |
| $50,000 to $74,999 | 147 (29.8%) | 95 (8.3%) |
| $75,000 to $99,999 | 73 (14.8%) | 256 (22.3%) |
| $100,000 to $149,999 | 82 (16.6%) | 266 (23.2%) |
| $150,000 or more | 26 (5.3%) | 403 (35.1%) |
| Total | 494 (100.0%) | 1,148 (100.0%) |
Property Value to Household Income Ratio in Junction City
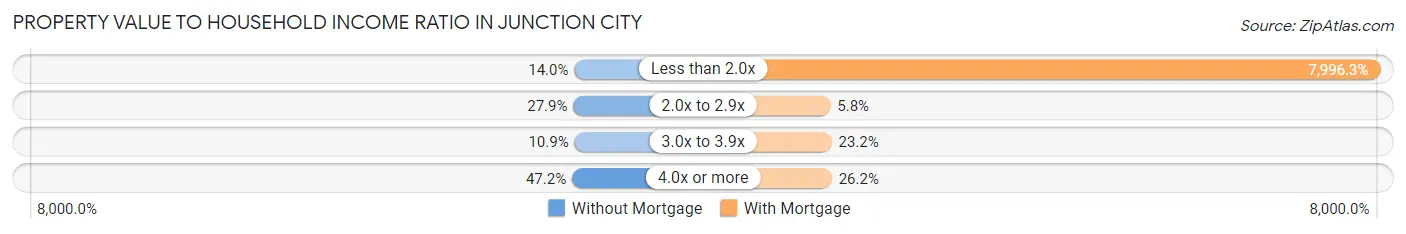
| Value-to-Income Ratio | Without Mortgage | With Mortgage |
| Less than 2.0x | 69 (14.0%) | 91,798 (7,996.3%) |
| 2.0x to 2.9x | 138 (27.9%) | 67 (5.8%) |
| 3.0x to 3.9x | 54 (10.9%) | 266 (23.2%) |
| 4.0x or more | 233 (47.2%) | 301 (26.2%) |
| Total | 494 (100.0%) | 1,148 (100.0%) |
Real Estate Taxes by Mortgage Status in Junction City
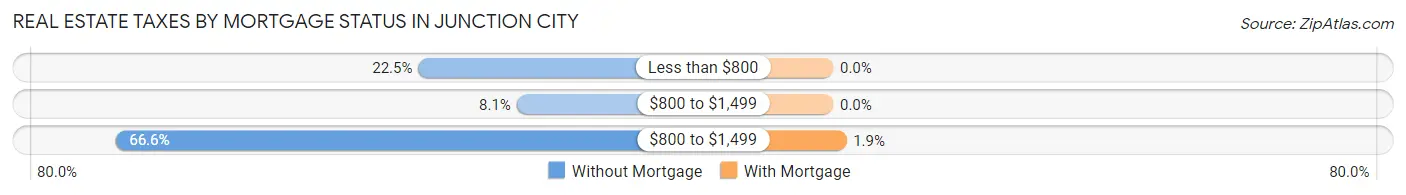
| Property Taxes | Without Mortgage | With Mortgage |
| Less than $800 | 111 (22.5%) | 0 (0.0%) |
| $800 to $1,499 | 40 (8.1%) | 0 (0.0%) |
| $800 to $1,499 | 329 (66.6%) | 22 (1.9%) |
| Total | 494 (100.0%) | 1,148 (100.0%) |
Health & Disability in Junction City
Health Insurance Coverage by Age in Junction City
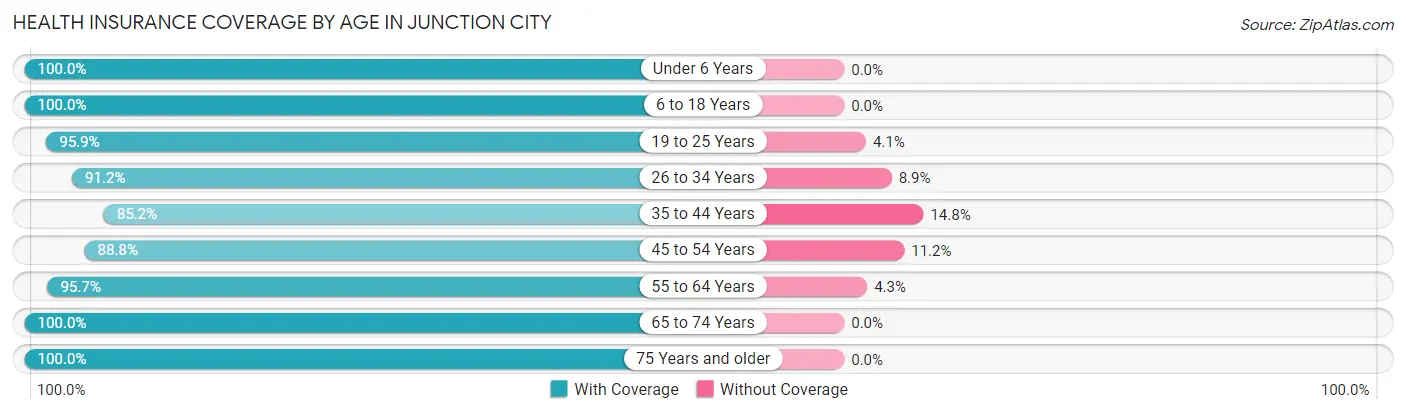
| Age Bracket | With Coverage | Without Coverage |
| Under 6 Years | 481 (100.0%) | 0 (0.0%) |
| 6 to 18 Years | 1,000 (100.0%) | 0 (0.0%) |
| 19 to 25 Years | 378 (95.9%) | 16 (4.1%) |
| 26 to 34 Years | 1,092 (91.1%) | 106 (8.8%) |
| 35 to 44 Years | 802 (85.2%) | 139 (14.8%) |
| 45 to 54 Years | 627 (88.8%) | 79 (11.2%) |
| 55 to 64 Years | 852 (95.7%) | 38 (4.3%) |
| 65 to 74 Years | 611 (100.0%) | 0 (0.0%) |
| 75 Years and older | 513 (100.0%) | 0 (0.0%) |
| Total | 6,356 (94.4%) | 378 (5.6%) |
Health Insurance Coverage by Citizenship Status in Junction City
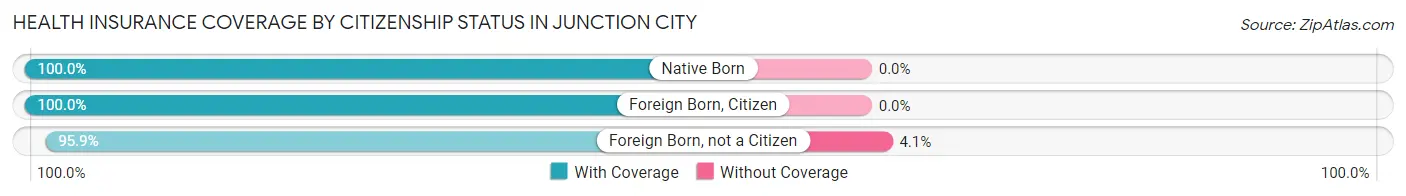
| Citizenship Status | With Coverage | Without Coverage |
| Native Born | 481 (100.0%) | 0 (0.0%) |
| Foreign Born, Citizen | 1,000 (100.0%) | 0 (0.0%) |
| Foreign Born, not a Citizen | 378 (95.9%) | 16 (4.1%) |
Health Insurance Coverage by Household Income in Junction City
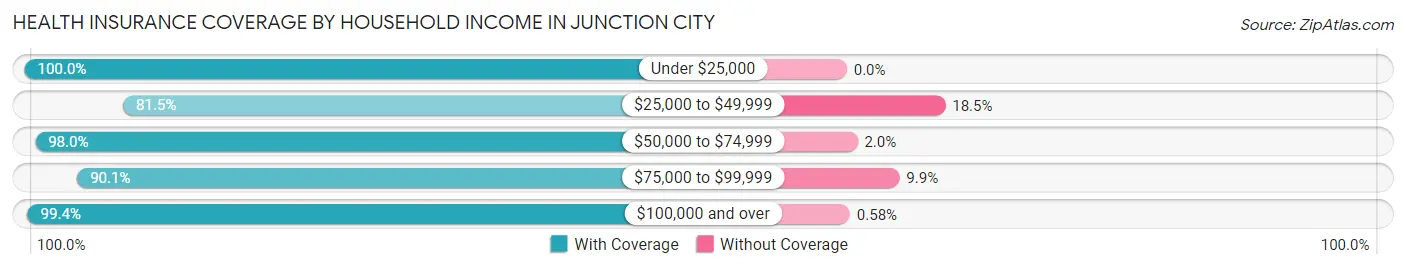
| Household Income | With Coverage | Without Coverage |
| Under $25,000 | 501 (100.0%) | 0 (0.0%) |
| $25,000 to $49,999 | 733 (81.5%) | 166 (18.5%) |
| $50,000 to $74,999 | 1,469 (98.0%) | 30 (2.0%) |
| $75,000 to $99,999 | 1,554 (90.1%) | 170 (9.9%) |
| $100,000 and over | 2,063 (99.4%) | 12 (0.6%) |
Public vs Private Health Insurance Coverage by Age in Junction City
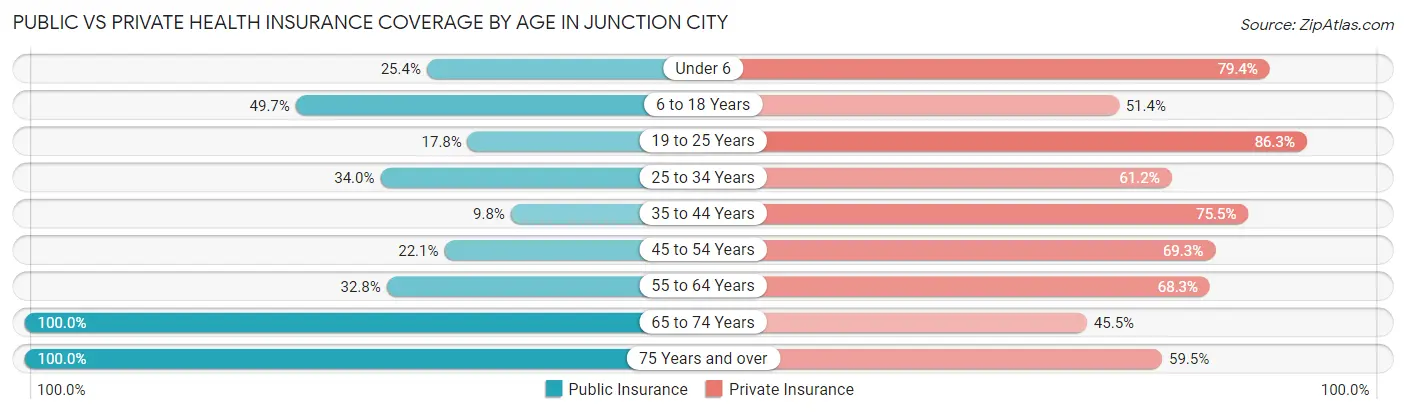
| Age Bracket | Public Insurance | Private Insurance |
| Under 6 | 122 (25.4%) | 382 (79.4%) |
| 6 to 18 Years | 497 (49.7%) | 514 (51.4%) |
| 19 to 25 Years | 70 (17.8%) | 340 (86.3%) |
| 25 to 34 Years | 407 (34.0%) | 733 (61.2%) |
| 35 to 44 Years | 92 (9.8%) | 710 (75.4%) |
| 45 to 54 Years | 156 (22.1%) | 489 (69.3%) |
| 55 to 64 Years | 292 (32.8%) | 608 (68.3%) |
| 65 to 74 Years | 611 (100.0%) | 278 (45.5%) |
| 75 Years and over | 513 (100.0%) | 305 (59.5%) |
| Total | 2,760 (41.0%) | 4,359 (64.7%) |
Disability Status by Sex by Age in Junction City
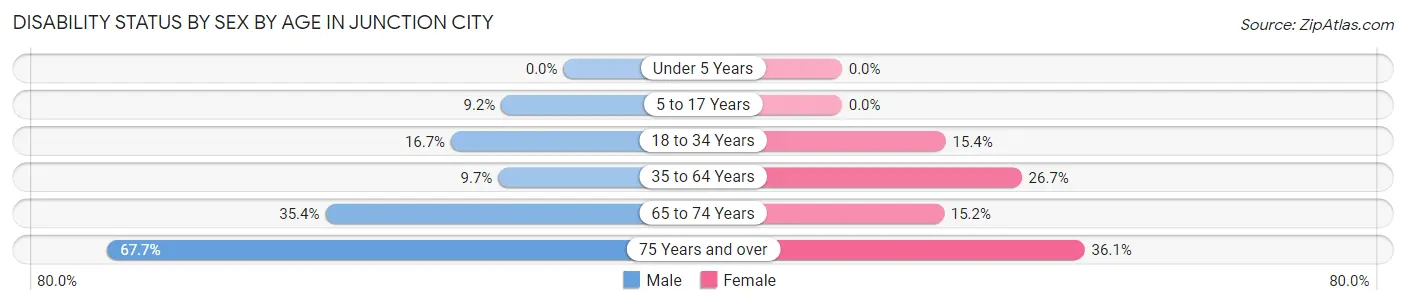
| Age Bracket | Male | Female |
| Under 5 Years | 0 (0.0%) | 0 (0.0%) |
| 5 to 17 Years | 51 (9.2%) | 0 (0.0%) |
| 18 to 34 Years | 140 (16.7%) | 130 (15.4%) |
| 35 to 64 Years | 118 (9.7%) | 352 (26.7%) |
| 65 to 74 Years | 111 (35.3%) | 45 (15.1%) |
| 75 Years and over | 107 (67.7%) | 128 (36.1%) |
Disability Class by Sex by Age in Junction City
Disability Class: Hearing Difficulty
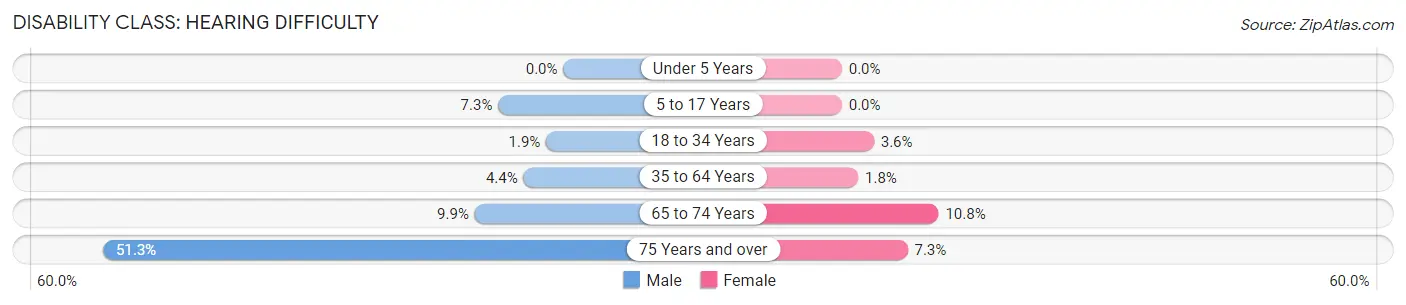
| Age Bracket | Male | Female |
| Under 5 Years | 0 (0.0%) | 0 (0.0%) |
| 5 to 17 Years | 40 (7.2%) | 0 (0.0%) |
| 18 to 34 Years | 16 (1.9%) | 30 (3.6%) |
| 35 to 64 Years | 54 (4.4%) | 24 (1.8%) |
| 65 to 74 Years | 31 (9.9%) | 32 (10.8%) |
| 75 Years and over | 81 (51.3%) | 26 (7.3%) |
Disability Class: Vision Difficulty
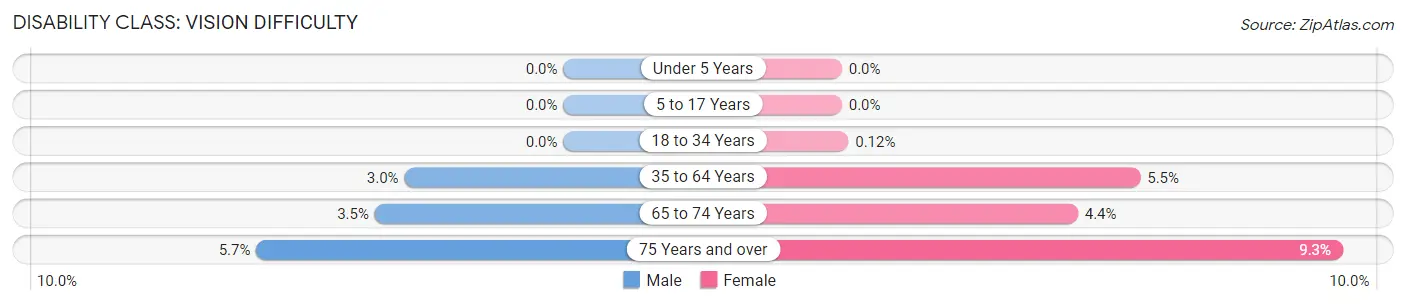
| Age Bracket | Male | Female |
| Under 5 Years | 0 (0.0%) | 0 (0.0%) |
| 5 to 17 Years | 0 (0.0%) | 0 (0.0%) |
| 18 to 34 Years | 0 (0.0%) | 1 (0.1%) |
| 35 to 64 Years | 36 (2.9%) | 73 (5.5%) |
| 65 to 74 Years | 11 (3.5%) | 13 (4.4%) |
| 75 Years and over | 9 (5.7%) | 33 (9.3%) |
Disability Class: Cognitive Difficulty
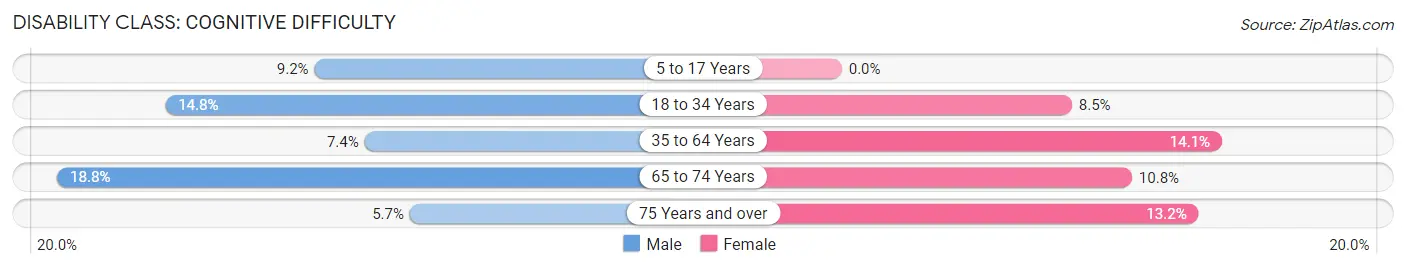
| Age Bracket | Male | Female |
| 5 to 17 Years | 51 (9.2%) | 0 (0.0%) |
| 18 to 34 Years | 124 (14.8%) | 72 (8.5%) |
| 35 to 64 Years | 90 (7.4%) | 186 (14.1%) |
| 65 to 74 Years | 59 (18.8%) | 32 (10.8%) |
| 75 Years and over | 9 (5.7%) | 47 (13.2%) |
Disability Class: Ambulatory Difficulty
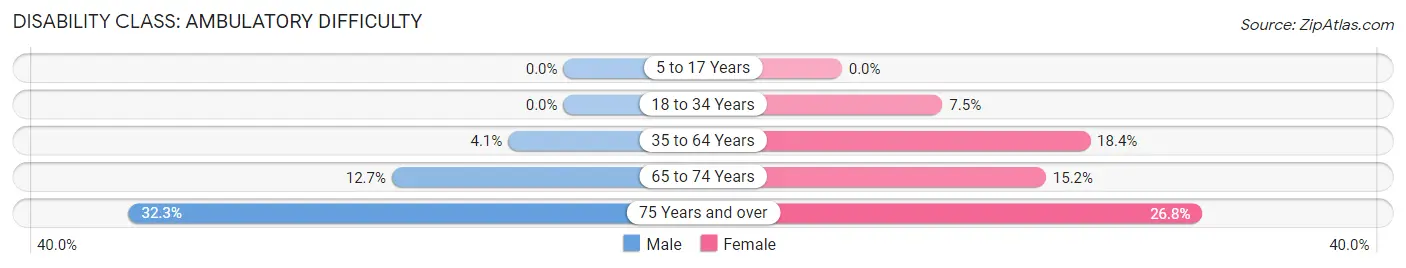
| Age Bracket | Male | Female |
| 5 to 17 Years | 0 (0.0%) | 0 (0.0%) |
| 18 to 34 Years | 0 (0.0%) | 63 (7.5%) |
| 35 to 64 Years | 50 (4.1%) | 243 (18.4%) |
| 65 to 74 Years | 40 (12.7%) | 45 (15.1%) |
| 75 Years and over | 51 (32.3%) | 95 (26.8%) |
Disability Class: Self-Care Difficulty
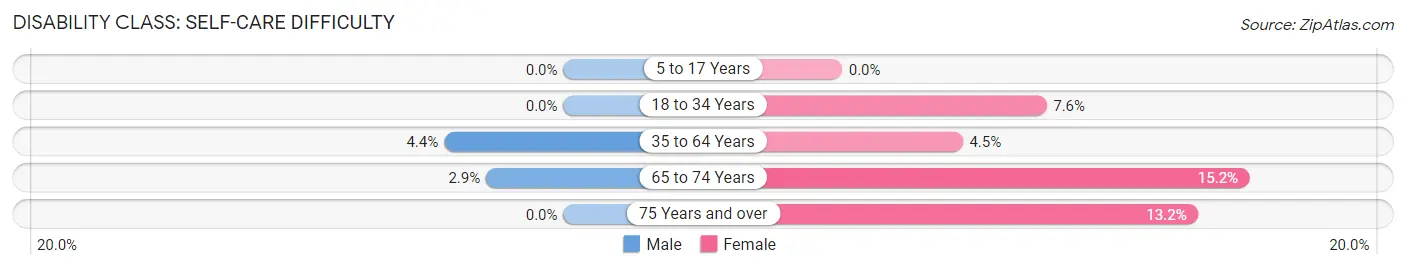
| Age Bracket | Male | Female |
| 5 to 17 Years | 0 (0.0%) | 0 (0.0%) |
| 18 to 34 Years | 0 (0.0%) | 64 (7.6%) |
| 35 to 64 Years | 54 (4.4%) | 59 (4.5%) |
| 65 to 74 Years | 9 (2.9%) | 45 (15.1%) |
| 75 Years and over | 0 (0.0%) | 47 (13.2%) |
Technology Access in Junction City
Computing Device Access in Junction City
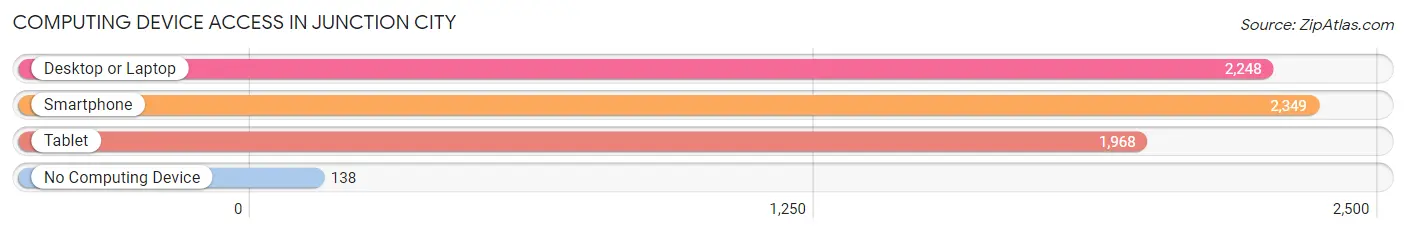
| Device Type | # Households | % Households |
| Desktop or Laptop | 2,248 | 81.1% |
| Smartphone | 2,349 | 84.7% |
| Tablet | 1,968 | 71.0% |
| No Computing Device | 138 | 5.0% |
| Total | 2,772 | 100.0% |
Internet Access in Junction City
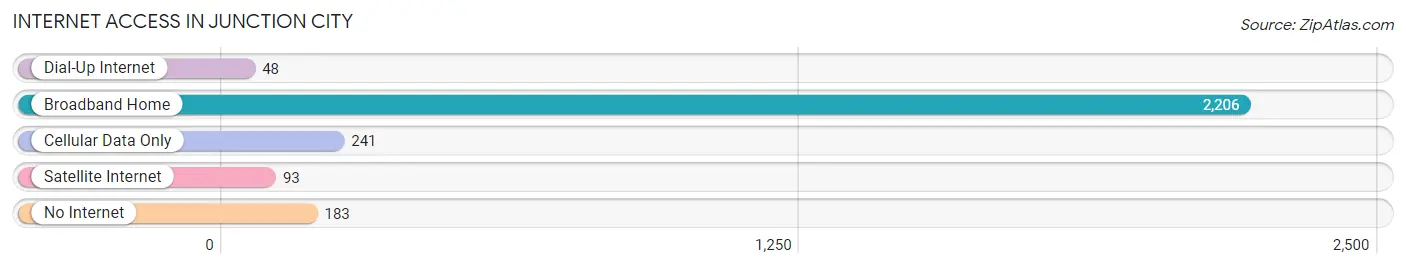
| Internet Type | # Households | % Households |
| Dial-Up Internet | 48 | 1.7% |
| Broadband Home | 2,206 | 79.6% |
| Cellular Data Only | 241 | 8.7% |
| Satellite Internet | 93 | 3.4% |
| No Internet | 183 | 6.6% |
| Total | 2,772 | 100.0% |
Junction City Summary
Junction City is a city located in Lane County, Oregon, United States. It is located on the Long Tom River, a tributary of the Willamette River, and is part of the Eugene-Springfield Metropolitan Statistical Area. As of the 2010 census, the city had a population of 5,392.
History
Junction City was founded in 1853 by a group of settlers led by William Meek, who named the settlement after the junction of the Long Tom River and the Willamette River. The town was incorporated in 1872 and was the first incorporated city in Lane County.
In the late 19th century, Junction City was a major center for the timber industry, with several sawmills located in the area. The city was also home to a number of other industries, including a brickyard, a flour mill, and a cannery.
Geography
Junction City is located at the junction of the Long Tom River and the Willamette River, approximately 15 miles east of Eugene. The city has a total area of 2.3 square miles, all of which is land.
The city is located in the Willamette Valley, a region of rolling hills and fertile soil. The climate is mild, with warm summers and cool winters.
Economy
Junction City is a small city with a diverse economy. The city is home to a number of businesses, including manufacturing, retail, and service industries. The city is also home to a number of agricultural operations, including dairy farms, vineyards, and nurseries.
The city is also home to a number of government agencies, including the Lane County Sheriff's Office, the Junction City Police Department, and the Junction City Fire Department.
Demographics
As of the 2010 census, the population of Junction City was 5,392. The racial makeup of the city was 87.3% White, 0.7% African American, 1.2% Native American, 0.9% Asian, 0.1% Pacific Islander, 6.2% from other races, and 3.7% from two or more races. Hispanic or Latino of any race were 11.2% of the population.
The median household income in Junction City was $41,944, and the median family income was $50,944. The per capita income for the city was $20,944. About 11.2% of families and 14.2% of the population were below the poverty line, including 19.2% of those under age 18 and 8.2% of those age 65 or over.
Common Questions
What is Per Capita Income in Junction City?
Per Capita income in Junction City is $32,459.
What is the Median Family Income in Junction City?
Median Family Income in Junction City is $87,880.
What is the Median Household income in Junction City?
Median Household Income in Junction City is $70,411.
What is Income or Wage Gap in Junction City?
Income or Wage Gap in Junction City is 26.7%.
Women in Junction City earn 73.3 cents for every dollar earned by a man.
What is Family Income Deficit in Junction City?
Family Income Deficit in Junction City is $13,954.
Families that are below poverty line in Junction City earn $13,954 less on average than the poverty threshold level.
What is Inequality or Gini Index in Junction City?
Inequality or Gini Index in Junction City is 0.37.
What is the Total Population of Junction City?
Total Population of Junction City is 6,831.
What is the Total Male Population of Junction City?
Total Male Population of Junction City is 3,435.
What is the Total Female Population of Junction City?
Total Female Population of Junction City is 3,396.
What is the Ratio of Males per 100 Females in Junction City?
There are 101.15 Males per 100 Females in Junction City.
What is the Ratio of Females per 100 Males in Junction City?
There are 98.86 Females per 100 Males in Junction City.
What is the Median Population Age in Junction City?
Median Population Age in Junction City is 38.5 Years.
What is the Average Family Size in Junction City
Average Family Size in Junction City is 2.9 People.
What is the Average Household Size in Junction City
Average Household Size in Junction City is 2.4 People.
How Large is the Labor Force in Junction City?
There are 3,760 People in the Labor Forcein in Junction City.
What is the Percentage of People in the Labor Force in Junction City?
67.9% of People are in the Labor Force in Junction City.
What is the Unemployment Rate in Junction City?
Unemployment Rate in Junction City is 6.0%.