Forked River, NJ Map & Demographics
Forked River Map
Forked River Overview
$46,836
PER CAPITA INCOME
$124,677
AVG FAMILY INCOME
$87,195
AVG HOUSEHOLD INCOME
25.7%
WAGE / INCOME GAP [ % ]
74.3¢/ $1
WAGE / INCOME GAP [ $ ]
0.46
INEQUALITY / GINI INDEX
5,003
TOTAL POPULATION
2,491
MALE POPULATION
2,512
FEMALE POPULATION
99.16
MALES / 100 FEMALES
100.84
FEMALES / 100 MALES
46.9
MEDIAN AGE
3.3
AVG FAMILY SIZE
2.4
AVG HOUSEHOLD SIZE
2,463
LABOR FORCE [ PEOPLE ]
61.8%
PERCENT IN LABOR FORCE
5.1%
UNEMPLOYMENT RATE
Forked River Zip Codes
Forked River Area Codes
Income in Forked River
Income Overview in Forked River
Per Capita Income in Forked River is $46,836, while median incomes of families and households are $124,677 and $87,195 respectively.
| Characteristic | Number | Measure |
| Per Capita Income | 5,003 | $46,836 |
| Median Family Income | 1,200 | $124,677 |
| Mean Family Income | 1,200 | $135,797 |
| Median Household Income | 2,088 | $87,195 |
| Mean Household Income | 2,088 | $109,328 |
| Income Deficit | 1,200 | $0 |
| Wage / Income Gap (%) | 5,003 | 25.72% |
| Wage / Income Gap ($) | 5,003 | 74.28¢ per $1 |
| Gini / Inequality Index | 5,003 | 0.46 |
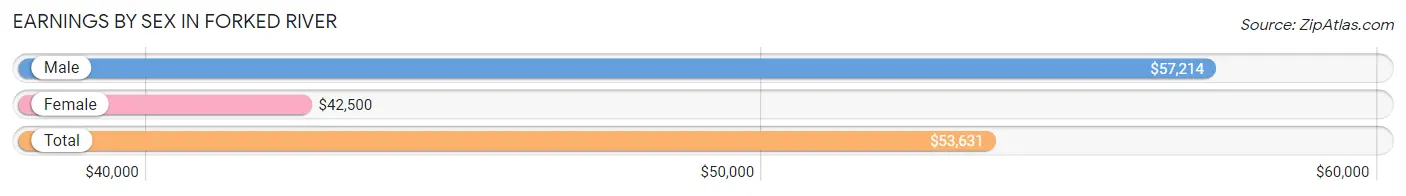
Earnings by Sex in Forked River
Average Earnings in Forked River are $53,631, $57,214 for men and $42,500 for women, a difference of 25.7%.
| Sex | Number | Average Earnings |
| Male | 1,478 (57.7%) | $57,214 |
| Female | 1,084 (42.3%) | $42,500 |
| Total | 2,562 (100.0%) | $53,631 |
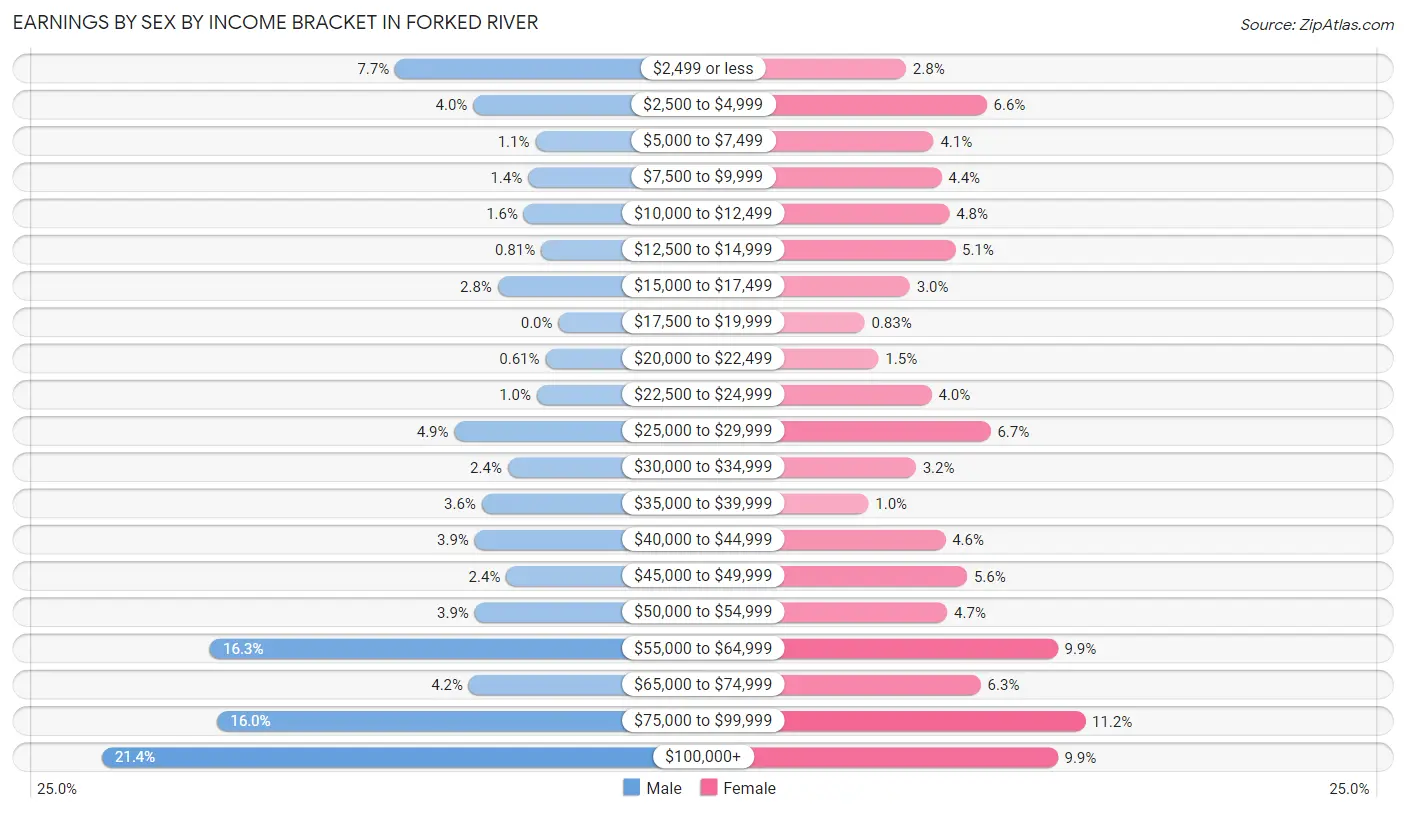
Earnings by Sex by Income Bracket in Forked River
The most common earnings brackets in Forked River are $100,000+ for men (316 | 21.4%) and $75,000 to $99,999 for women (121 | 11.2%).
| Income | Male | Female |
| $2,499 or less | 113 (7.6%) | 30 (2.8%) |
| $2,500 to $4,999 | 59 (4.0%) | 71 (6.6%) |
| $5,000 to $7,499 | 16 (1.1%) | 44 (4.1%) |
| $7,500 to $9,999 | 21 (1.4%) | 48 (4.4%) |
| $10,000 to $12,499 | 24 (1.6%) | 52 (4.8%) |
| $12,500 to $14,999 | 12 (0.8%) | 55 (5.1%) |
| $15,000 to $17,499 | 42 (2.8%) | 32 (2.9%) |
| $17,500 to $19,999 | 0 (0.0%) | 9 (0.8%) |
| $20,000 to $22,499 | 9 (0.6%) | 16 (1.5%) |
| $22,500 to $24,999 | 15 (1.0%) | 43 (4.0%) |
| $25,000 to $29,999 | 72 (4.9%) | 73 (6.7%) |
| $30,000 to $34,999 | 35 (2.4%) | 35 (3.2%) |
| $35,000 to $39,999 | 53 (3.6%) | 11 (1.0%) |
| $40,000 to $44,999 | 58 (3.9%) | 50 (4.6%) |
| $45,000 to $49,999 | 36 (2.4%) | 61 (5.6%) |
| $50,000 to $54,999 | 58 (3.9%) | 51 (4.7%) |
| $55,000 to $64,999 | 241 (16.3%) | 107 (9.9%) |
| $65,000 to $74,999 | 62 (4.2%) | 68 (6.3%) |
| $75,000 to $99,999 | 236 (16.0%) | 121 (11.2%) |
| $100,000+ | 316 (21.4%) | 107 (9.9%) |
| Total | 1,478 (100.0%) | 1,084 (100.0%) |
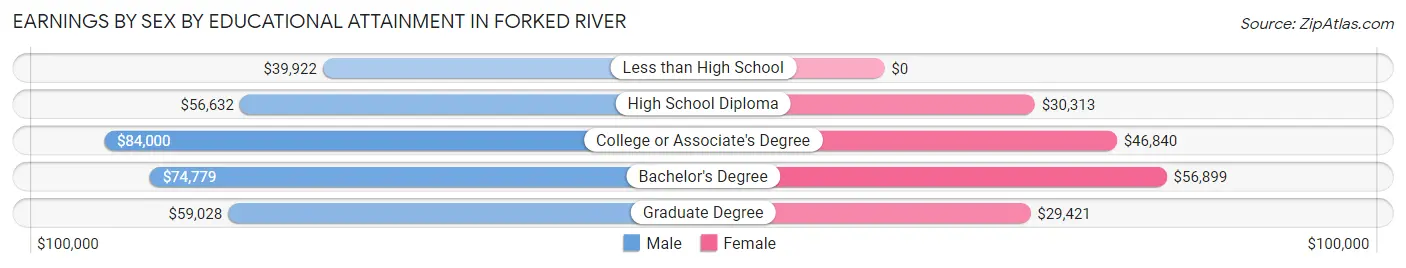
Earnings by Sex by Educational Attainment in Forked River
Average earnings in Forked River are $58,967 for men and $46,958 for women, a difference of 20.4%. Men with an educational attainment of college or associate's degree enjoy the highest average annual earnings of $84,000, while those with less than high school education earn the least with $39,922. Women with an educational attainment of bachelor's degree earn the most with the average annual earnings of $56,899, while those with graduate degree education have the smallest earnings of $29,421.
| Educational Attainment | Male Income | Female Income |
| Less than High School | $39,922 | $0 |
| High School Diploma | $56,632 | $30,313 |
| College or Associate's Degree | $84,000 | $46,840 |
| Bachelor's Degree | $74,779 | $56,899 |
| Graduate Degree | $59,028 | $29,421 |
| Total | $58,967 | $46,958 |
Family Income in Forked River
Family Income Brackets in Forked River
According to the Forked River family income data, there are 374 families falling into the $100,000 to $149,999 income range, which is the most common income bracket and makes up 31.2% of all families.
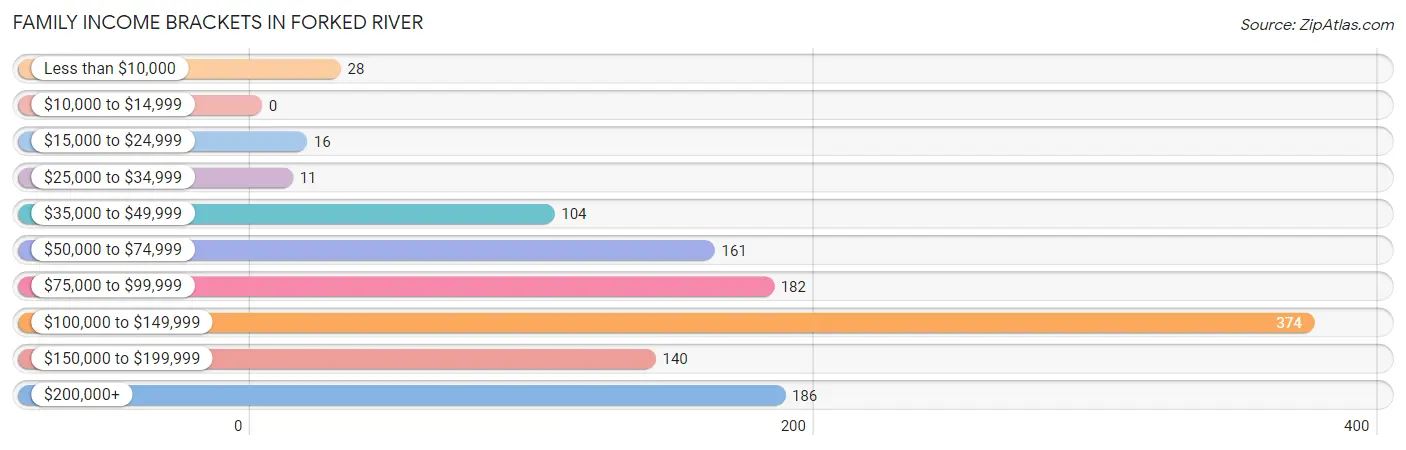
| Income Bracket | # Families | % Families |
| Less than $10,000 | 28 | 2.3% |
| $10,000 to $14,999 | 0 | 0.0% |
| $15,000 to $24,999 | 16 | 1.3% |
| $25,000 to $34,999 | 11 | 0.9% |
| $35,000 to $49,999 | 104 | 8.7% |
| $50,000 to $74,999 | 161 | 13.4% |
| $75,000 to $99,999 | 182 | 15.2% |
| $100,000 to $149,999 | 374 | 31.2% |
| $150,000 to $199,999 | 140 | 11.7% |
| $200,000+ | 186 | 15.5% |
Family Income by Famaliy Size in Forked River
3-person families (297 | 24.7%) account for the highest median family income in Forked River with $141,534 per family, while 2-person families (532 | 44.3%) have the highest median income of $47,890 per family member.
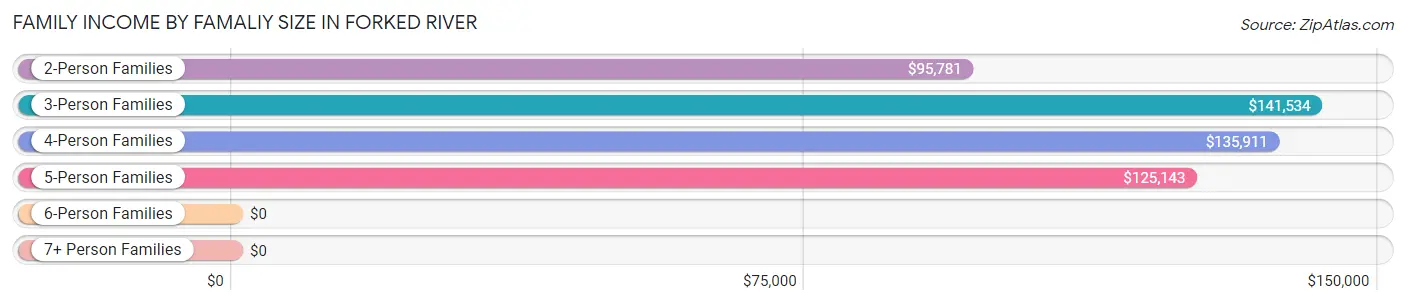
| Income Bracket | # Families | Median Income |
| 2-Person Families | 532 (44.3%) | $95,781 |
| 3-Person Families | 297 (24.7%) | $141,534 |
| 4-Person Families | 163 (13.6%) | $135,911 |
| 5-Person Families | 201 (16.8%) | $125,143 |
| 6-Person Families | 0 (0.0%) | $0 |
| 7+ Person Families | 7 (0.6%) | $0 |
| Total | 1,200 (100.0%) | $124,677 |
Family Income by Number of Earners in Forked River
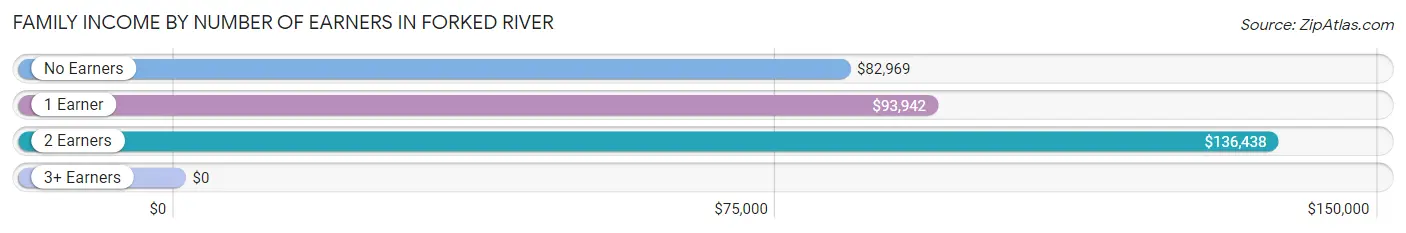
| Number of Earners | # Families | Median Income |
| No Earners | 102 (8.5%) | $82,969 |
| 1 Earner | 482 (40.2%) | $93,942 |
| 2 Earners | 451 (37.6%) | $136,438 |
| 3+ Earners | 165 (13.8%) | $0 |
| Total | 1,200 (100.0%) | $124,677 |
Household Income in Forked River
Household Income Brackets in Forked River
With 503 households falling in the category, the $100,000 to $149,999 income range is the most frequent in Forked River, accounting for 24.1% of all households. In contrast, only 56 households (2.7%) fall into the $15,000 to $24,999 income bracket, making it the least populous group.
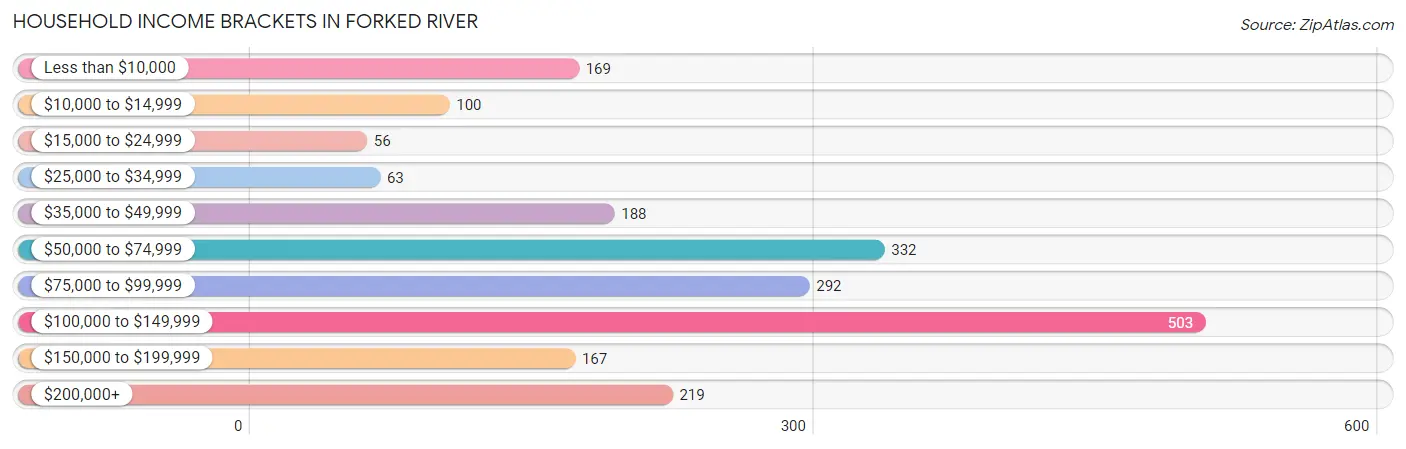
| Income Bracket | # Households | % Households |
| Less than $10,000 | 169 | 8.1% |
| $10,000 to $14,999 | 100 | 4.8% |
| $15,000 to $24,999 | 56 | 2.7% |
| $25,000 to $34,999 | 63 | 3.0% |
| $35,000 to $49,999 | 188 | 9.0% |
| $50,000 to $74,999 | 332 | 15.9% |
| $75,000 to $99,999 | 292 | 14.0% |
| $100,000 to $149,999 | 503 | 24.1% |
| $150,000 to $199,999 | 167 | 8.0% |
| $200,000+ | 219 | 10.5% |
Household Income by Householder Age in Forked River
The median household income in Forked River is $87,195, with the highest median household income of $123,065 found in the 25 to 44 years age bracket for the primary householder. A total of 432 households (20.7%) fall into this category. Meanwhile, the 15 to 24 years age bracket for the primary householder has the lowest median household income of $0, with 44 households (2.1%) in this group.
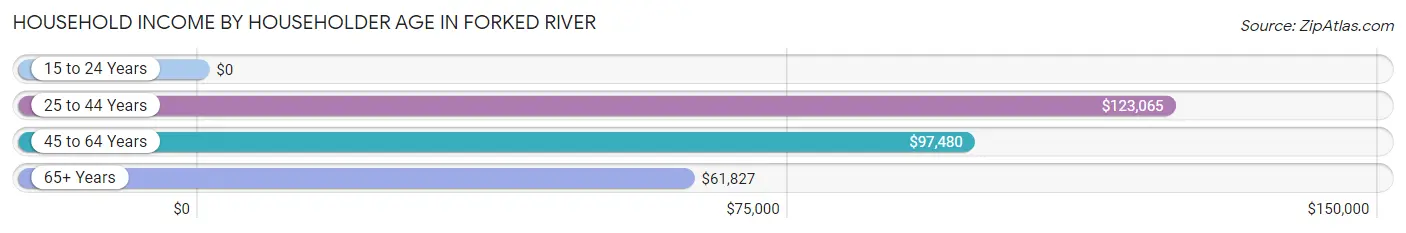
| Income Bracket | # Households | Median Income |
| 15 to 24 Years | 44 (2.1%) | $0 |
| 25 to 44 Years | 432 (20.7%) | $123,065 |
| 45 to 64 Years | 787 (37.7%) | $97,480 |
| 65+ Years | 825 (39.5%) | $61,827 |
| Total | 2,088 (100.0%) | $87,195 |
Poverty in Forked River
Income Below Poverty by Sex and Age in Forked River
With 3.8% poverty level for males and 10.6% for females among the residents of Forked River, 18 to 24 year old males and 75 year old and over females are the most vulnerable to poverty, with 35 males (16.1%) and 174 females (47.7%) in their respective age groups living below the poverty level.
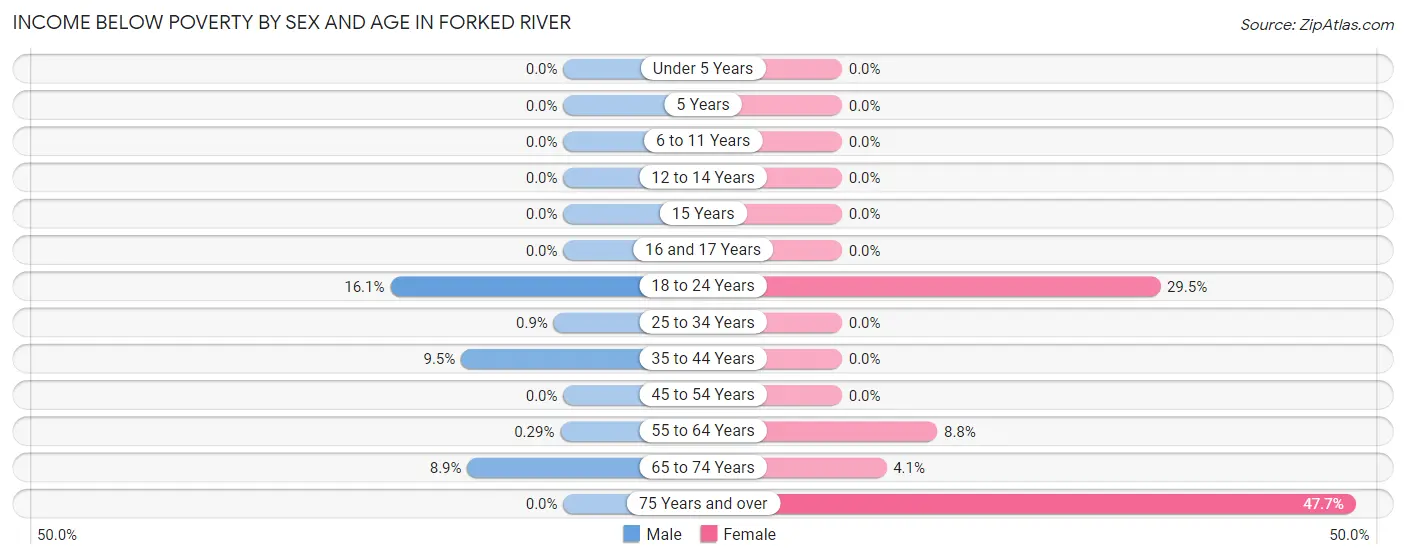
| Age Bracket | Male | Female |
| Under 5 Years | 0 (0.0%) | 0 (0.0%) |
| 5 Years | 0 (0.0%) | 0 (0.0%) |
| 6 to 11 Years | 0 (0.0%) | 0 (0.0%) |
| 12 to 14 Years | 0 (0.0%) | 0 (0.0%) |
| 15 Years | 0 (0.0%) | 0 (0.0%) |
| 16 and 17 Years | 0 (0.0%) | 0 (0.0%) |
| 18 to 24 Years | 35 (16.1%) | 44 (29.5%) |
| 25 to 34 Years | 2 (0.9%) | 0 (0.0%) |
| 35 to 44 Years | 26 (9.5%) | 0 (0.0%) |
| 45 to 54 Years | 0 (0.0%) | 0 (0.0%) |
| 55 to 64 Years | 1 (0.3%) | 35 (8.8%) |
| 65 to 74 Years | 31 (8.9%) | 11 (4.1%) |
| 75 Years and over | 0 (0.0%) | 174 (47.7%) |
| Total | 95 (3.8%) | 264 (10.6%) |
Income Above Poverty by Sex and Age in Forked River
According to the poverty statistics in Forked River, males aged under 5 years and females aged under 5 years are the age groups that are most secure financially, with 100.0% of males and 100.0% of females in these age groups living above the poverty line.
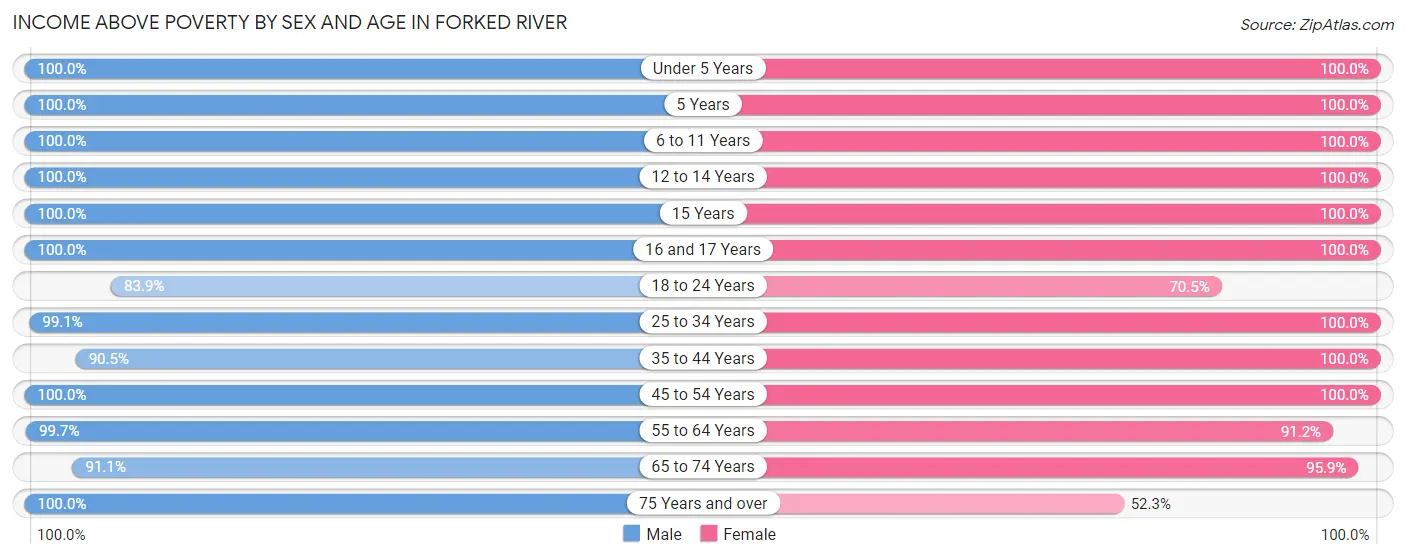
| Age Bracket | Male | Female |
| Under 5 Years | 54 (100.0%) | 183 (100.0%) |
| 5 Years | 15 (100.0%) | 9 (100.0%) |
| 6 to 11 Years | 180 (100.0%) | 113 (100.0%) |
| 12 to 14 Years | 92 (100.0%) | 271 (100.0%) |
| 15 Years | 34 (100.0%) | 55 (100.0%) |
| 16 and 17 Years | 60 (100.0%) | 14 (100.0%) |
| 18 to 24 Years | 183 (83.9%) | 105 (70.5%) |
| 25 to 34 Years | 219 (99.1%) | 139 (100.0%) |
| 35 to 44 Years | 248 (90.5%) | 243 (100.0%) |
| 45 to 54 Years | 530 (100.0%) | 297 (100.0%) |
| 55 to 64 Years | 340 (99.7%) | 361 (91.2%) |
| 65 to 74 Years | 317 (91.1%) | 256 (95.9%) |
| 75 Years and over | 119 (100.0%) | 191 (52.3%) |
| Total | 2,391 (96.2%) | 2,237 (89.4%) |
Income Below Poverty Among Married-Couple Families in Forked River
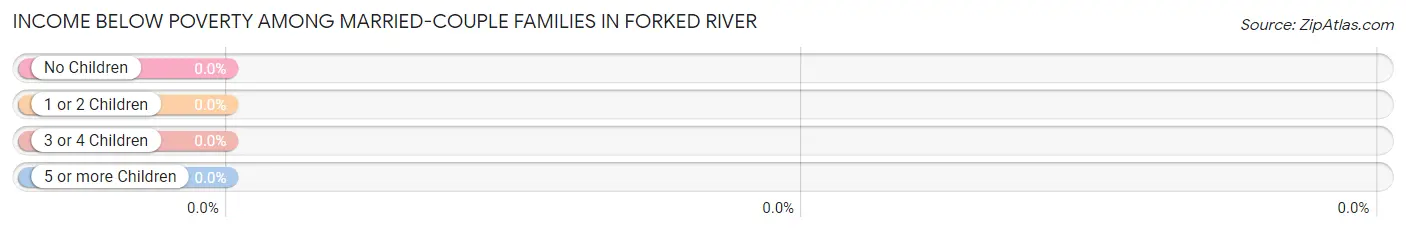
| Children | Above Poverty | Below Poverty |
| No Children | 611 (100.0%) | 0 (0.0%) |
| 1 or 2 Children | 282 (100.0%) | 0 (0.0%) |
| 3 or 4 Children | 109 (100.0%) | 0 (0.0%) |
| 5 or more Children | 7 (100.0%) | 0 (0.0%) |
| Total | 1,009 (100.0%) | 0 (0.0%) |
Income Below Poverty Among Single-Parent Households in Forked River
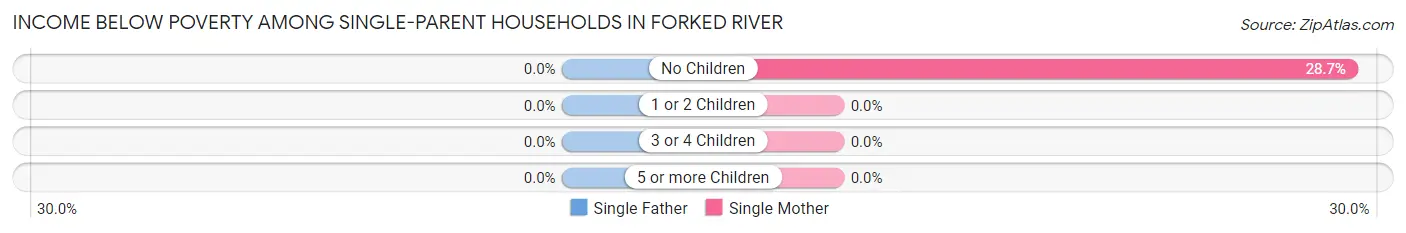
| Children | Single Father | Single Mother |
| No Children | 0 (0.0%) | 27 (28.7%) |
| 1 or 2 Children | 0 (0.0%) | 0 (0.0%) |
| 3 or 4 Children | 0 (0.0%) | 0 (0.0%) |
| 5 or more Children | 0 (0.0%) | 0 (0.0%) |
| Total | 0 (0.0%) | 27 (22.0%) |
Income Below Poverty Among Married-Couple vs Single-Parent Households in Forked River
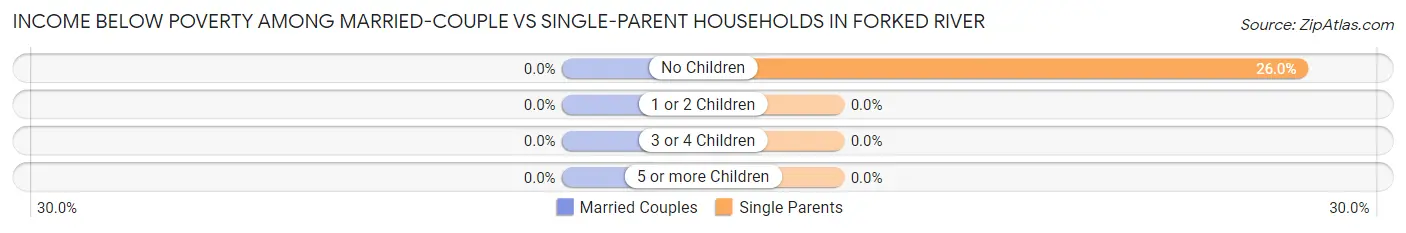
| Children | Married-Couple Families | Single-Parent Households |
| No Children | 0 (0.0%) | 27 (26.0%) |
| 1 or 2 Children | 0 (0.0%) | 0 (0.0%) |
| 3 or 4 Children | 0 (0.0%) | 0 (0.0%) |
| 5 or more Children | 0 (0.0%) | 0 (0.0%) |
| Total | 0 (0.0%) | 27 (14.1%) |
Race in Forked River
The most populous races in Forked River are White / Caucasian (4,289 | 85.7%), Hispanic or Latino (664 | 13.3%), and Some other Race (296 | 5.9%).
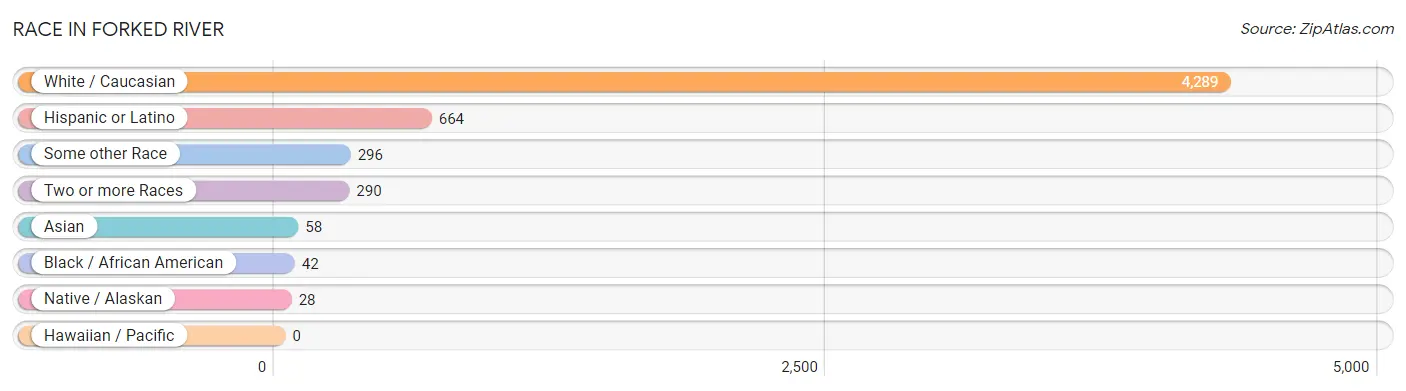
| Race | # Population | % Population |
| Asian | 58 | 1.2% |
| Black / African American | 42 | 0.8% |
| Hawaiian / Pacific | 0 | 0.0% |
| Hispanic or Latino | 664 | 13.3% |
| Native / Alaskan | 28 | 0.6% |
| White / Caucasian | 4,289 | 85.7% |
| Two or more Races | 290 | 5.8% |
| Some other Race | 296 | 5.9% |
| Total | 5,003 | 100.0% |
Ancestry in Forked River
The most populous ancestries reported in Forked River are Italian (1,334 | 26.7%), Irish (1,178 | 23.5%), German (747 | 14.9%), Polish (433 | 8.6%), and English (387 | 7.7%), together accounting for 81.5% of all Forked River residents.
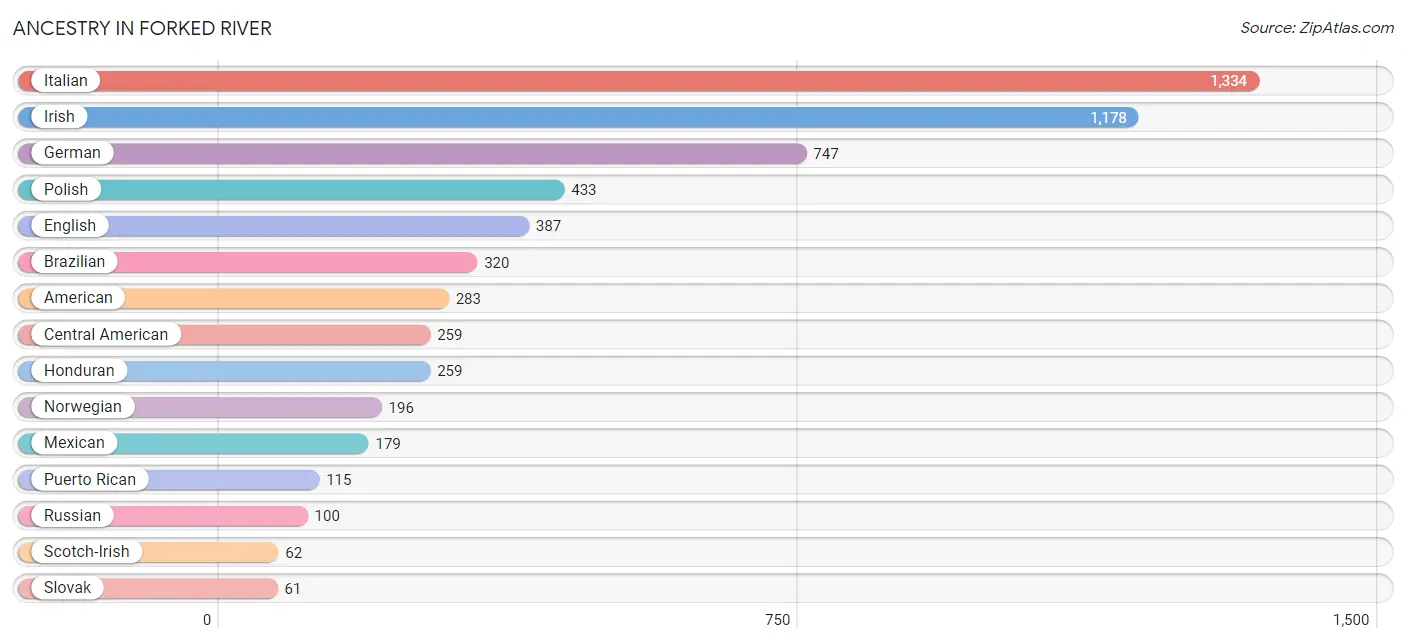
| Ancestry | # Population | % Population |
| American | 283 | 5.7% |
| Austrian | 5 | 0.1% |
| Belgian | 9 | 0.2% |
| Brazilian | 320 | 6.4% |
| British | 11 | 0.2% |
| Bulgarian | 50 | 1.0% |
| Burmese | 39 | 0.8% |
| Celtic | 7 | 0.1% |
| Central American | 259 | 5.2% |
| Cherokee | 9 | 0.2% |
| Colombian | 44 | 0.9% |
| Cuban | 28 | 0.6% |
| Czech | 11 | 0.2% |
| Danish | 27 | 0.5% |
| Dominican | 38 | 0.8% |
| Dutch | 9 | 0.2% |
| Eastern European | 15 | 0.3% |
| English | 387 | 7.7% |
| European | 5 | 0.1% |
| Finnish | 8 | 0.2% |
| French | 46 | 0.9% |
| French Canadian | 5 | 0.1% |
| German | 747 | 14.9% |
| Greek | 35 | 0.7% |
| Honduran | 259 | 5.2% |
| Hungarian | 53 | 1.1% |
| Irish | 1,178 | 23.5% |
| Italian | 1,334 | 26.7% |
| Korean | 7 | 0.1% |
| Lithuanian | 56 | 1.1% |
| Mexican | 179 | 3.6% |
| Mexican American Indian | 28 | 0.6% |
| Norwegian | 196 | 3.9% |
| Polish | 433 | 8.6% |
| Puerto Rican | 115 | 2.3% |
| Russian | 100 | 2.0% |
| Scotch-Irish | 62 | 1.2% |
| Scottish | 44 | 0.9% |
| Slovak | 61 | 1.2% |
| South American | 44 | 0.9% |
| Sri Lankan | 12 | 0.2% |
| Swedish | 31 | 0.6% |
| Ukrainian | 34 | 0.7% |
| Welsh | 35 | 0.7% | View All 44 Rows |
Immigrants in Forked River
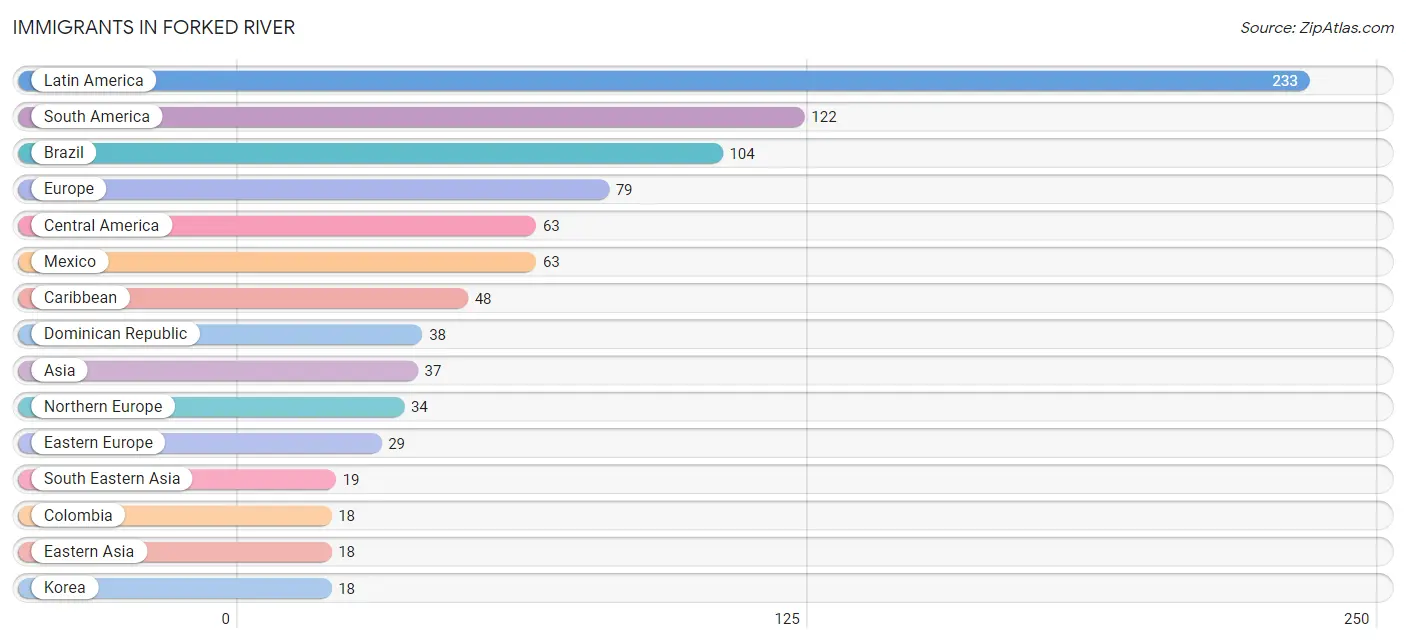
The most numerous immigrant groups reported in Forked River came from Latin America (233 | 4.7%), South America (122 | 2.4%), Brazil (104 | 2.1%), Europe (79 | 1.6%), and Central America (63 | 1.3%), together accounting for 12.0% of all Forked River residents.
| Immigration Origin | # Population | % Population |
| Asia | 37 | 0.7% |
| Brazil | 104 | 2.1% |
| Bulgaria | 17 | 0.3% |
| Canada | 7 | 0.1% |
| Caribbean | 48 | 1.0% |
| Central America | 63 | 1.3% |
| Colombia | 18 | 0.4% |
| Cuba | 10 | 0.2% |
| Dominican Republic | 38 | 0.8% |
| Eastern Asia | 18 | 0.4% |
| Eastern Europe | 29 | 0.6% |
| England | 11 | 0.2% |
| Europe | 79 | 1.6% |
| Germany | 16 | 0.3% |
| Ireland | 13 | 0.3% |
| Korea | 18 | 0.4% |
| Latin America | 233 | 4.7% |
| Mexico | 63 | 1.3% |
| Northern Europe | 34 | 0.7% |
| Philippines | 7 | 0.1% |
| Poland | 12 | 0.2% |
| Scotland | 10 | 0.2% |
| South America | 122 | 2.4% |
| South Eastern Asia | 19 | 0.4% |
| Vietnam | 12 | 0.2% |
| Western Europe | 16 | 0.3% | View All 26 Rows |
Sex and Age in Forked River
Sex and Age in Forked River
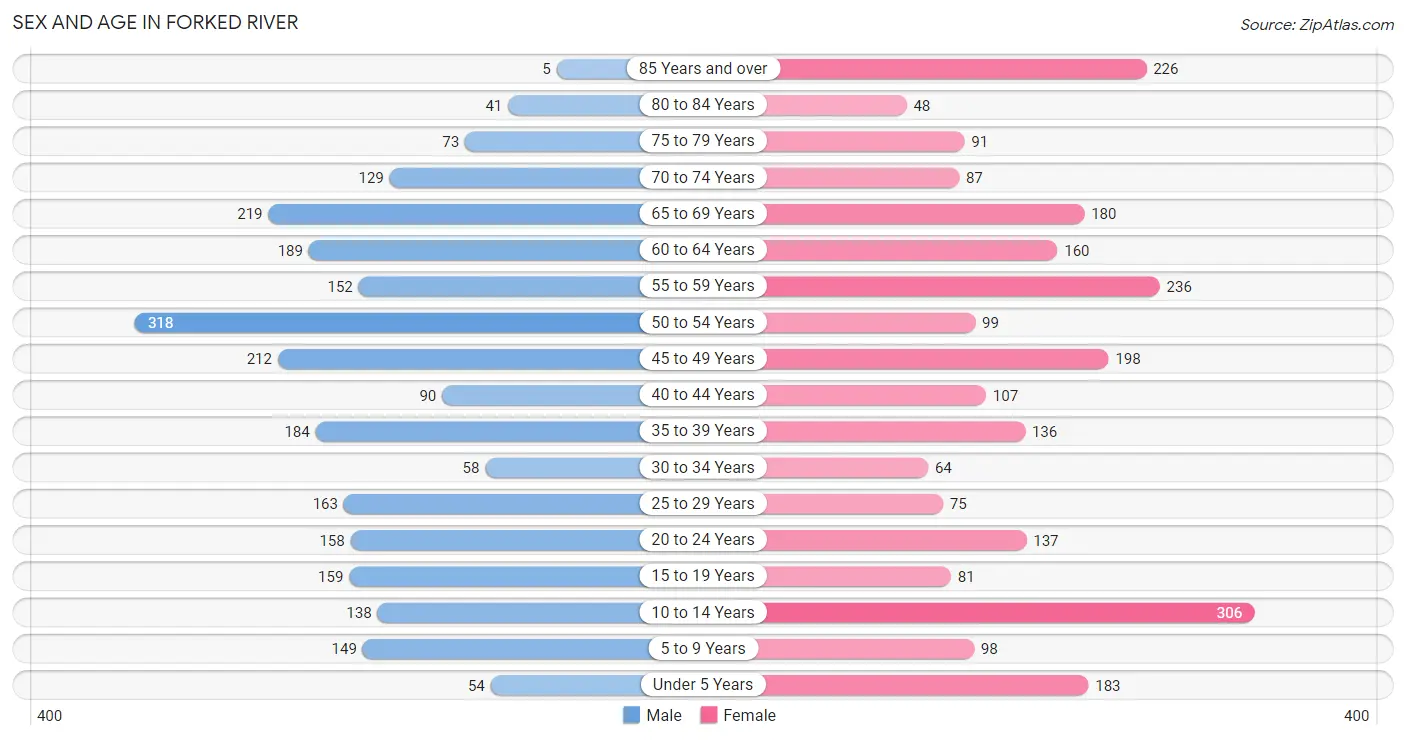
The most populous age groups in Forked River are 50 to 54 Years (318 | 12.8%) for men and 10 to 14 Years (306 | 12.2%) for women.
| Age Bracket | Male | Female |
| Under 5 Years | 54 (2.2%) | 183 (7.3%) |
| 5 to 9 Years | 149 (6.0%) | 98 (3.9%) |
| 10 to 14 Years | 138 (5.5%) | 306 (12.2%) |
| 15 to 19 Years | 159 (6.4%) | 81 (3.2%) |
| 20 to 24 Years | 158 (6.3%) | 137 (5.4%) |
| 25 to 29 Years | 163 (6.5%) | 75 (3.0%) |
| 30 to 34 Years | 58 (2.3%) | 64 (2.5%) |
| 35 to 39 Years | 184 (7.4%) | 136 (5.4%) |
| 40 to 44 Years | 90 (3.6%) | 107 (4.3%) |
| 45 to 49 Years | 212 (8.5%) | 198 (7.9%) |
| 50 to 54 Years | 318 (12.8%) | 99 (3.9%) |
| 55 to 59 Years | 152 (6.1%) | 236 (9.4%) |
| 60 to 64 Years | 189 (7.6%) | 160 (6.4%) |
| 65 to 69 Years | 219 (8.8%) | 180 (7.2%) |
| 70 to 74 Years | 129 (5.2%) | 87 (3.5%) |
| 75 to 79 Years | 73 (2.9%) | 91 (3.6%) |
| 80 to 84 Years | 41 (1.7%) | 48 (1.9%) |
| 85 Years and over | 5 (0.2%) | 226 (9.0%) |
| Total | 2,491 (100.0%) | 2,512 (100.0%) |
Families and Households in Forked River
Median Family Size in Forked River
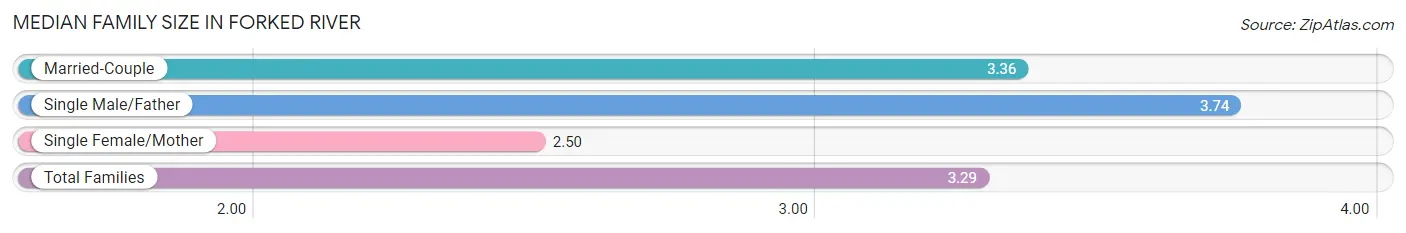
The median family size in Forked River is 3.29 persons per family, with single male/father families (68 | 5.7%) accounting for the largest median family size of 3.74 persons per family. On the other hand, single female/mother families (123 | 10.2%) represent the smallest median family size with 2.50 persons per family.
| Family Type | # Families | Family Size |
| Married-Couple | 1,009 (84.1%) | 3.36 |
| Single Male/Father | 68 (5.7%) | 3.74 |
| Single Female/Mother | 123 (10.2%) | 2.50 |
| Total Families | 1,200 (100.0%) | 3.29 |
Median Household Size in Forked River
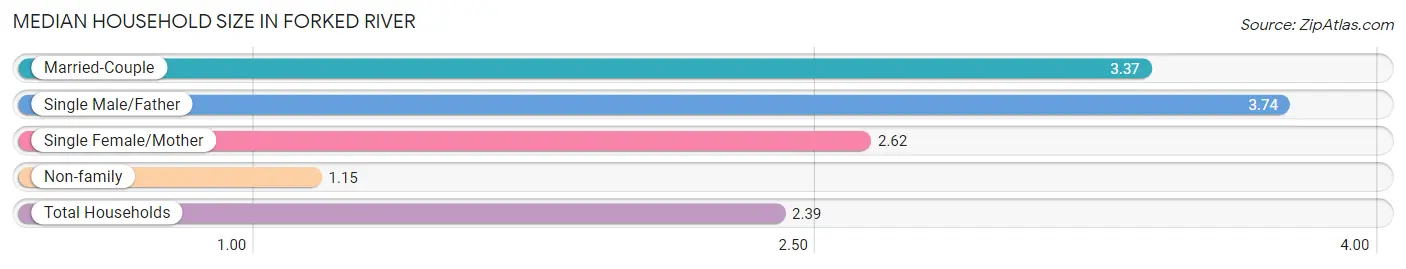
The median household size in Forked River is 2.39 persons per household, with single male/father households (68 | 3.3%) accounting for the largest median household size of 3.74 persons per household. non-family households (888 | 42.5%) represent the smallest median household size with 1.15 persons per household.
| Household Type | # Households | Household Size |
| Married-Couple | 1,009 (48.3%) | 3.37 |
| Single Male/Father | 68 (3.3%) | 3.74 |
| Single Female/Mother | 123 (5.9%) | 2.62 |
| Non-family | 888 (42.5%) | 1.15 |
| Total Households | 2,088 (100.0%) | 2.39 |
Household Size by Marriage Status in Forked River
Out of a total of 2,088 households in Forked River, 1,200 (57.5%) are family households, while 888 (42.5%) are nonfamily households. The most numerous type of family households are 2-person households, comprising 523, and the most common type of nonfamily households are 1-person households, comprising 777.
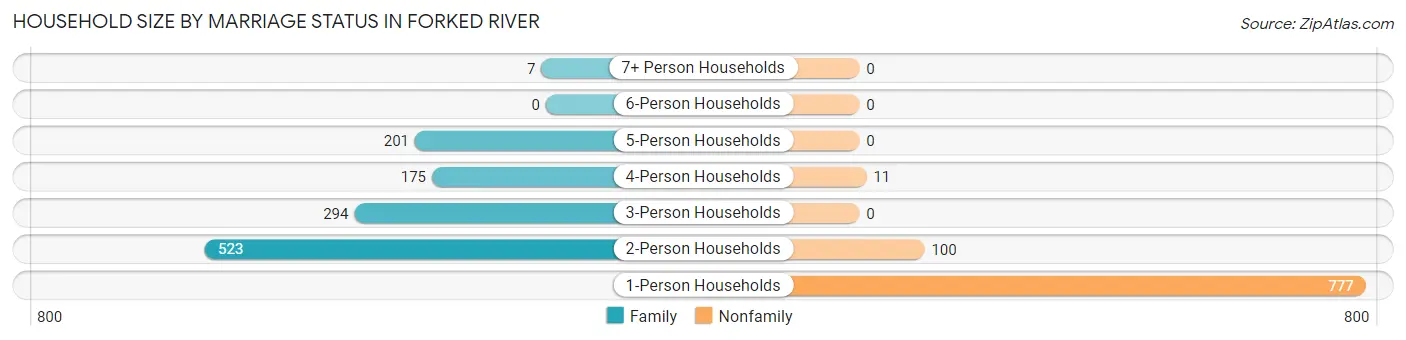
| Household Size | Family Households | Nonfamily Households |
| 1-Person Households | - | 777 (37.2%) |
| 2-Person Households | 523 (25.1%) | 100 (4.8%) |
| 3-Person Households | 294 (14.1%) | 0 (0.0%) |
| 4-Person Households | 175 (8.4%) | 11 (0.5%) |
| 5-Person Households | 201 (9.6%) | 0 (0.0%) |
| 6-Person Households | 0 (0.0%) | 0 (0.0%) |
| 7+ Person Households | 7 (0.3%) | 0 (0.0%) |
| Total | 1,200 (57.5%) | 888 (42.5%) |
Female Fertility in Forked River
Fertility by Age in Forked River
Average fertility rate in Forked River is 39.0 births per 1,000 women. Women in the age bracket of 20 to 34 years have the highest fertility rate with 58.0 births per 1,000 women. Women in the age bracket of 35 to 50 years acount for 52.9% of all women with births.
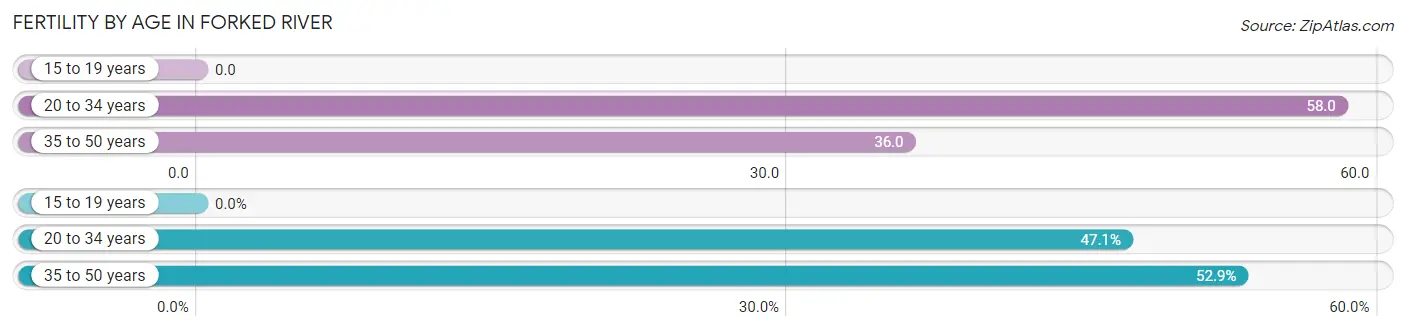
| Age Bracket | Women with Births | Births / 1,000 Women |
| 15 to 19 years | 0 (0.0%) | 0.0 |
| 20 to 34 years | 16 (47.1%) | 58.0 |
| 35 to 50 years | 18 (52.9%) | 36.0 |
| Total | 34 (100.0%) | 39.0 |
Fertility by Age by Marriage Status in Forked River
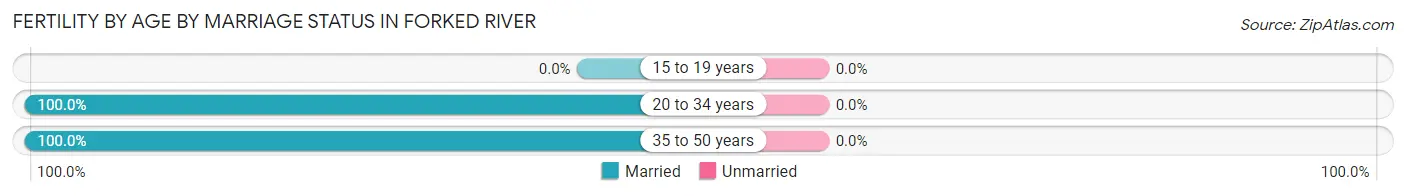
| Age Bracket | Married | Unmarried |
| 15 to 19 years | 0 (0.0%) | 0 (0.0%) |
| 20 to 34 years | 16 (100.0%) | 0 (0.0%) |
| 35 to 50 years | 18 (100.0%) | 0 (0.0%) |
| Total | 34 (100.0%) | 0 (0.0%) |
Fertility by Education in Forked River
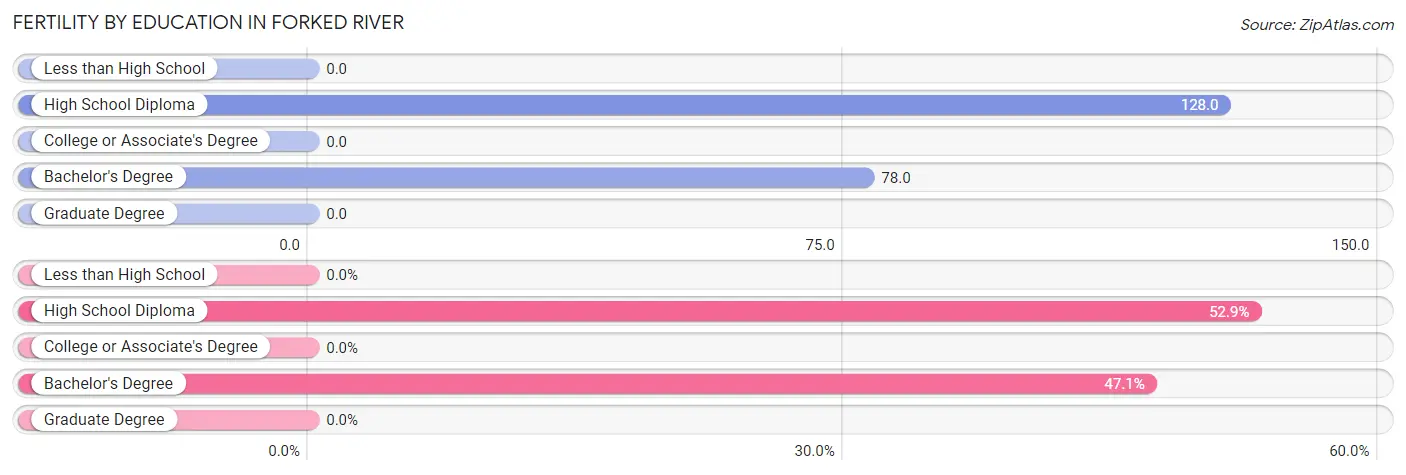
| Educational Attainment | Women with Births | Births / 1,000 Women |
| Less than High School | 0 (0.0%) | 0.0 |
| High School Diploma | 18 (52.9%) | 128.0 |
| College or Associate's Degree | 0 (0.0%) | 0.0 |
| Bachelor's Degree | 16 (47.1%) | 78.0 |
| Graduate Degree | 0 (0.0%) | 0.0 |
| Total | 34 (100.0%) | 39.0 |
Fertility by Education by Marriage Status in Forked River
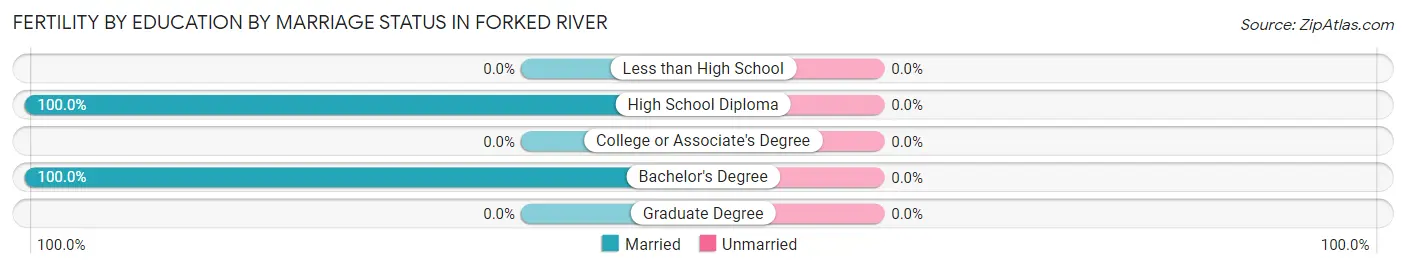
| Educational Attainment | Married | Unmarried |
| Less than High School | 0 (0.0%) | 0 (0.0%) |
| High School Diploma | 18 (100.0%) | 0 (0.0%) |
| College or Associate's Degree | 0 (0.0%) | 0 (0.0%) |
| Bachelor's Degree | 16 (100.0%) | 0 (0.0%) |
| Graduate Degree | 0 (0.0%) | 0 (0.0%) |
| Total | 34 (100.0%) | 0 (0.0%) |
Employment Characteristics in Forked River
Employment by Class of Employer in Forked River
Among the 2,268 employed individuals in Forked River, private company employees (1,629 | 71.8%), self-employed (not incorporated) (147 | 6.5%), and self-employed (incorporated) (145 | 6.4%) make up the most common classes of employment.
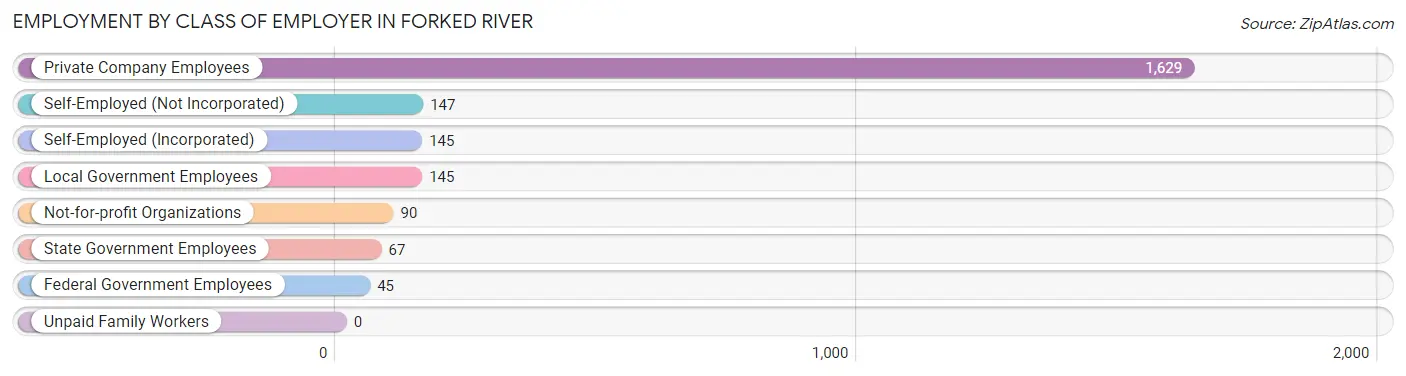
| Employer Class | # Employees | % Employees |
| Private Company Employees | 1,629 | 71.8% |
| Self-Employed (Incorporated) | 145 | 6.4% |
| Self-Employed (Not Incorporated) | 147 | 6.5% |
| Not-for-profit Organizations | 90 | 4.0% |
| Local Government Employees | 145 | 6.4% |
| State Government Employees | 67 | 2.9% |
| Federal Government Employees | 45 | 2.0% |
| Unpaid Family Workers | 0 | 0.0% |
| Total | 2,268 | 100.0% |
Employment Status by Age in Forked River
According to the labor force statistics for Forked River, out of the total population over 16 years of age (3,985), 61.8% or 2,463 individuals are in the labor force, with 5.1% or 126 of them unemployed. The age group with the highest labor force participation rate is 25 to 29 years, with 93.7% or 223 individuals in the labor force. Within the labor force, the 16 to 19 years age range has the highest percentage of unemployed individuals, with 100.0% or 8 of them being unemployed.
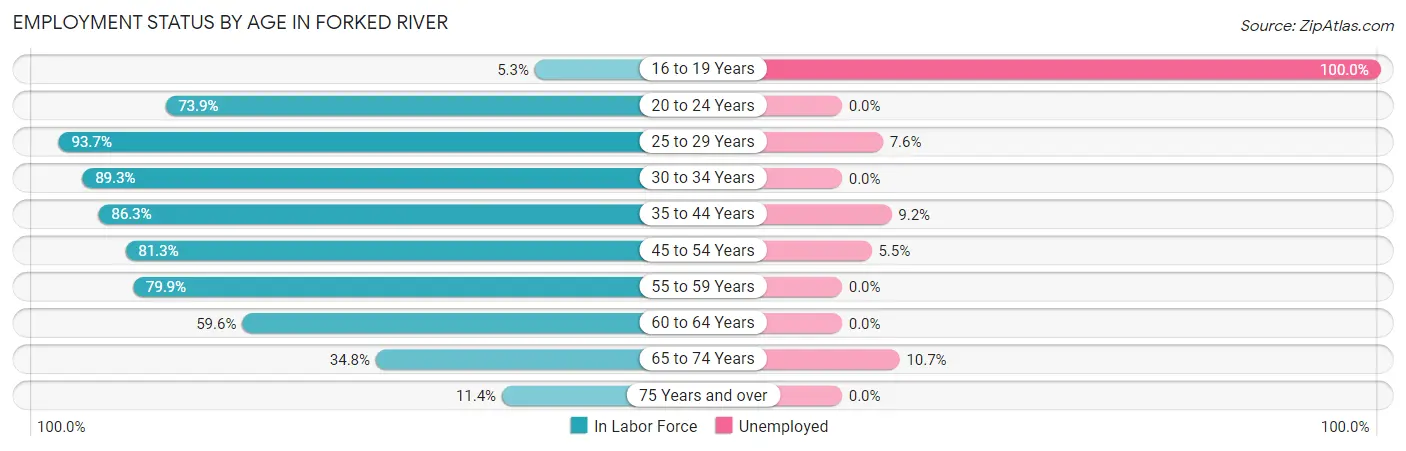
| Age Bracket | In Labor Force | Unemployed |
| 16 to 19 Years | 8 (5.3%) | 8 (100.0%) |
| 20 to 24 Years | 218 (73.9%) | 0 (0.0%) |
| 25 to 29 Years | 223 (93.7%) | 17 (7.6%) |
| 30 to 34 Years | 109 (89.3%) | 0 (0.0%) |
| 35 to 44 Years | 446 (86.3%) | 41 (9.2%) |
| 45 to 54 Years | 672 (81.3%) | 37 (5.5%) |
| 55 to 59 Years | 310 (79.9%) | 0 (0.0%) |
| 60 to 64 Years | 208 (59.6%) | 0 (0.0%) |
| 65 to 74 Years | 214 (34.8%) | 23 (10.7%) |
| 75 Years and over | 55 (11.4%) | 0 (0.0%) |
| Total | 2,463 (61.8%) | 126 (5.1%) |
Employment Status by Educational Attainment in Forked River
According to labor force statistics for Forked River, 80.6% of individuals (1,967) out of the total population between 25 and 64 years of age (2,441) are in the labor force, with 4.8% or 94 of them being unemployed. The group with the highest labor force participation rate are those with the educational attainment of bachelor's degree or higher, with 84.6% or 543 individuals in the labor force. Within the labor force, individuals with less than high school education have the highest percentage of unemployment, with 40.5% or 17 of them being unemployed.
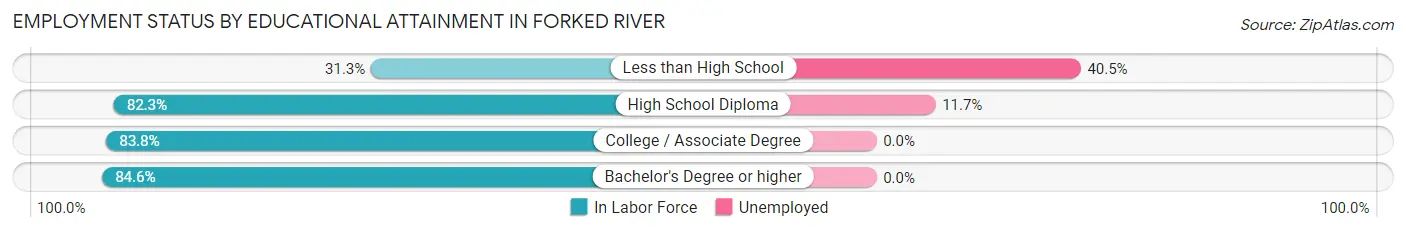
| Educational Attainment | In Labor Force | Unemployed |
| Less than High School | 42 (31.3%) | 54 (40.5%) |
| High School Diploma | 668 (82.3%) | 95 (11.7%) |
| College / Associate Degree | 715 (83.8%) | 0 (0.0%) |
| Bachelor's Degree or higher | 543 (84.6%) | 0 (0.0%) |
| Total | 1,967 (80.6%) | 117 (4.8%) |
Employment Occupations by Sex in Forked River
Management, Business, Science and Arts Occupations
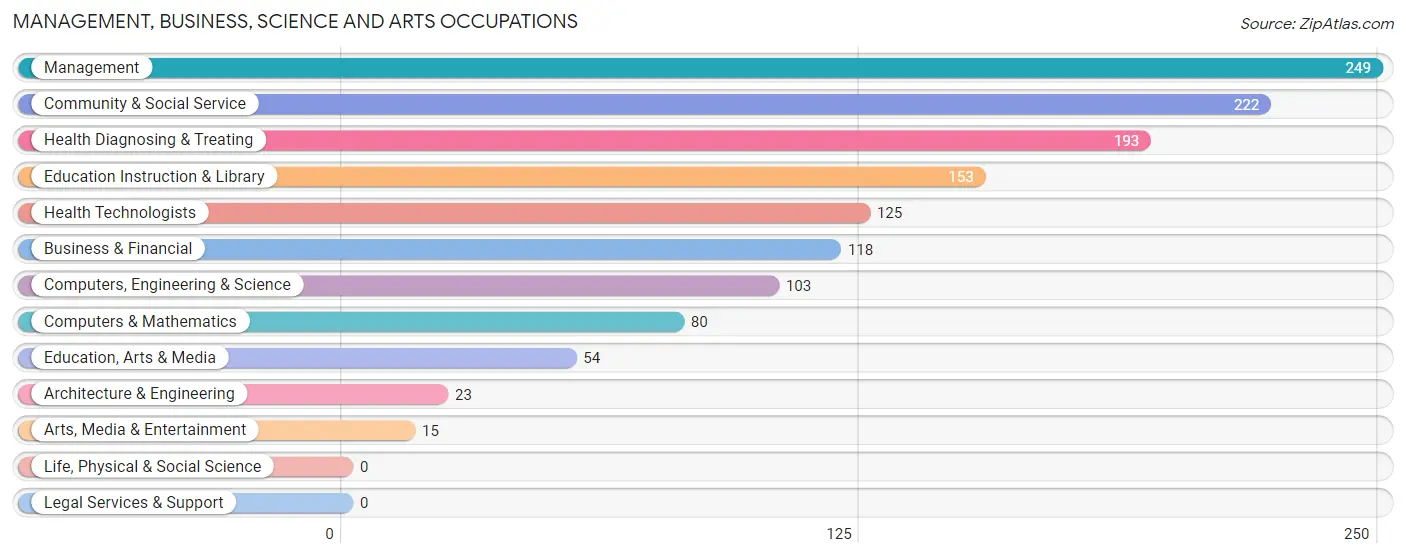
The most common Management, Business, Science and Arts occupations in Forked River are Management (249 | 10.6%), Community & Social Service (222 | 9.5%), Health Diagnosing & Treating (193 | 8.3%), Education Instruction & Library (153 | 6.6%), and Health Technologists (125 | 5.3%).
Management, Business, Science and Arts Occupations by Sex
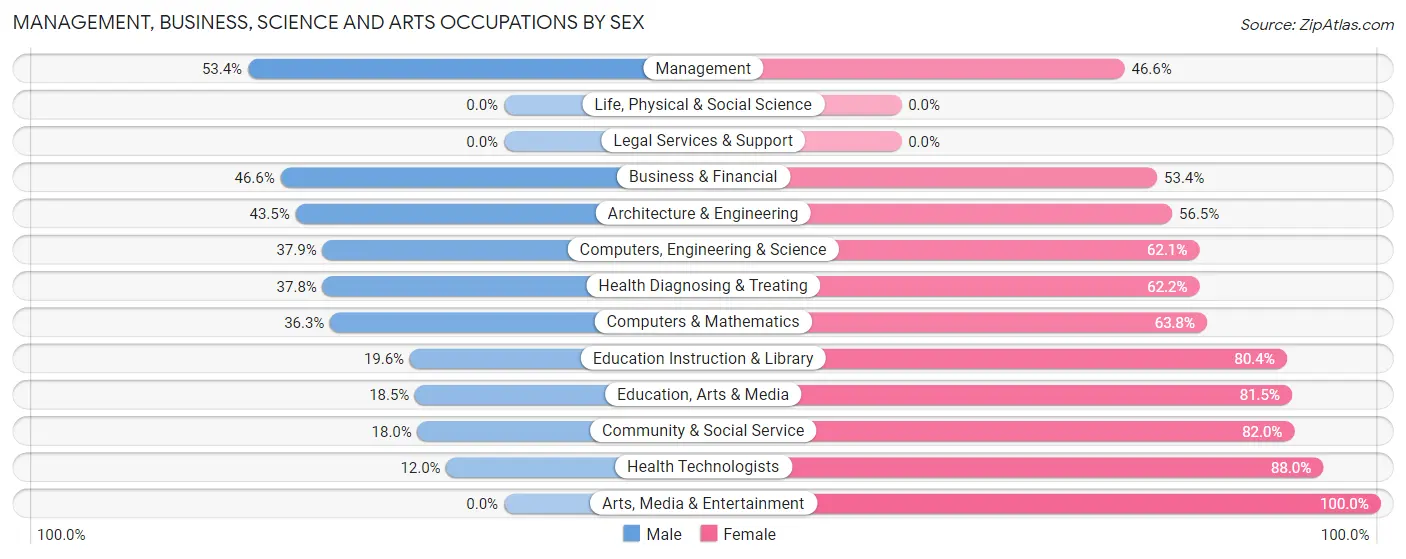
Within the Management, Business, Science and Arts occupations in Forked River, the most male-oriented occupations are Management (53.4%), Business & Financial (46.6%), and Architecture & Engineering (43.5%), while the most female-oriented occupations are Arts, Media & Entertainment (100.0%), Health Technologists (88.0%), and Community & Social Service (82.0%).
| Occupation | Male | Female |
| Management | 133 (53.4%) | 116 (46.6%) |
| Business & Financial | 55 (46.6%) | 63 (53.4%) |
| Computers, Engineering & Science | 39 (37.9%) | 64 (62.1%) |
| Computers & Mathematics | 29 (36.2%) | 51 (63.7%) |
| Architecture & Engineering | 10 (43.5%) | 13 (56.5%) |
| Life, Physical & Social Science | 0 (0.0%) | 0 (0.0%) |
| Community & Social Service | 40 (18.0%) | 182 (82.0%) |
| Education, Arts & Media | 10 (18.5%) | 44 (81.5%) |
| Legal Services & Support | 0 (0.0%) | 0 (0.0%) |
| Education Instruction & Library | 30 (19.6%) | 123 (80.4%) |
| Arts, Media & Entertainment | 0 (0.0%) | 15 (100.0%) |
| Health Diagnosing & Treating | 73 (37.8%) | 120 (62.2%) |
| Health Technologists | 15 (12.0%) | 110 (88.0%) |
| Total (Category) | 340 (38.4%) | 545 (61.6%) |
| Total (Overall) | 1,330 (56.9%) | 1,007 (43.1%) |
Services Occupations
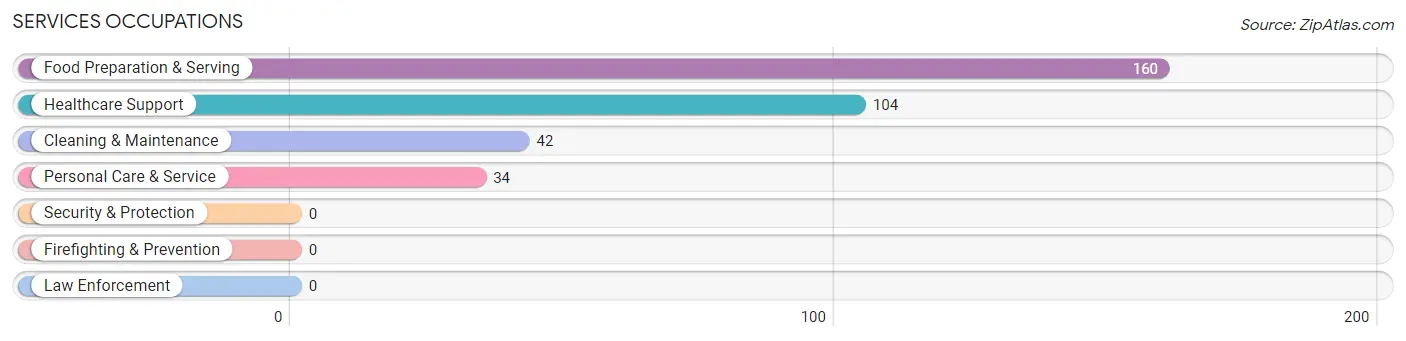
The most common Services occupations in Forked River are Food Preparation & Serving (160 | 6.9%), Healthcare Support (104 | 4.4%), Cleaning & Maintenance (42 | 1.8%), and Personal Care & Service (34 | 1.5%).
Services Occupations by Sex
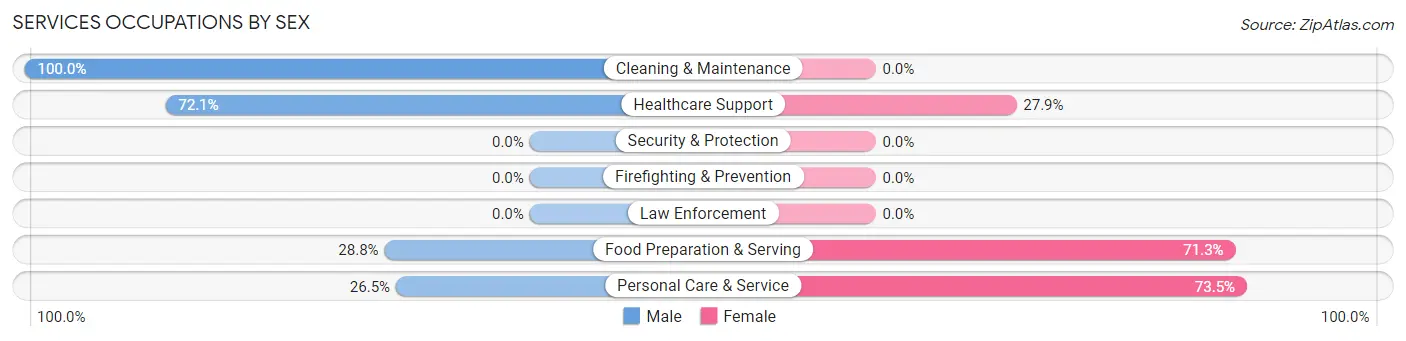
Within the Services occupations in Forked River, the most male-oriented occupations are Cleaning & Maintenance (100.0%), Healthcare Support (72.1%), and Food Preparation & Serving (28.7%), while the most female-oriented occupations are Personal Care & Service (73.5%), Food Preparation & Serving (71.3%), and Healthcare Support (27.9%).
| Occupation | Male | Female |
| Healthcare Support | 75 (72.1%) | 29 (27.9%) |
| Security & Protection | 0 (0.0%) | 0 (0.0%) |
| Firefighting & Prevention | 0 (0.0%) | 0 (0.0%) |
| Law Enforcement | 0 (0.0%) | 0 (0.0%) |
| Food Preparation & Serving | 46 (28.7%) | 114 (71.3%) |
| Cleaning & Maintenance | 42 (100.0%) | 0 (0.0%) |
| Personal Care & Service | 9 (26.5%) | 25 (73.5%) |
| Total (Category) | 172 (50.6%) | 168 (49.4%) |
| Total (Overall) | 1,330 (56.9%) | 1,007 (43.1%) |
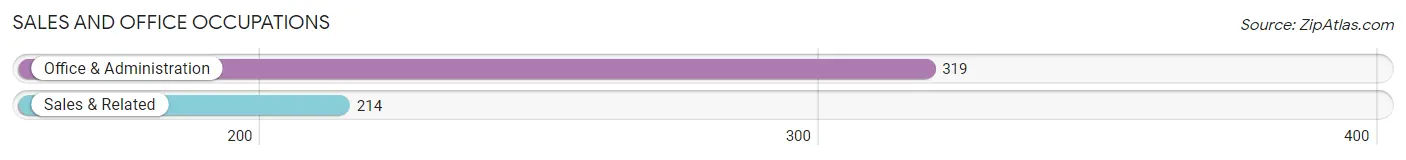
Sales and Office Occupations
The most common Sales and Office occupations in Forked River are Office & Administration (319 | 13.7%), and Sales & Related (214 | 9.2%).
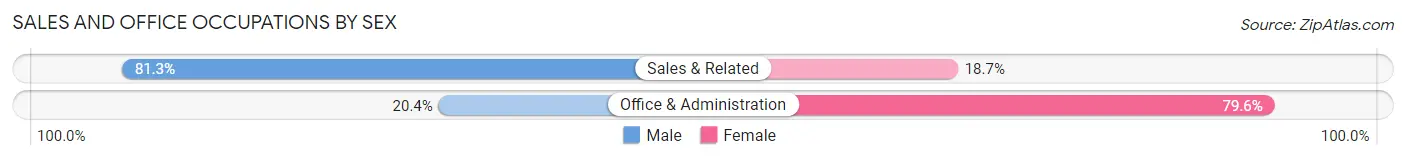
Sales and Office Occupations by Sex
| Occupation | Male | Female |
| Sales & Related | 174 (81.3%) | 40 (18.7%) |
| Office & Administration | 65 (20.4%) | 254 (79.6%) |
| Total (Category) | 239 (44.8%) | 294 (55.2%) |
| Total (Overall) | 1,330 (56.9%) | 1,007 (43.1%) |
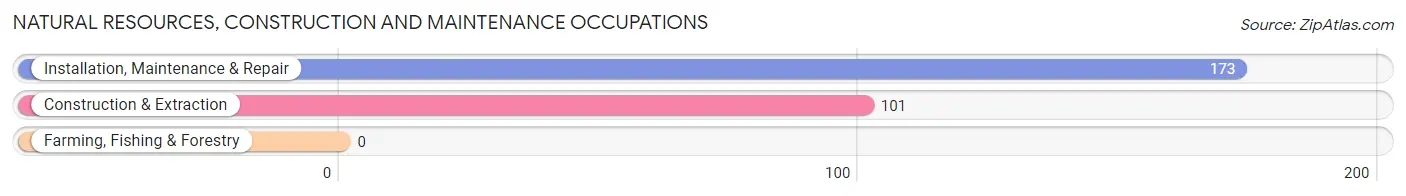
Natural Resources, Construction and Maintenance Occupations
The most common Natural Resources, Construction and Maintenance occupations in Forked River are Installation, Maintenance & Repair (173 | 7.4%), and Construction & Extraction (101 | 4.3%).
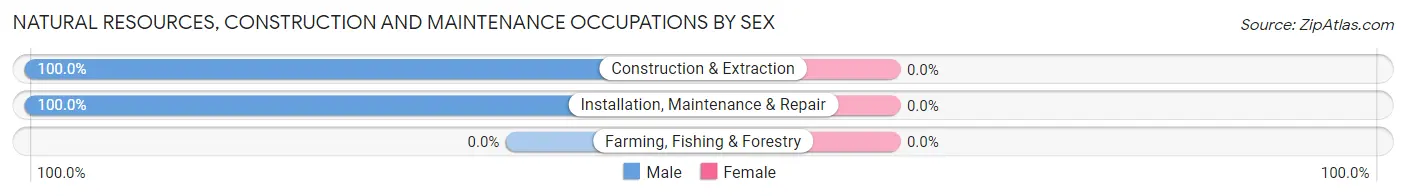
Natural Resources, Construction and Maintenance Occupations by Sex
| Occupation | Male | Female |
| Farming, Fishing & Forestry | 0 (0.0%) | 0 (0.0%) |
| Construction & Extraction | 101 (100.0%) | 0 (0.0%) |
| Installation, Maintenance & Repair | 173 (100.0%) | 0 (0.0%) |
| Total (Category) | 274 (100.0%) | 0 (0.0%) |
| Total (Overall) | 1,330 (56.9%) | 1,007 (43.1%) |
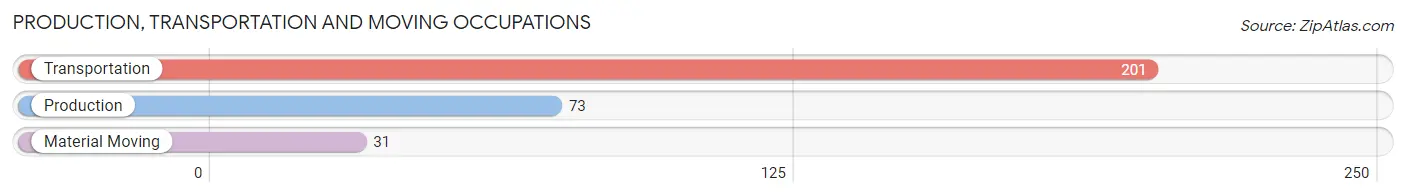
Production, Transportation and Moving Occupations
The most common Production, Transportation and Moving occupations in Forked River are Transportation (201 | 8.6%), Production (73 | 3.1%), and Material Moving (31 | 1.3%).
Production, Transportation and Moving Occupations by Sex
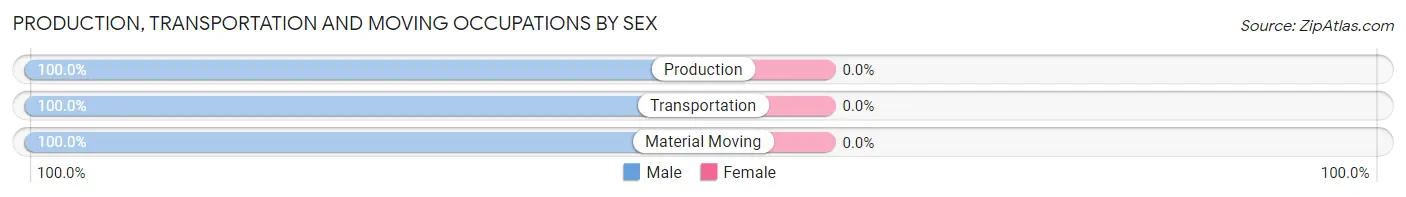
| Occupation | Male | Female |
| Production | 73 (100.0%) | 0 (0.0%) |
| Transportation | 201 (100.0%) | 0 (0.0%) |
| Material Moving | 31 (100.0%) | 0 (0.0%) |
| Total (Category) | 305 (100.0%) | 0 (0.0%) |
| Total (Overall) | 1,330 (56.9%) | 1,007 (43.1%) |
Employment Industries by Sex in Forked River
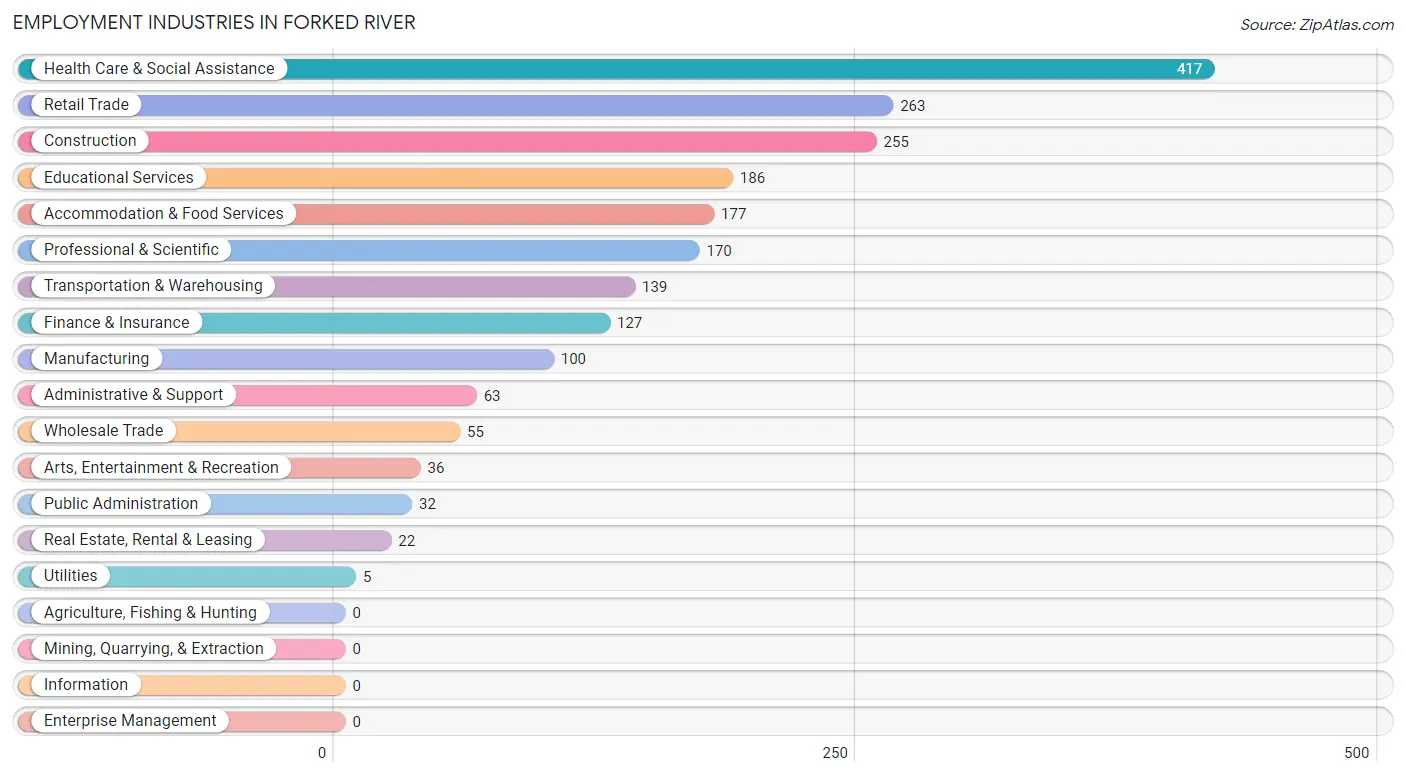
Employment Industries in Forked River
The major employment industries in Forked River include Health Care & Social Assistance (417 | 17.8%), Retail Trade (263 | 11.3%), Construction (255 | 10.9%), Educational Services (186 | 8.0%), and Accommodation & Food Services (177 | 7.6%).
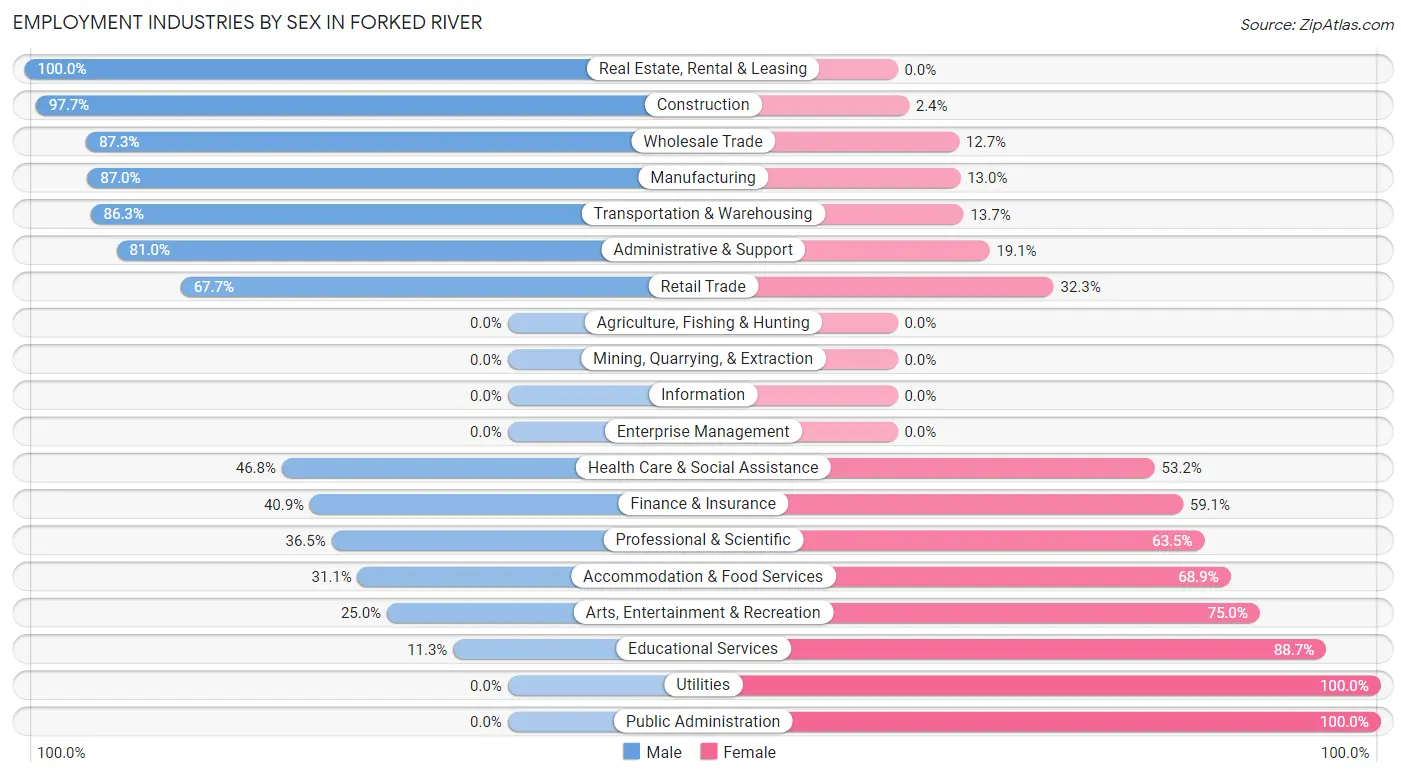
Employment Industries by Sex in Forked River
The Forked River industries that see more men than women are Real Estate, Rental & Leasing (100.0%), Construction (97.7%), and Wholesale Trade (87.3%), whereas the industries that tend to have a higher number of women are Utilities (100.0%), Public Administration (100.0%), and Educational Services (88.7%).
| Industry | Male | Female |
| Agriculture, Fishing & Hunting | 0 (0.0%) | 0 (0.0%) |
| Mining, Quarrying, & Extraction | 0 (0.0%) | 0 (0.0%) |
| Construction | 249 (97.7%) | 6 (2.4%) |
| Manufacturing | 87 (87.0%) | 13 (13.0%) |
| Wholesale Trade | 48 (87.3%) | 7 (12.7%) |
| Retail Trade | 178 (67.7%) | 85 (32.3%) |
| Transportation & Warehousing | 120 (86.3%) | 19 (13.7%) |
| Utilities | 0 (0.0%) | 5 (100.0%) |
| Information | 0 (0.0%) | 0 (0.0%) |
| Finance & Insurance | 52 (40.9%) | 75 (59.1%) |
| Real Estate, Rental & Leasing | 22 (100.0%) | 0 (0.0%) |
| Professional & Scientific | 62 (36.5%) | 108 (63.5%) |
| Enterprise Management | 0 (0.0%) | 0 (0.0%) |
| Administrative & Support | 51 (80.9%) | 12 (19.1%) |
| Educational Services | 21 (11.3%) | 165 (88.7%) |
| Health Care & Social Assistance | 195 (46.8%) | 222 (53.2%) |
| Arts, Entertainment & Recreation | 9 (25.0%) | 27 (75.0%) |
| Accommodation & Food Services | 55 (31.1%) | 122 (68.9%) |
| Public Administration | 0 (0.0%) | 32 (100.0%) |
| Total | 1,330 (56.9%) | 1,007 (43.1%) |
Education in Forked River
School Enrollment in Forked River
The most common levels of schooling among the 1,309 students in Forked River are middle school (391 | 29.9%), college / undergraduate (354 | 27.0%), and high school (233 | 17.8%).
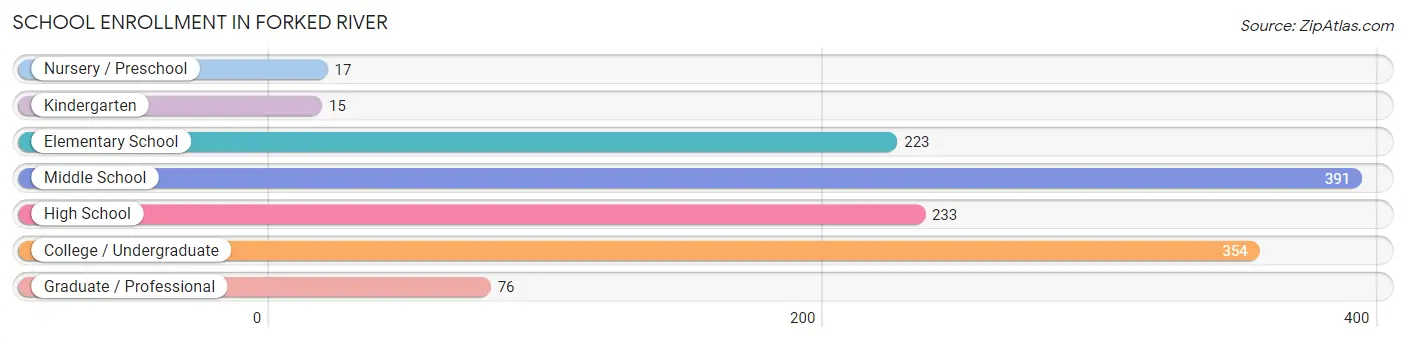
| School Level | # Students | % Students |
| Nursery / Preschool | 17 | 1.3% |
| Kindergarten | 15 | 1.1% |
| Elementary School | 223 | 17.0% |
| Middle School | 391 | 29.9% |
| High School | 233 | 17.8% |
| College / Undergraduate | 354 | 27.0% |
| Graduate / Professional | 76 | 5.8% |
| Total | 1,309 | 100.0% |
School Enrollment by Age by Funding Source in Forked River
Out of a total of 1,309 students who are enrolled in schools in Forked River, 103 (7.9%) attend a private institution, while the remaining 1,206 (92.1%) are enrolled in public schools. The age group of 25 to 34 year olds has the highest likelihood of being enrolled in private schools, with 52 (61.2% in the age bracket) enrolled. Conversely, the age group of 3 to 4 year olds has the lowest likelihood of being enrolled in a private school, with 17 (100.0% in the age bracket) attending a public institution.
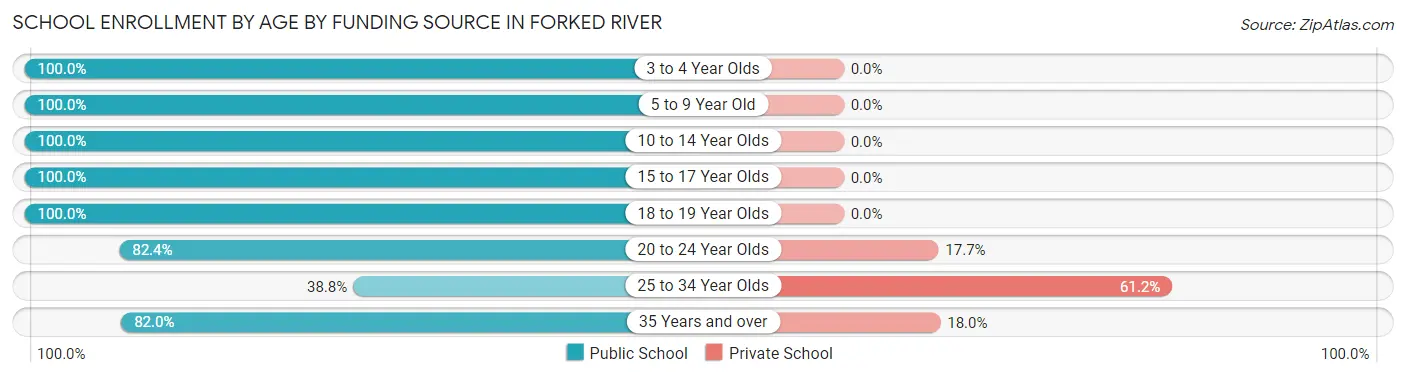
| Age Bracket | Public School | Private School |
| 3 to 4 Year Olds | 17 (100.0%) | 0 (0.0%) |
| 5 to 9 Year Old | 238 (100.0%) | 0 (0.0%) |
| 10 to 14 Year Olds | 444 (100.0%) | 0 (0.0%) |
| 15 to 17 Year Olds | 165 (100.0%) | 0 (0.0%) |
| 18 to 19 Year Olds | 74 (100.0%) | 0 (0.0%) |
| 20 to 24 Year Olds | 112 (82.4%) | 24 (17.6%) |
| 25 to 34 Year Olds | 33 (38.8%) | 52 (61.2%) |
| 35 Years and over | 123 (82.0%) | 27 (18.0%) |
| Total | 1,206 (92.1%) | 103 (7.9%) |
Educational Attainment by Field of Study in Forked River
Business (294 | 27.6%), education (170 | 16.0%), science & technology (108 | 10.2%), social sciences (74 | 7.0%), and liberal arts & history (71 | 6.7%) are the most common fields of study among 1,064 individuals in Forked River who have obtained a bachelor's degree or higher.
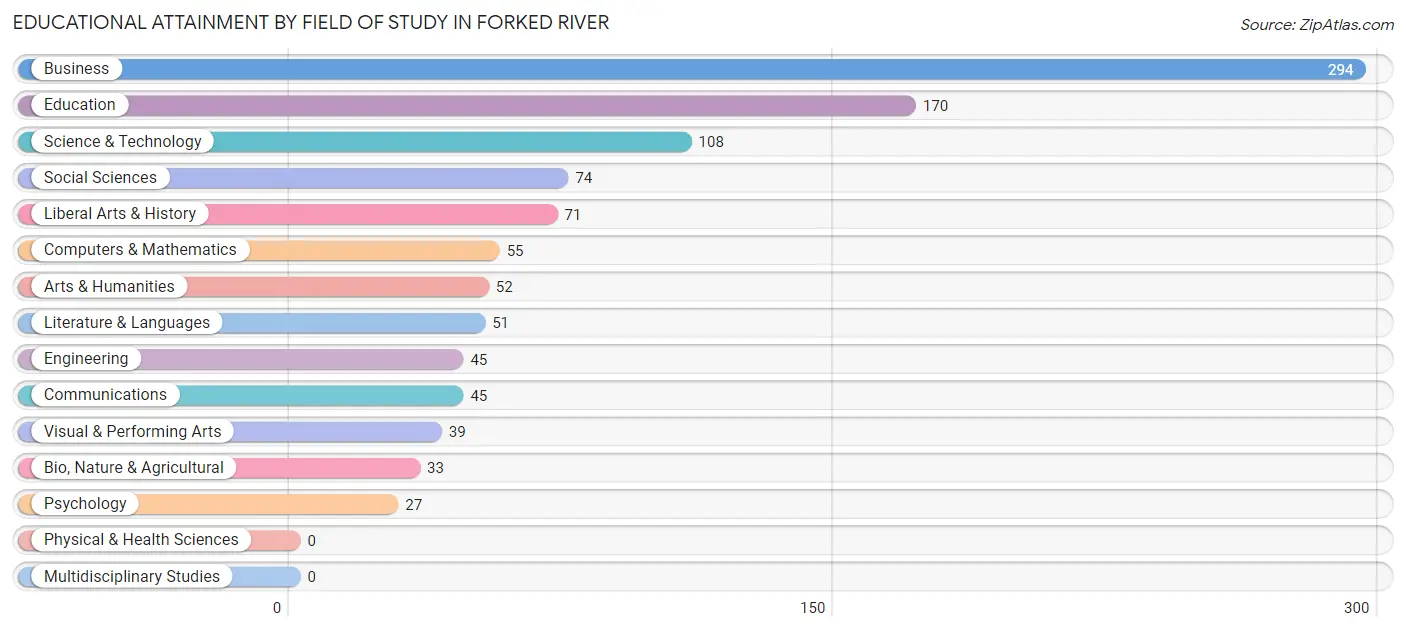
| Field of Study | # Graduates | % Graduates |
| Computers & Mathematics | 55 | 5.2% |
| Bio, Nature & Agricultural | 33 | 3.1% |
| Physical & Health Sciences | 0 | 0.0% |
| Psychology | 27 | 2.5% |
| Social Sciences | 74 | 7.0% |
| Engineering | 45 | 4.2% |
| Multidisciplinary Studies | 0 | 0.0% |
| Science & Technology | 108 | 10.2% |
| Business | 294 | 27.6% |
| Education | 170 | 16.0% |
| Literature & Languages | 51 | 4.8% |
| Liberal Arts & History | 71 | 6.7% |
| Visual & Performing Arts | 39 | 3.7% |
| Communications | 45 | 4.2% |
| Arts & Humanities | 52 | 4.9% |
| Total | 1,064 | 100.0% |
Transportation & Commute in Forked River
Vehicle Availability by Sex in Forked River
The most prevalent vehicle ownership categories in Forked River are males with 2 vehicles (563, accounting for 44.7%) and females with 2 vehicles (430, making up 55.9%).
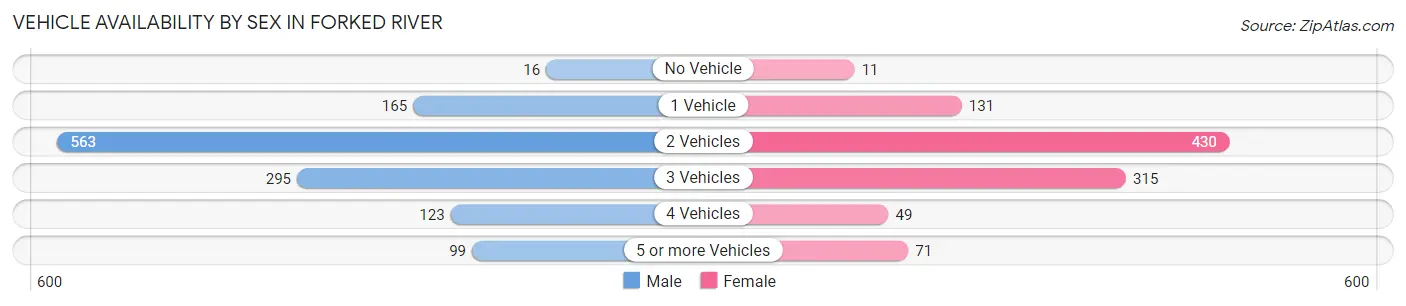
| Vehicles Available | Male | Female |
| No Vehicle | 16 (1.3%) | 11 (1.1%) |
| 1 Vehicle | 165 (13.1%) | 131 (13.0%) |
| 2 Vehicles | 563 (44.7%) | 430 (42.7%) |
| 3 Vehicles | 295 (23.4%) | 315 (31.3%) |
| 4 Vehicles | 123 (9.8%) | 49 (4.9%) |
| 5 or more Vehicles | 99 (7.9%) | 71 (7.0%) |
| Total | 1,261 (100.0%) | 1,007 (100.0%) |
Commute Time in Forked River
The most frequently occuring commute durations in Forked River are 20 to 24 minutes (357 commuters, 17.3%), 5 to 9 minutes (276 commuters, 13.4%), and 60 to 89 minutes (218 commuters, 10.6%).
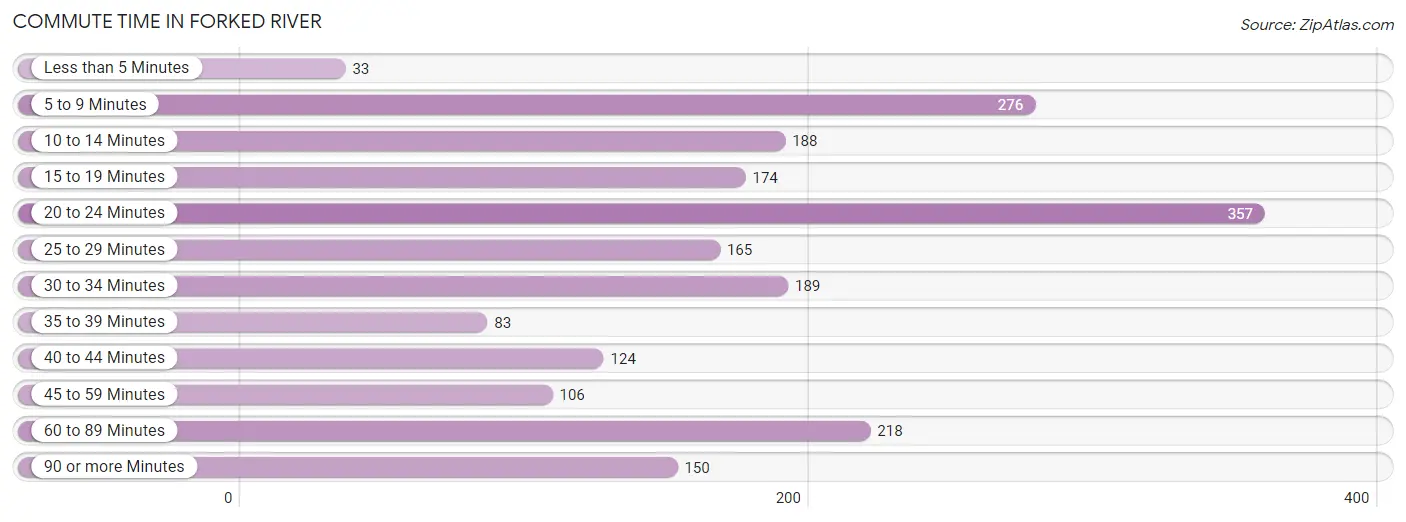
| Commute Time | # Commuters | % Commuters |
| Less than 5 Minutes | 33 | 1.6% |
| 5 to 9 Minutes | 276 | 13.4% |
| 10 to 14 Minutes | 188 | 9.1% |
| 15 to 19 Minutes | 174 | 8.4% |
| 20 to 24 Minutes | 357 | 17.3% |
| 25 to 29 Minutes | 165 | 8.0% |
| 30 to 34 Minutes | 189 | 9.2% |
| 35 to 39 Minutes | 83 | 4.0% |
| 40 to 44 Minutes | 124 | 6.0% |
| 45 to 59 Minutes | 106 | 5.1% |
| 60 to 89 Minutes | 218 | 10.6% |
| 90 or more Minutes | 150 | 7.3% |
Commute Time by Sex in Forked River
The most common commute times in Forked River are 20 to 24 minutes (194 commuters, 16.7%) for males and 20 to 24 minutes (163 commuters, 18.0%) for females.
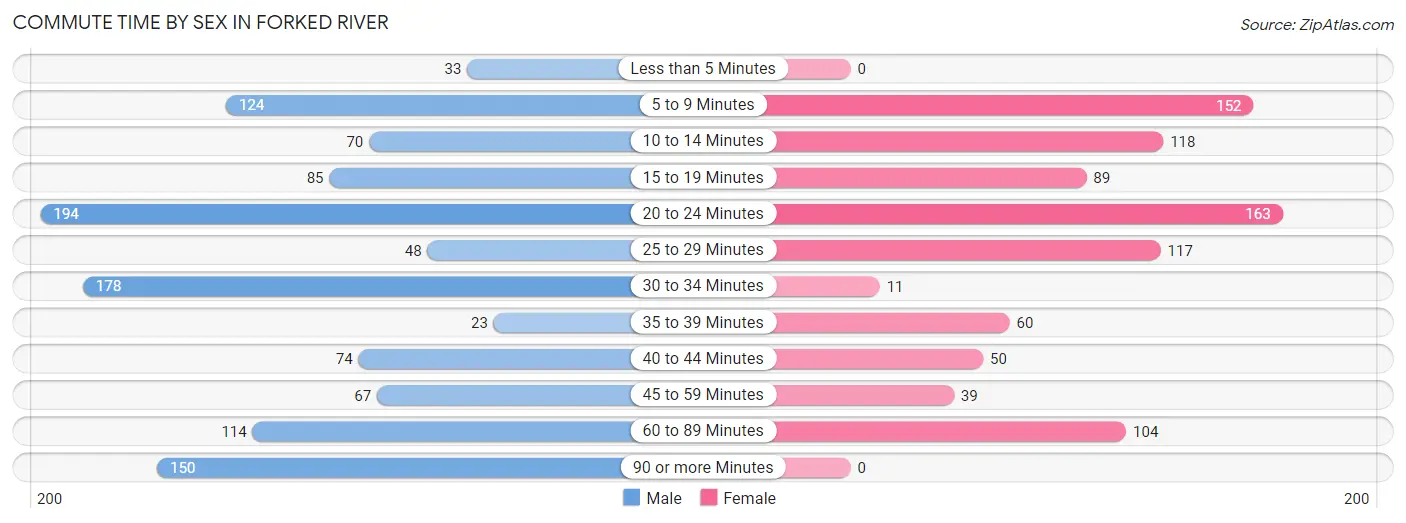
| Commute Time | Male | Female |
| Less than 5 Minutes | 33 (2.8%) | 0 (0.0%) |
| 5 to 9 Minutes | 124 (10.7%) | 152 (16.8%) |
| 10 to 14 Minutes | 70 (6.0%) | 118 (13.1%) |
| 15 to 19 Minutes | 85 (7.3%) | 89 (9.9%) |
| 20 to 24 Minutes | 194 (16.7%) | 163 (18.0%) |
| 25 to 29 Minutes | 48 (4.1%) | 117 (13.0%) |
| 30 to 34 Minutes | 178 (15.3%) | 11 (1.2%) |
| 35 to 39 Minutes | 23 (2.0%) | 60 (6.6%) |
| 40 to 44 Minutes | 74 (6.4%) | 50 (5.5%) |
| 45 to 59 Minutes | 67 (5.8%) | 39 (4.3%) |
| 60 to 89 Minutes | 114 (9.8%) | 104 (11.5%) |
| 90 or more Minutes | 150 (12.9%) | 0 (0.0%) |
Time of Departure to Work by Sex in Forked River
The most frequent times of departure to work in Forked River are 7:30 AM to 7:59 AM (184, 15.9%) for males and 6:00 AM to 6:29 AM (142, 15.7%) for females.
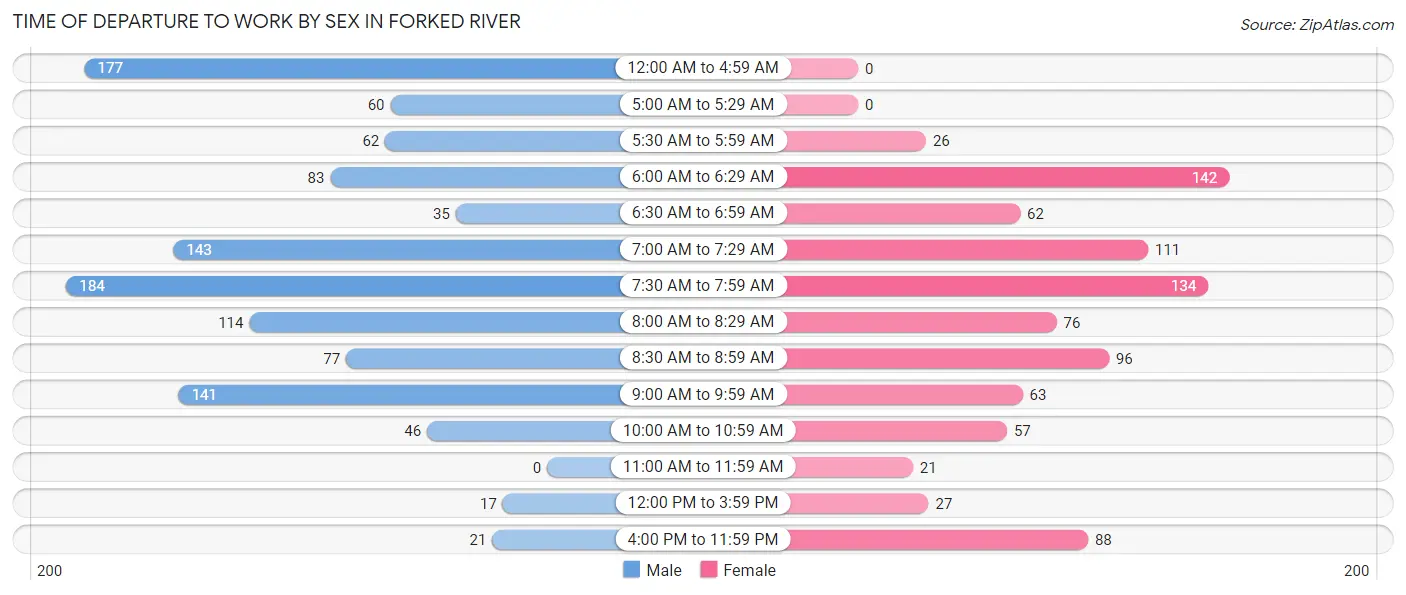
| Time of Departure | Male | Female |
| 12:00 AM to 4:59 AM | 177 (15.3%) | 0 (0.0%) |
| 5:00 AM to 5:29 AM | 60 (5.2%) | 0 (0.0%) |
| 5:30 AM to 5:59 AM | 62 (5.3%) | 26 (2.9%) |
| 6:00 AM to 6:29 AM | 83 (7.2%) | 142 (15.7%) |
| 6:30 AM to 6:59 AM | 35 (3.0%) | 62 (6.9%) |
| 7:00 AM to 7:29 AM | 143 (12.3%) | 111 (12.3%) |
| 7:30 AM to 7:59 AM | 184 (15.9%) | 134 (14.8%) |
| 8:00 AM to 8:29 AM | 114 (9.8%) | 76 (8.4%) |
| 8:30 AM to 8:59 AM | 77 (6.6%) | 96 (10.6%) |
| 9:00 AM to 9:59 AM | 141 (12.2%) | 63 (7.0%) |
| 10:00 AM to 10:59 AM | 46 (4.0%) | 57 (6.3%) |
| 11:00 AM to 11:59 AM | 0 (0.0%) | 21 (2.3%) |
| 12:00 PM to 3:59 PM | 17 (1.5%) | 27 (3.0%) |
| 4:00 PM to 11:59 PM | 21 (1.8%) | 88 (9.8%) |
| Total | 1,160 (100.0%) | 903 (100.0%) |
Housing Occupancy in Forked River
Occupancy by Ownership in Forked River
Of the total 2,088 dwellings in Forked River, owner-occupied units account for 1,826 (87.5%), while renter-occupied units make up 262 (12.6%).
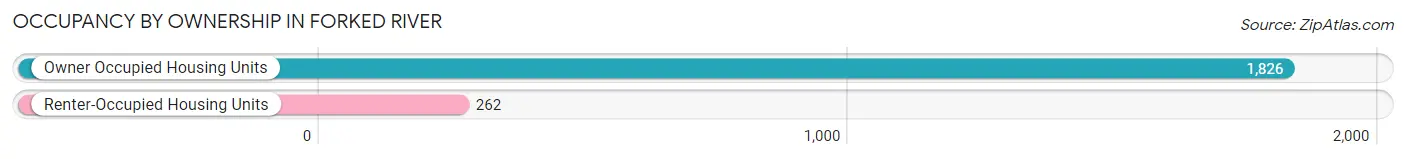
| Occupancy | # Housing Units | % Housing Units |
| Owner Occupied Housing Units | 1,826 | 87.5% |
| Renter-Occupied Housing Units | 262 | 12.6% |
| Total Occupied Housing Units | 2,088 | 100.0% |
Occupancy by Household Size in Forked River
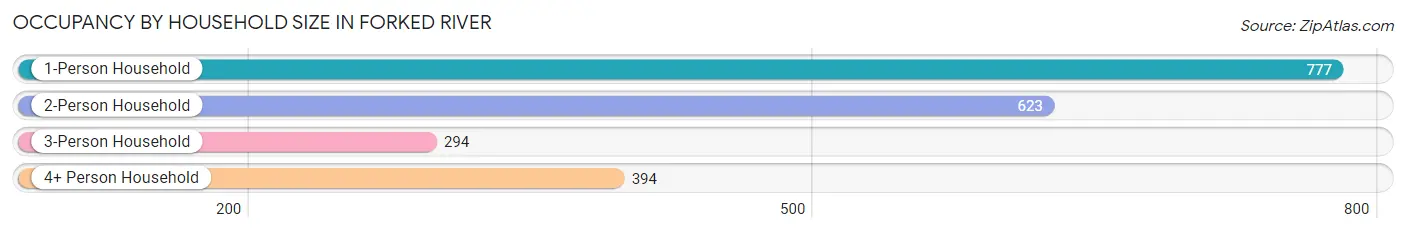
| Household Size | # Housing Units | % Housing Units |
| 1-Person Household | 777 | 37.2% |
| 2-Person Household | 623 | 29.8% |
| 3-Person Household | 294 | 14.1% |
| 4+ Person Household | 394 | 18.9% |
| Total Housing Units | 2,088 | 100.0% |
Occupancy by Ownership by Household Size in Forked River
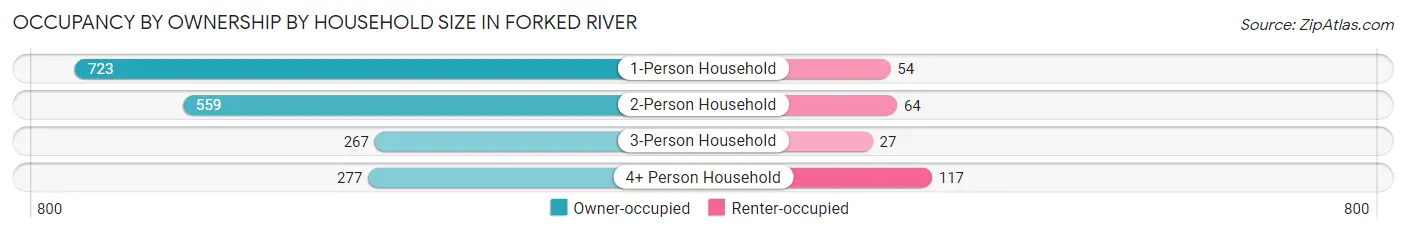
| Household Size | Owner-occupied | Renter-occupied |
| 1-Person Household | 723 (93.0%) | 54 (7.0%) |
| 2-Person Household | 559 (89.7%) | 64 (10.3%) |
| 3-Person Household | 267 (90.8%) | 27 (9.2%) |
| 4+ Person Household | 277 (70.3%) | 117 (29.7%) |
| Total Housing Units | 1,826 (87.5%) | 262 (12.6%) |
Occupancy by Educational Attainment in Forked River
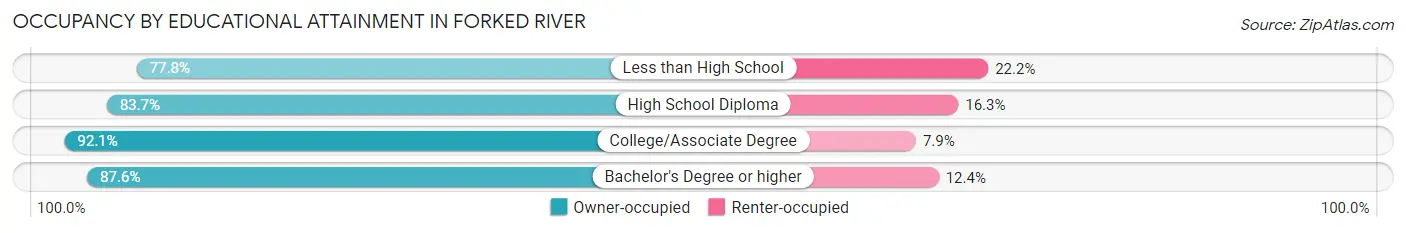
| Household Size | Owner-occupied | Renter-occupied |
| Less than High School | 49 (77.8%) | 14 (22.2%) |
| High School Diploma | 612 (83.7%) | 119 (16.3%) |
| College/Associate Degree | 642 (92.1%) | 55 (7.9%) |
| Bachelor's Degree or higher | 523 (87.6%) | 74 (12.4%) |
Occupancy by Age of Householder in Forked River
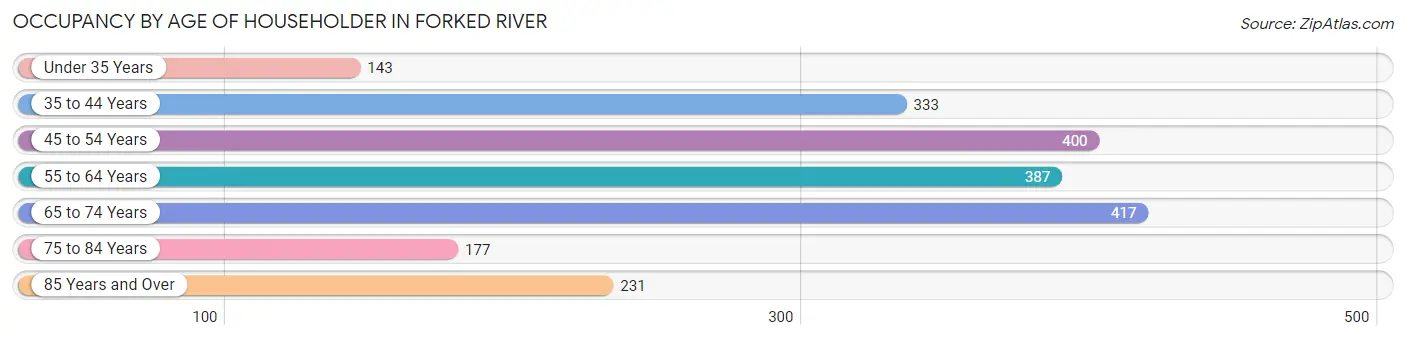
| Age Bracket | # Households | % Households |
| Under 35 Years | 143 | 6.9% |
| 35 to 44 Years | 333 | 16.0% |
| 45 to 54 Years | 400 | 19.2% |
| 55 to 64 Years | 387 | 18.5% |
| 65 to 74 Years | 417 | 20.0% |
| 75 to 84 Years | 177 | 8.5% |
| 85 Years and Over | 231 | 11.1% |
| Total | 2,088 | 100.0% |
Housing Finances in Forked River
Median Income by Occupancy in Forked River
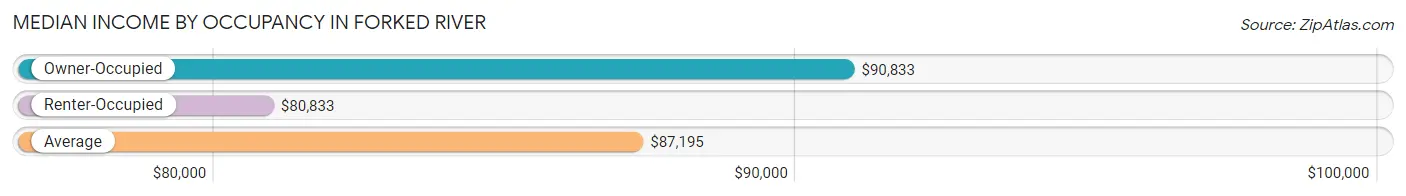
| Occupancy Type | # Households | Median Income |
| Owner-Occupied | 1,826 (87.5%) | $90,833 |
| Renter-Occupied | 262 (12.6%) | $80,833 |
| Average | 2,088 (100.0%) | $87,195 |
Occupancy by Householder Income Bracket in Forked River
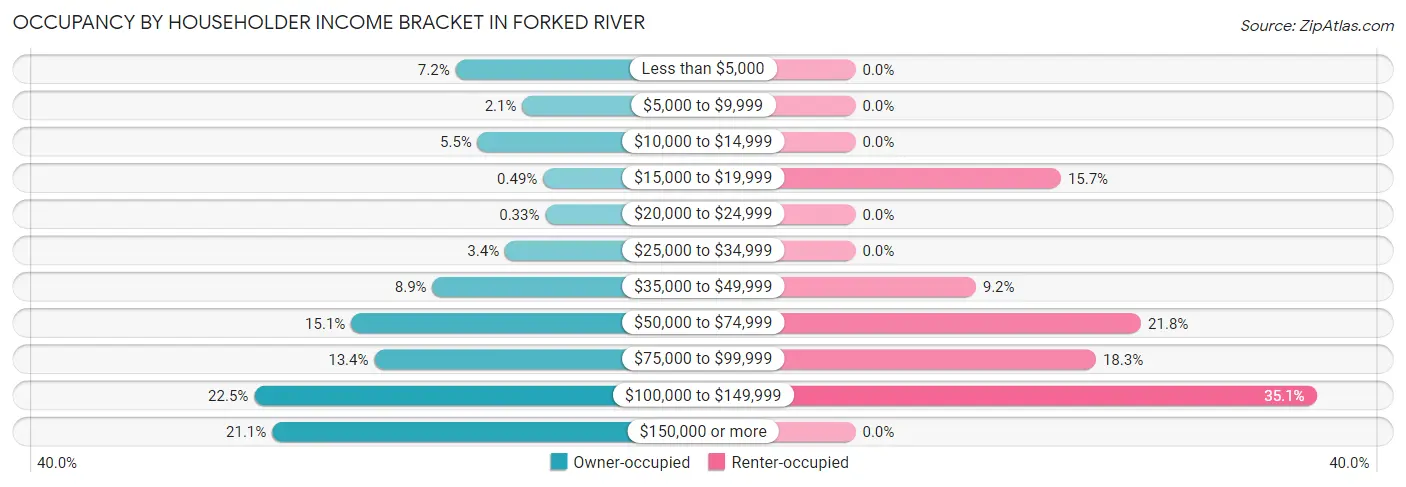
| Income Bracket | Owner-occupied | Renter-occupied |
| Less than $5,000 | 131 (7.2%) | 0 (0.0%) |
| $5,000 to $9,999 | 38 (2.1%) | 0 (0.0%) |
| $10,000 to $14,999 | 100 (5.5%) | 0 (0.0%) |
| $15,000 to $19,999 | 9 (0.5%) | 41 (15.7%) |
| $20,000 to $24,999 | 6 (0.3%) | 0 (0.0%) |
| $25,000 to $34,999 | 62 (3.4%) | 0 (0.0%) |
| $35,000 to $49,999 | 163 (8.9%) | 24 (9.2%) |
| $50,000 to $74,999 | 276 (15.1%) | 57 (21.8%) |
| $75,000 to $99,999 | 244 (13.4%) | 48 (18.3%) |
| $100,000 to $149,999 | 411 (22.5%) | 92 (35.1%) |
| $150,000 or more | 386 (21.1%) | 0 (0.0%) |
| Total | 1,826 (100.0%) | 262 (100.0%) |
Monthly Housing Cost Tiers in Forked River
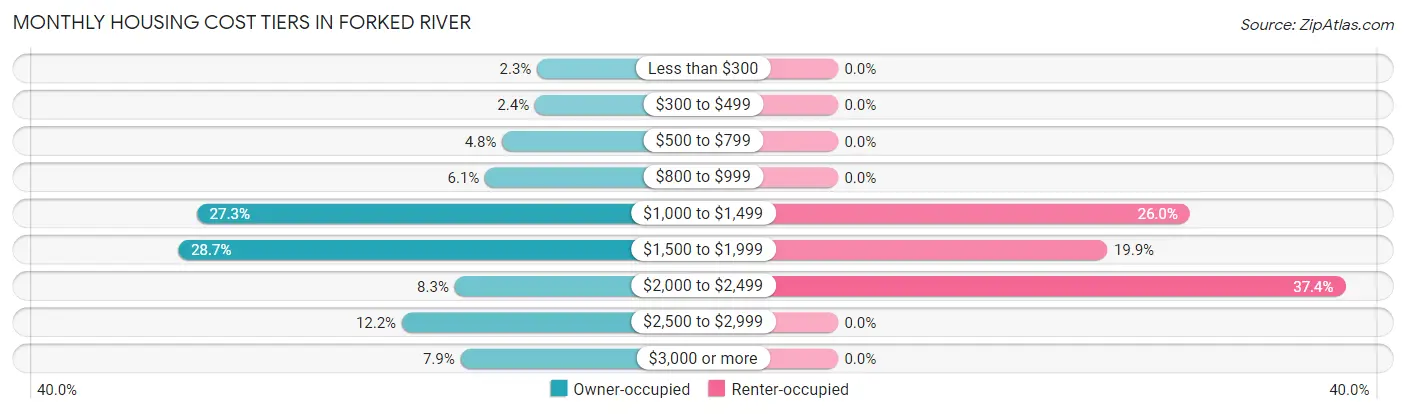
| Monthly Cost | Owner-occupied | Renter-occupied |
| Less than $300 | 41 (2.2%) | 0 (0.0%) |
| $300 to $499 | 44 (2.4%) | 0 (0.0%) |
| $500 to $799 | 88 (4.8%) | 0 (0.0%) |
| $800 to $999 | 111 (6.1%) | 0 (0.0%) |
| $1,000 to $1,499 | 499 (27.3%) | 68 (26.0%) |
| $1,500 to $1,999 | 524 (28.7%) | 52 (19.9%) |
| $2,000 to $2,499 | 152 (8.3%) | 98 (37.4%) |
| $2,500 to $2,999 | 223 (12.2%) | 0 (0.0%) |
| $3,000 or more | 144 (7.9%) | 0 (0.0%) |
| Total | 1,826 (100.0%) | 262 (100.0%) |
Physical Housing Characteristics in Forked River
Housing Structures in Forked River
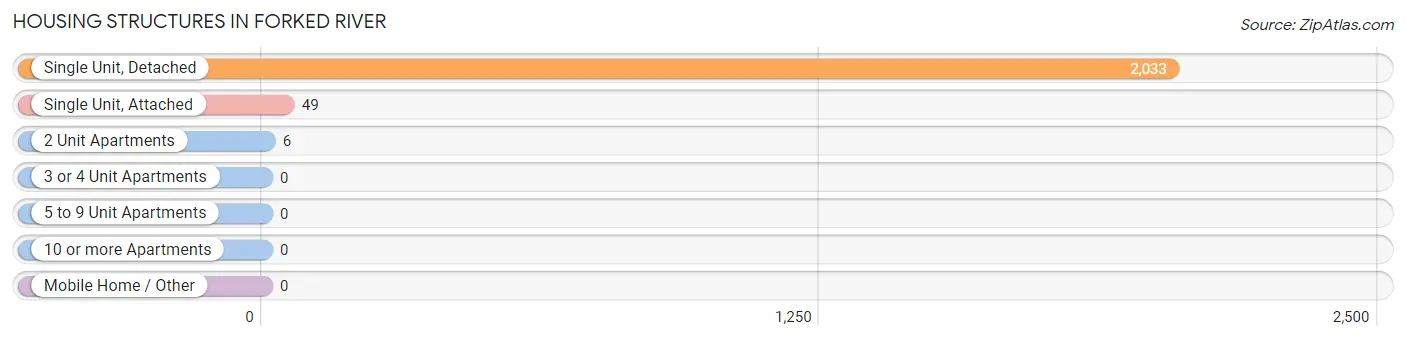
| Structure Type | # Housing Units | % Housing Units |
| Single Unit, Detached | 2,033 | 97.4% |
| Single Unit, Attached | 49 | 2.4% |
| 2 Unit Apartments | 6 | 0.3% |
| 3 or 4 Unit Apartments | 0 | 0.0% |
| 5 to 9 Unit Apartments | 0 | 0.0% |
| 10 or more Apartments | 0 | 0.0% |
| Mobile Home / Other | 0 | 0.0% |
| Total | 2,088 | 100.0% |
Housing Structures by Occupancy in Forked River
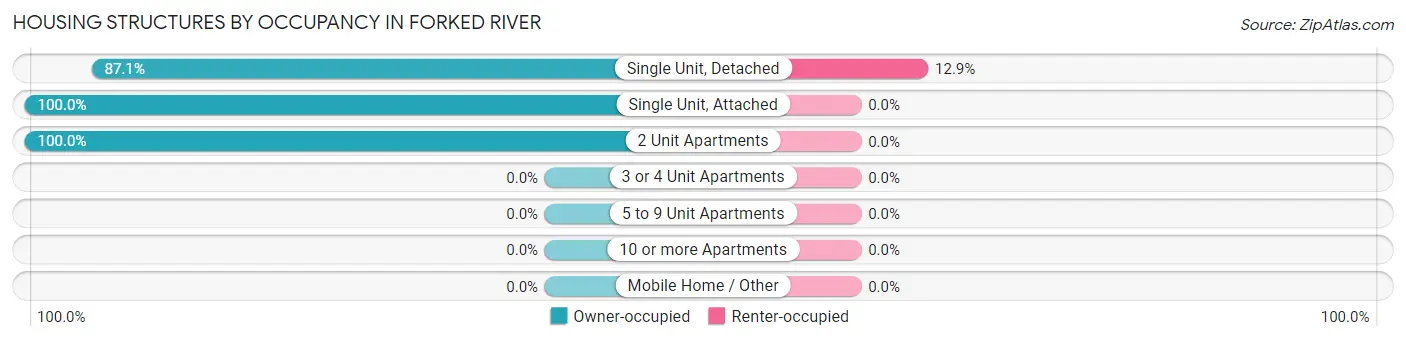
| Structure Type | Owner-occupied | Renter-occupied |
| Single Unit, Detached | 1,771 (87.1%) | 262 (12.9%) |
| Single Unit, Attached | 49 (100.0%) | 0 (0.0%) |
| 2 Unit Apartments | 6 (100.0%) | 0 (0.0%) |
| 3 or 4 Unit Apartments | 0 (0.0%) | 0 (0.0%) |
| 5 to 9 Unit Apartments | 0 (0.0%) | 0 (0.0%) |
| 10 or more Apartments | 0 (0.0%) | 0 (0.0%) |
| Mobile Home / Other | 0 (0.0%) | 0 (0.0%) |
| Total | 1,826 (87.5%) | 262 (12.6%) |
Housing Structures by Number of Rooms in Forked River
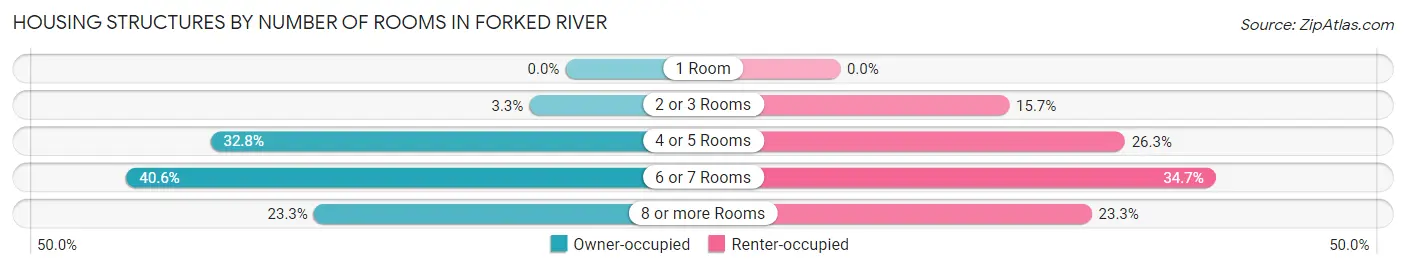
| Number of Rooms | Owner-occupied | Renter-occupied |
| 1 Room | 0 (0.0%) | 0 (0.0%) |
| 2 or 3 Rooms | 61 (3.3%) | 41 (15.7%) |
| 4 or 5 Rooms | 599 (32.8%) | 69 (26.3%) |
| 6 or 7 Rooms | 741 (40.6%) | 91 (34.7%) |
| 8 or more Rooms | 425 (23.3%) | 61 (23.3%) |
| Total | 1,826 (100.0%) | 262 (100.0%) |
Housing Structure by Heating Type in Forked River
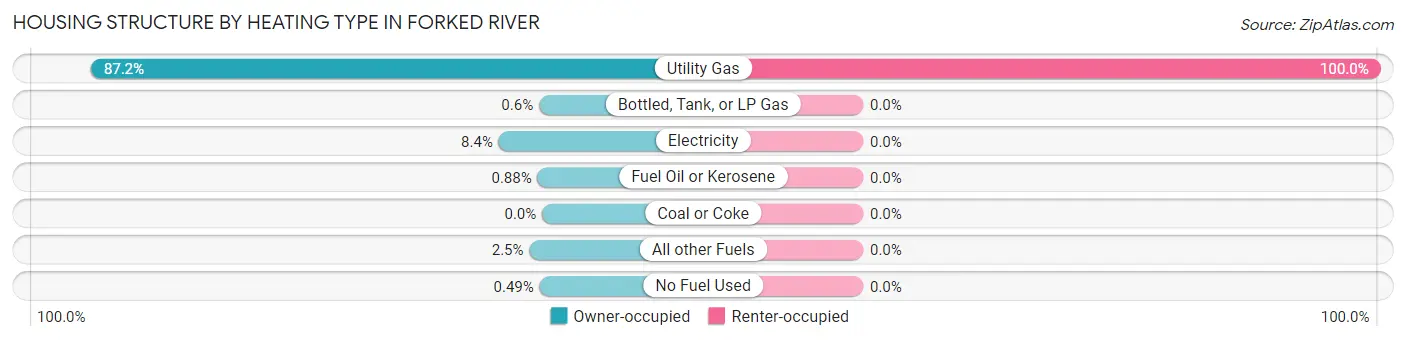
| Heating Type | Owner-occupied | Renter-occupied |
| Utility Gas | 1,592 (87.2%) | 262 (100.0%) |
| Bottled, Tank, or LP Gas | 11 (0.6%) | 0 (0.0%) |
| Electricity | 153 (8.4%) | 0 (0.0%) |
| Fuel Oil or Kerosene | 16 (0.9%) | 0 (0.0%) |
| Coal or Coke | 0 (0.0%) | 0 (0.0%) |
| All other Fuels | 45 (2.5%) | 0 (0.0%) |
| No Fuel Used | 9 (0.5%) | 0 (0.0%) |
| Total | 1,826 (100.0%) | 262 (100.0%) |
Household Vehicle Usage in Forked River
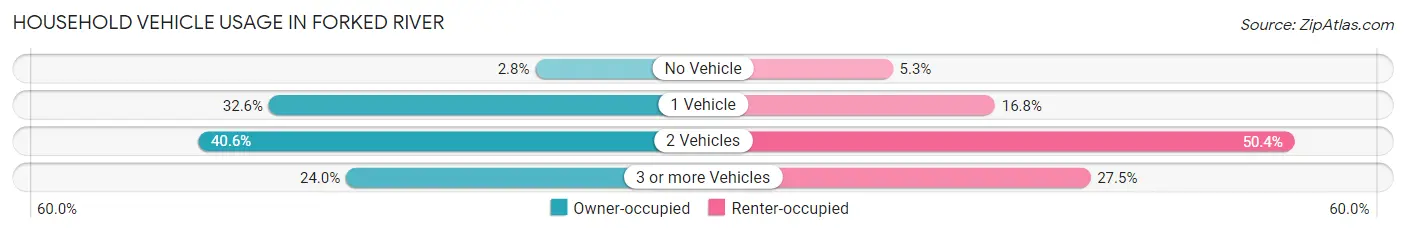
| Vehicles per Household | Owner-occupied | Renter-occupied |
| No Vehicle | 51 (2.8%) | 14 (5.3%) |
| 1 Vehicle | 596 (32.6%) | 44 (16.8%) |
| 2 Vehicles | 741 (40.6%) | 132 (50.4%) |
| 3 or more Vehicles | 438 (24.0%) | 72 (27.5%) |
| Total | 1,826 (100.0%) | 262 (100.0%) |
Real Estate & Mortgages in Forked River
Real Estate and Mortgage Overview in Forked River
| Characteristic | Without Mortgage | With Mortgage |
| Housing Units | 787 | 1,039 |
| Median Property Value | $449,600 | $325,500 |
| Median Household Income | $70,037 | $273 |
| Monthly Housing Costs | $1,160 | $133 |
| Real Estate Taxes | $8,457 | $16 |
Property Value by Mortgage Status in Forked River
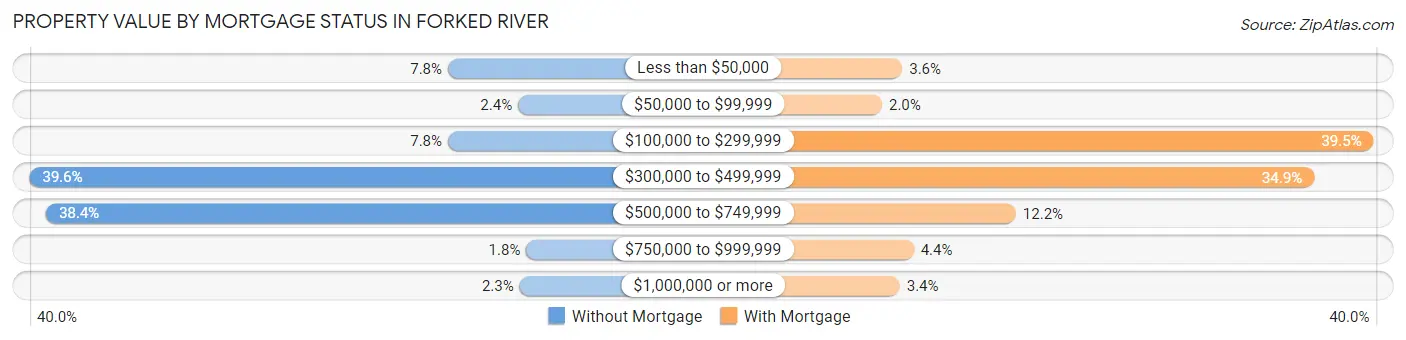
| Property Value | Without Mortgage | With Mortgage |
| Less than $50,000 | 61 (7.7%) | 37 (3.6%) |
| $50,000 to $99,999 | 19 (2.4%) | 21 (2.0%) |
| $100,000 to $299,999 | 61 (7.7%) | 410 (39.5%) |
| $300,000 to $499,999 | 312 (39.6%) | 363 (34.9%) |
| $500,000 to $749,999 | 302 (38.4%) | 127 (12.2%) |
| $750,000 to $999,999 | 14 (1.8%) | 46 (4.4%) |
| $1,000,000 or more | 18 (2.3%) | 35 (3.4%) |
| Total | 787 (100.0%) | 1,039 (100.0%) |
Household Income by Mortgage Status in Forked River
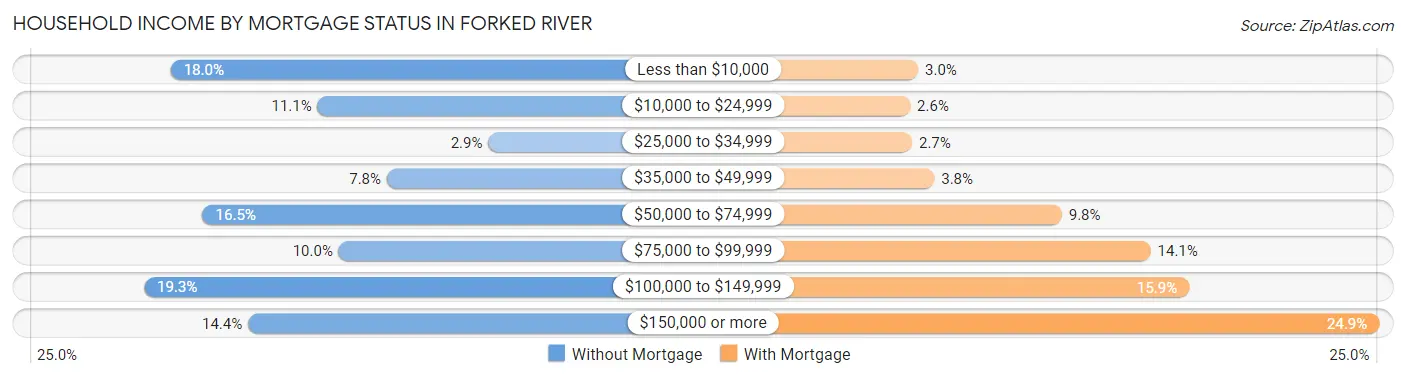
| Household Income | Without Mortgage | With Mortgage |
| Less than $10,000 | 142 (18.0%) | 31 (3.0%) |
| $10,000 to $24,999 | 87 (11.1%) | 27 (2.6%) |
| $25,000 to $34,999 | 23 (2.9%) | 28 (2.7%) |
| $35,000 to $49,999 | 61 (7.7%) | 39 (3.7%) |
| $50,000 to $74,999 | 130 (16.5%) | 102 (9.8%) |
| $75,000 to $99,999 | 79 (10.0%) | 146 (14.1%) |
| $100,000 to $149,999 | 152 (19.3%) | 165 (15.9%) |
| $150,000 or more | 113 (14.4%) | 259 (24.9%) |
| Total | 787 (100.0%) | 1,039 (100.0%) |
Property Value to Household Income Ratio in Forked River
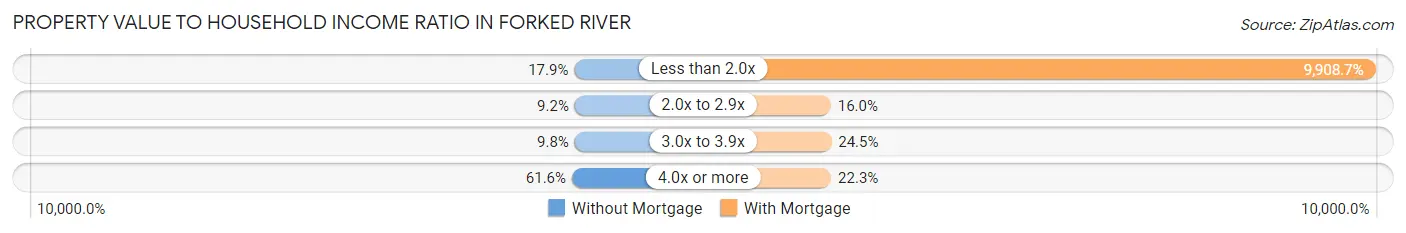
| Value-to-Income Ratio | Without Mortgage | With Mortgage |
| Less than 2.0x | 141 (17.9%) | 102,951 (9,908.7%) |
| 2.0x to 2.9x | 72 (9.1%) | 166 (16.0%) |
| 3.0x to 3.9x | 77 (9.8%) | 254 (24.4%) |
| 4.0x or more | 485 (61.6%) | 232 (22.3%) |
| Total | 787 (100.0%) | 1,039 (100.0%) |
Real Estate Taxes by Mortgage Status in Forked River
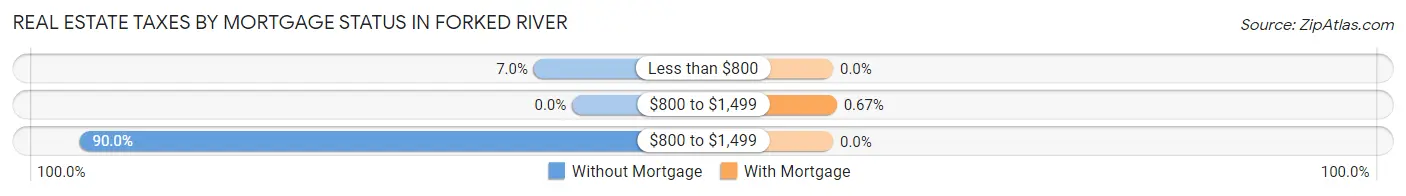
| Property Taxes | Without Mortgage | With Mortgage |
| Less than $800 | 55 (7.0%) | 0 (0.0%) |
| $800 to $1,499 | 0 (0.0%) | 7 (0.7%) |
| $800 to $1,499 | 708 (90.0%) | 0 (0.0%) |
| Total | 787 (100.0%) | 1,039 (100.0%) |
Health & Disability in Forked River
Health Insurance Coverage by Age in Forked River
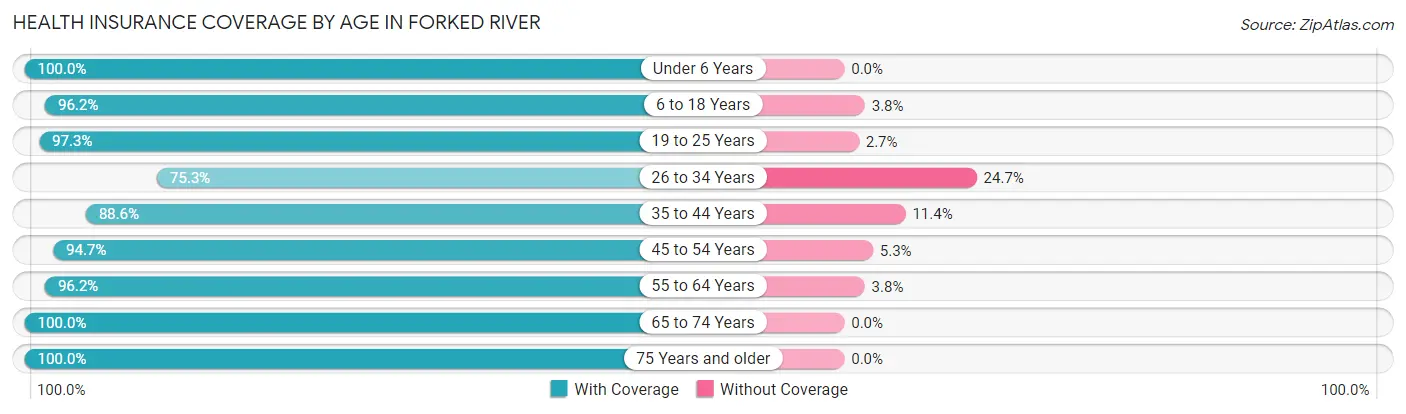
| Age Bracket | With Coverage | Without Coverage |
| Under 6 Years | 261 (100.0%) | 0 (0.0%) |
| 6 to 18 Years | 806 (96.2%) | 32 (3.8%) |
| 19 to 25 Years | 396 (97.3%) | 11 (2.7%) |
| 26 to 34 Years | 235 (75.3%) | 77 (24.7%) |
| 35 to 44 Years | 458 (88.6%) | 59 (11.4%) |
| 45 to 54 Years | 783 (94.7%) | 44 (5.3%) |
| 55 to 64 Years | 709 (96.2%) | 28 (3.8%) |
| 65 to 74 Years | 615 (100.0%) | 0 (0.0%) |
| 75 Years and older | 484 (100.0%) | 0 (0.0%) |
| Total | 4,747 (95.0%) | 251 (5.0%) |
Health Insurance Coverage by Citizenship Status in Forked River
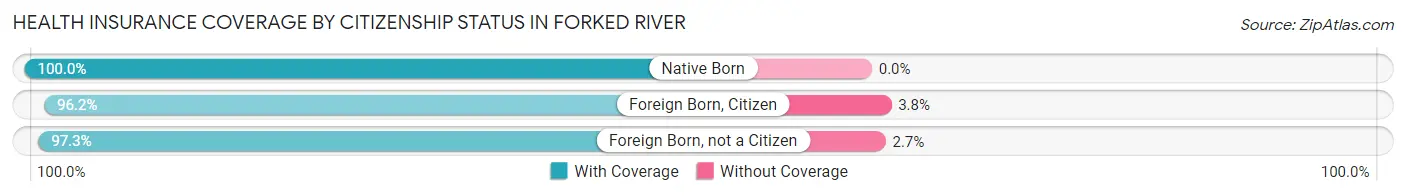
| Citizenship Status | With Coverage | Without Coverage |
| Native Born | 261 (100.0%) | 0 (0.0%) |
| Foreign Born, Citizen | 806 (96.2%) | 32 (3.8%) |
| Foreign Born, not a Citizen | 396 (97.3%) | 11 (2.7%) |
Health Insurance Coverage by Household Income in Forked River
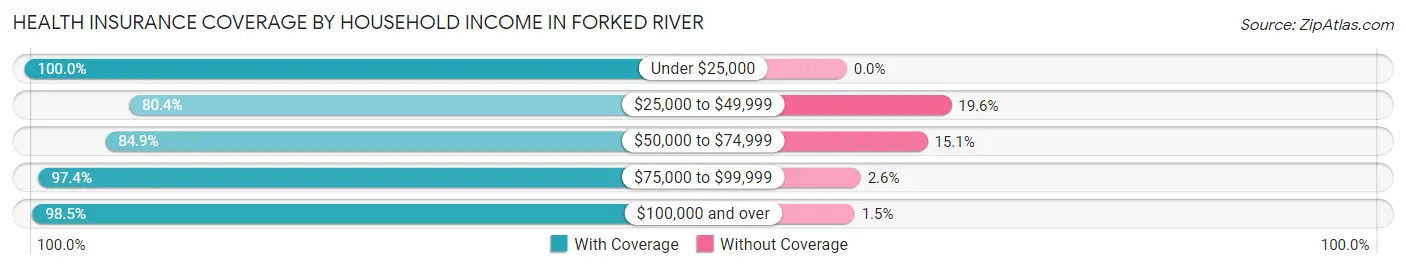
| Household Income | With Coverage | Without Coverage |
| Under $25,000 | 378 (100.0%) | 0 (0.0%) |
| $25,000 to $49,999 | 374 (80.4%) | 91 (19.6%) |
| $50,000 to $74,999 | 561 (84.9%) | 100 (15.1%) |
| $75,000 to $99,999 | 709 (97.4%) | 19 (2.6%) |
| $100,000 and over | 2,720 (98.5%) | 41 (1.5%) |
Public vs Private Health Insurance Coverage by Age in Forked River
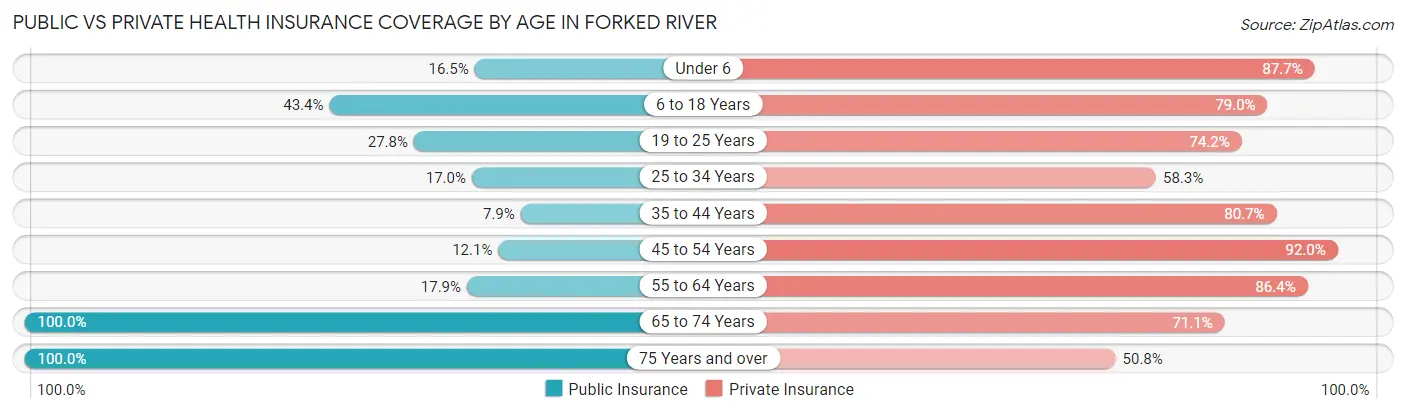
| Age Bracket | Public Insurance | Private Insurance |
| Under 6 | 43 (16.5%) | 229 (87.7%) |
| 6 to 18 Years | 364 (43.4%) | 662 (79.0%) |
| 19 to 25 Years | 113 (27.8%) | 302 (74.2%) |
| 25 to 34 Years | 53 (17.0%) | 182 (58.3%) |
| 35 to 44 Years | 41 (7.9%) | 417 (80.7%) |
| 45 to 54 Years | 100 (12.1%) | 761 (92.0%) |
| 55 to 64 Years | 132 (17.9%) | 637 (86.4%) |
| 65 to 74 Years | 615 (100.0%) | 437 (71.1%) |
| 75 Years and over | 484 (100.0%) | 246 (50.8%) |
| Total | 1,945 (38.9%) | 3,873 (77.5%) |
Disability Status by Sex by Age in Forked River
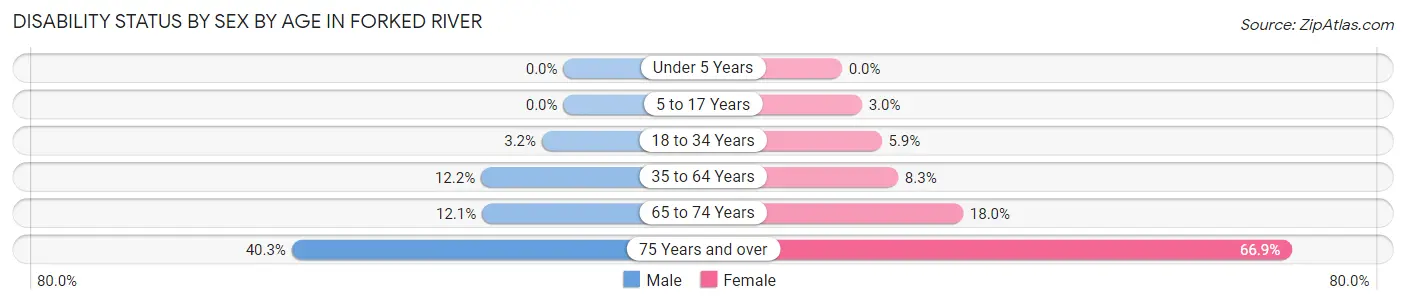
| Age Bracket | Male | Female |
| Under 5 Years | 0 (0.0%) | 0 (0.0%) |
| 5 to 17 Years | 0 (0.0%) | 14 (3.0%) |
| 18 to 34 Years | 14 (3.2%) | 17 (5.9%) |
| 35 to 64 Years | 140 (12.2%) | 78 (8.3%) |
| 65 to 74 Years | 42 (12.1%) | 48 (18.0%) |
| 75 Years and over | 48 (40.3%) | 244 (66.8%) |
Disability Class by Sex by Age in Forked River
Disability Class: Hearing Difficulty
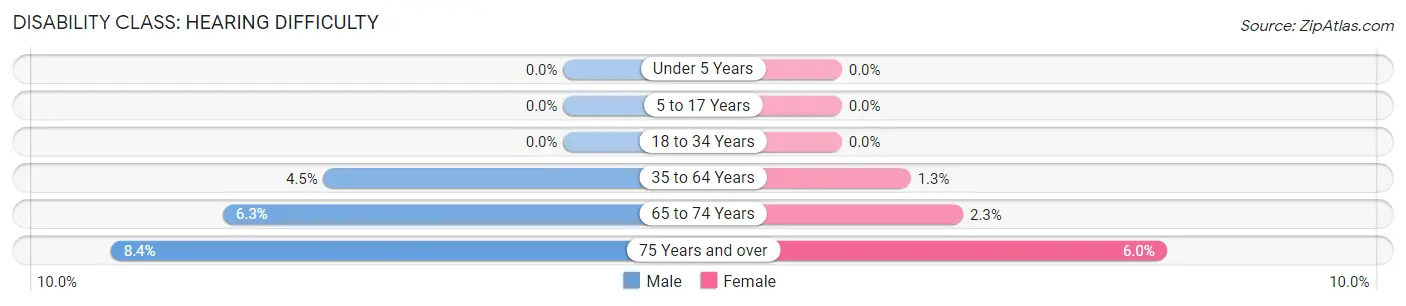
| Age Bracket | Male | Female |
| Under 5 Years | 0 (0.0%) | 0 (0.0%) |
| 5 to 17 Years | 0 (0.0%) | 0 (0.0%) |
| 18 to 34 Years | 0 (0.0%) | 0 (0.0%) |
| 35 to 64 Years | 51 (4.4%) | 12 (1.3%) |
| 65 to 74 Years | 22 (6.3%) | 6 (2.2%) |
| 75 Years and over | 10 (8.4%) | 22 (6.0%) |
Disability Class: Vision Difficulty
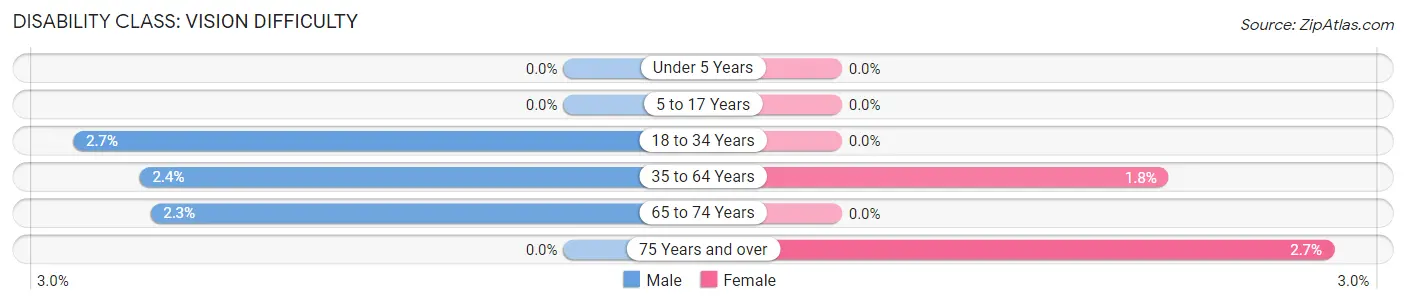
| Age Bracket | Male | Female |
| Under 5 Years | 0 (0.0%) | 0 (0.0%) |
| 5 to 17 Years | 0 (0.0%) | 0 (0.0%) |
| 18 to 34 Years | 12 (2.7%) | 0 (0.0%) |
| 35 to 64 Years | 27 (2.4%) | 17 (1.8%) |
| 65 to 74 Years | 8 (2.3%) | 0 (0.0%) |
| 75 Years and over | 0 (0.0%) | 10 (2.7%) |
Disability Class: Cognitive Difficulty
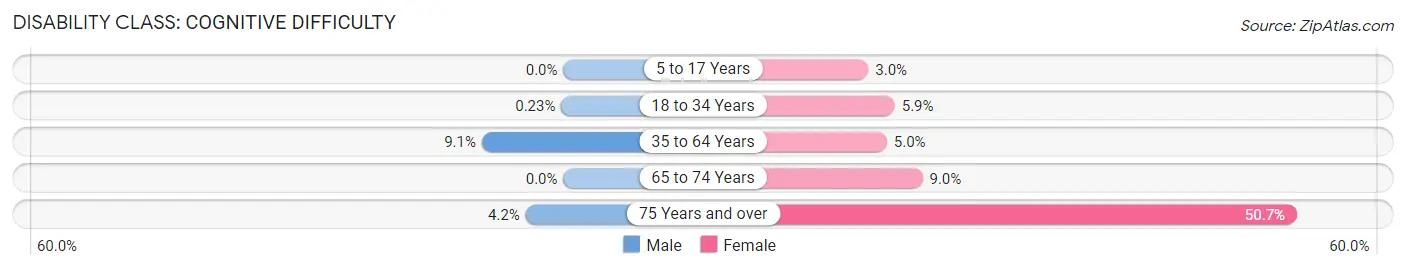
| Age Bracket | Male | Female |
| 5 to 17 Years | 0 (0.0%) | 14 (3.0%) |
| 18 to 34 Years | 1 (0.2%) | 17 (5.9%) |
| 35 to 64 Years | 104 (9.1%) | 47 (5.0%) |
| 65 to 74 Years | 0 (0.0%) | 24 (9.0%) |
| 75 Years and over | 5 (4.2%) | 185 (50.7%) |
Disability Class: Ambulatory Difficulty
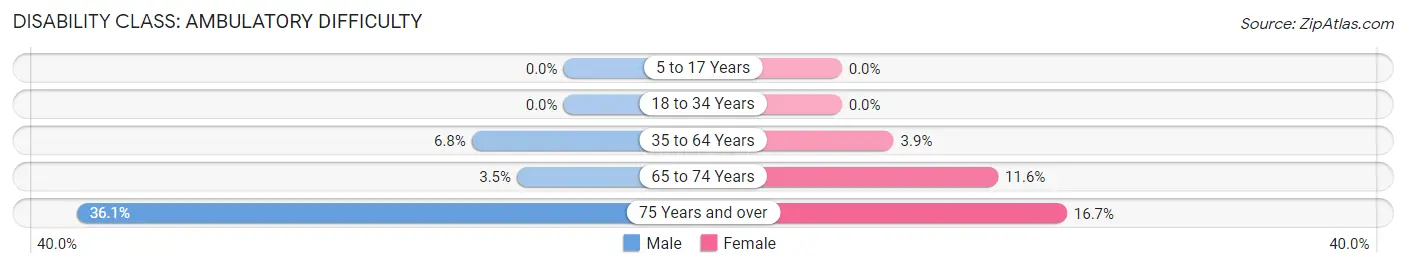
| Age Bracket | Male | Female |
| 5 to 17 Years | 0 (0.0%) | 0 (0.0%) |
| 18 to 34 Years | 0 (0.0%) | 0 (0.0%) |
| 35 to 64 Years | 78 (6.8%) | 36 (3.8%) |
| 65 to 74 Years | 12 (3.5%) | 31 (11.6%) |
| 75 Years and over | 43 (36.1%) | 61 (16.7%) |
Disability Class: Self-Care Difficulty
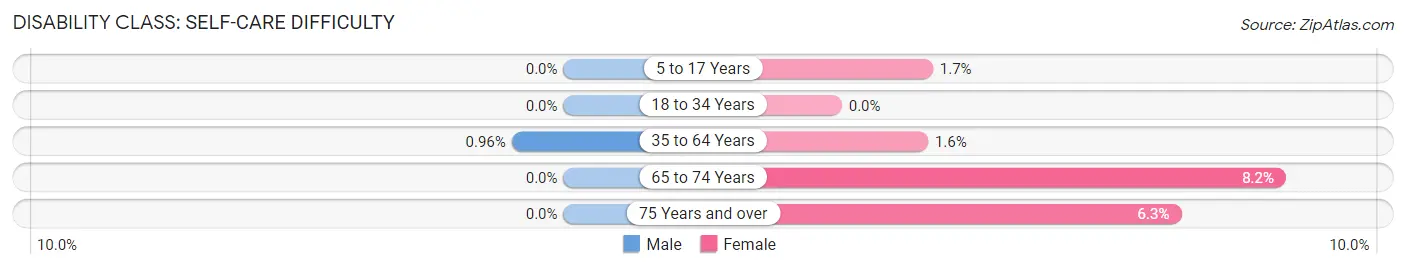
| Age Bracket | Male | Female |
| 5 to 17 Years | 0 (0.0%) | 8 (1.7%) |
| 18 to 34 Years | 0 (0.0%) | 0 (0.0%) |
| 35 to 64 Years | 11 (1.0%) | 15 (1.6%) |
| 65 to 74 Years | 0 (0.0%) | 22 (8.2%) |
| 75 Years and over | 0 (0.0%) | 23 (6.3%) |
Technology Access in Forked River
Computing Device Access in Forked River
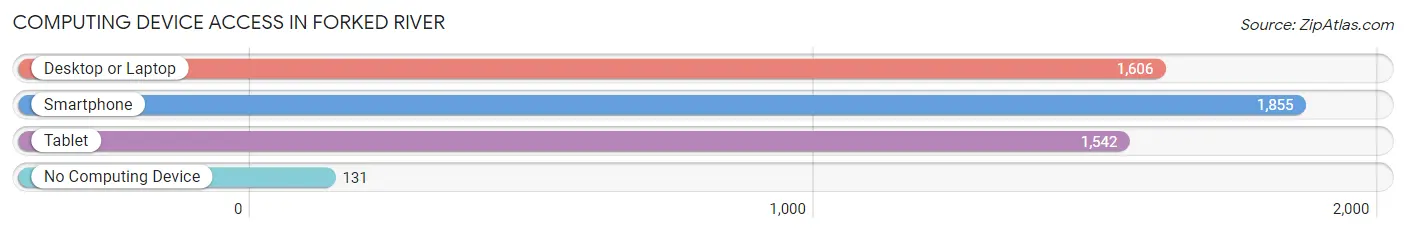
| Device Type | # Households | % Households |
| Desktop or Laptop | 1,606 | 76.9% |
| Smartphone | 1,855 | 88.8% |
| Tablet | 1,542 | 73.9% |
| No Computing Device | 131 | 6.3% |
| Total | 2,088 | 100.0% |
Internet Access in Forked River
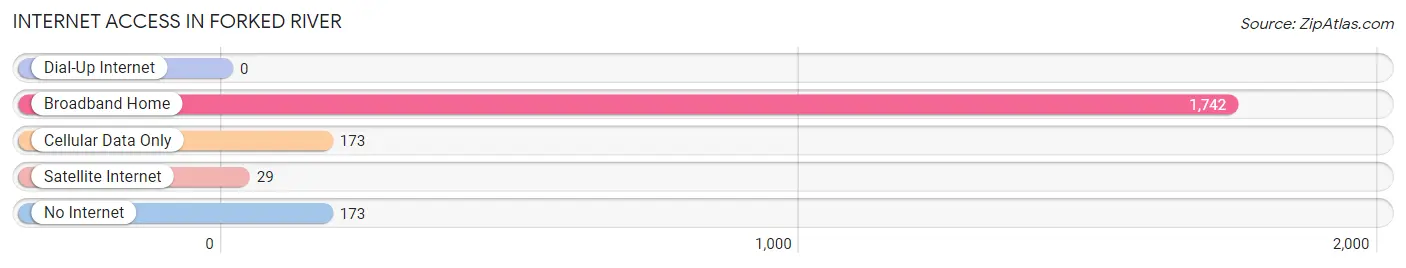
| Internet Type | # Households | % Households |
| Dial-Up Internet | 0 | 0.0% |
| Broadband Home | 1,742 | 83.4% |
| Cellular Data Only | 173 | 8.3% |
| Satellite Internet | 29 | 1.4% |
| No Internet | 173 | 8.3% |
| Total | 2,088 | 100.0% |
Forked River Summary
Forked River is a census-designated place (CDP) located in Ocean County, New Jersey, United States. As of the 2010 United States Census, the CDP's population was 5,244.
History
Forked River was originally known as "Cedar Creek" and was part of the Township of Dover, which was established in 1767. The name was changed to Forked River in 1834. The name is derived from the nearby Forked River, which is a tributary of the Barnegat Bay.
The area was first settled in the late 17th century by Dutch and English settlers. The area was primarily used for farming and fishing. In the early 19th century, the area began to develop as a resort community, with many summer homes being built along the river.
In the late 19th century, the area began to develop as a commercial fishing center. The first commercial fishing pier was built in 1891. The pier was destroyed by a storm in 1903, but was rebuilt in 1906.
Geography
Forked River is located at 39 52 45 North 74 11 45 West 39 879167 74 195278
According to the United States Census Bureau, the CDP has a total area of 4.3 square miles (11.2 km2), of which, 4.2 square miles (10.9 km2) of it is land and 0.1 square miles (0.3 km2) of it (2.37%) is water.
Economy
Forked River is a small community with a primarily service-based economy. The largest employers in the area are the local schools, hospitals, and government offices. There are also a number of small businesses in the area, including restaurants, retail stores, and professional services.
Demographics
As of the 2010 United States Census, there were 5,244 people, 2,068 households, and 1,521 families residing in the CDP. The population density was 1,241.3 per square mile (478.2/km2). There were 2,220 housing units at an average density of 527.2 per square mile (203.3/km2). The racial makeup of the CDP was 94.2% White, 1.3% African American, 0.2% Native American, 1.7% Asian, 0.1% Pacific Islander, 1.2% from other races, and 1.4% from two or more races. Hispanic or Latino of any race were 5.2% of the population.
There were 2,068 households, out of which 28.3% had children under the age of 18 living with them, 56.2% were married couples living together, 10.7% had a female householder with no husband present, and 28.7% were non-families. 22.7% of all households were made up of individuals, and 9.2% had someone living alone who was 65 years of age or older. The average household size was 2.53 and the average family size was 2.97.
In the CDP, the population was spread out, with 22.2% under the age of 18, 7.2% from 18 to 24, 25.2% from 25 to 44, 30.2% from 45 to 64, and 15.2% who were 65 years of age or older. The median age was 41.2 years. For every 100 females, there were 97.2 males. For every 100 females age 18 and over, there were 94.2 males.
The median income for a household in the CDP was $63,958, and the median income for a family was $71,964. Males had a median income of $51,964 versus $41,250 for females. The per capita income for the CDP was $29,945. About 4.2% of families and 5.3% of the population were below the poverty line, including 6.2% of those under age 18 and 4.2% of those age 65 or over.
Common Questions
What is Per Capita Income in Forked River?
Per Capita income in Forked River is $46,836.
What is the Median Family Income in Forked River?
Median Family Income in Forked River is $124,677.
What is the Median Household income in Forked River?
Median Household Income in Forked River is $87,195.
What is Income or Wage Gap in Forked River?
Income or Wage Gap in Forked River is 25.7%.
Women in Forked River earn 74.3 cents for every dollar earned by a man.
What is Inequality or Gini Index in Forked River?
Inequality or Gini Index in Forked River is 0.46.
What is the Total Population of Forked River?
Total Population of Forked River is 5,003.
What is the Total Male Population of Forked River?
Total Male Population of Forked River is 2,491.
What is the Total Female Population of Forked River?
Total Female Population of Forked River is 2,512.
What is the Ratio of Males per 100 Females in Forked River?
There are 99.16 Males per 100 Females in Forked River.
What is the Ratio of Females per 100 Males in Forked River?
There are 100.84 Females per 100 Males in Forked River.
What is the Median Population Age in Forked River?
Median Population Age in Forked River is 46.9 Years.
What is the Average Family Size in Forked River
Average Family Size in Forked River is 3.3 People.
What is the Average Household Size in Forked River
Average Household Size in Forked River is 2.4 People.
How Large is the Labor Force in Forked River?
There are 2,463 People in the Labor Forcein in Forked River.
What is the Percentage of People in the Labor Force in Forked River?
61.8% of People are in the Labor Force in Forked River.
What is the Unemployment Rate in Forked River?
Unemployment Rate in Forked River is 5.1%.