Absecon, NJ Map & Demographics
Absecon Map
Absecon Overview
$41,063
PER CAPITA INCOME
$92,778
AVG FAMILY INCOME
$73,141
AVG HOUSEHOLD INCOME
15.6%
WAGE / INCOME GAP [ % ]
84.4¢/ $1
WAGE / INCOME GAP [ $ ]
0.48
INEQUALITY / GINI INDEX
9,086
TOTAL POPULATION
4,514
MALE POPULATION
4,572
FEMALE POPULATION
98.73
MALES / 100 FEMALES
101.28
FEMALES / 100 MALES
37.6
MEDIAN AGE
3.1
AVG FAMILY SIZE
2.5
AVG HOUSEHOLD SIZE
4,441
LABOR FORCE [ PEOPLE ]
61.5%
PERCENT IN LABOR FORCE
8.7%
UNEMPLOYMENT RATE
Absecon Area Codes
Income in Absecon
Income Overview in Absecon
Per Capita Income in Absecon is $41,063, while median incomes of families and households are $92,778 and $73,141 respectively.
| Characteristic | Number | Measure |
| Per Capita Income | 9,086 | $41,063 |
| Median Family Income | 2,414 | $92,778 |
| Mean Family Income | 2,414 | $127,396 |
| Median Household Income | 3,564 | $73,141 |
| Mean Household Income | 3,564 | $106,976 |
| Income Deficit | 2,414 | $0 |
| Wage / Income Gap (%) | 9,086 | 15.59% |
| Wage / Income Gap ($) | 9,086 | 84.41¢ per $1 |
| Gini / Inequality Index | 9,086 | 0.48 |
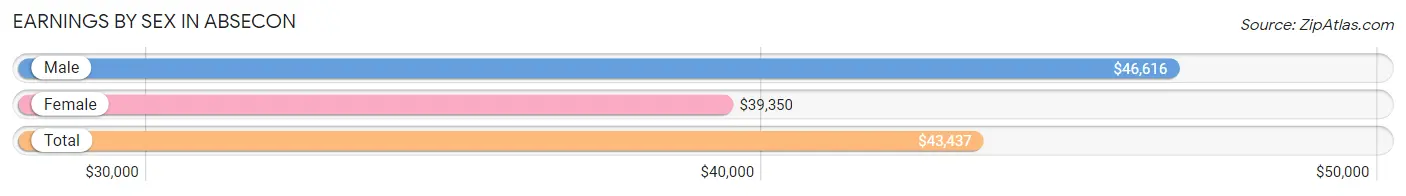
Earnings by Sex in Absecon
Average Earnings in Absecon are $43,437, $46,616 for men and $39,350 for women, a difference of 15.6%.
| Sex | Number | Average Earnings |
| Male | 2,263 (50.4%) | $46,616 |
| Female | 2,231 (49.6%) | $39,350 |
| Total | 4,494 (100.0%) | $43,437 |
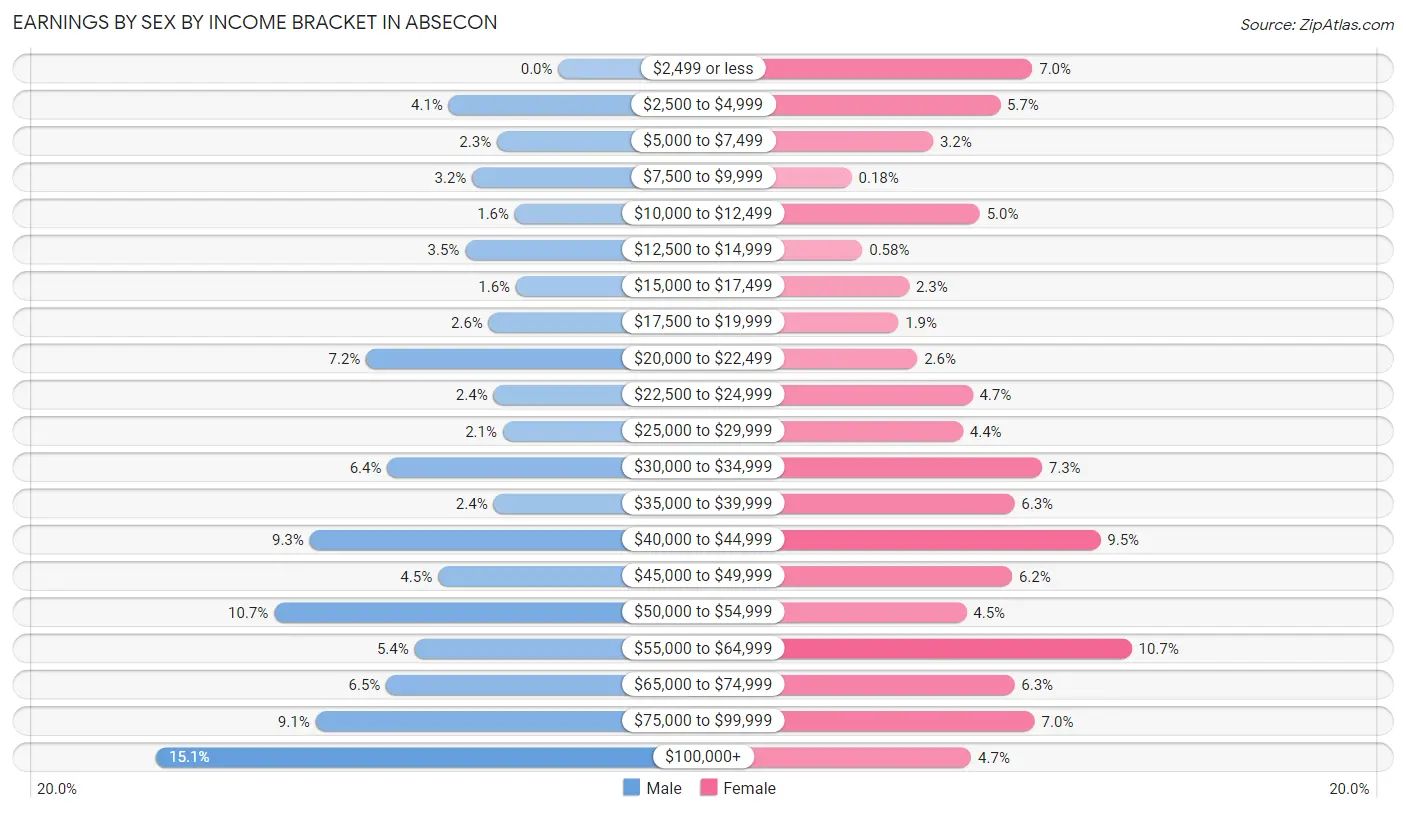
Earnings by Sex by Income Bracket in Absecon
The most common earnings brackets in Absecon are $100,000+ for men (341 | 15.1%) and $55,000 to $64,999 for women (238 | 10.7%).
| Income | Male | Female |
| $2,499 or less | 0 (0.0%) | 155 (7.0%) |
| $2,500 to $4,999 | 93 (4.1%) | 128 (5.7%) |
| $5,000 to $7,499 | 52 (2.3%) | 72 (3.2%) |
| $7,500 to $9,999 | 73 (3.2%) | 4 (0.2%) |
| $10,000 to $12,499 | 37 (1.6%) | 111 (5.0%) |
| $12,500 to $14,999 | 79 (3.5%) | 13 (0.6%) |
| $15,000 to $17,499 | 36 (1.6%) | 52 (2.3%) |
| $17,500 to $19,999 | 59 (2.6%) | 43 (1.9%) |
| $20,000 to $22,499 | 163 (7.2%) | 59 (2.6%) |
| $22,500 to $24,999 | 55 (2.4%) | 105 (4.7%) |
| $25,000 to $29,999 | 47 (2.1%) | 97 (4.3%) |
| $30,000 to $34,999 | 145 (6.4%) | 163 (7.3%) |
| $35,000 to $39,999 | 55 (2.4%) | 140 (6.3%) |
| $40,000 to $44,999 | 211 (9.3%) | 212 (9.5%) |
| $45,000 to $49,999 | 102 (4.5%) | 138 (6.2%) |
| $50,000 to $54,999 | 241 (10.6%) | 100 (4.5%) |
| $55,000 to $64,999 | 122 (5.4%) | 238 (10.7%) |
| $65,000 to $74,999 | 146 (6.5%) | 140 (6.3%) |
| $75,000 to $99,999 | 206 (9.1%) | 157 (7.0%) |
| $100,000+ | 341 (15.1%) | 104 (4.7%) |
| Total | 2,263 (100.0%) | 2,231 (100.0%) |
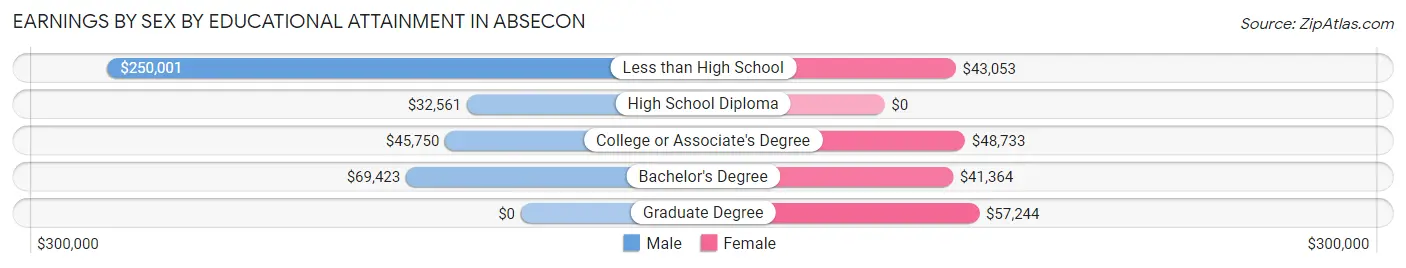
Earnings by Sex by Educational Attainment in Absecon
Average earnings in Absecon are $52,923 for men and $40,893 for women, a difference of 22.7%. Men with an educational attainment of less than high school enjoy the highest average annual earnings of $250,001, while those with high school diploma education earn the least with $32,561. Women with an educational attainment of graduate degree earn the most with the average annual earnings of $57,244, while those with bachelor's degree education have the smallest earnings of $41,364.
| Educational Attainment | Male Income | Female Income |
| Less than High School | $250,001 | $43,053 |
| High School Diploma | $32,561 | $0 |
| College or Associate's Degree | $45,750 | $48,733 |
| Bachelor's Degree | $69,423 | $41,364 |
| Graduate Degree | - | - |
| Total | $52,923 | $40,893 |
Family Income in Absecon
Family Income Brackets in Absecon
According to the Absecon family income data, there are 729 families falling into the $100,000 to $149,999 income range, which is the most common income bracket and makes up 30.2% of all families. Conversely, the $10,000 to $14,999 income bracket is the least frequent group with only 31 families (1.3%) belonging to this category.
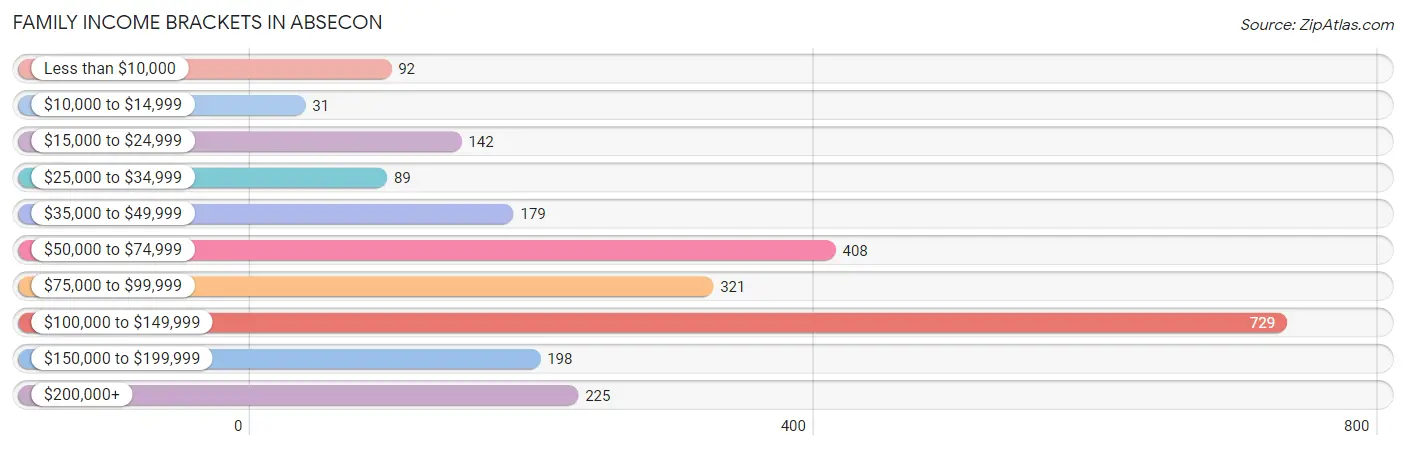
| Income Bracket | # Families | % Families |
| Less than $10,000 | 92 | 3.8% |
| $10,000 to $14,999 | 31 | 1.3% |
| $15,000 to $24,999 | 142 | 5.9% |
| $25,000 to $34,999 | 89 | 3.7% |
| $35,000 to $49,999 | 179 | 7.4% |
| $50,000 to $74,999 | 408 | 16.9% |
| $75,000 to $99,999 | 321 | 13.3% |
| $100,000 to $149,999 | 729 | 30.2% |
| $150,000 to $199,999 | 198 | 8.2% |
| $200,000+ | 225 | 9.3% |
Family Income by Famaliy Size in Absecon
3-person families (598 | 24.8%) account for the highest median family income in Absecon with $118,947 per family, while 3-person families (598 | 24.8%) have the highest median income of $39,649 per family member.
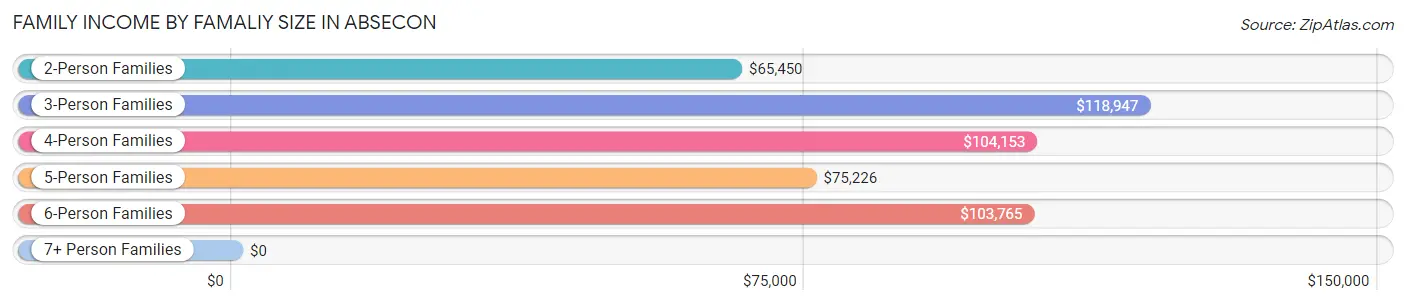
| Income Bracket | # Families | Median Income |
| 2-Person Families | 1,095 (45.4%) | $65,450 |
| 3-Person Families | 598 (24.8%) | $118,947 |
| 4-Person Families | 421 (17.4%) | $104,153 |
| 5-Person Families | 181 (7.5%) | $75,226 |
| 6-Person Families | 115 (4.8%) | $103,765 |
| 7+ Person Families | 4 (0.2%) | $0 |
| Total | 2,414 (100.0%) | $92,778 |
Family Income by Number of Earners in Absecon
The median family income in Absecon is $92,778, with families comprising 3+ earners (203) having the highest median family income of $143,293, while families with no earners (403) have the lowest median family income of $54,375, accounting for 8.4% and 16.7% of families, respectively.
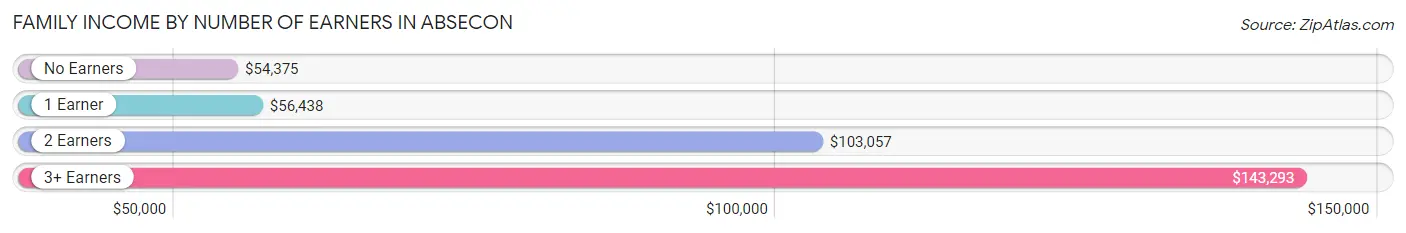
| Number of Earners | # Families | Median Income |
| No Earners | 403 (16.7%) | $54,375 |
| 1 Earner | 698 (28.9%) | $56,438 |
| 2 Earners | 1,110 (46.0%) | $103,057 |
| 3+ Earners | 203 (8.4%) | $143,293 |
| Total | 2,414 (100.0%) | $92,778 |
Household Income in Absecon
Household Income Brackets in Absecon
With 834 households falling in the category, the $100,000 to $149,999 income range is the most frequent in Absecon, accounting for 23.4% of all households. In contrast, only 29 households (0.8%) fall into the $10,000 to $14,999 income bracket, making it the least populous group.
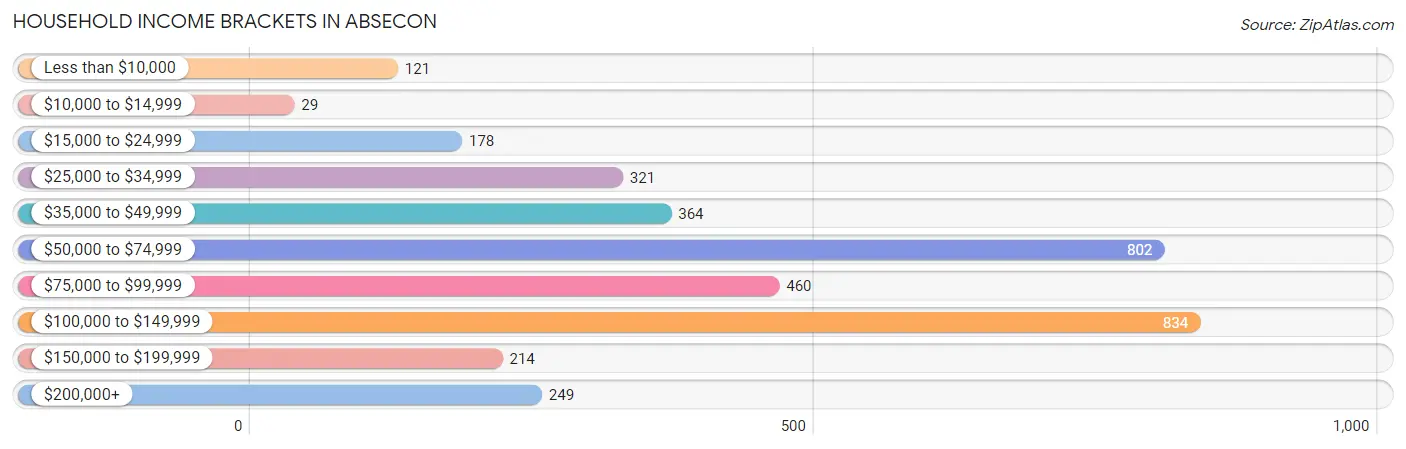
| Income Bracket | # Households | % Households |
| Less than $10,000 | 121 | 3.4% |
| $10,000 to $14,999 | 29 | 0.8% |
| $15,000 to $24,999 | 178 | 5.0% |
| $25,000 to $34,999 | 321 | 9.0% |
| $35,000 to $49,999 | 364 | 10.2% |
| $50,000 to $74,999 | 802 | 22.5% |
| $75,000 to $99,999 | 460 | 12.9% |
| $100,000 to $149,999 | 834 | 23.4% |
| $150,000 to $199,999 | 214 | 6.0% |
| $200,000+ | 249 | 7.0% |
Household Income by Householder Age in Absecon
The median household income in Absecon is $73,141, with the highest median household income of $90,402 found in the 25 to 44 years age bracket for the primary householder. A total of 1,085 households (30.4%) fall into this category. Meanwhile, the 15 to 24 years age bracket for the primary householder has the lowest median household income of $54,464, with 42 households (1.2%) in this group.
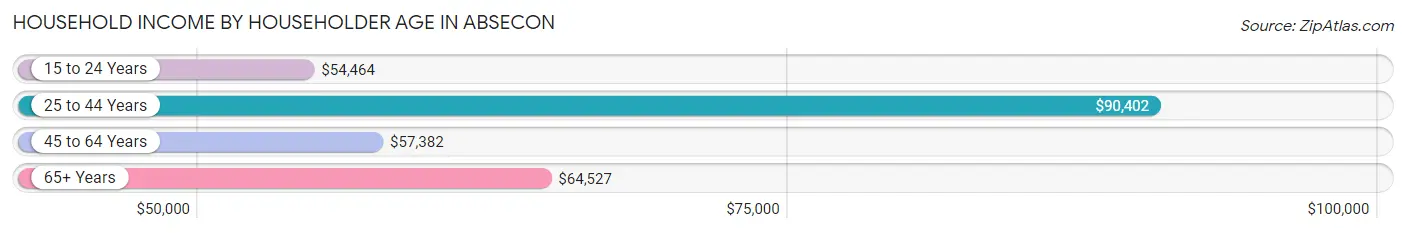
| Income Bracket | # Households | Median Income |
| 15 to 24 Years | 42 (1.2%) | $54,464 |
| 25 to 44 Years | 1,085 (30.4%) | $90,402 |
| 45 to 64 Years | 1,392 (39.1%) | $57,382 |
| 65+ Years | 1,045 (29.3%) | $64,527 |
| Total | 3,564 (100.0%) | $73,141 |
Poverty in Absecon
Income Below Poverty by Sex and Age in Absecon
With 5.7% poverty level for males and 12.6% for females among the residents of Absecon, under 5 year old males and 15 year old females are the most vulnerable to poverty, with 53 males (14.1%) and 18 females (62.1%) in their respective age groups living below the poverty level.
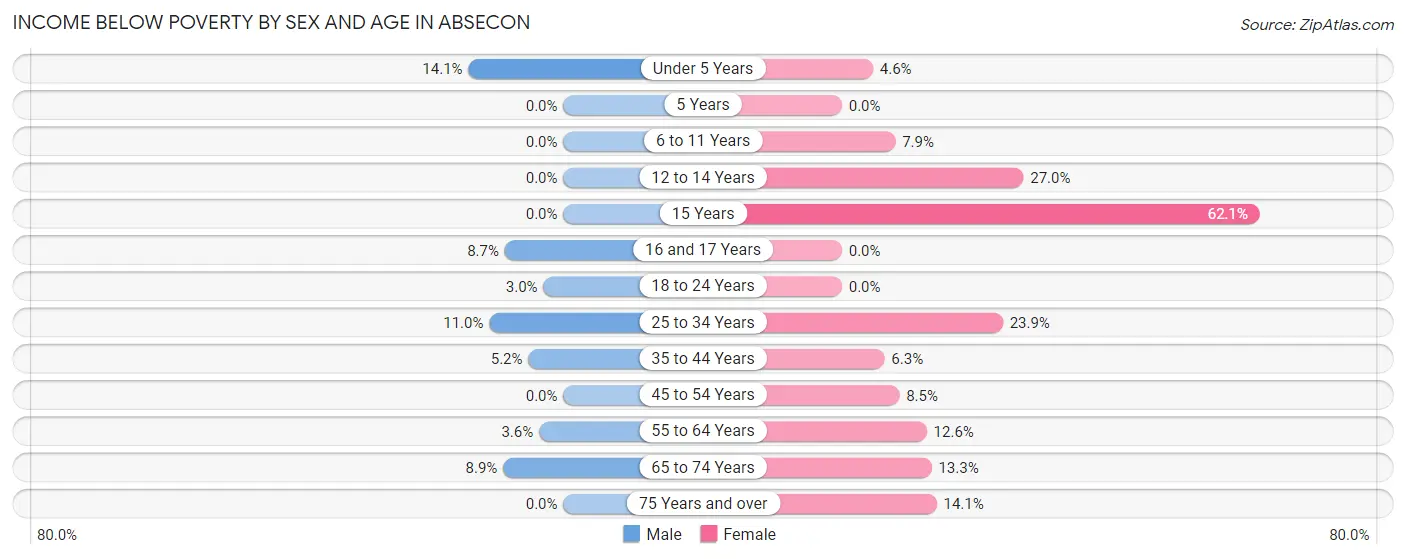
| Age Bracket | Male | Female |
| Under 5 Years | 53 (14.1%) | 16 (4.6%) |
| 5 Years | 0 (0.0%) | 0 (0.0%) |
| 6 to 11 Years | 0 (0.0%) | 36 (7.9%) |
| 12 to 14 Years | 0 (0.0%) | 38 (27.0%) |
| 15 Years | 0 (0.0%) | 18 (62.1%) |
| 16 and 17 Years | 8 (8.7%) | 0 (0.0%) |
| 18 to 24 Years | 12 (3.0%) | 0 (0.0%) |
| 25 to 34 Years | 80 (11.0%) | 172 (23.9%) |
| 35 to 44 Years | 28 (5.2%) | 35 (6.3%) |
| 45 to 54 Years | 0 (0.0%) | 29 (8.5%) |
| 55 to 64 Years | 28 (3.6%) | 107 (12.6%) |
| 65 to 74 Years | 44 (8.9%) | 61 (13.3%) |
| 75 Years and over | 0 (0.0%) | 57 (14.1%) |
| Total | 253 (5.7%) | 569 (12.6%) |
Income Above Poverty by Sex and Age in Absecon
According to the poverty statistics in Absecon, males aged 5 years and females aged 16 and 17 years are the age groups that are most secure financially, with 100.0% of males and 100.0% of females in these age groups living above the poverty line.
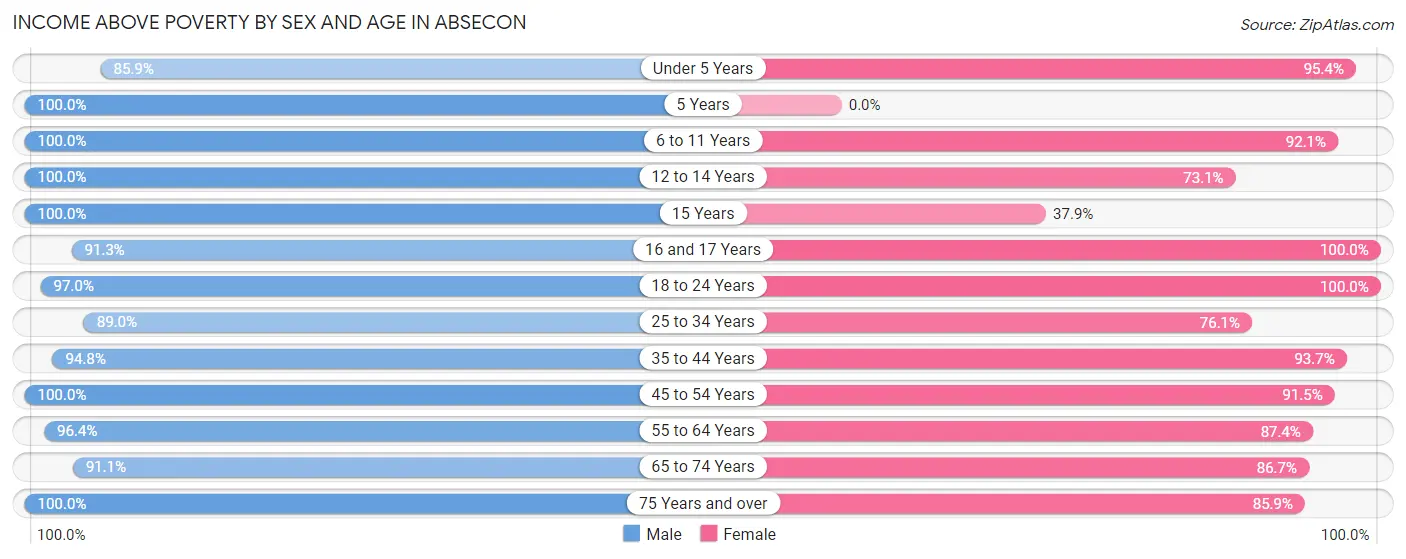
| Age Bracket | Male | Female |
| Under 5 Years | 323 (85.9%) | 331 (95.4%) |
| 5 Years | 116 (100.0%) | 0 (0.0%) |
| 6 to 11 Years | 248 (100.0%) | 418 (92.1%) |
| 12 to 14 Years | 127 (100.0%) | 103 (73.1%) |
| 15 Years | 26 (100.0%) | 11 (37.9%) |
| 16 and 17 Years | 84 (91.3%) | 67 (100.0%) |
| 18 to 24 Years | 394 (97.0%) | 141 (100.0%) |
| 25 to 34 Years | 647 (89.0%) | 548 (76.1%) |
| 35 to 44 Years | 510 (94.8%) | 518 (93.7%) |
| 45 to 54 Years | 192 (100.0%) | 311 (91.5%) |
| 55 to 64 Years | 748 (96.4%) | 742 (87.4%) |
| 65 to 74 Years | 448 (91.1%) | 397 (86.7%) |
| 75 Years and over | 342 (100.0%) | 348 (85.9%) |
| Total | 4,205 (94.3%) | 3,935 (87.4%) |
Income Below Poverty Among Married-Couple Families in Absecon
The poverty statistics for married-couple families in Absecon show that 1.6% or 28 of the total 1,778 families live below the poverty line. Families with 1 or 2 children have the highest poverty rate of 2.1%, comprising of 11 families. On the other hand, families with 3 or 4 children have the lowest poverty rate of 0.0%, which includes 0 families.
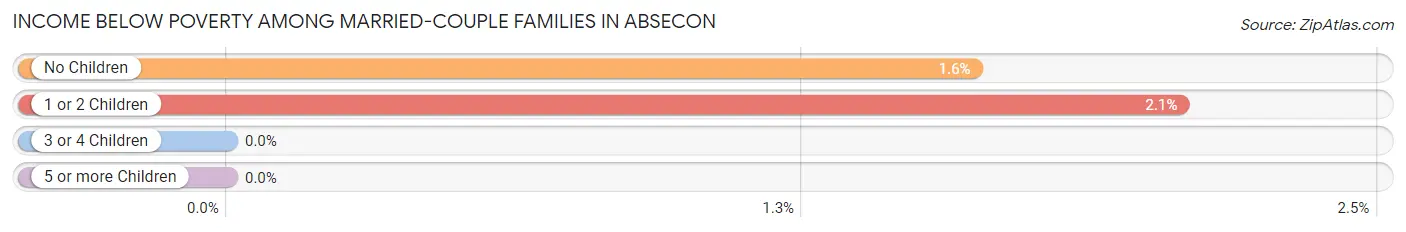
| Children | Above Poverty | Below Poverty |
| No Children | 1,030 (98.4%) | 17 (1.6%) |
| 1 or 2 Children | 520 (97.9%) | 11 (2.1%) |
| 3 or 4 Children | 200 (100.0%) | 0 (0.0%) |
| 5 or more Children | 0 (0.0%) | 0 (0.0%) |
| Total | 1,750 (98.4%) | 28 (1.6%) |
Income Below Poverty Among Single-Parent Households in Absecon
According to the poverty data in Absecon, 12.0% or 30 single-father households and 46.8% or 181 single-mother households are living below the poverty line. Among single-father households, those with 3 or 4 children have the highest poverty rate, with 11 households (100.0%) experiencing poverty. Likewise, among single-mother households, those with no children have the highest poverty rate, with 140 households (56.5%) falling below the poverty line.
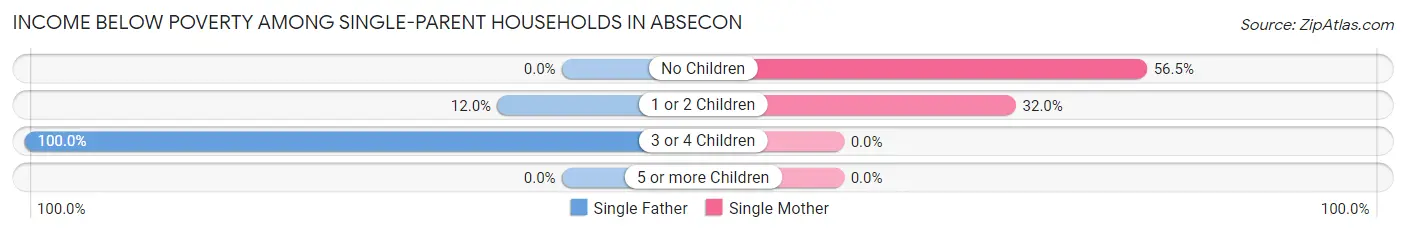
| Children | Single Father | Single Mother |
| No Children | 0 (0.0%) | 140 (56.5%) |
| 1 or 2 Children | 19 (12.0%) | 41 (32.0%) |
| 3 or 4 Children | 11 (100.0%) | 0 (0.0%) |
| 5 or more Children | 0 (0.0%) | 0 (0.0%) |
| Total | 30 (12.0%) | 181 (46.8%) |
Income Below Poverty Among Married-Couple vs Single-Parent Households in Absecon
The poverty data for Absecon shows that 28 of the married-couple family households (1.6%) and 211 of the single-parent households (33.2%) are living below the poverty level. Within the married-couple family households, those with 1 or 2 children have the highest poverty rate, with 11 households (2.1%) falling below the poverty line. Among the single-parent households, those with 3 or 4 children have the highest poverty rate, with 11 household (50.0%) living below poverty.
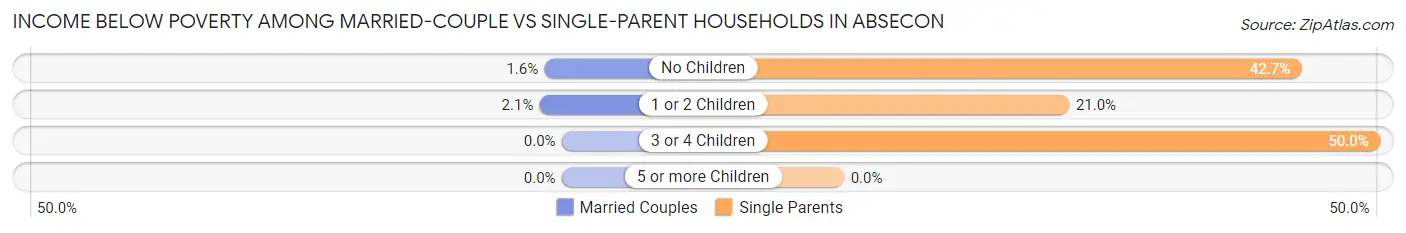
| Children | Married-Couple Families | Single-Parent Households |
| No Children | 17 (1.6%) | 140 (42.7%) |
| 1 or 2 Children | 11 (2.1%) | 60 (21.0%) |
| 3 or 4 Children | 0 (0.0%) | 11 (50.0%) |
| 5 or more Children | 0 (0.0%) | 0 (0.0%) |
| Total | 28 (1.6%) | 211 (33.2%) |
Race in Absecon
The most populous races in Absecon are White / Caucasian (6,539 | 72.0%), Hispanic or Latino (1,498 | 16.5%), and Two or more Races (1,106 | 12.2%).
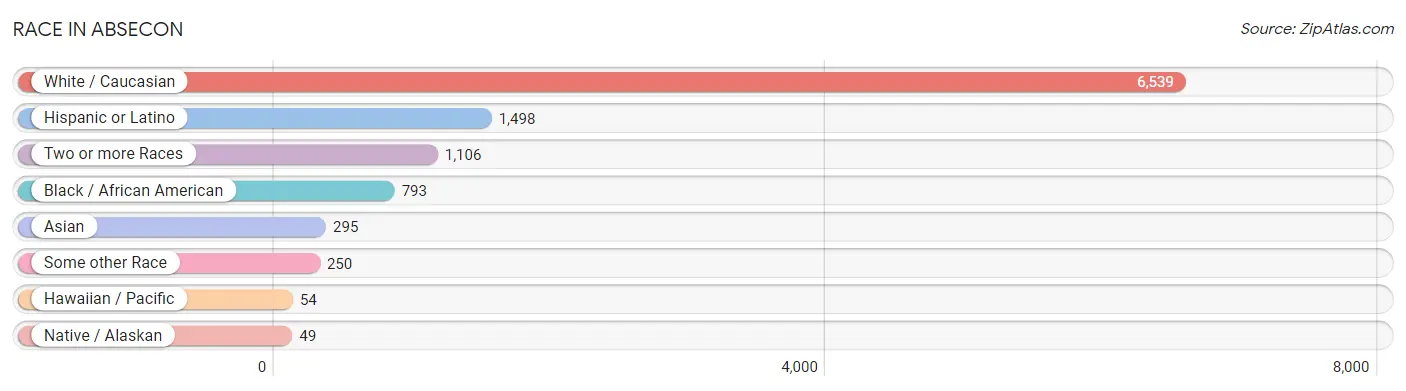
| Race | # Population | % Population |
| Asian | 295 | 3.3% |
| Black / African American | 793 | 8.7% |
| Hawaiian / Pacific | 54 | 0.6% |
| Hispanic or Latino | 1,498 | 16.5% |
| Native / Alaskan | 49 | 0.5% |
| White / Caucasian | 6,539 | 72.0% |
| Two or more Races | 1,106 | 12.2% |
| Some other Race | 250 | 2.8% |
| Total | 9,086 | 100.0% |
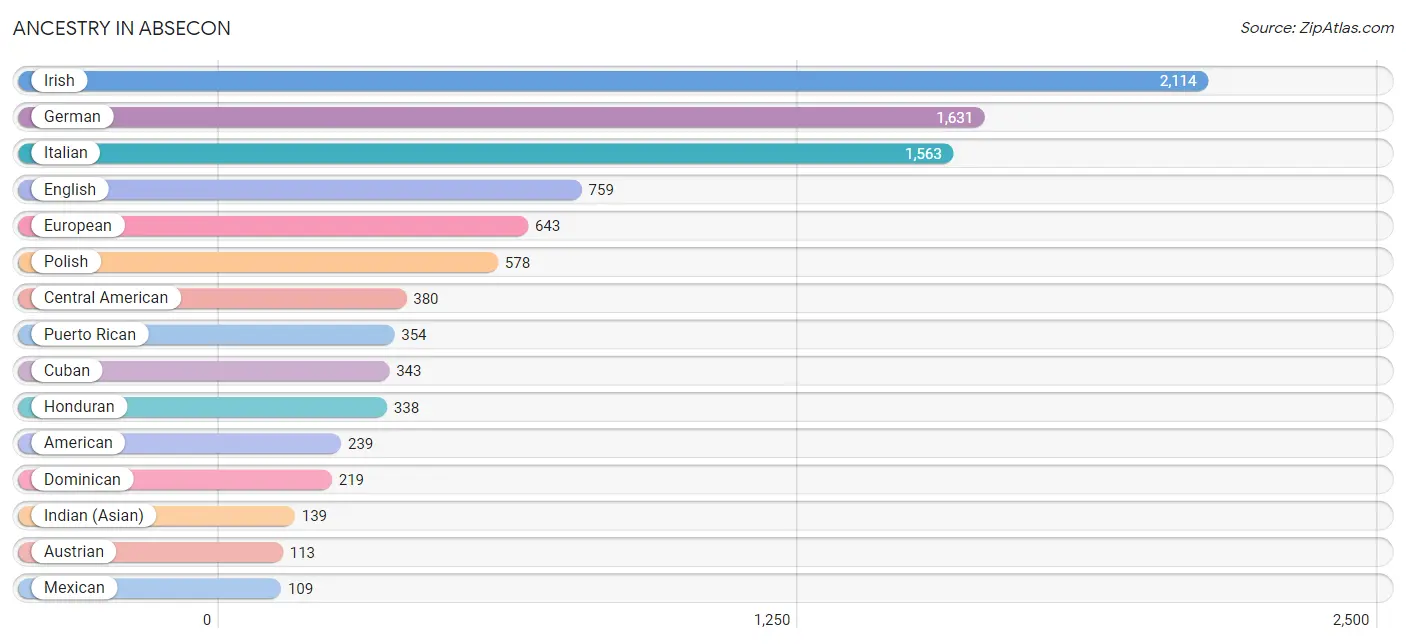
Ancestry in Absecon
The most populous ancestries reported in Absecon are Irish (2,114 | 23.3%), German (1,631 | 17.9%), Italian (1,563 | 17.2%), English (759 | 8.4%), and European (643 | 7.1%), together accounting for 73.9% of all Absecon residents.
| Ancestry | # Population | % Population |
| African | 54 | 0.6% |
| American | 239 | 2.6% |
| Austrian | 113 | 1.2% |
| Bermudan | 41 | 0.4% |
| British | 8 | 0.1% |
| British West Indian | 41 | 0.4% |
| Burmese | 21 | 0.2% |
| Central American | 380 | 4.2% |
| Colombian | 37 | 0.4% |
| Costa Rican | 18 | 0.2% |
| Croatian | 21 | 0.2% |
| Cuban | 343 | 3.8% |
| Dominican | 219 | 2.4% |
| Dutch | 49 | 0.5% |
| Eastern European | 21 | 0.2% |
| English | 759 | 8.4% |
| European | 643 | 7.1% |
| French | 96 | 1.1% |
| French Canadian | 24 | 0.3% |
| German | 1,631 | 17.9% |
| Greek | 8 | 0.1% |
| Guamanian / Chamorro | 41 | 0.4% |
| Honduran | 338 | 3.7% |
| Hungarian | 59 | 0.6% |
| Indian (Asian) | 139 | 1.5% |
| Irish | 2,114 | 23.3% |
| Italian | 1,563 | 17.2% |
| Jamaican | 15 | 0.2% |
| Kenyan | 44 | 0.5% |
| Korean | 66 | 0.7% |
| Lithuanian | 14 | 0.2% |
| Mexican | 109 | 1.2% |
| Mexican American Indian | 49 | 0.5% |
| Navajo | 14 | 0.2% |
| Northern European | 16 | 0.2% |
| Norwegian | 29 | 0.3% |
| Pakistani | 61 | 0.7% |
| Polish | 578 | 6.4% |
| Portuguese | 13 | 0.1% |
| Puerto Rican | 354 | 3.9% |
| Russian | 27 | 0.3% |
| Salvadoran | 24 | 0.3% |
| Scandinavian | 19 | 0.2% |
| Scotch-Irish | 17 | 0.2% |
| Scottish | 87 | 1.0% |
| South American | 37 | 0.4% |
| Sri Lankan | 11 | 0.1% |
| Subsaharan African | 54 | 0.6% |
| Swedish | 54 | 0.6% |
| Swiss | 11 | 0.1% |
| Thai | 31 | 0.3% |
| Ukrainian | 39 | 0.4% |
| Vietnamese | 24 | 0.3% |
| Welsh | 57 | 0.6% |
| West Indian | 15 | 0.2% | View All 55 Rows |
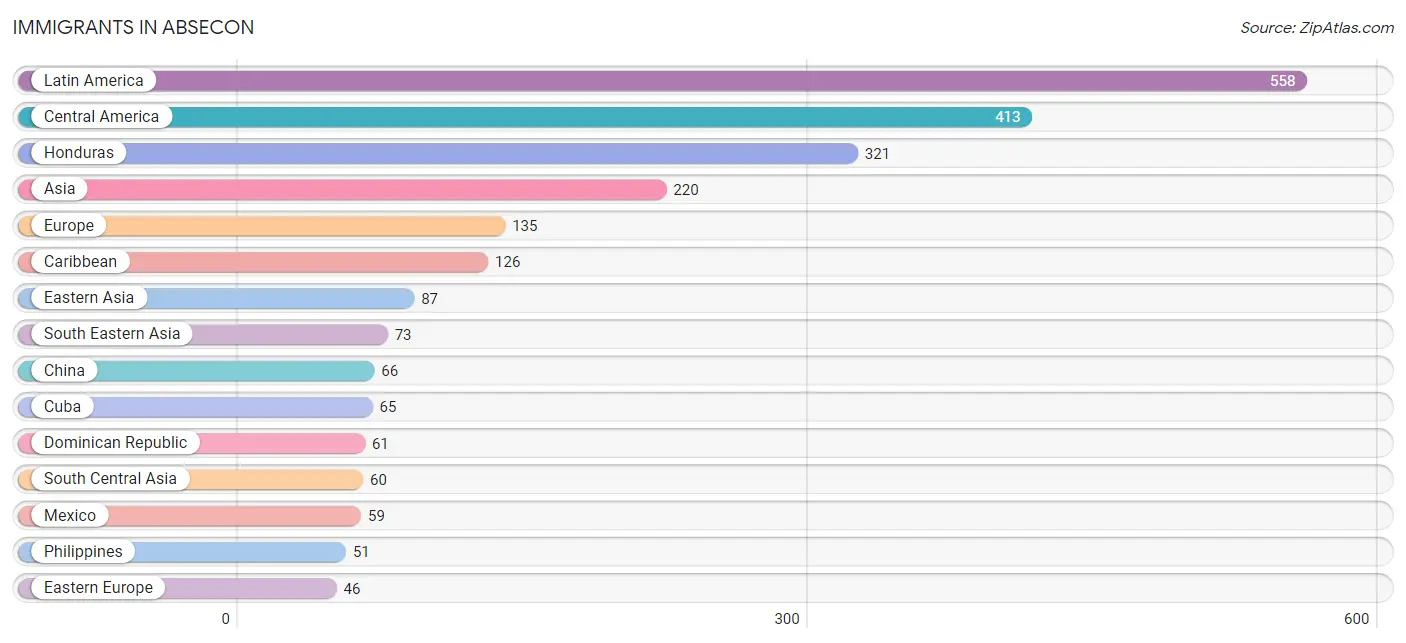
Immigrants in Absecon
The most numerous immigrant groups reported in Absecon came from Latin America (558 | 6.1%), Central America (413 | 4.5%), Honduras (321 | 3.5%), Asia (220 | 2.4%), and Europe (135 | 1.5%), together accounting for 18.1% of all Absecon residents.
| Immigration Origin | # Population | % Population |
| Africa | 22 | 0.2% |
| Asia | 220 | 2.4% |
| Bangladesh | 24 | 0.3% |
| Caribbean | 126 | 1.4% |
| Central America | 413 | 4.5% |
| China | 66 | 0.7% |
| Colombia | 19 | 0.2% |
| Cuba | 65 | 0.7% |
| Dominican Republic | 61 | 0.7% |
| Eastern Asia | 87 | 1.0% |
| Eastern Europe | 46 | 0.5% |
| El Salvador | 24 | 0.3% |
| Europe | 135 | 1.5% |
| Germany | 36 | 0.4% |
| Ghana | 22 | 0.2% |
| Honduras | 321 | 3.5% |
| India | 22 | 0.2% |
| Italy | 44 | 0.5% |
| Korea | 21 | 0.2% |
| Latin America | 558 | 6.1% |
| Mexico | 59 | 0.6% |
| Northern Europe | 9 | 0.1% |
| Pakistan | 14 | 0.2% |
| Panama | 9 | 0.1% |
| Philippines | 51 | 0.6% |
| Poland | 24 | 0.3% |
| Russia | 22 | 0.2% |
| South America | 19 | 0.2% |
| South Central Asia | 60 | 0.7% |
| South Eastern Asia | 73 | 0.8% |
| Southern Europe | 44 | 0.5% |
| Taiwan | 15 | 0.2% |
| Thailand | 11 | 0.1% |
| Vietnam | 11 | 0.1% |
| Western Africa | 22 | 0.2% |
| Western Europe | 36 | 0.4% | View All 36 Rows |
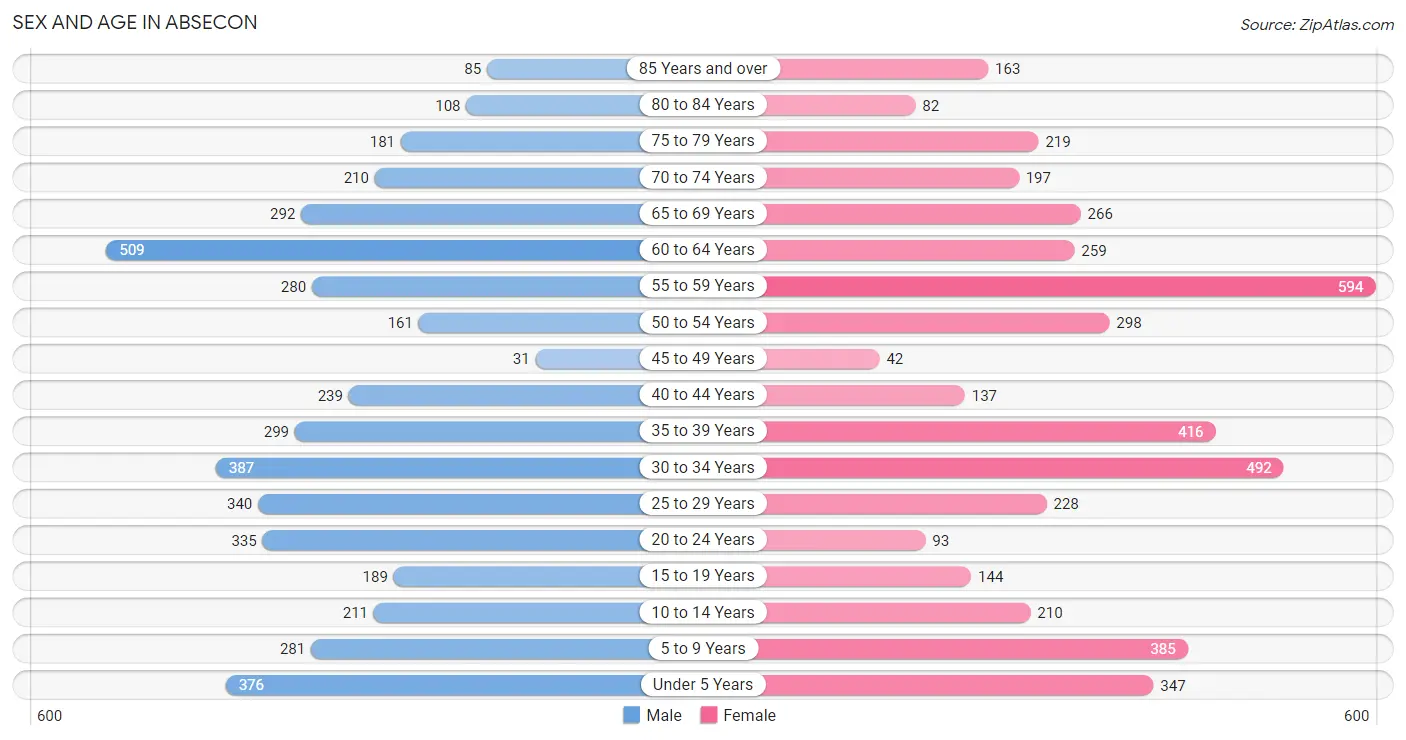
Sex and Age in Absecon
Sex and Age in Absecon
The most populous age groups in Absecon are 60 to 64 Years (509 | 11.3%) for men and 55 to 59 Years (594 | 13.0%) for women.
| Age Bracket | Male | Female |
| Under 5 Years | 376 (8.3%) | 347 (7.6%) |
| 5 to 9 Years | 281 (6.2%) | 385 (8.4%) |
| 10 to 14 Years | 211 (4.7%) | 210 (4.6%) |
| 15 to 19 Years | 189 (4.2%) | 144 (3.2%) |
| 20 to 24 Years | 335 (7.4%) | 93 (2.0%) |
| 25 to 29 Years | 340 (7.5%) | 228 (5.0%) |
| 30 to 34 Years | 387 (8.6%) | 492 (10.8%) |
| 35 to 39 Years | 299 (6.6%) | 416 (9.1%) |
| 40 to 44 Years | 239 (5.3%) | 137 (3.0%) |
| 45 to 49 Years | 31 (0.7%) | 42 (0.9%) |
| 50 to 54 Years | 161 (3.6%) | 298 (6.5%) |
| 55 to 59 Years | 280 (6.2%) | 594 (13.0%) |
| 60 to 64 Years | 509 (11.3%) | 259 (5.7%) |
| 65 to 69 Years | 292 (6.5%) | 266 (5.8%) |
| 70 to 74 Years | 210 (4.6%) | 197 (4.3%) |
| 75 to 79 Years | 181 (4.0%) | 219 (4.8%) |
| 80 to 84 Years | 108 (2.4%) | 82 (1.8%) |
| 85 Years and over | 85 (1.9%) | 163 (3.6%) |
| Total | 4,514 (100.0%) | 4,572 (100.0%) |
Families and Households in Absecon
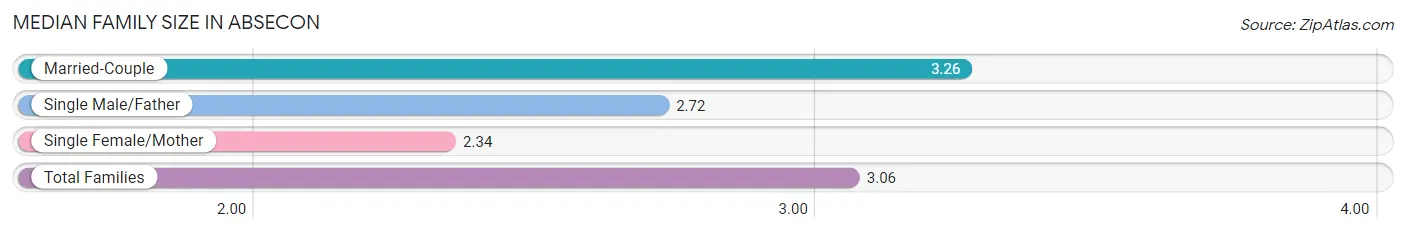
Median Family Size in Absecon
The median family size in Absecon is 3.06 persons per family, with married-couple families (1,778 | 73.7%) accounting for the largest median family size of 3.26 persons per family. On the other hand, single female/mother families (387 | 16.0%) represent the smallest median family size with 2.34 persons per family.
| Family Type | # Families | Family Size |
| Married-Couple | 1,778 (73.7%) | 3.26 |
| Single Male/Father | 249 (10.3%) | 2.72 |
| Single Female/Mother | 387 (16.0%) | 2.34 |
| Total Families | 2,414 (100.0%) | 3.06 |
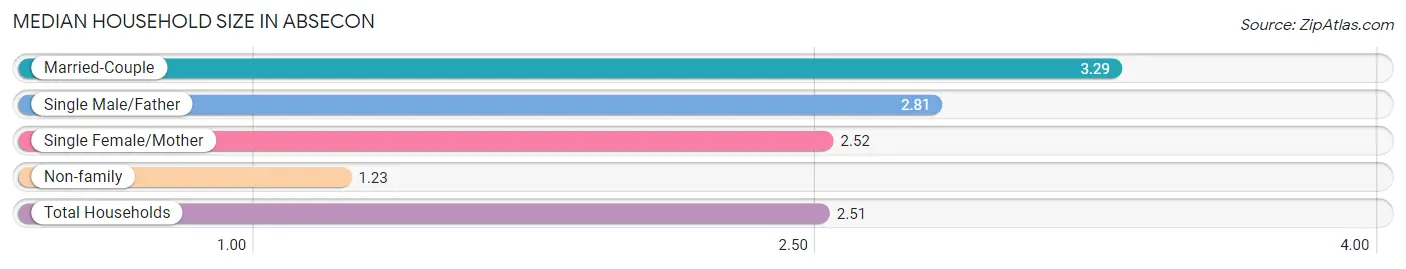
Median Household Size in Absecon
The median household size in Absecon is 2.51 persons per household, with married-couple households (1,778 | 49.9%) accounting for the largest median household size of 3.29 persons per household. non-family households (1,150 | 32.3%) represent the smallest median household size with 1.23 persons per household.
| Household Type | # Households | Household Size |
| Married-Couple | 1,778 (49.9%) | 3.29 |
| Single Male/Father | 249 (7.0%) | 2.81 |
| Single Female/Mother | 387 (10.9%) | 2.52 |
| Non-family | 1,150 (32.3%) | 1.23 |
| Total Households | 3,564 (100.0%) | 2.51 |
Household Size by Marriage Status in Absecon
Out of a total of 3,564 households in Absecon, 2,414 (67.7%) are family households, while 1,150 (32.3%) are nonfamily households. The most numerous type of family households are 2-person households, comprising 1,049, and the most common type of nonfamily households are 1-person households, comprising 921.
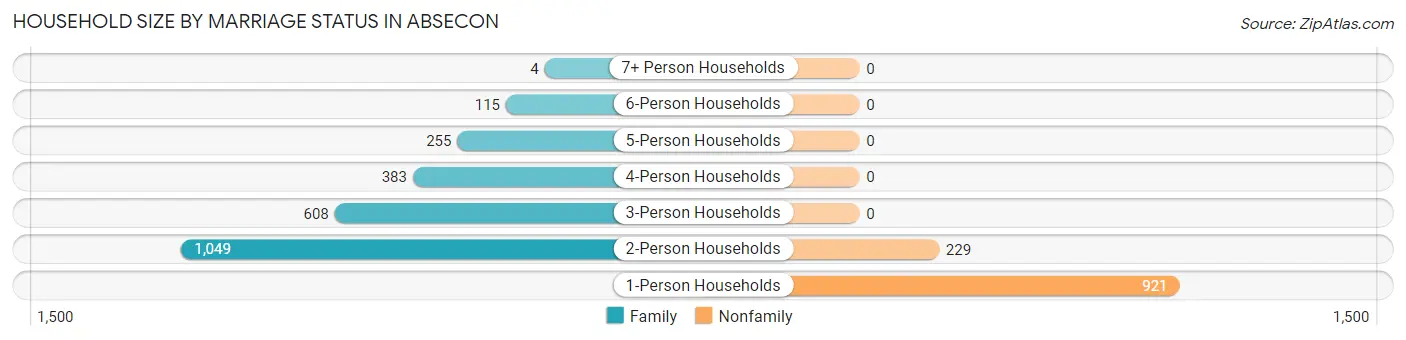
| Household Size | Family Households | Nonfamily Households |
| 1-Person Households | - | 921 (25.8%) |
| 2-Person Households | 1,049 (29.4%) | 229 (6.4%) |
| 3-Person Households | 608 (17.1%) | 0 (0.0%) |
| 4-Person Households | 383 (10.7%) | 0 (0.0%) |
| 5-Person Households | 255 (7.1%) | 0 (0.0%) |
| 6-Person Households | 115 (3.2%) | 0 (0.0%) |
| 7+ Person Households | 4 (0.1%) | 0 (0.0%) |
| Total | 2,414 (67.7%) | 1,150 (32.3%) |
Female Fertility in Absecon
Fertility by Age in Absecon
Average fertility rate in Absecon is 111.0 births per 1,000 women. Women in the age bracket of 35 to 50 years have the highest fertility rate with 172.0 births per 1,000 women. Women in the age bracket of 35 to 50 years acount for 65.9% of all women with births.
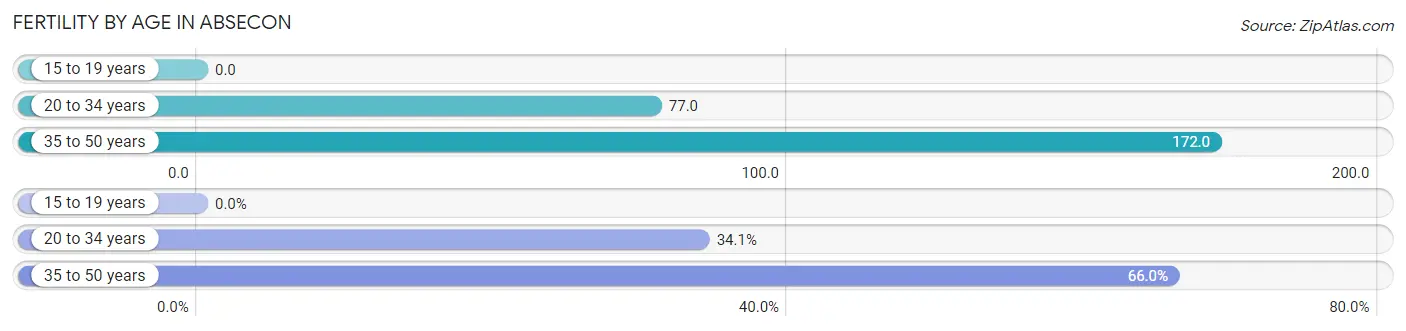
| Age Bracket | Women with Births | Births / 1,000 Women |
| 15 to 19 years | 0 (0.0%) | 0.0 |
| 20 to 34 years | 63 (34.1%) | 77.0 |
| 35 to 50 years | 122 (65.9%) | 172.0 |
| Total | 185 (100.0%) | 111.0 |
Fertility by Age by Marriage Status in Absecon
76.2% of women with births (185) in Absecon are married. The highest percentage of unmarried women with births falls into 20 to 34 years age bracket with 69.8% of them unmarried at the time of birth, while the lowest percentage of unmarried women with births belong to 35 to 50 years age bracket with 0.0% of them unmarried.
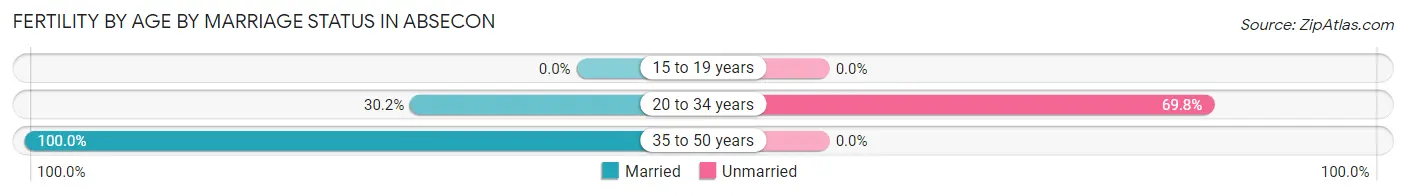
| Age Bracket | Married | Unmarried |
| 15 to 19 years | 0 (0.0%) | 0 (0.0%) |
| 20 to 34 years | 19 (30.2%) | 44 (69.8%) |
| 35 to 50 years | 122 (100.0%) | 0 (0.0%) |
| Total | 141 (76.2%) | 44 (23.8%) |
Fertility by Education in Absecon
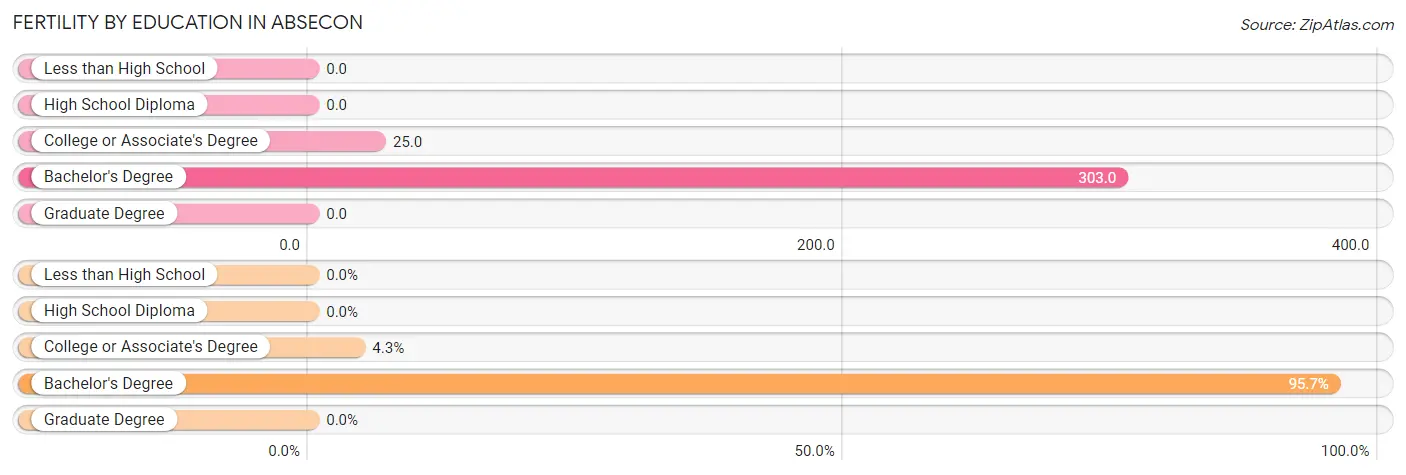
| Educational Attainment | Women with Births | Births / 1,000 Women |
| Less than High School | 0 (0.0%) | 0.0 |
| High School Diploma | 0 (0.0%) | 0.0 |
| College or Associate's Degree | 8 (4.3%) | 25.0 |
| Bachelor's Degree | 177 (95.7%) | 303.0 |
| Graduate Degree | 0 (0.0%) | 0.0 |
| Total | 185 (100.0%) | 111.0 |
Fertility by Education by Marriage Status in Absecon
23.8% of women with births in Absecon are unmarried. Women with the educational attainment of bachelor's degree are most likely to be married with 79.7% of them married at childbirth, while women with the educational attainment of college or associate's degree are least likely to be married with 100.0% of them unmarried at childbirth.
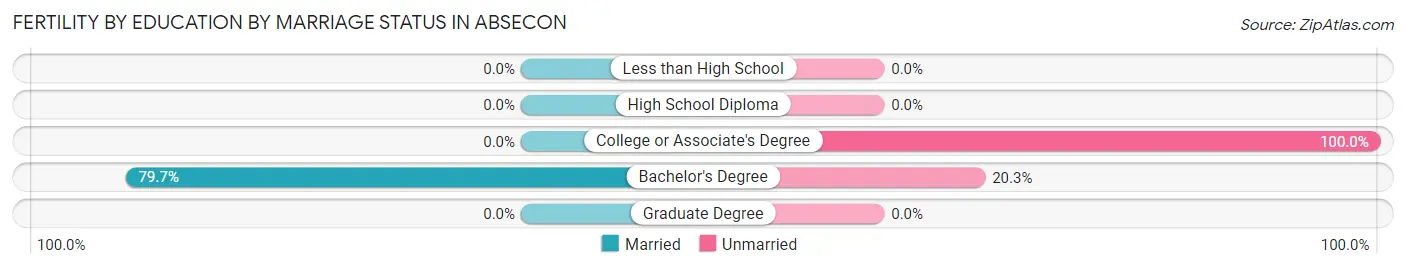
| Educational Attainment | Married | Unmarried |
| Less than High School | 0 (0.0%) | 0 (0.0%) |
| High School Diploma | 0 (0.0%) | 0 (0.0%) |
| College or Associate's Degree | 0 (0.0%) | 8 (100.0%) |
| Bachelor's Degree | 141 (79.7%) | 36 (20.3%) |
| Graduate Degree | 0 (0.0%) | 0 (0.0%) |
| Total | 141 (76.2%) | 44 (23.8%) |
Employment Characteristics in Absecon
Employment by Class of Employer in Absecon
Among the 3,901 employed individuals in Absecon, private company employees (2,157 | 55.3%), local government employees (587 | 15.0%), and self-employed (not incorporated) (275 | 7.0%) make up the most common classes of employment.
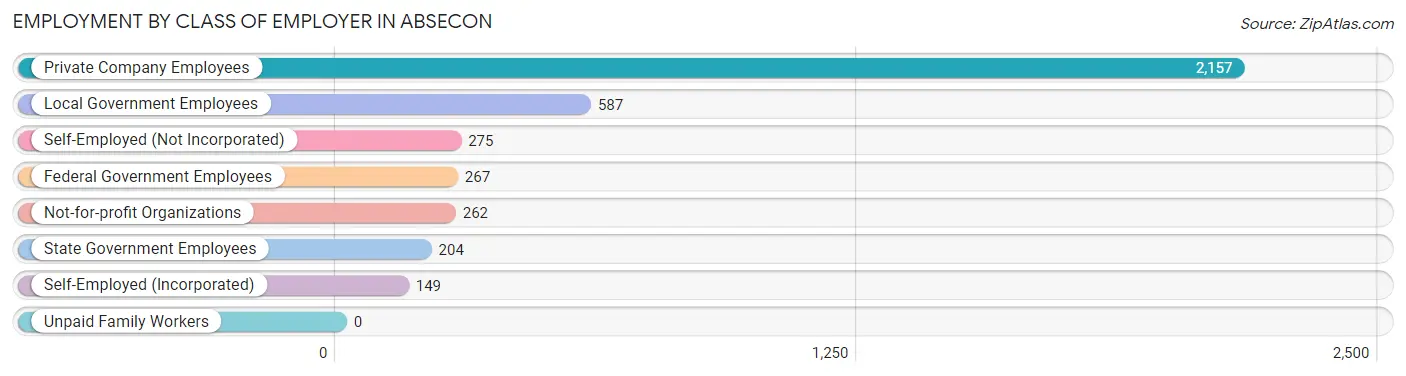
| Employer Class | # Employees | % Employees |
| Private Company Employees | 2,157 | 55.3% |
| Self-Employed (Incorporated) | 149 | 3.8% |
| Self-Employed (Not Incorporated) | 275 | 7.0% |
| Not-for-profit Organizations | 262 | 6.7% |
| Local Government Employees | 587 | 15.0% |
| State Government Employees | 204 | 5.2% |
| Federal Government Employees | 267 | 6.8% |
| Unpaid Family Workers | 0 | 0.0% |
| Total | 3,901 | 100.0% |
Employment Status by Age in Absecon
According to the labor force statistics for Absecon, out of the total population over 16 years of age (7,221), 61.5% or 4,441 individuals are in the labor force, with 8.7% or 386 of them unemployed. The age group with the highest labor force participation rate is 35 to 44 years, with 95.0% or 1,036 individuals in the labor force. Within the labor force, the 25 to 29 years age range has the highest percentage of unemployed individuals, with 27.2% or 104 of them being unemployed.
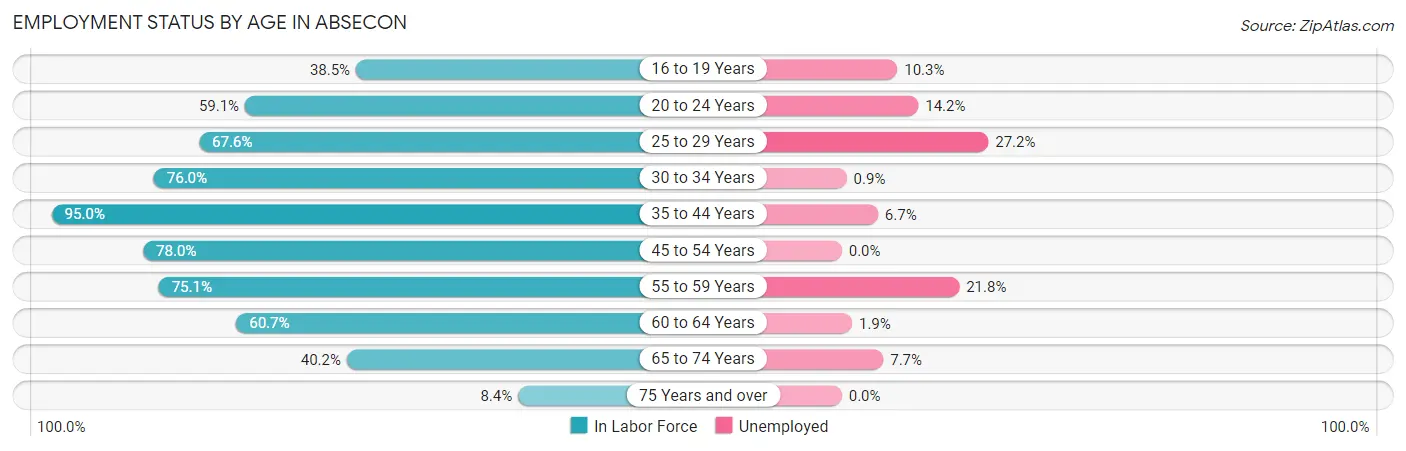
| Age Bracket | In Labor Force | Unemployed |
| 16 to 19 Years | 107 (38.5%) | 11 (10.3%) |
| 20 to 24 Years | 253 (59.1%) | 36 (14.2%) |
| 25 to 29 Years | 384 (67.6%) | 104 (27.2%) |
| 30 to 34 Years | 668 (76.0%) | 6 (0.9%) |
| 35 to 44 Years | 1,036 (95.0%) | 69 (6.7%) |
| 45 to 54 Years | 415 (78.0%) | 0 (0.0%) |
| 55 to 59 Years | 656 (75.1%) | 143 (21.8%) |
| 60 to 64 Years | 466 (60.7%) | 9 (1.9%) |
| 65 to 74 Years | 388 (40.2%) | 30 (7.7%) |
| 75 Years and over | 70 (8.4%) | 0 (0.0%) |
| Total | 4,441 (61.5%) | 386 (8.7%) |
Employment Status by Educational Attainment in Absecon
According to labor force statistics for Absecon, 76.9% of individuals (3,624) out of the total population between 25 and 64 years of age (4,712) are in the labor force, with 8.6% or 312 of them being unemployed. The group with the highest labor force participation rate are those with the educational attainment of bachelor's degree or higher, with 87.5% or 1,398 individuals in the labor force. Within the labor force, individuals with college / associate degree education have the highest percentage of unemployment, with 13.5% or 161 of them being unemployed.
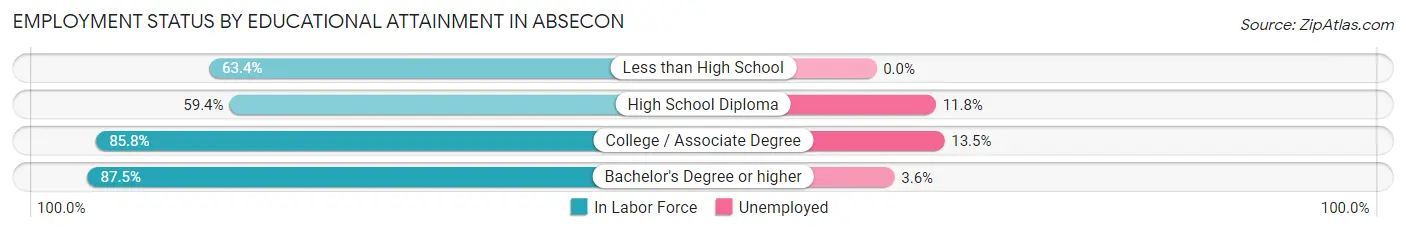
| Educational Attainment | In Labor Force | Unemployed |
| Less than High School | 142 (63.4%) | 0 (0.0%) |
| High School Diploma | 889 (59.4%) | 177 (11.8%) |
| College / Associate Degree | 1,196 (85.8%) | 188 (13.5%) |
| Bachelor's Degree or higher | 1,398 (87.5%) | 58 (3.6%) |
| Total | 3,624 (76.9%) | 405 (8.6%) |
Employment Occupations by Sex in Absecon
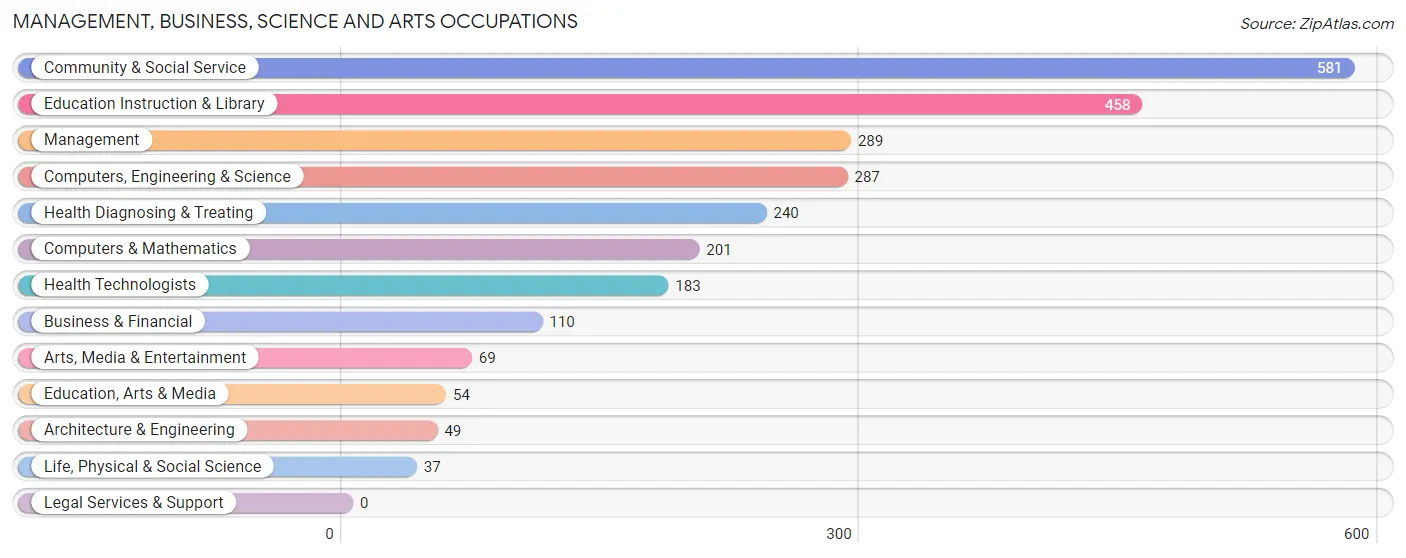
Management, Business, Science and Arts Occupations
The most common Management, Business, Science and Arts occupations in Absecon are Community & Social Service (581 | 14.8%), Education Instruction & Library (458 | 11.6%), Management (289 | 7.3%), Computers, Engineering & Science (287 | 7.3%), and Health Diagnosing & Treating (240 | 6.1%).
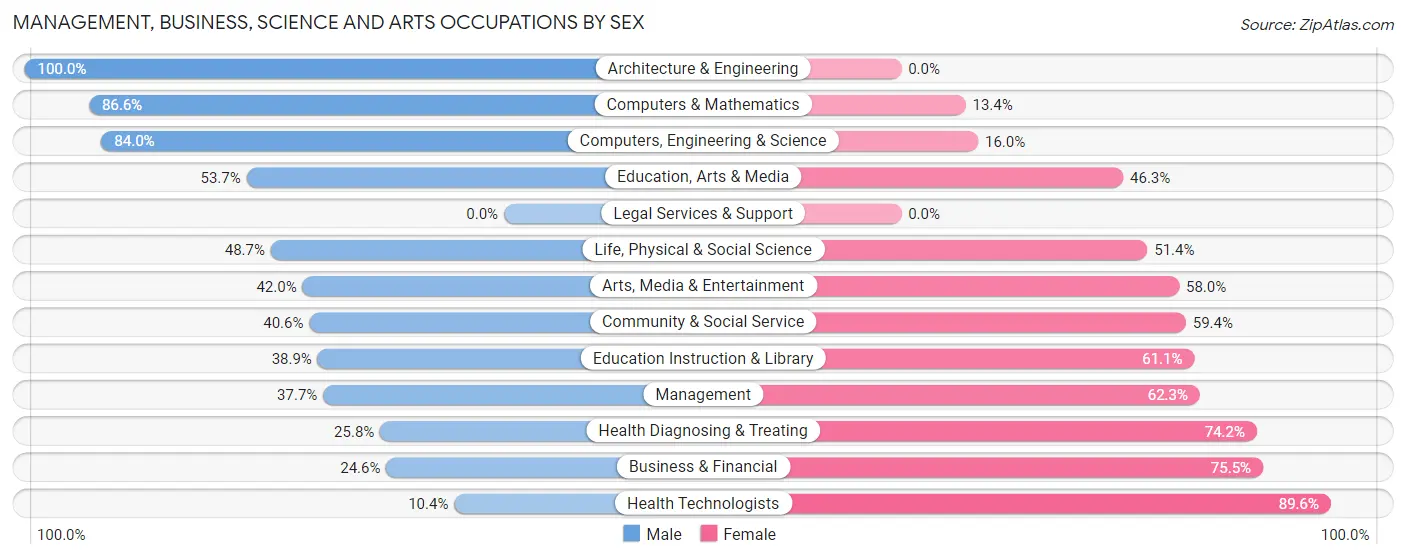
Management, Business, Science and Arts Occupations by Sex
Within the Management, Business, Science and Arts occupations in Absecon, the most male-oriented occupations are Architecture & Engineering (100.0%), Computers & Mathematics (86.6%), and Computers, Engineering & Science (84.0%), while the most female-oriented occupations are Health Technologists (89.6%), Business & Financial (75.4%), and Health Diagnosing & Treating (74.2%).
| Occupation | Male | Female |
| Management | 109 (37.7%) | 180 (62.3%) |
| Business & Financial | 27 (24.5%) | 83 (75.4%) |
| Computers, Engineering & Science | 241 (84.0%) | 46 (16.0%) |
| Computers & Mathematics | 174 (86.6%) | 27 (13.4%) |
| Architecture & Engineering | 49 (100.0%) | 0 (0.0%) |
| Life, Physical & Social Science | 18 (48.6%) | 19 (51.3%) |
| Community & Social Service | 236 (40.6%) | 345 (59.4%) |
| Education, Arts & Media | 29 (53.7%) | 25 (46.3%) |
| Legal Services & Support | 0 (0.0%) | 0 (0.0%) |
| Education Instruction & Library | 178 (38.9%) | 280 (61.1%) |
| Arts, Media & Entertainment | 29 (42.0%) | 40 (58.0%) |
| Health Diagnosing & Treating | 62 (25.8%) | 178 (74.2%) |
| Health Technologists | 19 (10.4%) | 164 (89.6%) |
| Total (Category) | 675 (44.8%) | 832 (55.2%) |
| Total (Overall) | 1,906 (48.4%) | 2,031 (51.6%) |
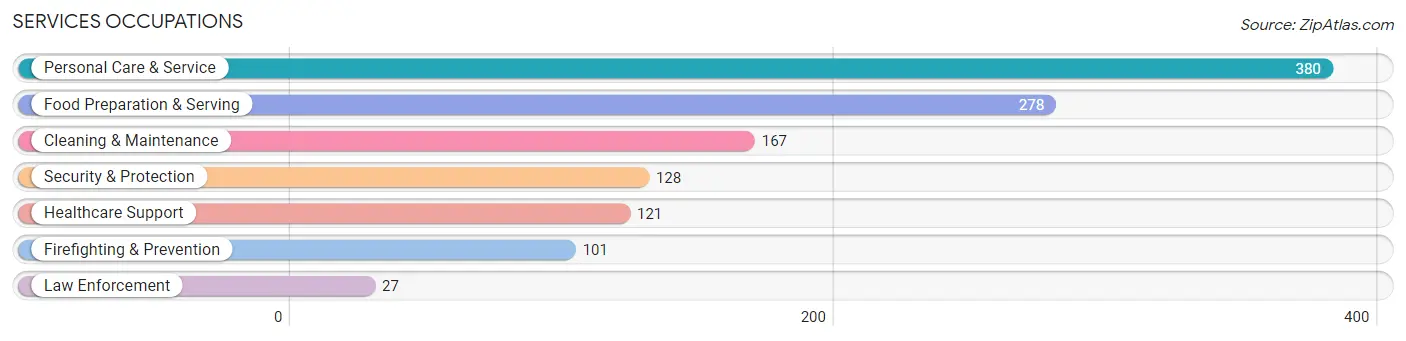
Services Occupations
The most common Services occupations in Absecon are Personal Care & Service (380 | 9.7%), Food Preparation & Serving (278 | 7.1%), Cleaning & Maintenance (167 | 4.2%), Security & Protection (128 | 3.3%), and Healthcare Support (121 | 3.1%).
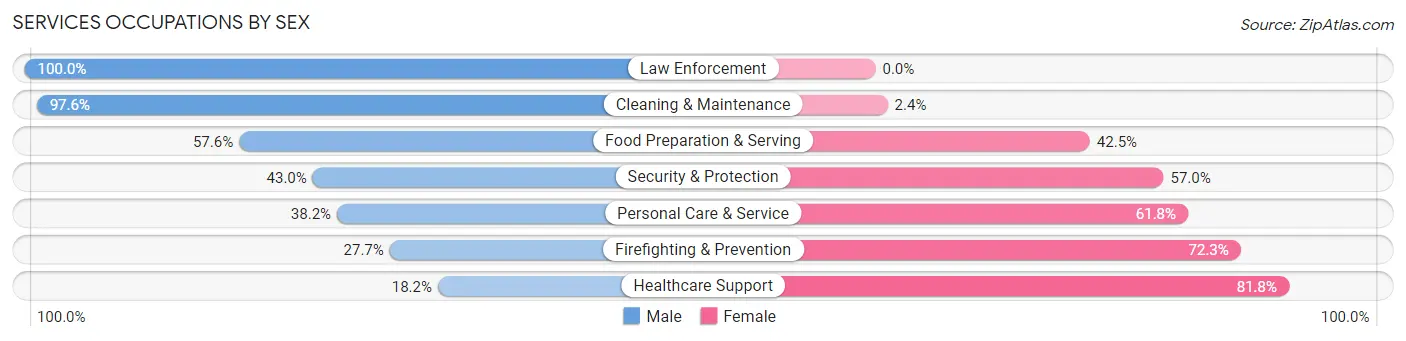
Services Occupations by Sex
Within the Services occupations in Absecon, the most male-oriented occupations are Law Enforcement (100.0%), Cleaning & Maintenance (97.6%), and Food Preparation & Serving (57.6%), while the most female-oriented occupations are Healthcare Support (81.8%), Firefighting & Prevention (72.3%), and Personal Care & Service (61.8%).
| Occupation | Male | Female |
| Healthcare Support | 22 (18.2%) | 99 (81.8%) |
| Security & Protection | 55 (43.0%) | 73 (57.0%) |
| Firefighting & Prevention | 28 (27.7%) | 73 (72.3%) |
| Law Enforcement | 27 (100.0%) | 0 (0.0%) |
| Food Preparation & Serving | 160 (57.6%) | 118 (42.4%) |
| Cleaning & Maintenance | 163 (97.6%) | 4 (2.4%) |
| Personal Care & Service | 145 (38.2%) | 235 (61.8%) |
| Total (Category) | 545 (50.7%) | 529 (49.3%) |
| Total (Overall) | 1,906 (48.4%) | 2,031 (51.6%) |
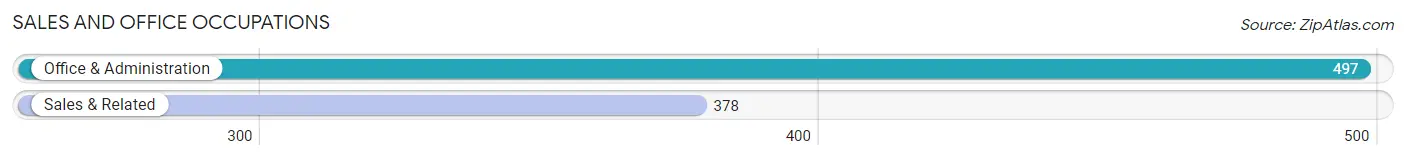
Sales and Office Occupations
The most common Sales and Office occupations in Absecon are Office & Administration (497 | 12.6%), and Sales & Related (378 | 9.6%).
Sales and Office Occupations by Sex
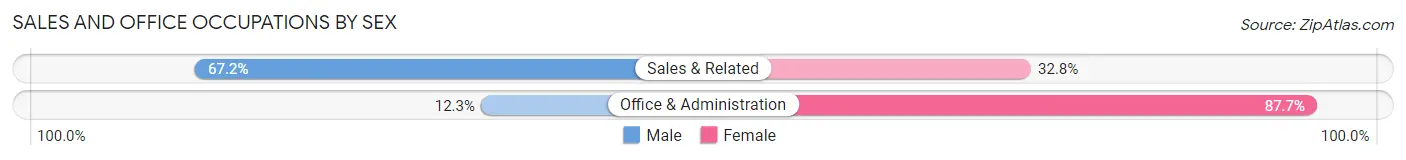
| Occupation | Male | Female |
| Sales & Related | 254 (67.2%) | 124 (32.8%) |
| Office & Administration | 61 (12.3%) | 436 (87.7%) |
| Total (Category) | 315 (36.0%) | 560 (64.0%) |
| Total (Overall) | 1,906 (48.4%) | 2,031 (51.6%) |
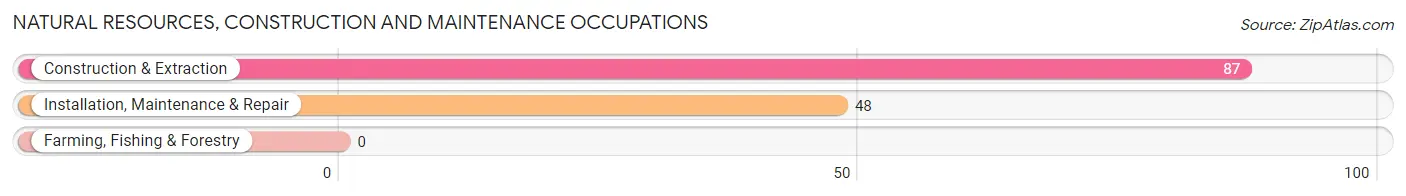
Natural Resources, Construction and Maintenance Occupations
The most common Natural Resources, Construction and Maintenance occupations in Absecon are Construction & Extraction (87 | 2.2%), and Installation, Maintenance & Repair (48 | 1.2%).
Natural Resources, Construction and Maintenance Occupations by Sex
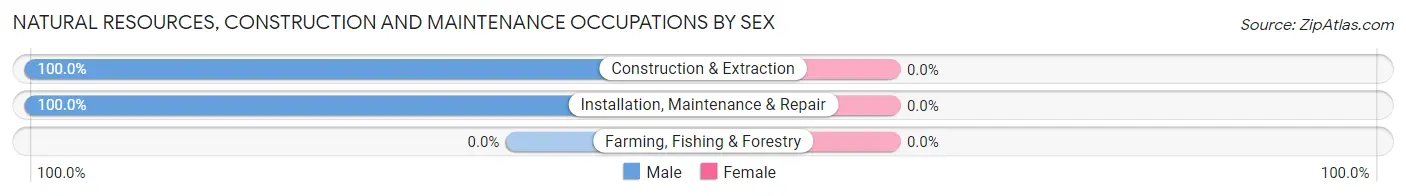
| Occupation | Male | Female |
| Farming, Fishing & Forestry | 0 (0.0%) | 0 (0.0%) |
| Construction & Extraction | 87 (100.0%) | 0 (0.0%) |
| Installation, Maintenance & Repair | 48 (100.0%) | 0 (0.0%) |
| Total (Category) | 135 (100.0%) | 0 (0.0%) |
| Total (Overall) | 1,906 (48.4%) | 2,031 (51.6%) |
Production, Transportation and Moving Occupations
The most common Production, Transportation and Moving occupations in Absecon are Production (144 | 3.7%), Transportation (140 | 3.6%), and Material Moving (62 | 1.6%).
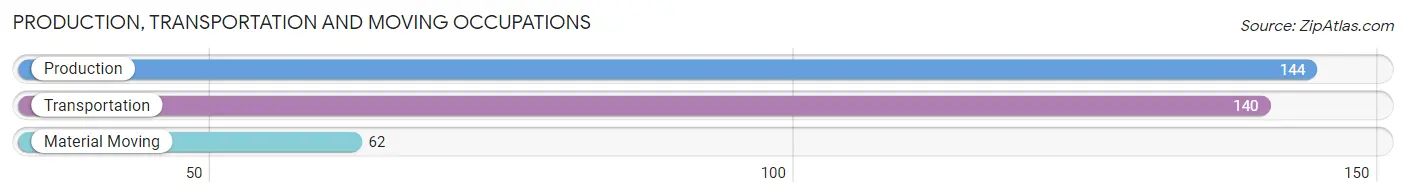
Production, Transportation and Moving Occupations by Sex
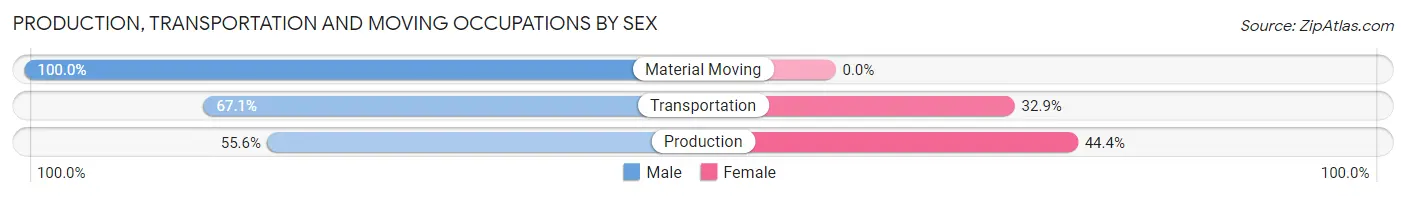
| Occupation | Male | Female |
| Production | 80 (55.6%) | 64 (44.4%) |
| Transportation | 94 (67.1%) | 46 (32.9%) |
| Material Moving | 62 (100.0%) | 0 (0.0%) |
| Total (Category) | 236 (68.2%) | 110 (31.8%) |
| Total (Overall) | 1,906 (48.4%) | 2,031 (51.6%) |
Employment Industries by Sex in Absecon
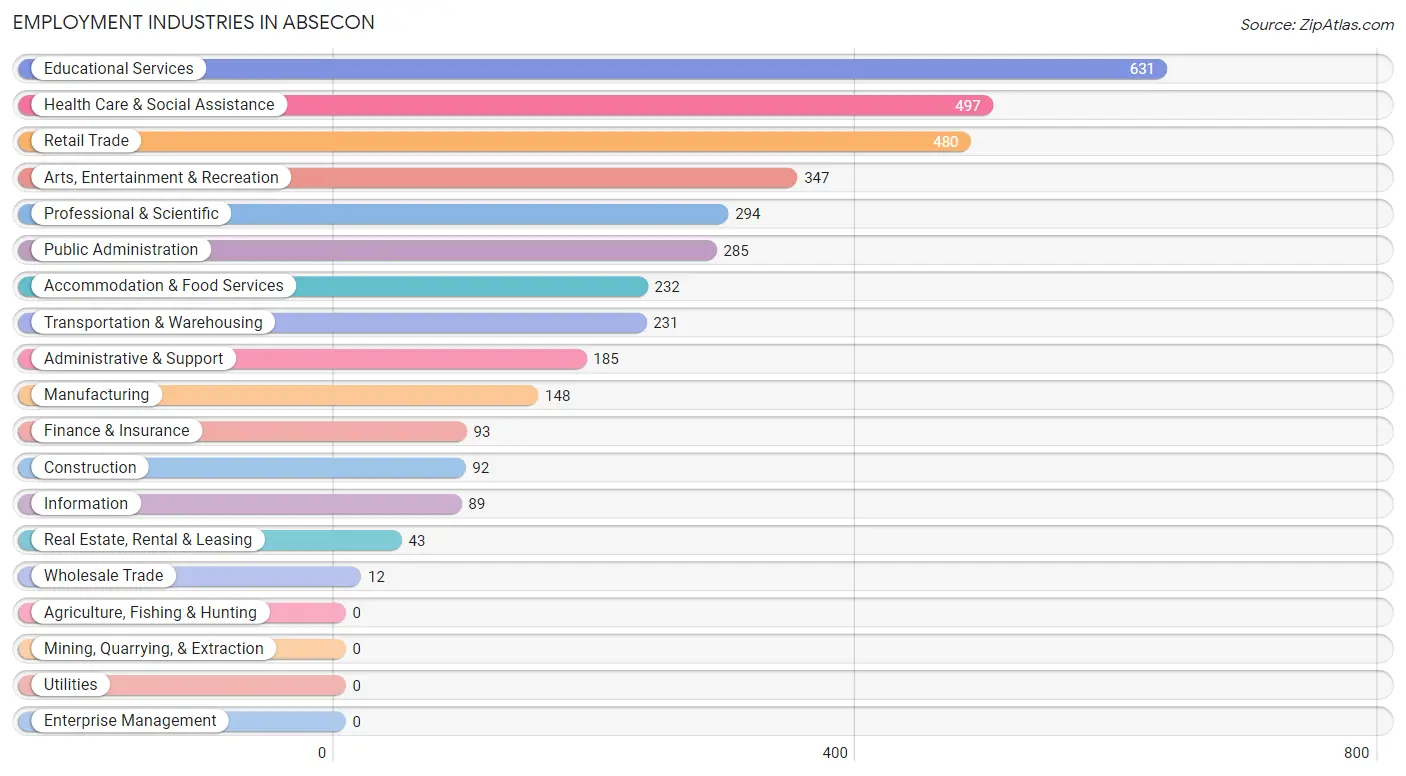
Employment Industries in Absecon
The major employment industries in Absecon include Educational Services (631 | 16.0%), Health Care & Social Assistance (497 | 12.6%), Retail Trade (480 | 12.2%), Arts, Entertainment & Recreation (347 | 8.8%), and Professional & Scientific (294 | 7.5%).
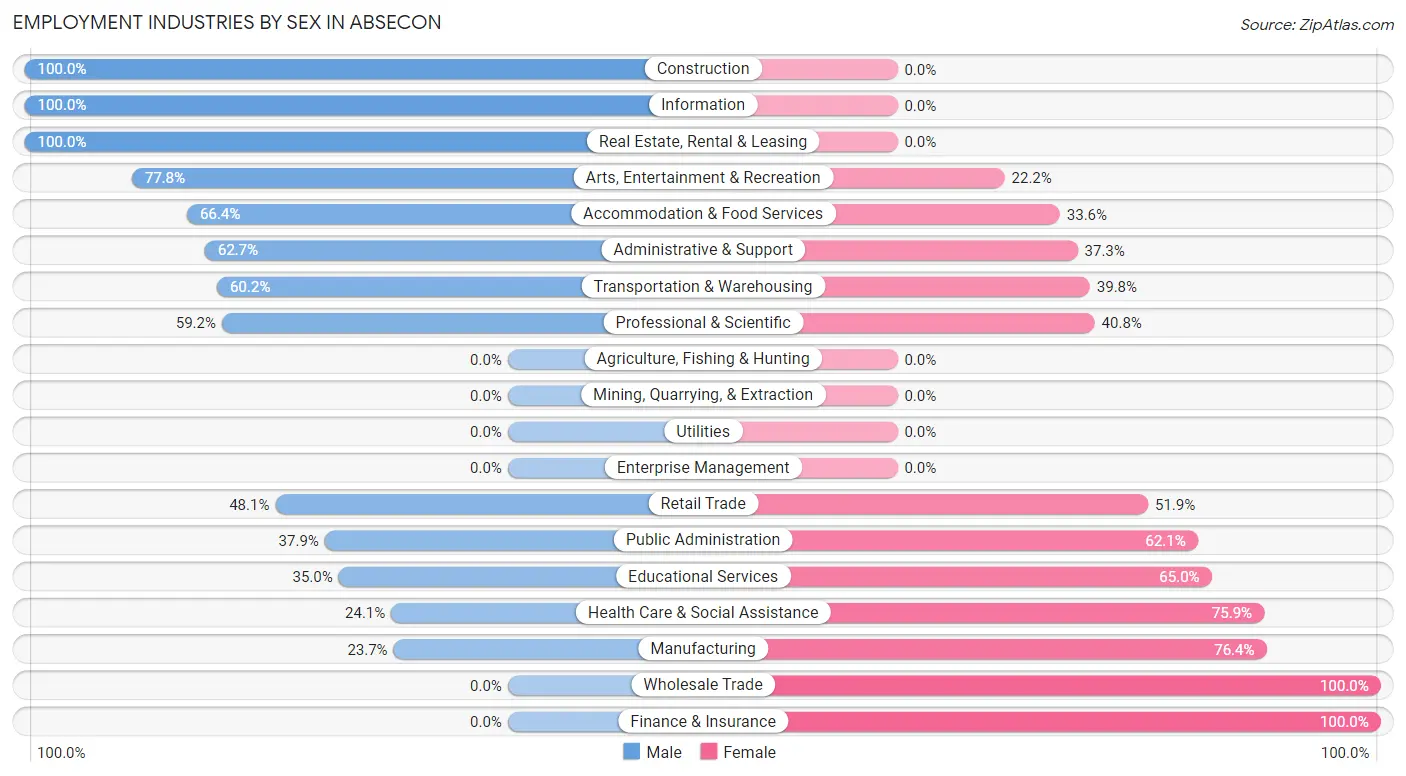
Employment Industries by Sex in Absecon
The Absecon industries that see more men than women are Construction (100.0%), Information (100.0%), and Real Estate, Rental & Leasing (100.0%), whereas the industries that tend to have a higher number of women are Wholesale Trade (100.0%), Finance & Insurance (100.0%), and Manufacturing (76.3%).
| Industry | Male | Female |
| Agriculture, Fishing & Hunting | 0 (0.0%) | 0 (0.0%) |
| Mining, Quarrying, & Extraction | 0 (0.0%) | 0 (0.0%) |
| Construction | 92 (100.0%) | 0 (0.0%) |
| Manufacturing | 35 (23.6%) | 113 (76.3%) |
| Wholesale Trade | 0 (0.0%) | 12 (100.0%) |
| Retail Trade | 231 (48.1%) | 249 (51.9%) |
| Transportation & Warehousing | 139 (60.2%) | 92 (39.8%) |
| Utilities | 0 (0.0%) | 0 (0.0%) |
| Information | 89 (100.0%) | 0 (0.0%) |
| Finance & Insurance | 0 (0.0%) | 93 (100.0%) |
| Real Estate, Rental & Leasing | 43 (100.0%) | 0 (0.0%) |
| Professional & Scientific | 174 (59.2%) | 120 (40.8%) |
| Enterprise Management | 0 (0.0%) | 0 (0.0%) |
| Administrative & Support | 116 (62.7%) | 69 (37.3%) |
| Educational Services | 221 (35.0%) | 410 (65.0%) |
| Health Care & Social Assistance | 120 (24.1%) | 377 (75.9%) |
| Arts, Entertainment & Recreation | 270 (77.8%) | 77 (22.2%) |
| Accommodation & Food Services | 154 (66.4%) | 78 (33.6%) |
| Public Administration | 108 (37.9%) | 177 (62.1%) |
| Total | 1,906 (48.4%) | 2,031 (51.6%) |
Education in Absecon
School Enrollment in Absecon
The most common levels of schooling among the 2,023 students in Absecon are elementary school (491 | 24.3%), middle school (395 | 19.5%), and college / undergraduate (379 | 18.7%).
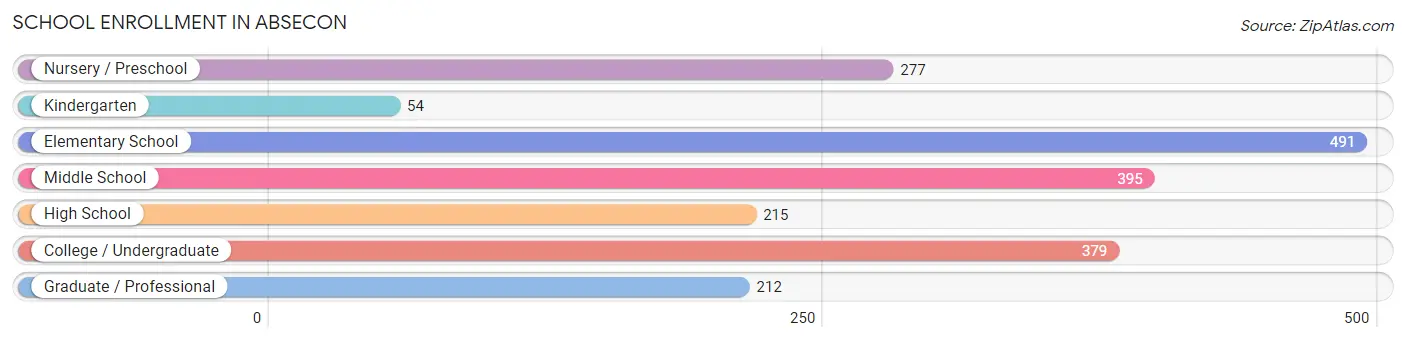
| School Level | # Students | % Students |
| Nursery / Preschool | 277 | 13.7% |
| Kindergarten | 54 | 2.7% |
| Elementary School | 491 | 24.3% |
| Middle School | 395 | 19.5% |
| High School | 215 | 10.6% |
| College / Undergraduate | 379 | 18.7% |
| Graduate / Professional | 212 | 10.5% |
| Total | 2,023 | 100.0% |
School Enrollment by Age by Funding Source in Absecon
Out of a total of 2,023 students who are enrolled in schools in Absecon, 344 (17.0%) attend a private institution, while the remaining 1,679 (83.0%) are enrolled in public schools. The age group of 20 to 24 year olds has the highest likelihood of being enrolled in private schools, with 161 (51.6% in the age bracket) enrolled. Conversely, the age group of 18 to 19 year olds has the lowest likelihood of being enrolled in a private school, with 108 (100.0% in the age bracket) attending a public institution.
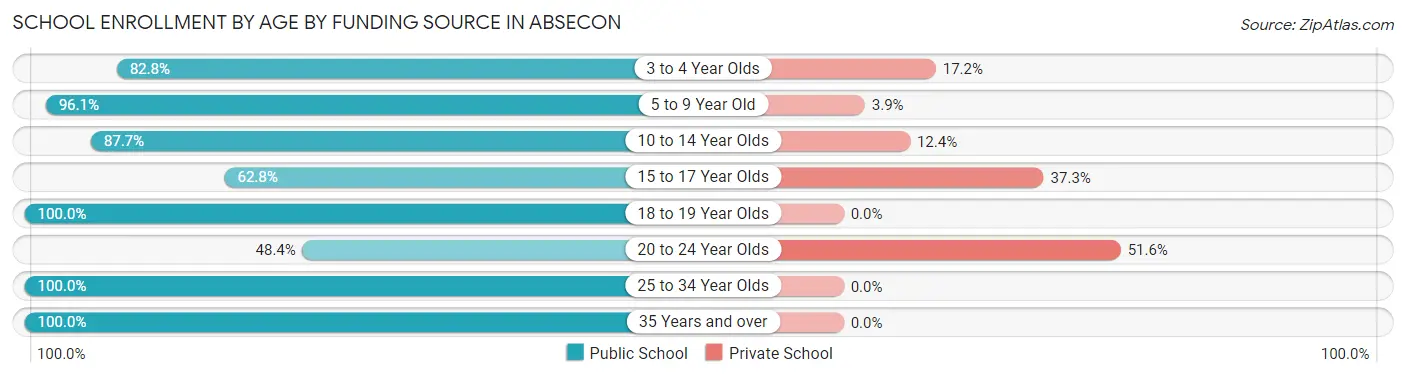
| Age Bracket | Public School | Private School |
| 3 to 4 Year Olds | 140 (82.8%) | 29 (17.2%) |
| 5 to 9 Year Old | 609 (96.1%) | 25 (3.9%) |
| 10 to 14 Year Olds | 369 (87.6%) | 52 (12.3%) |
| 15 to 17 Year Olds | 128 (62.7%) | 76 (37.2%) |
| 18 to 19 Year Olds | 108 (100.0%) | 0 (0.0%) |
| 20 to 24 Year Olds | 151 (48.4%) | 161 (51.6%) |
| 25 to 34 Year Olds | 129 (100.0%) | 0 (0.0%) |
| 35 Years and over | 46 (100.0%) | 0 (0.0%) |
| Total | 1,679 (83.0%) | 344 (17.0%) |
Educational Attainment by Field of Study in Absecon
Education (450 | 19.9%), business (307 | 13.6%), science & technology (306 | 13.6%), arts & humanities (209 | 9.3%), and communications (176 | 7.8%) are the most common fields of study among 2,258 individuals in Absecon who have obtained a bachelor's degree or higher.
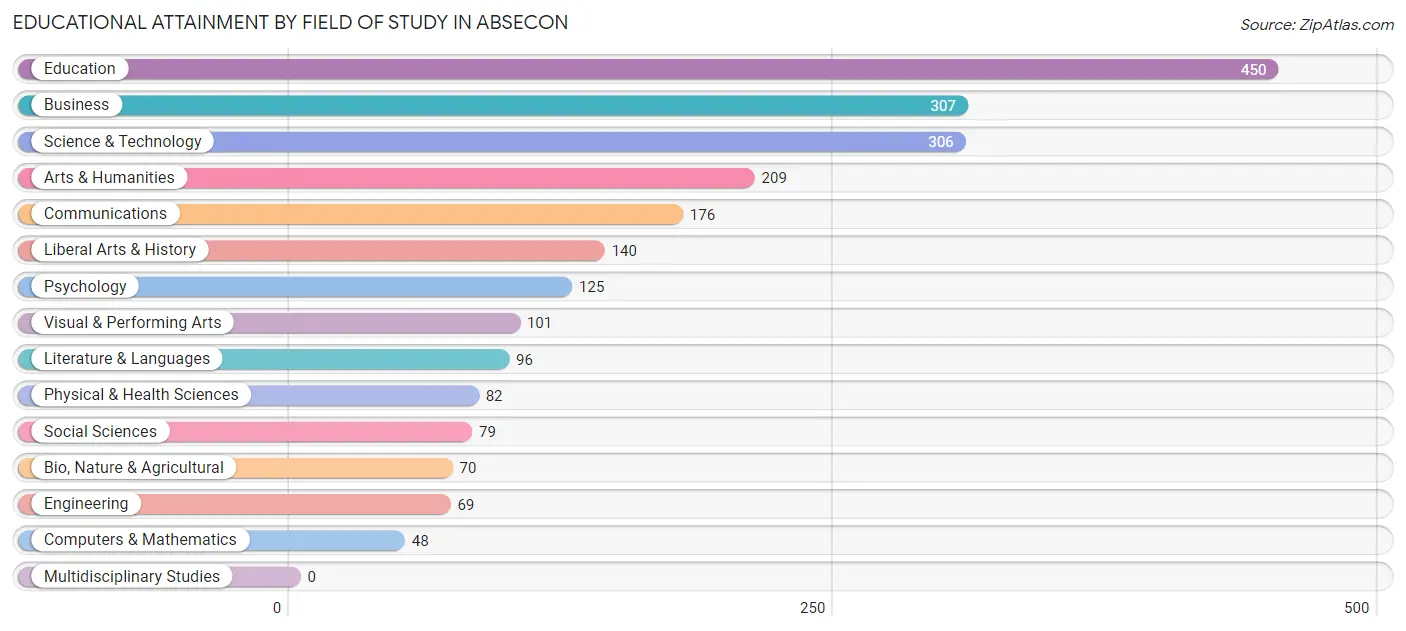
| Field of Study | # Graduates | % Graduates |
| Computers & Mathematics | 48 | 2.1% |
| Bio, Nature & Agricultural | 70 | 3.1% |
| Physical & Health Sciences | 82 | 3.6% |
| Psychology | 125 | 5.5% |
| Social Sciences | 79 | 3.5% |
| Engineering | 69 | 3.1% |
| Multidisciplinary Studies | 0 | 0.0% |
| Science & Technology | 306 | 13.6% |
| Business | 307 | 13.6% |
| Education | 450 | 19.9% |
| Literature & Languages | 96 | 4.3% |
| Liberal Arts & History | 140 | 6.2% |
| Visual & Performing Arts | 101 | 4.5% |
| Communications | 176 | 7.8% |
| Arts & Humanities | 209 | 9.3% |
| Total | 2,258 | 100.0% |
Transportation & Commute in Absecon
Vehicle Availability by Sex in Absecon
The most prevalent vehicle ownership categories in Absecon are males with 2 vehicles (870, accounting for 43.3%) and females with 2 vehicles (677, making up 46.2%).
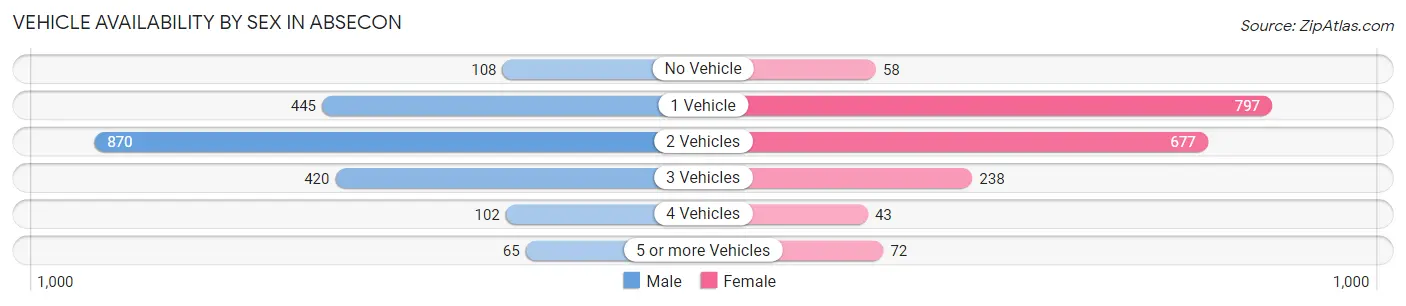
| Vehicles Available | Male | Female |
| No Vehicle | 108 (5.4%) | 58 (3.1%) |
| 1 Vehicle | 445 (22.1%) | 797 (42.3%) |
| 2 Vehicles | 870 (43.3%) | 677 (35.9%) |
| 3 Vehicles | 420 (20.9%) | 238 (12.6%) |
| 4 Vehicles | 102 (5.1%) | 43 (2.3%) |
| 5 or more Vehicles | 65 (3.2%) | 72 (3.8%) |
| Total | 2,010 (100.0%) | 1,885 (100.0%) |
Commute Time in Absecon
The most frequently occuring commute durations in Absecon are 15 to 19 minutes (1,001 commuters, 28.3%), 10 to 14 minutes (866 commuters, 24.5%), and 20 to 24 minutes (586 commuters, 16.6%).
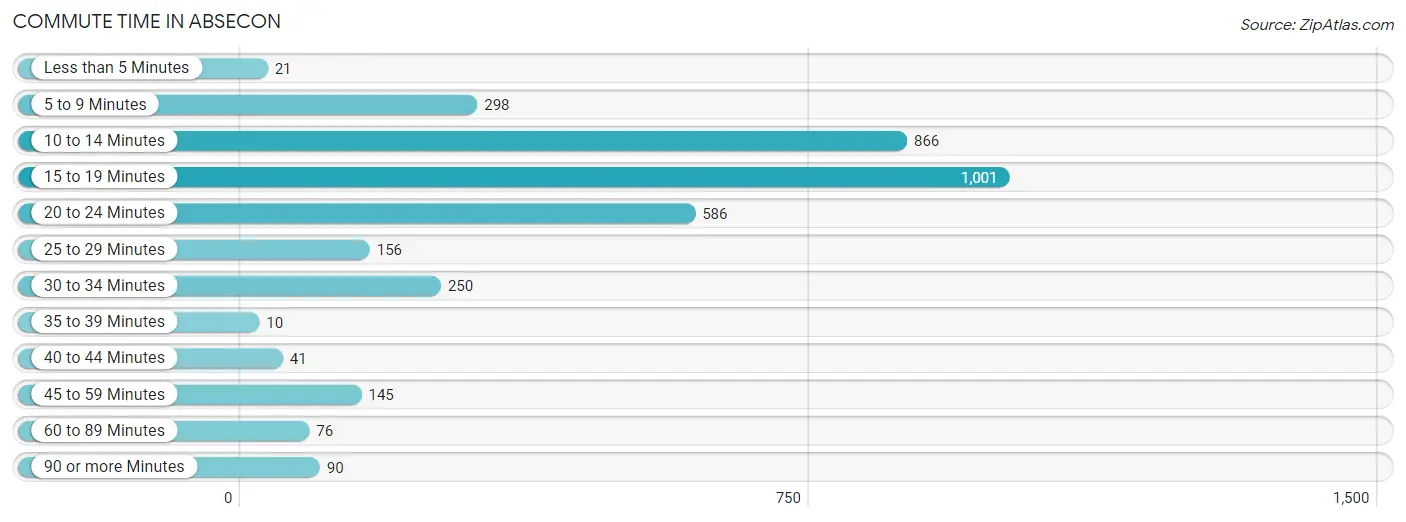
| Commute Time | # Commuters | % Commuters |
| Less than 5 Minutes | 21 | 0.6% |
| 5 to 9 Minutes | 298 | 8.4% |
| 10 to 14 Minutes | 866 | 24.5% |
| 15 to 19 Minutes | 1,001 | 28.3% |
| 20 to 24 Minutes | 586 | 16.6% |
| 25 to 29 Minutes | 156 | 4.4% |
| 30 to 34 Minutes | 250 | 7.1% |
| 35 to 39 Minutes | 10 | 0.3% |
| 40 to 44 Minutes | 41 | 1.2% |
| 45 to 59 Minutes | 145 | 4.1% |
| 60 to 89 Minutes | 76 | 2.1% |
| 90 or more Minutes | 90 | 2.5% |
Commute Time by Sex in Absecon
The most common commute times in Absecon are 15 to 19 minutes (539 commuters, 30.1%) for males and 15 to 19 minutes (462 commuters, 26.4%) for females.
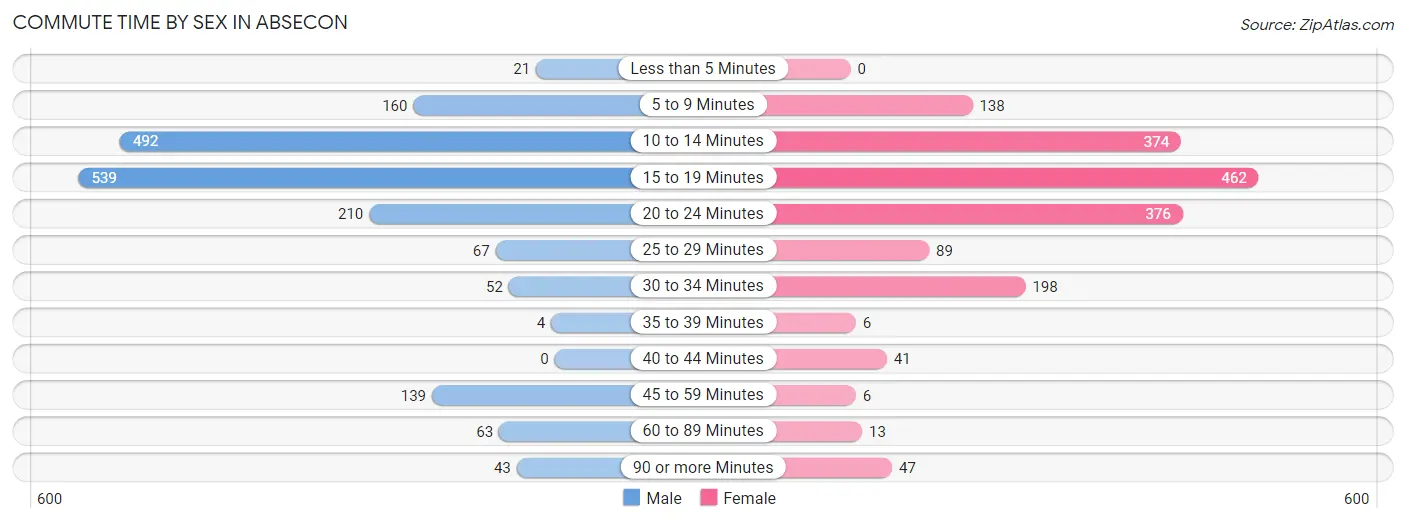
| Commute Time | Male | Female |
| Less than 5 Minutes | 21 (1.2%) | 0 (0.0%) |
| 5 to 9 Minutes | 160 (8.9%) | 138 (7.9%) |
| 10 to 14 Minutes | 492 (27.5%) | 374 (21.4%) |
| 15 to 19 Minutes | 539 (30.1%) | 462 (26.4%) |
| 20 to 24 Minutes | 210 (11.7%) | 376 (21.5%) |
| 25 to 29 Minutes | 67 (3.7%) | 89 (5.1%) |
| 30 to 34 Minutes | 52 (2.9%) | 198 (11.3%) |
| 35 to 39 Minutes | 4 (0.2%) | 6 (0.3%) |
| 40 to 44 Minutes | 0 (0.0%) | 41 (2.3%) |
| 45 to 59 Minutes | 139 (7.8%) | 6 (0.3%) |
| 60 to 89 Minutes | 63 (3.5%) | 13 (0.7%) |
| 90 or more Minutes | 43 (2.4%) | 47 (2.7%) |
Time of Departure to Work by Sex in Absecon
The most frequent times of departure to work in Absecon are 7:00 AM to 7:29 AM (271, 15.1%) for males and 7:30 AM to 7:59 AM (499, 28.5%) for females.
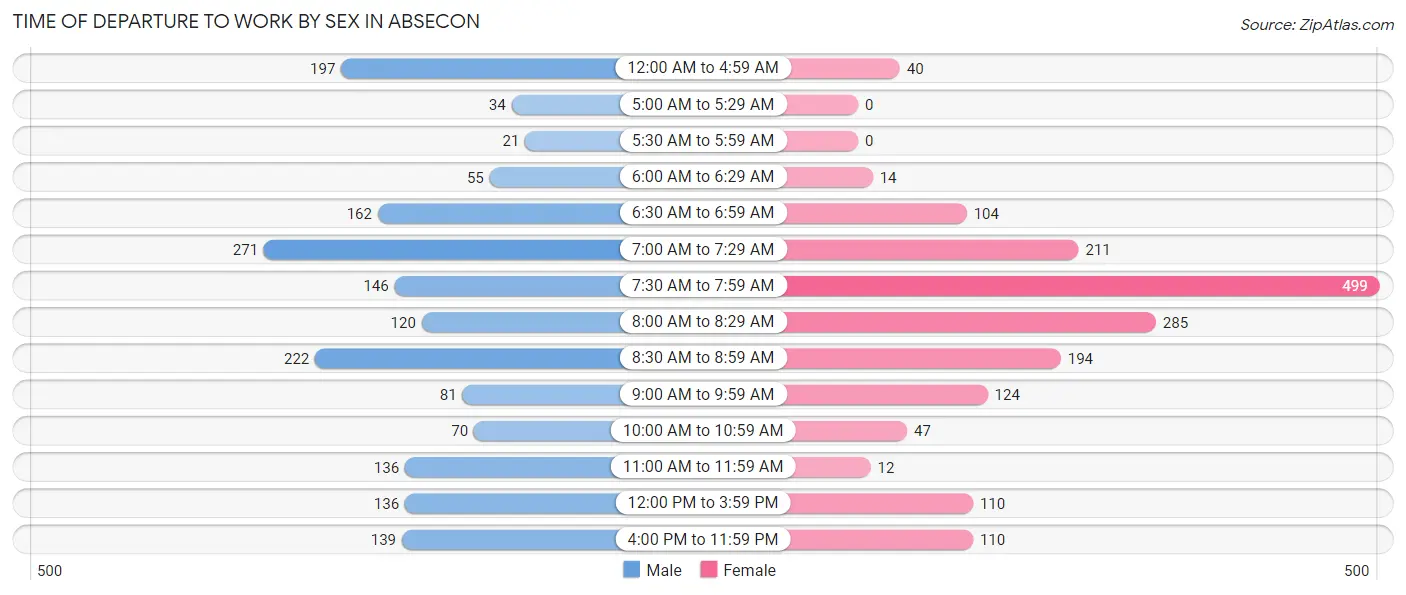
| Time of Departure | Male | Female |
| 12:00 AM to 4:59 AM | 197 (11.0%) | 40 (2.3%) |
| 5:00 AM to 5:29 AM | 34 (1.9%) | 0 (0.0%) |
| 5:30 AM to 5:59 AM | 21 (1.2%) | 0 (0.0%) |
| 6:00 AM to 6:29 AM | 55 (3.1%) | 14 (0.8%) |
| 6:30 AM to 6:59 AM | 162 (9.0%) | 104 (5.9%) |
| 7:00 AM to 7:29 AM | 271 (15.1%) | 211 (12.1%) |
| 7:30 AM to 7:59 AM | 146 (8.2%) | 499 (28.5%) |
| 8:00 AM to 8:29 AM | 120 (6.7%) | 285 (16.3%) |
| 8:30 AM to 8:59 AM | 222 (12.4%) | 194 (11.1%) |
| 9:00 AM to 9:59 AM | 81 (4.5%) | 124 (7.1%) |
| 10:00 AM to 10:59 AM | 70 (3.9%) | 47 (2.7%) |
| 11:00 AM to 11:59 AM | 136 (7.6%) | 12 (0.7%) |
| 12:00 PM to 3:59 PM | 136 (7.6%) | 110 (6.3%) |
| 4:00 PM to 11:59 PM | 139 (7.8%) | 110 (6.3%) |
| Total | 1,790 (100.0%) | 1,750 (100.0%) |
Housing Occupancy in Absecon
Occupancy by Ownership in Absecon
Of the total 3,564 dwellings in Absecon, owner-occupied units account for 2,625 (73.7%), while renter-occupied units make up 939 (26.4%).
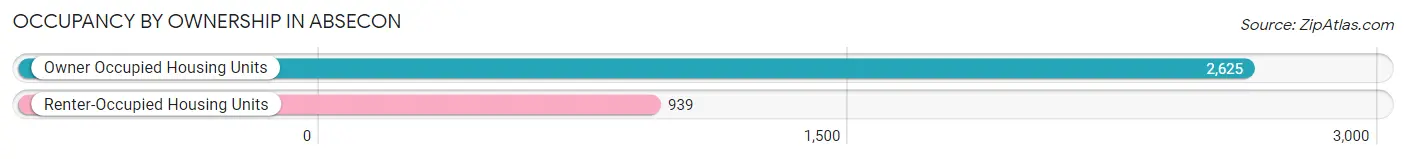
| Occupancy | # Housing Units | % Housing Units |
| Owner Occupied Housing Units | 2,625 | 73.7% |
| Renter-Occupied Housing Units | 939 | 26.4% |
| Total Occupied Housing Units | 3,564 | 100.0% |
Occupancy by Household Size in Absecon
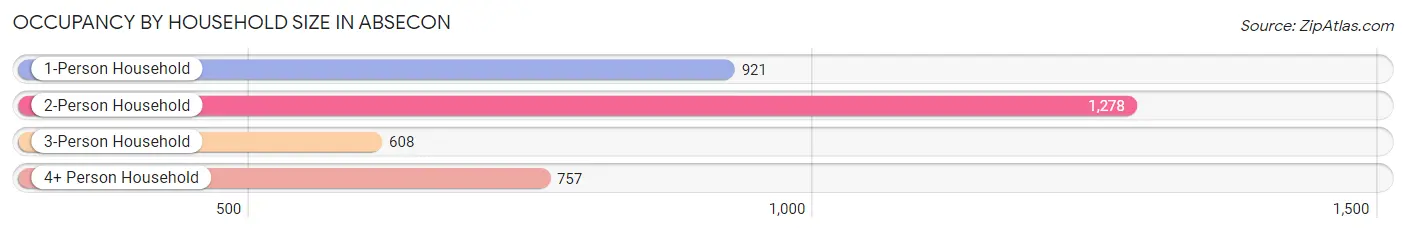
| Household Size | # Housing Units | % Housing Units |
| 1-Person Household | 921 | 25.8% |
| 2-Person Household | 1,278 | 35.9% |
| 3-Person Household | 608 | 17.1% |
| 4+ Person Household | 757 | 21.2% |
| Total Housing Units | 3,564 | 100.0% |
Occupancy by Ownership by Household Size in Absecon
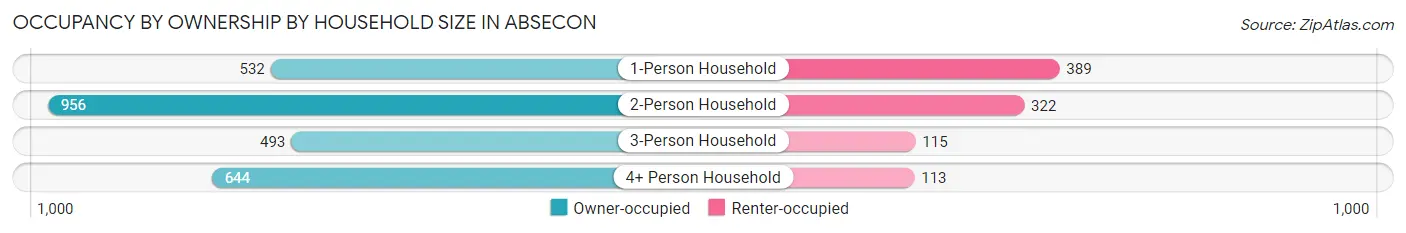
| Household Size | Owner-occupied | Renter-occupied |
| 1-Person Household | 532 (57.8%) | 389 (42.2%) |
| 2-Person Household | 956 (74.8%) | 322 (25.2%) |
| 3-Person Household | 493 (81.1%) | 115 (18.9%) |
| 4+ Person Household | 644 (85.1%) | 113 (14.9%) |
| Total Housing Units | 2,625 (73.7%) | 939 (26.4%) |
Occupancy by Educational Attainment in Absecon
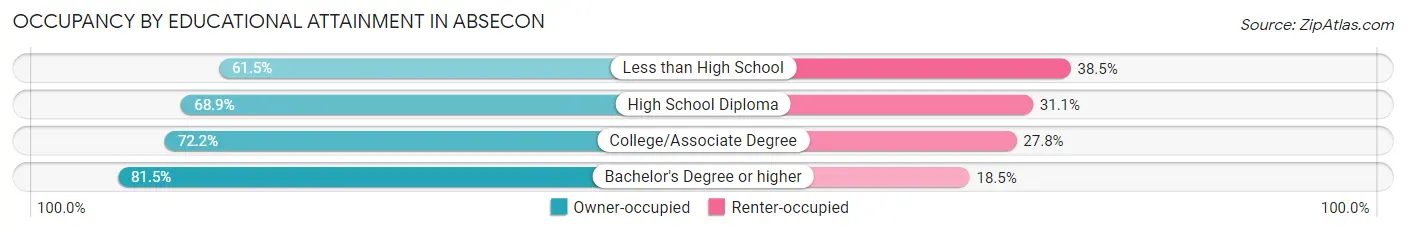
| Household Size | Owner-occupied | Renter-occupied |
| Less than High School | 118 (61.5%) | 74 (38.5%) |
| High School Diploma | 579 (68.9%) | 261 (31.1%) |
| College/Associate Degree | 1,052 (72.2%) | 405 (27.8%) |
| Bachelor's Degree or higher | 876 (81.5%) | 199 (18.5%) |
Occupancy by Age of Householder in Absecon
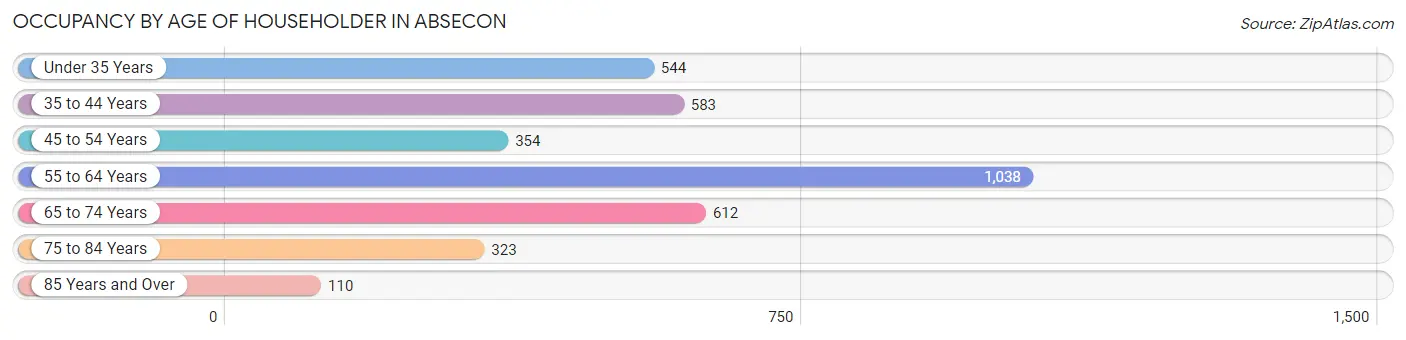
| Age Bracket | # Households | % Households |
| Under 35 Years | 544 | 15.3% |
| 35 to 44 Years | 583 | 16.4% |
| 45 to 54 Years | 354 | 9.9% |
| 55 to 64 Years | 1,038 | 29.1% |
| 65 to 74 Years | 612 | 17.2% |
| 75 to 84 Years | 323 | 9.1% |
| 85 Years and Over | 110 | 3.1% |
| Total | 3,564 | 100.0% |
Housing Finances in Absecon
Median Income by Occupancy in Absecon
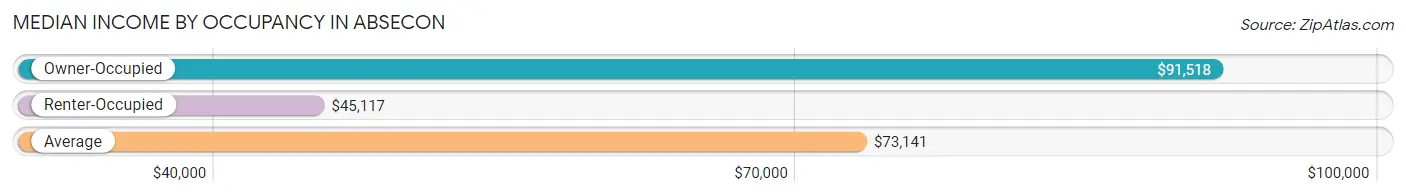
| Occupancy Type | # Households | Median Income |
| Owner-Occupied | 2,625 (73.7%) | $91,518 |
| Renter-Occupied | 939 (26.4%) | $45,117 |
| Average | 3,564 (100.0%) | $73,141 |
Occupancy by Householder Income Bracket in Absecon
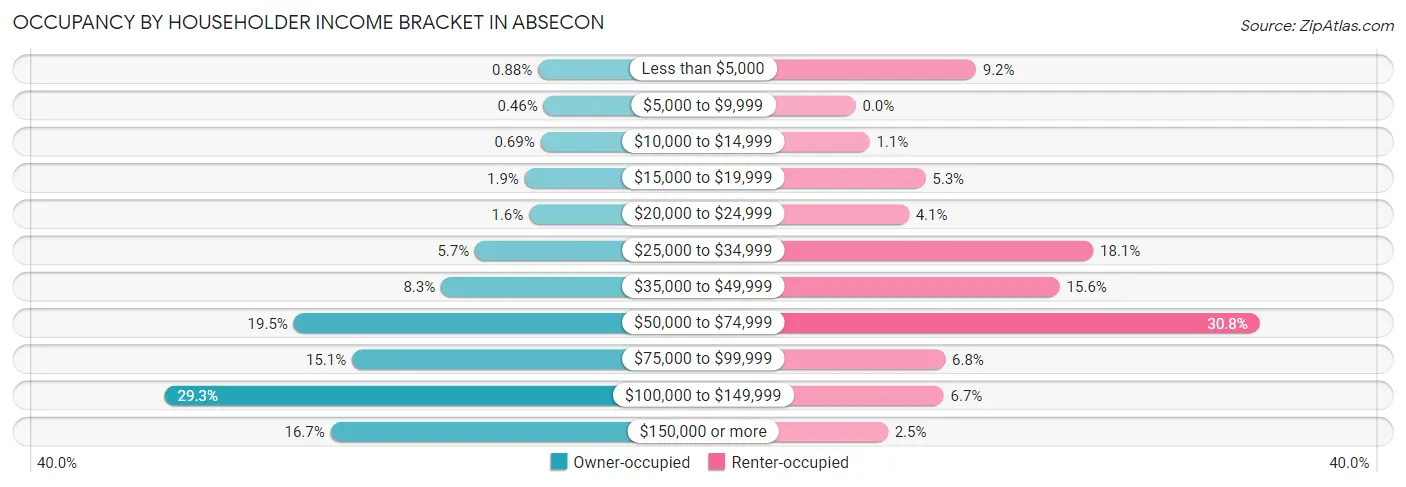
| Income Bracket | Owner-occupied | Renter-occupied |
| Less than $5,000 | 23 (0.9%) | 86 (9.2%) |
| $5,000 to $9,999 | 12 (0.5%) | 0 (0.0%) |
| $10,000 to $14,999 | 18 (0.7%) | 10 (1.1%) |
| $15,000 to $19,999 | 50 (1.9%) | 50 (5.3%) |
| $20,000 to $24,999 | 41 (1.6%) | 38 (4.1%) |
| $25,000 to $34,999 | 149 (5.7%) | 170 (18.1%) |
| $35,000 to $49,999 | 217 (8.3%) | 146 (15.5%) |
| $50,000 to $74,999 | 512 (19.5%) | 289 (30.8%) |
| $75,000 to $99,999 | 395 (15.0%) | 64 (6.8%) |
| $100,000 to $149,999 | 770 (29.3%) | 63 (6.7%) |
| $150,000 or more | 438 (16.7%) | 23 (2.5%) |
| Total | 2,625 (100.0%) | 939 (100.0%) |
Monthly Housing Cost Tiers in Absecon
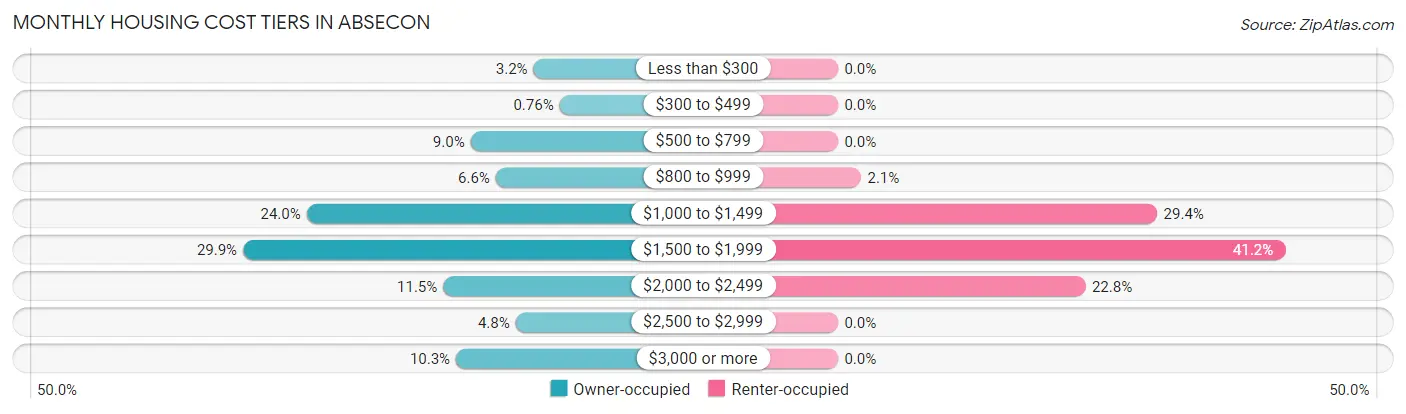
| Monthly Cost | Owner-occupied | Renter-occupied |
| Less than $300 | 83 (3.2%) | 0 (0.0%) |
| $300 to $499 | 20 (0.8%) | 0 (0.0%) |
| $500 to $799 | 235 (8.9%) | 0 (0.0%) |
| $800 to $999 | 174 (6.6%) | 20 (2.1%) |
| $1,000 to $1,499 | 631 (24.0%) | 276 (29.4%) |
| $1,500 to $1,999 | 785 (29.9%) | 387 (41.2%) |
| $2,000 to $2,499 | 301 (11.5%) | 214 (22.8%) |
| $2,500 to $2,999 | 126 (4.8%) | 0 (0.0%) |
| $3,000 or more | 270 (10.3%) | 0 (0.0%) |
| Total | 2,625 (100.0%) | 939 (100.0%) |
Physical Housing Characteristics in Absecon
Housing Structures in Absecon
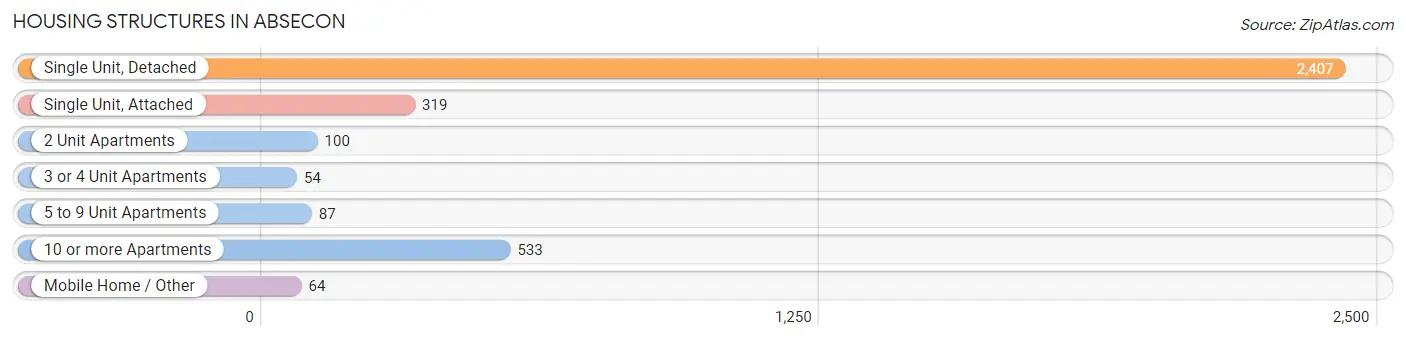
| Structure Type | # Housing Units | % Housing Units |
| Single Unit, Detached | 2,407 | 67.5% |
| Single Unit, Attached | 319 | 8.9% |
| 2 Unit Apartments | 100 | 2.8% |
| 3 or 4 Unit Apartments | 54 | 1.5% |
| 5 to 9 Unit Apartments | 87 | 2.4% |
| 10 or more Apartments | 533 | 15.0% |
| Mobile Home / Other | 64 | 1.8% |
| Total | 3,564 | 100.0% |
Housing Structures by Occupancy in Absecon
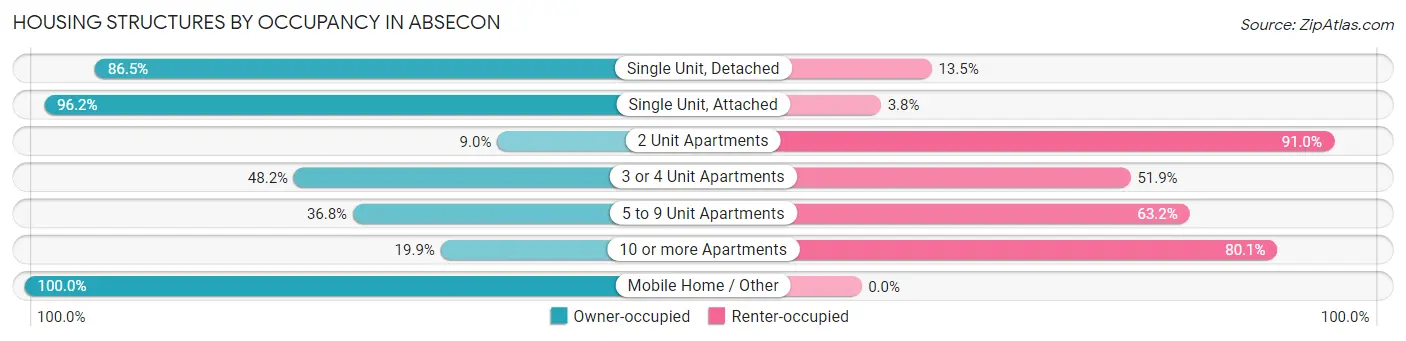
| Structure Type | Owner-occupied | Renter-occupied |
| Single Unit, Detached | 2,081 (86.5%) | 326 (13.5%) |
| Single Unit, Attached | 307 (96.2%) | 12 (3.8%) |
| 2 Unit Apartments | 9 (9.0%) | 91 (91.0%) |
| 3 or 4 Unit Apartments | 26 (48.1%) | 28 (51.8%) |
| 5 to 9 Unit Apartments | 32 (36.8%) | 55 (63.2%) |
| 10 or more Apartments | 106 (19.9%) | 427 (80.1%) |
| Mobile Home / Other | 64 (100.0%) | 0 (0.0%) |
| Total | 2,625 (73.7%) | 939 (26.4%) |
Housing Structures by Number of Rooms in Absecon
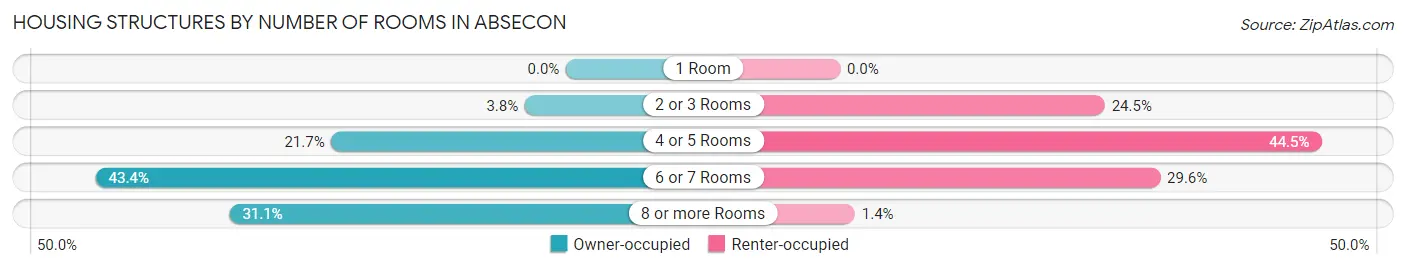
| Number of Rooms | Owner-occupied | Renter-occupied |
| 1 Room | 0 (0.0%) | 0 (0.0%) |
| 2 or 3 Rooms | 100 (3.8%) | 230 (24.5%) |
| 4 or 5 Rooms | 570 (21.7%) | 418 (44.5%) |
| 6 or 7 Rooms | 1,140 (43.4%) | 278 (29.6%) |
| 8 or more Rooms | 815 (31.0%) | 13 (1.4%) |
| Total | 2,625 (100.0%) | 939 (100.0%) |
Housing Structure by Heating Type in Absecon
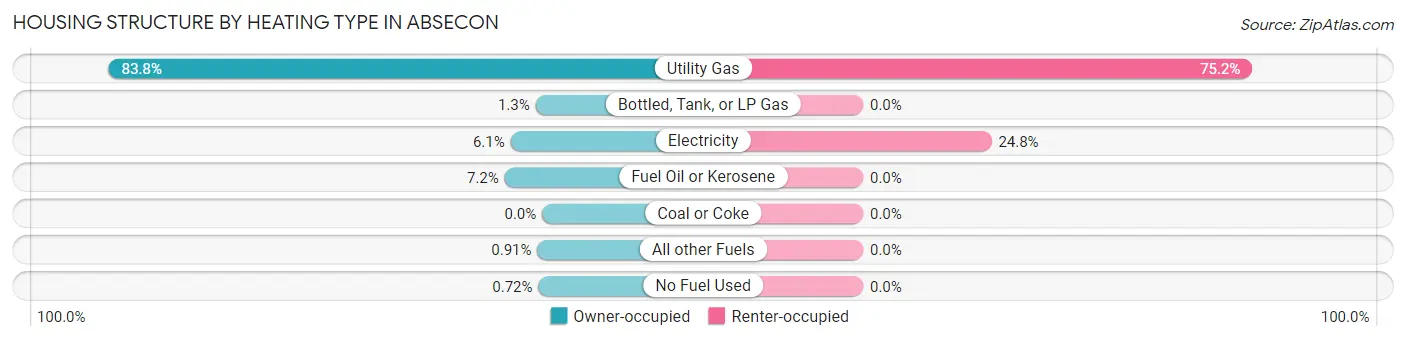
| Heating Type | Owner-occupied | Renter-occupied |
| Utility Gas | 2,199 (83.8%) | 706 (75.2%) |
| Bottled, Tank, or LP Gas | 33 (1.3%) | 0 (0.0%) |
| Electricity | 160 (6.1%) | 233 (24.8%) |
| Fuel Oil or Kerosene | 190 (7.2%) | 0 (0.0%) |
| Coal or Coke | 0 (0.0%) | 0 (0.0%) |
| All other Fuels | 24 (0.9%) | 0 (0.0%) |
| No Fuel Used | 19 (0.7%) | 0 (0.0%) |
| Total | 2,625 (100.0%) | 939 (100.0%) |
Household Vehicle Usage in Absecon
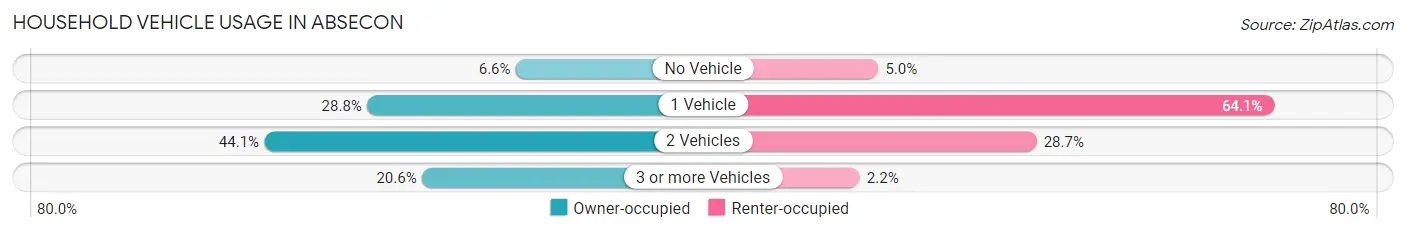
| Vehicles per Household | Owner-occupied | Renter-occupied |
| No Vehicle | 172 (6.6%) | 47 (5.0%) |
| 1 Vehicle | 755 (28.8%) | 602 (64.1%) |
| 2 Vehicles | 1,158 (44.1%) | 269 (28.6%) |
| 3 or more Vehicles | 540 (20.6%) | 21 (2.2%) |
| Total | 2,625 (100.0%) | 939 (100.0%) |
Real Estate & Mortgages in Absecon
Real Estate and Mortgage Overview in Absecon
| Characteristic | Without Mortgage | With Mortgage |
| Housing Units | 971 | 1,654 |
| Median Property Value | $213,100 | $231,600 |
| Median Household Income | $70,521 | $267 |
| Monthly Housing Costs | $1,013 | $270 |
| Real Estate Taxes | $6,591 | $30 |
Property Value by Mortgage Status in Absecon
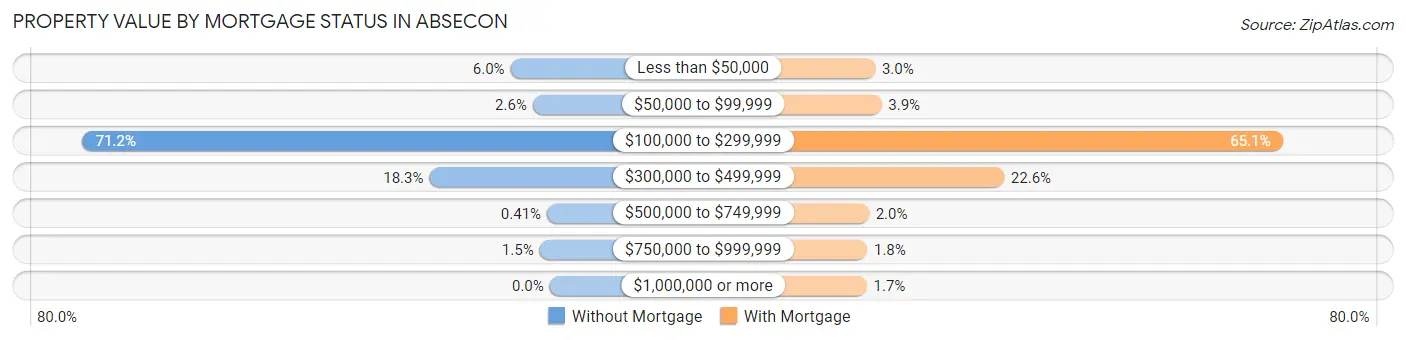
| Property Value | Without Mortgage | With Mortgage |
| Less than $50,000 | 58 (6.0%) | 49 (3.0%) |
| $50,000 to $99,999 | 25 (2.6%) | 65 (3.9%) |
| $100,000 to $299,999 | 691 (71.2%) | 1,076 (65.0%) |
| $300,000 to $499,999 | 178 (18.3%) | 374 (22.6%) |
| $500,000 to $749,999 | 4 (0.4%) | 33 (2.0%) |
| $750,000 to $999,999 | 15 (1.5%) | 29 (1.8%) |
| $1,000,000 or more | 0 (0.0%) | 28 (1.7%) |
| Total | 971 (100.0%) | 1,654 (100.0%) |
Household Income by Mortgage Status in Absecon
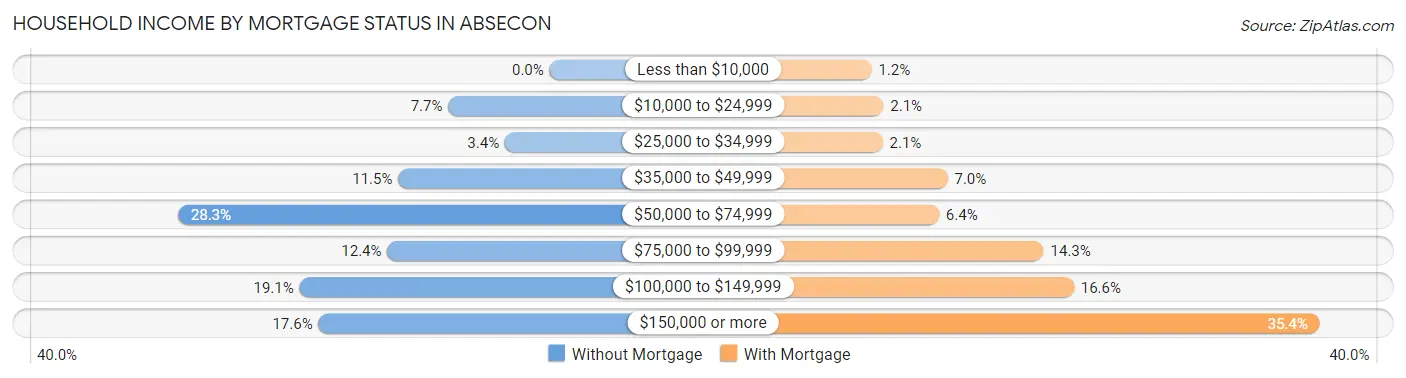
| Household Income | Without Mortgage | With Mortgage |
| Less than $10,000 | 0 (0.0%) | 20 (1.2%) |
| $10,000 to $24,999 | 75 (7.7%) | 35 (2.1%) |
| $25,000 to $34,999 | 33 (3.4%) | 34 (2.1%) |
| $35,000 to $49,999 | 112 (11.5%) | 116 (7.0%) |
| $50,000 to $74,999 | 275 (28.3%) | 105 (6.4%) |
| $75,000 to $99,999 | 120 (12.4%) | 237 (14.3%) |
| $100,000 to $149,999 | 185 (19.1%) | 275 (16.6%) |
| $150,000 or more | 171 (17.6%) | 585 (35.4%) |
| Total | 971 (100.0%) | 1,654 (100.0%) |
Property Value to Household Income Ratio in Absecon
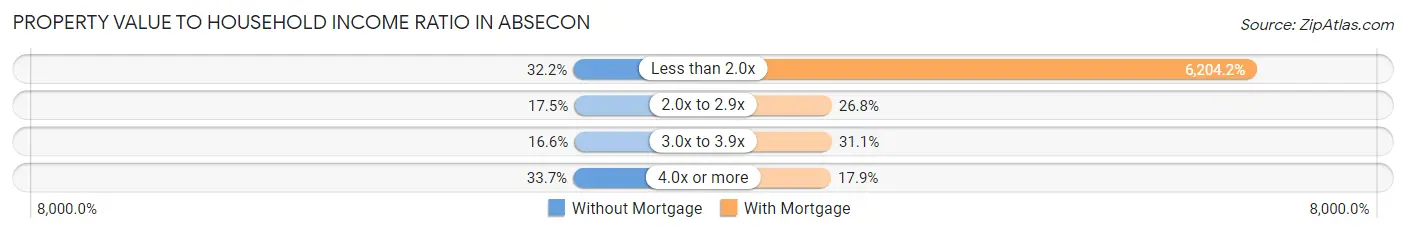
| Value-to-Income Ratio | Without Mortgage | With Mortgage |
| Less than 2.0x | 313 (32.2%) | 102,618 (6,204.2%) |
| 2.0x to 2.9x | 170 (17.5%) | 443 (26.8%) |
| 3.0x to 3.9x | 161 (16.6%) | 515 (31.1%) |
| 4.0x or more | 327 (33.7%) | 296 (17.9%) |
| Total | 971 (100.0%) | 1,654 (100.0%) |
Real Estate Taxes by Mortgage Status in Absecon
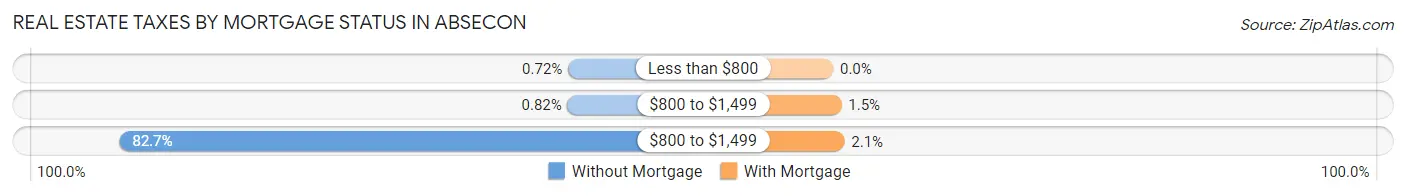
| Property Taxes | Without Mortgage | With Mortgage |
| Less than $800 | 7 (0.7%) | 0 (0.0%) |
| $800 to $1,499 | 8 (0.8%) | 25 (1.5%) |
| $800 to $1,499 | 803 (82.7%) | 34 (2.1%) |
| Total | 971 (100.0%) | 1,654 (100.0%) |
Health & Disability in Absecon
Health Insurance Coverage by Age in Absecon
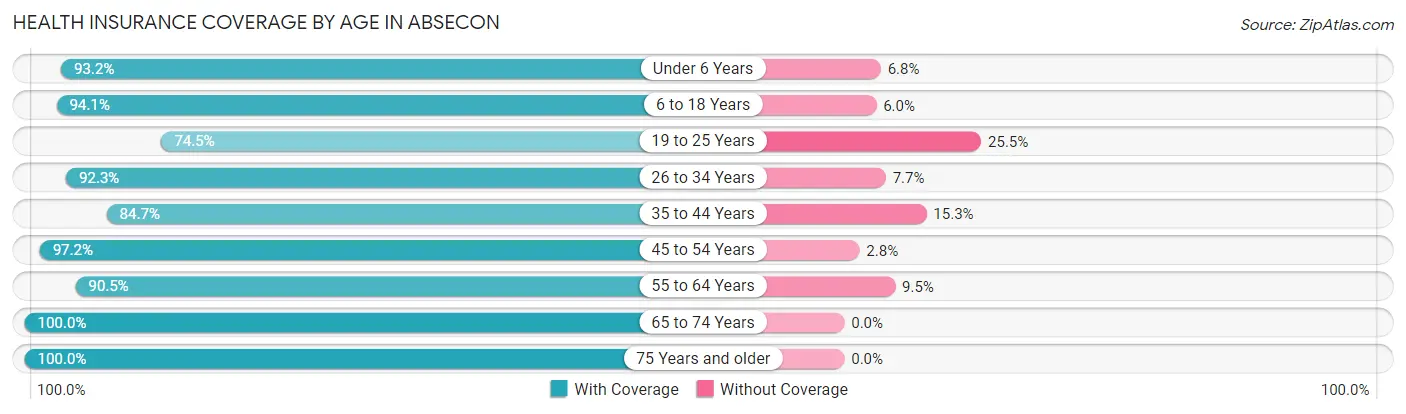
| Age Bracket | With Coverage | Without Coverage |
| Under 6 Years | 782 (93.2%) | 57 (6.8%) |
| 6 to 18 Years | 1,153 (94.1%) | 73 (5.9%) |
| 19 to 25 Years | 403 (74.5%) | 138 (25.5%) |
| 26 to 34 Years | 1,196 (92.3%) | 100 (7.7%) |
| 35 to 44 Years | 913 (84.7%) | 165 (15.3%) |
| 45 to 54 Years | 517 (97.2%) | 15 (2.8%) |
| 55 to 64 Years | 1,471 (90.5%) | 154 (9.5%) |
| 65 to 74 Years | 950 (100.0%) | 0 (0.0%) |
| 75 Years and older | 747 (100.0%) | 0 (0.0%) |
| Total | 8,132 (92.0%) | 702 (8.0%) |
Health Insurance Coverage by Citizenship Status in Absecon
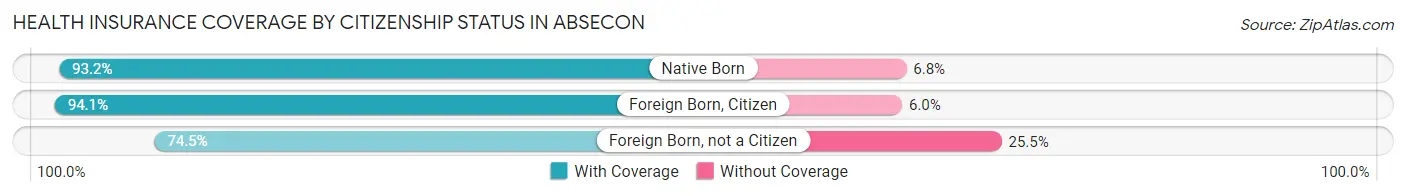
| Citizenship Status | With Coverage | Without Coverage |
| Native Born | 782 (93.2%) | 57 (6.8%) |
| Foreign Born, Citizen | 1,153 (94.1%) | 73 (5.9%) |
| Foreign Born, not a Citizen | 403 (74.5%) | 138 (25.5%) |
Health Insurance Coverage by Household Income in Absecon
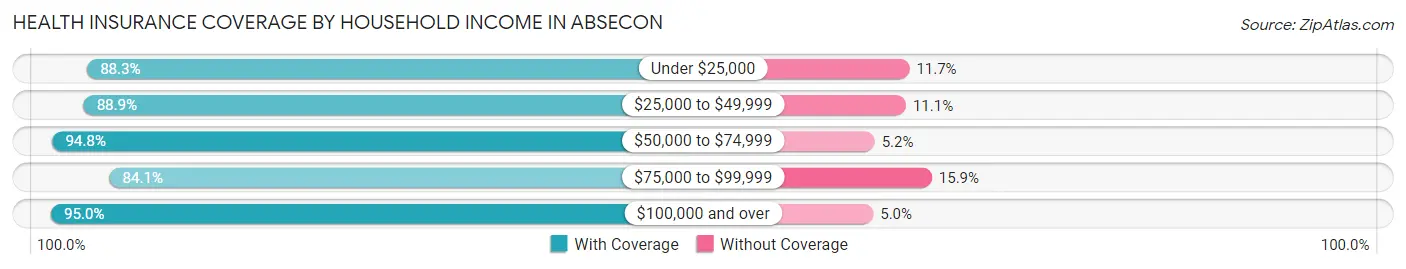
| Household Income | With Coverage | Without Coverage |
| Under $25,000 | 594 (88.3%) | 79 (11.7%) |
| $25,000 to $49,999 | 1,034 (88.9%) | 129 (11.1%) |
| $50,000 to $74,999 | 1,594 (94.8%) | 88 (5.2%) |
| $75,000 to $99,999 | 1,092 (84.1%) | 207 (15.9%) |
| $100,000 and over | 3,797 (95.0%) | 198 (5.0%) |
Public vs Private Health Insurance Coverage by Age in Absecon
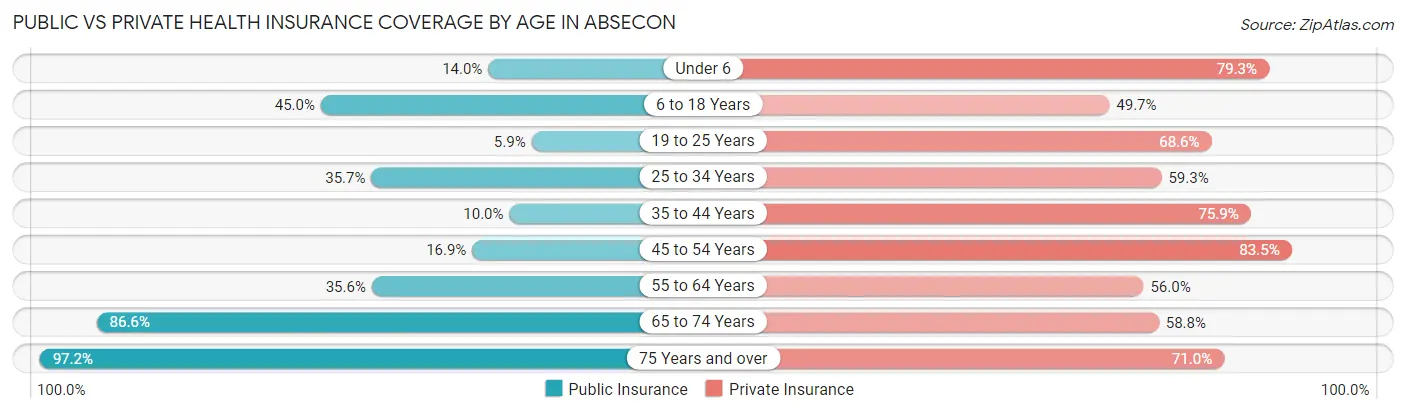
| Age Bracket | Public Insurance | Private Insurance |
| Under 6 | 117 (14.0%) | 665 (79.3%) |
| 6 to 18 Years | 552 (45.0%) | 609 (49.7%) |
| 19 to 25 Years | 32 (5.9%) | 371 (68.6%) |
| 25 to 34 Years | 462 (35.6%) | 769 (59.3%) |
| 35 to 44 Years | 108 (10.0%) | 818 (75.9%) |
| 45 to 54 Years | 90 (16.9%) | 444 (83.5%) |
| 55 to 64 Years | 578 (35.6%) | 910 (56.0%) |
| 65 to 74 Years | 823 (86.6%) | 559 (58.8%) |
| 75 Years and over | 726 (97.2%) | 530 (71.0%) |
| Total | 3,488 (39.5%) | 5,675 (64.2%) |
Disability Status by Sex by Age in Absecon
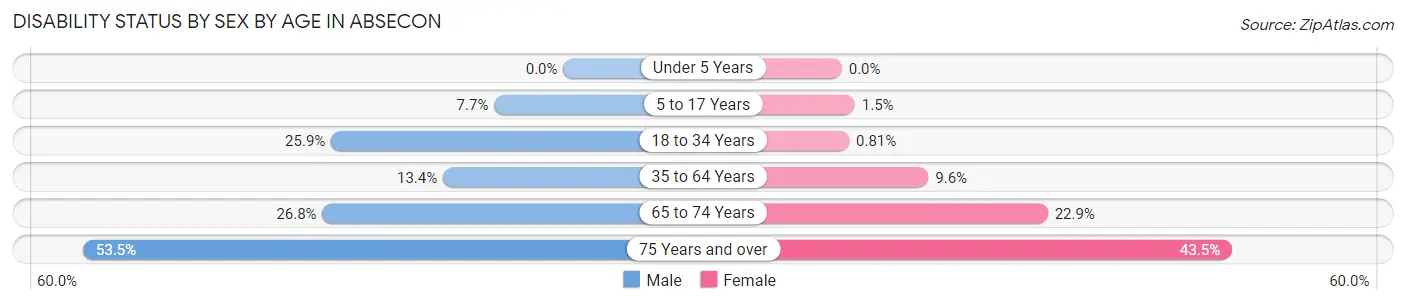
| Age Bracket | Male | Female |
| Under 5 Years | 0 (0.0%) | 0 (0.0%) |
| 5 to 17 Years | 47 (7.7%) | 10 (1.5%) |
| 18 to 34 Years | 263 (25.9%) | 7 (0.8%) |
| 35 to 64 Years | 200 (13.4%) | 168 (9.6%) |
| 65 to 74 Years | 132 (26.8%) | 105 (22.9%) |
| 75 Years and over | 183 (53.5%) | 176 (43.5%) |
Disability Class by Sex by Age in Absecon
Disability Class: Hearing Difficulty
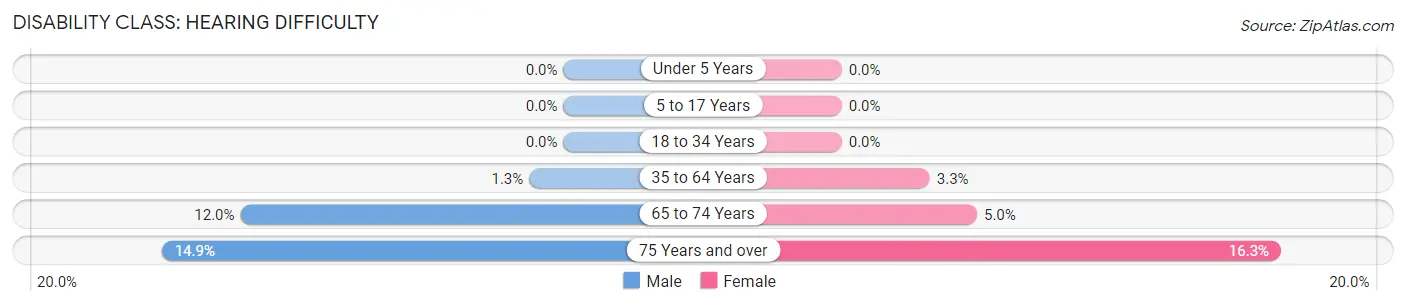
| Age Bracket | Male | Female |
| Under 5 Years | 0 (0.0%) | 0 (0.0%) |
| 5 to 17 Years | 0 (0.0%) | 0 (0.0%) |
| 18 to 34 Years | 0 (0.0%) | 0 (0.0%) |
| 35 to 64 Years | 19 (1.3%) | 57 (3.3%) |
| 65 to 74 Years | 59 (12.0%) | 23 (5.0%) |
| 75 Years and over | 51 (14.9%) | 66 (16.3%) |
Disability Class: Vision Difficulty
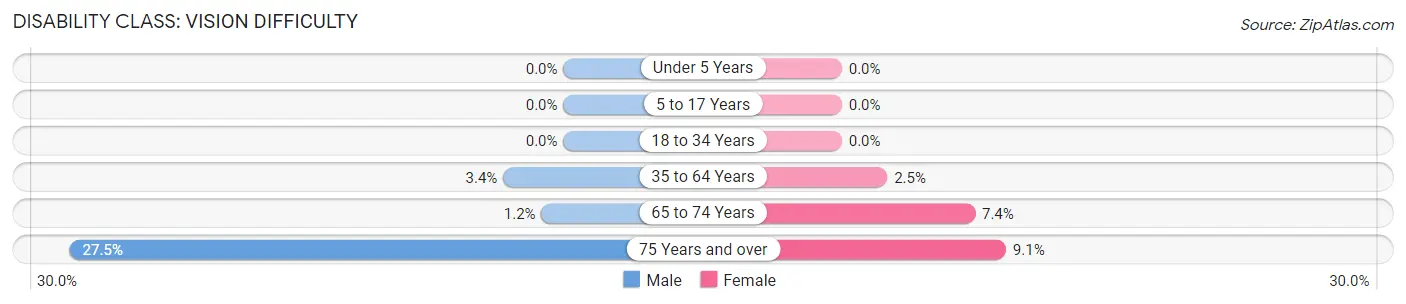
| Age Bracket | Male | Female |
| Under 5 Years | 0 (0.0%) | 0 (0.0%) |
| 5 to 17 Years | 0 (0.0%) | 0 (0.0%) |
| 18 to 34 Years | 0 (0.0%) | 0 (0.0%) |
| 35 to 64 Years | 50 (3.4%) | 44 (2.5%) |
| 65 to 74 Years | 6 (1.2%) | 34 (7.4%) |
| 75 Years and over | 94 (27.5%) | 37 (9.1%) |
Disability Class: Cognitive Difficulty
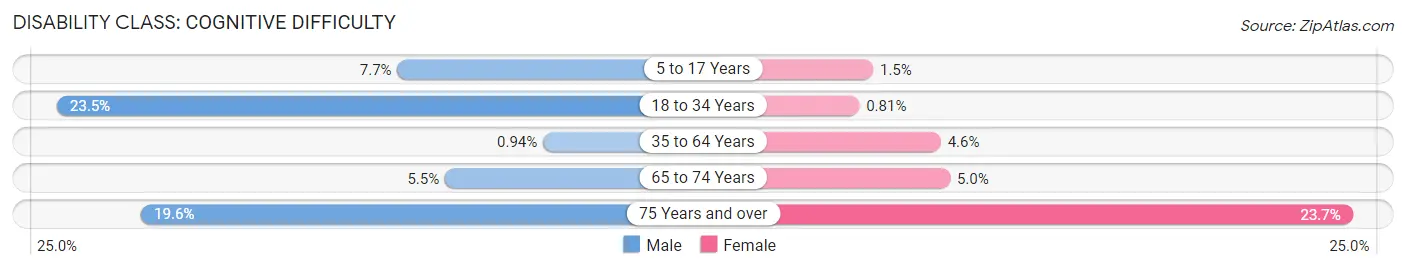
| Age Bracket | Male | Female |
| 5 to 17 Years | 47 (7.7%) | 10 (1.5%) |
| 18 to 34 Years | 239 (23.5%) | 7 (0.8%) |
| 35 to 64 Years | 14 (0.9%) | 80 (4.6%) |
| 65 to 74 Years | 27 (5.5%) | 23 (5.0%) |
| 75 Years and over | 67 (19.6%) | 96 (23.7%) |
Disability Class: Ambulatory Difficulty
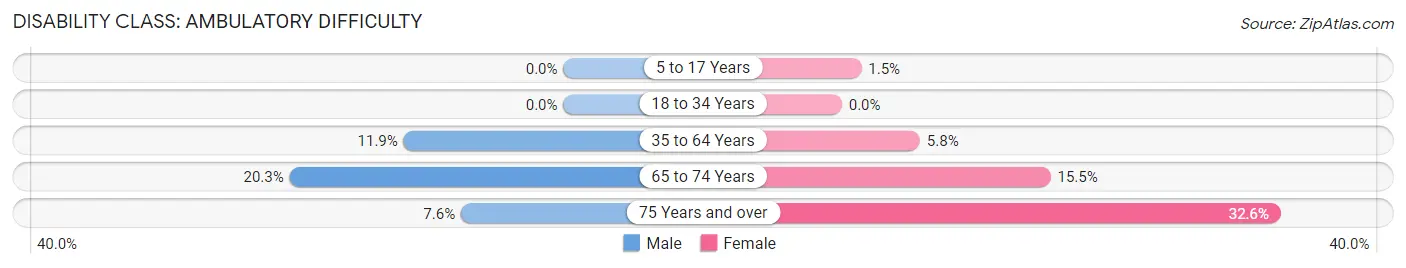
| Age Bracket | Male | Female |
| 5 to 17 Years | 0 (0.0%) | 10 (1.5%) |
| 18 to 34 Years | 0 (0.0%) | 0 (0.0%) |
| 35 to 64 Years | 177 (11.9%) | 101 (5.8%) |
| 65 to 74 Years | 100 (20.3%) | 71 (15.5%) |
| 75 Years and over | 26 (7.6%) | 132 (32.6%) |
Disability Class: Self-Care Difficulty
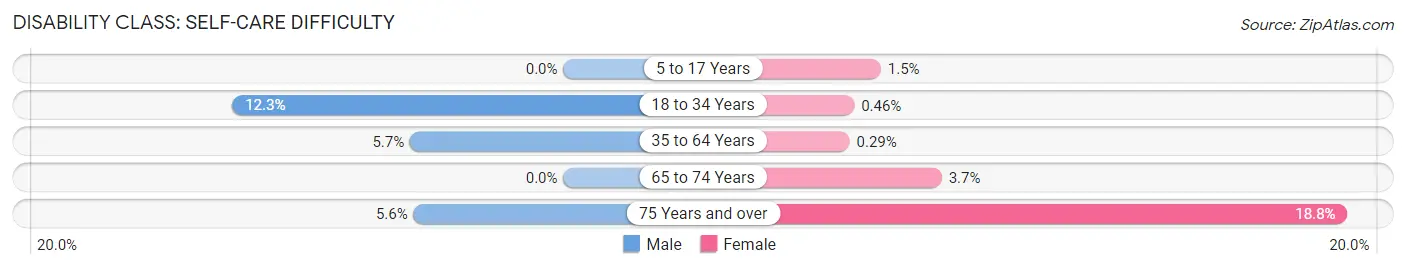
| Age Bracket | Male | Female |
| 5 to 17 Years | 0 (0.0%) | 10 (1.5%) |
| 18 to 34 Years | 125 (12.3%) | 4 (0.5%) |
| 35 to 64 Years | 85 (5.7%) | 5 (0.3%) |
| 65 to 74 Years | 0 (0.0%) | 17 (3.7%) |
| 75 Years and over | 19 (5.6%) | 76 (18.8%) |
Technology Access in Absecon
Computing Device Access in Absecon
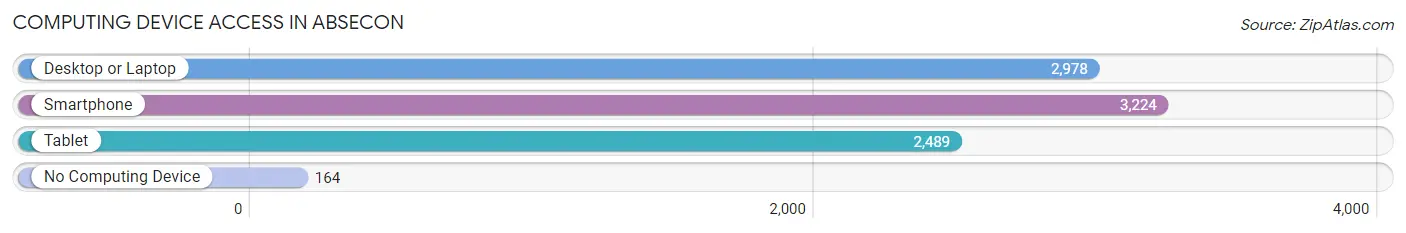
| Device Type | # Households | % Households |
| Desktop or Laptop | 2,978 | 83.6% |
| Smartphone | 3,224 | 90.5% |
| Tablet | 2,489 | 69.8% |
| No Computing Device | 164 | 4.6% |
| Total | 3,564 | 100.0% |
Internet Access in Absecon
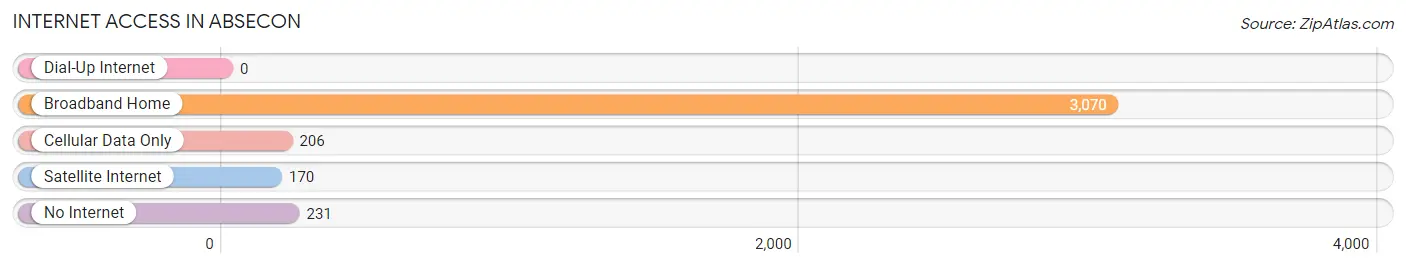
| Internet Type | # Households | % Households |
| Dial-Up Internet | 0 | 0.0% |
| Broadband Home | 3,070 | 86.1% |
| Cellular Data Only | 206 | 5.8% |
| Satellite Internet | 170 | 4.8% |
| No Internet | 231 | 6.5% |
| Total | 3,564 | 100.0% |
Absecon Summary
Absecon, NJ is a small city located in Atlantic County, New Jersey. It is situated on the Absecon Bay, just south of Atlantic City. The city has a population of 8,411 as of the 2010 census, making it the second-largest city in Atlantic County.
Geography
Absecon is located at 39°24'25" North, 74°30'25" West (39.406944, -74.506944). It is bordered by Atlantic City to the north, Egg Harbor Township to the west, and Galloway Township to the south. The city covers an area of 4.2 square miles, all of which is land.
The city is situated on the Absecon Bay, which is part of the Atlantic Ocean. The bay is a popular spot for fishing, boating, and other recreational activities. The city is also home to several parks, including Absecon Wildlife Management Area, Absecon Creek Park, and Absecon Lighthouse Park.
Climate
Absecon has a humid subtropical climate, with hot, humid summers and mild winters. The average high temperature in July is 85°F, and the average low temperature in January is 28°F. The city receives an average of 44 inches of precipitation per year.
Demographics
As of the 2010 census, Absecon had a population of 8,411. The racial makeup of the city was 79.2% White, 11.3% African American, 0.3% Native American, 2.2% Asian, 0.1% Pacific Islander, 4.3% from other races, and 2.7% from two or more races. Hispanic or Latino of any race were 11.3% of the population.
The median household income in Absecon was $50,945 in 2017, and the median family income was $60,945. The per capita income was $25,945. About 8.3% of families and 10.2% of the population were below the poverty line, including 14.2% of those under age 18 and 6.2% of those age 65 or over.
Economy
Absecon is home to several businesses, including retail stores, restaurants, and professional services. The city is also home to several casinos, including the Borgata Hotel Casino & Spa, Harrah's Resort Atlantic City, and the Golden Nugget Atlantic City. Tourism is a major industry in Absecon, as the city is located near several popular attractions, including the Atlantic City Boardwalk and the Absecon Lighthouse.
The city is also home to several manufacturing companies, including Absecon Mills, a textile manufacturer, and Absecon Machine Works, a machine shop. The city is also home to several educational institutions, including Atlantic Cape Community College and Stockton University.
History
Absecon was first settled in the early 1700s by Dutch and English settlers. The city was incorporated in 1872 and was named after the Absegami tribe, which inhabited the area prior to European settlement.
In the late 1800s, Absecon became a popular resort destination, with several hotels and resorts being built in the area. The city was also home to several amusement parks, including Absecon Beach Park and Absecon Amusement Park.
In the early 1900s, Absecon became a popular destination for gamblers, with several casinos being built in the area. The city was also home to several speakeasies during the Prohibition era.
In the late 20th century, Absecon became a popular destination for tourists, with several casinos and resorts being built in the area. The city is also home to several popular attractions, including the Absecon Lighthouse and the Atlantic City Boardwalk.
Common Questions
What is Per Capita Income in Absecon?
Per Capita income in Absecon is $41,063.
What is the Median Family Income in Absecon?
Median Family Income in Absecon is $92,778.
What is the Median Household income in Absecon?
Median Household Income in Absecon is $73,141.
What is Income or Wage Gap in Absecon?
Income or Wage Gap in Absecon is 15.6%.
Women in Absecon earn 84.4 cents for every dollar earned by a man.
What is Inequality or Gini Index in Absecon?
Inequality or Gini Index in Absecon is 0.48.
What is the Total Population of Absecon?
Total Population of Absecon is 9,086.
What is the Total Male Population of Absecon?
Total Male Population of Absecon is 4,514.
What is the Total Female Population of Absecon?
Total Female Population of Absecon is 4,572.
What is the Ratio of Males per 100 Females in Absecon?
There are 98.73 Males per 100 Females in Absecon.
What is the Ratio of Females per 100 Males in Absecon?
There are 101.28 Females per 100 Males in Absecon.
What is the Median Population Age in Absecon?
Median Population Age in Absecon is 37.6 Years.
What is the Average Family Size in Absecon
Average Family Size in Absecon is 3.1 People.
What is the Average Household Size in Absecon
Average Household Size in Absecon is 2.5 People.
How Large is the Labor Force in Absecon?
There are 4,441 People in the Labor Forcein in Absecon.
What is the Percentage of People in the Labor Force in Absecon?
61.5% of People are in the Labor Force in Absecon.
What is the Unemployment Rate in Absecon?
Unemployment Rate in Absecon is 8.7%.