Long Valley, NJ Map & Demographics
Long Valley Map
Long Valley Overview
$59,777
PER CAPITA INCOME
$126,979
AVG FAMILY INCOME
$117,000
AVG HOUSEHOLD INCOME
50.4%
WAGE / INCOME GAP [ % ]
49.6¢/ $1
WAGE / INCOME GAP [ $ ]
0.47
INEQUALITY / GINI INDEX
2,046
TOTAL POPULATION
1,006
MALE POPULATION
1,040
FEMALE POPULATION
96.73
MALES / 100 FEMALES
103.38
FEMALES / 100 MALES
47.2
MEDIAN AGE
3.0
AVG FAMILY SIZE
2.7
AVG HOUSEHOLD SIZE
1,007
LABOR FORCE [ PEOPLE ]
59.4%
PERCENT IN LABOR FORCE
4.5%
UNEMPLOYMENT RATE
Long Valley Zip Codes
Long Valley Area Codes
Income in Long Valley
Income Overview in Long Valley
Per Capita Income in Long Valley is $59,777, while median incomes of families and households are $126,979 and $117,000 respectively.
| Characteristic | Number | Measure |
| Per Capita Income | 2,046 | $59,777 |
| Median Family Income | 622 | $126,979 |
| Mean Family Income | 622 | $182,182 |
| Median Household Income | 754 | $117,000 |
| Mean Household Income | 754 | $160,314 |
| Income Deficit | 622 | $0 |
| Wage / Income Gap (%) | 2,046 | 50.45% |
| Wage / Income Gap ($) | 2,046 | 49.55¢ per $1 |
| Gini / Inequality Index | 2,046 | 0.47 |
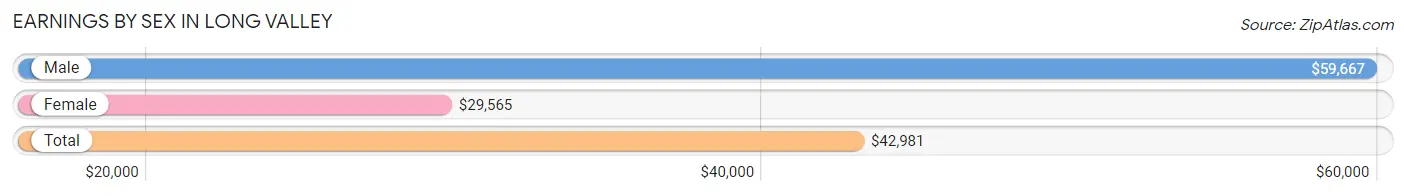
Earnings by Sex in Long Valley
Average Earnings in Long Valley are $42,981, $59,667 for men and $29,565 for women, a difference of 50.4%.
| Sex | Number | Average Earnings |
| Male | 544 (51.7%) | $59,667 |
| Female | 508 (48.3%) | $29,565 |
| Total | 1,052 (100.0%) | $42,981 |
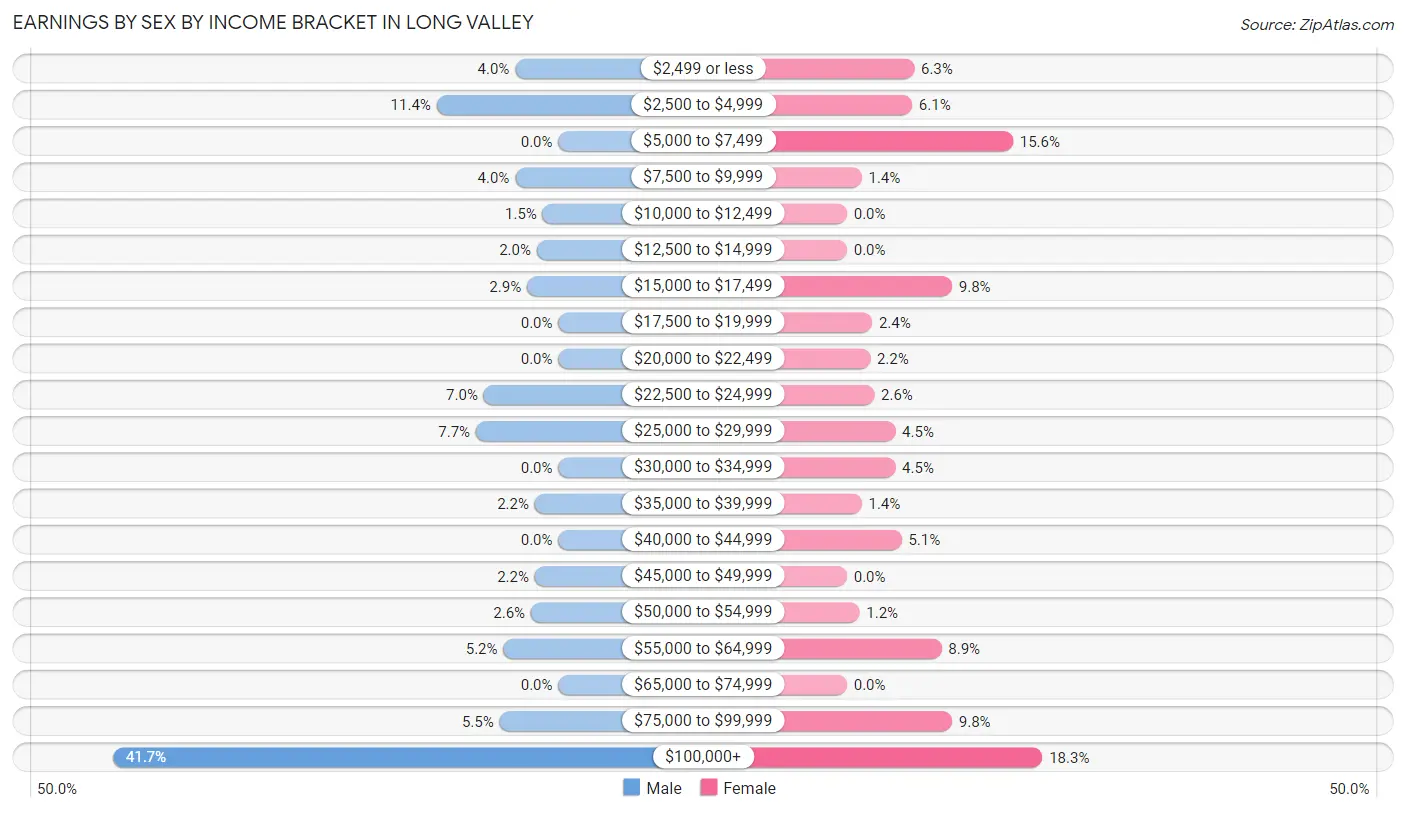
Earnings by Sex by Income Bracket in Long Valley
The most common earnings brackets in Long Valley are $100,000+ for men (227 | 41.7%) and $100,000+ for women (93 | 18.3%).
| Income | Male | Female |
| $2,499 or less | 22 (4.0%) | 32 (6.3%) |
| $2,500 to $4,999 | 62 (11.4%) | 31 (6.1%) |
| $5,000 to $7,499 | 0 (0.0%) | 79 (15.5%) |
| $7,500 to $9,999 | 22 (4.0%) | 7 (1.4%) |
| $10,000 to $12,499 | 8 (1.5%) | 0 (0.0%) |
| $12,500 to $14,999 | 11 (2.0%) | 0 (0.0%) |
| $15,000 to $17,499 | 16 (2.9%) | 50 (9.8%) |
| $17,500 to $19,999 | 0 (0.0%) | 12 (2.4%) |
| $20,000 to $22,499 | 0 (0.0%) | 11 (2.2%) |
| $22,500 to $24,999 | 38 (7.0%) | 13 (2.6%) |
| $25,000 to $29,999 | 42 (7.7%) | 23 (4.5%) |
| $30,000 to $34,999 | 0 (0.0%) | 23 (4.5%) |
| $35,000 to $39,999 | 12 (2.2%) | 7 (1.4%) |
| $40,000 to $44,999 | 0 (0.0%) | 26 (5.1%) |
| $45,000 to $49,999 | 12 (2.2%) | 0 (0.0%) |
| $50,000 to $54,999 | 14 (2.6%) | 6 (1.2%) |
| $55,000 to $64,999 | 28 (5.1%) | 45 (8.9%) |
| $65,000 to $74,999 | 0 (0.0%) | 0 (0.0%) |
| $75,000 to $99,999 | 30 (5.5%) | 50 (9.8%) |
| $100,000+ | 227 (41.7%) | 93 (18.3%) |
| Total | 544 (100.0%) | 508 (100.0%) |
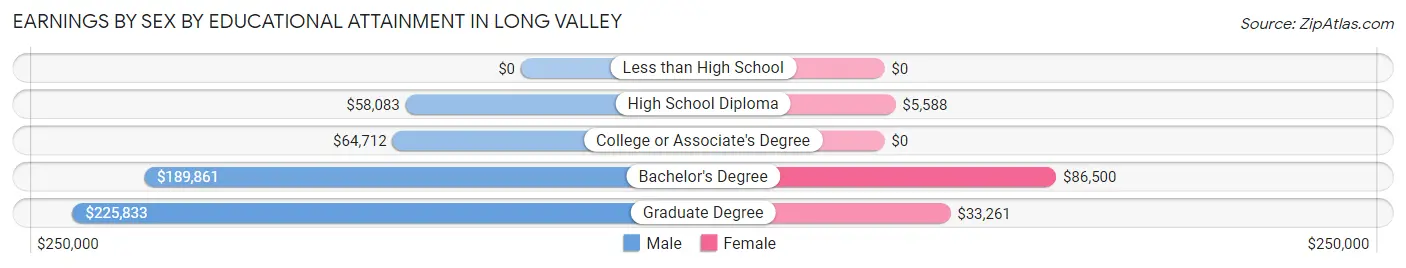
Earnings by Sex by Educational Attainment in Long Valley
| Educational Attainment | Male Income | Female Income |
| Less than High School | - | - |
| High School Diploma | $58,083 | $5,588 |
| College or Associate's Degree | $64,712 | $0 |
| Bachelor's Degree | $189,861 | $86,500 |
| Graduate Degree | $225,833 | $33,261 |
| Total | $117,212 | $0 |
Family Income in Long Valley
Family Income Brackets in Long Valley
According to the Long Valley family income data, there are 208 families falling into the $200,000+ income range, which is the most common income bracket and makes up 33.4% of all families.
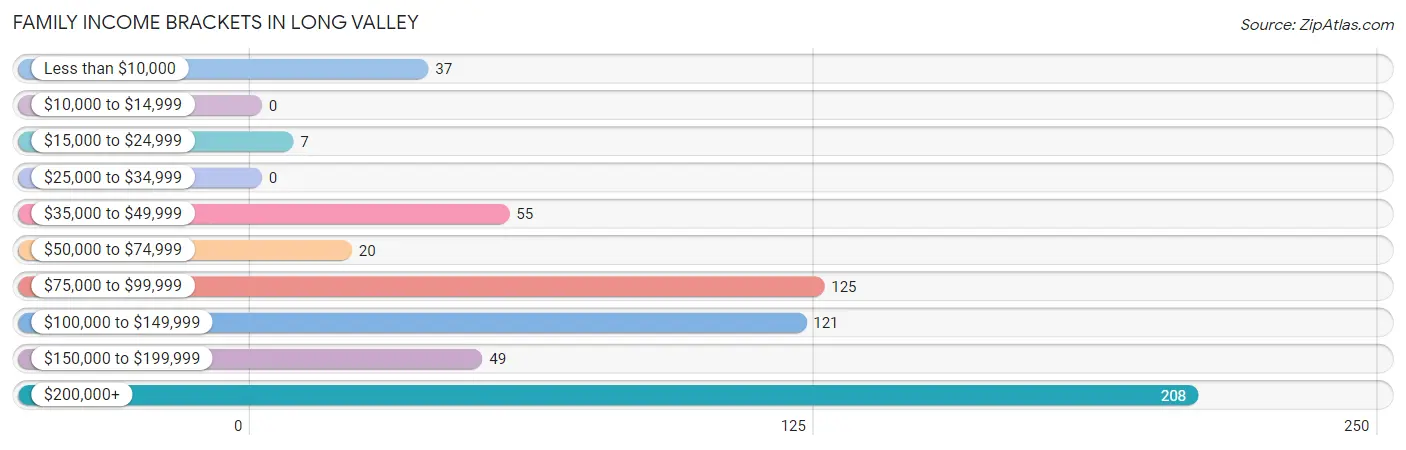
| Income Bracket | # Families | % Families |
| Less than $10,000 | 37 | 5.9% |
| $10,000 to $14,999 | 0 | 0.0% |
| $15,000 to $24,999 | 7 | 1.1% |
| $25,000 to $34,999 | 0 | 0.0% |
| $35,000 to $49,999 | 55 | 8.8% |
| $50,000 to $74,999 | 20 | 3.2% |
| $75,000 to $99,999 | 125 | 20.1% |
| $100,000 to $149,999 | 121 | 19.5% |
| $150,000 to $199,999 | 49 | 7.9% |
| $200,000+ | 208 | 33.4% |
Family Income by Famaliy Size in Long Valley
5-person families (83 | 13.3%) account for the highest median family income in Long Valley with $250,001 per family, while 3-person families (108 | 17.4%) have the highest median income of $65,238 per family member.
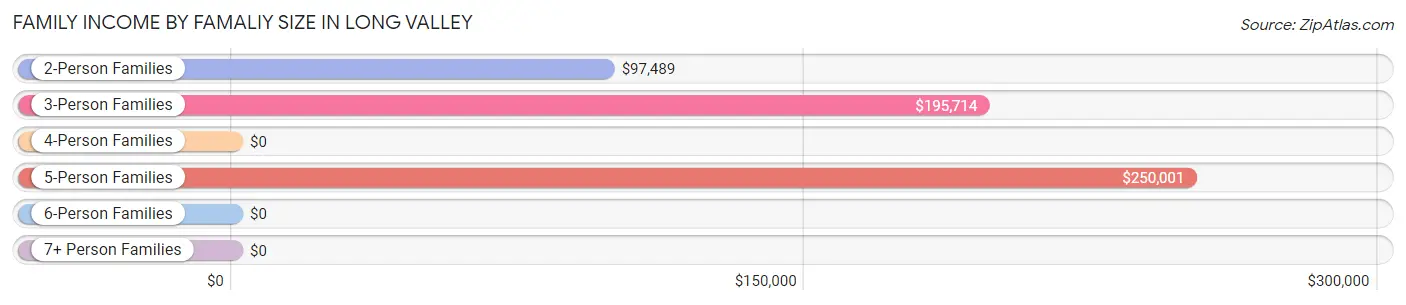
| Income Bracket | # Families | Median Income |
| 2-Person Families | 311 (50.0%) | $97,489 |
| 3-Person Families | 108 (17.4%) | $195,714 |
| 4-Person Families | 120 (19.3%) | $0 |
| 5-Person Families | 83 (13.3%) | $250,001 |
| 6-Person Families | 0 (0.0%) | $0 |
| 7+ Person Families | 0 (0.0%) | $0 |
| Total | 622 (100.0%) | $126,979 |
Family Income by Number of Earners in Long Valley
The median family income in Long Valley is $126,979, with families comprising 3+ earners (95) having the highest median family income of $250,001, while families with no earners (132) have the lowest median family income of $96,923, accounting for 15.3% and 21.2% of families, respectively.
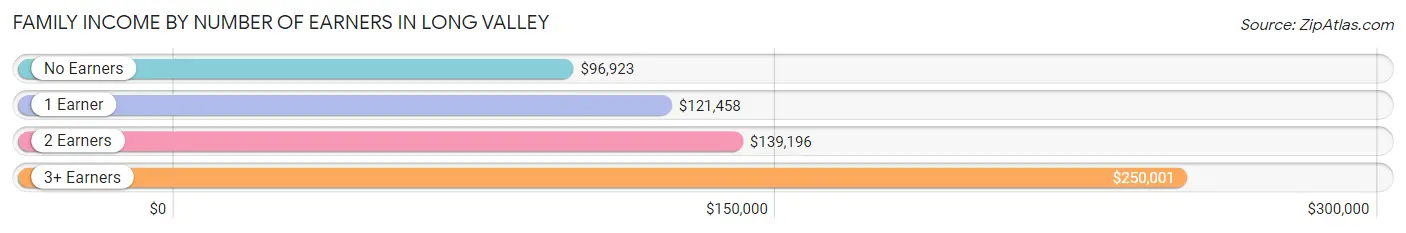
| Number of Earners | # Families | Median Income |
| No Earners | 132 (21.2%) | $96,923 |
| 1 Earner | 156 (25.1%) | $121,458 |
| 2 Earners | 239 (38.4%) | $139,196 |
| 3+ Earners | 95 (15.3%) | $250,001 |
| Total | 622 (100.0%) | $126,979 |
Household Income in Long Valley
Household Income Brackets in Long Valley
With 208 households falling in the category, the $200,000+ income range is the most frequent in Long Valley, accounting for 27.6% of all households.
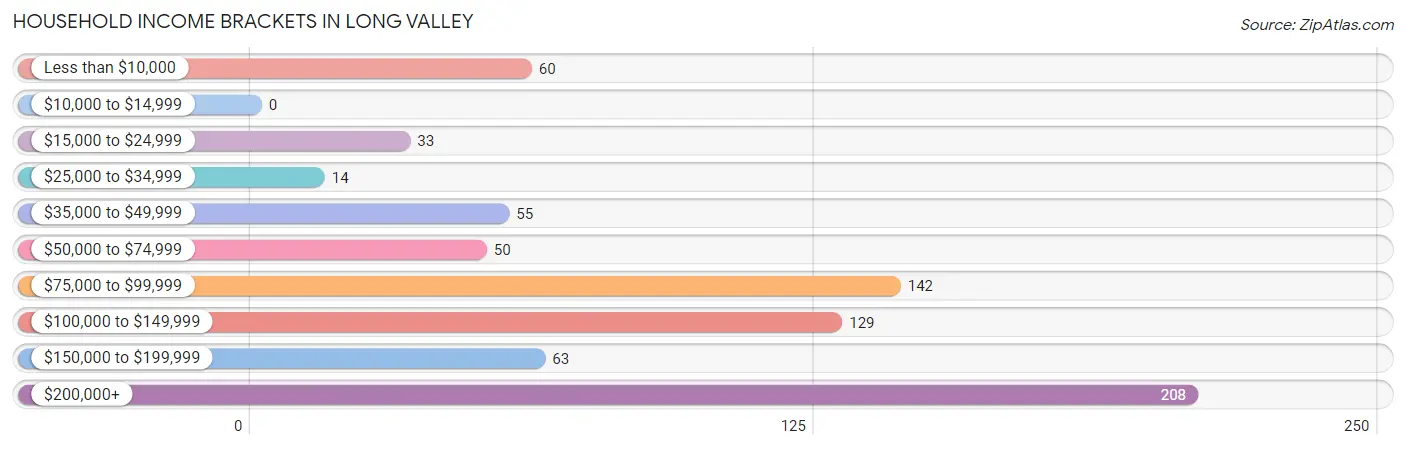
| Income Bracket | # Households | % Households |
| Less than $10,000 | 60 | 8.0% |
| $10,000 to $14,999 | 0 | 0.0% |
| $15,000 to $24,999 | 33 | 4.4% |
| $25,000 to $34,999 | 14 | 1.9% |
| $35,000 to $49,999 | 55 | 7.3% |
| $50,000 to $74,999 | 50 | 6.6% |
| $75,000 to $99,999 | 142 | 18.8% |
| $100,000 to $149,999 | 129 | 17.1% |
| $150,000 to $199,999 | 63 | 8.4% |
| $200,000+ | 208 | 27.6% |
Household Income by Householder Age in Long Valley
The median household income in Long Valley is $117,000, with the highest median household income of $196,190 found in the 45 to 64 years age bracket for the primary householder. A total of 346 households (45.9%) fall into this category. Meanwhile, the 15 to 24 years age bracket for the primary householder has the lowest median household income of $0, with 37 households (4.9%) in this group.
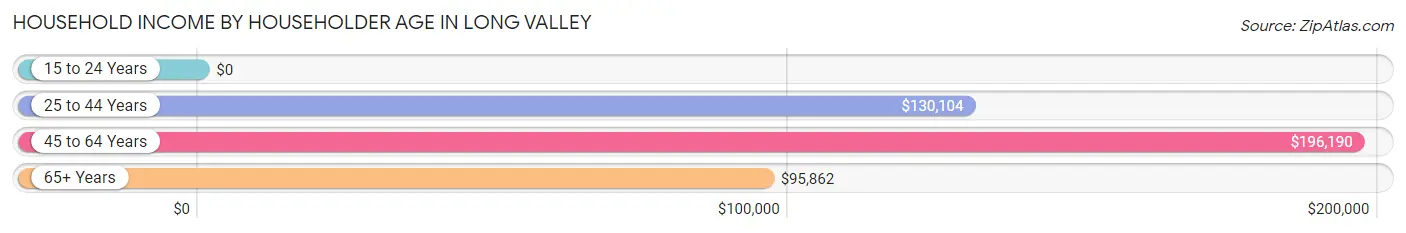
| Income Bracket | # Households | Median Income |
| 15 to 24 Years | 37 (4.9%) | $0 |
| 25 to 44 Years | 107 (14.2%) | $130,104 |
| 45 to 64 Years | 346 (45.9%) | $196,190 |
| 65+ Years | 264 (35.0%) | $95,862 |
| Total | 754 (100.0%) | $117,000 |
Poverty in Long Valley
Income Below Poverty by Sex and Age in Long Valley
With 11.5% poverty level for males and 6.1% for females among the residents of Long Valley, 15 year old males and 15 year old females are the most vulnerable to poverty, with 12 males (63.2%) and 30 females (40.0%) in their respective age groups living below the poverty level.
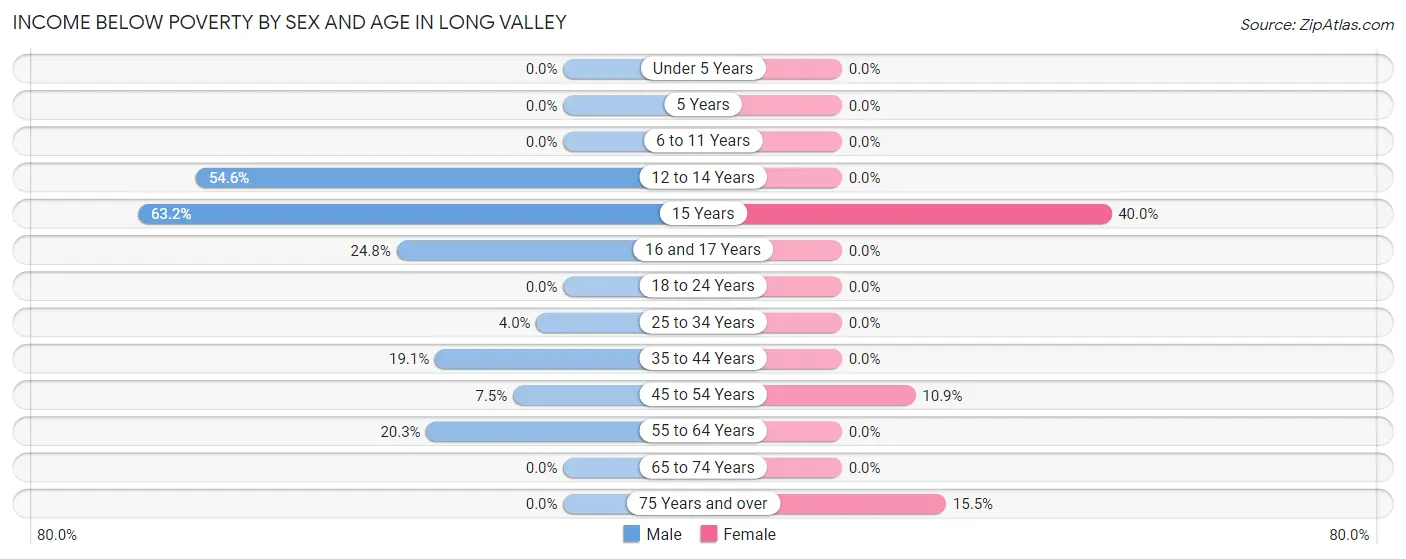
| Age Bracket | Male | Female |
| Under 5 Years | 0 (0.0%) | 0 (0.0%) |
| 5 Years | 0 (0.0%) | 0 (0.0%) |
| 6 to 11 Years | 0 (0.0%) | 0 (0.0%) |
| 12 to 14 Years | 18 (54.5%) | 0 (0.0%) |
| 15 Years | 12 (63.2%) | 30 (40.0%) |
| 16 and 17 Years | 27 (24.8%) | 0 (0.0%) |
| 18 to 24 Years | 0 (0.0%) | 0 (0.0%) |
| 25 to 34 Years | 4 (4.0%) | 0 (0.0%) |
| 35 to 44 Years | 8 (19.1%) | 0 (0.0%) |
| 45 to 54 Years | 10 (7.5%) | 19 (10.9%) |
| 55 to 64 Years | 37 (20.3%) | 0 (0.0%) |
| 65 to 74 Years | 0 (0.0%) | 0 (0.0%) |
| 75 Years and over | 0 (0.0%) | 15 (15.5%) |
| Total | 116 (11.5%) | 64 (6.1%) |
Income Above Poverty by Sex and Age in Long Valley
According to the poverty statistics in Long Valley, males aged under 5 years and females aged under 5 years are the age groups that are most secure financially, with 100.0% of males and 100.0% of females in these age groups living above the poverty line.
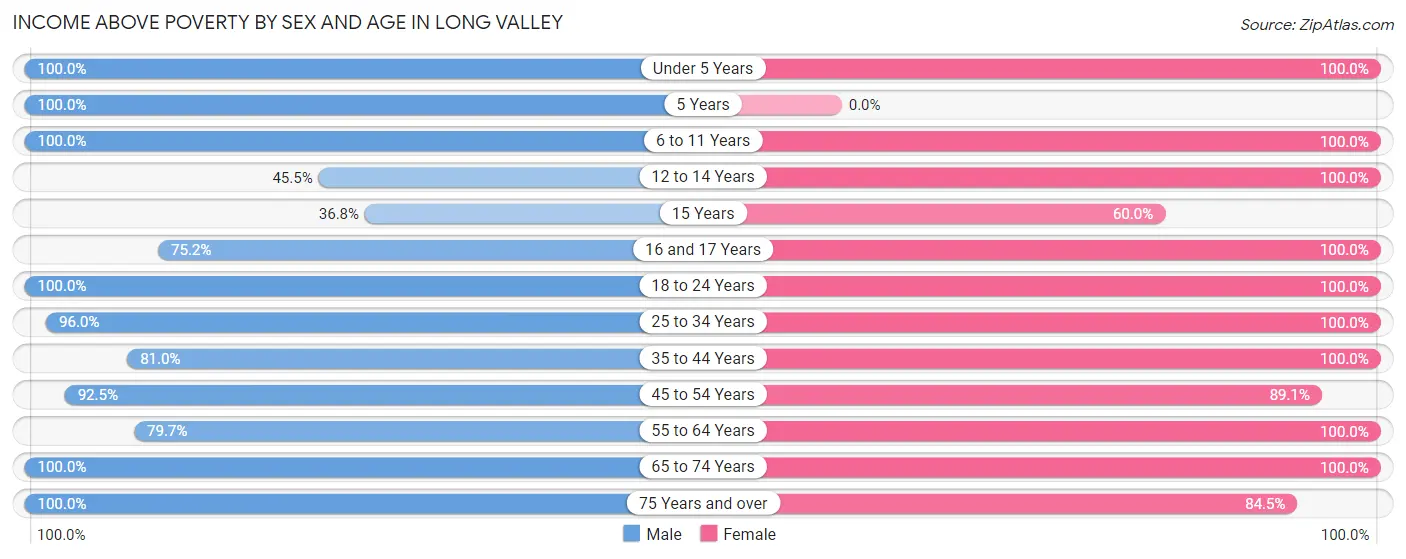
| Age Bracket | Male | Female |
| Under 5 Years | 54 (100.0%) | 76 (100.0%) |
| 5 Years | 18 (100.0%) | 0 (0.0%) |
| 6 to 11 Years | 43 (100.0%) | 18 (100.0%) |
| 12 to 14 Years | 15 (45.5%) | 14 (100.0%) |
| 15 Years | 7 (36.8%) | 45 (60.0%) |
| 16 and 17 Years | 82 (75.2%) | 71 (100.0%) |
| 18 to 24 Years | 78 (100.0%) | 92 (100.0%) |
| 25 to 34 Years | 96 (96.0%) | 73 (100.0%) |
| 35 to 44 Years | 34 (80.9%) | 75 (100.0%) |
| 45 to 54 Years | 124 (92.5%) | 155 (89.1%) |
| 55 to 64 Years | 145 (79.7%) | 111 (100.0%) |
| 65 to 74 Years | 130 (100.0%) | 164 (100.0%) |
| 75 Years and over | 64 (100.0%) | 82 (84.5%) |
| Total | 890 (88.5%) | 976 (93.9%) |
Income Below Poverty Among Married-Couple Families in Long Valley
The poverty statistics for married-couple families in Long Valley show that 3.6% or 19 of the total 532 families live below the poverty line. Families with 1 or 2 children have the highest poverty rate of 12.3%, comprising of 19 families. On the other hand, families with no children have the lowest poverty rate of 0.0%, which includes 0 families.
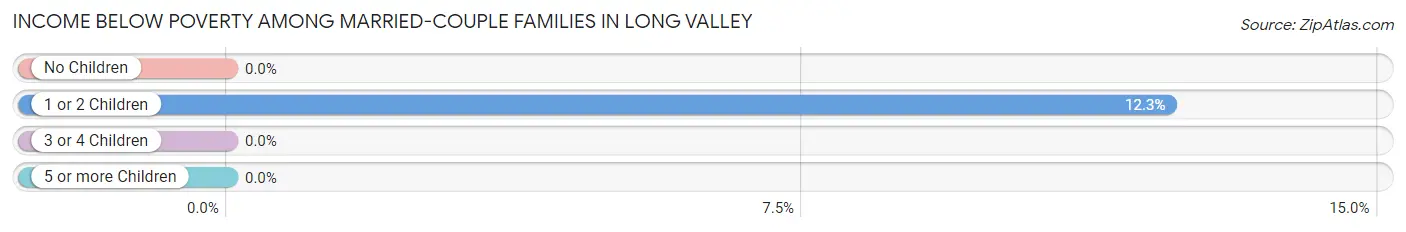
| Children | Above Poverty | Below Poverty |
| No Children | 325 (100.0%) | 0 (0.0%) |
| 1 or 2 Children | 136 (87.7%) | 19 (12.3%) |
| 3 or 4 Children | 52 (100.0%) | 0 (0.0%) |
| 5 or more Children | 0 (0.0%) | 0 (0.0%) |
| Total | 513 (96.4%) | 19 (3.6%) |
Income Below Poverty Among Single-Parent Households in Long Valley
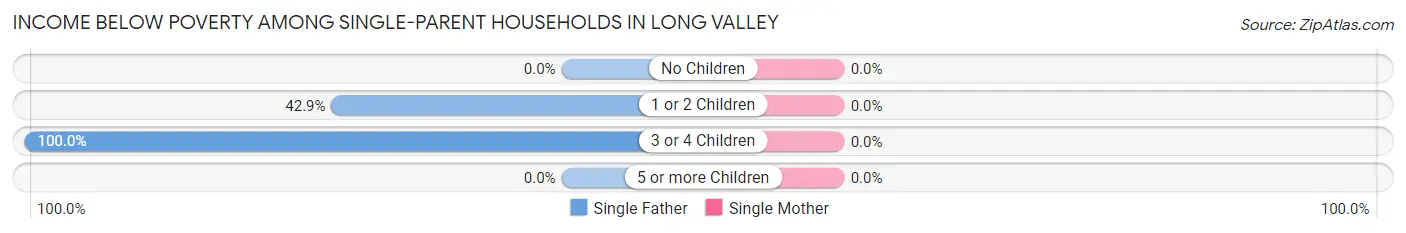
| Children | Single Father | Single Mother |
| No Children | 0 (0.0%) | 0 (0.0%) |
| 1 or 2 Children | 15 (42.9%) | 0 (0.0%) |
| 3 or 4 Children | 10 (100.0%) | 0 (0.0%) |
| 5 or more Children | 0 (0.0%) | 0 (0.0%) |
| Total | 25 (46.3%) | 0 (0.0%) |
Income Below Poverty Among Married-Couple vs Single-Parent Households in Long Valley
The poverty data for Long Valley shows that 19 of the married-couple family households (3.6%) and 25 of the single-parent households (27.8%) are living below the poverty level. Within the married-couple family households, those with 1 or 2 children have the highest poverty rate, with 19 households (12.3%) falling below the poverty line. Among the single-parent households, those with 3 or 4 children have the highest poverty rate, with 10 household (100.0%) living below poverty.
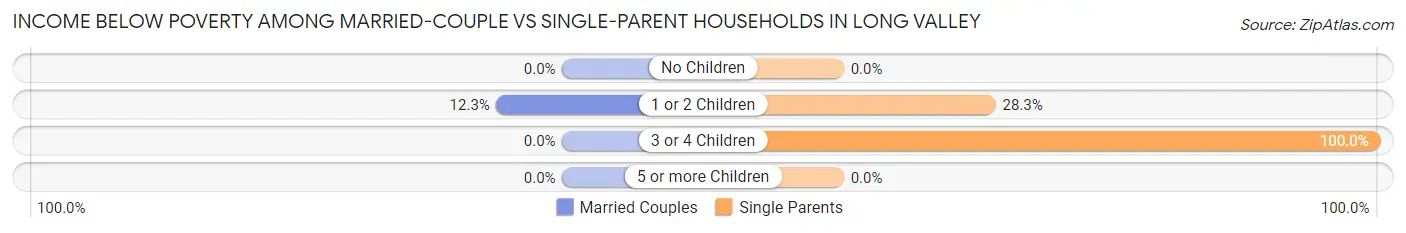
| Children | Married-Couple Families | Single-Parent Households |
| No Children | 0 (0.0%) | 0 (0.0%) |
| 1 or 2 Children | 19 (12.3%) | 15 (28.3%) |
| 3 or 4 Children | 0 (0.0%) | 10 (100.0%) |
| 5 or more Children | 0 (0.0%) | 0 (0.0%) |
| Total | 19 (3.6%) | 25 (27.8%) |
Race in Long Valley
The most populous races in Long Valley are White / Caucasian (1,708 | 83.5%), Hispanic or Latino (394 | 19.3%), and Two or more Races (232 | 11.3%).
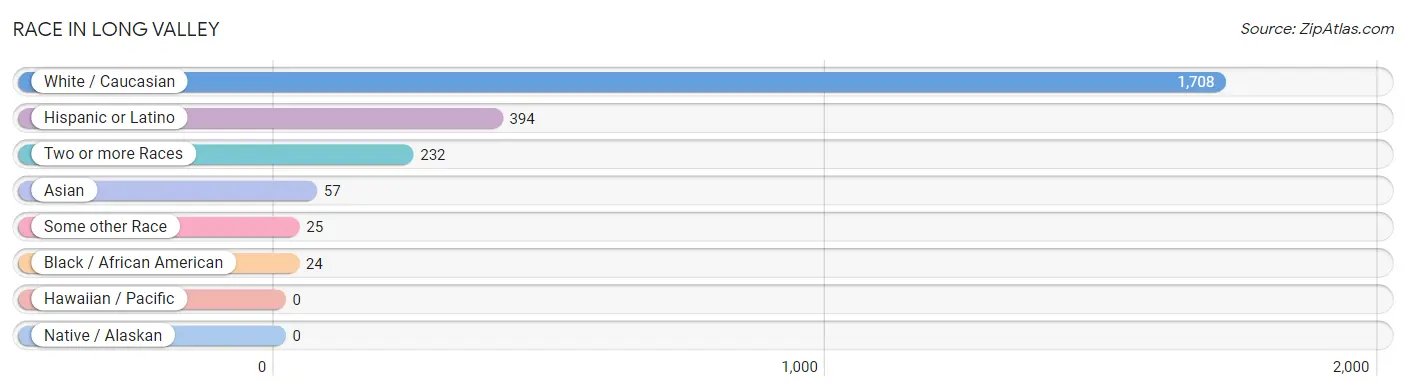
| Race | # Population | % Population |
| Asian | 57 | 2.8% |
| Black / African American | 24 | 1.2% |
| Hawaiian / Pacific | 0 | 0.0% |
| Hispanic or Latino | 394 | 19.3% |
| Native / Alaskan | 0 | 0.0% |
| White / Caucasian | 1,708 | 83.5% |
| Two or more Races | 232 | 11.3% |
| Some other Race | 25 | 1.2% |
| Total | 2,046 | 100.0% |
Ancestry in Long Valley
The most populous ancestries reported in Long Valley are Irish (536 | 26.2%), German (481 | 23.5%), Italian (457 | 22.3%), English (186 | 9.1%), and Central American (174 | 8.5%), together accounting for 89.6% of all Long Valley residents.
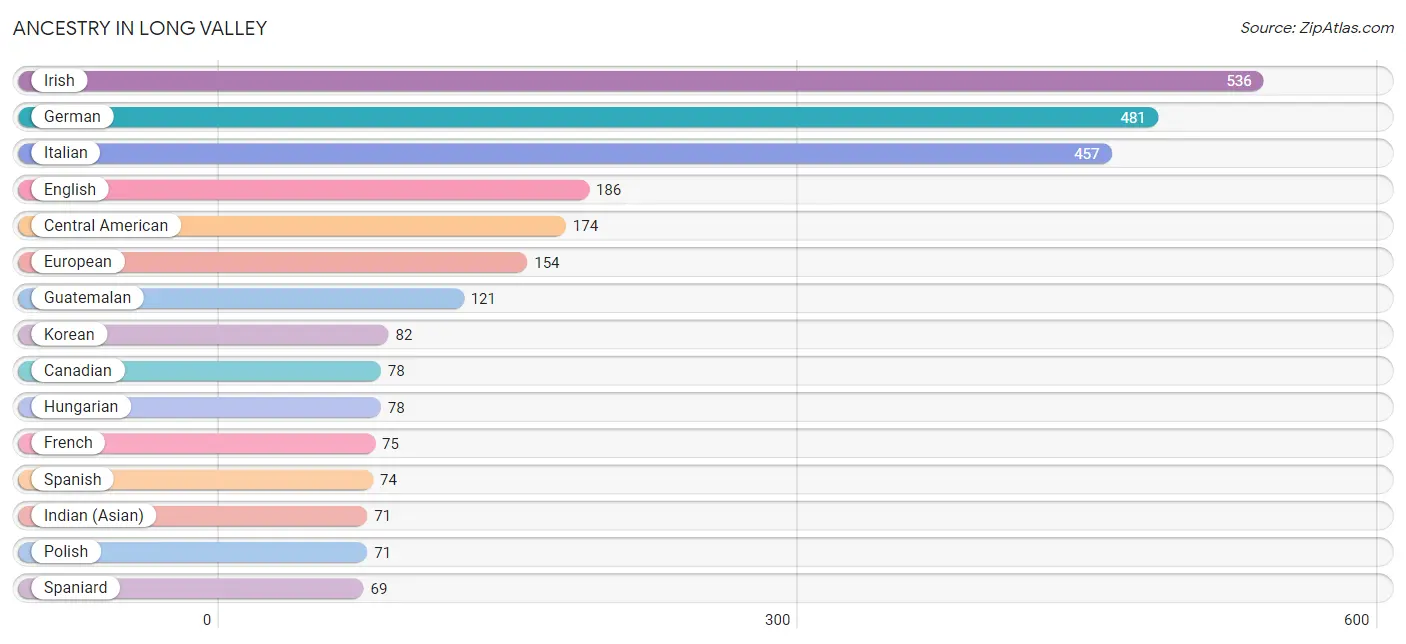
| Ancestry | # Population | % Population |
| American | 16 | 0.8% |
| Belgian | 20 | 1.0% |
| Brazilian | 15 | 0.7% |
| Canadian | 78 | 3.8% |
| Central American | 174 | 8.5% |
| Czech | 5 | 0.2% |
| Dutch | 35 | 1.7% |
| English | 186 | 9.1% |
| European | 154 | 7.5% |
| French | 75 | 3.7% |
| French Canadian | 10 | 0.5% |
| German | 481 | 23.5% |
| Greek | 13 | 0.6% |
| Guatemalan | 121 | 5.9% |
| Honduran | 53 | 2.6% |
| Hungarian | 78 | 3.8% |
| Indian (Asian) | 71 | 3.5% |
| Irish | 536 | 26.2% |
| Italian | 457 | 22.3% |
| Korean | 82 | 4.0% |
| Northern European | 13 | 0.6% |
| Norwegian | 36 | 1.8% |
| Polish | 71 | 3.5% |
| Portuguese | 17 | 0.8% |
| Puerto Rican | 24 | 1.2% |
| Russian | 31 | 1.5% |
| Scotch-Irish | 9 | 0.4% |
| Scottish | 53 | 2.6% |
| Slovak | 13 | 0.6% |
| Spaniard | 69 | 3.4% |
| Spanish | 74 | 3.6% |
| Swiss | 20 | 1.0% |
| Thai | 16 | 0.8% |
| Yugoslavian | 14 | 0.7% | View All 34 Rows |
Immigrants in Long Valley
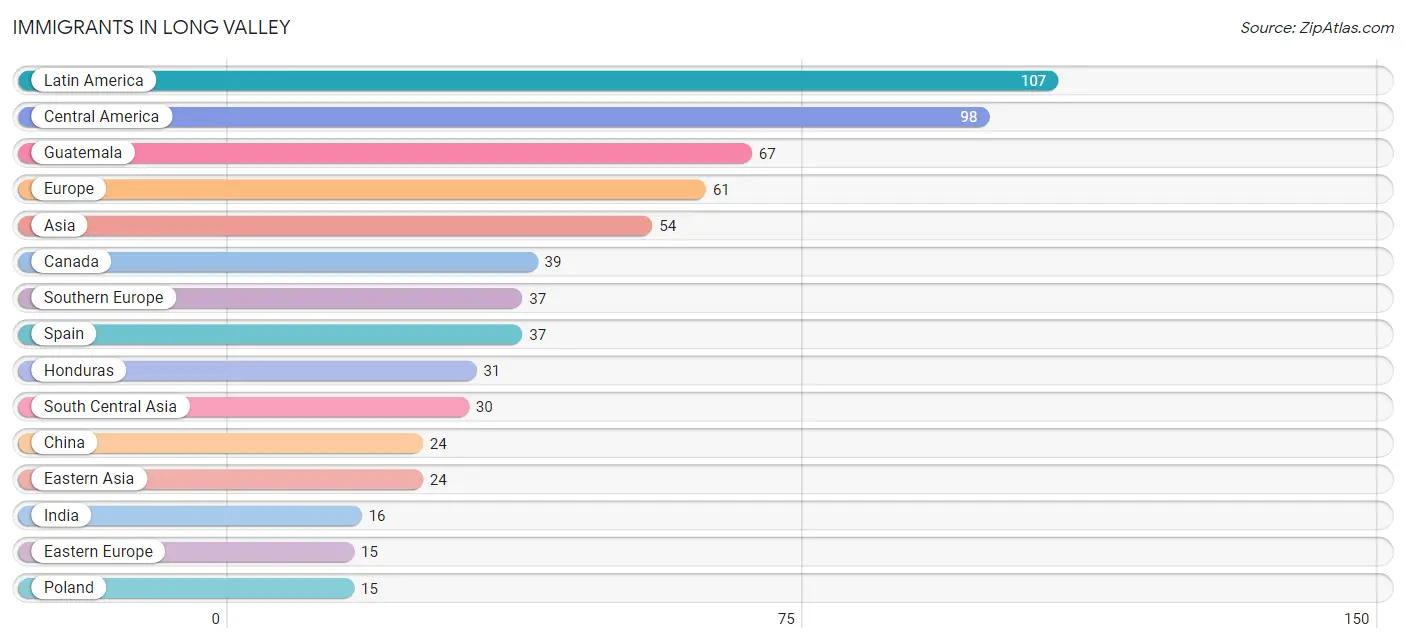
The most numerous immigrant groups reported in Long Valley came from Latin America (107 | 5.2%), Central America (98 | 4.8%), Guatemala (67 | 3.3%), Europe (61 | 3.0%), and Asia (54 | 2.6%), together accounting for 18.9% of all Long Valley residents.
| Immigration Origin | # Population | % Population |
| Africa | 8 | 0.4% |
| Asia | 54 | 2.6% |
| Brazil | 9 | 0.4% |
| Canada | 39 | 1.9% |
| Central America | 98 | 4.8% |
| China | 24 | 1.2% |
| Eastern Asia | 24 | 1.2% |
| Eastern Europe | 15 | 0.7% |
| Europe | 61 | 3.0% |
| France | 9 | 0.4% |
| Guatemala | 67 | 3.3% |
| Honduras | 31 | 1.5% |
| India | 16 | 0.8% |
| Latin America | 107 | 5.2% |
| Middle Africa | 8 | 0.4% |
| Poland | 15 | 0.7% |
| South America | 9 | 0.4% |
| South Central Asia | 30 | 1.5% |
| Southern Europe | 37 | 1.8% |
| Spain | 37 | 1.8% |
| Uzbekistan | 14 | 0.7% |
| Western Europe | 9 | 0.4% |
| Zaire | 8 | 0.4% | View All 23 Rows |
Sex and Age in Long Valley
Sex and Age in Long Valley
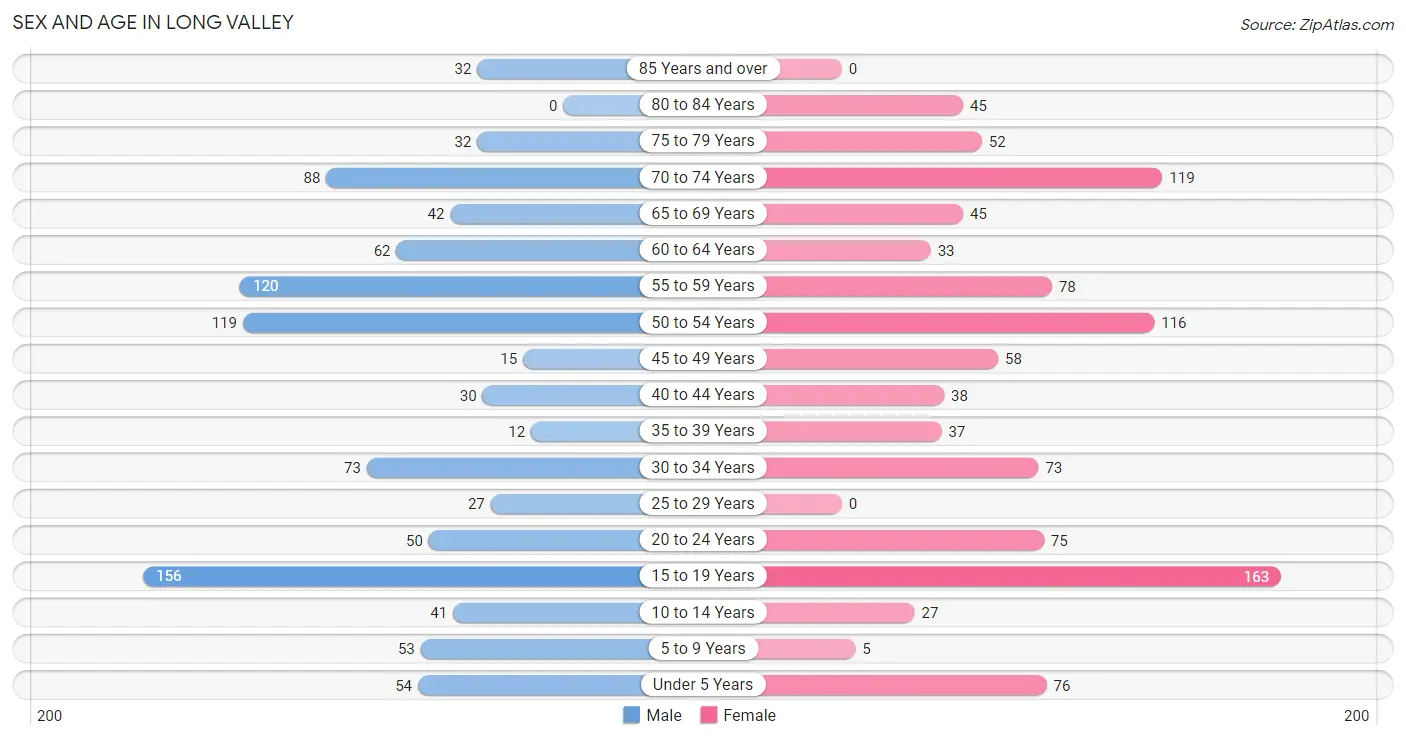
The most populous age groups in Long Valley are 15 to 19 Years (156 | 15.5%) for men and 15 to 19 Years (163 | 15.7%) for women.
| Age Bracket | Male | Female |
| Under 5 Years | 54 (5.4%) | 76 (7.3%) |
| 5 to 9 Years | 53 (5.3%) | 5 (0.5%) |
| 10 to 14 Years | 41 (4.1%) | 27 (2.6%) |
| 15 to 19 Years | 156 (15.5%) | 163 (15.7%) |
| 20 to 24 Years | 50 (5.0%) | 75 (7.2%) |
| 25 to 29 Years | 27 (2.7%) | 0 (0.0%) |
| 30 to 34 Years | 73 (7.3%) | 73 (7.0%) |
| 35 to 39 Years | 12 (1.2%) | 37 (3.6%) |
| 40 to 44 Years | 30 (3.0%) | 38 (3.6%) |
| 45 to 49 Years | 15 (1.5%) | 58 (5.6%) |
| 50 to 54 Years | 119 (11.8%) | 116 (11.2%) |
| 55 to 59 Years | 120 (11.9%) | 78 (7.5%) |
| 60 to 64 Years | 62 (6.2%) | 33 (3.2%) |
| 65 to 69 Years | 42 (4.2%) | 45 (4.3%) |
| 70 to 74 Years | 88 (8.7%) | 119 (11.4%) |
| 75 to 79 Years | 32 (3.2%) | 52 (5.0%) |
| 80 to 84 Years | 0 (0.0%) | 45 (4.3%) |
| 85 Years and over | 32 (3.2%) | 0 (0.0%) |
| Total | 1,006 (100.0%) | 1,040 (100.0%) |
Families and Households in Long Valley
Median Family Size in Long Valley
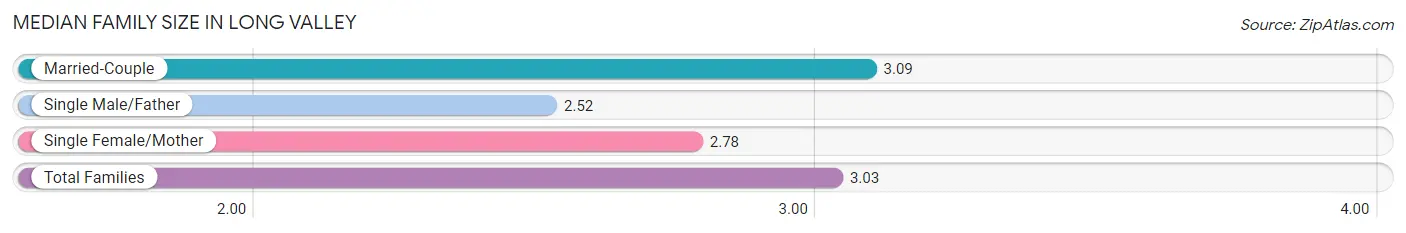
The median family size in Long Valley is 3.03 persons per family, with married-couple families (532 | 85.5%) accounting for the largest median family size of 3.09 persons per family. On the other hand, single male/father families (54 | 8.7%) represent the smallest median family size with 2.52 persons per family.
| Family Type | # Families | Family Size |
| Married-Couple | 532 (85.5%) | 3.09 |
| Single Male/Father | 54 (8.7%) | 2.52 |
| Single Female/Mother | 36 (5.8%) | 2.78 |
| Total Families | 622 (100.0%) | 3.03 |
Median Household Size in Long Valley
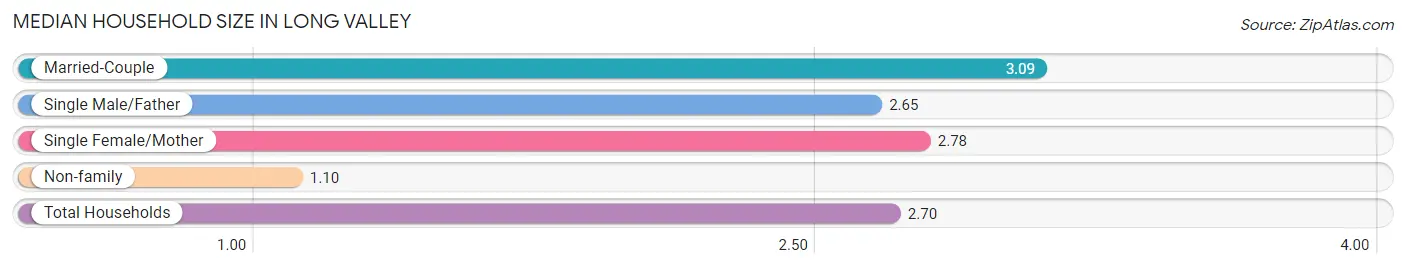
The median household size in Long Valley is 2.70 persons per household, with married-couple households (532 | 70.6%) accounting for the largest median household size of 3.09 persons per household. non-family households (132 | 17.5%) represent the smallest median household size with 1.10 persons per household.
| Household Type | # Households | Household Size |
| Married-Couple | 532 (70.6%) | 3.09 |
| Single Male/Father | 54 (7.2%) | 2.65 |
| Single Female/Mother | 36 (4.8%) | 2.78 |
| Non-family | 132 (17.5%) | 1.10 |
| Total Households | 754 (100.0%) | 2.70 |
Household Size by Marriage Status in Long Valley
Out of a total of 754 households in Long Valley, 622 (82.5%) are family households, while 132 (17.5%) are nonfamily households. The most numerous type of family households are 2-person households, comprising 311, and the most common type of nonfamily households are 1-person households, comprising 118.
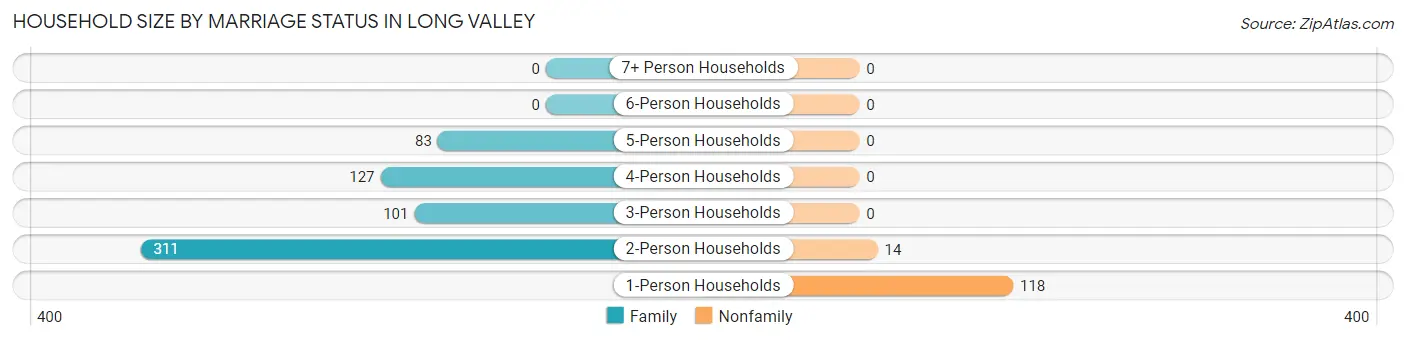
| Household Size | Family Households | Nonfamily Households |
| 1-Person Households | - | 118 (15.7%) |
| 2-Person Households | 311 (41.2%) | 14 (1.9%) |
| 3-Person Households | 101 (13.4%) | 0 (0.0%) |
| 4-Person Households | 127 (16.8%) | 0 (0.0%) |
| 5-Person Households | 83 (11.0%) | 0 (0.0%) |
| 6-Person Households | 0 (0.0%) | 0 (0.0%) |
| 7+ Person Households | 0 (0.0%) | 0 (0.0%) |
| Total | 622 (82.5%) | 132 (17.5%) |
Female Fertility in Long Valley
Fertility by Age in Long Valley
Average fertility rate in Long Valley is 153.0 births per 1,000 women. Women in the age bracket of 20 to 34 years have the highest fertility rate with 345.0 births per 1,000 women. Women in the age bracket of 20 to 34 years acount for 75.0% of all women with births.
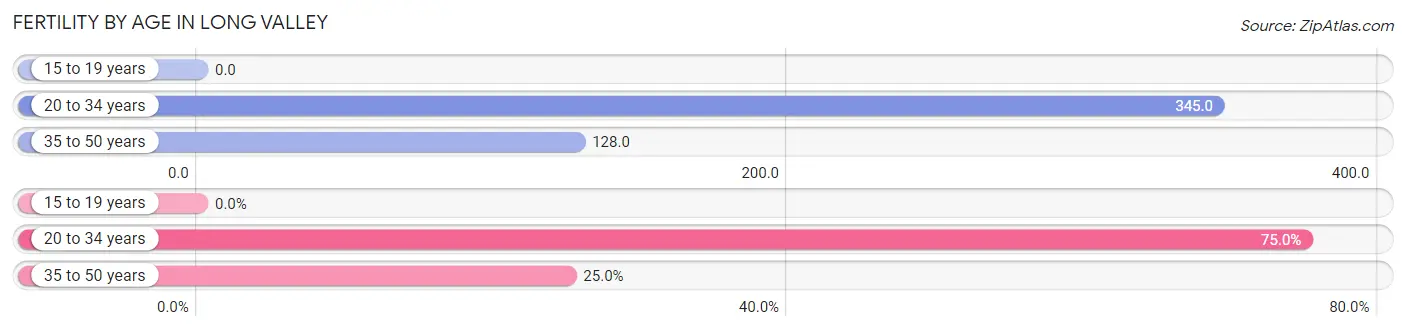
| Age Bracket | Women with Births | Births / 1,000 Women |
| 15 to 19 years | 0 (0.0%) | 0.0 |
| 20 to 34 years | 51 (75.0%) | 345.0 |
| 35 to 50 years | 17 (25.0%) | 128.0 |
| Total | 68 (100.0%) | 153.0 |
Fertility by Age by Marriage Status in Long Valley
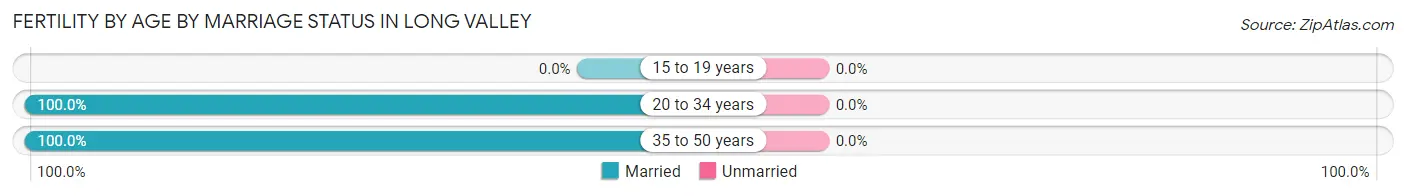
| Age Bracket | Married | Unmarried |
| 15 to 19 years | 0 (0.0%) | 0 (0.0%) |
| 20 to 34 years | 51 (100.0%) | 0 (0.0%) |
| 35 to 50 years | 17 (100.0%) | 0 (0.0%) |
| Total | 68 (100.0%) | 0 (0.0%) |
Fertility by Education in Long Valley
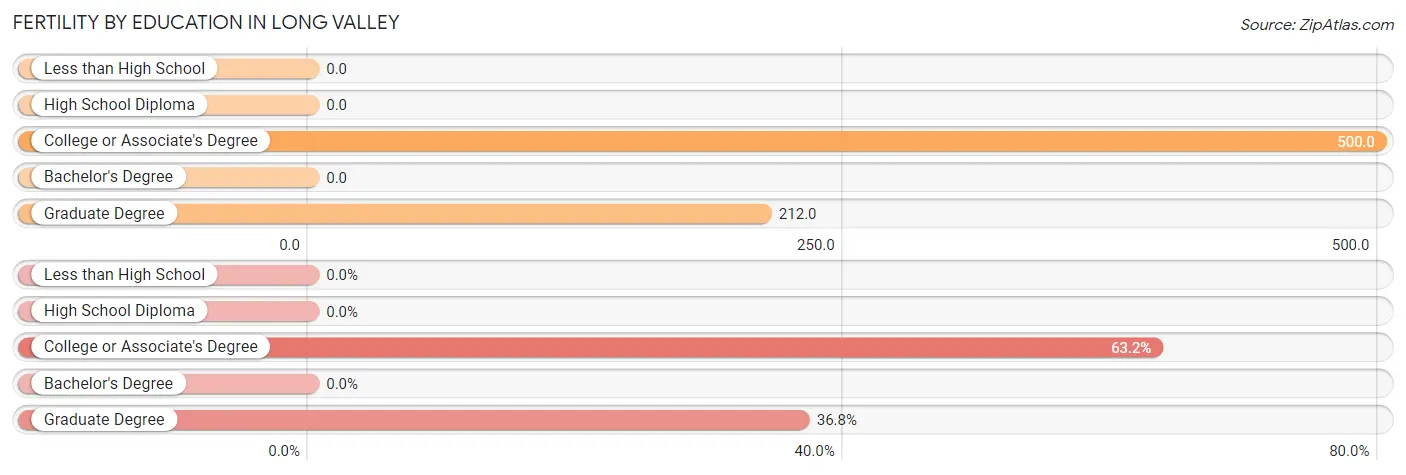
| Educational Attainment | Women with Births | Births / 1,000 Women |
| Less than High School | 0 (0.0%) | 0.0 |
| High School Diploma | 0 (0.0%) | 0.0 |
| College or Associate's Degree | 43 (63.2%) | 500.0 |
| Bachelor's Degree | 0 (0.0%) | 0.0 |
| Graduate Degree | 25 (36.8%) | 212.0 |
| Total | 68 (100.0%) | 153.0 |
Fertility by Education by Marriage Status in Long Valley
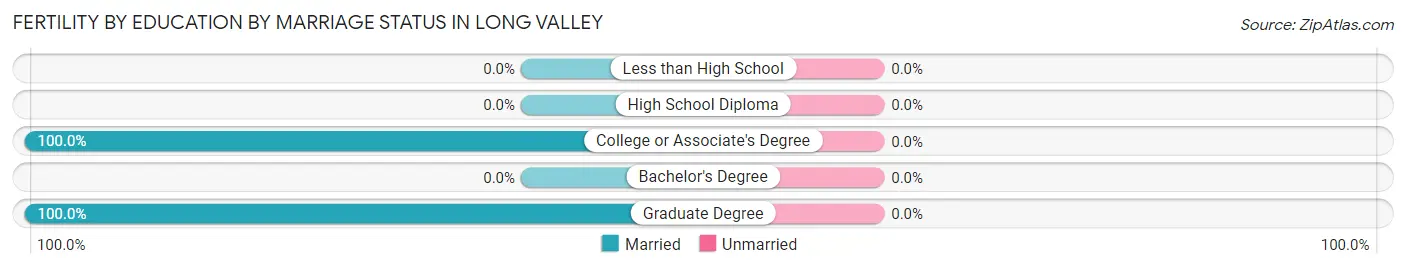
| Educational Attainment | Married | Unmarried |
| Less than High School | 0 (0.0%) | 0 (0.0%) |
| High School Diploma | 0 (0.0%) | 0 (0.0%) |
| College or Associate's Degree | 43 (100.0%) | 0 (0.0%) |
| Bachelor's Degree | 0 (0.0%) | 0 (0.0%) |
| Graduate Degree | 25 (100.0%) | 0 (0.0%) |
| Total | 68 (100.0%) | 0 (0.0%) |
Employment Characteristics in Long Valley
Employment by Class of Employer in Long Valley
Among the 945 employed individuals in Long Valley, private company employees (599 | 63.4%), not-for-profit organizations (115 | 12.2%), and self-employed (not incorporated) (86 | 9.1%) make up the most common classes of employment.
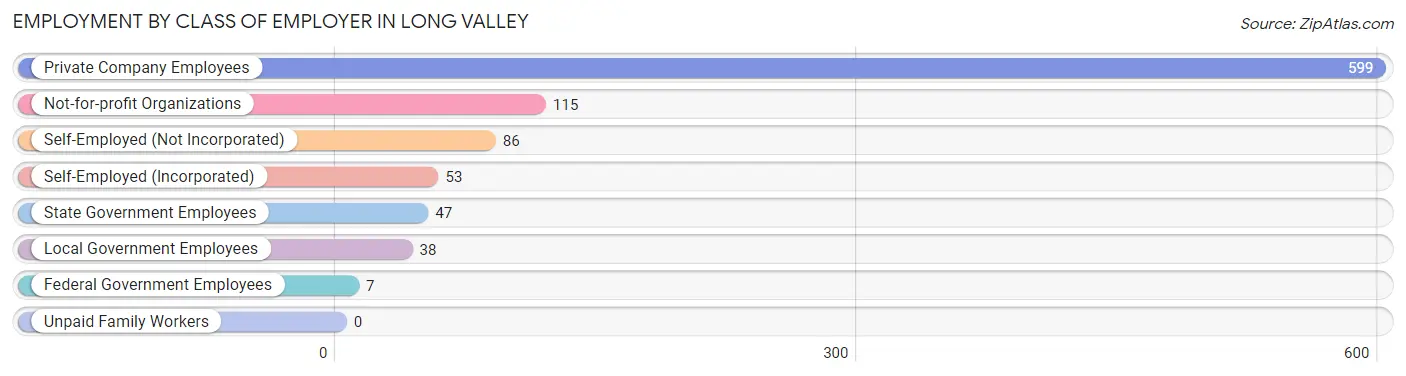
| Employer Class | # Employees | % Employees |
| Private Company Employees | 599 | 63.4% |
| Self-Employed (Incorporated) | 53 | 5.6% |
| Self-Employed (Not Incorporated) | 86 | 9.1% |
| Not-for-profit Organizations | 115 | 12.2% |
| Local Government Employees | 38 | 4.0% |
| State Government Employees | 47 | 5.0% |
| Federal Government Employees | 7 | 0.7% |
| Unpaid Family Workers | 0 | 0.0% |
| Total | 945 | 100.0% |
Employment Status by Age in Long Valley
According to the labor force statistics for Long Valley, out of the total population over 16 years of age (1,696), 59.4% or 1,007 individuals are in the labor force, with 4.5% or 45 of them unemployed. The age group with the highest labor force participation rate is 20 to 24 years, with 100.0% or 125 individuals in the labor force. Within the labor force, the 45 to 54 years age range has the highest percentage of unemployed individuals, with 10.8% or 29 of them being unemployed.
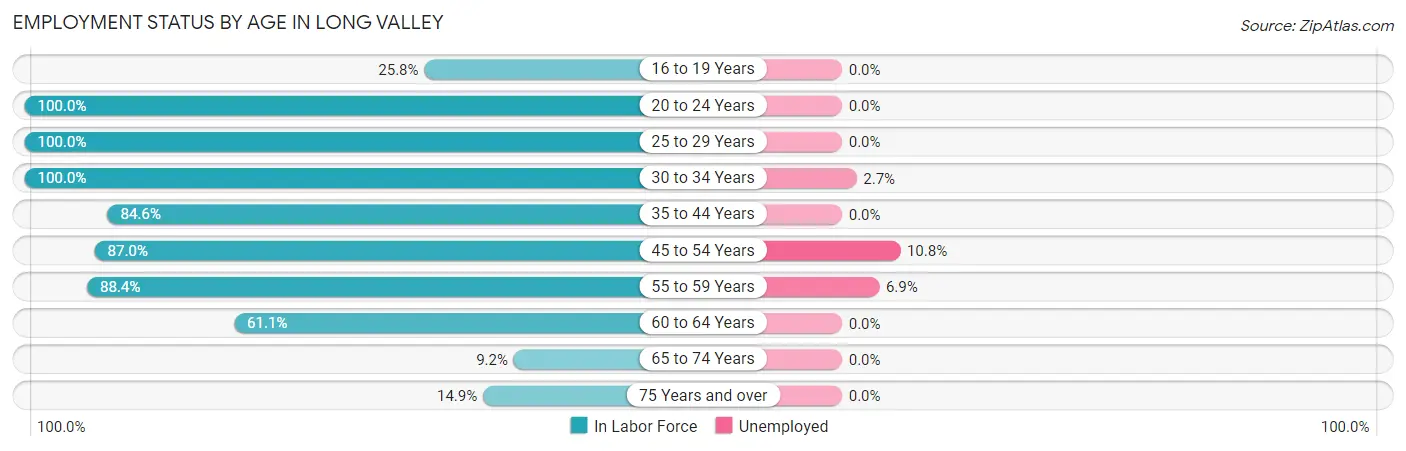
| Age Bracket | In Labor Force | Unemployed |
| 16 to 19 Years | 58 (25.8%) | 0 (0.0%) |
| 20 to 24 Years | 125 (100.0%) | 0 (0.0%) |
| 25 to 29 Years | 27 (100.0%) | 0 (0.0%) |
| 30 to 34 Years | 146 (100.0%) | 4 (2.7%) |
| 35 to 44 Years | 99 (84.6%) | 0 (0.0%) |
| 45 to 54 Years | 268 (87.0%) | 29 (10.8%) |
| 55 to 59 Years | 175 (88.4%) | 12 (6.9%) |
| 60 to 64 Years | 58 (61.1%) | 0 (0.0%) |
| 65 to 74 Years | 27 (9.2%) | 0 (0.0%) |
| 75 Years and over | 24 (14.9%) | 0 (0.0%) |
| Total | 1,007 (59.4%) | 45 (4.5%) |
Employment Status by Educational Attainment in Long Valley
According to labor force statistics for Long Valley, 86.8% of individuals (773) out of the total population between 25 and 64 years of age (891) are in the labor force, with 5.8% or 45 of them being unemployed. The group with the highest labor force participation rate are those with the educational attainment of less than high school, with 100.0% or 40 individuals in the labor force. Within the labor force, individuals with high school diploma education have the highest percentage of unemployment, with 18.2% or 10 of them being unemployed.
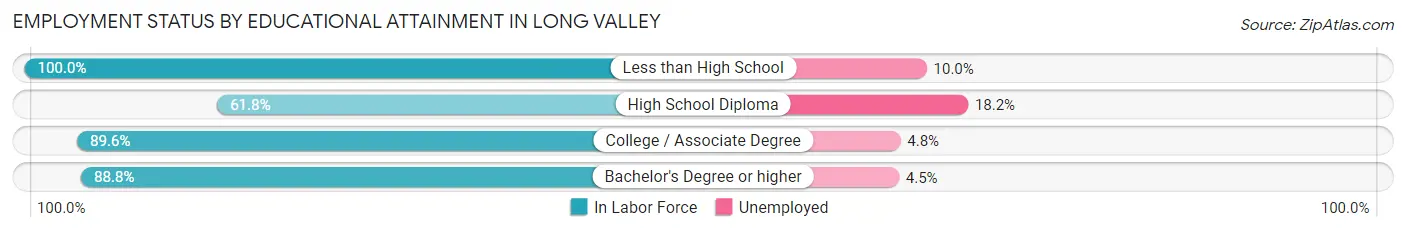
| Educational Attainment | In Labor Force | Unemployed |
| Less than High School | 40 (100.0%) | 4 (10.0%) |
| High School Diploma | 55 (61.8%) | 16 (18.2%) |
| College / Associate Degree | 146 (89.6%) | 8 (4.8%) |
| Bachelor's Degree or higher | 532 (88.8%) | 27 (4.5%) |
| Total | 773 (86.8%) | 52 (5.8%) |
Employment Occupations by Sex in Long Valley
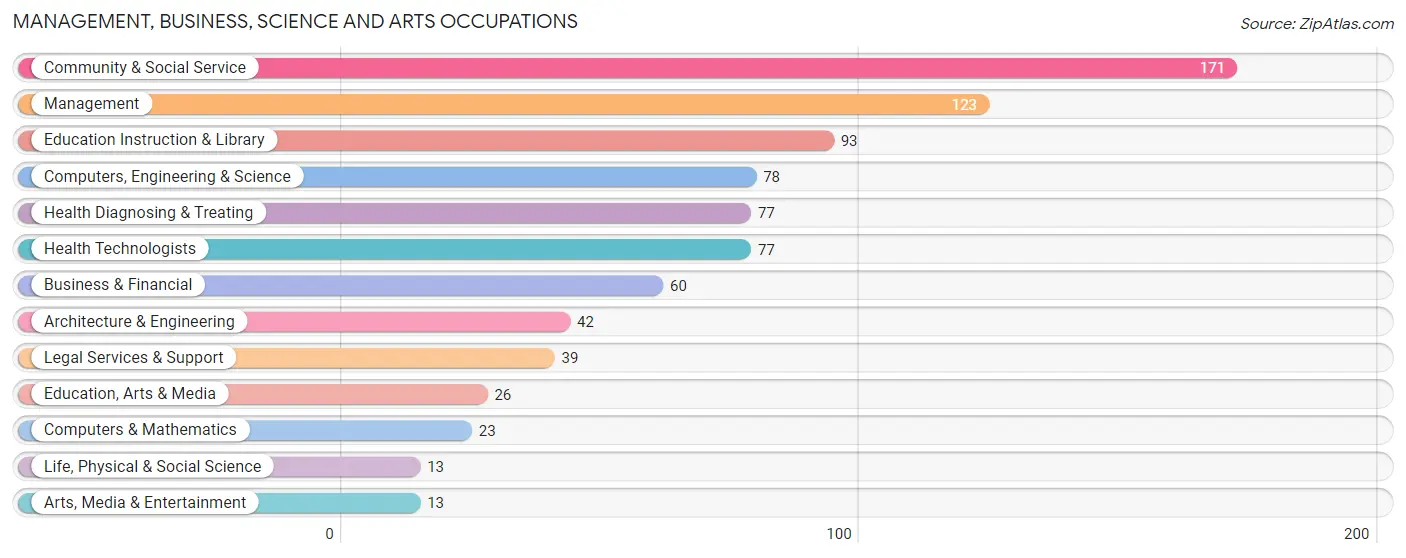
Management, Business, Science and Arts Occupations
The most common Management, Business, Science and Arts occupations in Long Valley are Community & Social Service (171 | 17.8%), Management (123 | 12.8%), Education Instruction & Library (93 | 9.7%), Computers, Engineering & Science (78 | 8.1%), and Health Diagnosing & Treating (77 | 8.0%).
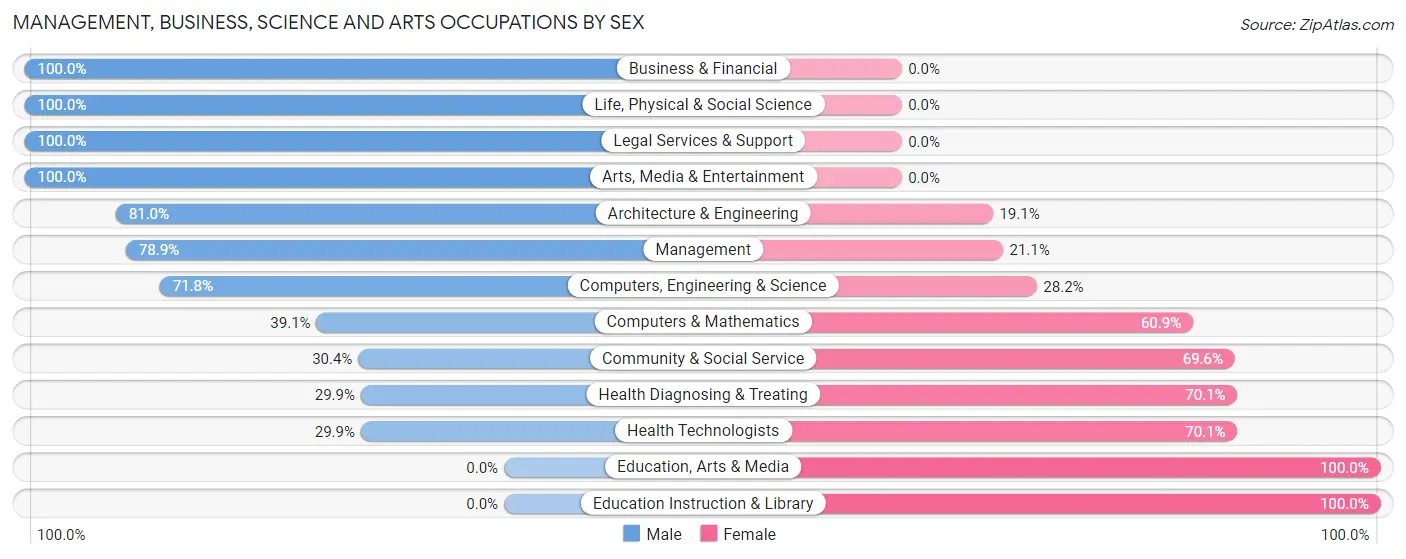
Management, Business, Science and Arts Occupations by Sex
Within the Management, Business, Science and Arts occupations in Long Valley, the most male-oriented occupations are Business & Financial (100.0%), Life, Physical & Social Science (100.0%), and Legal Services & Support (100.0%), while the most female-oriented occupations are Education, Arts & Media (100.0%), Education Instruction & Library (100.0%), and Health Diagnosing & Treating (70.1%).
| Occupation | Male | Female |
| Management | 97 (78.9%) | 26 (21.1%) |
| Business & Financial | 60 (100.0%) | 0 (0.0%) |
| Computers, Engineering & Science | 56 (71.8%) | 22 (28.2%) |
| Computers & Mathematics | 9 (39.1%) | 14 (60.9%) |
| Architecture & Engineering | 34 (80.9%) | 8 (19.1%) |
| Life, Physical & Social Science | 13 (100.0%) | 0 (0.0%) |
| Community & Social Service | 52 (30.4%) | 119 (69.6%) |
| Education, Arts & Media | 0 (0.0%) | 26 (100.0%) |
| Legal Services & Support | 39 (100.0%) | 0 (0.0%) |
| Education Instruction & Library | 0 (0.0%) | 93 (100.0%) |
| Arts, Media & Entertainment | 13 (100.0%) | 0 (0.0%) |
| Health Diagnosing & Treating | 23 (29.9%) | 54 (70.1%) |
| Health Technologists | 23 (29.9%) | 54 (70.1%) |
| Total (Category) | 288 (56.6%) | 221 (43.4%) |
| Total (Overall) | 495 (51.5%) | 467 (48.5%) |
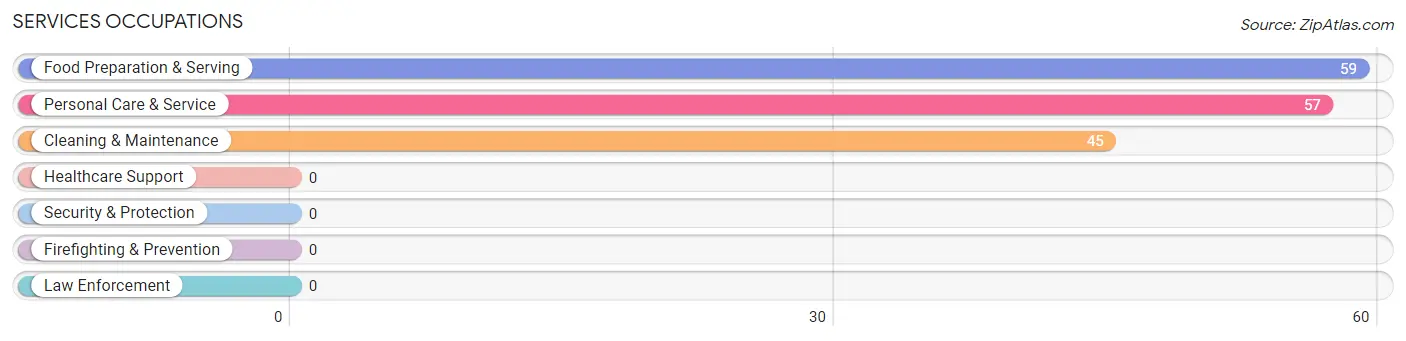
Services Occupations
The most common Services occupations in Long Valley are Food Preparation & Serving (59 | 6.1%), Personal Care & Service (57 | 5.9%), and Cleaning & Maintenance (45 | 4.7%).
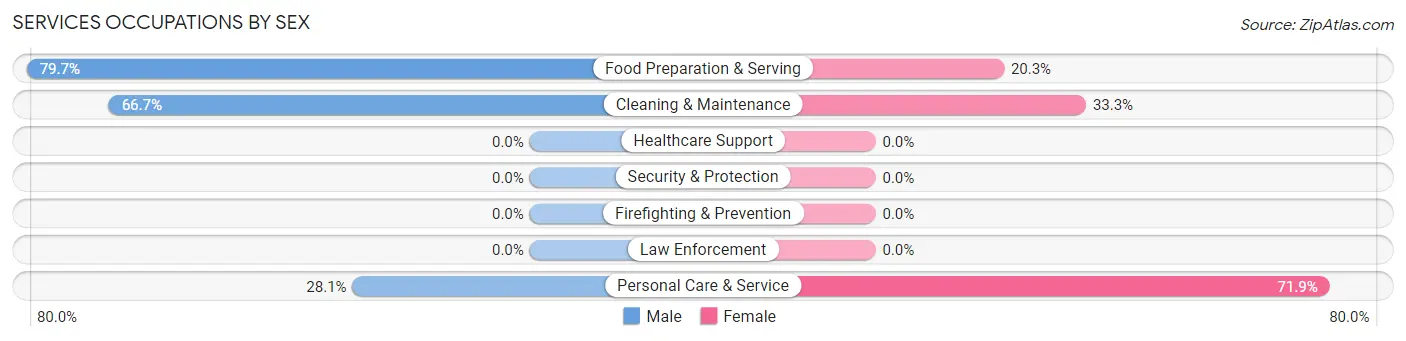
Services Occupations by Sex
Within the Services occupations in Long Valley, the most male-oriented occupations are Food Preparation & Serving (79.7%), Cleaning & Maintenance (66.7%), and Personal Care & Service (28.1%), while the most female-oriented occupations are Personal Care & Service (71.9%), Cleaning & Maintenance (33.3%), and Food Preparation & Serving (20.3%).
| Occupation | Male | Female |
| Healthcare Support | 0 (0.0%) | 0 (0.0%) |
| Security & Protection | 0 (0.0%) | 0 (0.0%) |
| Firefighting & Prevention | 0 (0.0%) | 0 (0.0%) |
| Law Enforcement | 0 (0.0%) | 0 (0.0%) |
| Food Preparation & Serving | 47 (79.7%) | 12 (20.3%) |
| Cleaning & Maintenance | 30 (66.7%) | 15 (33.3%) |
| Personal Care & Service | 16 (28.1%) | 41 (71.9%) |
| Total (Category) | 93 (57.8%) | 68 (42.2%) |
| Total (Overall) | 495 (51.5%) | 467 (48.5%) |
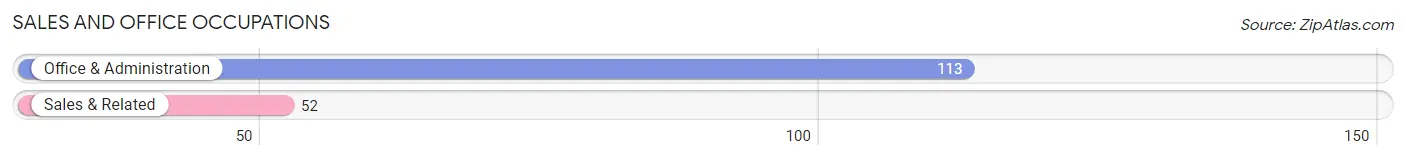
Sales and Office Occupations
The most common Sales and Office occupations in Long Valley are Office & Administration (113 | 11.7%), and Sales & Related (52 | 5.4%).
Sales and Office Occupations by Sex
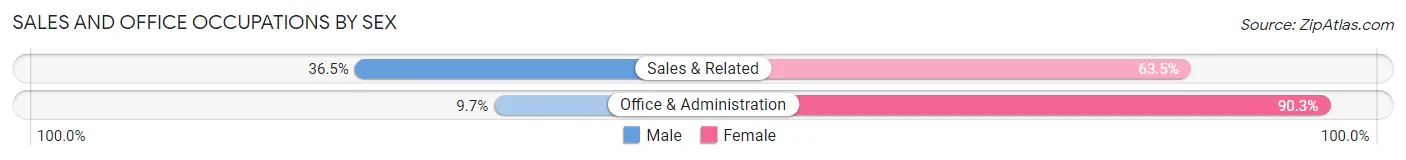
| Occupation | Male | Female |
| Sales & Related | 19 (36.5%) | 33 (63.5%) |
| Office & Administration | 11 (9.7%) | 102 (90.3%) |
| Total (Category) | 30 (18.2%) | 135 (81.8%) |
| Total (Overall) | 495 (51.5%) | 467 (48.5%) |
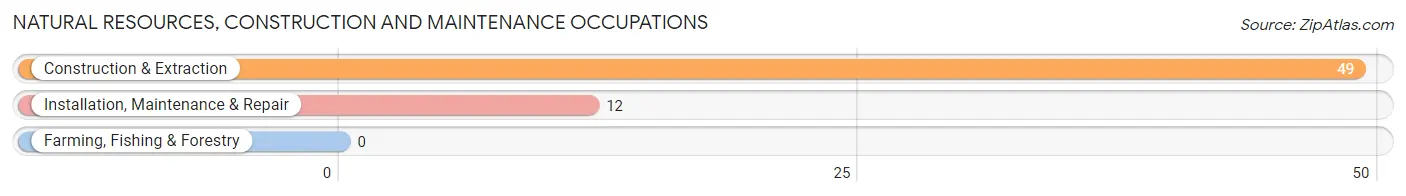
Natural Resources, Construction and Maintenance Occupations
The most common Natural Resources, Construction and Maintenance occupations in Long Valley are Construction & Extraction (49 | 5.1%), and Installation, Maintenance & Repair (12 | 1.3%).
Natural Resources, Construction and Maintenance Occupations by Sex
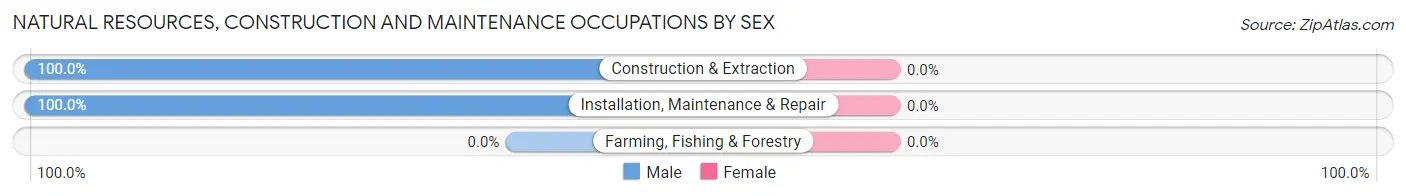
| Occupation | Male | Female |
| Farming, Fishing & Forestry | 0 (0.0%) | 0 (0.0%) |
| Construction & Extraction | 49 (100.0%) | 0 (0.0%) |
| Installation, Maintenance & Repair | 12 (100.0%) | 0 (0.0%) |
| Total (Category) | 61 (100.0%) | 0 (0.0%) |
| Total (Overall) | 495 (51.5%) | 467 (48.5%) |
Production, Transportation and Moving Occupations
The most common Production, Transportation and Moving occupations in Long Valley are Transportation (51 | 5.3%), and Production (15 | 1.6%).
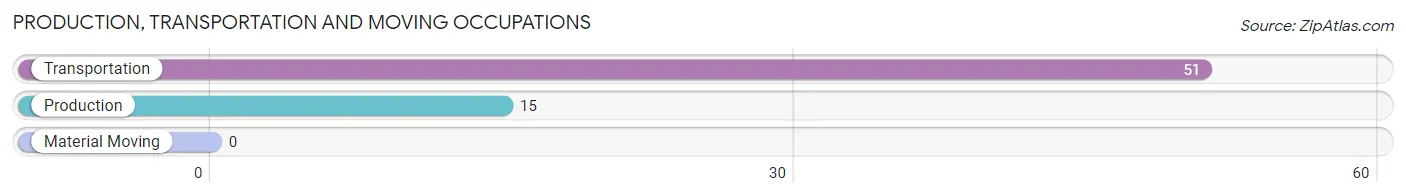
Production, Transportation and Moving Occupations by Sex
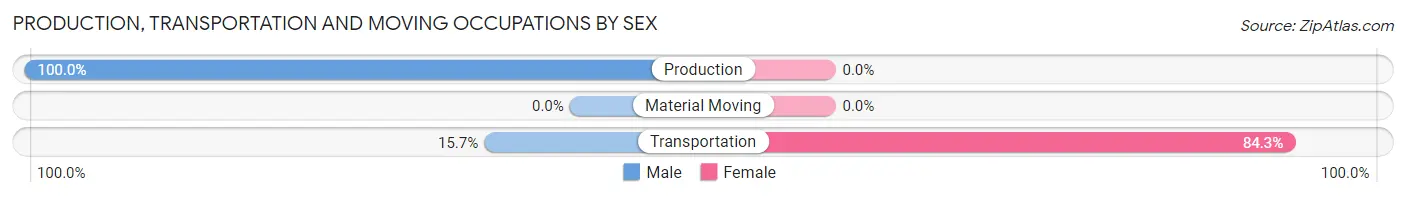
| Occupation | Male | Female |
| Production | 15 (100.0%) | 0 (0.0%) |
| Transportation | 8 (15.7%) | 43 (84.3%) |
| Material Moving | 0 (0.0%) | 0 (0.0%) |
| Total (Category) | 23 (34.8%) | 43 (65.1%) |
| Total (Overall) | 495 (51.5%) | 467 (48.5%) |
Employment Industries by Sex in Long Valley
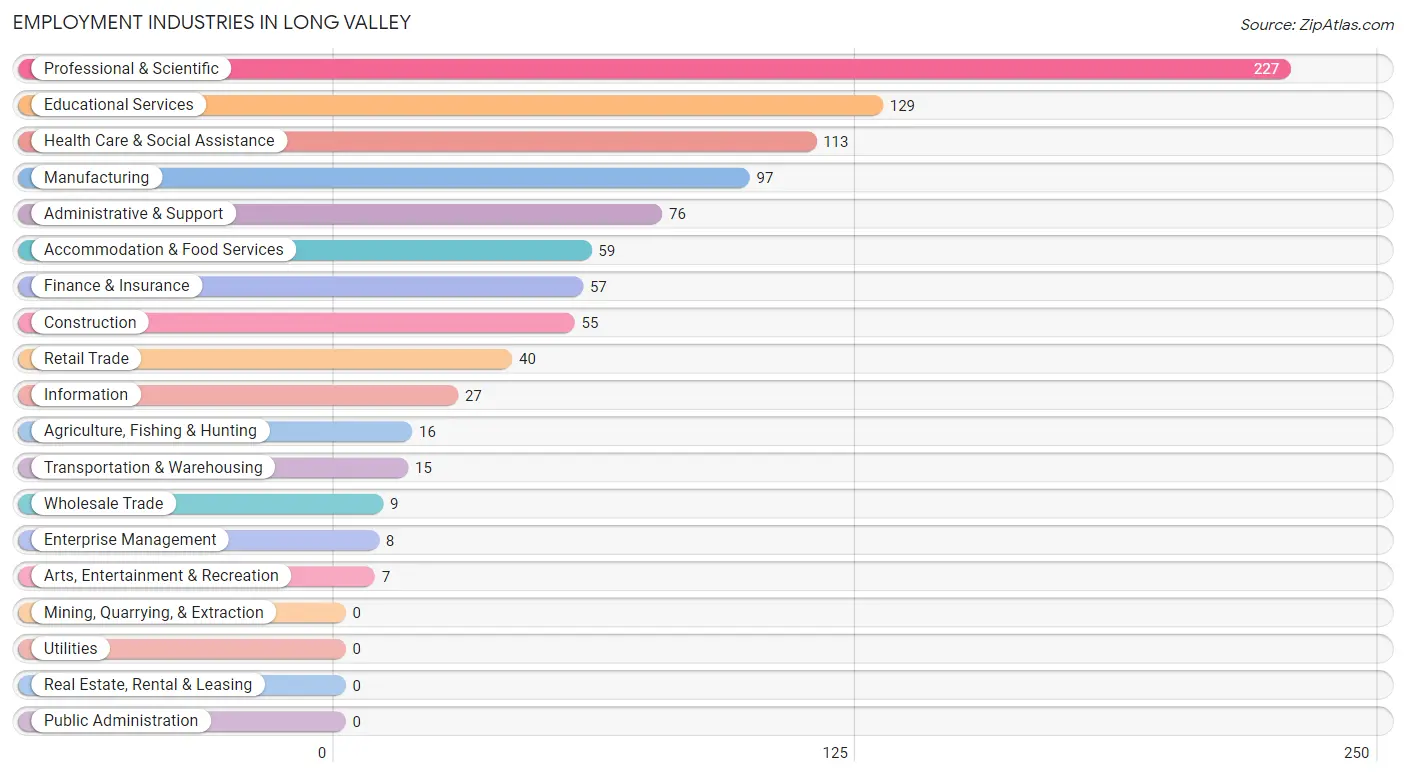
Employment Industries in Long Valley
The major employment industries in Long Valley include Professional & Scientific (227 | 23.6%), Educational Services (129 | 13.4%), Health Care & Social Assistance (113 | 11.7%), Manufacturing (97 | 10.1%), and Administrative & Support (76 | 7.9%).
Employment Industries by Sex in Long Valley
The Long Valley industries that see more men than women are Agriculture, Fishing & Hunting (100.0%), Construction (100.0%), and Wholesale Trade (100.0%), whereas the industries that tend to have a higher number of women are Educational Services (100.0%), Arts, Entertainment & Recreation (100.0%), and Health Care & Social Assistance (79.6%).
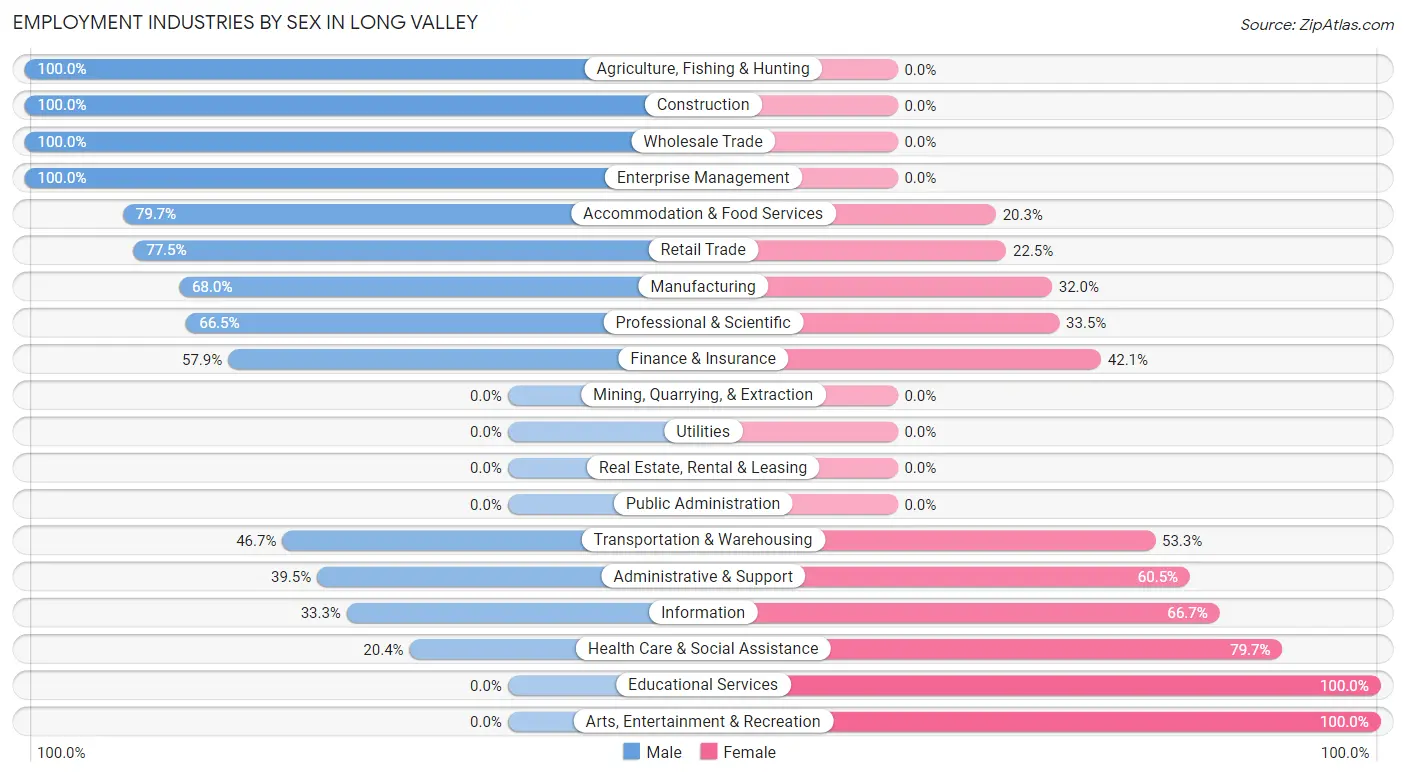
| Industry | Male | Female |
| Agriculture, Fishing & Hunting | 16 (100.0%) | 0 (0.0%) |
| Mining, Quarrying, & Extraction | 0 (0.0%) | 0 (0.0%) |
| Construction | 55 (100.0%) | 0 (0.0%) |
| Manufacturing | 66 (68.0%) | 31 (32.0%) |
| Wholesale Trade | 9 (100.0%) | 0 (0.0%) |
| Retail Trade | 31 (77.5%) | 9 (22.5%) |
| Transportation & Warehousing | 7 (46.7%) | 8 (53.3%) |
| Utilities | 0 (0.0%) | 0 (0.0%) |
| Information | 9 (33.3%) | 18 (66.7%) |
| Finance & Insurance | 33 (57.9%) | 24 (42.1%) |
| Real Estate, Rental & Leasing | 0 (0.0%) | 0 (0.0%) |
| Professional & Scientific | 151 (66.5%) | 76 (33.5%) |
| Enterprise Management | 8 (100.0%) | 0 (0.0%) |
| Administrative & Support | 30 (39.5%) | 46 (60.5%) |
| Educational Services | 0 (0.0%) | 129 (100.0%) |
| Health Care & Social Assistance | 23 (20.3%) | 90 (79.6%) |
| Arts, Entertainment & Recreation | 0 (0.0%) | 7 (100.0%) |
| Accommodation & Food Services | 47 (79.7%) | 12 (20.3%) |
| Public Administration | 0 (0.0%) | 0 (0.0%) |
| Total | 495 (51.5%) | 467 (48.5%) |
Education in Long Valley
School Enrollment in Long Valley
The most common levels of schooling among the 484 students in Long Valley are high school (274 | 56.6%), middle school (60 | 12.4%), and college / undergraduate (60 | 12.4%).
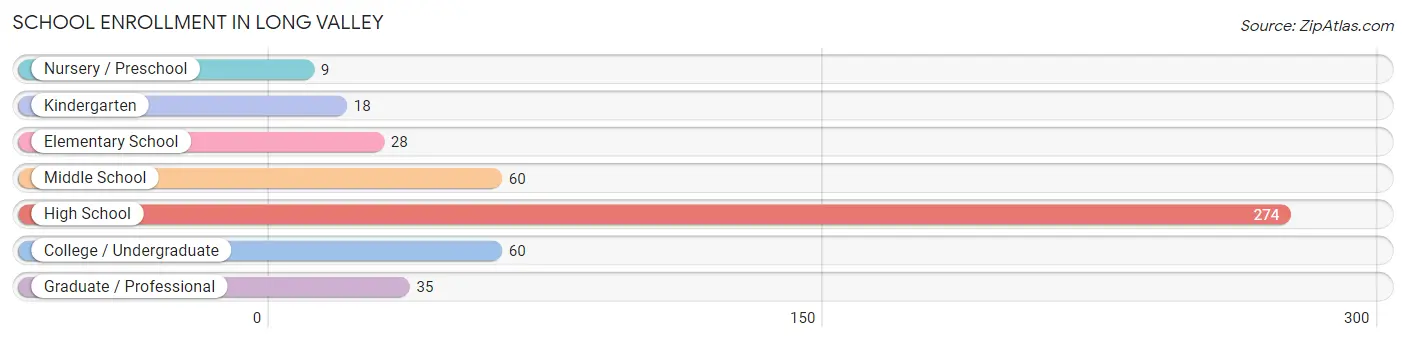
| School Level | # Students | % Students |
| Nursery / Preschool | 9 | 1.9% |
| Kindergarten | 18 | 3.7% |
| Elementary School | 28 | 5.8% |
| Middle School | 60 | 12.4% |
| High School | 274 | 56.6% |
| College / Undergraduate | 60 | 12.4% |
| Graduate / Professional | 35 | 7.2% |
| Total | 484 | 100.0% |
School Enrollment by Age by Funding Source in Long Valley
Out of a total of 484 students who are enrolled in schools in Long Valley, 111 (22.9%) attend a private institution, while the remaining 373 (77.1%) are enrolled in public schools. The age group of 3 to 4 year olds has the highest likelihood of being enrolled in private schools, with 9 (100.0% in the age bracket) enrolled. Conversely, the age group of 15 to 17 year olds has the lowest likelihood of being enrolled in a private school, with 274 (100.0% in the age bracket) attending a public institution.
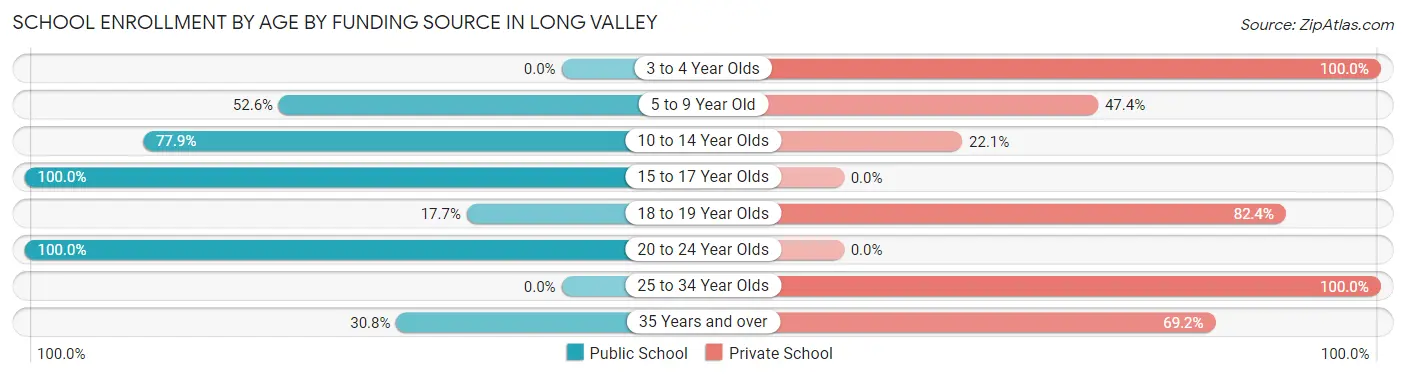
| Age Bracket | Public School | Private School |
| 3 to 4 Year Olds | 0 (0.0%) | 9 (100.0%) |
| 5 to 9 Year Old | 20 (52.6%) | 18 (47.4%) |
| 10 to 14 Year Olds | 53 (77.9%) | 15 (22.1%) |
| 15 to 17 Year Olds | 274 (100.0%) | 0 (0.0%) |
| 18 to 19 Year Olds | 6 (17.6%) | 28 (82.4%) |
| 20 to 24 Year Olds | 12 (100.0%) | 0 (0.0%) |
| 25 to 34 Year Olds | 0 (0.0%) | 23 (100.0%) |
| 35 Years and over | 8 (30.8%) | 18 (69.2%) |
| Total | 373 (77.1%) | 111 (22.9%) |
Educational Attainment by Field of Study in Long Valley
Computers & mathematics (112 | 13.5%), science & technology (98 | 11.8%), education (83 | 10.0%), business (82 | 9.9%), and communications (82 | 9.9%) are the most common fields of study among 830 individuals in Long Valley who have obtained a bachelor's degree or higher.
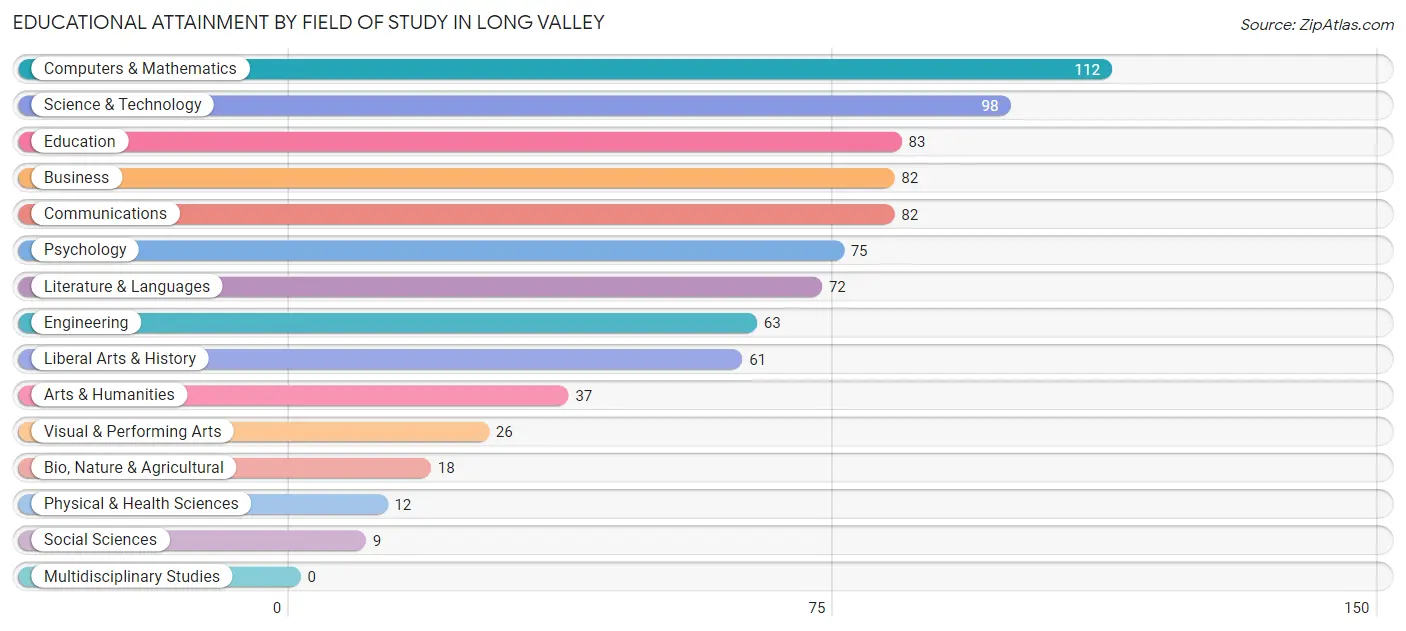
| Field of Study | # Graduates | % Graduates |
| Computers & Mathematics | 112 | 13.5% |
| Bio, Nature & Agricultural | 18 | 2.2% |
| Physical & Health Sciences | 12 | 1.5% |
| Psychology | 75 | 9.0% |
| Social Sciences | 9 | 1.1% |
| Engineering | 63 | 7.6% |
| Multidisciplinary Studies | 0 | 0.0% |
| Science & Technology | 98 | 11.8% |
| Business | 82 | 9.9% |
| Education | 83 | 10.0% |
| Literature & Languages | 72 | 8.7% |
| Liberal Arts & History | 61 | 7.3% |
| Visual & Performing Arts | 26 | 3.1% |
| Communications | 82 | 9.9% |
| Arts & Humanities | 37 | 4.5% |
| Total | 830 | 100.0% |
Transportation & Commute in Long Valley
Vehicle Availability by Sex in Long Valley
The most prevalent vehicle ownership categories in Long Valley are males with 3 vehicles (196, accounting for 39.6%) and females with 3 vehicles (156, making up 44.1%).
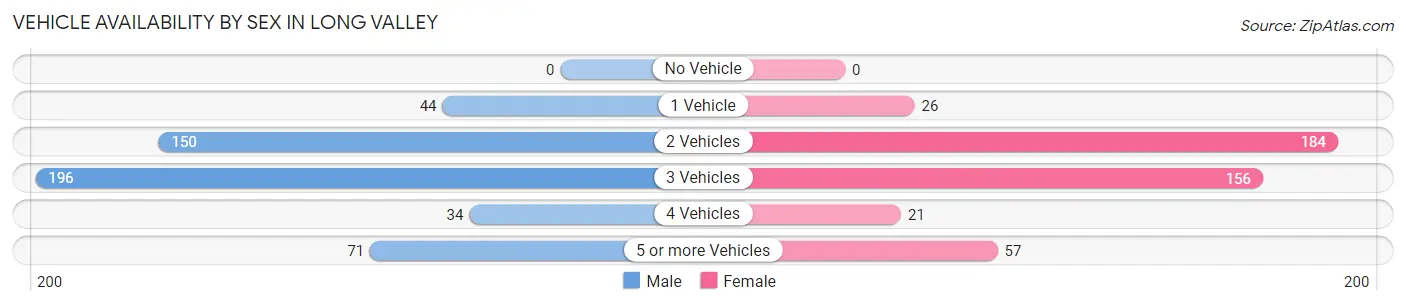
| Vehicles Available | Male | Female |
| No Vehicle | 0 (0.0%) | 0 (0.0%) |
| 1 Vehicle | 44 (8.9%) | 26 (5.9%) |
| 2 Vehicles | 150 (30.3%) | 184 (41.4%) |
| 3 Vehicles | 196 (39.6%) | 156 (35.1%) |
| 4 Vehicles | 34 (6.9%) | 21 (4.7%) |
| 5 or more Vehicles | 71 (14.3%) | 57 (12.8%) |
| Total | 495 (100.0%) | 444 (100.0%) |
Commute Time in Long Valley
The most frequently occuring commute durations in Long Valley are 45 to 59 minutes (163 commuters, 20.2%), 60 to 89 minutes (118 commuters, 14.6%), and 35 to 39 minutes (88 commuters, 10.9%).
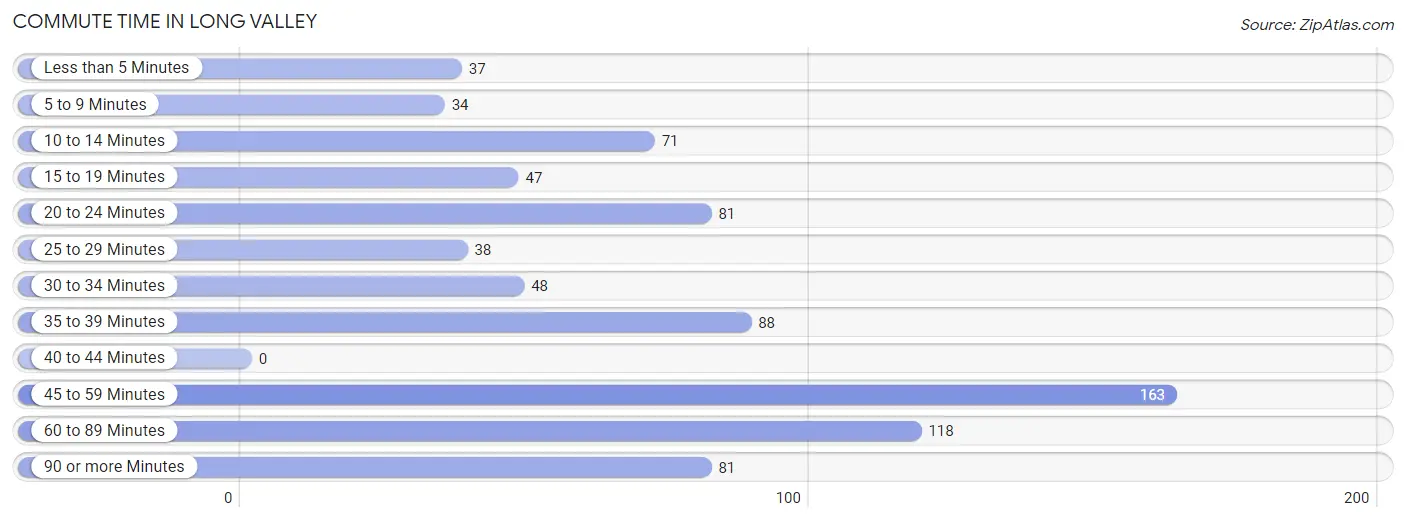
| Commute Time | # Commuters | % Commuters |
| Less than 5 Minutes | 37 | 4.6% |
| 5 to 9 Minutes | 34 | 4.2% |
| 10 to 14 Minutes | 71 | 8.8% |
| 15 to 19 Minutes | 47 | 5.8% |
| 20 to 24 Minutes | 81 | 10.1% |
| 25 to 29 Minutes | 38 | 4.7% |
| 30 to 34 Minutes | 48 | 6.0% |
| 35 to 39 Minutes | 88 | 10.9% |
| 40 to 44 Minutes | 0 | 0.0% |
| 45 to 59 Minutes | 163 | 20.2% |
| 60 to 89 Minutes | 118 | 14.6% |
| 90 or more Minutes | 81 | 10.1% |
Commute Time by Sex in Long Valley
The most common commute times in Long Valley are 45 to 59 minutes (112 commuters, 26.7%) for males and 10 to 14 minutes (71 commuters, 18.4%) for females.
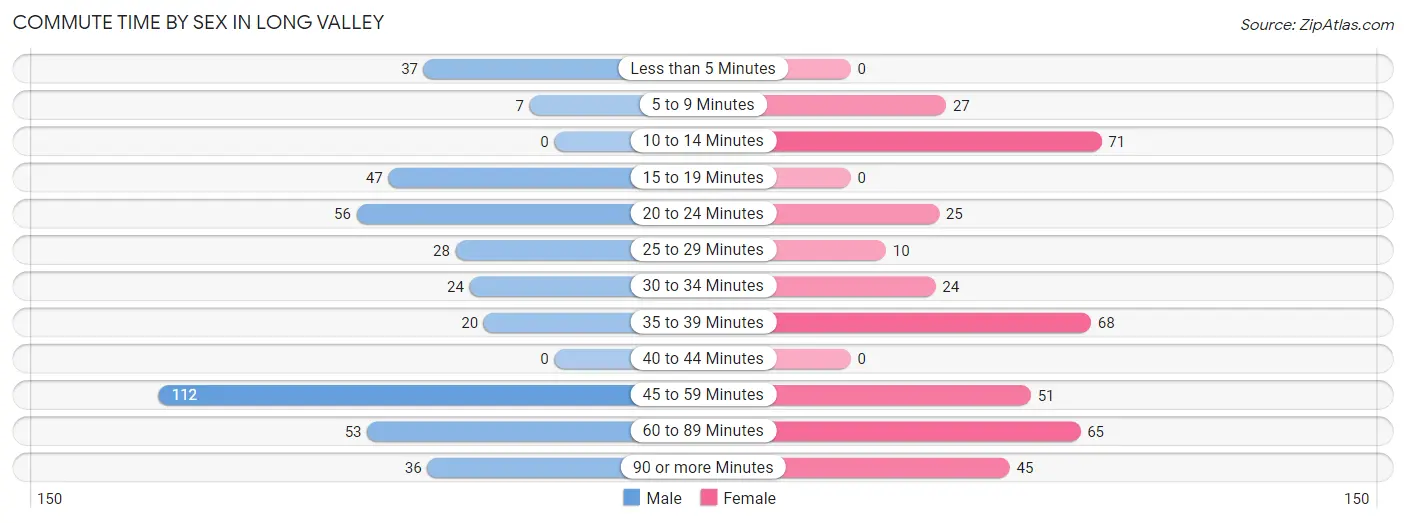
| Commute Time | Male | Female |
| Less than 5 Minutes | 37 (8.8%) | 0 (0.0%) |
| 5 to 9 Minutes | 7 (1.7%) | 27 (7.0%) |
| 10 to 14 Minutes | 0 (0.0%) | 71 (18.4%) |
| 15 to 19 Minutes | 47 (11.2%) | 0 (0.0%) |
| 20 to 24 Minutes | 56 (13.3%) | 25 (6.5%) |
| 25 to 29 Minutes | 28 (6.7%) | 10 (2.6%) |
| 30 to 34 Minutes | 24 (5.7%) | 24 (6.2%) |
| 35 to 39 Minutes | 20 (4.8%) | 68 (17.6%) |
| 40 to 44 Minutes | 0 (0.0%) | 0 (0.0%) |
| 45 to 59 Minutes | 112 (26.7%) | 51 (13.2%) |
| 60 to 89 Minutes | 53 (12.6%) | 65 (16.8%) |
| 90 or more Minutes | 36 (8.6%) | 45 (11.7%) |
Time of Departure to Work by Sex in Long Valley
The most frequent times of departure to work in Long Valley are 8:00 AM to 8:29 AM (76, 18.1%) for males and 7:00 AM to 7:29 AM (89, 23.1%) for females.
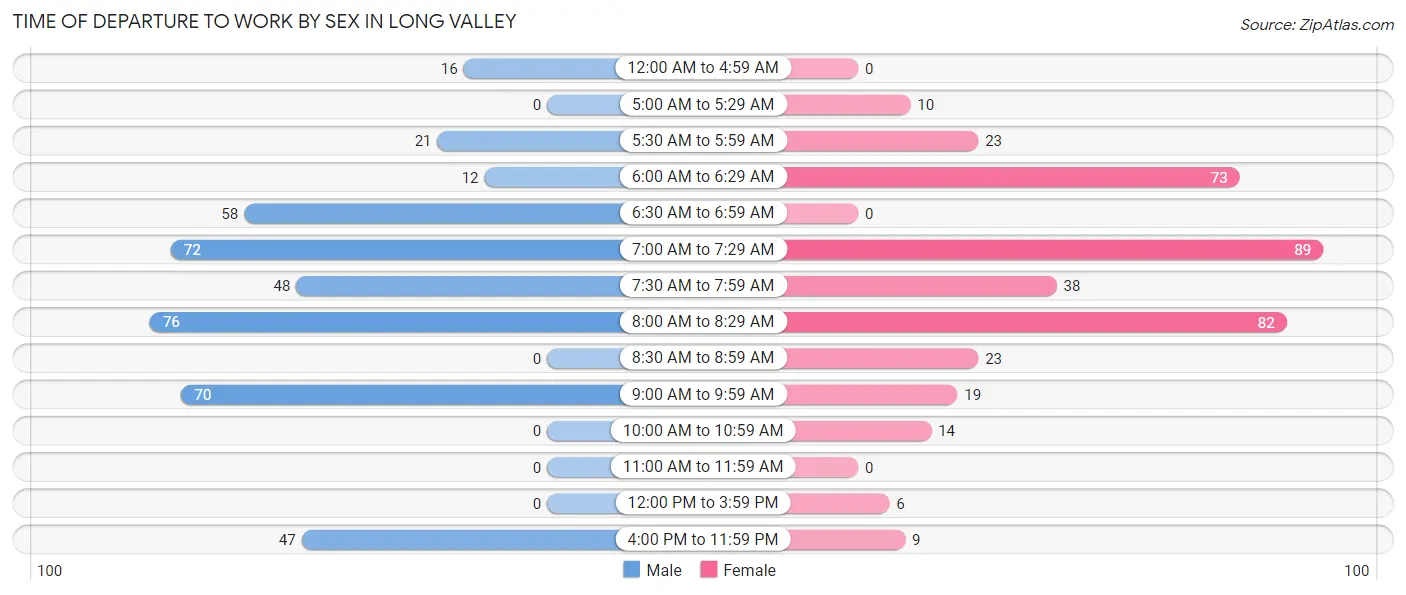
| Time of Departure | Male | Female |
| 12:00 AM to 4:59 AM | 16 (3.8%) | 0 (0.0%) |
| 5:00 AM to 5:29 AM | 0 (0.0%) | 10 (2.6%) |
| 5:30 AM to 5:59 AM | 21 (5.0%) | 23 (6.0%) |
| 6:00 AM to 6:29 AM | 12 (2.9%) | 73 (18.9%) |
| 6:30 AM to 6:59 AM | 58 (13.8%) | 0 (0.0%) |
| 7:00 AM to 7:29 AM | 72 (17.1%) | 89 (23.1%) |
| 7:30 AM to 7:59 AM | 48 (11.4%) | 38 (9.8%) |
| 8:00 AM to 8:29 AM | 76 (18.1%) | 82 (21.2%) |
| 8:30 AM to 8:59 AM | 0 (0.0%) | 23 (6.0%) |
| 9:00 AM to 9:59 AM | 70 (16.7%) | 19 (4.9%) |
| 10:00 AM to 10:59 AM | 0 (0.0%) | 14 (3.6%) |
| 11:00 AM to 11:59 AM | 0 (0.0%) | 0 (0.0%) |
| 12:00 PM to 3:59 PM | 0 (0.0%) | 6 (1.5%) |
| 4:00 PM to 11:59 PM | 47 (11.2%) | 9 (2.3%) |
| Total | 420 (100.0%) | 386 (100.0%) |
Housing Occupancy in Long Valley
Occupancy by Ownership in Long Valley
Of the total 754 dwellings in Long Valley, owner-occupied units account for 668 (88.6%), while renter-occupied units make up 86 (11.4%).
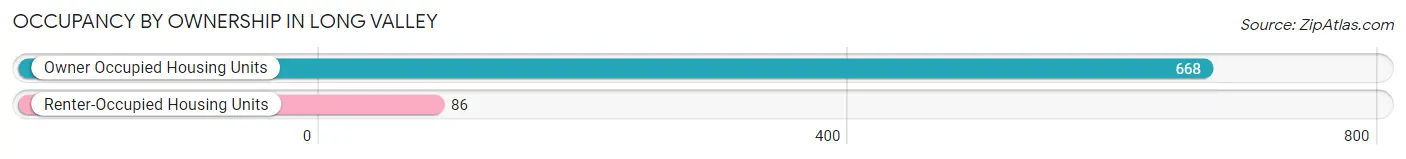
| Occupancy | # Housing Units | % Housing Units |
| Owner Occupied Housing Units | 668 | 88.6% |
| Renter-Occupied Housing Units | 86 | 11.4% |
| Total Occupied Housing Units | 754 | 100.0% |
Occupancy by Household Size in Long Valley
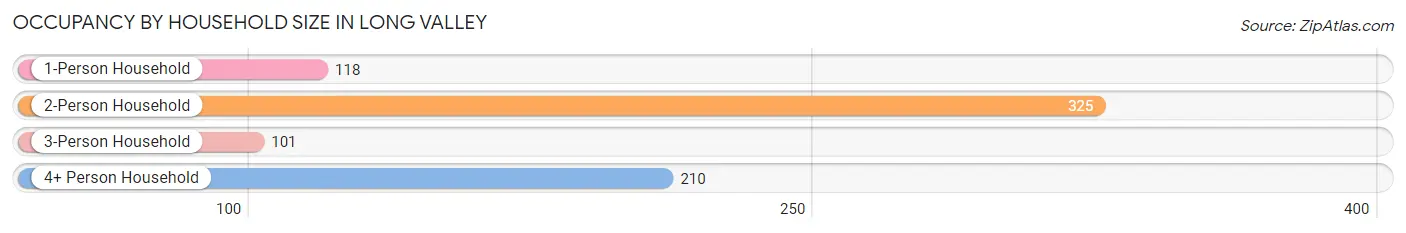
| Household Size | # Housing Units | % Housing Units |
| 1-Person Household | 118 | 15.7% |
| 2-Person Household | 325 | 43.1% |
| 3-Person Household | 101 | 13.4% |
| 4+ Person Household | 210 | 27.9% |
| Total Housing Units | 754 | 100.0% |
Occupancy by Ownership by Household Size in Long Valley
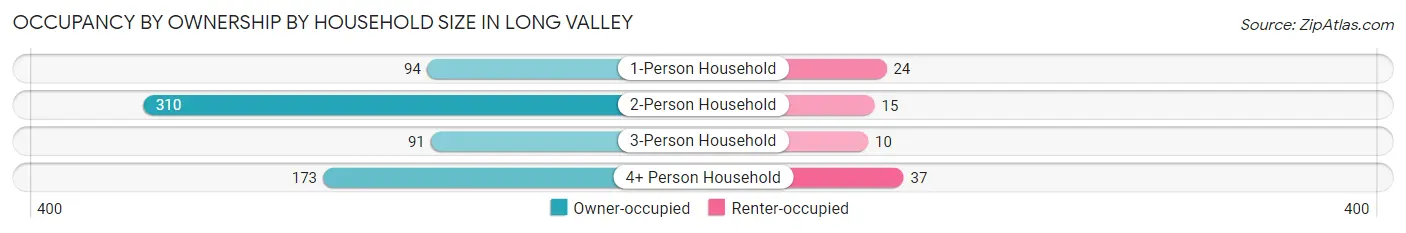
| Household Size | Owner-occupied | Renter-occupied |
| 1-Person Household | 94 (79.7%) | 24 (20.3%) |
| 2-Person Household | 310 (95.4%) | 15 (4.6%) |
| 3-Person Household | 91 (90.1%) | 10 (9.9%) |
| 4+ Person Household | 173 (82.4%) | 37 (17.6%) |
| Total Housing Units | 668 (88.6%) | 86 (11.4%) |
Occupancy by Educational Attainment in Long Valley
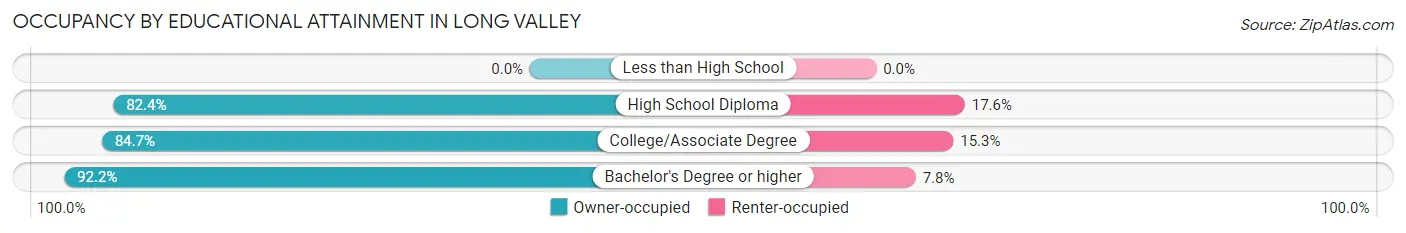
| Household Size | Owner-occupied | Renter-occupied |
| Less than High School | 0 (0.0%) | 0 (0.0%) |
| High School Diploma | 75 (82.4%) | 16 (17.6%) |
| College/Associate Degree | 205 (84.7%) | 37 (15.3%) |
| Bachelor's Degree or higher | 388 (92.2%) | 33 (7.8%) |
Occupancy by Age of Householder in Long Valley
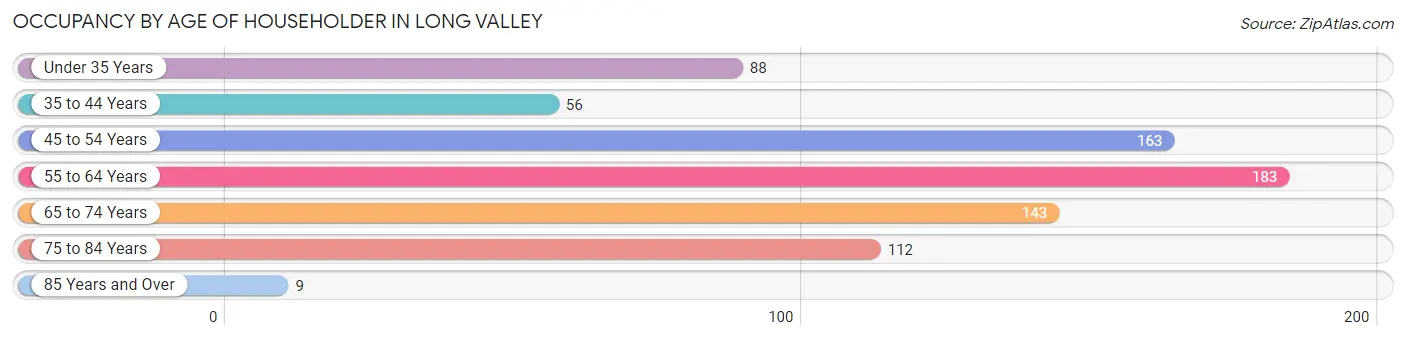
| Age Bracket | # Households | % Households |
| Under 35 Years | 88 | 11.7% |
| 35 to 44 Years | 56 | 7.4% |
| 45 to 54 Years | 163 | 21.6% |
| 55 to 64 Years | 183 | 24.3% |
| 65 to 74 Years | 143 | 19.0% |
| 75 to 84 Years | 112 | 14.8% |
| 85 Years and Over | 9 | 1.2% |
| Total | 754 | 100.0% |
Housing Finances in Long Valley
Median Income by Occupancy in Long Valley
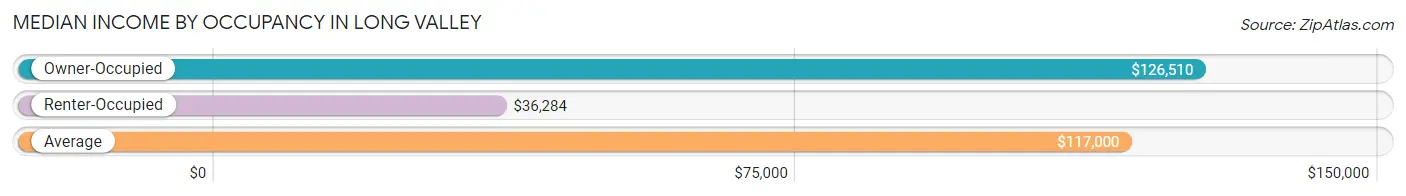
| Occupancy Type | # Households | Median Income |
| Owner-Occupied | 668 (88.6%) | $126,510 |
| Renter-Occupied | 86 (11.4%) | $36,284 |
| Average | 754 (100.0%) | $117,000 |
Occupancy by Householder Income Bracket in Long Valley
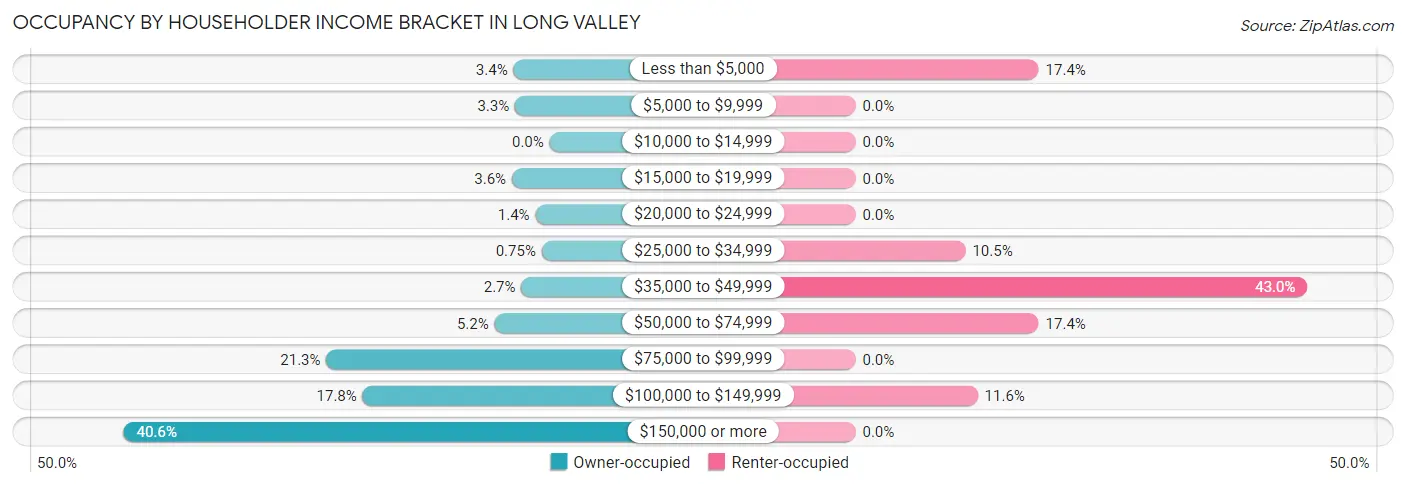
| Income Bracket | Owner-occupied | Renter-occupied |
| Less than $5,000 | 23 (3.4%) | 15 (17.4%) |
| $5,000 to $9,999 | 22 (3.3%) | 0 (0.0%) |
| $10,000 to $14,999 | 0 (0.0%) | 0 (0.0%) |
| $15,000 to $19,999 | 24 (3.6%) | 0 (0.0%) |
| $20,000 to $24,999 | 9 (1.3%) | 0 (0.0%) |
| $25,000 to $34,999 | 5 (0.7%) | 9 (10.5%) |
| $35,000 to $49,999 | 18 (2.7%) | 37 (43.0%) |
| $50,000 to $74,999 | 35 (5.2%) | 15 (17.4%) |
| $75,000 to $99,999 | 142 (21.3%) | 0 (0.0%) |
| $100,000 to $149,999 | 119 (17.8%) | 10 (11.6%) |
| $150,000 or more | 271 (40.6%) | 0 (0.0%) |
| Total | 668 (100.0%) | 86 (100.0%) |
Monthly Housing Cost Tiers in Long Valley
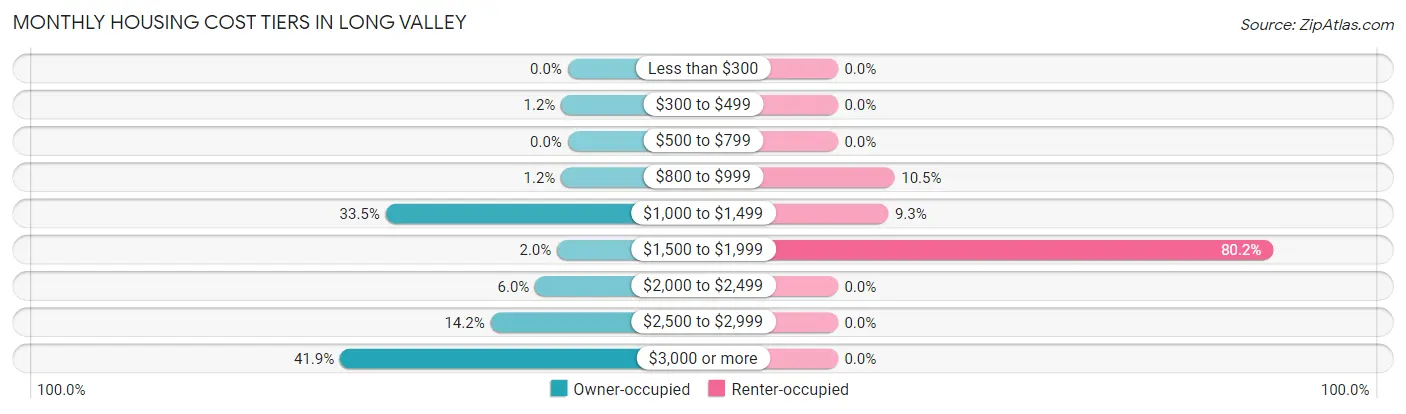
| Monthly Cost | Owner-occupied | Renter-occupied |
| Less than $300 | 0 (0.0%) | 0 (0.0%) |
| $300 to $499 | 8 (1.2%) | 0 (0.0%) |
| $500 to $799 | 0 (0.0%) | 0 (0.0%) |
| $800 to $999 | 8 (1.2%) | 9 (10.5%) |
| $1,000 to $1,499 | 224 (33.5%) | 8 (9.3%) |
| $1,500 to $1,999 | 13 (1.9%) | 69 (80.2%) |
| $2,000 to $2,499 | 40 (6.0%) | 0 (0.0%) |
| $2,500 to $2,999 | 95 (14.2%) | 0 (0.0%) |
| $3,000 or more | 280 (41.9%) | 0 (0.0%) |
| Total | 668 (100.0%) | 86 (100.0%) |
Physical Housing Characteristics in Long Valley
Housing Structures in Long Valley
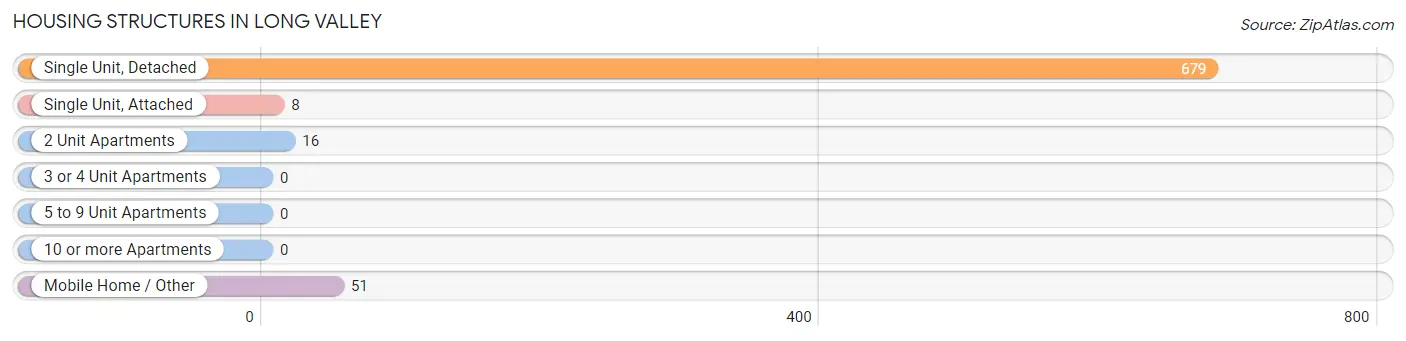
| Structure Type | # Housing Units | % Housing Units |
| Single Unit, Detached | 679 | 90.0% |
| Single Unit, Attached | 8 | 1.1% |
| 2 Unit Apartments | 16 | 2.1% |
| 3 or 4 Unit Apartments | 0 | 0.0% |
| 5 to 9 Unit Apartments | 0 | 0.0% |
| 10 or more Apartments | 0 | 0.0% |
| Mobile Home / Other | 51 | 6.8% |
| Total | 754 | 100.0% |
Housing Structures by Occupancy in Long Valley
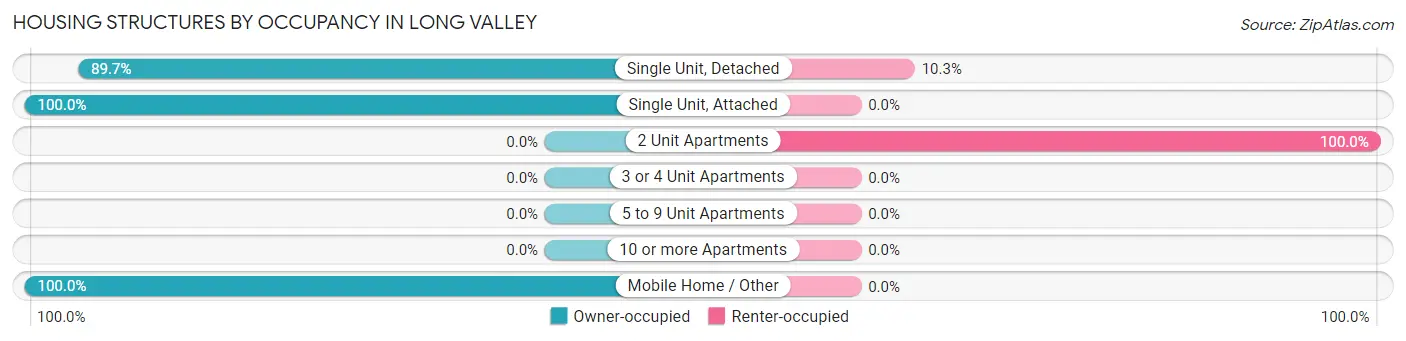
| Structure Type | Owner-occupied | Renter-occupied |
| Single Unit, Detached | 609 (89.7%) | 70 (10.3%) |
| Single Unit, Attached | 8 (100.0%) | 0 (0.0%) |
| 2 Unit Apartments | 0 (0.0%) | 16 (100.0%) |
| 3 or 4 Unit Apartments | 0 (0.0%) | 0 (0.0%) |
| 5 to 9 Unit Apartments | 0 (0.0%) | 0 (0.0%) |
| 10 or more Apartments | 0 (0.0%) | 0 (0.0%) |
| Mobile Home / Other | 51 (100.0%) | 0 (0.0%) |
| Total | 668 (88.6%) | 86 (11.4%) |
Housing Structures by Number of Rooms in Long Valley
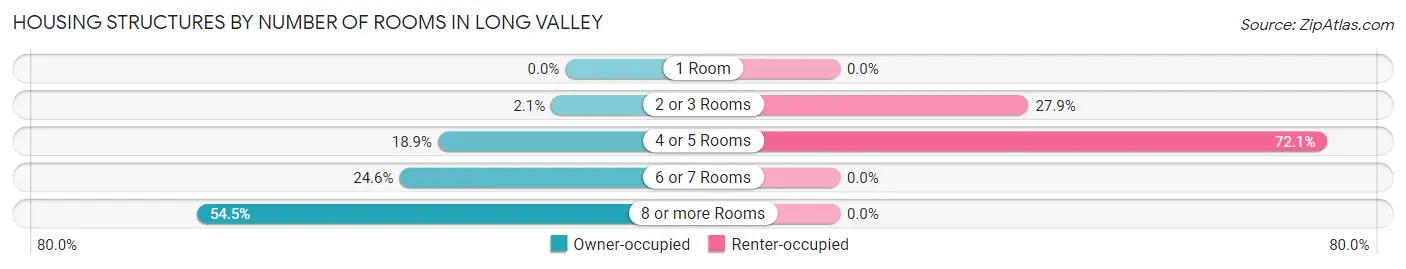
| Number of Rooms | Owner-occupied | Renter-occupied |
| 1 Room | 0 (0.0%) | 0 (0.0%) |
| 2 or 3 Rooms | 14 (2.1%) | 24 (27.9%) |
| 4 or 5 Rooms | 126 (18.9%) | 62 (72.1%) |
| 6 or 7 Rooms | 164 (24.5%) | 0 (0.0%) |
| 8 or more Rooms | 364 (54.5%) | 0 (0.0%) |
| Total | 668 (100.0%) | 86 (100.0%) |
Housing Structure by Heating Type in Long Valley
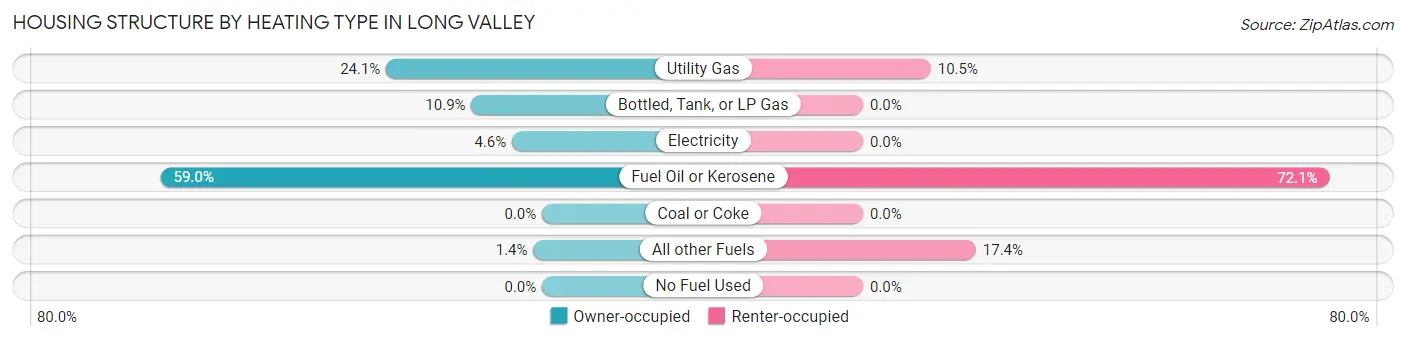
| Heating Type | Owner-occupied | Renter-occupied |
| Utility Gas | 161 (24.1%) | 9 (10.5%) |
| Bottled, Tank, or LP Gas | 73 (10.9%) | 0 (0.0%) |
| Electricity | 31 (4.6%) | 0 (0.0%) |
| Fuel Oil or Kerosene | 394 (59.0%) | 62 (72.1%) |
| Coal or Coke | 0 (0.0%) | 0 (0.0%) |
| All other Fuels | 9 (1.3%) | 15 (17.4%) |
| No Fuel Used | 0 (0.0%) | 0 (0.0%) |
| Total | 668 (100.0%) | 86 (100.0%) |
Household Vehicle Usage in Long Valley
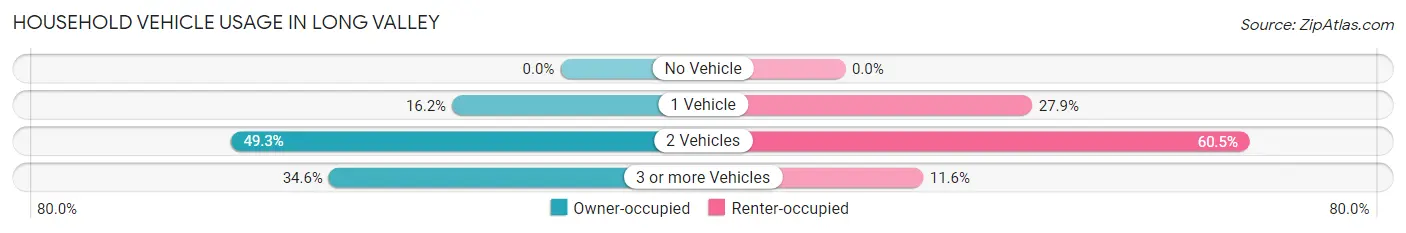
| Vehicles per Household | Owner-occupied | Renter-occupied |
| No Vehicle | 0 (0.0%) | 0 (0.0%) |
| 1 Vehicle | 108 (16.2%) | 24 (27.9%) |
| 2 Vehicles | 329 (49.2%) | 52 (60.5%) |
| 3 or more Vehicles | 231 (34.6%) | 10 (11.6%) |
| Total | 668 (100.0%) | 86 (100.0%) |
Real Estate & Mortgages in Long Valley
Real Estate and Mortgage Overview in Long Valley
| Characteristic | Without Mortgage | With Mortgage |
| Housing Units | 273 | 395 |
| Median Property Value | $361,600 | $474,700 |
| Median Household Income | $100,156 | $222 |
| Monthly Housing Costs | $1,258 | $280 |
| Real Estate Taxes | $9,291 | $12 |
Property Value by Mortgage Status in Long Valley
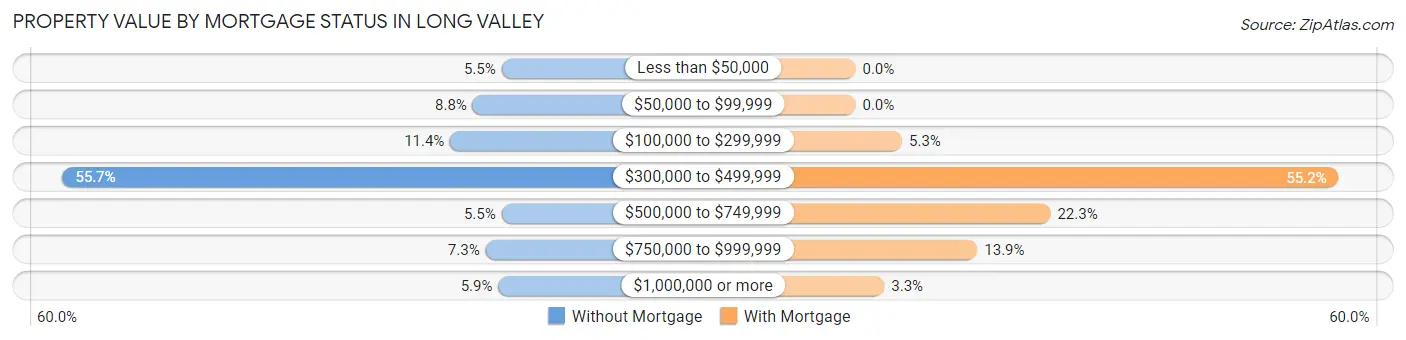
| Property Value | Without Mortgage | With Mortgage |
| Less than $50,000 | 15 (5.5%) | 0 (0.0%) |
| $50,000 to $99,999 | 24 (8.8%) | 0 (0.0%) |
| $100,000 to $299,999 | 31 (11.4%) | 21 (5.3%) |
| $300,000 to $499,999 | 152 (55.7%) | 218 (55.2%) |
| $500,000 to $749,999 | 15 (5.5%) | 88 (22.3%) |
| $750,000 to $999,999 | 20 (7.3%) | 55 (13.9%) |
| $1,000,000 or more | 16 (5.9%) | 13 (3.3%) |
| Total | 273 (100.0%) | 395 (100.0%) |
Household Income by Mortgage Status in Long Valley
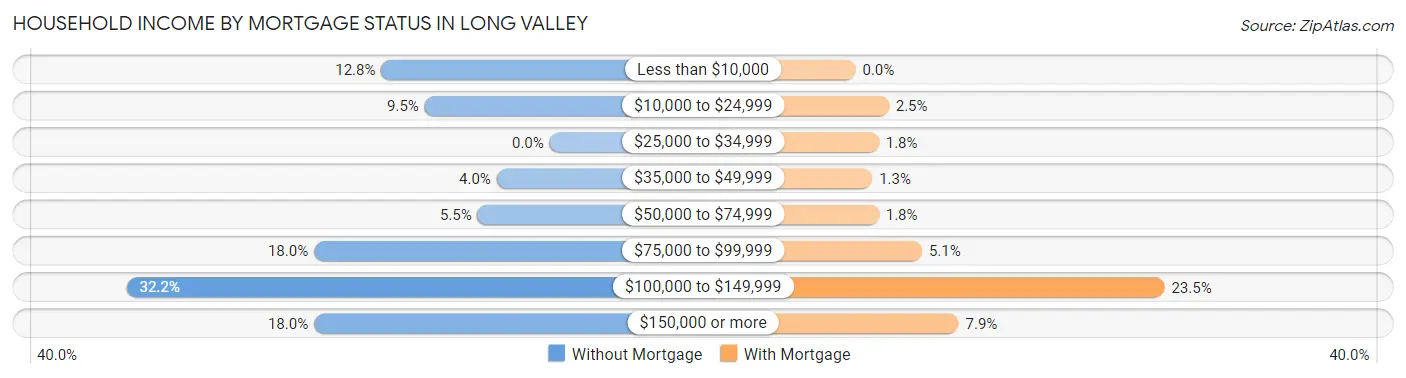
| Household Income | Without Mortgage | With Mortgage |
| Less than $10,000 | 35 (12.8%) | 0 (0.0%) |
| $10,000 to $24,999 | 26 (9.5%) | 10 (2.5%) |
| $25,000 to $34,999 | 0 (0.0%) | 7 (1.8%) |
| $35,000 to $49,999 | 11 (4.0%) | 5 (1.3%) |
| $50,000 to $74,999 | 15 (5.5%) | 7 (1.8%) |
| $75,000 to $99,999 | 49 (17.9%) | 20 (5.1%) |
| $100,000 to $149,999 | 88 (32.2%) | 93 (23.5%) |
| $150,000 or more | 49 (17.9%) | 31 (7.9%) |
| Total | 273 (100.0%) | 395 (100.0%) |
Property Value to Household Income Ratio in Long Valley
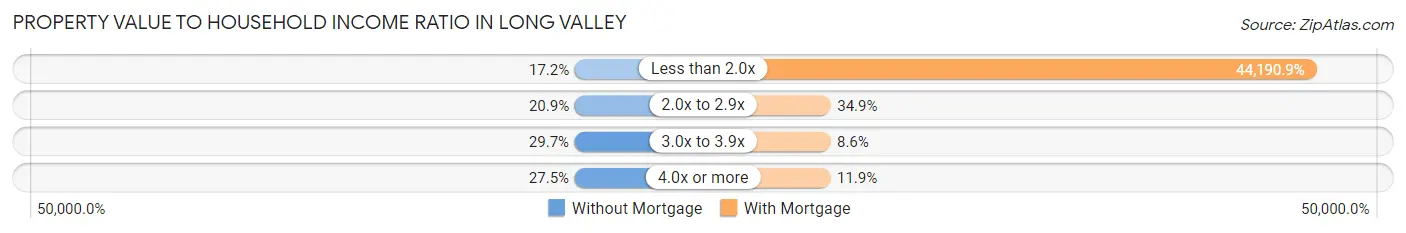
| Value-to-Income Ratio | Without Mortgage | With Mortgage |
| Less than 2.0x | 47 (17.2%) | 174,554 (44,190.9%) |
| 2.0x to 2.9x | 57 (20.9%) | 138 (34.9%) |
| 3.0x to 3.9x | 81 (29.7%) | 34 (8.6%) |
| 4.0x or more | 75 (27.5%) | 47 (11.9%) |
| Total | 273 (100.0%) | 395 (100.0%) |
Real Estate Taxes by Mortgage Status in Long Valley
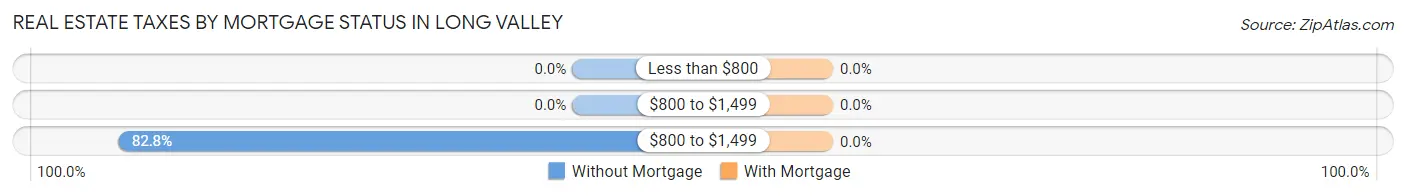
| Property Taxes | Without Mortgage | With Mortgage |
| Less than $800 | 0 (0.0%) | 0 (0.0%) |
| $800 to $1,499 | 0 (0.0%) | 0 (0.0%) |
| $800 to $1,499 | 226 (82.8%) | 0 (0.0%) |
| Total | 273 (100.0%) | 395 (100.0%) |
Health & Disability in Long Valley
Health Insurance Coverage by Age in Long Valley
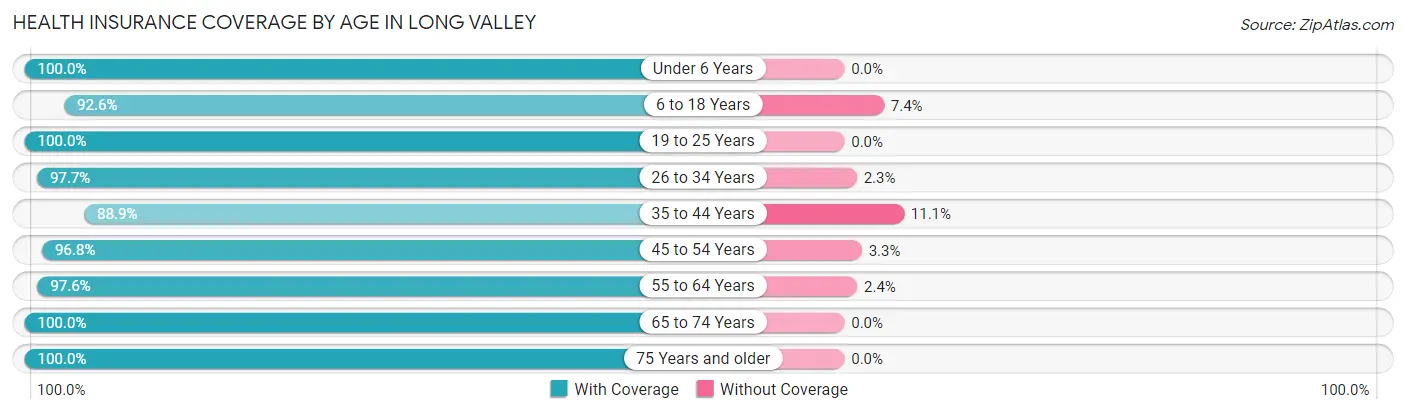
| Age Bracket | With Coverage | Without Coverage |
| Under 6 Years | 148 (100.0%) | 0 (0.0%) |
| 6 to 18 Years | 364 (92.6%) | 29 (7.4%) |
| 19 to 25 Years | 159 (100.0%) | 0 (0.0%) |
| 26 to 34 Years | 169 (97.7%) | 4 (2.3%) |
| 35 to 44 Years | 104 (88.9%) | 13 (11.1%) |
| 45 to 54 Years | 298 (96.8%) | 10 (3.3%) |
| 55 to 64 Years | 286 (97.6%) | 7 (2.4%) |
| 65 to 74 Years | 294 (100.0%) | 0 (0.0%) |
| 75 Years and older | 161 (100.0%) | 0 (0.0%) |
| Total | 1,983 (96.9%) | 63 (3.1%) |
Health Insurance Coverage by Citizenship Status in Long Valley
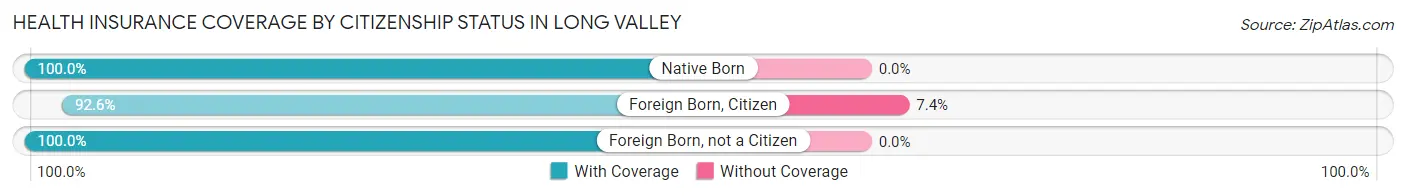
| Citizenship Status | With Coverage | Without Coverage |
| Native Born | 148 (100.0%) | 0 (0.0%) |
| Foreign Born, Citizen | 364 (92.6%) | 29 (7.4%) |
| Foreign Born, not a Citizen | 159 (100.0%) | 0 (0.0%) |
Health Insurance Coverage by Household Income in Long Valley
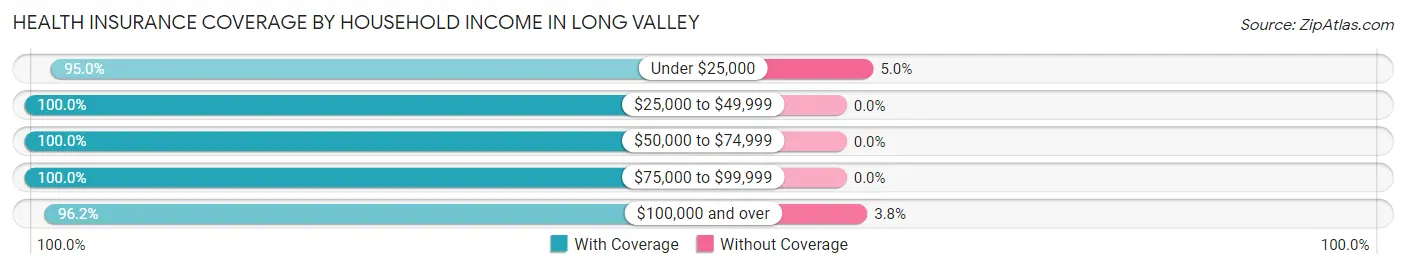
| Household Income | With Coverage | Without Coverage |
| Under $25,000 | 190 (95.0%) | 10 (5.0%) |
| $25,000 to $49,999 | 186 (100.0%) | 0 (0.0%) |
| $50,000 to $74,999 | 60 (100.0%) | 0 (0.0%) |
| $75,000 to $99,999 | 313 (100.0%) | 0 (0.0%) |
| $100,000 and over | 1,226 (96.2%) | 49 (3.8%) |
Public vs Private Health Insurance Coverage by Age in Long Valley
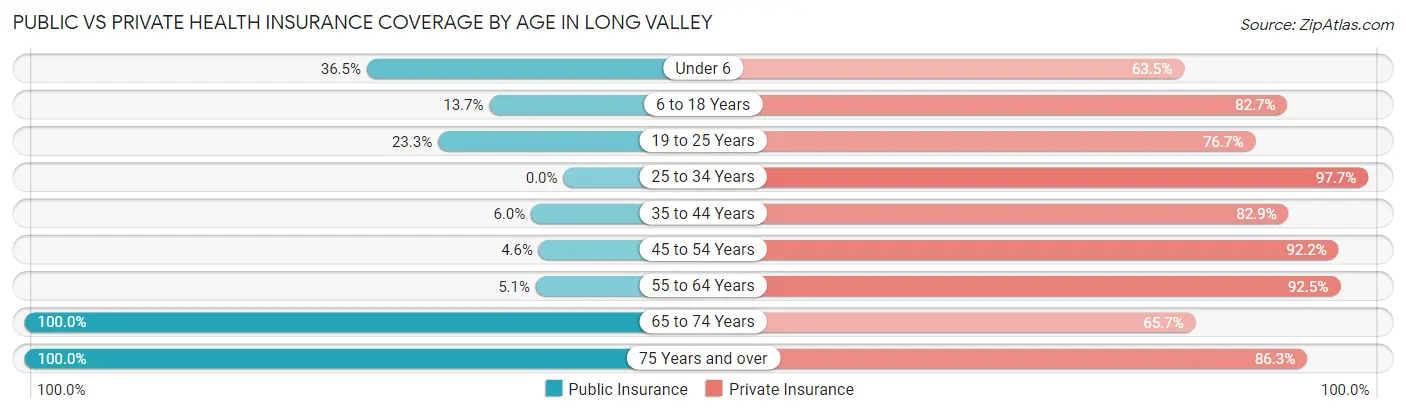
| Age Bracket | Public Insurance | Private Insurance |
| Under 6 | 54 (36.5%) | 94 (63.5%) |
| 6 to 18 Years | 54 (13.7%) | 325 (82.7%) |
| 19 to 25 Years | 37 (23.3%) | 122 (76.7%) |
| 25 to 34 Years | 0 (0.0%) | 169 (97.7%) |
| 35 to 44 Years | 7 (6.0%) | 97 (82.9%) |
| 45 to 54 Years | 14 (4.5%) | 284 (92.2%) |
| 55 to 64 Years | 15 (5.1%) | 271 (92.5%) |
| 65 to 74 Years | 294 (100.0%) | 193 (65.6%) |
| 75 Years and over | 161 (100.0%) | 139 (86.3%) |
| Total | 636 (31.1%) | 1,694 (82.8%) |
Disability Status by Sex by Age in Long Valley
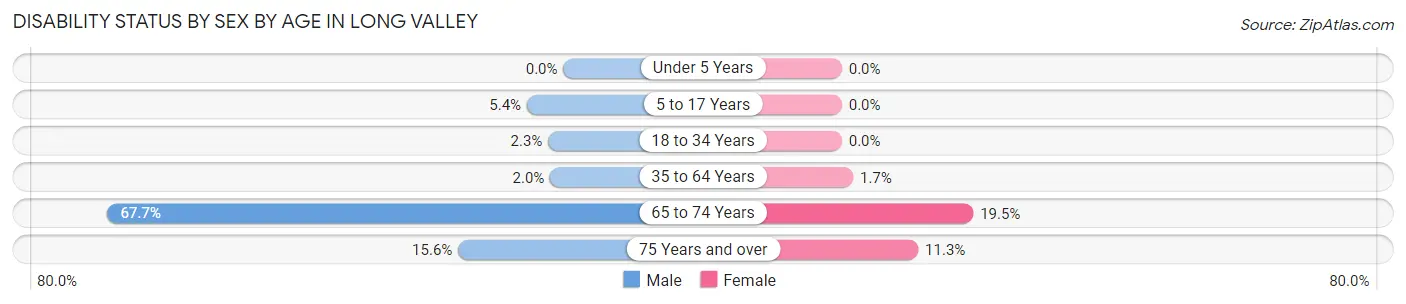
| Age Bracket | Male | Female |
| Under 5 Years | 0 (0.0%) | 0 (0.0%) |
| 5 to 17 Years | 12 (5.4%) | 0 (0.0%) |
| 18 to 34 Years | 4 (2.2%) | 0 (0.0%) |
| 35 to 64 Years | 7 (2.0%) | 6 (1.7%) |
| 65 to 74 Years | 88 (67.7%) | 32 (19.5%) |
| 75 Years and over | 10 (15.6%) | 11 (11.3%) |
Disability Class by Sex by Age in Long Valley
Disability Class: Hearing Difficulty
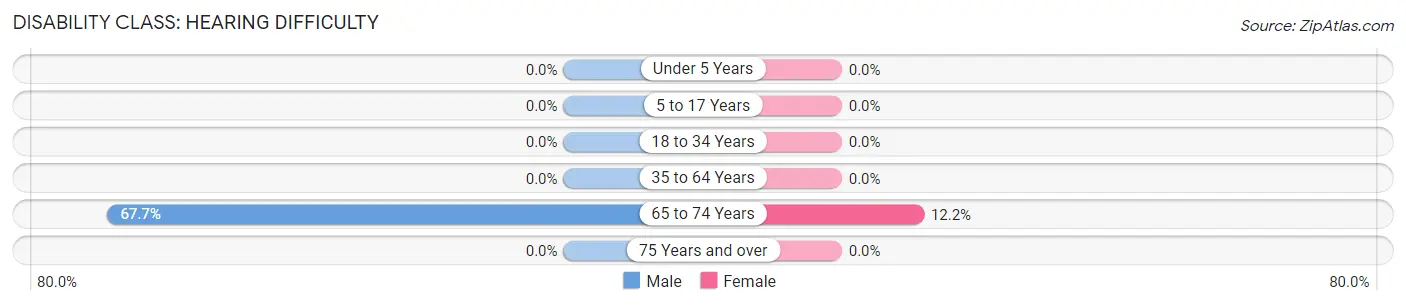
| Age Bracket | Male | Female |
| Under 5 Years | 0 (0.0%) | 0 (0.0%) |
| 5 to 17 Years | 0 (0.0%) | 0 (0.0%) |
| 18 to 34 Years | 0 (0.0%) | 0 (0.0%) |
| 35 to 64 Years | 0 (0.0%) | 0 (0.0%) |
| 65 to 74 Years | 88 (67.7%) | 20 (12.2%) |
| 75 Years and over | 0 (0.0%) | 0 (0.0%) |
Disability Class: Vision Difficulty
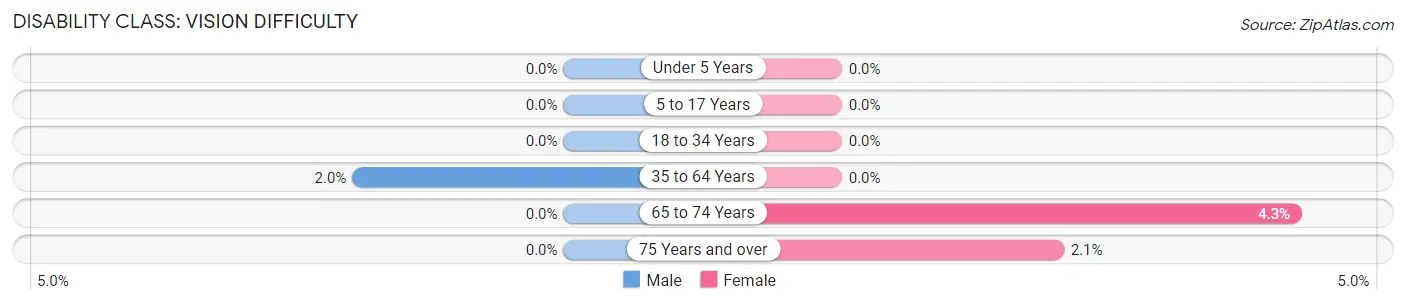
| Age Bracket | Male | Female |
| Under 5 Years | 0 (0.0%) | 0 (0.0%) |
| 5 to 17 Years | 0 (0.0%) | 0 (0.0%) |
| 18 to 34 Years | 0 (0.0%) | 0 (0.0%) |
| 35 to 64 Years | 7 (2.0%) | 0 (0.0%) |
| 65 to 74 Years | 0 (0.0%) | 7 (4.3%) |
| 75 Years and over | 0 (0.0%) | 2 (2.1%) |
Disability Class: Cognitive Difficulty
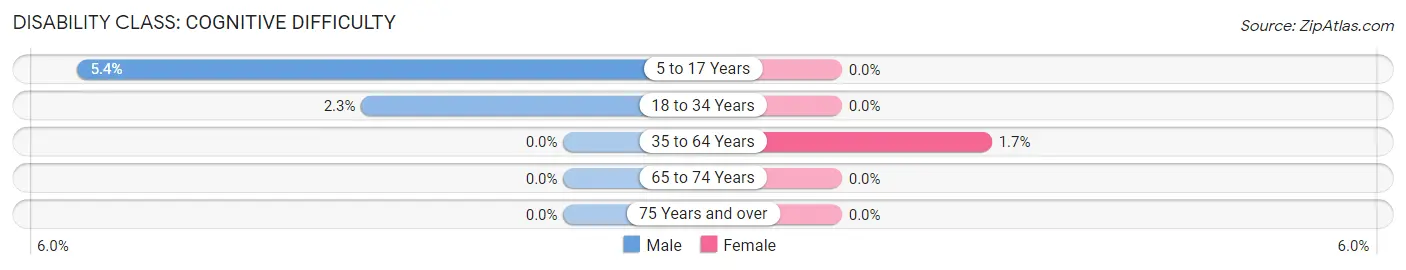
| Age Bracket | Male | Female |
| 5 to 17 Years | 12 (5.4%) | 0 (0.0%) |
| 18 to 34 Years | 4 (2.2%) | 0 (0.0%) |
| 35 to 64 Years | 0 (0.0%) | 6 (1.7%) |
| 65 to 74 Years | 0 (0.0%) | 0 (0.0%) |
| 75 Years and over | 0 (0.0%) | 0 (0.0%) |
Disability Class: Ambulatory Difficulty
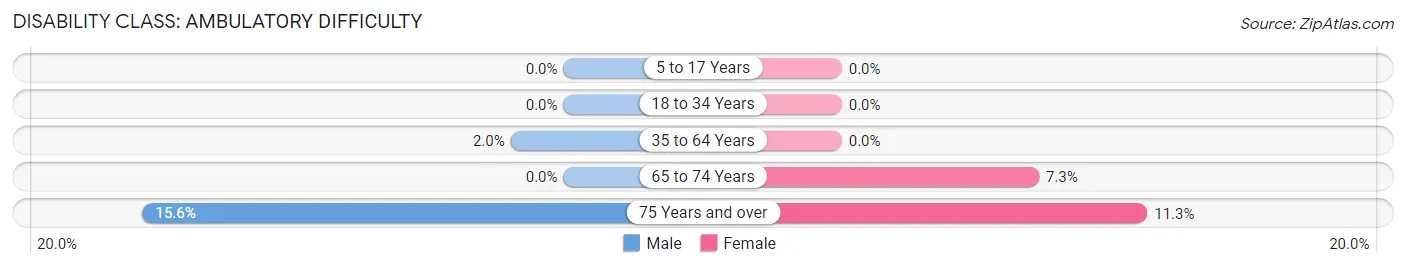
| Age Bracket | Male | Female |
| 5 to 17 Years | 0 (0.0%) | 0 (0.0%) |
| 18 to 34 Years | 0 (0.0%) | 0 (0.0%) |
| 35 to 64 Years | 7 (2.0%) | 0 (0.0%) |
| 65 to 74 Years | 0 (0.0%) | 12 (7.3%) |
| 75 Years and over | 10 (15.6%) | 11 (11.3%) |
Disability Class: Self-Care Difficulty
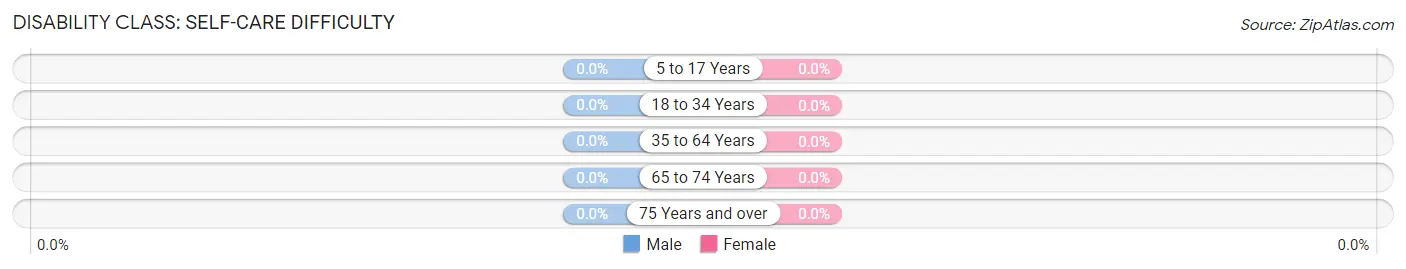
| Age Bracket | Male | Female |
| 5 to 17 Years | 0 (0.0%) | 0 (0.0%) |
| 18 to 34 Years | 0 (0.0%) | 0 (0.0%) |
| 35 to 64 Years | 0 (0.0%) | 0 (0.0%) |
| 65 to 74 Years | 0 (0.0%) | 0 (0.0%) |
| 75 Years and over | 0 (0.0%) | 0 (0.0%) |
Technology Access in Long Valley
Computing Device Access in Long Valley
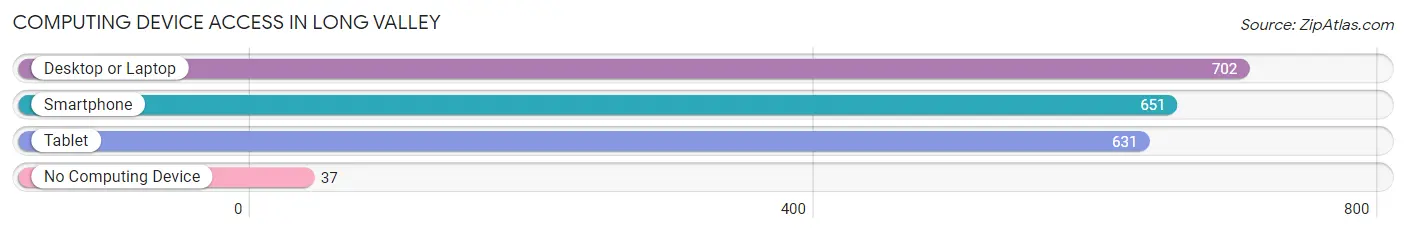
| Device Type | # Households | % Households |
| Desktop or Laptop | 702 | 93.1% |
| Smartphone | 651 | 86.3% |
| Tablet | 631 | 83.7% |
| No Computing Device | 37 | 4.9% |
| Total | 754 | 100.0% |
Internet Access in Long Valley
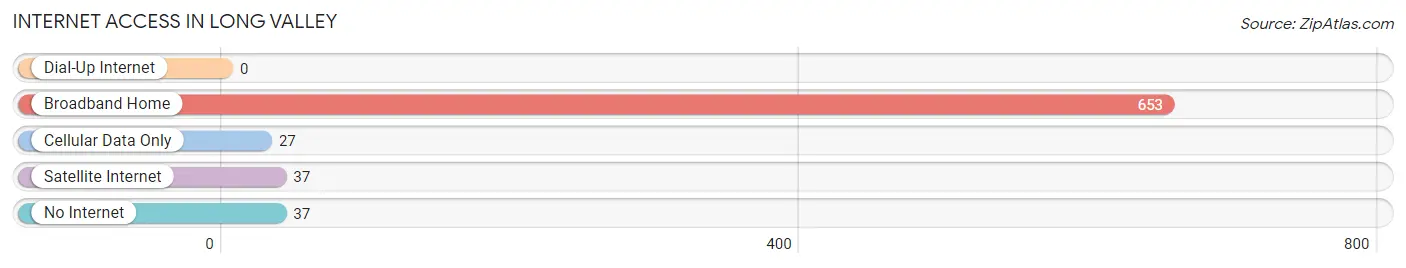
| Internet Type | # Households | % Households |
| Dial-Up Internet | 0 | 0.0% |
| Broadband Home | 653 | 86.6% |
| Cellular Data Only | 27 | 3.6% |
| Satellite Internet | 37 | 4.9% |
| No Internet | 37 | 4.9% |
| Total | 754 | 100.0% |
Long Valley Summary
Long Valley is a small unincorporated community located in Morris County, New Jersey. It is situated in the northern part of the state, about 40 miles west of New York City. The area is known for its rural charm and scenic beauty, and is home to a variety of businesses, farms, and recreational activities.
History
Long Valley was first settled in the late 1700s by Dutch and German immigrants. The area was originally known as German Valley, and was part of the larger Morris County. In 1845, the area was renamed Long Valley, after the long valley that runs through the area.
The area was largely agricultural until the late 19th century, when the railroad arrived and the area began to develop. The railroad brought new businesses and industries to the area, and the population began to grow. By the early 20th century, Long Valley had become a thriving community with a variety of businesses, including a hotel, a bank, and a post office.
Geography
Long Valley is located in the northern part of Morris County, New Jersey. It is situated in the Raritan Valley, a region of rolling hills and valleys. The area is known for its scenic beauty, and is home to a variety of wildlife, including deer, foxes, and wild turkeys.
The area is also home to a variety of recreational activities, including hiking, fishing, and camping. The nearby Musconetcong River is popular for canoeing and kayaking.
Economy
Long Valley is home to a variety of businesses, including farms, restaurants, and retail stores. The area is also home to a number of small manufacturing companies, including a furniture maker and a metal fabricator.
The area is also home to a number of recreational activities, including golf courses, ski resorts, and state parks. The nearby Musconetcong River is popular for canoeing and kayaking.
Demographics
As of the 2010 census, Long Valley had a population of 4,845. The population is largely white (93.3%), with a small percentage of African Americans (2.2%) and Hispanics (2.7%). The median household income is $90,945, and the median home value is $521,000.
Long Valley is a small, rural community with a strong sense of community. The area is known for its scenic beauty and recreational activities, and is home to a variety of businesses, farms, and recreational activities. The area is also home to a diverse population, with a variety of backgrounds and cultures.
Common Questions
What is Per Capita Income in Long Valley?
Per Capita income in Long Valley is $59,777.
What is the Median Family Income in Long Valley?
Median Family Income in Long Valley is $126,979.
What is the Median Household income in Long Valley?
Median Household Income in Long Valley is $117,000.
What is Income or Wage Gap in Long Valley?
Income or Wage Gap in Long Valley is 50.4%.
Women in Long Valley earn 49.6 cents for every dollar earned by a man.
What is Inequality or Gini Index in Long Valley?
Inequality or Gini Index in Long Valley is 0.47.
What is the Total Population of Long Valley?
Total Population of Long Valley is 2,046.
What is the Total Male Population of Long Valley?
Total Male Population of Long Valley is 1,006.
What is the Total Female Population of Long Valley?
Total Female Population of Long Valley is 1,040.
What is the Ratio of Males per 100 Females in Long Valley?
There are 96.73 Males per 100 Females in Long Valley.
What is the Ratio of Females per 100 Males in Long Valley?
There are 103.38 Females per 100 Males in Long Valley.
What is the Median Population Age in Long Valley?
Median Population Age in Long Valley is 47.2 Years.
What is the Average Family Size in Long Valley
Average Family Size in Long Valley is 3.0 People.
What is the Average Household Size in Long Valley
Average Household Size in Long Valley is 2.7 People.
How Large is the Labor Force in Long Valley?
There are 1,007 People in the Labor Forcein in Long Valley.
What is the Percentage of People in the Labor Force in Long Valley?
59.4% of People are in the Labor Force in Long Valley.
What is the Unemployment Rate in Long Valley?
Unemployment Rate in Long Valley is 4.5%.