Cleveland, MS Map & Demographics
Cleveland Map
Cleveland Overview
$26,351
PER CAPITA INCOME
$61,196
AVG FAMILY INCOME
$42,005
AVG HOUSEHOLD INCOME
43.9%
WAGE / INCOME GAP [ % ]
56.1¢/ $1
WAGE / INCOME GAP [ $ ]
0.54
INEQUALITY / GINI INDEX
11,082
TOTAL POPULATION
5,303
MALE POPULATION
5,779
FEMALE POPULATION
91.76
MALES / 100 FEMALES
108.98
FEMALES / 100 MALES
33.8
MEDIAN AGE
3.2
AVG FAMILY SIZE
2.5
AVG HOUSEHOLD SIZE
4,340
LABOR FORCE [ PEOPLE ]
50.7%
PERCENT IN LABOR FORCE
7.4%
UNEMPLOYMENT RATE
Cleveland Area Codes
Income in Cleveland
Income Overview in Cleveland
Per Capita Income in Cleveland is $26,351, while median incomes of families and households are $61,196 and $42,005 respectively.
| Characteristic | Number | Measure |
| Per Capita Income | 11,082 | $26,351 |
| Median Family Income | 2,284 | $61,196 |
| Mean Family Income | 2,284 | $78,134 |
| Median Household Income | 3,996 | $42,005 |
| Mean Household Income | 3,996 | $69,054 |
| Income Deficit | 2,284 | $0 |
| Wage / Income Gap (%) | 11,082 | 43.86% |
| Wage / Income Gap ($) | 11,082 | 56.14¢ per $1 |
| Gini / Inequality Index | 11,082 | 0.54 |
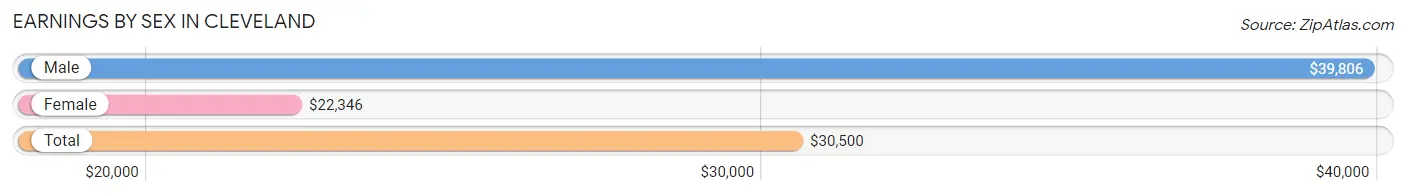
Earnings by Sex in Cleveland
Average Earnings in Cleveland are $30,500, $39,806 for men and $22,346 for women, a difference of 43.9%.
| Sex | Number | Average Earnings |
| Male | 2,287 (50.1%) | $39,806 |
| Female | 2,281 (49.9%) | $22,346 |
| Total | 4,568 (100.0%) | $30,500 |
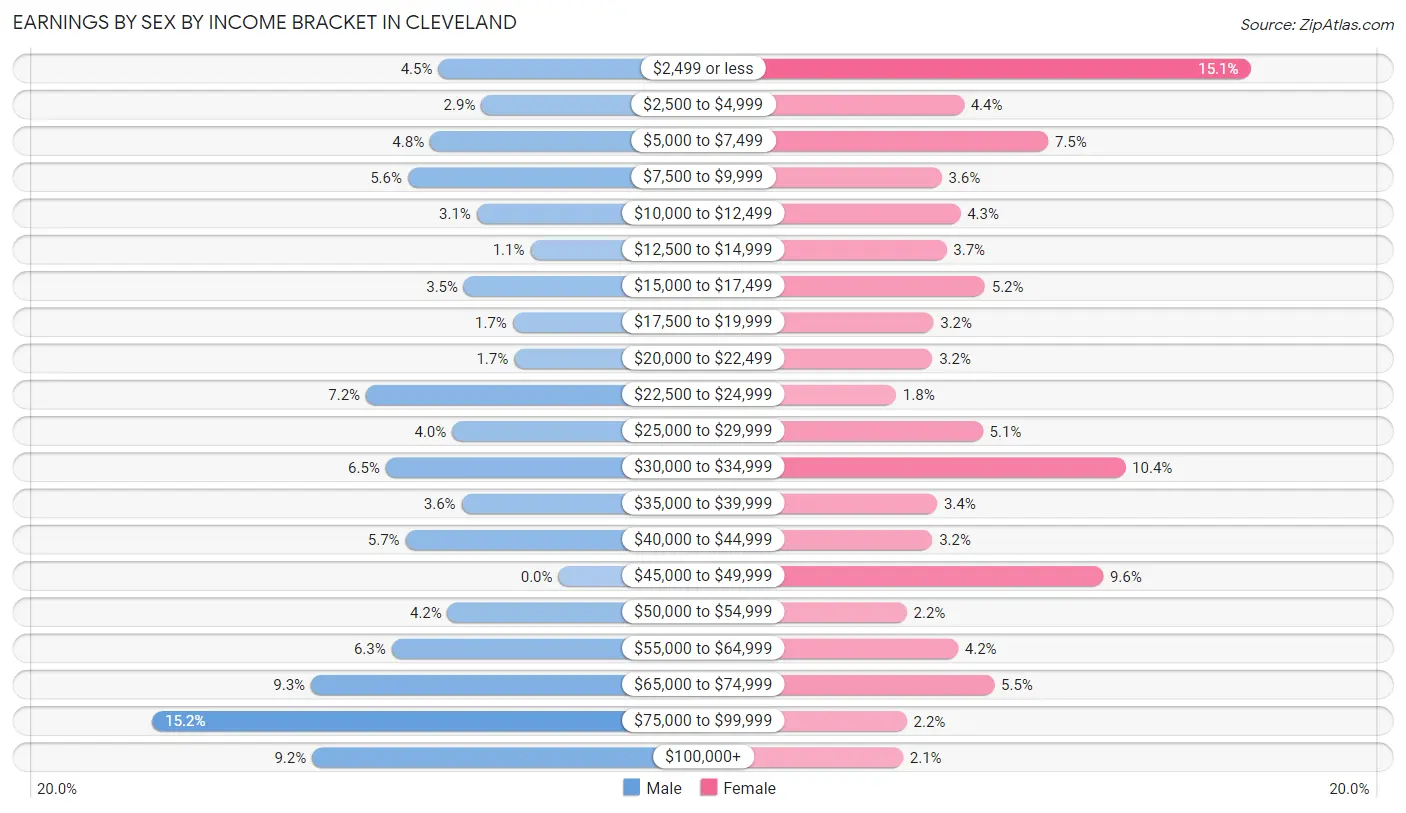
Earnings by Sex by Income Bracket in Cleveland
The most common earnings brackets in Cleveland are $75,000 to $99,999 for men (348 | 15.2%) and $2,499 or less for women (345 | 15.1%).
| Income | Male | Female |
| $2,499 or less | 103 (4.5%) | 345 (15.1%) |
| $2,500 to $4,999 | 66 (2.9%) | 100 (4.4%) |
| $5,000 to $7,499 | 110 (4.8%) | 172 (7.5%) |
| $7,500 to $9,999 | 129 (5.6%) | 81 (3.5%) |
| $10,000 to $12,499 | 70 (3.1%) | 97 (4.3%) |
| $12,500 to $14,999 | 24 (1.1%) | 85 (3.7%) |
| $15,000 to $17,499 | 81 (3.5%) | 118 (5.2%) |
| $17,500 to $19,999 | 39 (1.7%) | 74 (3.2%) |
| $20,000 to $22,499 | 38 (1.7%) | 73 (3.2%) |
| $22,500 to $24,999 | 165 (7.2%) | 42 (1.8%) |
| $25,000 to $29,999 | 91 (4.0%) | 116 (5.1%) |
| $30,000 to $34,999 | 148 (6.5%) | 238 (10.4%) |
| $35,000 to $39,999 | 83 (3.6%) | 77 (3.4%) |
| $40,000 to $44,999 | 131 (5.7%) | 73 (3.2%) |
| $45,000 to $49,999 | 0 (0.0%) | 219 (9.6%) |
| $50,000 to $54,999 | 95 (4.2%) | 51 (2.2%) |
| $55,000 to $64,999 | 143 (6.2%) | 95 (4.2%) |
| $65,000 to $74,999 | 212 (9.3%) | 126 (5.5%) |
| $75,000 to $99,999 | 348 (15.2%) | 51 (2.2%) |
| $100,000+ | 211 (9.2%) | 48 (2.1%) |
| Total | 2,287 (100.0%) | 2,281 (100.0%) |
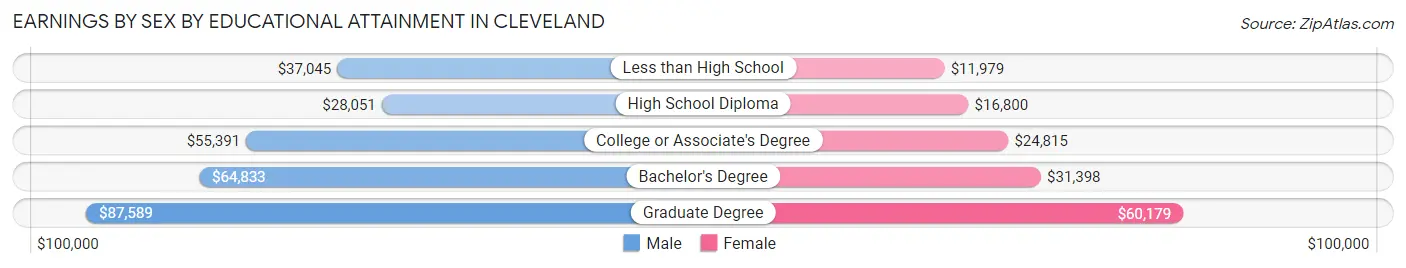
Earnings by Sex by Educational Attainment in Cleveland
Average earnings in Cleveland are $51,421 for men and $31,812 for women, a difference of 38.1%. Men with an educational attainment of graduate degree enjoy the highest average annual earnings of $87,589, while those with high school diploma education earn the least with $28,051. Women with an educational attainment of graduate degree earn the most with the average annual earnings of $60,179, while those with less than high school education have the smallest earnings of $11,979.
| Educational Attainment | Male Income | Female Income |
| Less than High School | $37,045 | $11,979 |
| High School Diploma | $28,051 | $16,800 |
| College or Associate's Degree | $55,391 | $24,815 |
| Bachelor's Degree | $64,833 | $31,398 |
| Graduate Degree | $87,589 | $60,179 |
| Total | $51,421 | $31,812 |
Family Income in Cleveland
Family Income Brackets in Cleveland
According to the Cleveland family income data, there are 532 families falling into the $50,000 to $74,999 income range, which is the most common income bracket and makes up 23.3% of all families. Conversely, the $150,000 to $199,999 income bracket is the least frequent group with only 9 families (0.4%) belonging to this category.
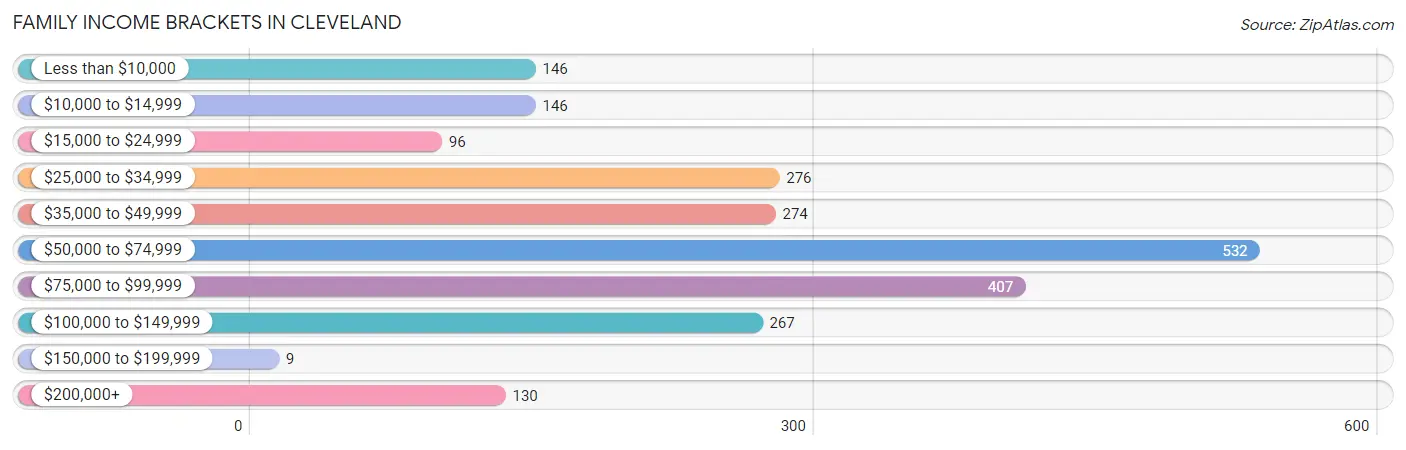
| Income Bracket | # Families | % Families |
| Less than $10,000 | 146 | 6.4% |
| $10,000 to $14,999 | 146 | 6.4% |
| $15,000 to $24,999 | 96 | 4.2% |
| $25,000 to $34,999 | 276 | 12.1% |
| $35,000 to $49,999 | 274 | 12.0% |
| $50,000 to $74,999 | 532 | 23.3% |
| $75,000 to $99,999 | 407 | 17.8% |
| $100,000 to $149,999 | 267 | 11.7% |
| $150,000 to $199,999 | 9 | 0.4% |
| $200,000+ | 130 | 5.7% |
Family Income by Famaliy Size in Cleveland
6-person families (29 | 1.3%) account for the highest median family income in Cleveland with $98,274 per family, while 2-person families (1,085 | 47.5%) have the highest median income of $26,213 per family member.
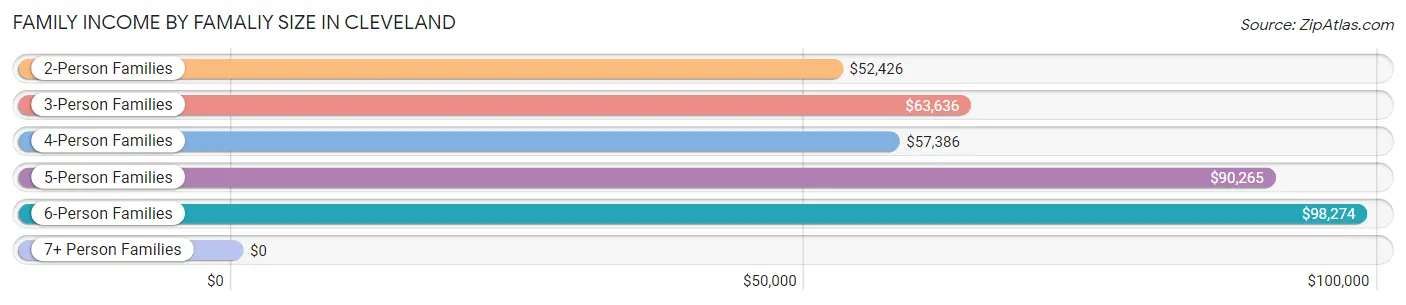
| Income Bracket | # Families | Median Income |
| 2-Person Families | 1,085 (47.5%) | $52,426 |
| 3-Person Families | 466 (20.4%) | $63,636 |
| 4-Person Families | 441 (19.3%) | $57,386 |
| 5-Person Families | 211 (9.2%) | $90,265 |
| 6-Person Families | 29 (1.3%) | $98,274 |
| 7+ Person Families | 52 (2.3%) | $0 |
| Total | 2,284 (100.0%) | $61,196 |
Family Income by Number of Earners in Cleveland
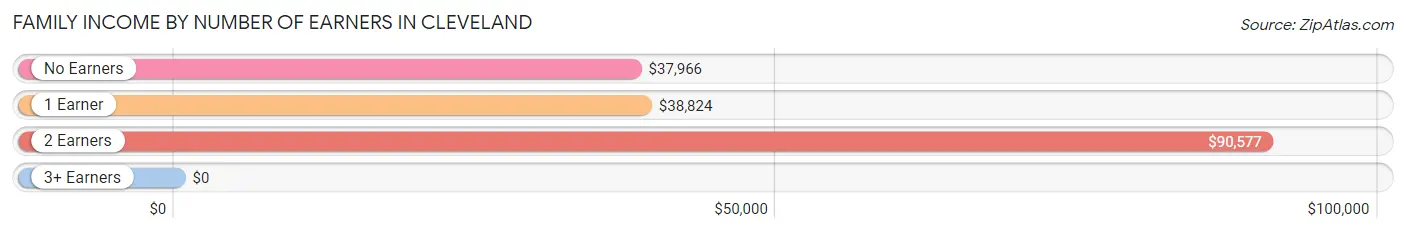
| Number of Earners | # Families | Median Income |
| No Earners | 467 (20.4%) | $37,966 |
| 1 Earner | 968 (42.4%) | $38,824 |
| 2 Earners | 762 (33.4%) | $90,577 |
| 3+ Earners | 87 (3.8%) | $0 |
| Total | 2,284 (100.0%) | $61,196 |
Household Income in Cleveland
Household Income Brackets in Cleveland
With 607 households falling in the category, the $50,000 to $74,999 income range is the most frequent in Cleveland, accounting for 15.2% of all households. In contrast, only 48 households (1.2%) fall into the $150,000 to $199,999 income bracket, making it the least populous group.
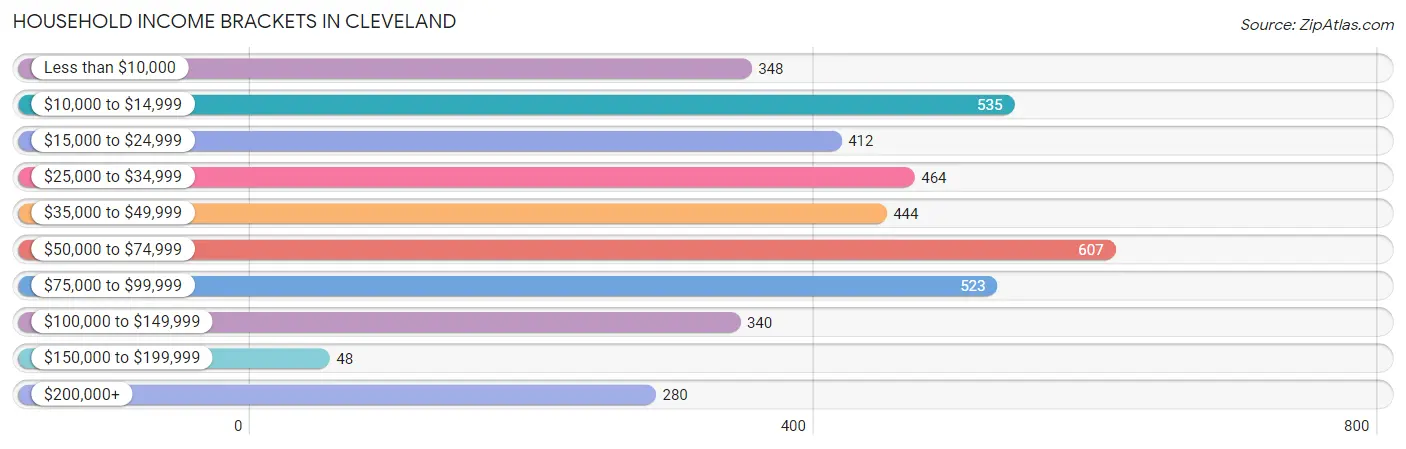
| Income Bracket | # Households | % Households |
| Less than $10,000 | 348 | 8.7% |
| $10,000 to $14,999 | 535 | 13.4% |
| $15,000 to $24,999 | 412 | 10.3% |
| $25,000 to $34,999 | 464 | 11.6% |
| $35,000 to $49,999 | 444 | 11.1% |
| $50,000 to $74,999 | 607 | 15.2% |
| $75,000 to $99,999 | 523 | 13.1% |
| $100,000 to $149,999 | 340 | 8.5% |
| $150,000 to $199,999 | 48 | 1.2% |
| $200,000+ | 280 | 7.0% |
Household Income by Householder Age in Cleveland
The median household income in Cleveland is $42,005, with the highest median household income of $71,232 found in the 25 to 44 years age bracket for the primary householder. A total of 1,242 households (31.1%) fall into this category. Meanwhile, the 15 to 24 years age bracket for the primary householder has the lowest median household income of $0, with 230 households (5.8%) in this group.
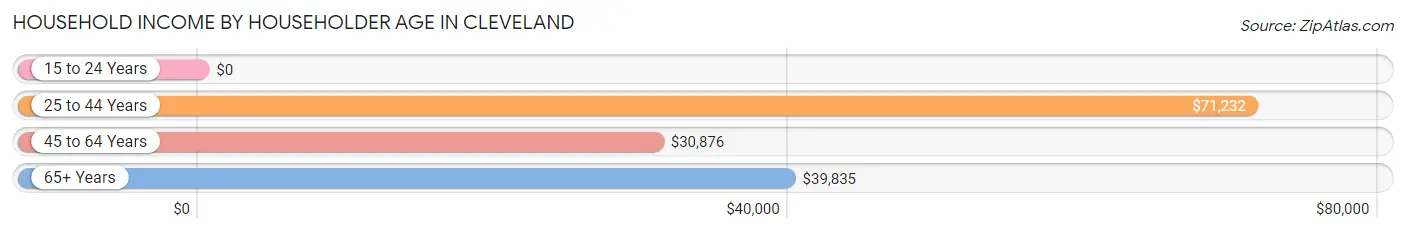
| Income Bracket | # Households | Median Income |
| 15 to 24 Years | 230 (5.8%) | $0 |
| 25 to 44 Years | 1,242 (31.1%) | $71,232 |
| 45 to 64 Years | 1,505 (37.7%) | $30,876 |
| 65+ Years | 1,019 (25.5%) | $39,835 |
| Total | 3,996 (100.0%) | $42,005 |
Poverty in Cleveland
Income Below Poverty by Sex and Age in Cleveland
With 20.5% poverty level for males and 35.8% for females among the residents of Cleveland, 15 year old males and 15 year old females are the most vulnerable to poverty, with 30 males (100.0%) and 80 females (86.0%) in their respective age groups living below the poverty level.
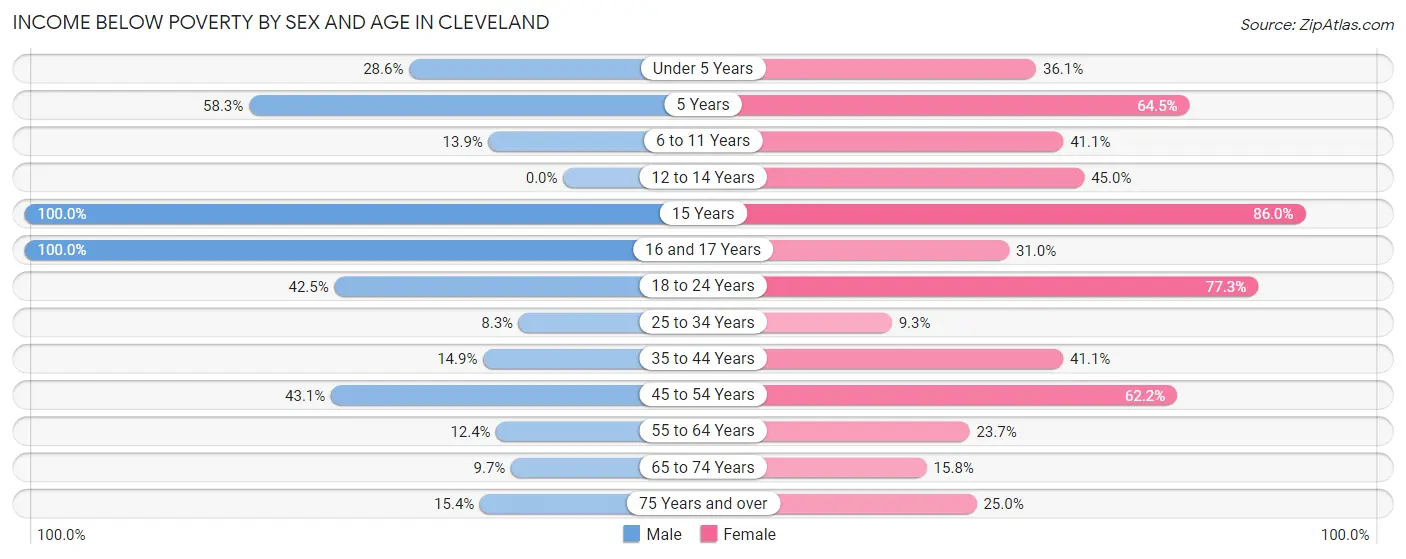
| Age Bracket | Male | Female |
| Under 5 Years | 95 (28.6%) | 159 (36.0%) |
| 5 Years | 28 (58.3%) | 20 (64.5%) |
| 6 to 11 Years | 56 (13.9%) | 150 (41.1%) |
| 12 to 14 Years | 0 (0.0%) | 36 (45.0%) |
| 15 Years | 30 (100.0%) | 80 (86.0%) |
| 16 and 17 Years | 36 (100.0%) | 45 (31.0%) |
| 18 to 24 Years | 155 (42.5%) | 292 (77.2%) |
| 25 to 34 Years | 61 (8.3%) | 64 (9.3%) |
| 35 to 44 Years | 116 (14.9%) | 219 (41.1%) |
| 45 to 54 Years | 244 (43.1%) | 351 (62.2%) |
| 55 to 64 Years | 60 (12.4%) | 191 (23.7%) |
| 65 to 74 Years | 38 (9.7%) | 69 (15.8%) |
| 75 Years and over | 46 (15.4%) | 97 (25.0%) |
| Total | 965 (20.5%) | 1,773 (35.8%) |
Income Above Poverty by Sex and Age in Cleveland
According to the poverty statistics in Cleveland, males aged 12 to 14 years and females aged 25 to 34 years are the age groups that are most secure financially, with 100.0% of males and 90.7% of females in these age groups living above the poverty line.
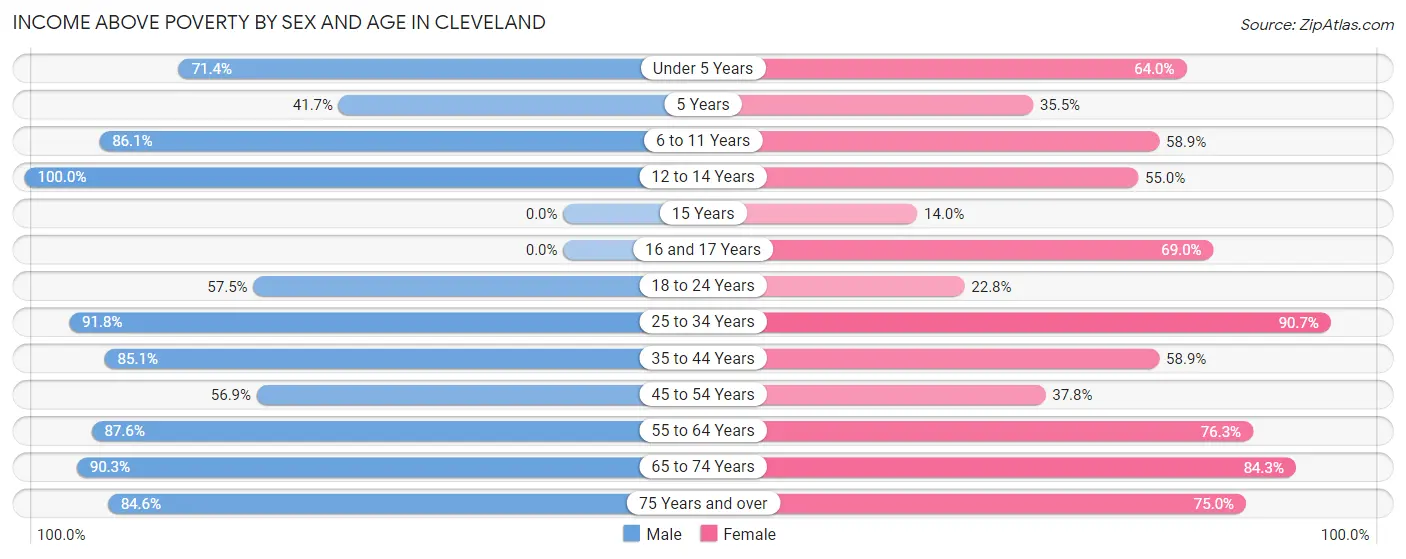
| Age Bracket | Male | Female |
| Under 5 Years | 237 (71.4%) | 282 (63.9%) |
| 5 Years | 20 (41.7%) | 11 (35.5%) |
| 6 to 11 Years | 348 (86.1%) | 215 (58.9%) |
| 12 to 14 Years | 225 (100.0%) | 44 (55.0%) |
| 15 Years | 0 (0.0%) | 13 (14.0%) |
| 16 and 17 Years | 0 (0.0%) | 100 (69.0%) |
| 18 to 24 Years | 210 (57.5%) | 86 (22.8%) |
| 25 to 34 Years | 678 (91.7%) | 627 (90.7%) |
| 35 to 44 Years | 664 (85.1%) | 314 (58.9%) |
| 45 to 54 Years | 322 (56.9%) | 213 (37.8%) |
| 55 to 64 Years | 423 (87.6%) | 615 (76.3%) |
| 65 to 74 Years | 354 (90.3%) | 369 (84.3%) |
| 75 Years and over | 252 (84.6%) | 291 (75.0%) |
| Total | 3,733 (79.5%) | 3,180 (64.2%) |
Income Below Poverty Among Married-Couple Families in Cleveland
The poverty statistics for married-couple families in Cleveland show that 13.0% or 165 of the total 1,270 families live below the poverty line. Families with 3 or 4 children have the highest poverty rate of 42.6%, comprising of 46 families. On the other hand, families with no children have the lowest poverty rate of 7.7%, which includes 57 families.
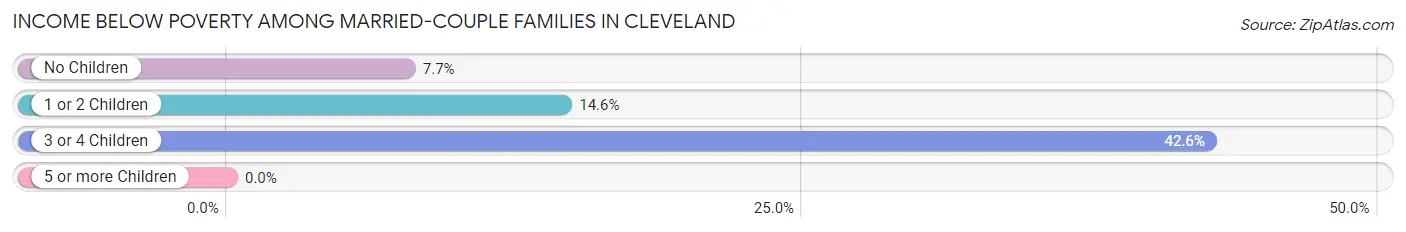
| Children | Above Poverty | Below Poverty |
| No Children | 679 (92.3%) | 57 (7.7%) |
| 1 or 2 Children | 364 (85.5%) | 62 (14.5%) |
| 3 or 4 Children | 62 (57.4%) | 46 (42.6%) |
| 5 or more Children | 0 (0.0%) | 0 (0.0%) |
| Total | 1,105 (87.0%) | 165 (13.0%) |
Income Below Poverty Among Single-Parent Households in Cleveland
According to the poverty data in Cleveland, 9.8% or 38 single-father households and 41.6% or 260 single-mother households are living below the poverty line. Among single-father households, those with 3 or 4 children have the highest poverty rate, with 19 households (16.1%) experiencing poverty. Likewise, among single-mother households, those with 1 or 2 children have the highest poverty rate, with 210 households (69.1%) falling below the poverty line.
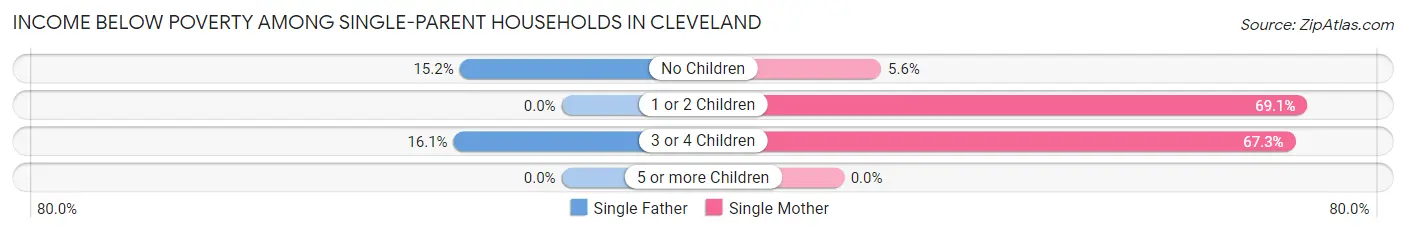
| Children | Single Father | Single Mother |
| No Children | 19 (15.2%) | 15 (5.6%) |
| 1 or 2 Children | 0 (0.0%) | 210 (69.1%) |
| 3 or 4 Children | 19 (16.1%) | 35 (67.3%) |
| 5 or more Children | 0 (0.0%) | 0 (0.0%) |
| Total | 38 (9.8%) | 260 (41.6%) |
Income Below Poverty Among Married-Couple vs Single-Parent Households in Cleveland
The poverty data for Cleveland shows that 165 of the married-couple family households (13.0%) and 298 of the single-parent households (29.4%) are living below the poverty level. Within the married-couple family households, those with 3 or 4 children have the highest poverty rate, with 46 households (42.6%) falling below the poverty line. Among the single-parent households, those with 1 or 2 children have the highest poverty rate, with 210 household (46.7%) living below poverty.
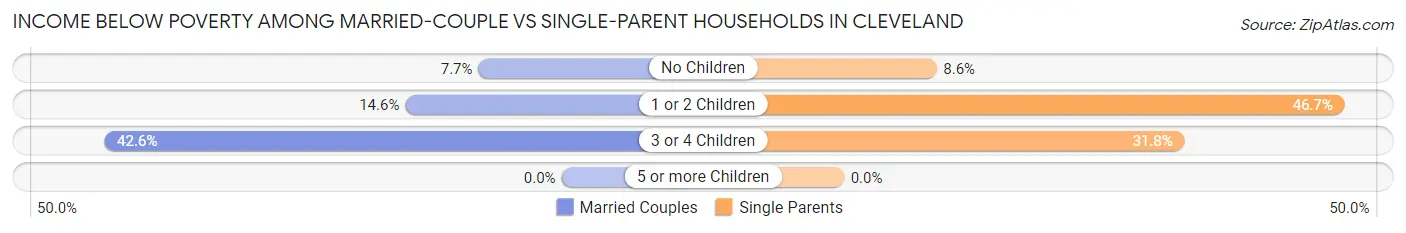
| Children | Married-Couple Families | Single-Parent Households |
| No Children | 57 (7.7%) | 34 (8.6%) |
| 1 or 2 Children | 62 (14.5%) | 210 (46.7%) |
| 3 or 4 Children | 46 (42.6%) | 54 (31.8%) |
| 5 or more Children | 0 (0.0%) | 0 (0.0%) |
| Total | 165 (13.0%) | 298 (29.4%) |
Race in Cleveland
The most populous races in Cleveland are Black / African American (5,859 | 52.9%), White / Caucasian (4,501 | 40.6%), and Two or more Races (518 | 4.7%).
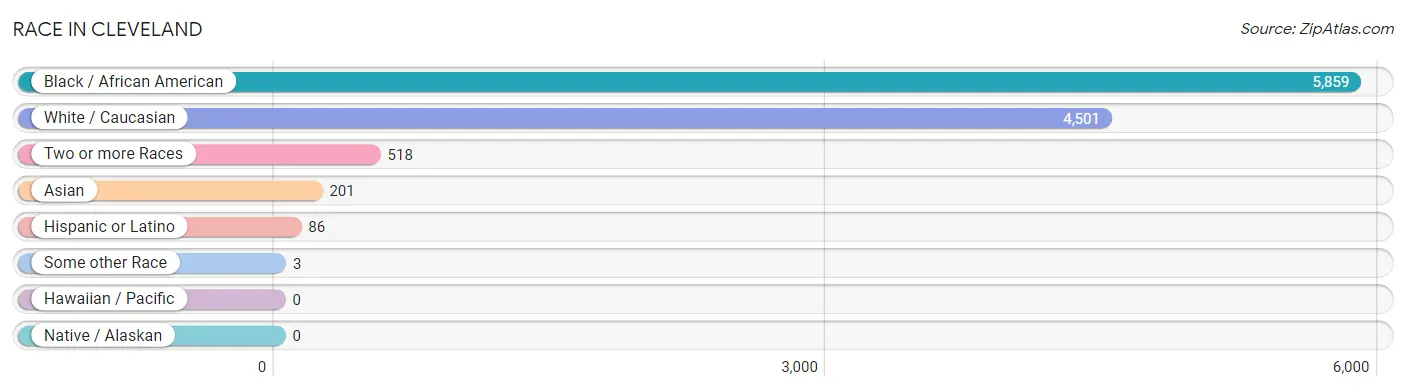
| Race | # Population | % Population |
| Asian | 201 | 1.8% |
| Black / African American | 5,859 | 52.9% |
| Hawaiian / Pacific | 0 | 0.0% |
| Hispanic or Latino | 86 | 0.8% |
| Native / Alaskan | 0 | 0.0% |
| White / Caucasian | 4,501 | 40.6% |
| Two or more Races | 518 | 4.7% |
| Some other Race | 3 | 0.0% |
| Total | 11,082 | 100.0% |
Ancestry in Cleveland
The most populous ancestries reported in Cleveland are English (1,012 | 9.1%), Irish (568 | 5.1%), Italian (516 | 4.7%), American (383 | 3.5%), and German (283 | 2.5%), together accounting for 24.9% of all Cleveland residents.
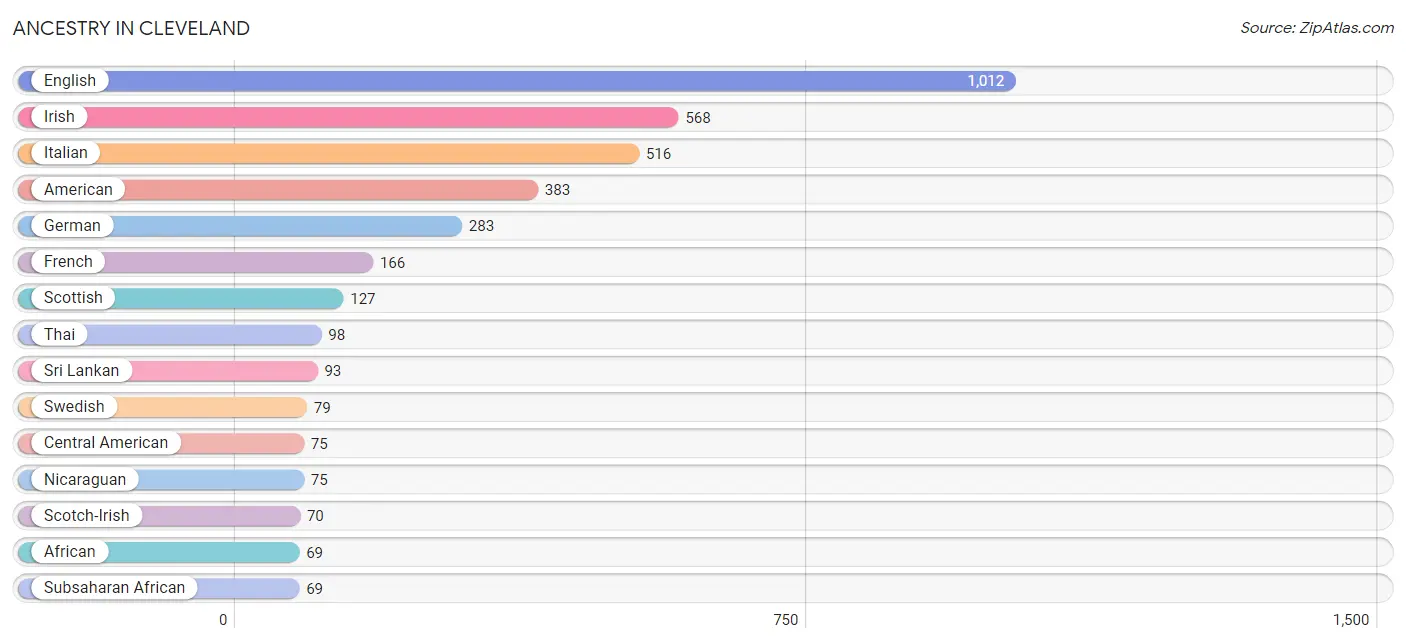
| Ancestry | # Population | % Population |
| African | 69 | 0.6% |
| American | 383 | 3.5% |
| Arab | 42 | 0.4% |
| Australian | 52 | 0.5% |
| Burmese | 16 | 0.1% |
| Central American | 75 | 0.7% |
| Eastern European | 13 | 0.1% |
| English | 1,012 | 9.1% |
| European | 67 | 0.6% |
| French | 166 | 1.5% |
| German | 283 | 2.5% |
| Haitian | 31 | 0.3% |
| Indian (Asian) | 45 | 0.4% |
| Irish | 568 | 5.1% |
| Italian | 516 | 4.7% |
| Lebanese | 42 | 0.4% |
| Mexican | 11 | 0.1% |
| Mongolian | 7 | 0.1% |
| Nicaraguan | 75 | 0.7% |
| Northern European | 33 | 0.3% |
| Polish | 25 | 0.2% |
| Romanian | 17 | 0.2% |
| Scotch-Irish | 70 | 0.6% |
| Scottish | 127 | 1.1% |
| Sri Lankan | 93 | 0.8% |
| Subsaharan African | 69 | 0.6% |
| Swedish | 79 | 0.7% |
| Thai | 98 | 0.9% |
| Welsh | 56 | 0.5% | View All 29 Rows |
Immigrants in Cleveland
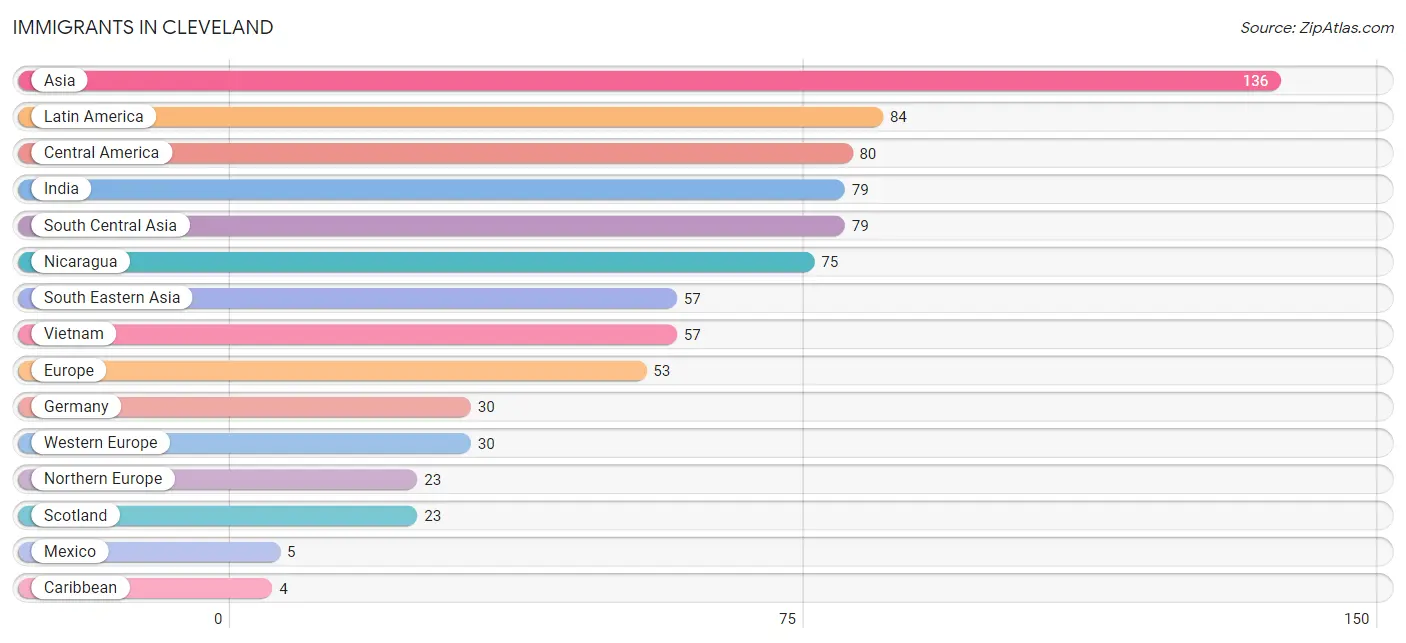
The most numerous immigrant groups reported in Cleveland came from Asia (136 | 1.2%), Latin America (84 | 0.8%), Central America (80 | 0.7%), India (79 | 0.7%), and South Central Asia (79 | 0.7%), together accounting for 4.1% of all Cleveland residents.
| Immigration Origin | # Population | % Population |
| Asia | 136 | 1.2% |
| Caribbean | 4 | 0.0% |
| Central America | 80 | 0.7% |
| Europe | 53 | 0.5% |
| Germany | 30 | 0.3% |
| Haiti | 4 | 0.0% |
| India | 79 | 0.7% |
| Latin America | 84 | 0.8% |
| Mexico | 5 | 0.1% |
| Nicaragua | 75 | 0.7% |
| Northern Europe | 23 | 0.2% |
| Scotland | 23 | 0.2% |
| South Central Asia | 79 | 0.7% |
| South Eastern Asia | 57 | 0.5% |
| Vietnam | 57 | 0.5% |
| Western Europe | 30 | 0.3% | View All 16 Rows |
Sex and Age in Cleveland
Sex and Age in Cleveland
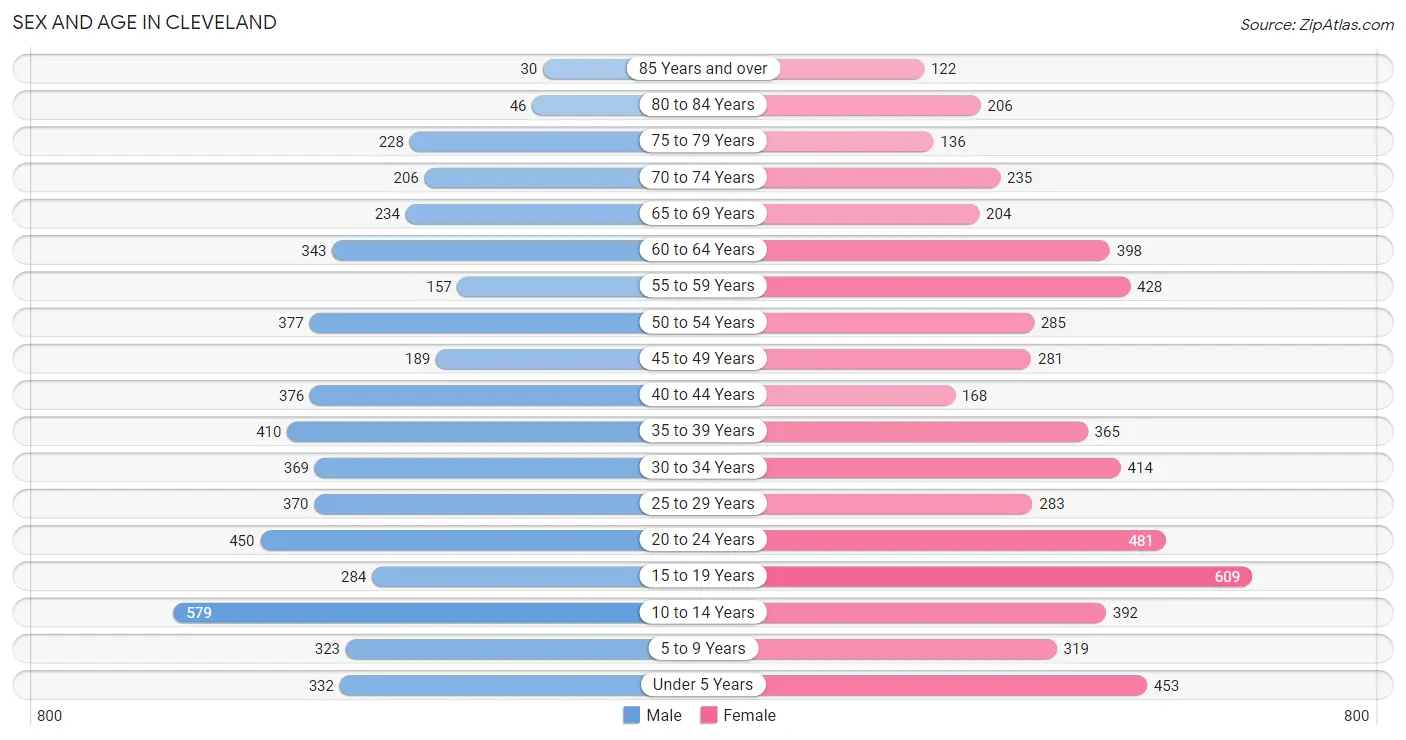
The most populous age groups in Cleveland are 10 to 14 Years (579 | 10.9%) for men and 15 to 19 Years (609 | 10.5%) for women.
| Age Bracket | Male | Female |
| Under 5 Years | 332 (6.3%) | 453 (7.8%) |
| 5 to 9 Years | 323 (6.1%) | 319 (5.5%) |
| 10 to 14 Years | 579 (10.9%) | 392 (6.8%) |
| 15 to 19 Years | 284 (5.4%) | 609 (10.5%) |
| 20 to 24 Years | 450 (8.5%) | 481 (8.3%) |
| 25 to 29 Years | 370 (7.0%) | 283 (4.9%) |
| 30 to 34 Years | 369 (7.0%) | 414 (7.2%) |
| 35 to 39 Years | 410 (7.7%) | 365 (6.3%) |
| 40 to 44 Years | 376 (7.1%) | 168 (2.9%) |
| 45 to 49 Years | 189 (3.6%) | 281 (4.9%) |
| 50 to 54 Years | 377 (7.1%) | 285 (4.9%) |
| 55 to 59 Years | 157 (3.0%) | 428 (7.4%) |
| 60 to 64 Years | 343 (6.5%) | 398 (6.9%) |
| 65 to 69 Years | 234 (4.4%) | 204 (3.5%) |
| 70 to 74 Years | 206 (3.9%) | 235 (4.1%) |
| 75 to 79 Years | 228 (4.3%) | 136 (2.4%) |
| 80 to 84 Years | 46 (0.9%) | 206 (3.6%) |
| 85 Years and over | 30 (0.6%) | 122 (2.1%) |
| Total | 5,303 (100.0%) | 5,779 (100.0%) |
Families and Households in Cleveland
Median Family Size in Cleveland
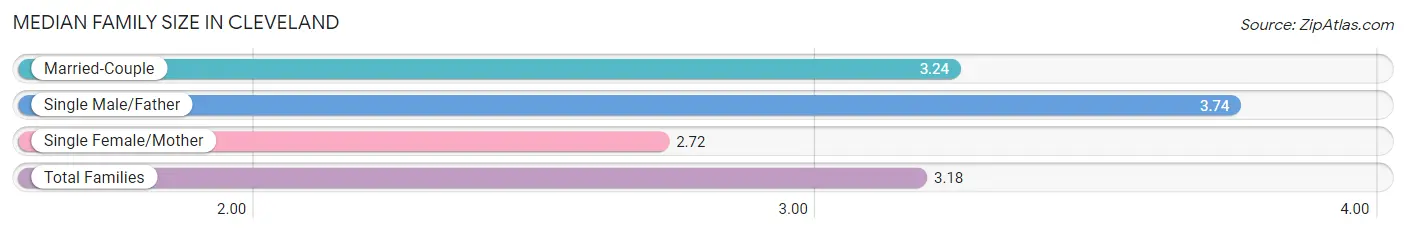
The median family size in Cleveland is 3.18 persons per family, with single male/father families (389 | 17.0%) accounting for the largest median family size of 3.74 persons per family. On the other hand, single female/mother families (625 | 27.4%) represent the smallest median family size with 2.72 persons per family.
| Family Type | # Families | Family Size |
| Married-Couple | 1,270 (55.6%) | 3.24 |
| Single Male/Father | 389 (17.0%) | 3.74 |
| Single Female/Mother | 625 (27.4%) | 2.72 |
| Total Families | 2,284 (100.0%) | 3.18 |
Median Household Size in Cleveland
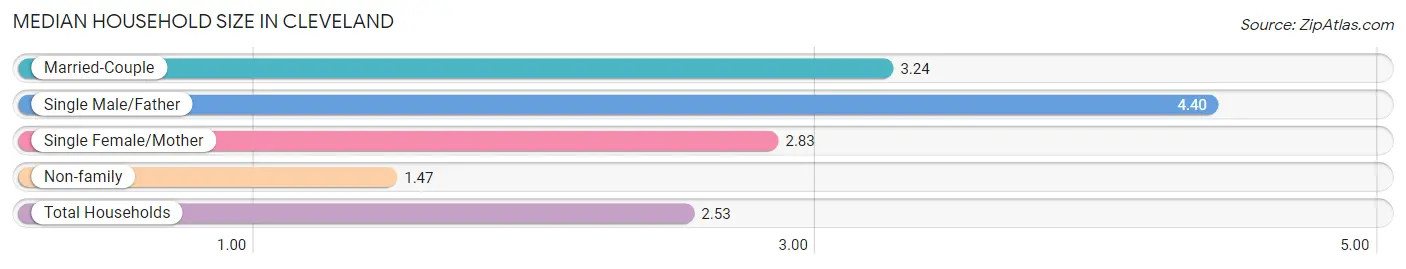
The median household size in Cleveland is 2.53 persons per household, with single male/father households (389 | 9.7%) accounting for the largest median household size of 4.4 persons per household. non-family households (1,712 | 42.8%) represent the smallest median household size with 1.47 persons per household.
| Household Type | # Households | Household Size |
| Married-Couple | 1,270 (31.8%) | 3.24 |
| Single Male/Father | 389 (9.7%) | 4.40 |
| Single Female/Mother | 625 (15.6%) | 2.83 |
| Non-family | 1,712 (42.8%) | 1.47 |
| Total Households | 3,996 (100.0%) | 2.53 |
Household Size by Marriage Status in Cleveland
Out of a total of 3,996 households in Cleveland, 2,284 (57.2%) are family households, while 1,712 (42.8%) are nonfamily households. The most numerous type of family households are 2-person households, comprising 1,026, and the most common type of nonfamily households are 1-person households, comprising 1,430.
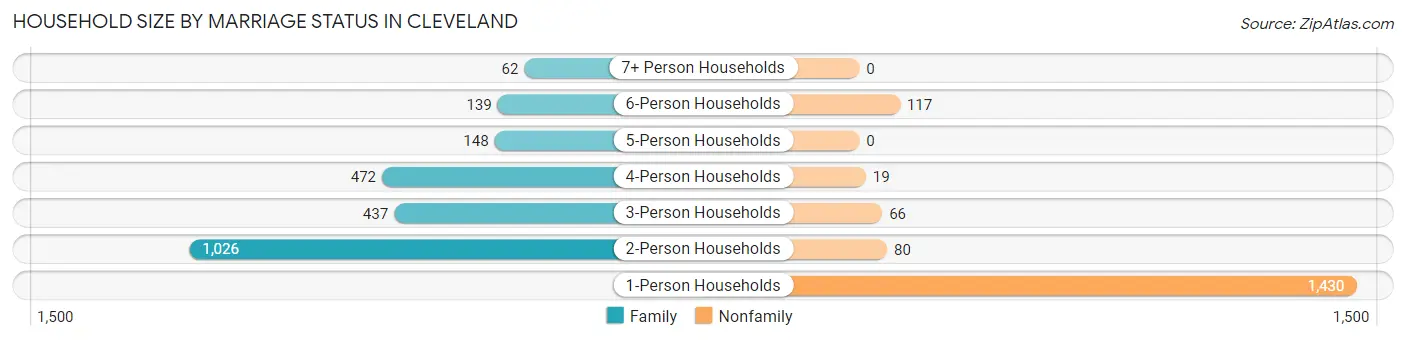
| Household Size | Family Households | Nonfamily Households |
| 1-Person Households | - | 1,430 (35.8%) |
| 2-Person Households | 1,026 (25.7%) | 80 (2.0%) |
| 3-Person Households | 437 (10.9%) | 66 (1.7%) |
| 4-Person Households | 472 (11.8%) | 19 (0.5%) |
| 5-Person Households | 148 (3.7%) | 0 (0.0%) |
| 6-Person Households | 139 (3.5%) | 117 (2.9%) |
| 7+ Person Households | 62 (1.5%) | 0 (0.0%) |
| Total | 2,284 (57.2%) | 1,712 (42.8%) |
Female Fertility in Cleveland
Fertility by Age in Cleveland
Average fertility rate in Cleveland is 26.0 births per 1,000 women. Women in the age bracket of 20 to 34 years have the highest fertility rate with 42.0 births per 1,000 women. Women in the age bracket of 20 to 34 years acount for 73.5% of all women with births.
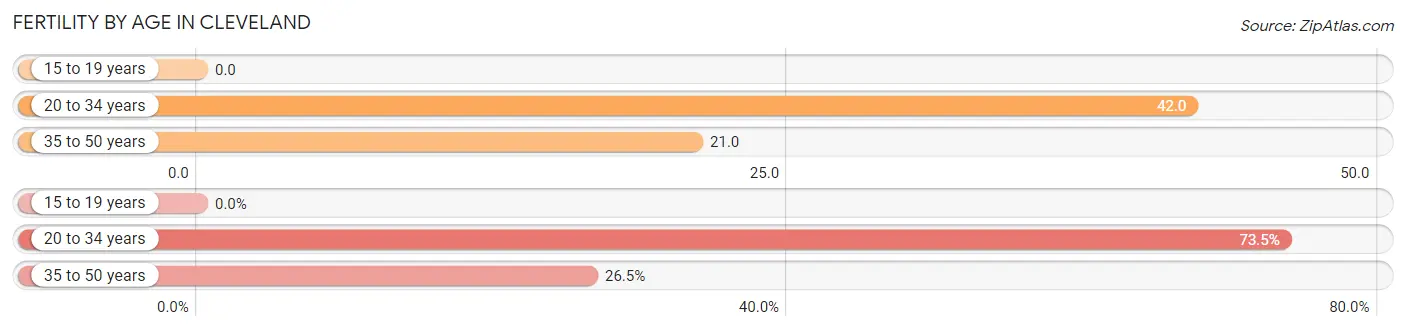
| Age Bracket | Women with Births | Births / 1,000 Women |
| 15 to 19 years | 0 (0.0%) | 0.0 |
| 20 to 34 years | 50 (73.5%) | 42.0 |
| 35 to 50 years | 18 (26.5%) | 21.0 |
| Total | 68 (100.0%) | 26.0 |
Fertility by Age by Marriage Status in Cleveland
35.3% of women with births (68) in Cleveland are married. The highest percentage of unmarried women with births falls into 35 to 50 years age bracket with 100.0% of them unmarried at the time of birth, while the lowest percentage of unmarried women with births belong to 20 to 34 years age bracket with 52.0% of them unmarried.
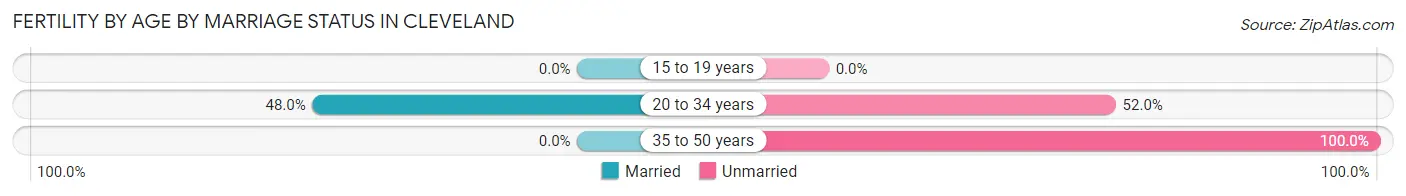
| Age Bracket | Married | Unmarried |
| 15 to 19 years | 0 (0.0%) | 0 (0.0%) |
| 20 to 34 years | 24 (48.0%) | 26 (52.0%) |
| 35 to 50 years | 0 (0.0%) | 18 (100.0%) |
| Total | 24 (35.3%) | 44 (64.7%) |
Fertility by Education in Cleveland
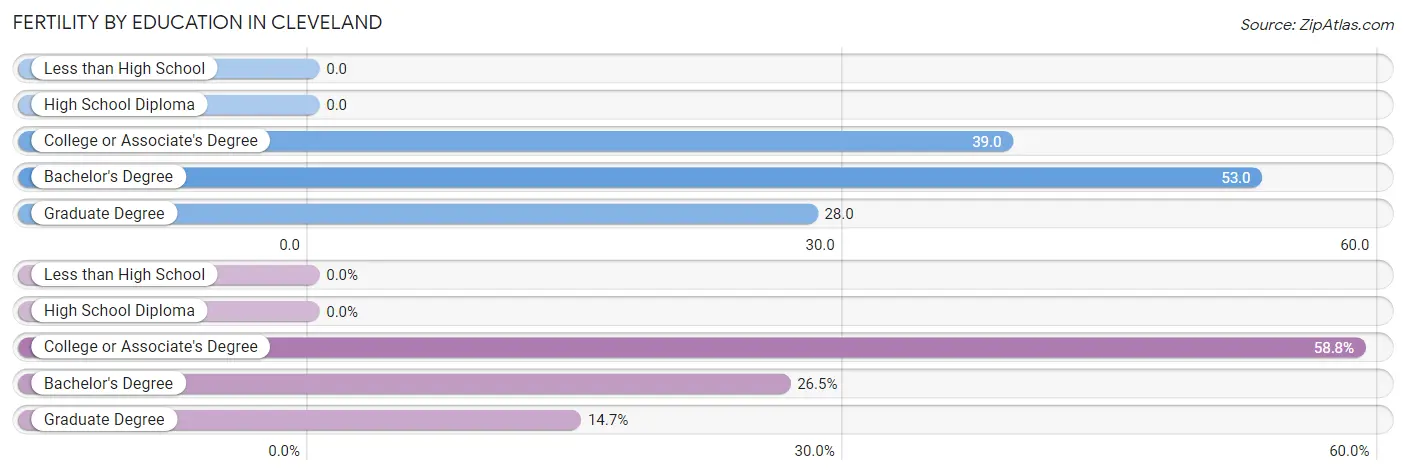
| Educational Attainment | Women with Births | Births / 1,000 Women |
| Less than High School | 0 (0.0%) | 0.0 |
| High School Diploma | 0 (0.0%) | 0.0 |
| College or Associate's Degree | 40 (58.8%) | 39.0 |
| Bachelor's Degree | 18 (26.5%) | 53.0 |
| Graduate Degree | 10 (14.7%) | 28.0 |
| Total | 68 (100.0%) | 26.0 |
Fertility by Education by Marriage Status in Cleveland
64.7% of women with births in Cleveland are unmarried. Women with the educational attainment of graduate degree are most likely to be married with 100.0% of them married at childbirth, while women with the educational attainment of bachelor's degree are least likely to be married with 100.0% of them unmarried at childbirth.
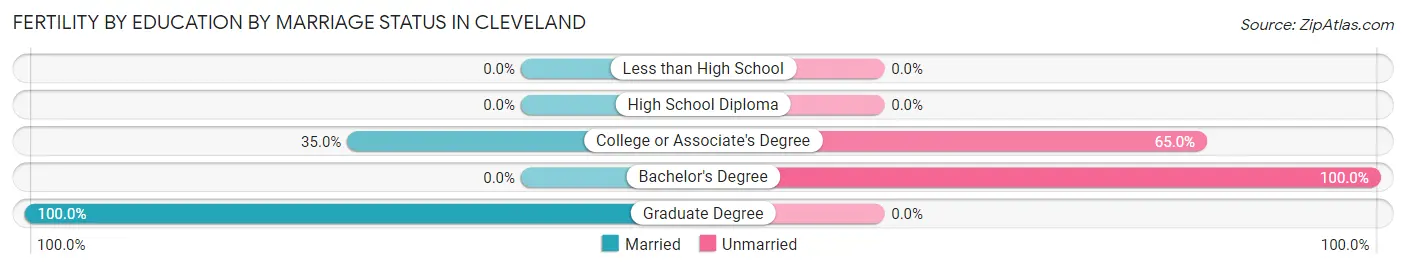
| Educational Attainment | Married | Unmarried |
| Less than High School | 0 (0.0%) | 0 (0.0%) |
| High School Diploma | 0 (0.0%) | 0 (0.0%) |
| College or Associate's Degree | 14 (35.0%) | 26 (65.0%) |
| Bachelor's Degree | 0 (0.0%) | 18 (100.0%) |
| Graduate Degree | 10 (100.0%) | 0 (0.0%) |
| Total | 24 (35.3%) | 44 (64.7%) |
Employment Characteristics in Cleveland
Employment by Class of Employer in Cleveland
Among the 3,919 employed individuals in Cleveland, private company employees (2,060 | 52.6%), state government employees (687 | 17.5%), and local government employees (420 | 10.7%) make up the most common classes of employment.
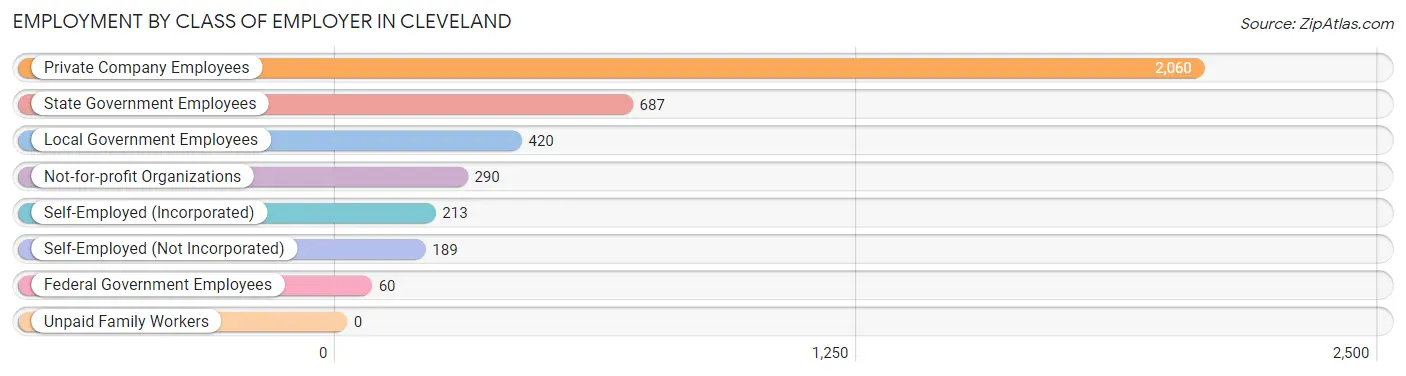
| Employer Class | # Employees | % Employees |
| Private Company Employees | 2,060 | 52.6% |
| Self-Employed (Incorporated) | 213 | 5.4% |
| Self-Employed (Not Incorporated) | 189 | 4.8% |
| Not-for-profit Organizations | 290 | 7.4% |
| Local Government Employees | 420 | 10.7% |
| State Government Employees | 687 | 17.5% |
| Federal Government Employees | 60 | 1.5% |
| Unpaid Family Workers | 0 | 0.0% |
| Total | 3,919 | 100.0% |
Employment Status by Age in Cleveland
According to the labor force statistics for Cleveland, out of the total population over 16 years of age (8,561), 50.7% or 4,340 individuals are in the labor force, with 7.4% or 321 of them unemployed. The age group with the highest labor force participation rate is 35 to 44 years, with 86.2% or 1,137 individuals in the labor force. Within the labor force, the 45 to 54 years age range has the highest percentage of unemployed individuals, with 18.7% or 80 of them being unemployed.
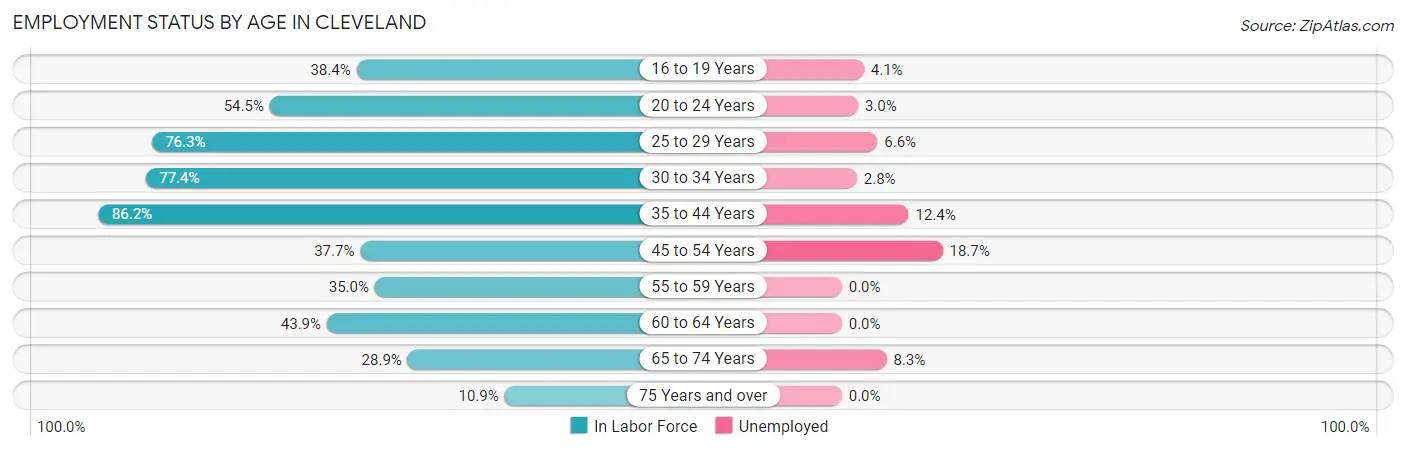
| Age Bracket | In Labor Force | Unemployed |
| 16 to 19 Years | 296 (38.4%) | 12 (4.1%) |
| 20 to 24 Years | 507 (54.5%) | 15 (3.0%) |
| 25 to 29 Years | 498 (76.3%) | 33 (6.6%) |
| 30 to 34 Years | 606 (77.4%) | 17 (2.8%) |
| 35 to 44 Years | 1,137 (86.2%) | 141 (12.4%) |
| 45 to 54 Years | 427 (37.7%) | 80 (18.7%) |
| 55 to 59 Years | 205 (35.0%) | 0 (0.0%) |
| 60 to 64 Years | 325 (43.9%) | 0 (0.0%) |
| 65 to 74 Years | 254 (28.9%) | 21 (8.3%) |
| 75 Years and over | 84 (10.9%) | 0 (0.0%) |
| Total | 4,340 (50.7%) | 321 (7.4%) |
Employment Status by Educational Attainment in Cleveland
According to labor force statistics for Cleveland, 61.3% of individuals (3,196) out of the total population between 25 and 64 years of age (5,213) are in the labor force, with 8.5% or 272 of them being unemployed. The group with the highest labor force participation rate are those with the educational attainment of bachelor's degree or higher, with 84.5% or 1,398 individuals in the labor force. Within the labor force, individuals with less than high school education have the highest percentage of unemployment, with 55.9% or 137 of them being unemployed.
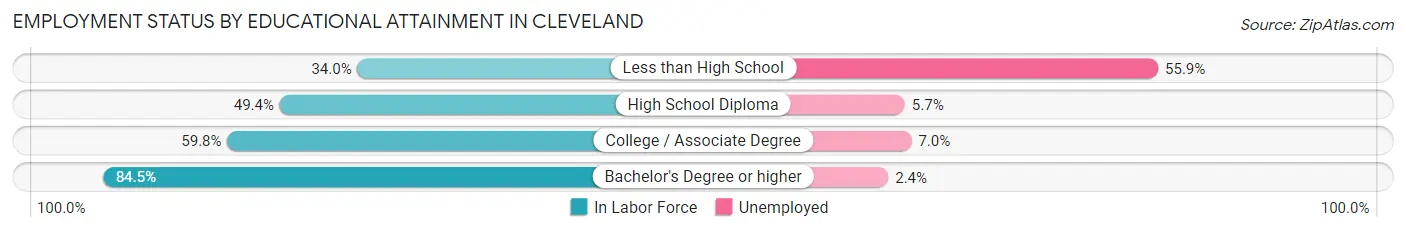
| Educational Attainment | In Labor Force | Unemployed |
| Less than High School | 245 (34.0%) | 403 (55.9%) |
| High School Diploma | 668 (49.4%) | 77 (5.7%) |
| College / Associate Degree | 887 (59.8%) | 104 (7.0%) |
| Bachelor's Degree or higher | 1,398 (84.5%) | 40 (2.4%) |
| Total | 3,196 (61.3%) | 443 (8.5%) |
Employment Occupations by Sex in Cleveland
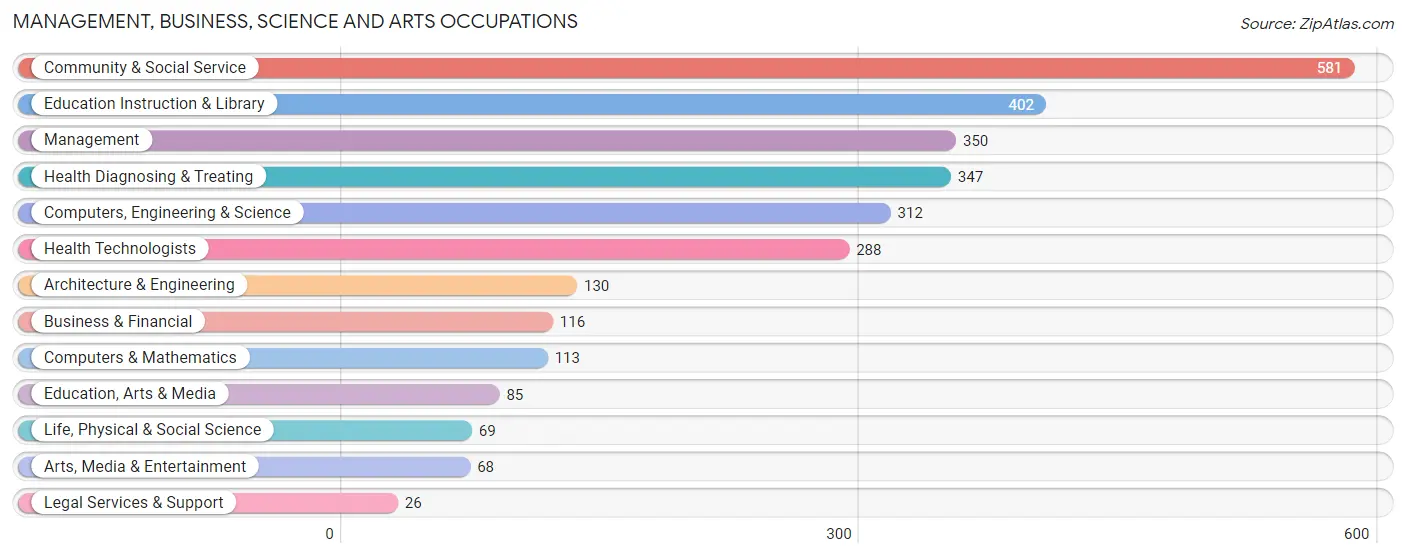
Management, Business, Science and Arts Occupations
The most common Management, Business, Science and Arts occupations in Cleveland are Community & Social Service (581 | 14.4%), Education Instruction & Library (402 | 10.0%), Management (350 | 8.7%), Health Diagnosing & Treating (347 | 8.6%), and Computers, Engineering & Science (312 | 7.8%).
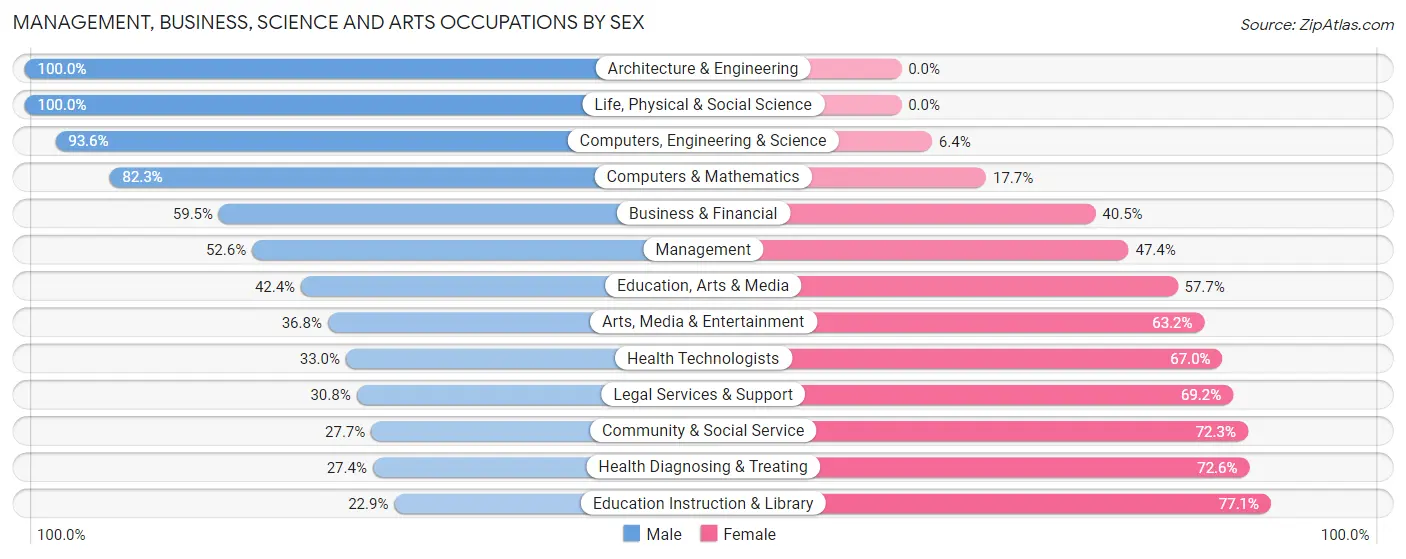
Management, Business, Science and Arts Occupations by Sex
Within the Management, Business, Science and Arts occupations in Cleveland, the most male-oriented occupations are Architecture & Engineering (100.0%), Life, Physical & Social Science (100.0%), and Computers, Engineering & Science (93.6%), while the most female-oriented occupations are Education Instruction & Library (77.1%), Health Diagnosing & Treating (72.6%), and Community & Social Service (72.3%).
| Occupation | Male | Female |
| Management | 184 (52.6%) | 166 (47.4%) |
| Business & Financial | 69 (59.5%) | 47 (40.5%) |
| Computers, Engineering & Science | 292 (93.6%) | 20 (6.4%) |
| Computers & Mathematics | 93 (82.3%) | 20 (17.7%) |
| Architecture & Engineering | 130 (100.0%) | 0 (0.0%) |
| Life, Physical & Social Science | 69 (100.0%) | 0 (0.0%) |
| Community & Social Service | 161 (27.7%) | 420 (72.3%) |
| Education, Arts & Media | 36 (42.3%) | 49 (57.7%) |
| Legal Services & Support | 8 (30.8%) | 18 (69.2%) |
| Education Instruction & Library | 92 (22.9%) | 310 (77.1%) |
| Arts, Media & Entertainment | 25 (36.8%) | 43 (63.2%) |
| Health Diagnosing & Treating | 95 (27.4%) | 252 (72.6%) |
| Health Technologists | 95 (33.0%) | 193 (67.0%) |
| Total (Category) | 801 (46.9%) | 905 (53.0%) |
| Total (Overall) | 1,940 (48.3%) | 2,080 (51.7%) |
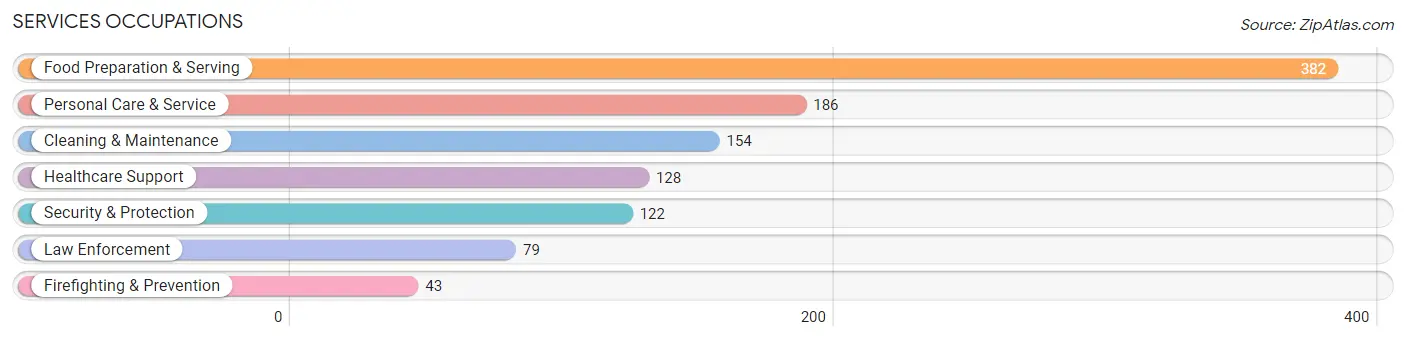
Services Occupations
The most common Services occupations in Cleveland are Food Preparation & Serving (382 | 9.5%), Personal Care & Service (186 | 4.6%), Cleaning & Maintenance (154 | 3.8%), Healthcare Support (128 | 3.2%), and Security & Protection (122 | 3.0%).
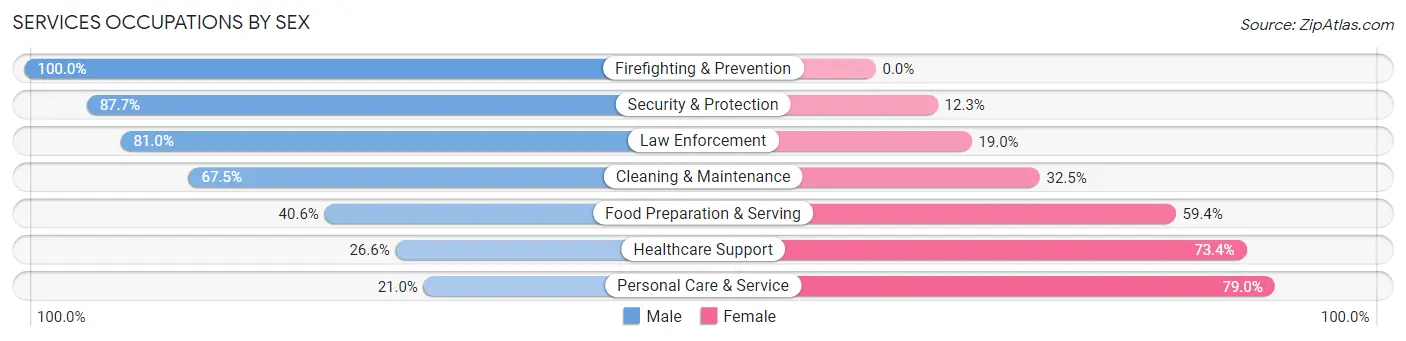
Services Occupations by Sex
Within the Services occupations in Cleveland, the most male-oriented occupations are Firefighting & Prevention (100.0%), Security & Protection (87.7%), and Law Enforcement (81.0%), while the most female-oriented occupations are Personal Care & Service (79.0%), Healthcare Support (73.4%), and Food Preparation & Serving (59.4%).
| Occupation | Male | Female |
| Healthcare Support | 34 (26.6%) | 94 (73.4%) |
| Security & Protection | 107 (87.7%) | 15 (12.3%) |
| Firefighting & Prevention | 43 (100.0%) | 0 (0.0%) |
| Law Enforcement | 64 (81.0%) | 15 (19.0%) |
| Food Preparation & Serving | 155 (40.6%) | 227 (59.4%) |
| Cleaning & Maintenance | 104 (67.5%) | 50 (32.5%) |
| Personal Care & Service | 39 (21.0%) | 147 (79.0%) |
| Total (Category) | 439 (45.2%) | 533 (54.8%) |
| Total (Overall) | 1,940 (48.3%) | 2,080 (51.7%) |
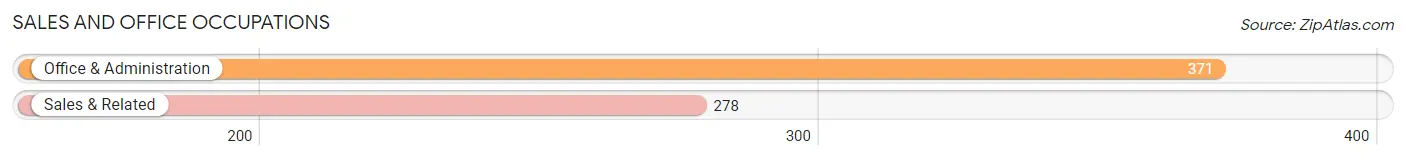
Sales and Office Occupations
The most common Sales and Office occupations in Cleveland are Office & Administration (371 | 9.2%), and Sales & Related (278 | 6.9%).
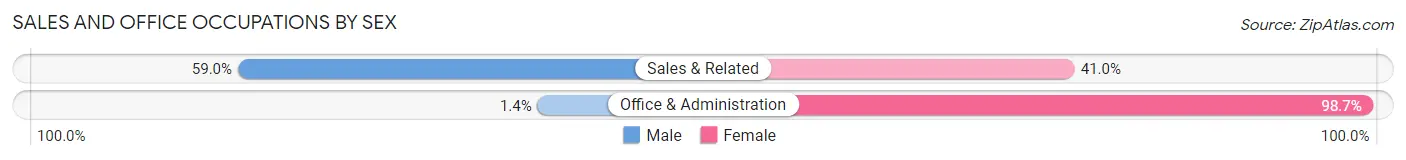
Sales and Office Occupations by Sex
| Occupation | Male | Female |
| Sales & Related | 164 (59.0%) | 114 (41.0%) |
| Office & Administration | 5 (1.3%) | 366 (98.7%) |
| Total (Category) | 169 (26.0%) | 480 (74.0%) |
| Total (Overall) | 1,940 (48.3%) | 2,080 (51.7%) |
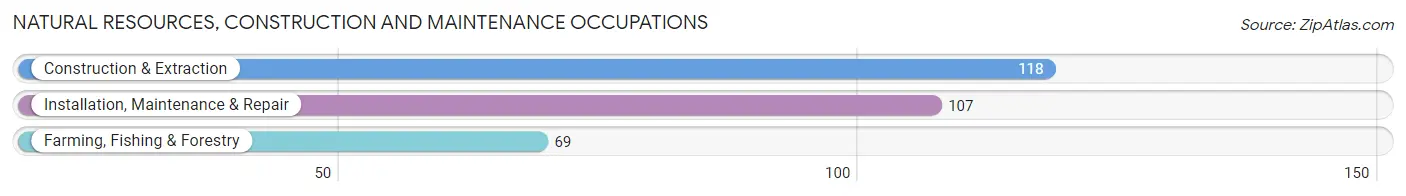
Natural Resources, Construction and Maintenance Occupations
The most common Natural Resources, Construction and Maintenance occupations in Cleveland are Construction & Extraction (118 | 2.9%), Installation, Maintenance & Repair (107 | 2.7%), and Farming, Fishing & Forestry (69 | 1.7%).
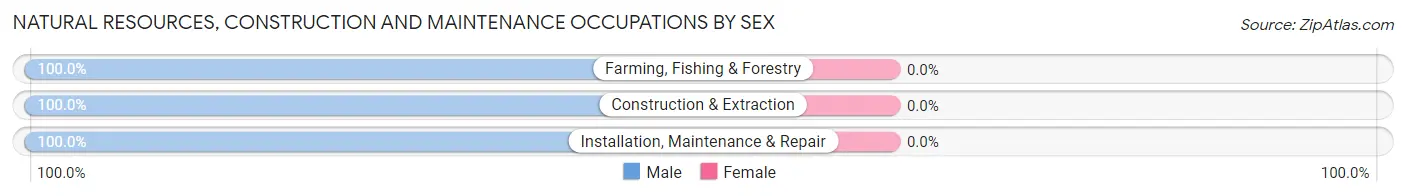
Natural Resources, Construction and Maintenance Occupations by Sex
| Occupation | Male | Female |
| Farming, Fishing & Forestry | 69 (100.0%) | 0 (0.0%) |
| Construction & Extraction | 118 (100.0%) | 0 (0.0%) |
| Installation, Maintenance & Repair | 107 (100.0%) | 0 (0.0%) |
| Total (Category) | 294 (100.0%) | 0 (0.0%) |
| Total (Overall) | 1,940 (48.3%) | 2,080 (51.7%) |
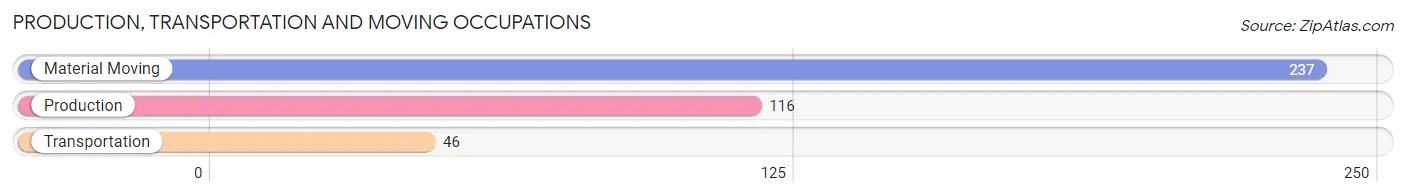
Production, Transportation and Moving Occupations
The most common Production, Transportation and Moving occupations in Cleveland are Material Moving (237 | 5.9%), Production (116 | 2.9%), and Transportation (46 | 1.1%).
Production, Transportation and Moving Occupations by Sex
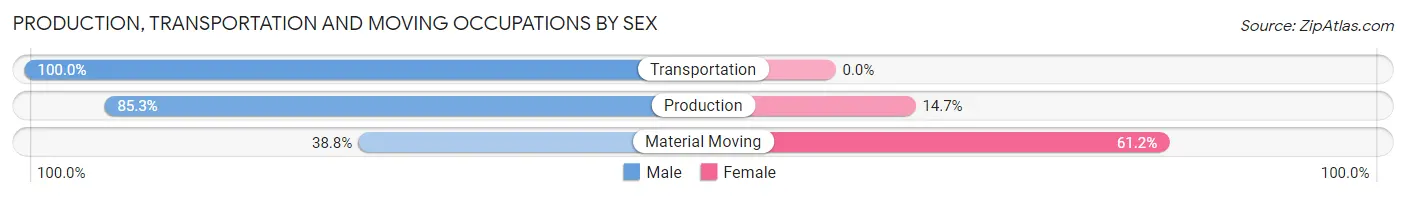
| Occupation | Male | Female |
| Production | 99 (85.3%) | 17 (14.7%) |
| Transportation | 46 (100.0%) | 0 (0.0%) |
| Material Moving | 92 (38.8%) | 145 (61.2%) |
| Total (Category) | 237 (59.4%) | 162 (40.6%) |
| Total (Overall) | 1,940 (48.3%) | 2,080 (51.7%) |
Employment Industries by Sex in Cleveland
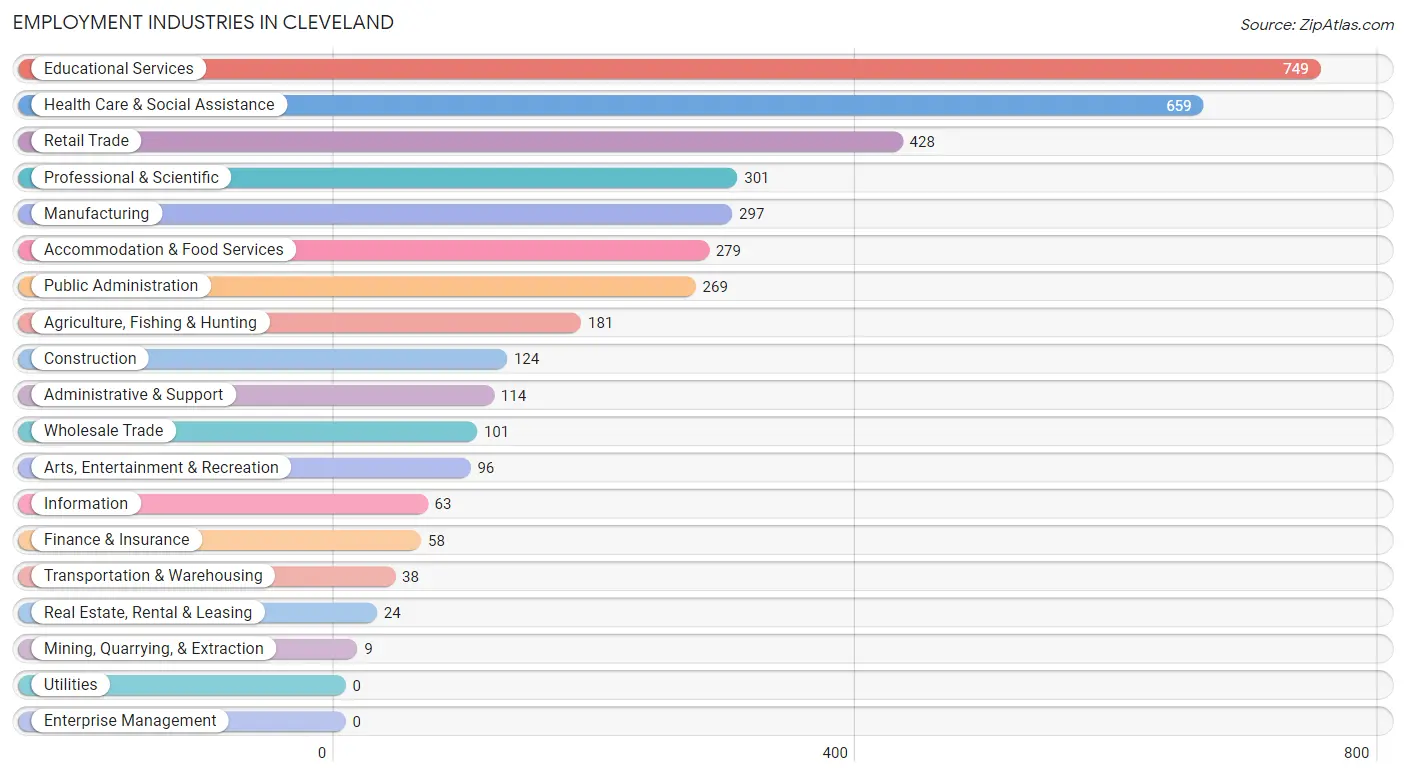
Employment Industries in Cleveland
The major employment industries in Cleveland include Educational Services (749 | 18.6%), Health Care & Social Assistance (659 | 16.4%), Retail Trade (428 | 10.6%), Professional & Scientific (301 | 7.5%), and Manufacturing (297 | 7.4%).
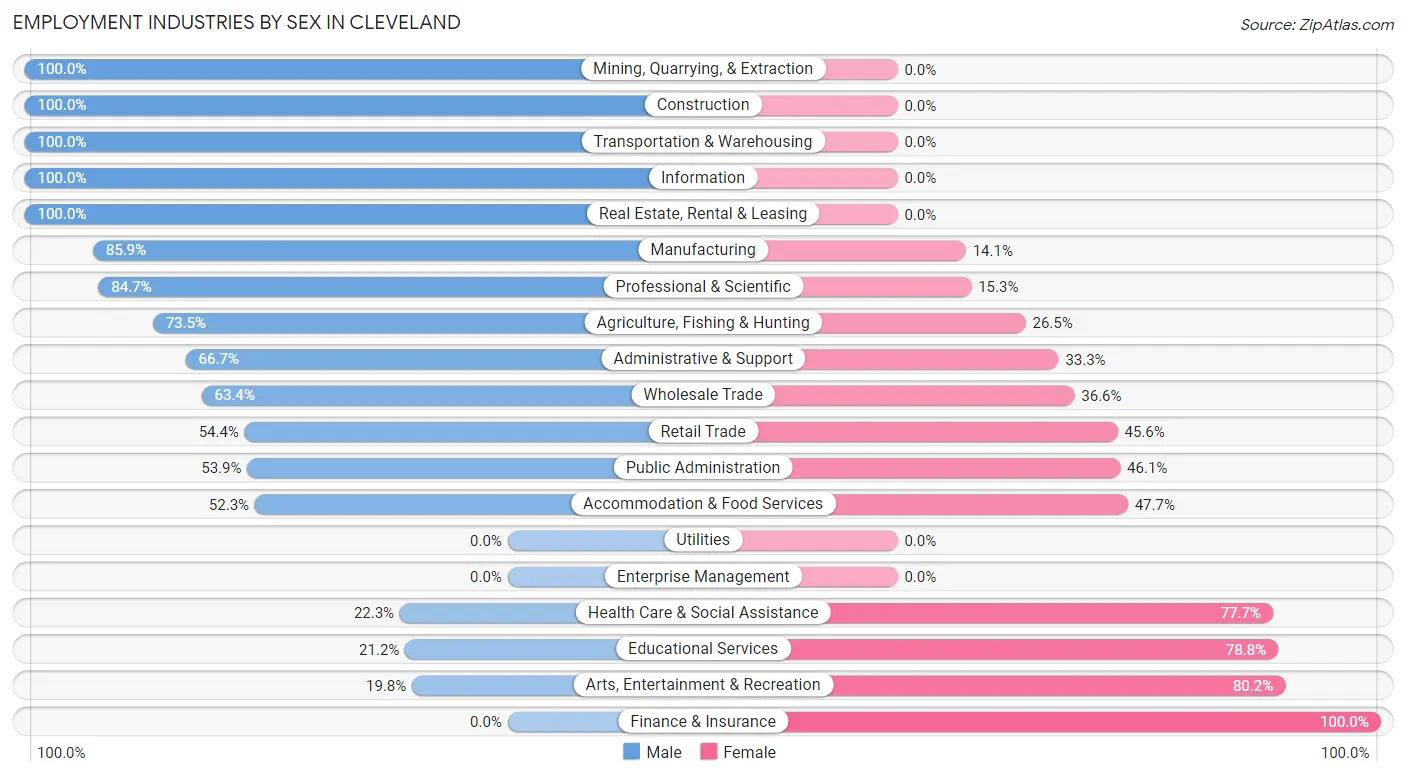
Employment Industries by Sex in Cleveland
The Cleveland industries that see more men than women are Mining, Quarrying, & Extraction (100.0%), Construction (100.0%), and Transportation & Warehousing (100.0%), whereas the industries that tend to have a higher number of women are Finance & Insurance (100.0%), Arts, Entertainment & Recreation (80.2%), and Educational Services (78.8%).
| Industry | Male | Female |
| Agriculture, Fishing & Hunting | 133 (73.5%) | 48 (26.5%) |
| Mining, Quarrying, & Extraction | 9 (100.0%) | 0 (0.0%) |
| Construction | 124 (100.0%) | 0 (0.0%) |
| Manufacturing | 255 (85.9%) | 42 (14.1%) |
| Wholesale Trade | 64 (63.4%) | 37 (36.6%) |
| Retail Trade | 233 (54.4%) | 195 (45.6%) |
| Transportation & Warehousing | 38 (100.0%) | 0 (0.0%) |
| Utilities | 0 (0.0%) | 0 (0.0%) |
| Information | 63 (100.0%) | 0 (0.0%) |
| Finance & Insurance | 0 (0.0%) | 58 (100.0%) |
| Real Estate, Rental & Leasing | 24 (100.0%) | 0 (0.0%) |
| Professional & Scientific | 255 (84.7%) | 46 (15.3%) |
| Enterprise Management | 0 (0.0%) | 0 (0.0%) |
| Administrative & Support | 76 (66.7%) | 38 (33.3%) |
| Educational Services | 159 (21.2%) | 590 (78.8%) |
| Health Care & Social Assistance | 147 (22.3%) | 512 (77.7%) |
| Arts, Entertainment & Recreation | 19 (19.8%) | 77 (80.2%) |
| Accommodation & Food Services | 146 (52.3%) | 133 (47.7%) |
| Public Administration | 145 (53.9%) | 124 (46.1%) |
| Total | 1,940 (48.3%) | 2,080 (51.7%) |
Education in Cleveland
School Enrollment in Cleveland
The most common levels of schooling among the 3,855 students in Cleveland are college / undergraduate (1,315 | 34.1%), middle school (732 | 19.0%), and elementary school (606 | 15.7%).
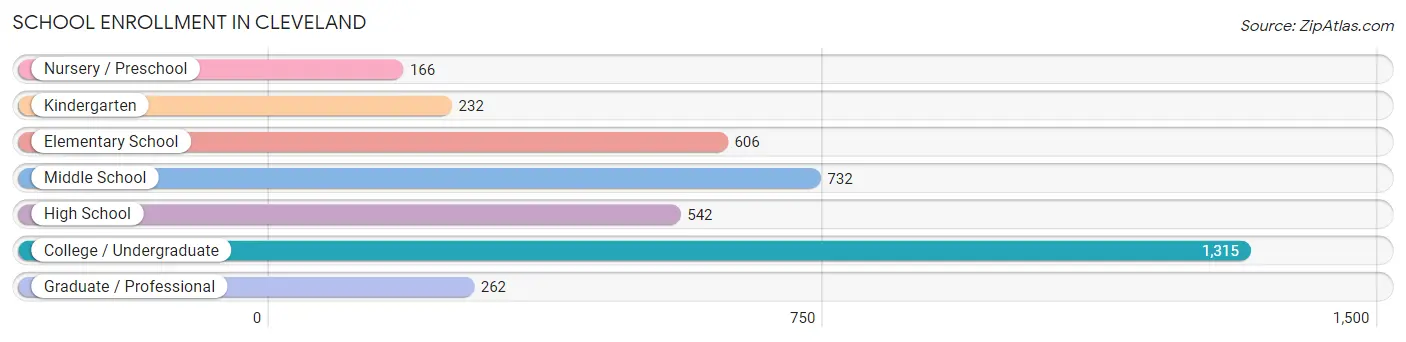
| School Level | # Students | % Students |
| Nursery / Preschool | 166 | 4.3% |
| Kindergarten | 232 | 6.0% |
| Elementary School | 606 | 15.7% |
| Middle School | 732 | 19.0% |
| High School | 542 | 14.1% |
| College / Undergraduate | 1,315 | 34.1% |
| Graduate / Professional | 262 | 6.8% |
| Total | 3,855 | 100.0% |
School Enrollment by Age by Funding Source in Cleveland
Out of a total of 3,855 students who are enrolled in schools in Cleveland, 320 (8.3%) attend a private institution, while the remaining 3,535 (91.7%) are enrolled in public schools. The age group of 25 to 34 year olds has the highest likelihood of being enrolled in private schools, with 38 (25.0% in the age bracket) enrolled. Conversely, the age group of 35 years and over has the lowest likelihood of being enrolled in a private school, with 152 (100.0% in the age bracket) attending a public institution.
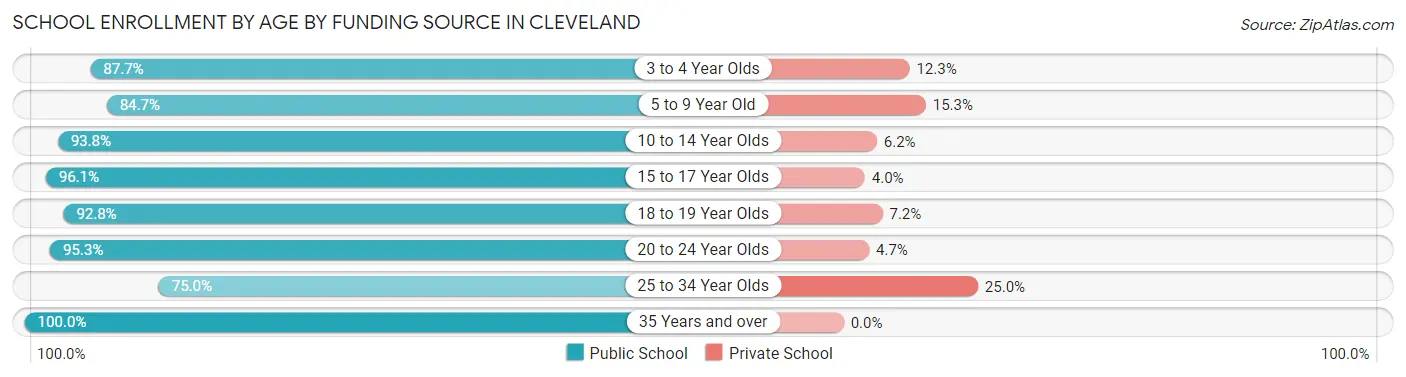
| Age Bracket | Public School | Private School |
| 3 to 4 Year Olds | 229 (87.7%) | 32 (12.3%) |
| 5 to 9 Year Old | 537 (84.7%) | 97 (15.3%) |
| 10 to 14 Year Olds | 911 (93.8%) | 60 (6.2%) |
| 15 to 17 Year Olds | 292 (96.1%) | 12 (4.0%) |
| 18 to 19 Year Olds | 538 (92.8%) | 42 (7.2%) |
| 20 to 24 Year Olds | 763 (95.3%) | 38 (4.7%) |
| 25 to 34 Year Olds | 114 (75.0%) | 38 (25.0%) |
| 35 Years and over | 152 (100.0%) | 0 (0.0%) |
| Total | 3,535 (91.7%) | 320 (8.3%) |
Educational Attainment by Field of Study in Cleveland
Business (593 | 25.5%), education (531 | 22.8%), science & technology (313 | 13.4%), bio, nature & agricultural (181 | 7.8%), and engineering (155 | 6.7%) are the most common fields of study among 2,329 individuals in Cleveland who have obtained a bachelor's degree or higher.
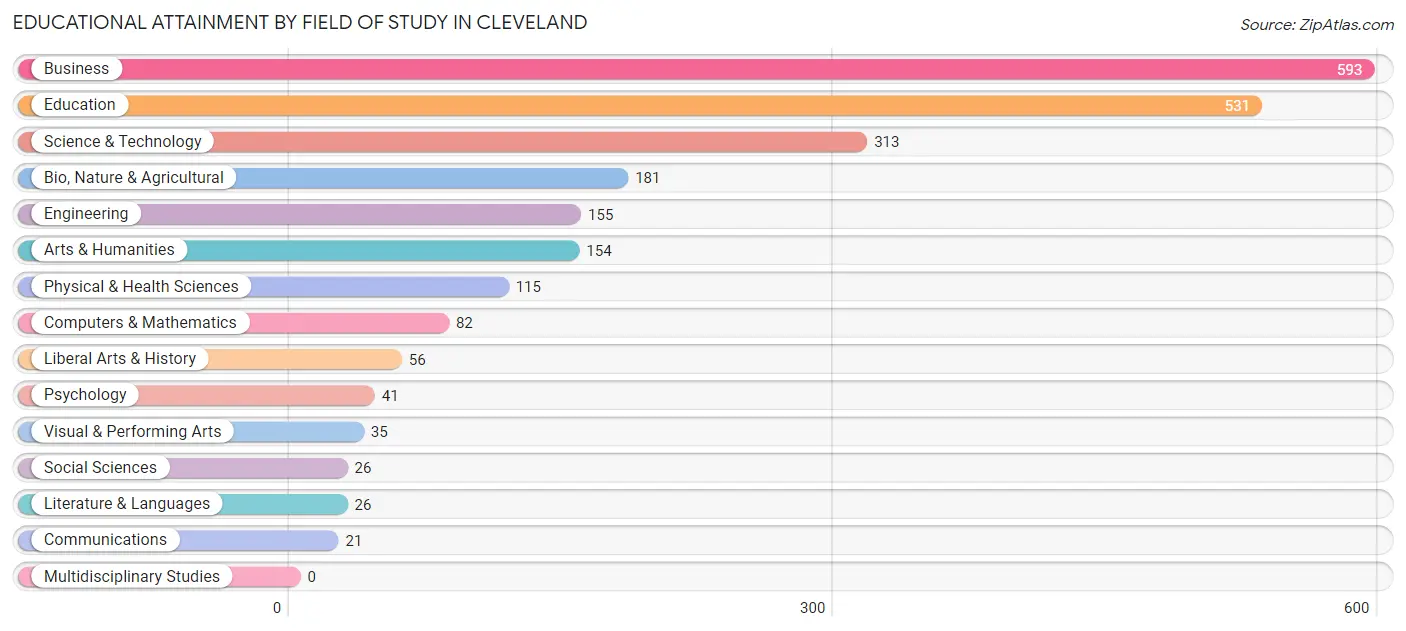
| Field of Study | # Graduates | % Graduates |
| Computers & Mathematics | 82 | 3.5% |
| Bio, Nature & Agricultural | 181 | 7.8% |
| Physical & Health Sciences | 115 | 4.9% |
| Psychology | 41 | 1.8% |
| Social Sciences | 26 | 1.1% |
| Engineering | 155 | 6.7% |
| Multidisciplinary Studies | 0 | 0.0% |
| Science & Technology | 313 | 13.4% |
| Business | 593 | 25.5% |
| Education | 531 | 22.8% |
| Literature & Languages | 26 | 1.1% |
| Liberal Arts & History | 56 | 2.4% |
| Visual & Performing Arts | 35 | 1.5% |
| Communications | 21 | 0.9% |
| Arts & Humanities | 154 | 6.6% |
| Total | 2,329 | 100.0% |
Transportation & Commute in Cleveland
Vehicle Availability by Sex in Cleveland
The most prevalent vehicle ownership categories in Cleveland are males with 2 vehicles (888, accounting for 47.7%) and females with 2 vehicles (649, making up 50.5%).
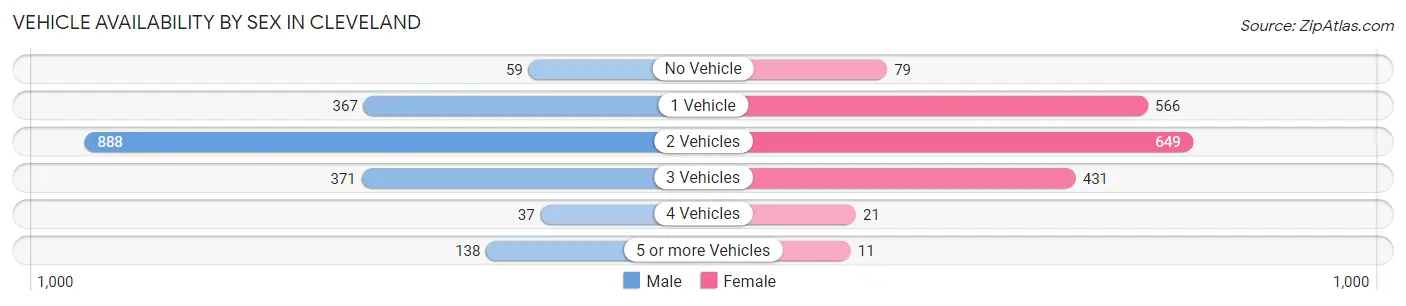
| Vehicles Available | Male | Female |
| No Vehicle | 59 (3.2%) | 79 (4.5%) |
| 1 Vehicle | 367 (19.7%) | 566 (32.2%) |
| 2 Vehicles | 888 (47.7%) | 649 (36.9%) |
| 3 Vehicles | 371 (20.0%) | 431 (24.5%) |
| 4 Vehicles | 37 (2.0%) | 21 (1.2%) |
| 5 or more Vehicles | 138 (7.4%) | 11 (0.6%) |
| Total | 1,860 (100.0%) | 1,757 (100.0%) |
Commute Time in Cleveland
The most frequently occuring commute durations in Cleveland are 5 to 9 minutes (1,379 commuters, 35.4%), 10 to 14 minutes (622 commuters, 16.0%), and 15 to 19 minutes (452 commuters, 11.6%).
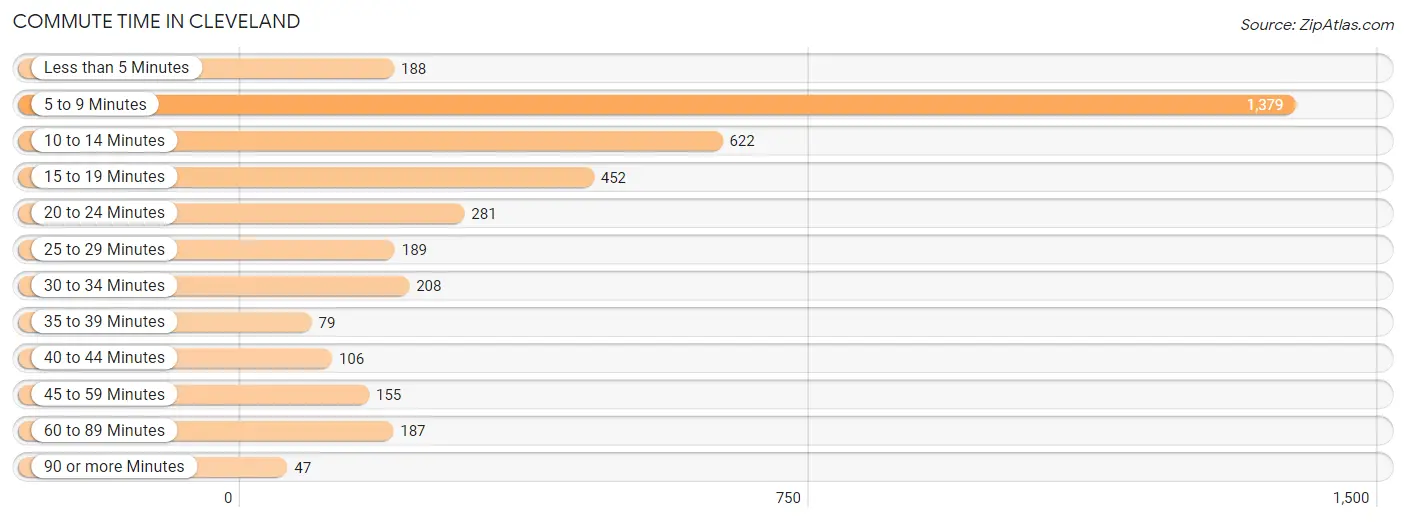
| Commute Time | # Commuters | % Commuters |
| Less than 5 Minutes | 188 | 4.8% |
| 5 to 9 Minutes | 1,379 | 35.4% |
| 10 to 14 Minutes | 622 | 16.0% |
| 15 to 19 Minutes | 452 | 11.6% |
| 20 to 24 Minutes | 281 | 7.2% |
| 25 to 29 Minutes | 189 | 4.9% |
| 30 to 34 Minutes | 208 | 5.3% |
| 35 to 39 Minutes | 79 | 2.0% |
| 40 to 44 Minutes | 106 | 2.7% |
| 45 to 59 Minutes | 155 | 4.0% |
| 60 to 89 Minutes | 187 | 4.8% |
| 90 or more Minutes | 47 | 1.2% |
Commute Time by Sex in Cleveland
The most common commute times in Cleveland are 5 to 9 minutes (696 commuters, 36.7%) for males and 5 to 9 minutes (683 commuters, 34.2%) for females.
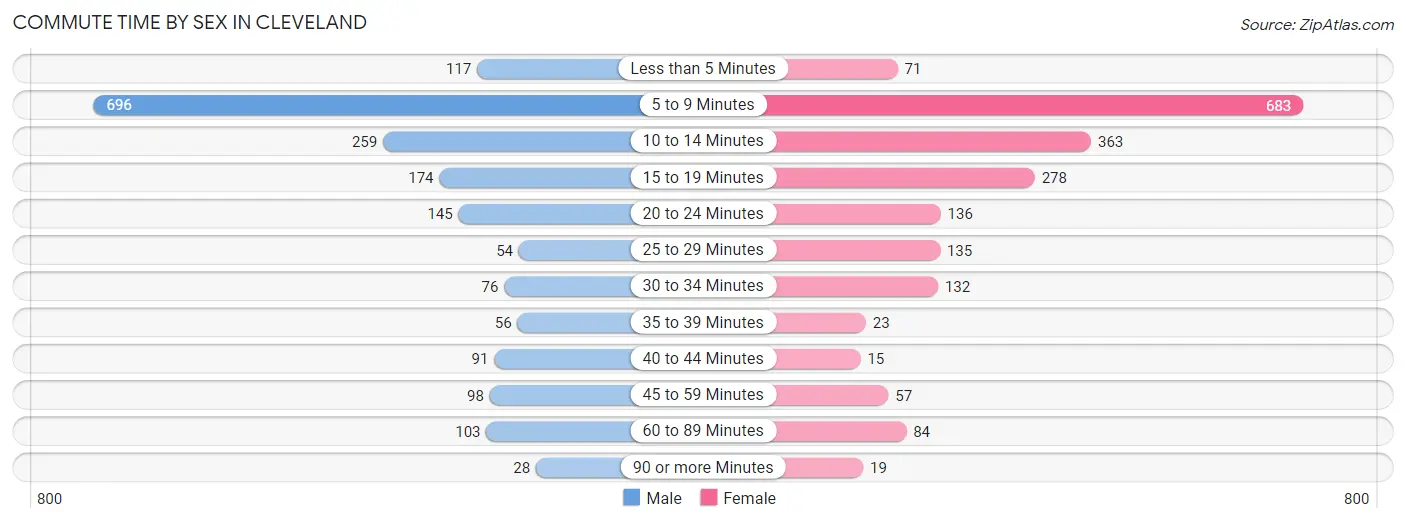
| Commute Time | Male | Female |
| Less than 5 Minutes | 117 (6.2%) | 71 (3.6%) |
| 5 to 9 Minutes | 696 (36.7%) | 683 (34.2%) |
| 10 to 14 Minutes | 259 (13.7%) | 363 (18.2%) |
| 15 to 19 Minutes | 174 (9.2%) | 278 (13.9%) |
| 20 to 24 Minutes | 145 (7.6%) | 136 (6.8%) |
| 25 to 29 Minutes | 54 (2.9%) | 135 (6.8%) |
| 30 to 34 Minutes | 76 (4.0%) | 132 (6.6%) |
| 35 to 39 Minutes | 56 (2.9%) | 23 (1.1%) |
| 40 to 44 Minutes | 91 (4.8%) | 15 (0.7%) |
| 45 to 59 Minutes | 98 (5.2%) | 57 (2.9%) |
| 60 to 89 Minutes | 103 (5.4%) | 84 (4.2%) |
| 90 or more Minutes | 28 (1.5%) | 19 (0.9%) |
Time of Departure to Work by Sex in Cleveland
The most frequent times of departure to work in Cleveland are 7:00 AM to 7:29 AM (441, 23.3%) for males and 7:30 AM to 7:59 AM (411, 20.6%) for females.
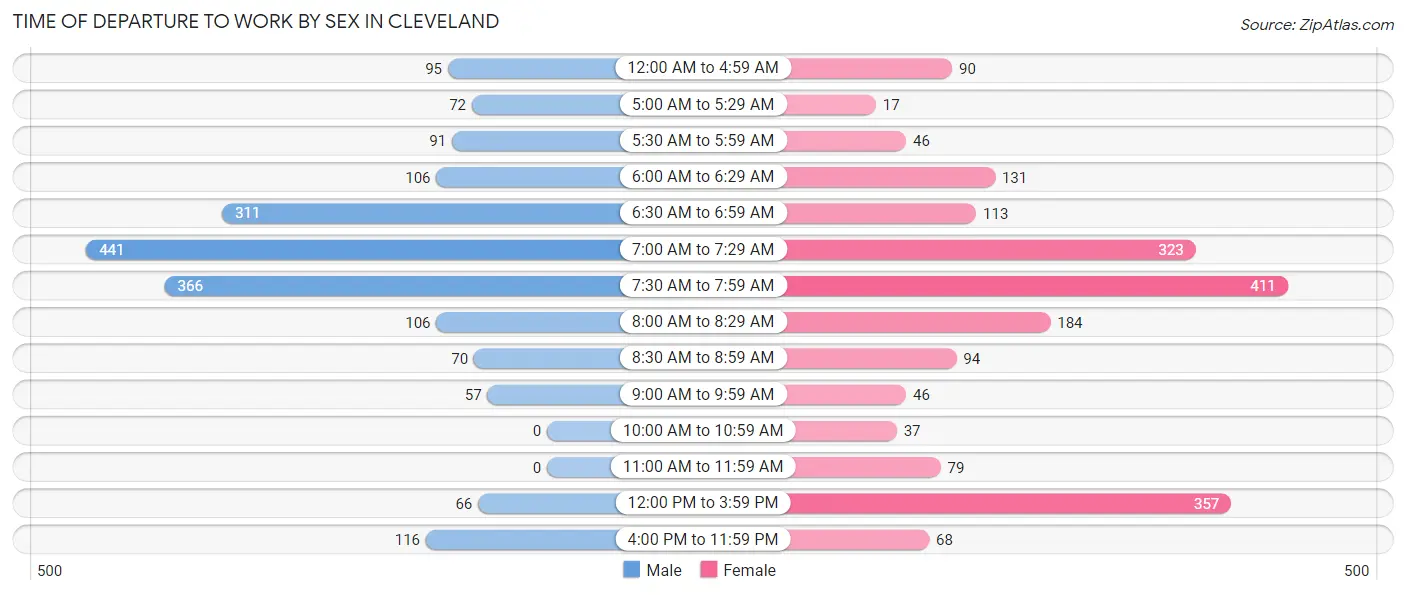
| Time of Departure | Male | Female |
| 12:00 AM to 4:59 AM | 95 (5.0%) | 90 (4.5%) |
| 5:00 AM to 5:29 AM | 72 (3.8%) | 17 (0.9%) |
| 5:30 AM to 5:59 AM | 91 (4.8%) | 46 (2.3%) |
| 6:00 AM to 6:29 AM | 106 (5.6%) | 131 (6.6%) |
| 6:30 AM to 6:59 AM | 311 (16.4%) | 113 (5.7%) |
| 7:00 AM to 7:29 AM | 441 (23.3%) | 323 (16.2%) |
| 7:30 AM to 7:59 AM | 366 (19.3%) | 411 (20.6%) |
| 8:00 AM to 8:29 AM | 106 (5.6%) | 184 (9.2%) |
| 8:30 AM to 8:59 AM | 70 (3.7%) | 94 (4.7%) |
| 9:00 AM to 9:59 AM | 57 (3.0%) | 46 (2.3%) |
| 10:00 AM to 10:59 AM | 0 (0.0%) | 37 (1.8%) |
| 11:00 AM to 11:59 AM | 0 (0.0%) | 79 (4.0%) |
| 12:00 PM to 3:59 PM | 66 (3.5%) | 357 (17.9%) |
| 4:00 PM to 11:59 PM | 116 (6.1%) | 68 (3.4%) |
| Total | 1,897 (100.0%) | 1,996 (100.0%) |
Housing Occupancy in Cleveland
Occupancy by Ownership in Cleveland
Of the total 3,996 dwellings in Cleveland, owner-occupied units account for 2,550 (63.8%), while renter-occupied units make up 1,446 (36.2%).
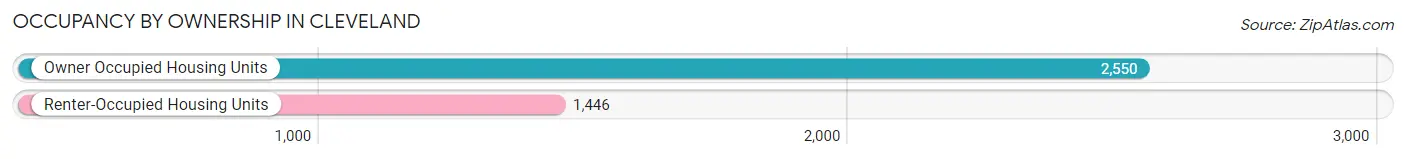
| Occupancy | # Housing Units | % Housing Units |
| Owner Occupied Housing Units | 2,550 | 63.8% |
| Renter-Occupied Housing Units | 1,446 | 36.2% |
| Total Occupied Housing Units | 3,996 | 100.0% |
Occupancy by Household Size in Cleveland
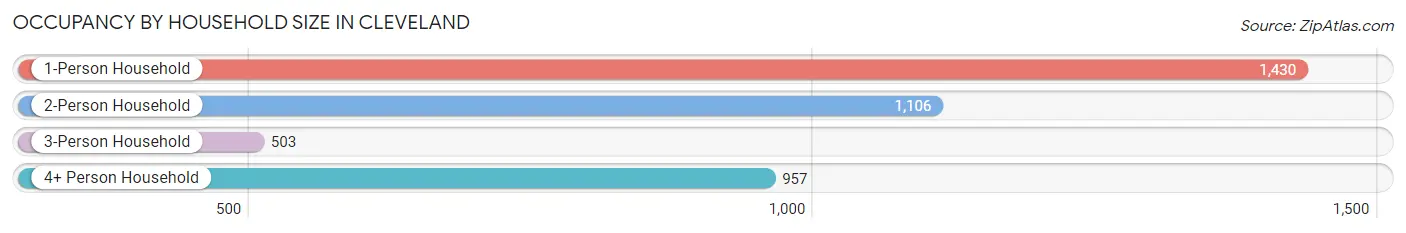
| Household Size | # Housing Units | % Housing Units |
| 1-Person Household | 1,430 | 35.8% |
| 2-Person Household | 1,106 | 27.7% |
| 3-Person Household | 503 | 12.6% |
| 4+ Person Household | 957 | 23.9% |
| Total Housing Units | 3,996 | 100.0% |
Occupancy by Ownership by Household Size in Cleveland
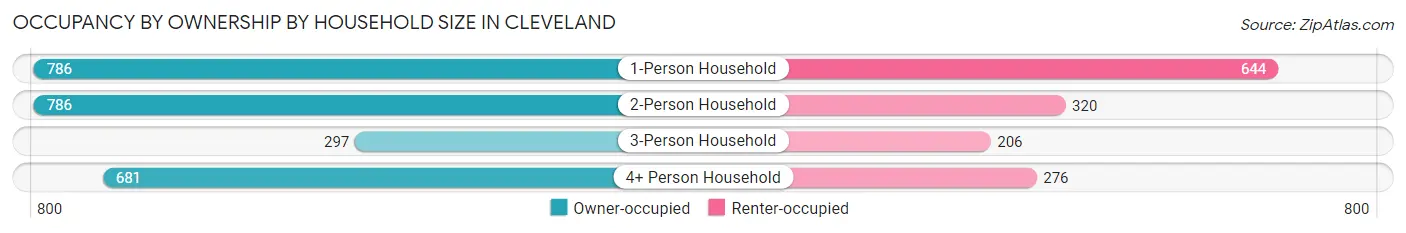
| Household Size | Owner-occupied | Renter-occupied |
| 1-Person Household | 786 (55.0%) | 644 (45.0%) |
| 2-Person Household | 786 (71.1%) | 320 (28.9%) |
| 3-Person Household | 297 (59.1%) | 206 (40.9%) |
| 4+ Person Household | 681 (71.2%) | 276 (28.8%) |
| Total Housing Units | 2,550 (63.8%) | 1,446 (36.2%) |
Occupancy by Educational Attainment in Cleveland
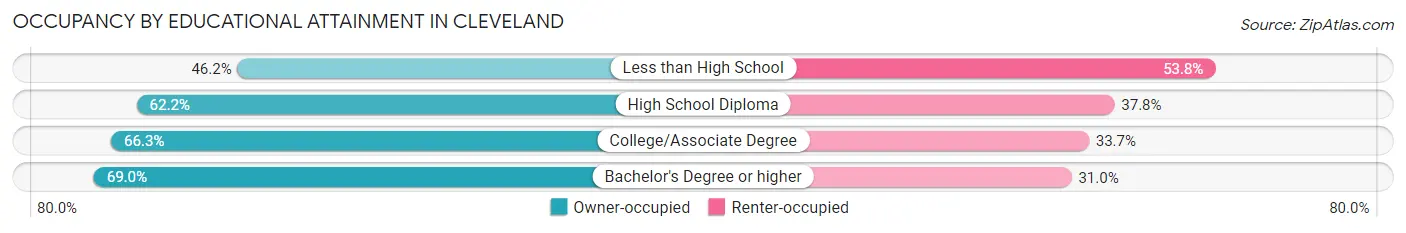
| Household Size | Owner-occupied | Renter-occupied |
| Less than High School | 239 (46.2%) | 278 (53.8%) |
| High School Diploma | 476 (62.2%) | 289 (37.8%) |
| College/Associate Degree | 924 (66.3%) | 470 (33.7%) |
| Bachelor's Degree or higher | 911 (69.0%) | 409 (31.0%) |
Occupancy by Age of Householder in Cleveland
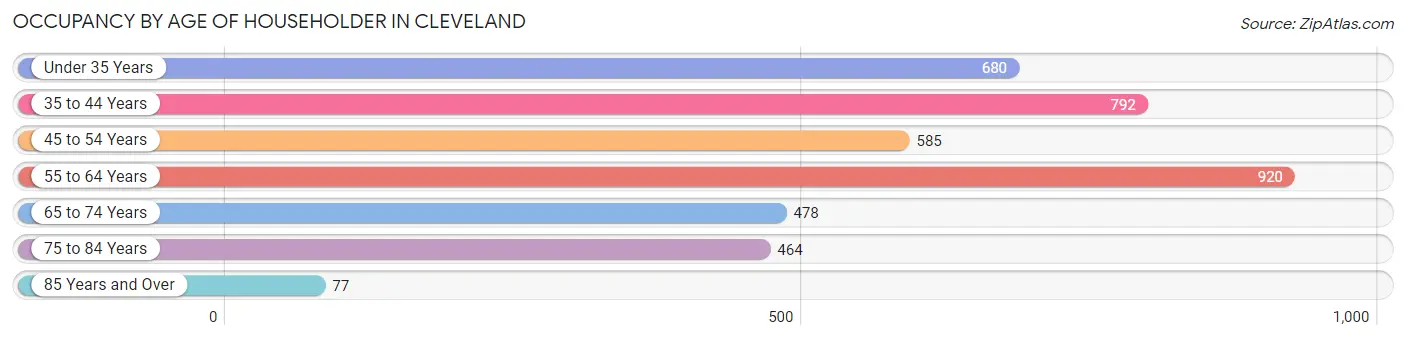
| Age Bracket | # Households | % Households |
| Under 35 Years | 680 | 17.0% |
| 35 to 44 Years | 792 | 19.8% |
| 45 to 54 Years | 585 | 14.6% |
| 55 to 64 Years | 920 | 23.0% |
| 65 to 74 Years | 478 | 12.0% |
| 75 to 84 Years | 464 | 11.6% |
| 85 Years and Over | 77 | 1.9% |
| Total | 3,996 | 100.0% |
Housing Finances in Cleveland
Median Income by Occupancy in Cleveland
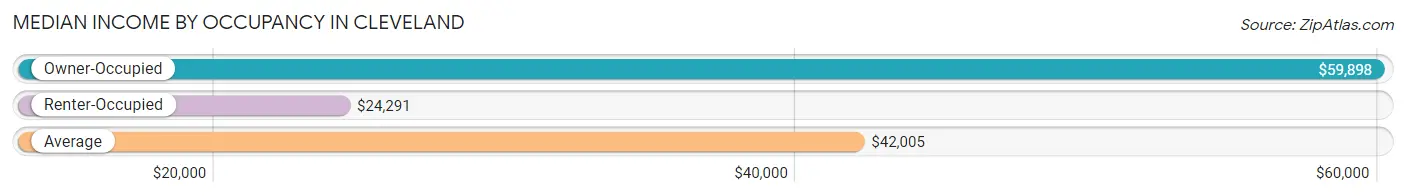
| Occupancy Type | # Households | Median Income |
| Owner-Occupied | 2,550 (63.8%) | $59,898 |
| Renter-Occupied | 1,446 (36.2%) | $24,291 |
| Average | 3,996 (100.0%) | $42,005 |
Occupancy by Householder Income Bracket in Cleveland
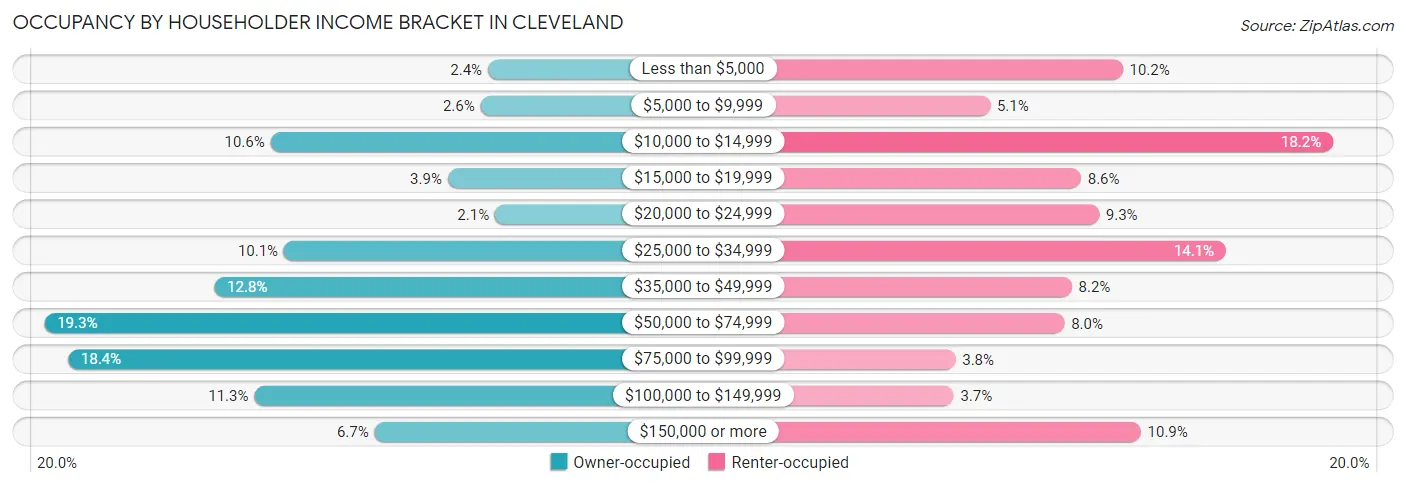
| Income Bracket | Owner-occupied | Renter-occupied |
| Less than $5,000 | 60 (2.4%) | 147 (10.2%) |
| $5,000 to $9,999 | 67 (2.6%) | 74 (5.1%) |
| $10,000 to $14,999 | 271 (10.6%) | 263 (18.2%) |
| $15,000 to $19,999 | 99 (3.9%) | 124 (8.6%) |
| $20,000 to $24,999 | 53 (2.1%) | 134 (9.3%) |
| $25,000 to $34,999 | 258 (10.1%) | 204 (14.1%) |
| $35,000 to $49,999 | 326 (12.8%) | 119 (8.2%) |
| $50,000 to $74,999 | 491 (19.3%) | 115 (8.0%) |
| $75,000 to $99,999 | 468 (18.3%) | 55 (3.8%) |
| $100,000 to $149,999 | 287 (11.3%) | 54 (3.7%) |
| $150,000 or more | 170 (6.7%) | 157 (10.9%) |
| Total | 2,550 (100.0%) | 1,446 (100.0%) |
Monthly Housing Cost Tiers in Cleveland
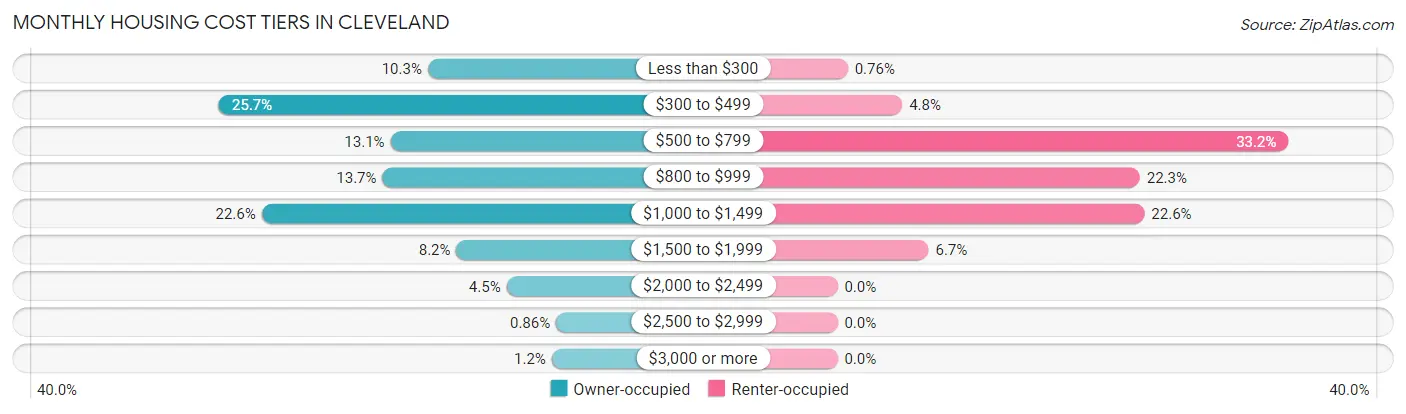
| Monthly Cost | Owner-occupied | Renter-occupied |
| Less than $300 | 263 (10.3%) | 11 (0.8%) |
| $300 to $499 | 655 (25.7%) | 69 (4.8%) |
| $500 to $799 | 333 (13.1%) | 480 (33.2%) |
| $800 to $999 | 348 (13.7%) | 322 (22.3%) |
| $1,000 to $1,499 | 575 (22.6%) | 327 (22.6%) |
| $1,500 to $1,999 | 209 (8.2%) | 97 (6.7%) |
| $2,000 to $2,499 | 115 (4.5%) | 0 (0.0%) |
| $2,500 to $2,999 | 22 (0.9%) | 0 (0.0%) |
| $3,000 or more | 30 (1.2%) | 0 (0.0%) |
| Total | 2,550 (100.0%) | 1,446 (100.0%) |
Physical Housing Characteristics in Cleveland
Housing Structures in Cleveland
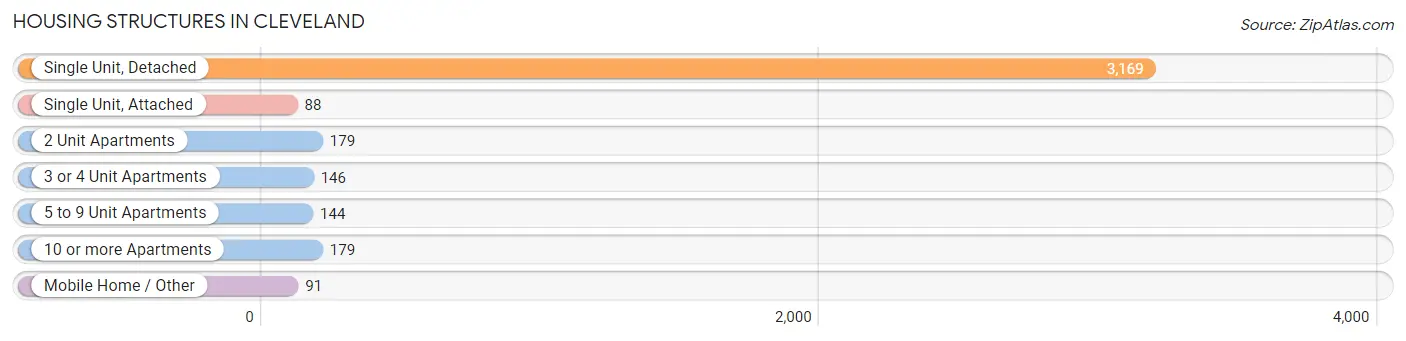
| Structure Type | # Housing Units | % Housing Units |
| Single Unit, Detached | 3,169 | 79.3% |
| Single Unit, Attached | 88 | 2.2% |
| 2 Unit Apartments | 179 | 4.5% |
| 3 or 4 Unit Apartments | 146 | 3.6% |
| 5 to 9 Unit Apartments | 144 | 3.6% |
| 10 or more Apartments | 179 | 4.5% |
| Mobile Home / Other | 91 | 2.3% |
| Total | 3,996 | 100.0% |
Housing Structures by Occupancy in Cleveland
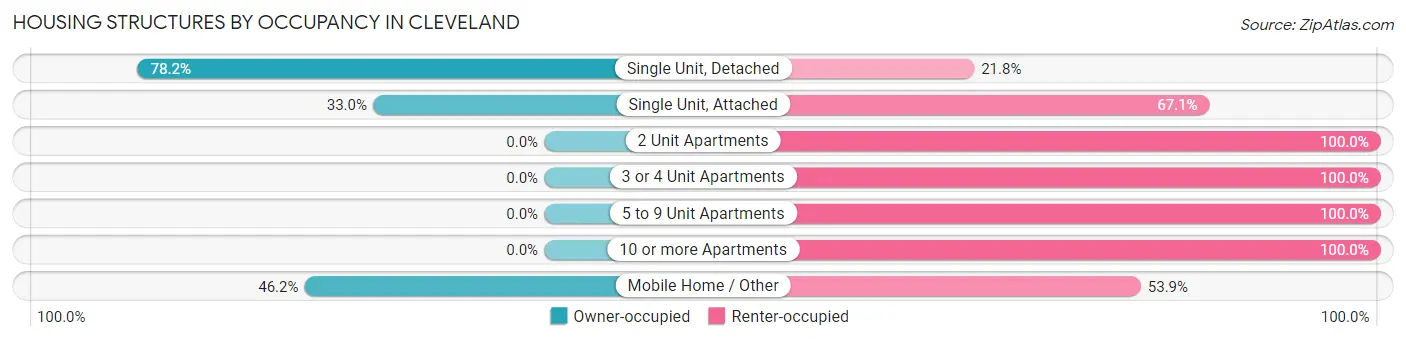
| Structure Type | Owner-occupied | Renter-occupied |
| Single Unit, Detached | 2,479 (78.2%) | 690 (21.8%) |
| Single Unit, Attached | 29 (33.0%) | 59 (67.0%) |
| 2 Unit Apartments | 0 (0.0%) | 179 (100.0%) |
| 3 or 4 Unit Apartments | 0 (0.0%) | 146 (100.0%) |
| 5 to 9 Unit Apartments | 0 (0.0%) | 144 (100.0%) |
| 10 or more Apartments | 0 (0.0%) | 179 (100.0%) |
| Mobile Home / Other | 42 (46.2%) | 49 (53.8%) |
| Total | 2,550 (63.8%) | 1,446 (36.2%) |
Housing Structures by Number of Rooms in Cleveland
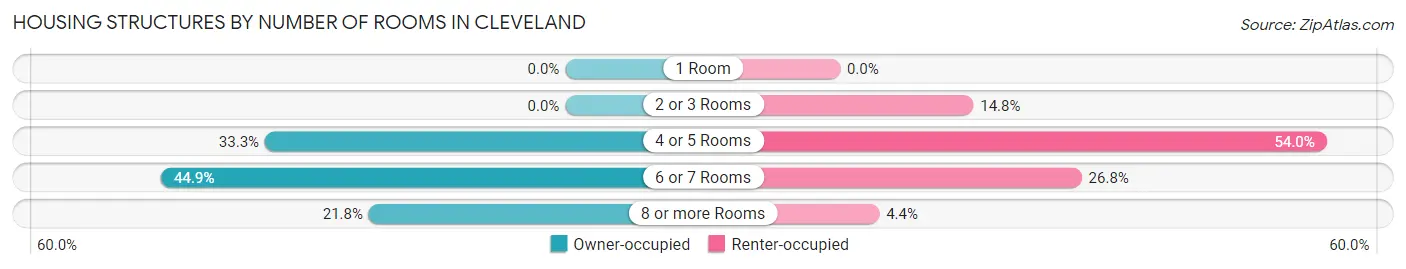
| Number of Rooms | Owner-occupied | Renter-occupied |
| 1 Room | 0 (0.0%) | 0 (0.0%) |
| 2 or 3 Rooms | 0 (0.0%) | 214 (14.8%) |
| 4 or 5 Rooms | 850 (33.3%) | 781 (54.0%) |
| 6 or 7 Rooms | 1,144 (44.9%) | 388 (26.8%) |
| 8 or more Rooms | 556 (21.8%) | 63 (4.4%) |
| Total | 2,550 (100.0%) | 1,446 (100.0%) |
Housing Structure by Heating Type in Cleveland
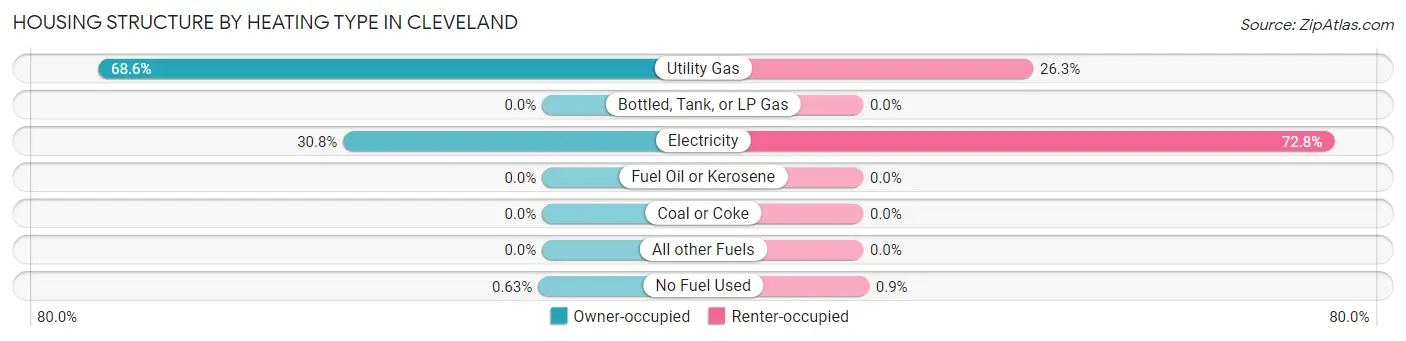
| Heating Type | Owner-occupied | Renter-occupied |
| Utility Gas | 1,750 (68.6%) | 380 (26.3%) |
| Bottled, Tank, or LP Gas | 0 (0.0%) | 0 (0.0%) |
| Electricity | 784 (30.7%) | 1,053 (72.8%) |
| Fuel Oil or Kerosene | 0 (0.0%) | 0 (0.0%) |
| Coal or Coke | 0 (0.0%) | 0 (0.0%) |
| All other Fuels | 0 (0.0%) | 0 (0.0%) |
| No Fuel Used | 16 (0.6%) | 13 (0.9%) |
| Total | 2,550 (100.0%) | 1,446 (100.0%) |
Household Vehicle Usage in Cleveland
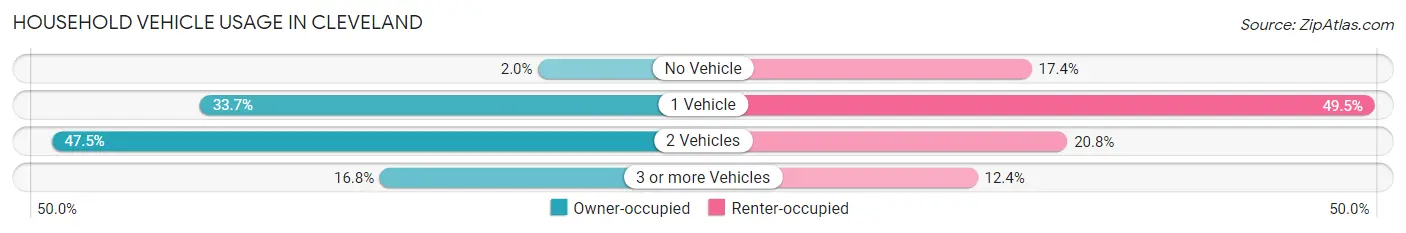
| Vehicles per Household | Owner-occupied | Renter-occupied |
| No Vehicle | 52 (2.0%) | 252 (17.4%) |
| 1 Vehicle | 858 (33.7%) | 715 (49.4%) |
| 2 Vehicles | 1,211 (47.5%) | 300 (20.7%) |
| 3 or more Vehicles | 429 (16.8%) | 179 (12.4%) |
| Total | 2,550 (100.0%) | 1,446 (100.0%) |
Real Estate & Mortgages in Cleveland
Real Estate and Mortgage Overview in Cleveland
| Characteristic | Without Mortgage | With Mortgage |
| Housing Units | 1,355 | 1,195 |
| Median Property Value | $123,000 | $165,300 |
| Median Household Income | $39,871 | $74 |
| Monthly Housing Costs | $456 | $30 |
| Real Estate Taxes | $897 | $58 |
Property Value by Mortgage Status in Cleveland
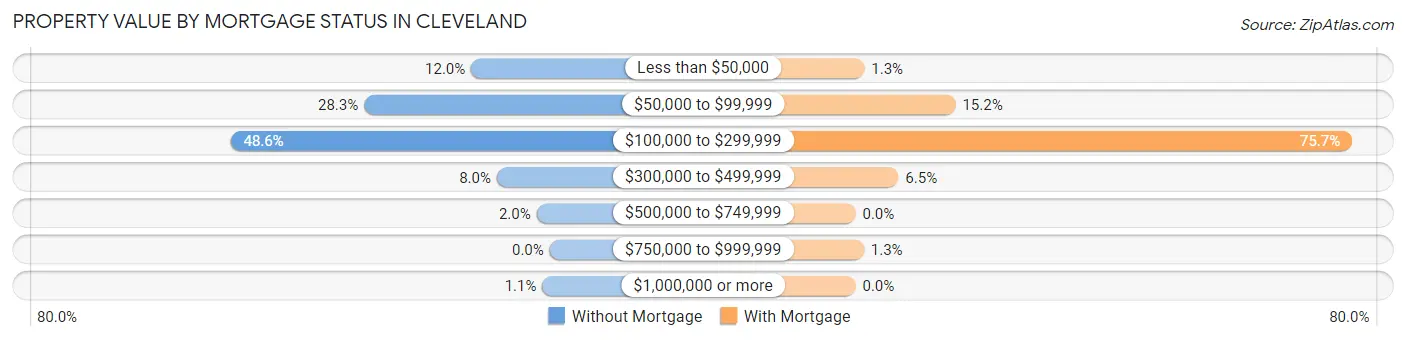
| Property Value | Without Mortgage | With Mortgage |
| Less than $50,000 | 162 (12.0%) | 16 (1.3%) |
| $50,000 to $99,999 | 383 (28.3%) | 182 (15.2%) |
| $100,000 to $299,999 | 659 (48.6%) | 904 (75.6%) |
| $300,000 to $499,999 | 109 (8.0%) | 78 (6.5%) |
| $500,000 to $749,999 | 27 (2.0%) | 0 (0.0%) |
| $750,000 to $999,999 | 0 (0.0%) | 15 (1.3%) |
| $1,000,000 or more | 15 (1.1%) | 0 (0.0%) |
| Total | 1,355 (100.0%) | 1,195 (100.0%) |
Household Income by Mortgage Status in Cleveland
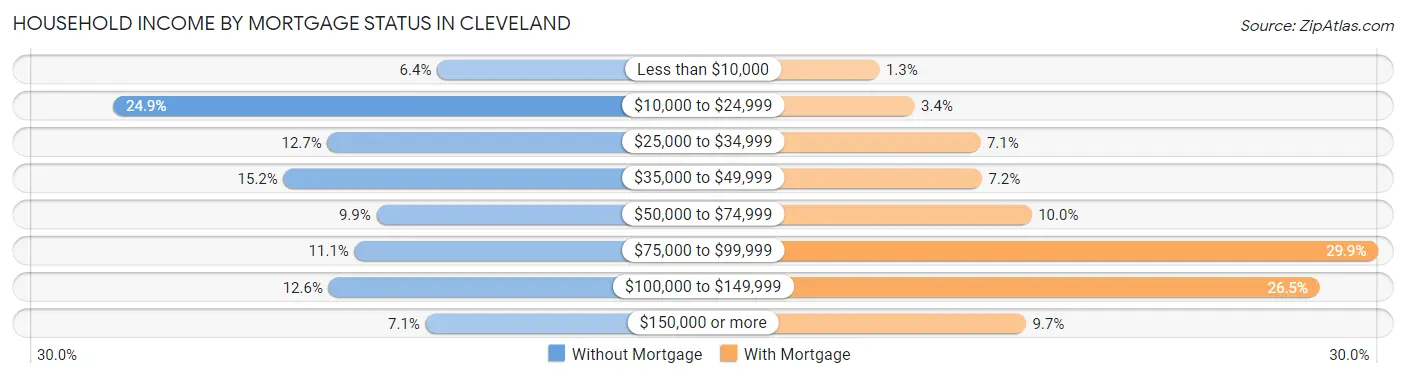
| Household Income | Without Mortgage | With Mortgage |
| Less than $10,000 | 87 (6.4%) | 16 (1.3%) |
| $10,000 to $24,999 | 338 (24.9%) | 40 (3.4%) |
| $25,000 to $34,999 | 172 (12.7%) | 85 (7.1%) |
| $35,000 to $49,999 | 206 (15.2%) | 86 (7.2%) |
| $50,000 to $74,999 | 134 (9.9%) | 120 (10.0%) |
| $75,000 to $99,999 | 151 (11.1%) | 357 (29.9%) |
| $100,000 to $149,999 | 171 (12.6%) | 317 (26.5%) |
| $150,000 or more | 96 (7.1%) | 116 (9.7%) |
| Total | 1,355 (100.0%) | 1,195 (100.0%) |
Property Value to Household Income Ratio in Cleveland
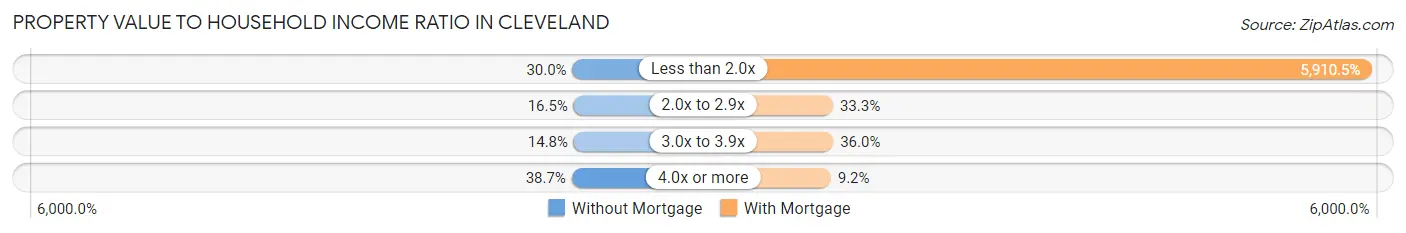
| Value-to-Income Ratio | Without Mortgage | With Mortgage |
| Less than 2.0x | 407 (30.0%) | 70,630 (5,910.5%) |
| 2.0x to 2.9x | 224 (16.5%) | 398 (33.3%) |
| 3.0x to 3.9x | 200 (14.8%) | 430 (36.0%) |
| 4.0x or more | 524 (38.7%) | 110 (9.2%) |
| Total | 1,355 (100.0%) | 1,195 (100.0%) |
Real Estate Taxes by Mortgage Status in Cleveland
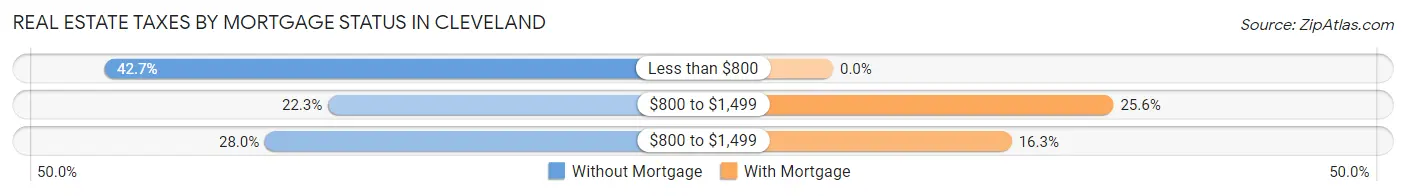
| Property Taxes | Without Mortgage | With Mortgage |
| Less than $800 | 579 (42.7%) | 0 (0.0%) |
| $800 to $1,499 | 302 (22.3%) | 306 (25.6%) |
| $800 to $1,499 | 380 (28.0%) | 195 (16.3%) |
| Total | 1,355 (100.0%) | 1,195 (100.0%) |
Health & Disability in Cleveland
Health Insurance Coverage by Age in Cleveland
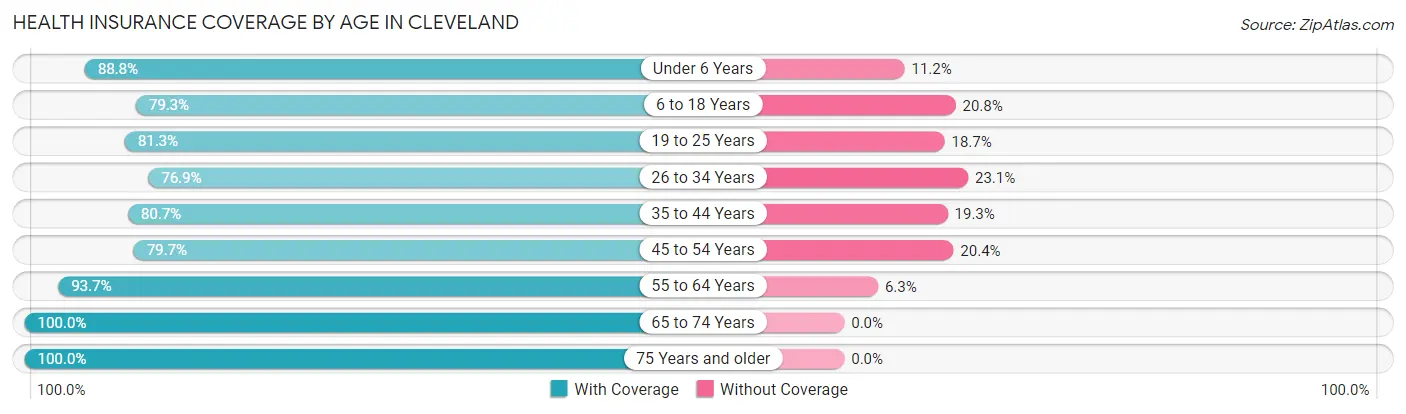
| Age Bracket | With Coverage | Without Coverage |
| Under 6 Years | 767 (88.8%) | 97 (11.2%) |
| 6 to 18 Years | 1,707 (79.2%) | 447 (20.7%) |
| 19 to 25 Years | 987 (81.3%) | 227 (18.7%) |
| 26 to 34 Years | 1,097 (76.9%) | 329 (23.1%) |
| 35 to 44 Years | 1,060 (80.7%) | 253 (19.3%) |
| 45 to 54 Years | 900 (79.6%) | 230 (20.3%) |
| 55 to 64 Years | 1,208 (93.7%) | 81 (6.3%) |
| 65 to 74 Years | 830 (100.0%) | 0 (0.0%) |
| 75 Years and older | 686 (100.0%) | 0 (0.0%) |
| Total | 9,242 (84.7%) | 1,664 (15.3%) |
Health Insurance Coverage by Citizenship Status in Cleveland
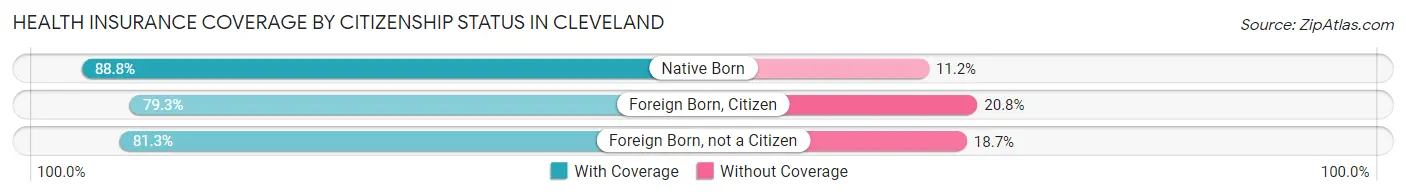
| Citizenship Status | With Coverage | Without Coverage |
| Native Born | 767 (88.8%) | 97 (11.2%) |
| Foreign Born, Citizen | 1,707 (79.2%) | 447 (20.7%) |
| Foreign Born, not a Citizen | 987 (81.3%) | 227 (18.7%) |
Health Insurance Coverage by Household Income in Cleveland
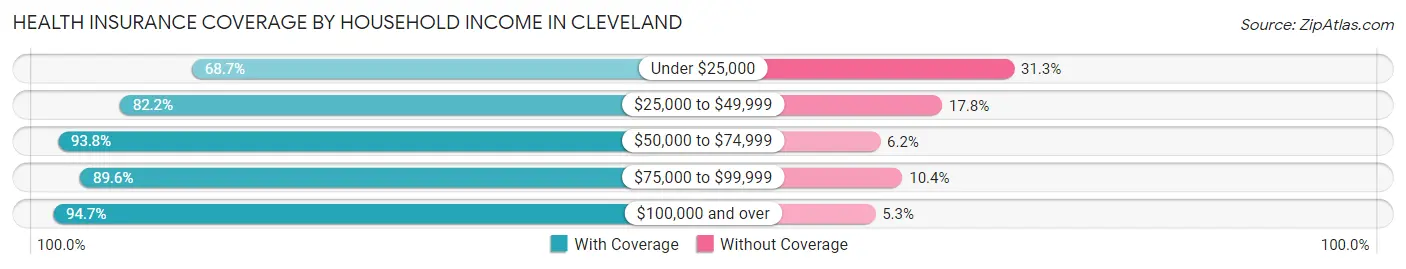
| Household Income | With Coverage | Without Coverage |
| Under $25,000 | 1,908 (68.7%) | 871 (31.3%) |
| $25,000 to $49,999 | 1,676 (82.2%) | 364 (17.8%) |
| $50,000 to $74,999 | 1,698 (93.8%) | 113 (6.2%) |
| $75,000 to $99,999 | 1,456 (89.6%) | 169 (10.4%) |
| $100,000 and over | 1,759 (94.7%) | 99 (5.3%) |
Public vs Private Health Insurance Coverage by Age in Cleveland
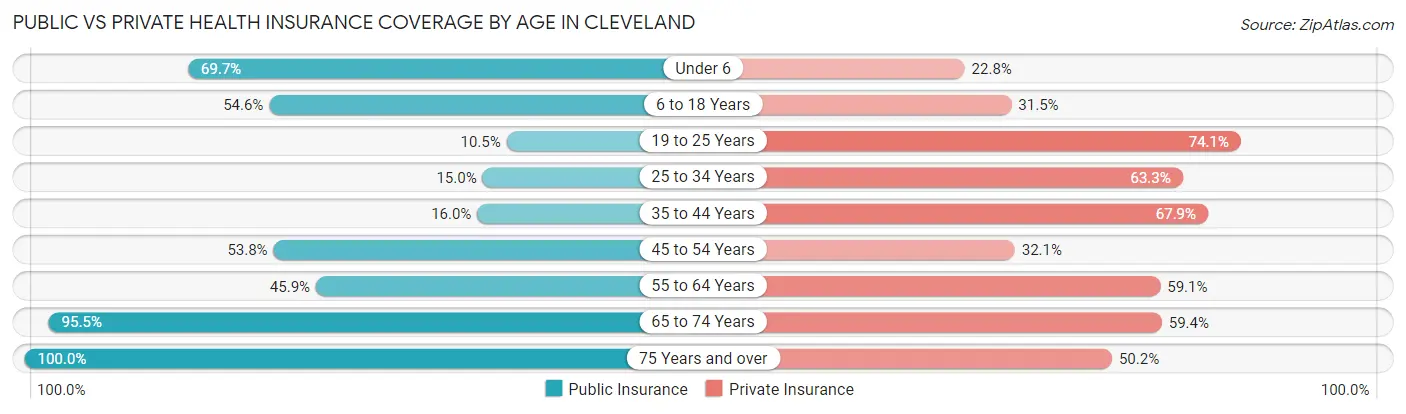
| Age Bracket | Public Insurance | Private Insurance |
| Under 6 | 602 (69.7%) | 197 (22.8%) |
| 6 to 18 Years | 1,176 (54.6%) | 678 (31.5%) |
| 19 to 25 Years | 128 (10.5%) | 899 (74.1%) |
| 25 to 34 Years | 214 (15.0%) | 902 (63.2%) |
| 35 to 44 Years | 210 (16.0%) | 892 (67.9%) |
| 45 to 54 Years | 608 (53.8%) | 363 (32.1%) |
| 55 to 64 Years | 592 (45.9%) | 762 (59.1%) |
| 65 to 74 Years | 793 (95.5%) | 493 (59.4%) |
| 75 Years and over | 686 (100.0%) | 344 (50.1%) |
| Total | 5,009 (45.9%) | 5,530 (50.7%) |
Disability Status by Sex by Age in Cleveland
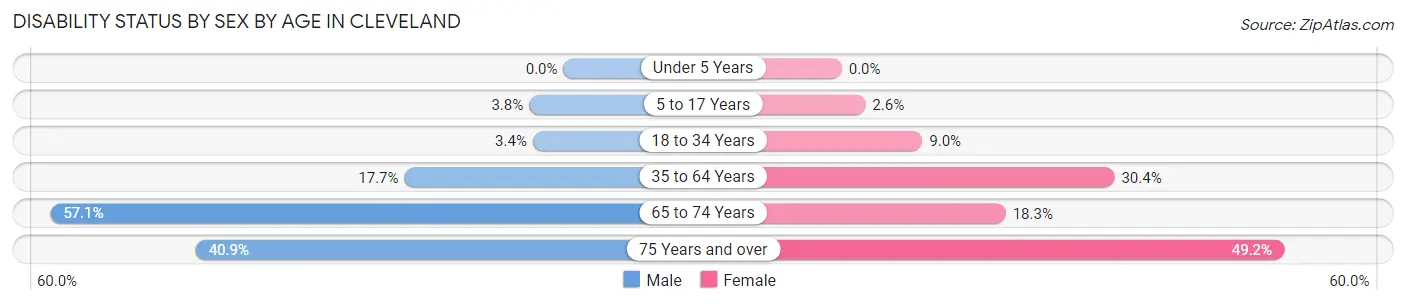
| Age Bracket | Male | Female |
| Under 5 Years | 0 (0.0%) | 0 (0.0%) |
| 5 to 17 Years | 37 (3.8%) | 25 (2.6%) |
| 18 to 34 Years | 48 (3.4%) | 139 (9.0%) |
| 35 to 64 Years | 324 (17.7%) | 578 (30.4%) |
| 65 to 74 Years | 224 (57.1%) | 80 (18.3%) |
| 75 Years and over | 122 (40.9%) | 191 (49.2%) |
Disability Class by Sex by Age in Cleveland
Disability Class: Hearing Difficulty
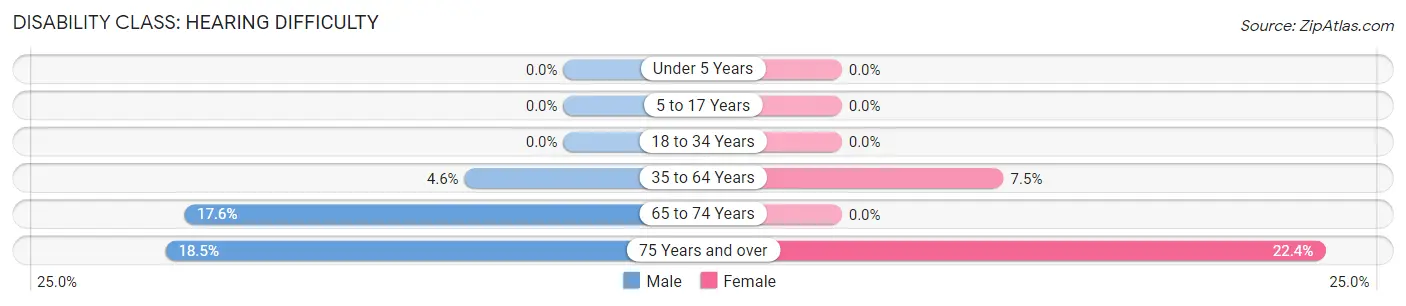
| Age Bracket | Male | Female |
| Under 5 Years | 0 (0.0%) | 0 (0.0%) |
| 5 to 17 Years | 0 (0.0%) | 0 (0.0%) |
| 18 to 34 Years | 0 (0.0%) | 0 (0.0%) |
| 35 to 64 Years | 84 (4.6%) | 143 (7.5%) |
| 65 to 74 Years | 69 (17.6%) | 0 (0.0%) |
| 75 Years and over | 55 (18.5%) | 87 (22.4%) |
Disability Class: Vision Difficulty
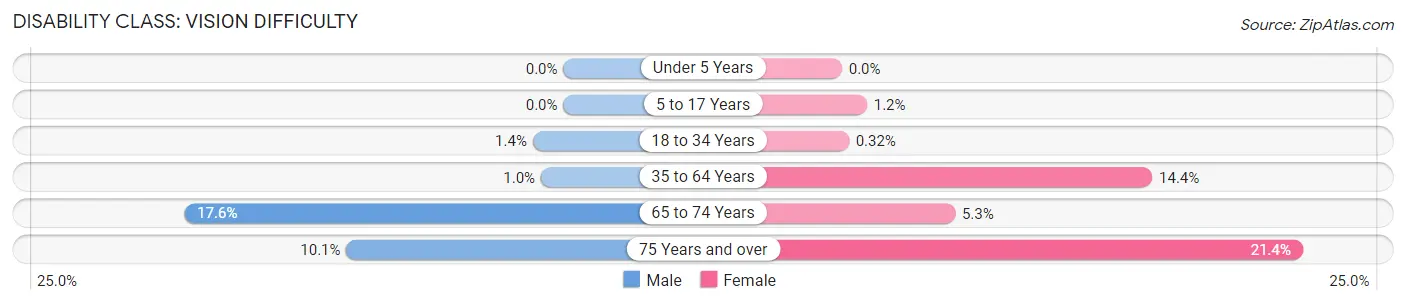
| Age Bracket | Male | Female |
| Under 5 Years | 0 (0.0%) | 0 (0.0%) |
| 5 to 17 Years | 0 (0.0%) | 11 (1.2%) |
| 18 to 34 Years | 20 (1.4%) | 5 (0.3%) |
| 35 to 64 Years | 19 (1.0%) | 274 (14.4%) |
| 65 to 74 Years | 69 (17.6%) | 23 (5.2%) |
| 75 Years and over | 30 (10.1%) | 83 (21.4%) |
Disability Class: Cognitive Difficulty
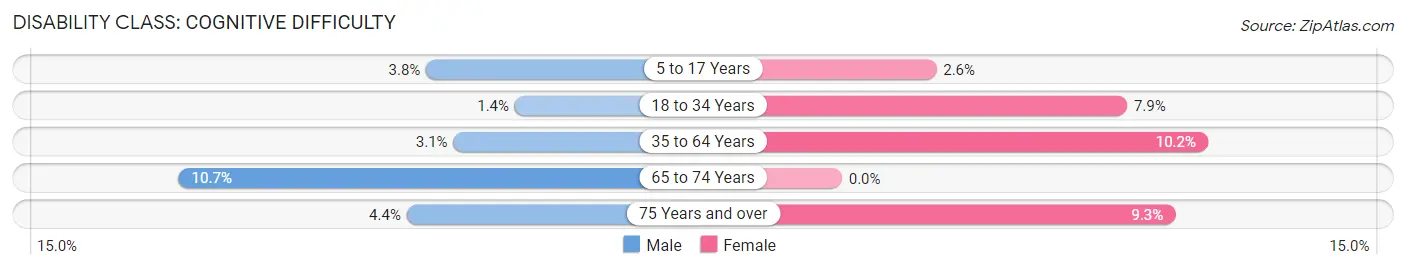
| Age Bracket | Male | Female |
| 5 to 17 Years | 37 (3.8%) | 25 (2.6%) |
| 18 to 34 Years | 19 (1.3%) | 123 (7.9%) |
| 35 to 64 Years | 56 (3.1%) | 194 (10.2%) |
| 65 to 74 Years | 42 (10.7%) | 0 (0.0%) |
| 75 Years and over | 13 (4.4%) | 36 (9.3%) |
Disability Class: Ambulatory Difficulty
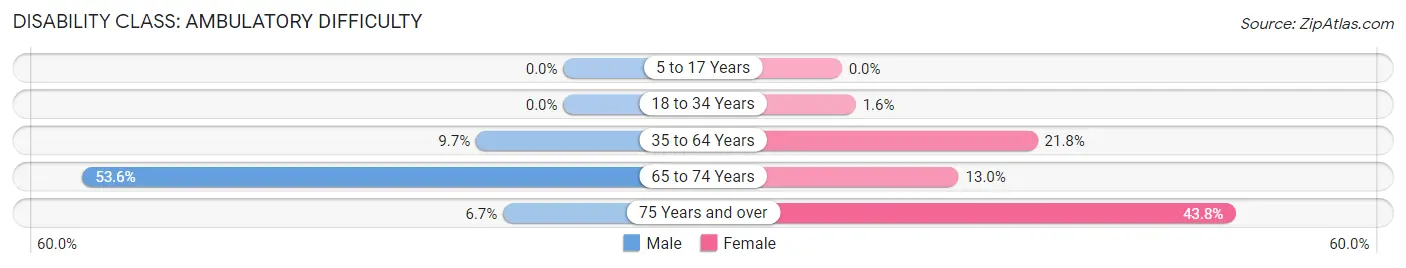
| Age Bracket | Male | Female |
| 5 to 17 Years | 0 (0.0%) | 0 (0.0%) |
| 18 to 34 Years | 0 (0.0%) | 24 (1.5%) |
| 35 to 64 Years | 178 (9.7%) | 415 (21.8%) |
| 65 to 74 Years | 210 (53.6%) | 57 (13.0%) |
| 75 Years and over | 20 (6.7%) | 170 (43.8%) |
Disability Class: Self-Care Difficulty
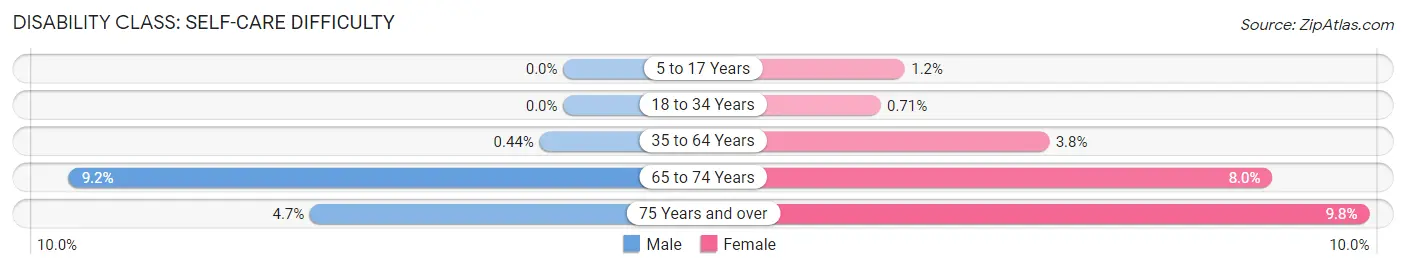
| Age Bracket | Male | Female |
| 5 to 17 Years | 0 (0.0%) | 11 (1.2%) |
| 18 to 34 Years | 0 (0.0%) | 11 (0.7%) |
| 35 to 64 Years | 8 (0.4%) | 73 (3.8%) |
| 65 to 74 Years | 36 (9.2%) | 35 (8.0%) |
| 75 Years and over | 14 (4.7%) | 38 (9.8%) |
Technology Access in Cleveland
Computing Device Access in Cleveland
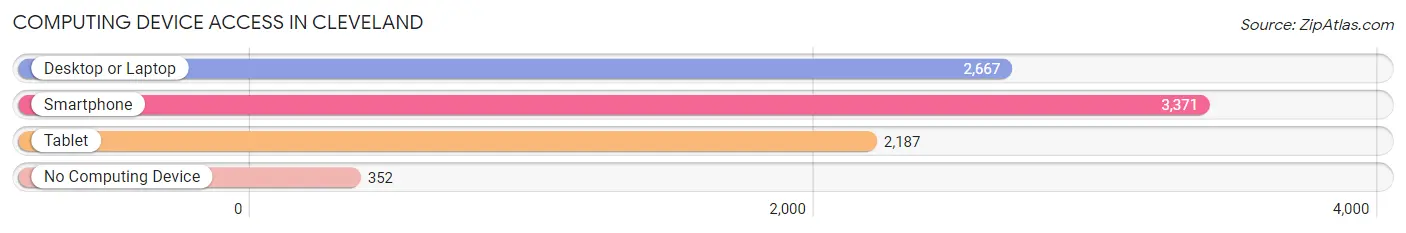
| Device Type | # Households | % Households |
| Desktop or Laptop | 2,667 | 66.7% |
| Smartphone | 3,371 | 84.4% |
| Tablet | 2,187 | 54.7% |
| No Computing Device | 352 | 8.8% |
| Total | 3,996 | 100.0% |
Internet Access in Cleveland
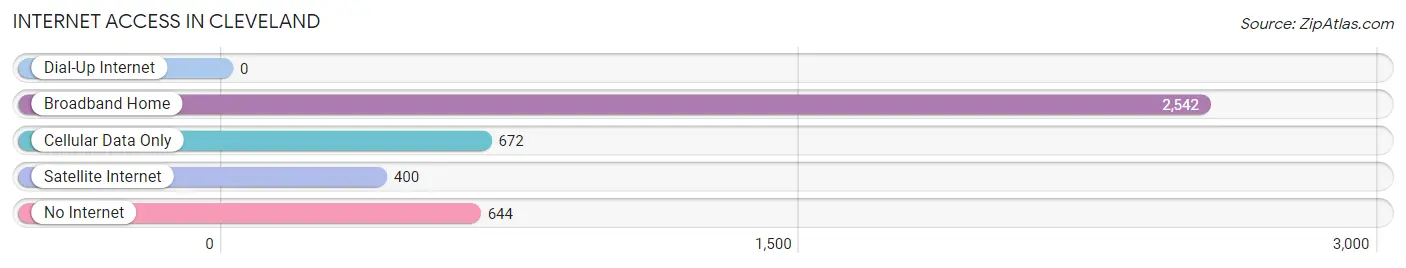
| Internet Type | # Households | % Households |
| Dial-Up Internet | 0 | 0.0% |
| Broadband Home | 2,542 | 63.6% |
| Cellular Data Only | 672 | 16.8% |
| Satellite Internet | 400 | 10.0% |
| No Internet | 644 | 16.1% |
| Total | 3,996 | 100.0% |
Cleveland Summary
Cleveland, Mississippi is a city located in Bolivar County, Mississippi. It is the county seat of Bolivar County and is located in the Mississippi Delta region. The city has a population of 12,334 as of the 2010 census.
History
Cleveland was founded in 1869 by the Cleveland Land Company, which was formed by a group of investors from Cleveland, Ohio. The city was named after the investors’ hometown. The city was incorporated in 1886 and was the first city in Bolivar County.
The city was a major center of cotton production and processing in the late 19th and early 20th centuries. The city was also a major center of African-American culture and education in the early 20th century. The city was home to the first African-American college in the state, Rust College, which was founded in 1866.
Geography
Cleveland is located in the Mississippi Delta region of the state. The city is situated on the banks of the Yazoo River and is surrounded by the Yazoo National Wildlife Refuge. The city is located approximately 60 miles south of Memphis, Tennessee and approximately 100 miles north of Jackson, Mississippi.
The city has a total area of 8.3 square miles, of which 8.2 square miles is land and 0.1 square miles is water. The city is located in the humid subtropical climate zone and has hot, humid summers and mild winters.
Economy
Cleveland’s economy is largely based on agriculture and manufacturing. The city is home to several large manufacturing plants, including a Tyson Foods poultry processing plant and a Delta Pride Catfish processing plant. The city is also home to several agricultural businesses, including cotton gins, grain elevators, and feed mills.
The city is also home to several retail businesses, including several restaurants, grocery stores, and clothing stores. The city is also home to several medical facilities, including Bolivar Medical Center and Delta Regional Medical Center.
Demographics
As of the 2010 census, the city had a population of 12,334. The racial makeup of the city was 57.3% African American, 40.2% White, 0.3% Native American, 0.2% Asian, 0.1% Pacific Islander, 0.7% from other races, and 1.4% from two or more races. Hispanic or Latino of any race were 1.7% of the population.
The median income for a household in the city was $25,945, and the median income for a family was $31,944. The per capita income for the city was $14,845. About 24.3% of the population was below the poverty line.
Cleveland is a diverse city with a rich history and culture. The city is home to several large manufacturing and agricultural businesses, as well as several retail businesses. The city is also home to several medical facilities and educational institutions. The city has a population of 12,334 as of the 2010 census and has a median income of $25,945.
Common Questions
What is Per Capita Income in Cleveland?
Per Capita income in Cleveland is $26,351.
What is the Median Family Income in Cleveland?
Median Family Income in Cleveland is $61,196.
What is the Median Household income in Cleveland?
Median Household Income in Cleveland is $42,005.
What is Income or Wage Gap in Cleveland?
Income or Wage Gap in Cleveland is 43.9%.
Women in Cleveland earn 56.1 cents for every dollar earned by a man.
What is Inequality or Gini Index in Cleveland?
Inequality or Gini Index in Cleveland is 0.54.
What is the Total Population of Cleveland?
Total Population of Cleveland is 11,082.
What is the Total Male Population of Cleveland?
Total Male Population of Cleveland is 5,303.
What is the Total Female Population of Cleveland?
Total Female Population of Cleveland is 5,779.
What is the Ratio of Males per 100 Females in Cleveland?
There are 91.76 Males per 100 Females in Cleveland.
What is the Ratio of Females per 100 Males in Cleveland?
There are 108.98 Females per 100 Males in Cleveland.
What is the Median Population Age in Cleveland?
Median Population Age in Cleveland is 33.8 Years.
What is the Average Family Size in Cleveland
Average Family Size in Cleveland is 3.2 People.
What is the Average Household Size in Cleveland
Average Household Size in Cleveland is 2.5 People.
How Large is the Labor Force in Cleveland?
There are 4,340 People in the Labor Forcein in Cleveland.
What is the Percentage of People in the Labor Force in Cleveland?
50.7% of People are in the Labor Force in Cleveland.
What is the Unemployment Rate in Cleveland?
Unemployment Rate in Cleveland is 7.4%.