Anguilla, MS Map & Demographics
Anguilla Map
Anguilla Overview
$18,789
PER CAPITA INCOME
$27,917
AVG HOUSEHOLD INCOME
45.9%
WAGE / INCOME GAP [ % ]
54.1¢/ $1
WAGE / INCOME GAP [ $ ]
$10,559
FAMILY INCOME DEFICIT
0.47
INEQUALITY / GINI INDEX
613
TOTAL POPULATION
346
MALE POPULATION
267
FEMALE POPULATION
129.59
MALES / 100 FEMALES
77.17
FEMALES / 100 MALES
40.4
MEDIAN AGE
3.3
AVG FAMILY SIZE
2.5
AVG HOUSEHOLD SIZE
272
LABOR FORCE [ PEOPLE ]
53.6%
PERCENT IN LABOR FORCE
4.8%
UNEMPLOYMENT RATE
Anguilla Zip Codes
Anguilla Area Codes
Income in Anguilla
Income Overview in Anguilla
| Characteristic | Number | Measure |
| Per Capita Income | 613 | $18,789 |
| Median Family Income | 154 | $0 |
| Mean Family Income | 154 | $55,738 |
| Median Household Income | 250 | $27,917 |
| Mean Household Income | 250 | $44,247 |
| Income Deficit | 154 | $10,559 |
| Wage / Income Gap (%) | 613 | 45.87% |
| Wage / Income Gap ($) | 613 | 54.13¢ per $1 |
| Gini / Inequality Index | 613 | 0.47 |
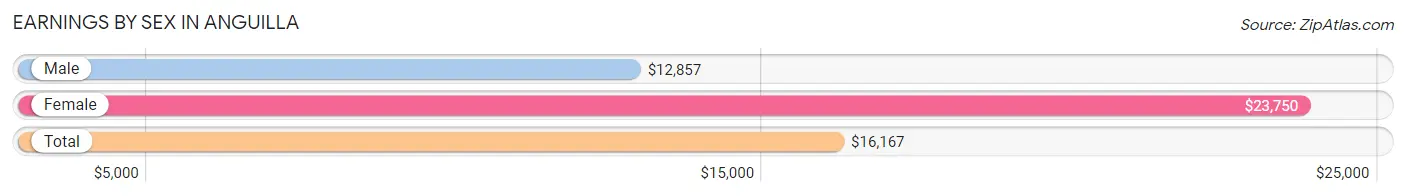
Earnings by Sex in Anguilla
Average Earnings in Anguilla are $16,167, $12,857 for men and $23,750 for women, a difference of 45.9%.
| Sex | Number | Average Earnings |
| Male | 122 (45.5%) | $12,857 |
| Female | 146 (54.5%) | $23,750 |
| Total | 268 (100.0%) | $16,167 |
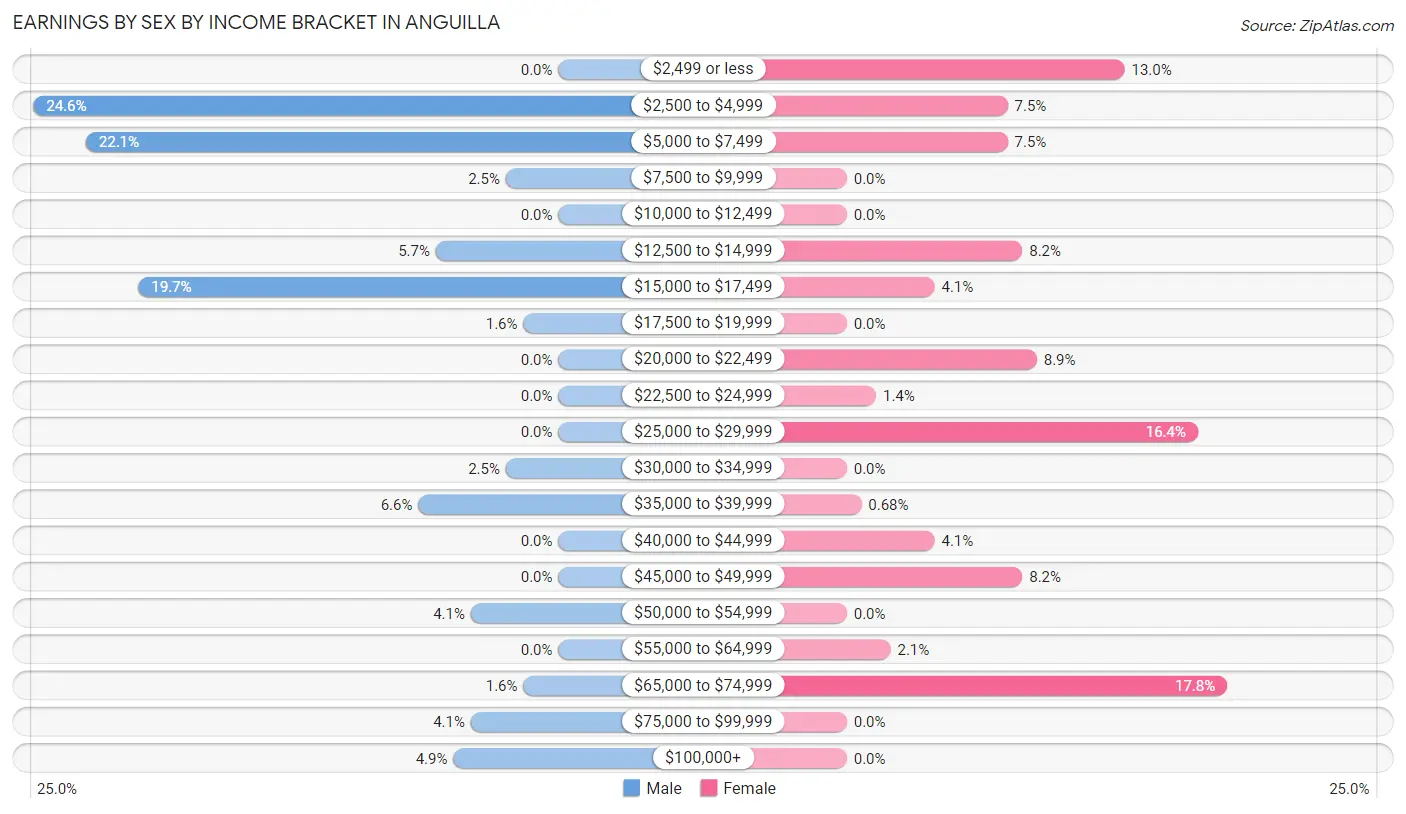
Earnings by Sex by Income Bracket in Anguilla
The most common earnings brackets in Anguilla are $2,500 to $4,999 for men (30 | 24.6%) and $65,000 to $74,999 for women (26 | 17.8%).
| Income | Male | Female |
| $2,499 or less | 0 (0.0%) | 19 (13.0%) |
| $2,500 to $4,999 | 30 (24.6%) | 11 (7.5%) |
| $5,000 to $7,499 | 27 (22.1%) | 11 (7.5%) |
| $7,500 to $9,999 | 3 (2.5%) | 0 (0.0%) |
| $10,000 to $12,499 | 0 (0.0%) | 0 (0.0%) |
| $12,500 to $14,999 | 7 (5.7%) | 12 (8.2%) |
| $15,000 to $17,499 | 24 (19.7%) | 6 (4.1%) |
| $17,500 to $19,999 | 2 (1.6%) | 0 (0.0%) |
| $20,000 to $22,499 | 0 (0.0%) | 13 (8.9%) |
| $22,500 to $24,999 | 0 (0.0%) | 2 (1.4%) |
| $25,000 to $29,999 | 0 (0.0%) | 24 (16.4%) |
| $30,000 to $34,999 | 3 (2.5%) | 0 (0.0%) |
| $35,000 to $39,999 | 8 (6.6%) | 1 (0.7%) |
| $40,000 to $44,999 | 0 (0.0%) | 6 (4.1%) |
| $45,000 to $49,999 | 0 (0.0%) | 12 (8.2%) |
| $50,000 to $54,999 | 5 (4.1%) | 0 (0.0%) |
| $55,000 to $64,999 | 0 (0.0%) | 3 (2.1%) |
| $65,000 to $74,999 | 2 (1.6%) | 26 (17.8%) |
| $75,000 to $99,999 | 5 (4.1%) | 0 (0.0%) |
| $100,000+ | 6 (4.9%) | 0 (0.0%) |
| Total | 122 (100.0%) | 146 (100.0%) |
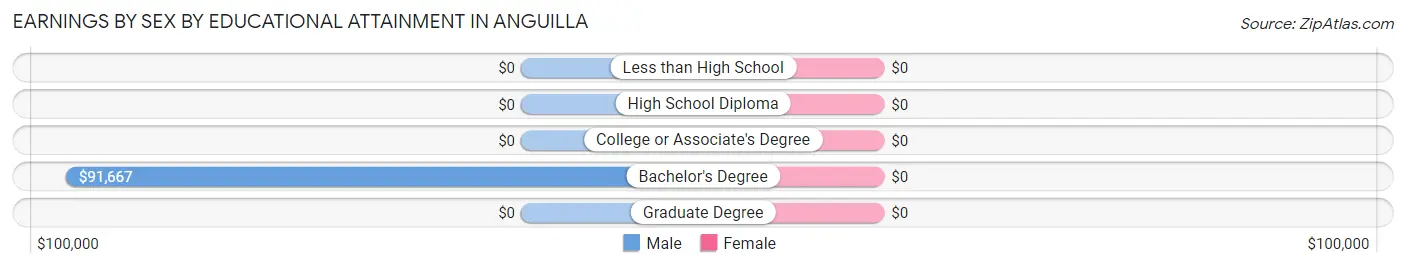
Earnings by Sex by Educational Attainment in Anguilla
| Educational Attainment | Male Income | Female Income |
| Less than High School | - | - |
| High School Diploma | - | - |
| College or Associate's Degree | - | - |
| Bachelor's Degree | $91,667 | $0 |
| Graduate Degree | - | - |
| Total | $36,875 | $23,750 |
Family Income in Anguilla
Family Income Brackets in Anguilla
According to the Anguilla family income data, there are 29 families falling into the $15,000 to $24,999 income range, which is the most common income bracket and makes up 18.8% of all families. Conversely, the $200,000+ income bracket is the least frequent group with only 2 families (1.3%) belonging to this category.
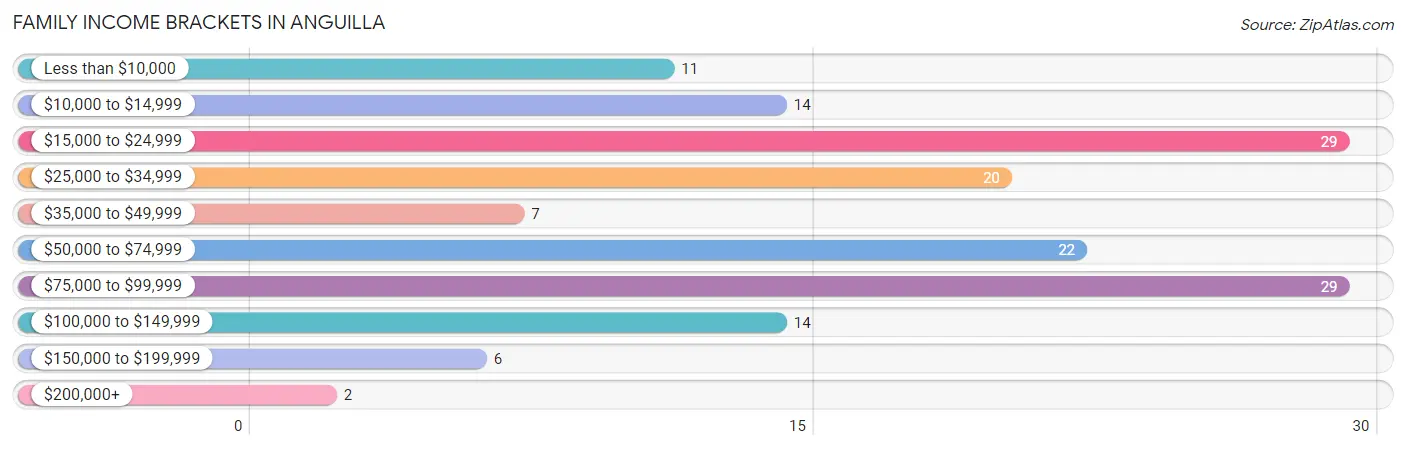
| Income Bracket | # Families | % Families |
| Less than $10,000 | 11 | 7.1% |
| $10,000 to $14,999 | 14 | 9.1% |
| $15,000 to $24,999 | 29 | 18.8% |
| $25,000 to $34,999 | 20 | 13.0% |
| $35,000 to $49,999 | 7 | 4.5% |
| $50,000 to $74,999 | 22 | 14.3% |
| $75,000 to $99,999 | 29 | 18.8% |
| $100,000 to $149,999 | 14 | 9.1% |
| $150,000 to $199,999 | 6 | 3.9% |
| $200,000+ | 2 | 1.3% |
Family Income by Famaliy Size in Anguilla
2-person families (78 | 50.6%) account for the highest median family income in Anguilla with $80,865 per family, while 2-person families (78 | 50.6%) have the highest median income of $40,432 per family member.
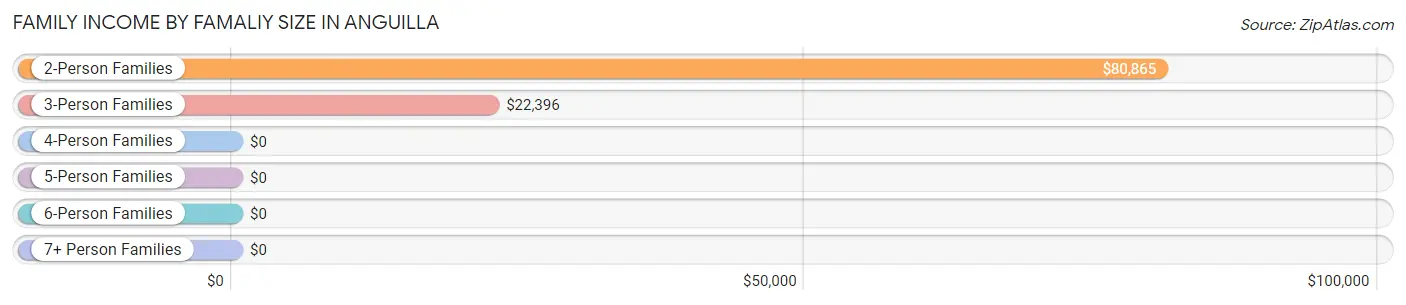
| Income Bracket | # Families | Median Income |
| 2-Person Families | 78 (50.6%) | $80,865 |
| 3-Person Families | 46 (29.9%) | $22,396 |
| 4-Person Families | 14 (9.1%) | $0 |
| 5-Person Families | 11 (7.1%) | $0 |
| 6-Person Families | 5 (3.3%) | $0 |
| 7+ Person Families | 0 (0.0%) | $0 |
| Total | 154 (100.0%) | $0 |
Family Income by Number of Earners in Anguilla
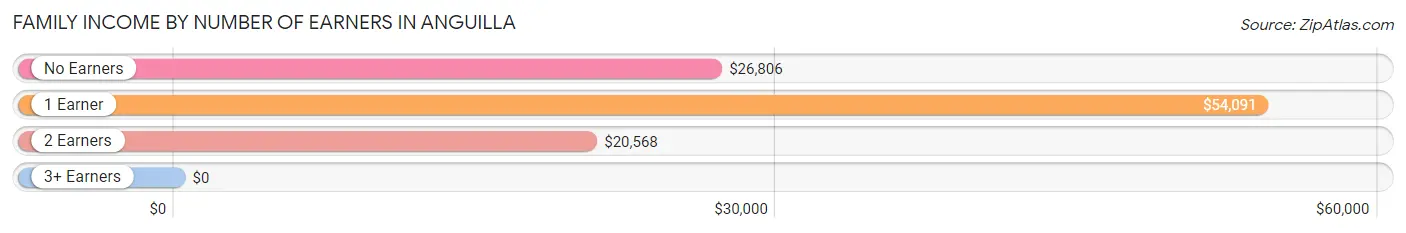
| Number of Earners | # Families | Median Income |
| No Earners | 19 (12.3%) | $26,806 |
| 1 Earner | 100 (64.9%) | $54,091 |
| 2 Earners | 27 (17.5%) | $20,568 |
| 3+ Earners | 8 (5.2%) | $0 |
| Total | 154 (100.0%) | $0 |
Household Income in Anguilla
Household Income Brackets in Anguilla
With 60 households falling in the category, the $25,000 to $34,999 income range is the most frequent in Anguilla, accounting for 24.0% of all households. In contrast, only 2 households (0.8%) fall into the $200,000+ income bracket, making it the least populous group.
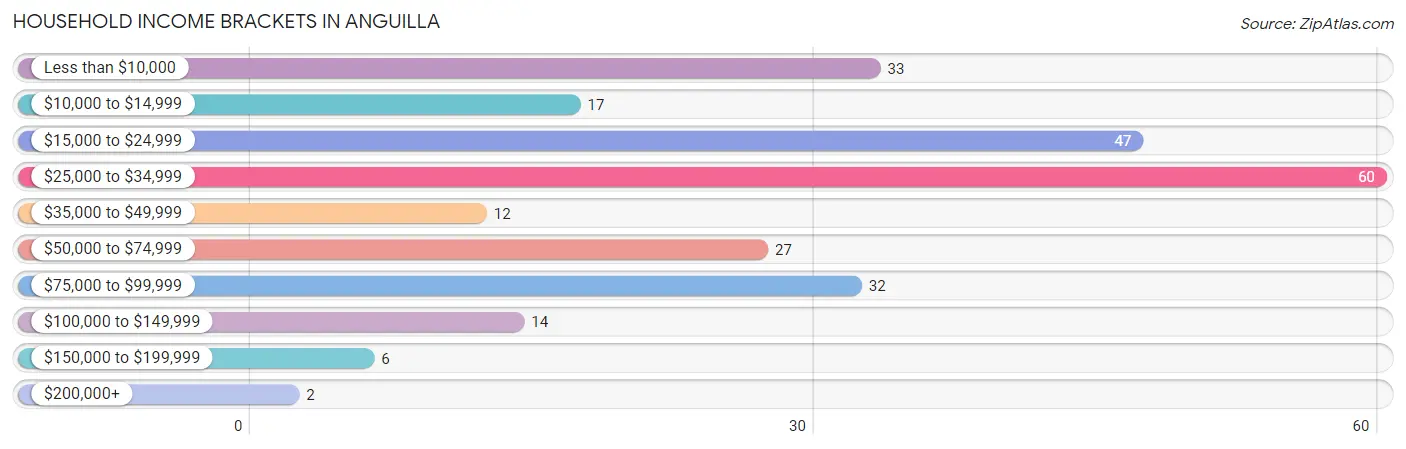
| Income Bracket | # Households | % Households |
| Less than $10,000 | 33 | 13.2% |
| $10,000 to $14,999 | 17 | 6.8% |
| $15,000 to $24,999 | 47 | 18.8% |
| $25,000 to $34,999 | 60 | 24.0% |
| $35,000 to $49,999 | 12 | 4.8% |
| $50,000 to $74,999 | 27 | 10.8% |
| $75,000 to $99,999 | 32 | 12.8% |
| $100,000 to $149,999 | 14 | 5.6% |
| $150,000 to $199,999 | 6 | 2.4% |
| $200,000+ | 2 | 0.8% |
Household Income by Householder Age in Anguilla
The median household income in Anguilla is $27,917, with the highest median household income of $29,479 found in the 65+ years age bracket for the primary householder. A total of 99 households (39.6%) fall into this category.
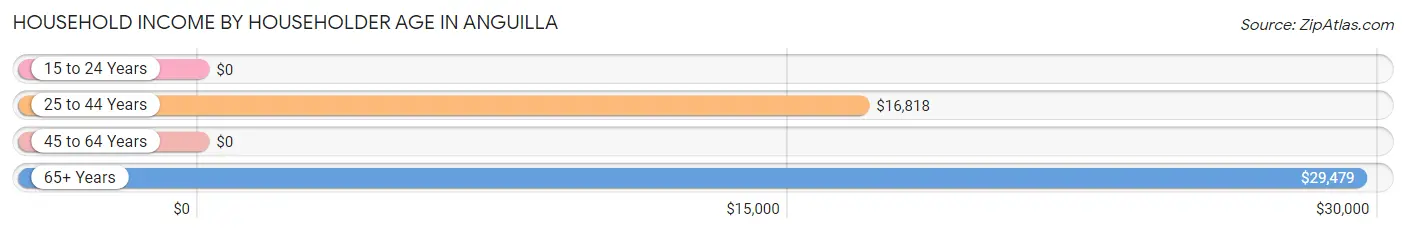
| Income Bracket | # Households | Median Income |
| 15 to 24 Years | 0 (0.0%) | $0 |
| 25 to 44 Years | 60 (24.0%) | $16,818 |
| 45 to 64 Years | 91 (36.4%) | $0 |
| 65+ Years | 99 (39.6%) | $29,479 |
| Total | 250 (100.0%) | $27,917 |
Poverty in Anguilla
Income Below Poverty by Sex and Age in Anguilla
With 50.9% poverty level for males and 41.9% for females among the residents of Anguilla, 12 to 14 year old males and under 5 year old females are the most vulnerable to poverty, with 24 males (100.0%) and 11 females (100.0%) in their respective age groups living below the poverty level.
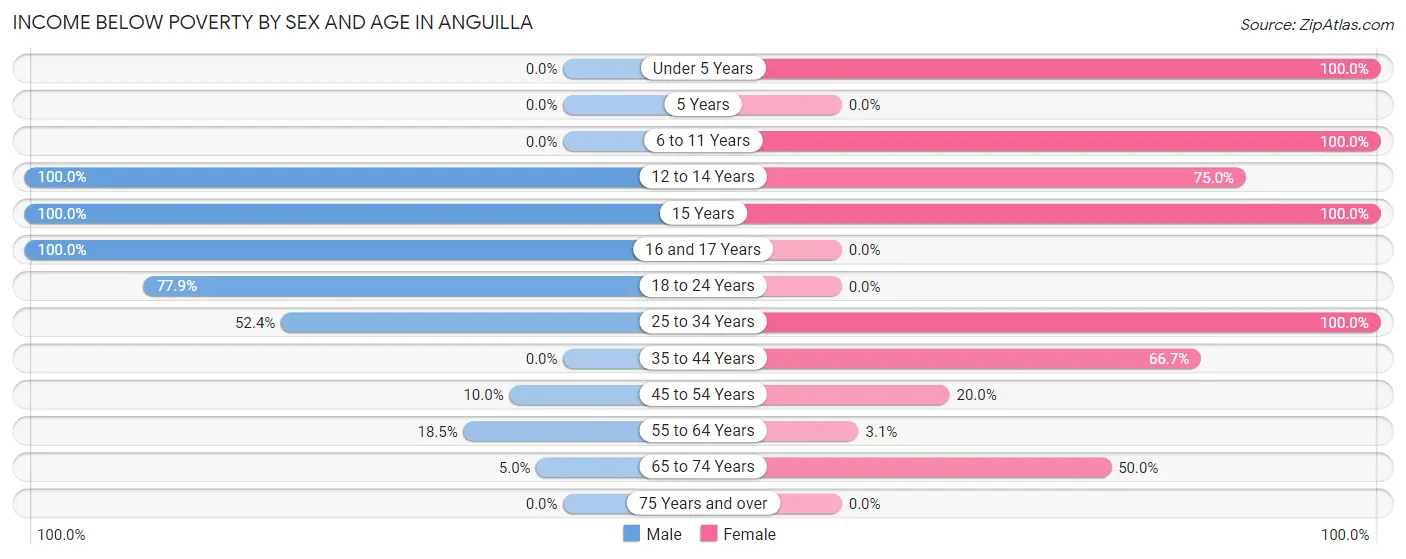
| Age Bracket | Male | Female |
| Under 5 Years | 0 (0.0%) | 11 (100.0%) |
| 5 Years | 0 (0.0%) | 0 (0.0%) |
| 6 to 11 Years | 0 (0.0%) | 8 (100.0%) |
| 12 to 14 Years | 24 (100.0%) | 9 (75.0%) |
| 15 Years | 25 (100.0%) | 15 (100.0%) |
| 16 and 17 Years | 14 (100.0%) | 0 (0.0%) |
| 18 to 24 Years | 88 (77.9%) | 0 (0.0%) |
| 25 to 34 Years | 11 (52.4%) | 11 (100.0%) |
| 35 to 44 Years | 0 (0.0%) | 40 (66.7%) |
| 45 to 54 Years | 2 (10.0%) | 3 (20.0%) |
| 55 to 64 Years | 10 (18.5%) | 2 (3.1%) |
| 65 to 74 Years | 2 (5.0%) | 13 (50.0%) |
| 75 Years and over | 0 (0.0%) | 0 (0.0%) |
| Total | 176 (50.9%) | 112 (41.9%) |
Income Above Poverty by Sex and Age in Anguilla
According to the poverty statistics in Anguilla, males aged under 5 years and females aged 75 years and over are the age groups that are most secure financially, with 100.0% of males and 100.0% of females in these age groups living above the poverty line.
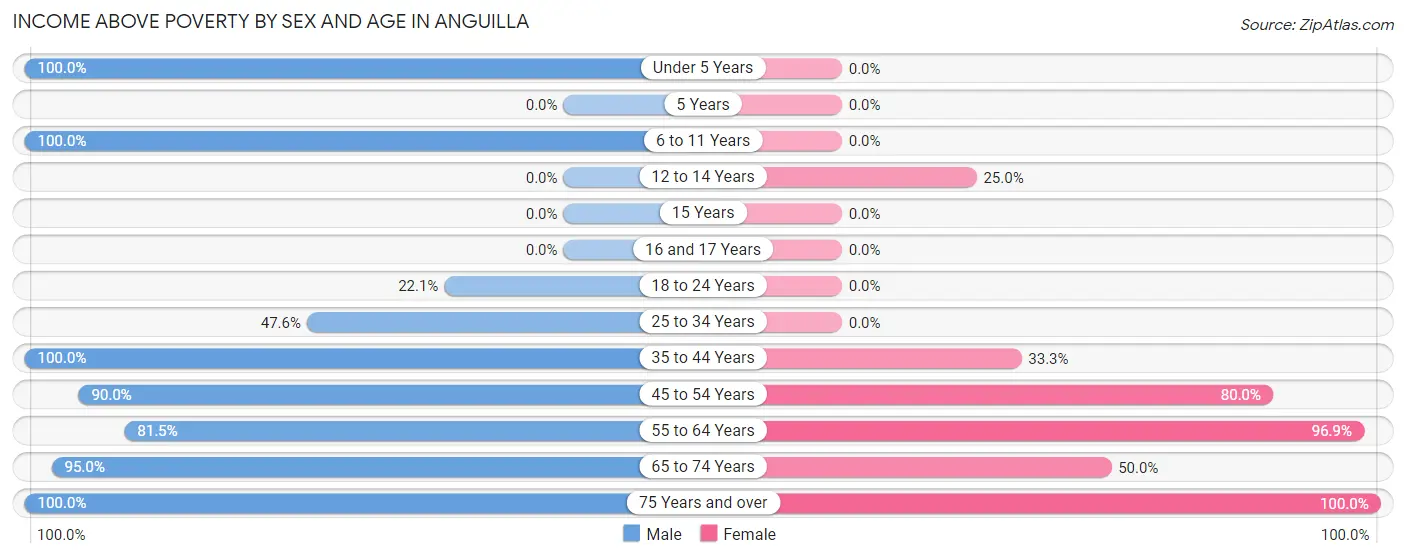
| Age Bracket | Male | Female |
| Under 5 Years | 7 (100.0%) | 0 (0.0%) |
| 5 Years | 0 (0.0%) | 0 (0.0%) |
| 6 to 11 Years | 4 (100.0%) | 0 (0.0%) |
| 12 to 14 Years | 0 (0.0%) | 3 (25.0%) |
| 15 Years | 0 (0.0%) | 0 (0.0%) |
| 16 and 17 Years | 0 (0.0%) | 0 (0.0%) |
| 18 to 24 Years | 25 (22.1%) | 0 (0.0%) |
| 25 to 34 Years | 10 (47.6%) | 0 (0.0%) |
| 35 to 44 Years | 20 (100.0%) | 20 (33.3%) |
| 45 to 54 Years | 18 (90.0%) | 12 (80.0%) |
| 55 to 64 Years | 44 (81.5%) | 62 (96.9%) |
| 65 to 74 Years | 38 (95.0%) | 13 (50.0%) |
| 75 Years and over | 4 (100.0%) | 45 (100.0%) |
| Total | 170 (49.1%) | 155 (58.1%) |
Income Below Poverty Among Married-Couple Families in Anguilla
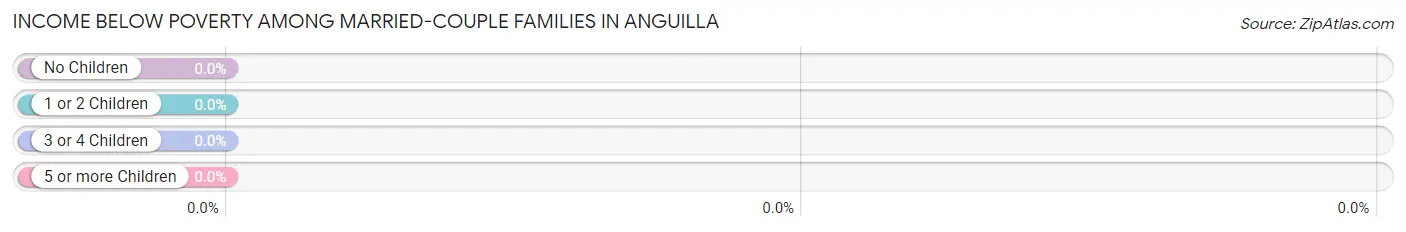
| Children | Above Poverty | Below Poverty |
| No Children | 67 (100.0%) | 0 (0.0%) |
| 1 or 2 Children | 13 (100.0%) | 0 (0.0%) |
| 3 or 4 Children | 0 (0.0%) | 0 (0.0%) |
| 5 or more Children | 0 (0.0%) | 0 (0.0%) |
| Total | 80 (100.0%) | 0 (0.0%) |
Income Below Poverty Among Single-Parent Households in Anguilla
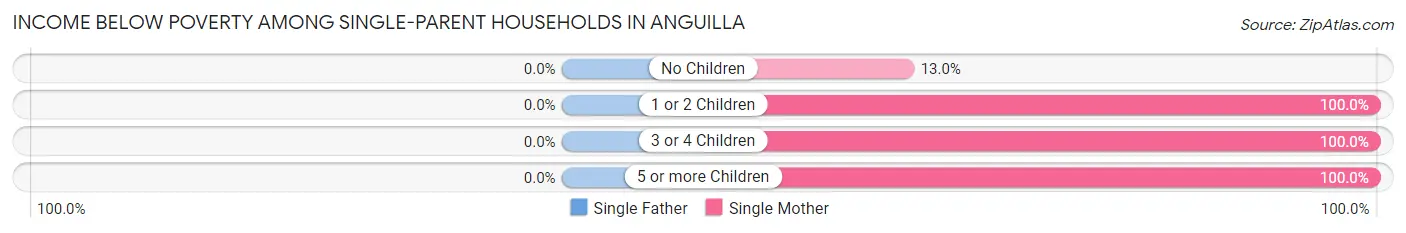
| Children | Single Father | Single Mother |
| No Children | 0 (0.0%) | 3 (13.0%) |
| 1 or 2 Children | 0 (0.0%) | 35 (100.0%) |
| 3 or 4 Children | 0 (0.0%) | 11 (100.0%) |
| 5 or more Children | 0 (0.0%) | 5 (100.0%) |
| Total | 0 (0.0%) | 54 (73.0%) |
Income Below Poverty Among Married-Couple vs Single-Parent Households in Anguilla
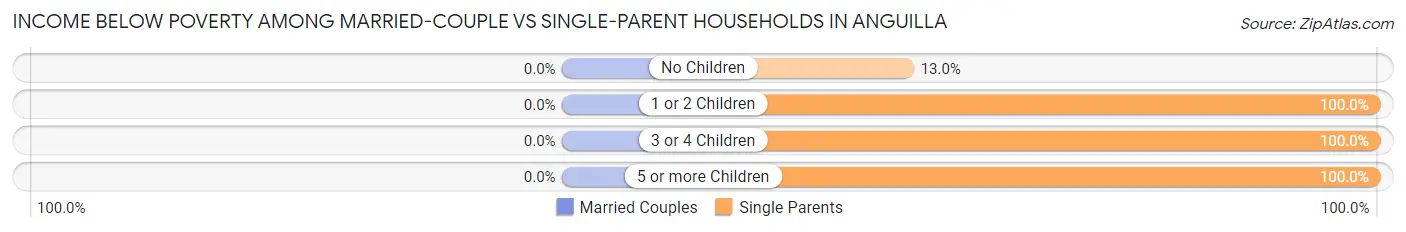
| Children | Married-Couple Families | Single-Parent Households |
| No Children | 0 (0.0%) | 3 (13.0%) |
| 1 or 2 Children | 0 (0.0%) | 35 (100.0%) |
| 3 or 4 Children | 0 (0.0%) | 11 (100.0%) |
| 5 or more Children | 0 (0.0%) | 5 (100.0%) |
| Total | 0 (0.0%) | 54 (73.0%) |
Race in Anguilla
The most populous races in Anguilla are Black / African American (551 | 89.9%), White / Caucasian (51 | 8.3%), and Two or more Races (11 | 1.8%).
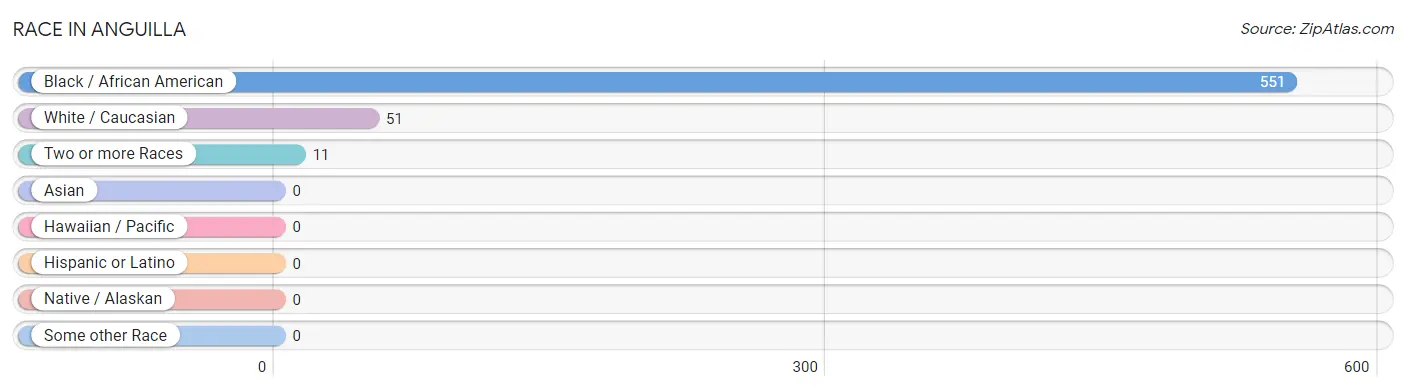
| Race | # Population | % Population |
| Asian | 0 | 0.0% |
| Black / African American | 551 | 89.9% |
| Hawaiian / Pacific | 0 | 0.0% |
| Hispanic or Latino | 0 | 0.0% |
| Native / Alaskan | 0 | 0.0% |
| White / Caucasian | 51 | 8.3% |
| Two or more Races | 11 | 1.8% |
| Some other Race | 0 | 0.0% |
| Total | 613 | 100.0% |
Ancestry in Anguilla
The most populous ancestries reported in Anguilla are American (28 | 4.6%), Irish (27 | 4.4%), English (3 | 0.5%), and European (2 | 0.3%), together accounting for 9.8% of all Anguilla residents.
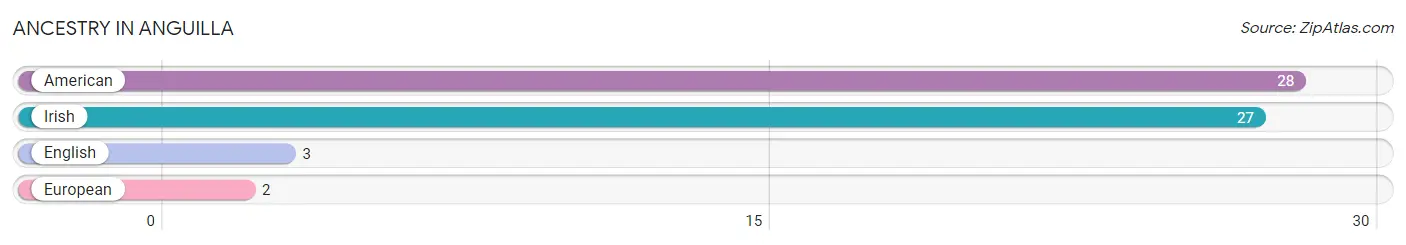
| Ancestry | # Population | % Population |
| American | 28 | 4.6% |
| English | 3 | 0.5% |
| European | 2 | 0.3% |
| Irish | 27 | 4.4% | View All 4 Rows |
Immigrants in Anguilla

| Immigration Origin | # Population | % Population | View All 0 Rows |
Sex and Age in Anguilla
Sex and Age in Anguilla
The most populous age groups in Anguilla are 20 to 24 Years (82 | 23.7%) for men and 40 to 44 Years (46 | 17.2%) for women.
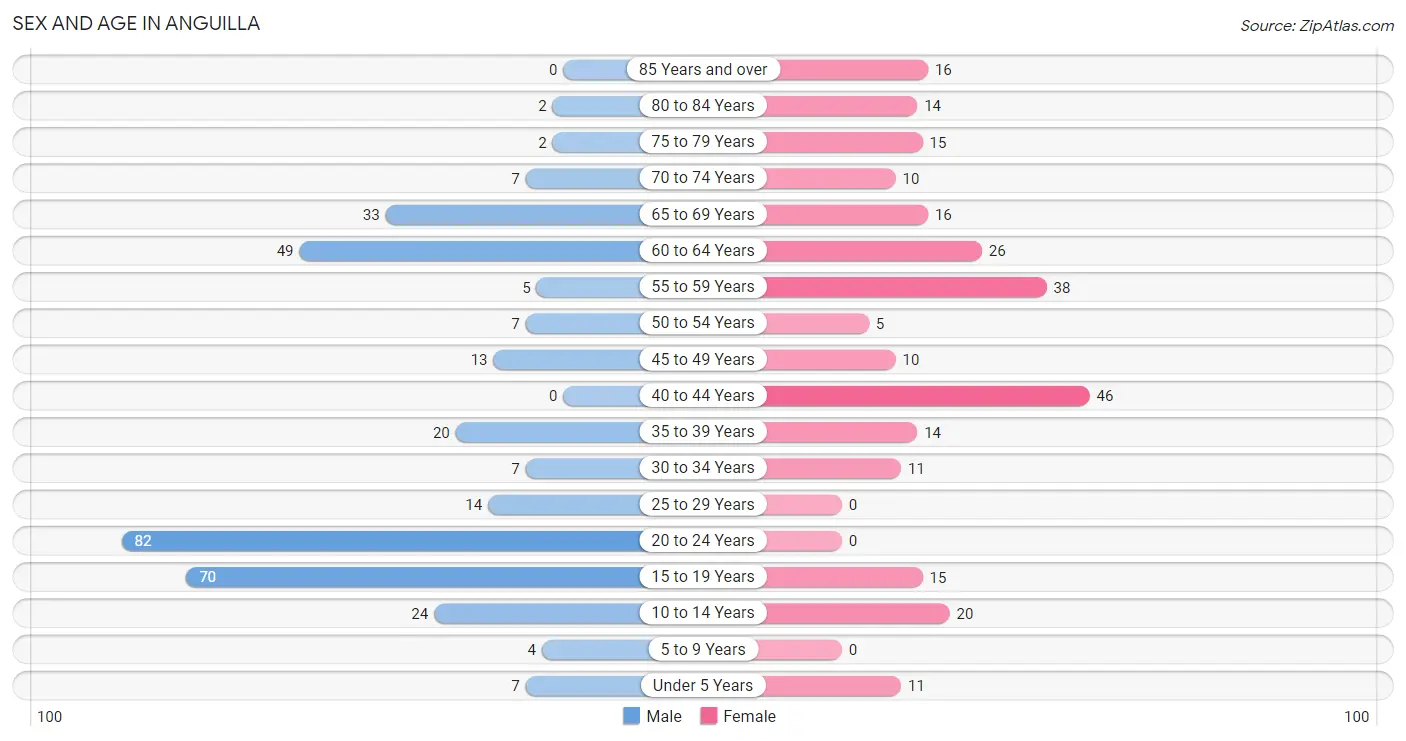
| Age Bracket | Male | Female |
| Under 5 Years | 7 (2.0%) | 11 (4.1%) |
| 5 to 9 Years | 4 (1.2%) | 0 (0.0%) |
| 10 to 14 Years | 24 (6.9%) | 20 (7.5%) |
| 15 to 19 Years | 70 (20.2%) | 15 (5.6%) |
| 20 to 24 Years | 82 (23.7%) | 0 (0.0%) |
| 25 to 29 Years | 14 (4.1%) | 0 (0.0%) |
| 30 to 34 Years | 7 (2.0%) | 11 (4.1%) |
| 35 to 39 Years | 20 (5.8%) | 14 (5.2%) |
| 40 to 44 Years | 0 (0.0%) | 46 (17.2%) |
| 45 to 49 Years | 13 (3.8%) | 10 (3.7%) |
| 50 to 54 Years | 7 (2.0%) | 5 (1.9%) |
| 55 to 59 Years | 5 (1.5%) | 38 (14.2%) |
| 60 to 64 Years | 49 (14.2%) | 26 (9.7%) |
| 65 to 69 Years | 33 (9.5%) | 16 (6.0%) |
| 70 to 74 Years | 7 (2.0%) | 10 (3.7%) |
| 75 to 79 Years | 2 (0.6%) | 15 (5.6%) |
| 80 to 84 Years | 2 (0.6%) | 14 (5.2%) |
| 85 Years and over | 0 (0.0%) | 16 (6.0%) |
| Total | 346 (100.0%) | 267 (100.0%) |
Families and Households in Anguilla
Median Family Size in Anguilla
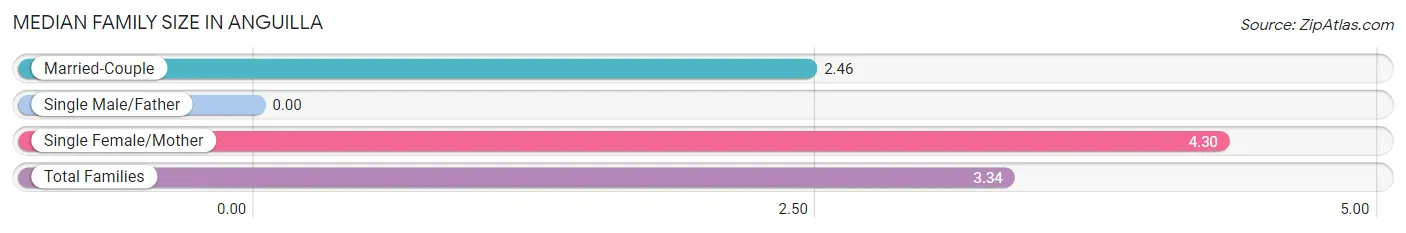
| Family Type | # Families | Family Size |
| Married-Couple | 80 (51.9%) | 2.46 |
| Single Male/Father | 0 (0.0%) | - |
| Single Female/Mother | 74 (48.0%) | 4.30 |
| Total Families | 154 (100.0%) | 3.34 |
Median Household Size in Anguilla
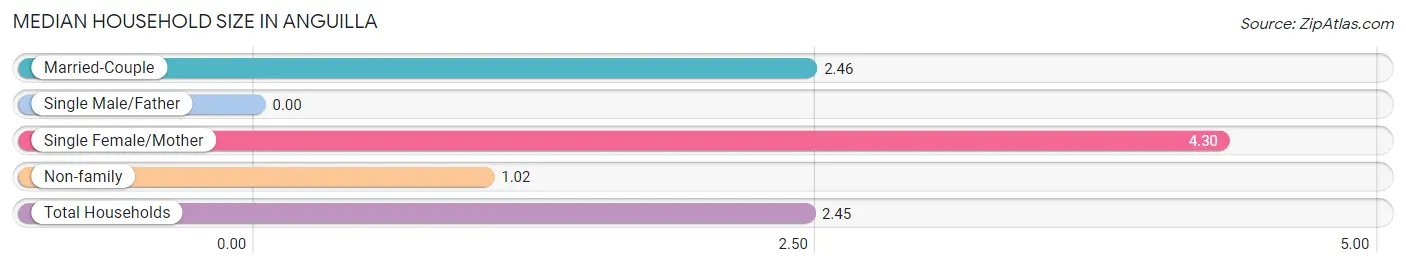
| Household Type | # Households | Household Size |
| Married-Couple | 80 (32.0%) | 2.46 |
| Single Male/Father | 0 (0.0%) | - |
| Single Female/Mother | 74 (29.6%) | 4.30 |
| Non-family | 96 (38.4%) | 1.02 |
| Total Households | 250 (100.0%) | 2.45 |
Household Size by Marriage Status in Anguilla
Out of a total of 250 households in Anguilla, 154 (61.6%) are family households, while 96 (38.4%) are nonfamily households. The most numerous type of family households are 2-person households, comprising 78, and the most common type of nonfamily households are 1-person households, comprising 94.
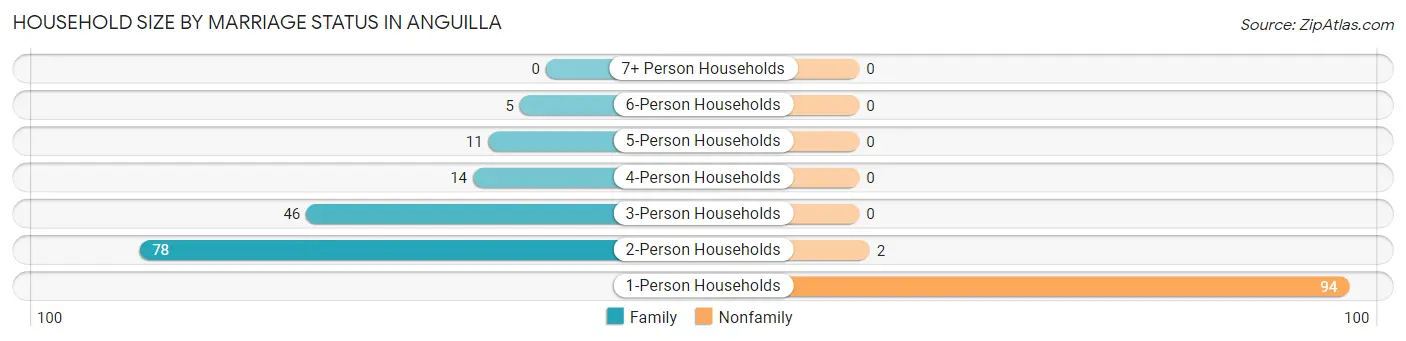
| Household Size | Family Households | Nonfamily Households |
| 1-Person Households | - | 94 (37.6%) |
| 2-Person Households | 78 (31.2%) | 2 (0.8%) |
| 3-Person Households | 46 (18.4%) | 0 (0.0%) |
| 4-Person Households | 14 (5.6%) | 0 (0.0%) |
| 5-Person Households | 11 (4.4%) | 0 (0.0%) |
| 6-Person Households | 5 (2.0%) | 0 (0.0%) |
| 7+ Person Households | 0 (0.0%) | 0 (0.0%) |
| Total | 154 (61.6%) | 96 (38.4%) |
Female Fertility in Anguilla
Fertility by Age in Anguilla
| Age Bracket | Women with Births | Births / 1,000 Women |
| 15 to 19 years | 0 (0.0%) | 0.0 |
| 20 to 34 years | 0 (0.0%) | 0.0 |
| 35 to 50 years | 0 (0.0%) | 0.0 |
| Total | 0 (0.0%) | 0.0 |
Fertility by Age by Marriage Status in Anguilla
| Age Bracket | Married | Unmarried |
| 15 to 19 years | 0 (0.0%) | 0 (0.0%) |
| 20 to 34 years | 0 (0.0%) | 0 (0.0%) |
| 35 to 50 years | 0 (0.0%) | 0 (0.0%) |
| Total | 0 (0.0%) | 0 (0.0%) |
Fertility by Education in Anguilla
| Educational Attainment | Women with Births | Births / 1,000 Women |
| Less than High School | 0 (0.0%) | 0.0 |
| High School Diploma | 0 (0.0%) | 0.0 |
| College or Associate's Degree | 0 (0.0%) | 0.0 |
| Bachelor's Degree | 0 (0.0%) | 0.0 |
| Graduate Degree | 0 (0.0%) | 0.0 |
| Total | 0 (0.0%) | 0.0 |
Fertility by Education by Marriage Status in Anguilla
| Educational Attainment | Married | Unmarried |
| Less than High School | 0 (0.0%) | 0 (0.0%) |
| High School Diploma | 0 (0.0%) | 0 (0.0%) |
| College or Associate's Degree | 0 (0.0%) | 0 (0.0%) |
| Bachelor's Degree | 0 (0.0%) | 0 (0.0%) |
| Graduate Degree | 0 (0.0%) | 0 (0.0%) |
| Total | 0 (0.0%) | 0 (0.0%) |
Employment Characteristics in Anguilla
Employment by Class of Employer in Anguilla
Among the 248 employed individuals in Anguilla, private company employees (108 | 43.5%), state government employees (90 | 36.3%), and local government employees (41 | 16.5%) make up the most common classes of employment.
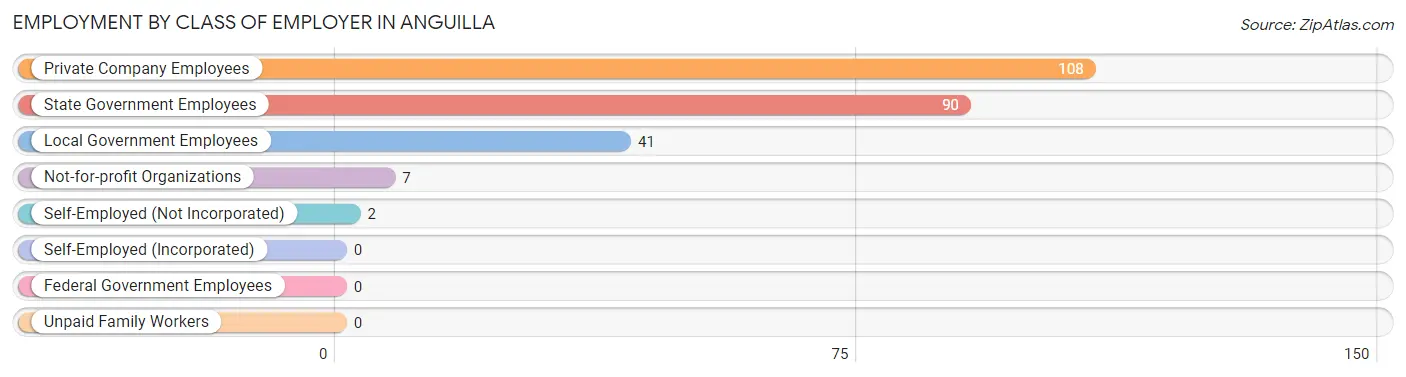
| Employer Class | # Employees | % Employees |
| Private Company Employees | 108 | 43.5% |
| Self-Employed (Incorporated) | 0 | 0.0% |
| Self-Employed (Not Incorporated) | 2 | 0.8% |
| Not-for-profit Organizations | 7 | 2.8% |
| Local Government Employees | 41 | 16.5% |
| State Government Employees | 90 | 36.3% |
| Federal Government Employees | 0 | 0.0% |
| Unpaid Family Workers | 0 | 0.0% |
| Total | 248 | 100.0% |
Employment Status by Age in Anguilla
According to the labor force statistics for Anguilla, out of the total population over 16 years of age (507), 53.6% or 272 individuals are in the labor force, with 4.8% or 13 of them unemployed. The age group with the highest labor force participation rate is 20 to 24 years, with 100.0% or 82 individuals in the labor force. Within the labor force, the 35 to 44 years age range has the highest percentage of unemployed individuals, with 9.5% or 6 of them being unemployed.
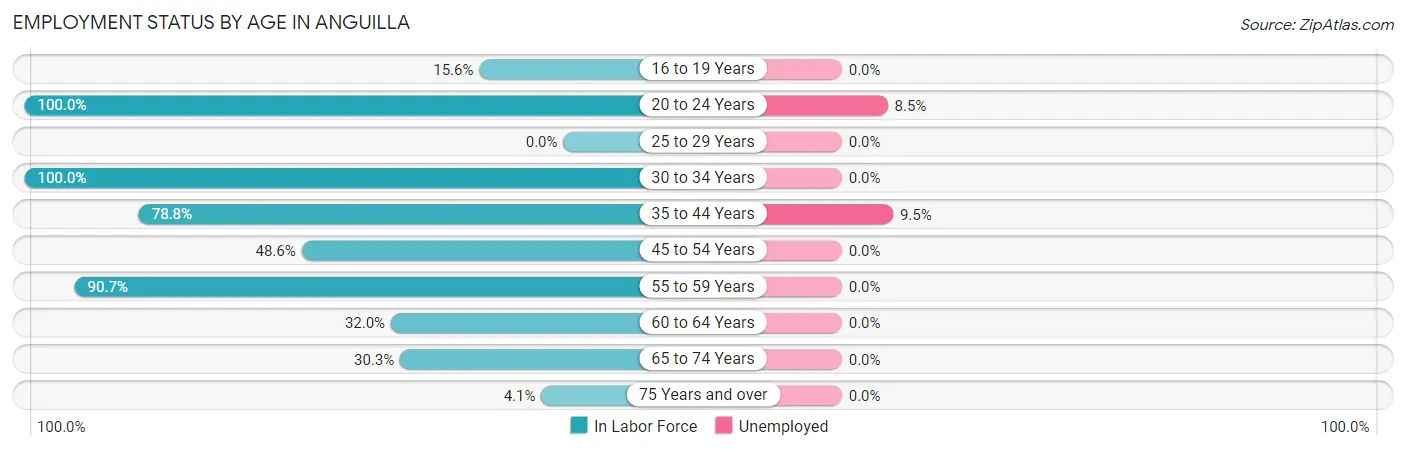
| Age Bracket | In Labor Force | Unemployed |
| 16 to 19 Years | 7 (15.6%) | 0 (0.0%) |
| 20 to 24 Years | 82 (100.0%) | 7 (8.5%) |
| 25 to 29 Years | 0 (0.0%) | 0 (0.0%) |
| 30 to 34 Years | 18 (100.0%) | 0 (0.0%) |
| 35 to 44 Years | 63 (78.8%) | 6 (9.5%) |
| 45 to 54 Years | 17 (48.6%) | 0 (0.0%) |
| 55 to 59 Years | 39 (90.7%) | 0 (0.0%) |
| 60 to 64 Years | 24 (32.0%) | 0 (0.0%) |
| 65 to 74 Years | 20 (30.3%) | 0 (0.0%) |
| 75 Years and over | 2 (4.1%) | 0 (0.0%) |
| Total | 272 (53.6%) | 13 (4.8%) |
Employment Status by Educational Attainment in Anguilla
According to labor force statistics for Anguilla, 60.8% of individuals (161) out of the total population between 25 and 64 years of age (265) are in the labor force, with 3.7% or 6 of them being unemployed. The group with the highest labor force participation rate are those with the educational attainment of high school diploma, with 84.3% or 59 individuals in the labor force. Within the labor force, individuals with college / associate degree education have the highest percentage of unemployment, with 8.8% or 6 of them being unemployed.
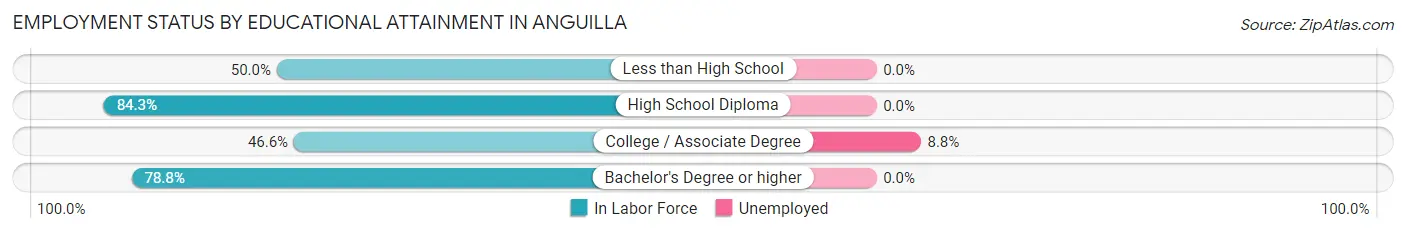
| Educational Attainment | In Labor Force | Unemployed |
| Less than High School | 8 (50.0%) | 0 (0.0%) |
| High School Diploma | 59 (84.3%) | 0 (0.0%) |
| College / Associate Degree | 68 (46.6%) | 13 (8.8%) |
| Bachelor's Degree or higher | 26 (78.8%) | 0 (0.0%) |
| Total | 161 (60.8%) | 10 (3.7%) |
Employment Occupations by Sex in Anguilla
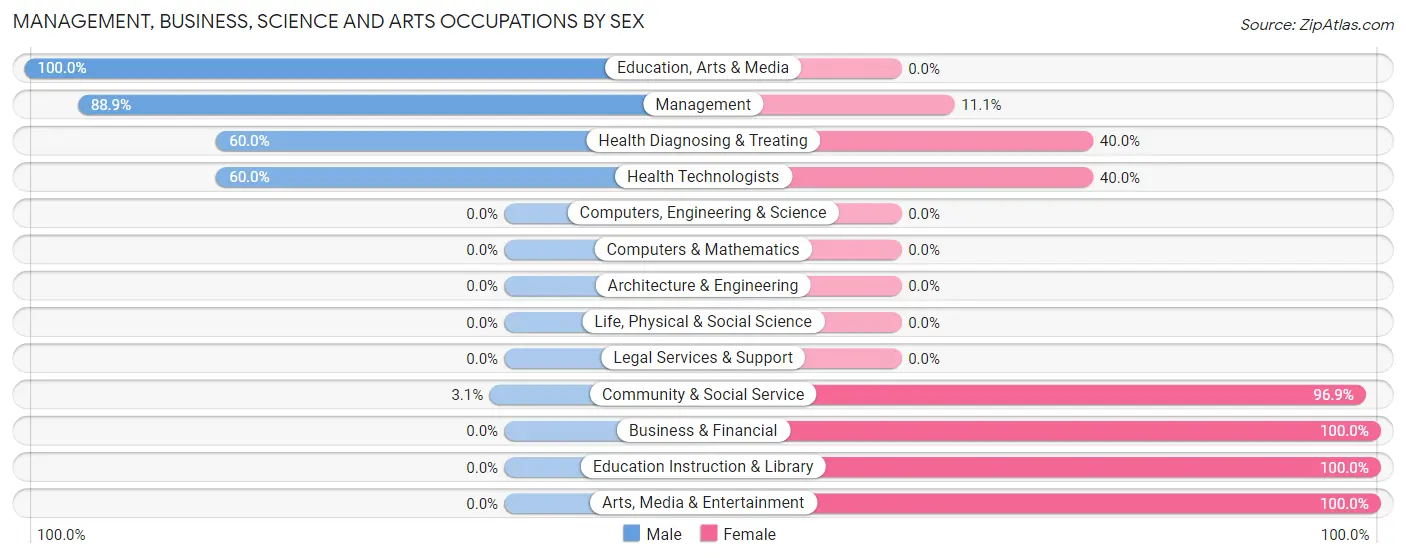
Management, Business, Science and Arts Occupations
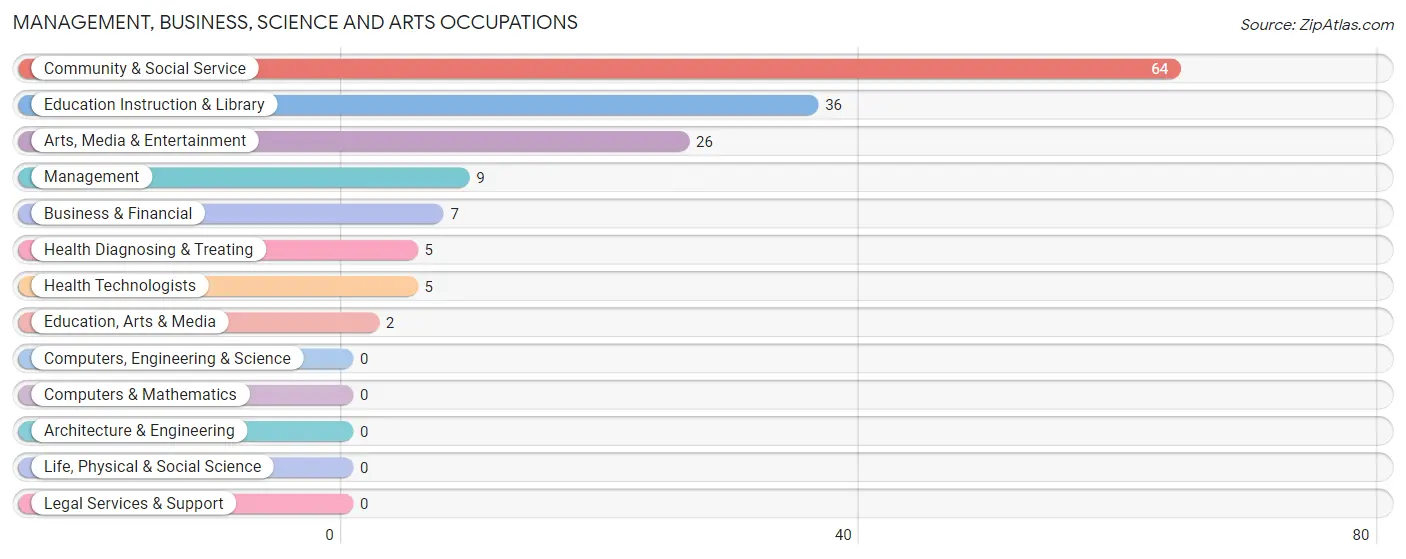
The most common Management, Business, Science and Arts occupations in Anguilla are Community & Social Service (64 | 24.7%), Education Instruction & Library (36 | 13.9%), Arts, Media & Entertainment (26 | 10.0%), Management (9 | 3.5%), and Business & Financial (7 | 2.7%).
Management, Business, Science and Arts Occupations by Sex
Within the Management, Business, Science and Arts occupations in Anguilla, the most male-oriented occupations are Education, Arts & Media (100.0%), Management (88.9%), and Health Diagnosing & Treating (60.0%), while the most female-oriented occupations are Business & Financial (100.0%), Education Instruction & Library (100.0%), and Arts, Media & Entertainment (100.0%).
| Occupation | Male | Female |
| Management | 8 (88.9%) | 1 (11.1%) |
| Business & Financial | 0 (0.0%) | 7 (100.0%) |
| Computers, Engineering & Science | 0 (0.0%) | 0 (0.0%) |
| Computers & Mathematics | 0 (0.0%) | 0 (0.0%) |
| Architecture & Engineering | 0 (0.0%) | 0 (0.0%) |
| Life, Physical & Social Science | 0 (0.0%) | 0 (0.0%) |
| Community & Social Service | 2 (3.1%) | 62 (96.9%) |
| Education, Arts & Media | 2 (100.0%) | 0 (0.0%) |
| Legal Services & Support | 0 (0.0%) | 0 (0.0%) |
| Education Instruction & Library | 0 (0.0%) | 36 (100.0%) |
| Arts, Media & Entertainment | 0 (0.0%) | 26 (100.0%) |
| Health Diagnosing & Treating | 3 (60.0%) | 2 (40.0%) |
| Health Technologists | 3 (60.0%) | 2 (40.0%) |
| Total (Category) | 13 (15.3%) | 72 (84.7%) |
| Total (Overall) | 119 (46.0%) | 140 (54.0%) |
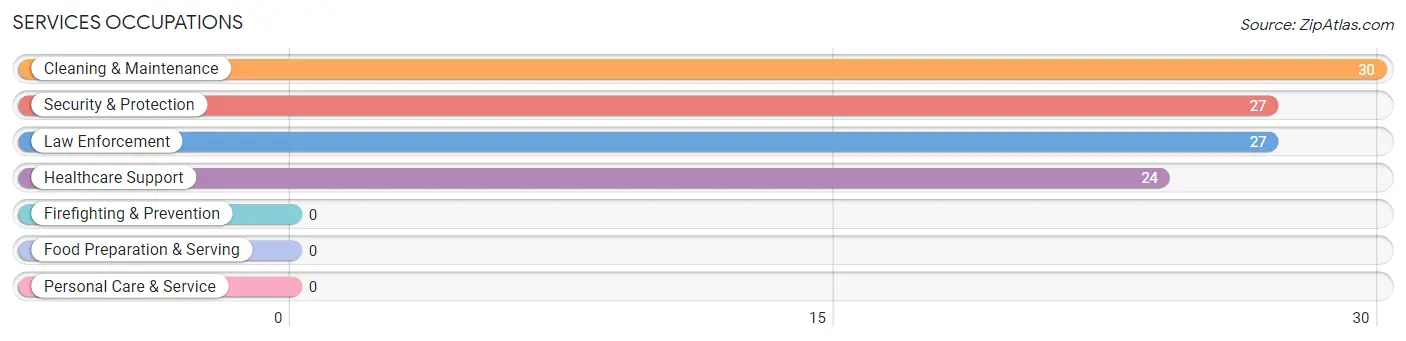
Services Occupations
The most common Services occupations in Anguilla are Cleaning & Maintenance (30 | 11.6%), Security & Protection (27 | 10.4%), Law Enforcement (27 | 10.4%), and Healthcare Support (24 | 9.3%).
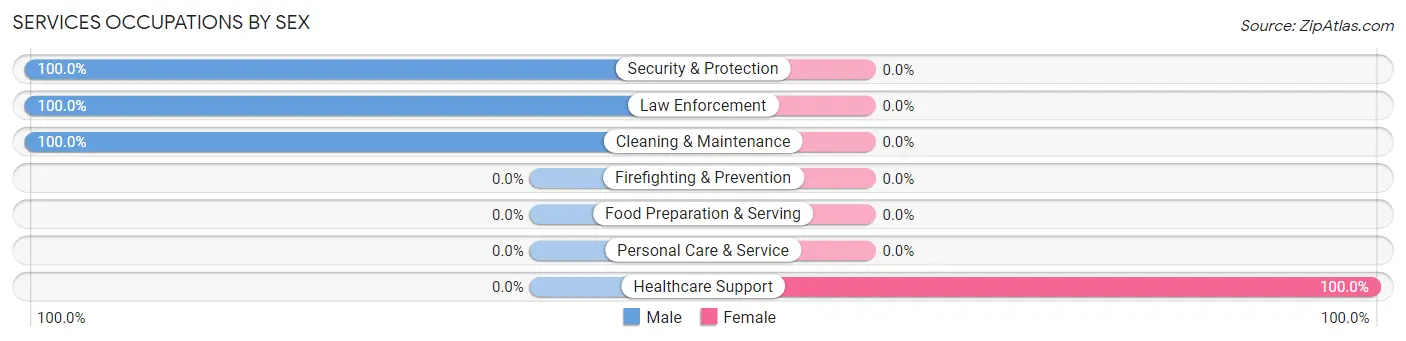
Services Occupations by Sex
| Occupation | Male | Female |
| Healthcare Support | 0 (0.0%) | 24 (100.0%) |
| Security & Protection | 27 (100.0%) | 0 (0.0%) |
| Firefighting & Prevention | 0 (0.0%) | 0 (0.0%) |
| Law Enforcement | 27 (100.0%) | 0 (0.0%) |
| Food Preparation & Serving | 0 (0.0%) | 0 (0.0%) |
| Cleaning & Maintenance | 30 (100.0%) | 0 (0.0%) |
| Personal Care & Service | 0 (0.0%) | 0 (0.0%) |
| Total (Category) | 57 (70.4%) | 24 (29.6%) |
| Total (Overall) | 119 (46.0%) | 140 (54.0%) |
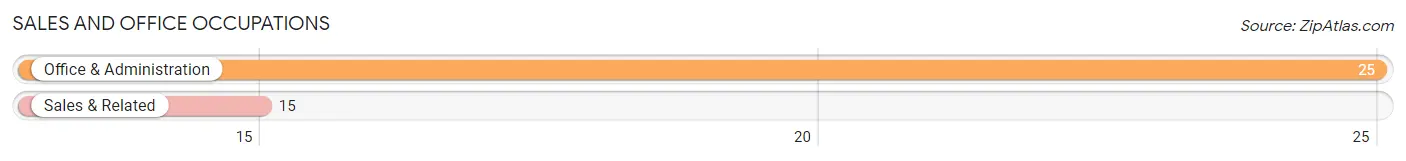
Sales and Office Occupations
The most common Sales and Office occupations in Anguilla are Office & Administration (25 | 9.7%), and Sales & Related (15 | 5.8%).
Sales and Office Occupations by Sex

| Occupation | Male | Female |
| Sales & Related | 15 (100.0%) | 0 (0.0%) |
| Office & Administration | 0 (0.0%) | 25 (100.0%) |
| Total (Category) | 15 (37.5%) | 25 (62.5%) |
| Total (Overall) | 119 (46.0%) | 140 (54.0%) |
Natural Resources, Construction and Maintenance Occupations
The most common Natural Resources, Construction and Maintenance occupations in Anguilla are , and Farming, Fishing & Forestry (6 | 2.3%).
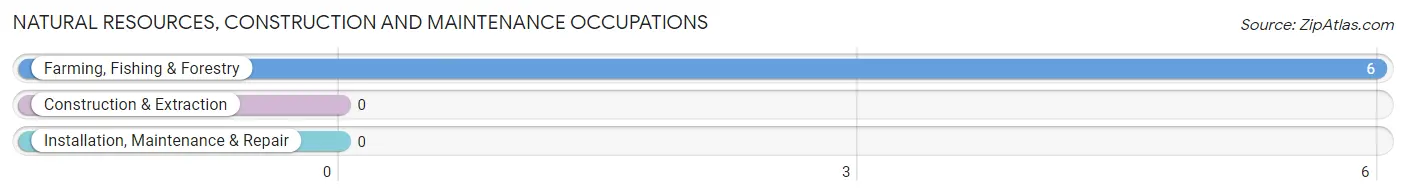
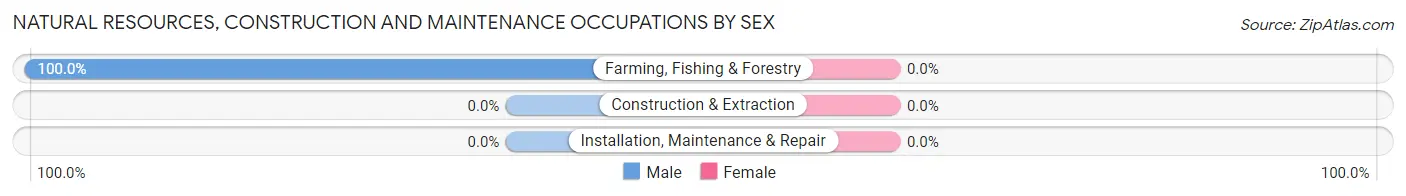
Natural Resources, Construction and Maintenance Occupations by Sex
| Occupation | Male | Female |
| Farming, Fishing & Forestry | 6 (100.0%) | 0 (0.0%) |
| Construction & Extraction | 0 (0.0%) | 0 (0.0%) |
| Installation, Maintenance & Repair | 0 (0.0%) | 0 (0.0%) |
| Total (Category) | 6 (100.0%) | 0 (0.0%) |
| Total (Overall) | 119 (46.0%) | 140 (54.0%) |
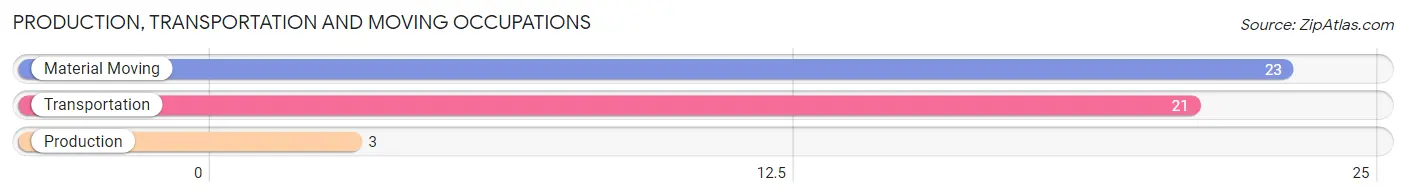
Production, Transportation and Moving Occupations
The most common Production, Transportation and Moving occupations in Anguilla are Material Moving (23 | 8.9%), Transportation (21 | 8.1%), and Production (3 | 1.2%).
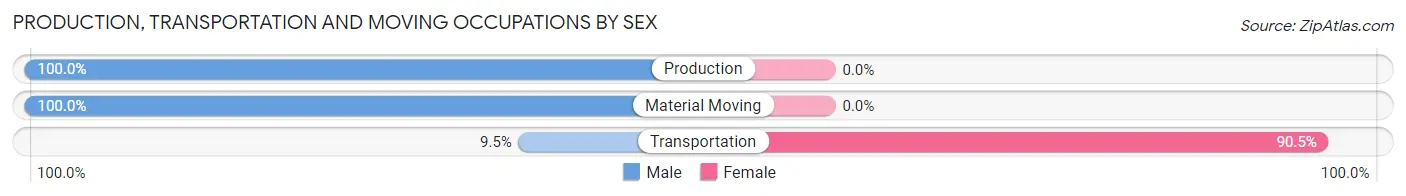
Production, Transportation and Moving Occupations by Sex
| Occupation | Male | Female |
| Production | 3 (100.0%) | 0 (0.0%) |
| Transportation | 2 (9.5%) | 19 (90.5%) |
| Material Moving | 23 (100.0%) | 0 (0.0%) |
| Total (Category) | 28 (59.6%) | 19 (40.4%) |
| Total (Overall) | 119 (46.0%) | 140 (54.0%) |
Employment Industries by Sex in Anguilla
Employment Industries in Anguilla
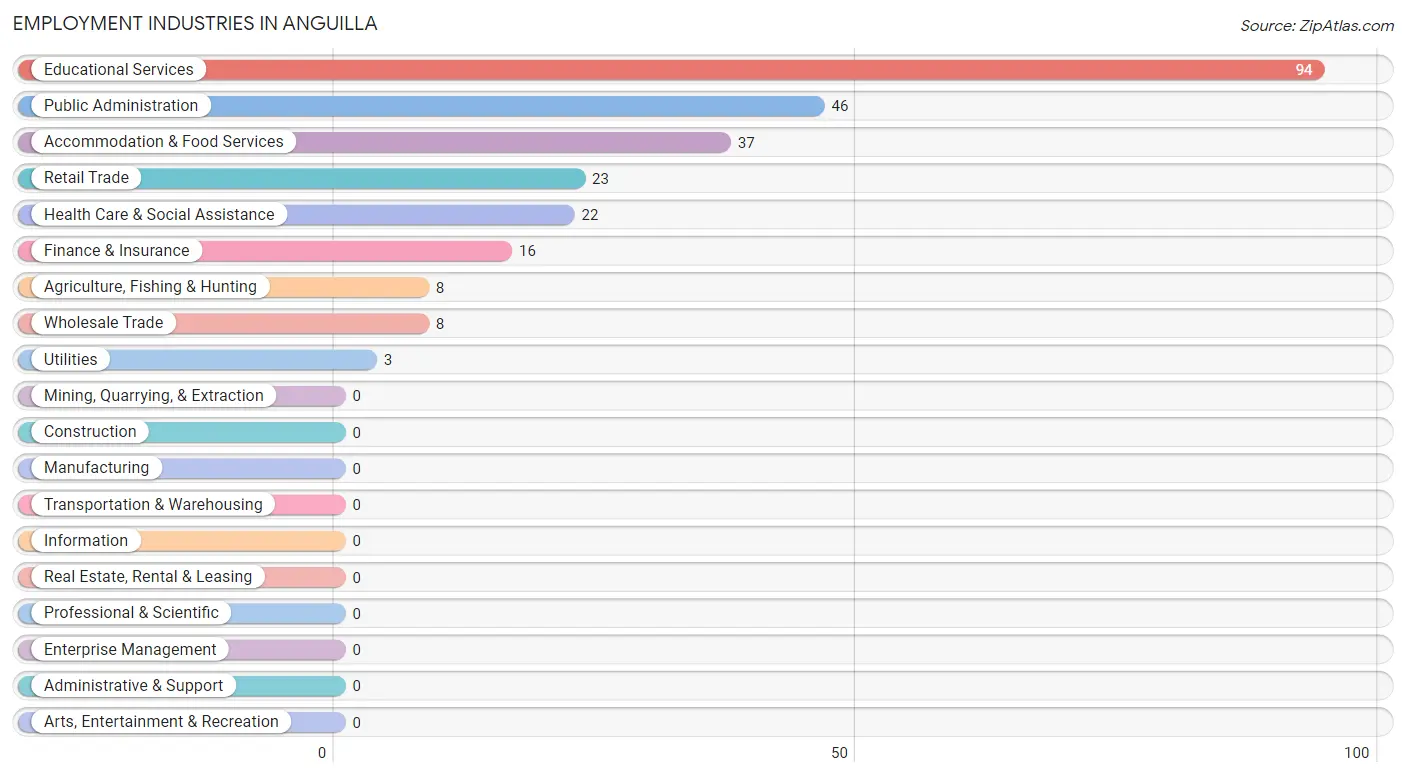
The major employment industries in Anguilla include Educational Services (94 | 36.3%), Public Administration (46 | 17.8%), Accommodation & Food Services (37 | 14.3%), Retail Trade (23 | 8.9%), and Health Care & Social Assistance (22 | 8.5%).
Employment Industries by Sex in Anguilla
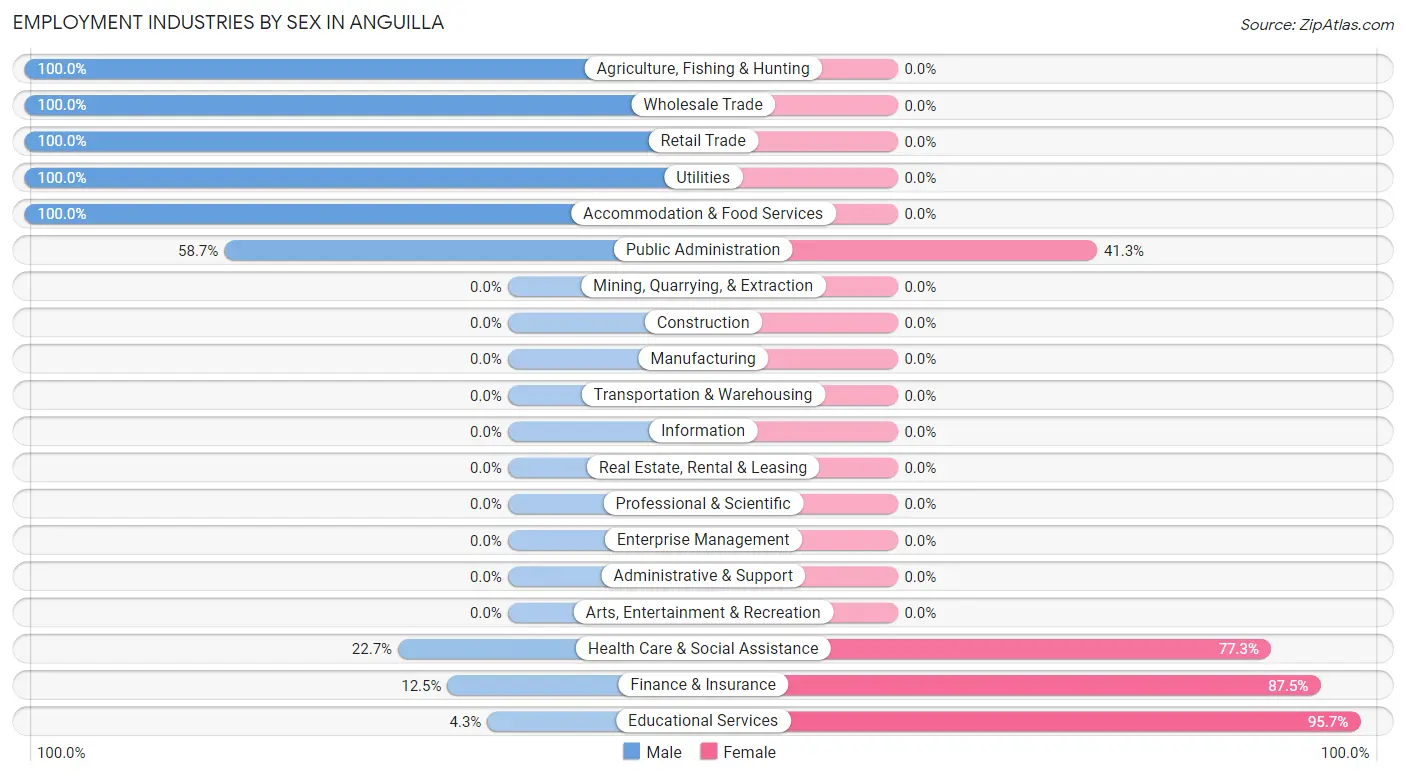
The Anguilla industries that see more men than women are Agriculture, Fishing & Hunting (100.0%), Wholesale Trade (100.0%), and Retail Trade (100.0%), whereas the industries that tend to have a higher number of women are Educational Services (95.7%), Finance & Insurance (87.5%), and Health Care & Social Assistance (77.3%).
| Industry | Male | Female |
| Agriculture, Fishing & Hunting | 8 (100.0%) | 0 (0.0%) |
| Mining, Quarrying, & Extraction | 0 (0.0%) | 0 (0.0%) |
| Construction | 0 (0.0%) | 0 (0.0%) |
| Manufacturing | 0 (0.0%) | 0 (0.0%) |
| Wholesale Trade | 8 (100.0%) | 0 (0.0%) |
| Retail Trade | 23 (100.0%) | 0 (0.0%) |
| Transportation & Warehousing | 0 (0.0%) | 0 (0.0%) |
| Utilities | 3 (100.0%) | 0 (0.0%) |
| Information | 0 (0.0%) | 0 (0.0%) |
| Finance & Insurance | 2 (12.5%) | 14 (87.5%) |
| Real Estate, Rental & Leasing | 0 (0.0%) | 0 (0.0%) |
| Professional & Scientific | 0 (0.0%) | 0 (0.0%) |
| Enterprise Management | 0 (0.0%) | 0 (0.0%) |
| Administrative & Support | 0 (0.0%) | 0 (0.0%) |
| Educational Services | 4 (4.3%) | 90 (95.7%) |
| Health Care & Social Assistance | 5 (22.7%) | 17 (77.3%) |
| Arts, Entertainment & Recreation | 0 (0.0%) | 0 (0.0%) |
| Accommodation & Food Services | 37 (100.0%) | 0 (0.0%) |
| Public Administration | 27 (58.7%) | 19 (41.3%) |
| Total | 119 (46.0%) | 140 (54.0%) |
Education in Anguilla
School Enrollment in Anguilla
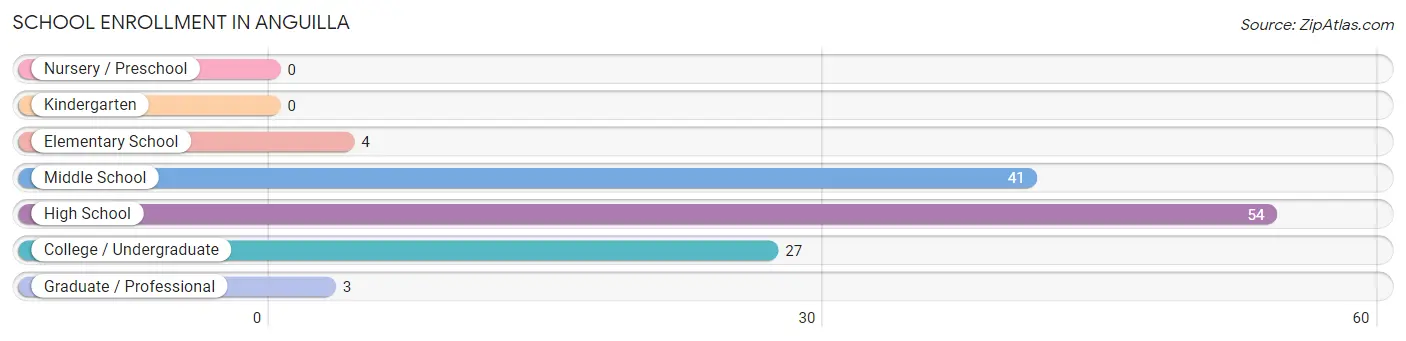
The most common levels of schooling among the 129 students in Anguilla are high school (54 | 41.9%), middle school (41 | 31.8%), and college / undergraduate (27 | 20.9%).
| School Level | # Students | % Students |
| Nursery / Preschool | 0 | 0.0% |
| Kindergarten | 0 | 0.0% |
| Elementary School | 4 | 3.1% |
| Middle School | 41 | 31.8% |
| High School | 54 | 41.9% |
| College / Undergraduate | 27 | 20.9% |
| Graduate / Professional | 3 | 2.3% |
| Total | 129 | 100.0% |
School Enrollment by Age by Funding Source in Anguilla
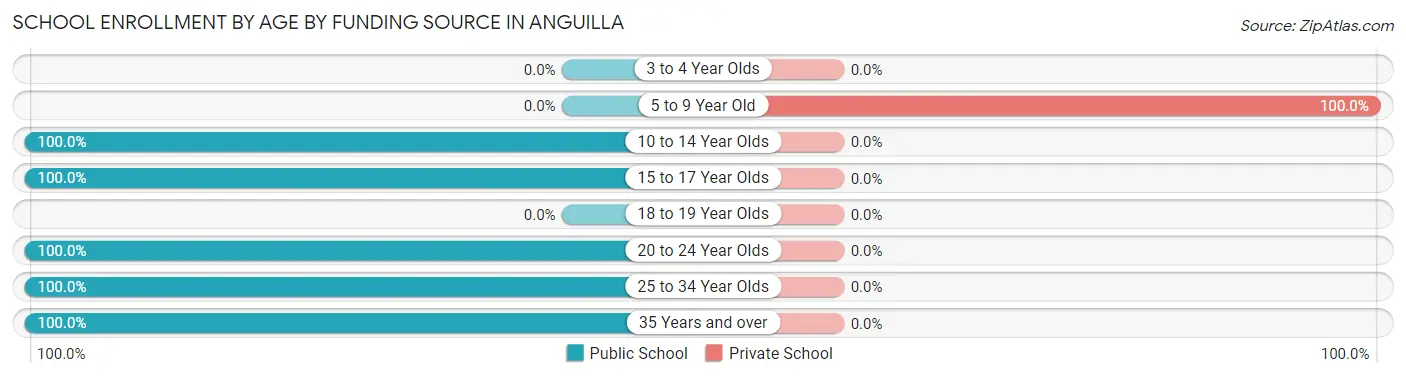
Out of a total of 129 students who are enrolled in schools in Anguilla, 4 (3.1%) attend a private institution, while the remaining 125 (96.9%) are enrolled in public schools. The age group of 5 to 9 year old has the highest likelihood of being enrolled in private schools, with 4 (100.0% in the age bracket) enrolled. Conversely, the age group of 10 to 14 year olds has the lowest likelihood of being enrolled in a private school, with 41 (100.0% in the age bracket) attending a public institution.
| Age Bracket | Public School | Private School |
| 3 to 4 Year Olds | 0 (0.0%) | 0 (0.0%) |
| 5 to 9 Year Old | 0 (0.0%) | 4 (100.0%) |
| 10 to 14 Year Olds | 41 (100.0%) | 0 (0.0%) |
| 15 to 17 Year Olds | 54 (100.0%) | 0 (0.0%) |
| 18 to 19 Year Olds | 0 (0.0%) | 0 (0.0%) |
| 20 to 24 Year Olds | 18 (100.0%) | 0 (0.0%) |
| 25 to 34 Year Olds | 3 (100.0%) | 0 (0.0%) |
| 35 Years and over | 9 (100.0%) | 0 (0.0%) |
| Total | 125 (96.9%) | 4 (3.1%) |
Educational Attainment by Field of Study in Anguilla
Education (13 | 24.1%), business (11 | 20.4%), liberal arts & history (11 | 20.4%), science & technology (6 | 11.1%), and social sciences (5 | 9.3%) are the most common fields of study among 54 individuals in Anguilla who have obtained a bachelor's degree or higher.
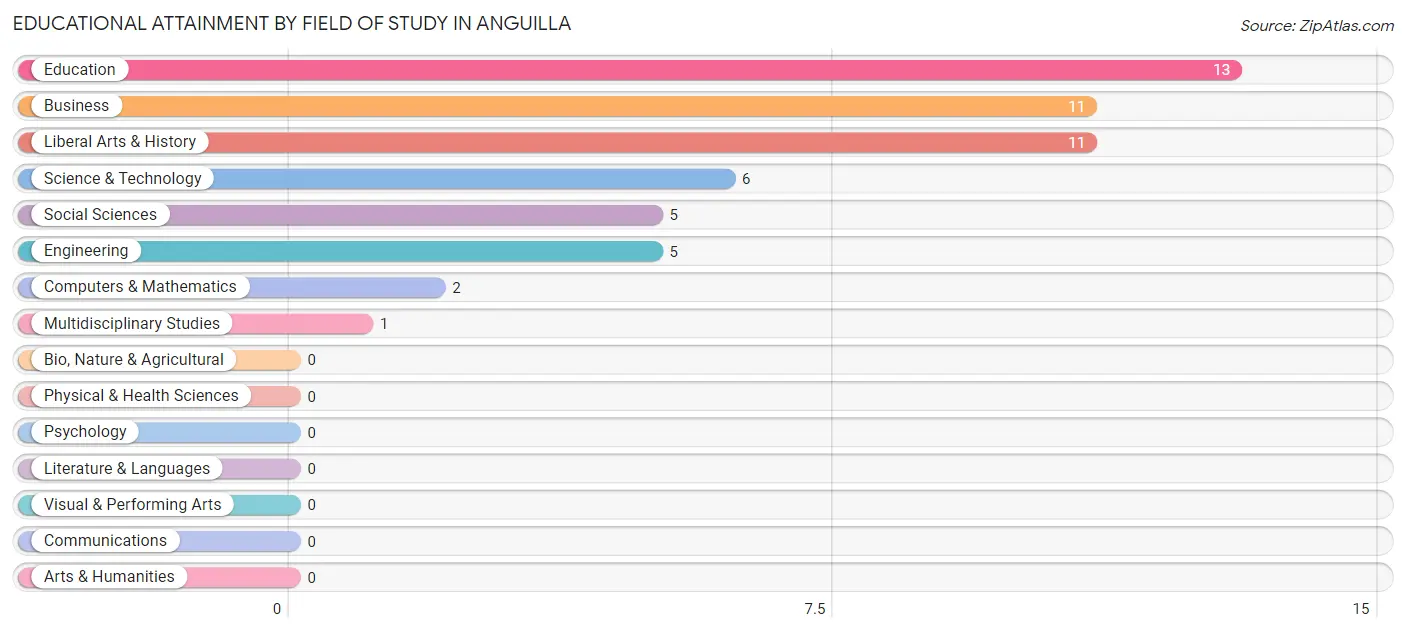
| Field of Study | # Graduates | % Graduates |
| Computers & Mathematics | 2 | 3.7% |
| Bio, Nature & Agricultural | 0 | 0.0% |
| Physical & Health Sciences | 0 | 0.0% |
| Psychology | 0 | 0.0% |
| Social Sciences | 5 | 9.3% |
| Engineering | 5 | 9.3% |
| Multidisciplinary Studies | 1 | 1.8% |
| Science & Technology | 6 | 11.1% |
| Business | 11 | 20.4% |
| Education | 13 | 24.1% |
| Literature & Languages | 0 | 0.0% |
| Liberal Arts & History | 11 | 20.4% |
| Visual & Performing Arts | 0 | 0.0% |
| Communications | 0 | 0.0% |
| Arts & Humanities | 0 | 0.0% |
| Total | 54 | 100.0% |
Transportation & Commute in Anguilla
Vehicle Availability by Sex in Anguilla
The most prevalent vehicle ownership categories in Anguilla are males with 1 vehicle (67, accounting for 56.3%) and females with 1 vehicle (47, making up 51.9%).
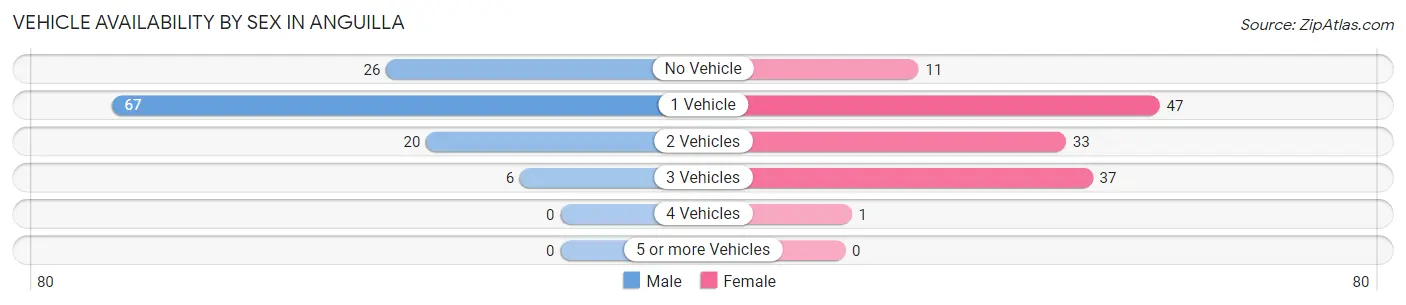
| Vehicles Available | Male | Female |
| No Vehicle | 26 (21.8%) | 11 (8.5%) |
| 1 Vehicle | 67 (56.3%) | 47 (36.4%) |
| 2 Vehicles | 20 (16.8%) | 33 (25.6%) |
| 3 Vehicles | 6 (5.0%) | 37 (28.7%) |
| 4 Vehicles | 0 (0.0%) | 1 (0.8%) |
| 5 or more Vehicles | 0 (0.0%) | 0 (0.0%) |
| Total | 119 (100.0%) | 129 (100.0%) |
Commute Time in Anguilla
The most frequently occuring commute durations in Anguilla are 5 to 9 minutes (71 commuters, 30.9%), 10 to 14 minutes (57 commuters, 24.8%), and 15 to 19 minutes (56 commuters, 24.3%).
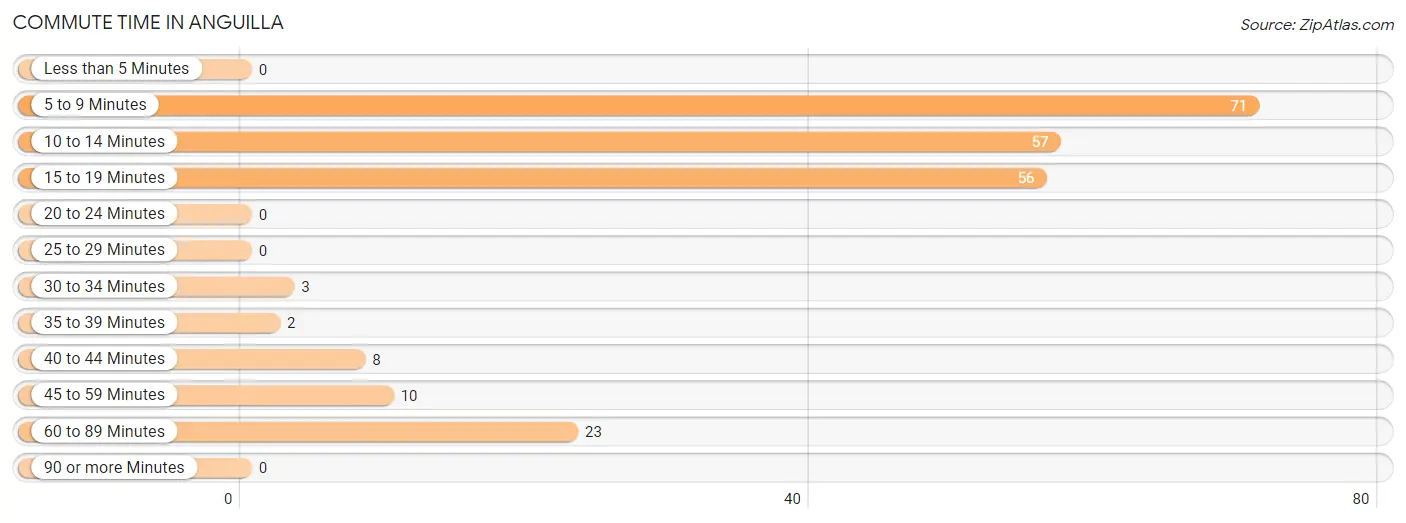
| Commute Time | # Commuters | % Commuters |
| Less than 5 Minutes | 0 | 0.0% |
| 5 to 9 Minutes | 71 | 30.9% |
| 10 to 14 Minutes | 57 | 24.8% |
| 15 to 19 Minutes | 56 | 24.3% |
| 20 to 24 Minutes | 0 | 0.0% |
| 25 to 29 Minutes | 0 | 0.0% |
| 30 to 34 Minutes | 3 | 1.3% |
| 35 to 39 Minutes | 2 | 0.9% |
| 40 to 44 Minutes | 8 | 3.5% |
| 45 to 59 Minutes | 10 | 4.3% |
| 60 to 89 Minutes | 23 | 10.0% |
| 90 or more Minutes | 0 | 0.0% |
Commute Time by Sex in Anguilla
The most common commute times in Anguilla are 15 to 19 minutes (31 commuters, 30.7%) for males and 10 to 14 minutes (43 commuters, 33.3%) for females.
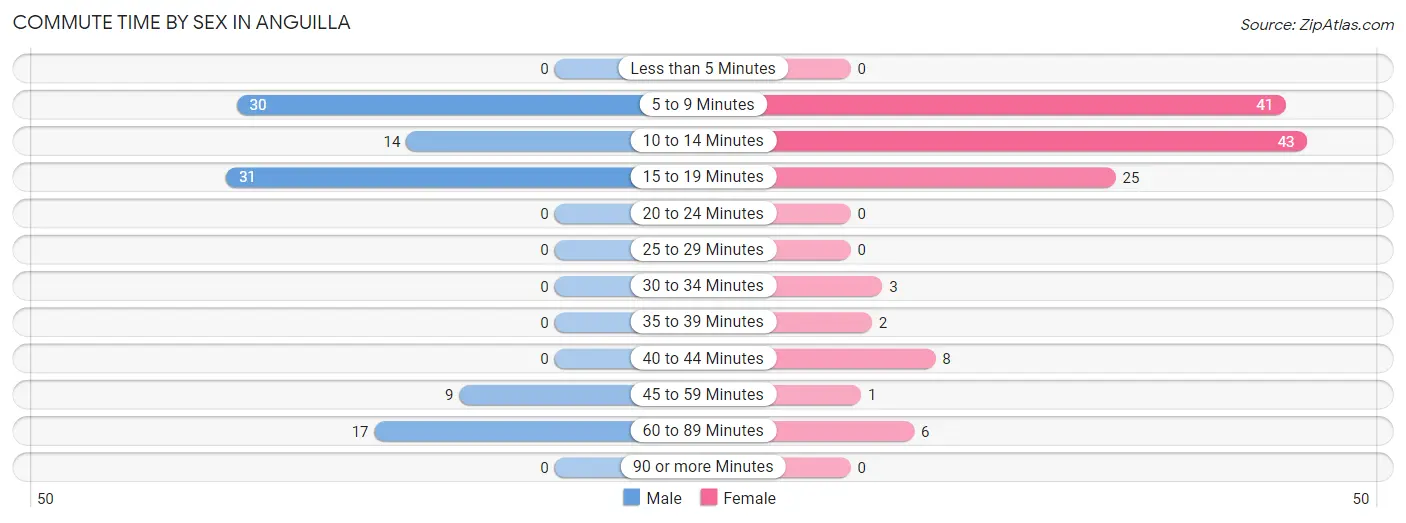
| Commute Time | Male | Female |
| Less than 5 Minutes | 0 (0.0%) | 0 (0.0%) |
| 5 to 9 Minutes | 30 (29.7%) | 41 (31.8%) |
| 10 to 14 Minutes | 14 (13.9%) | 43 (33.3%) |
| 15 to 19 Minutes | 31 (30.7%) | 25 (19.4%) |
| 20 to 24 Minutes | 0 (0.0%) | 0 (0.0%) |
| 25 to 29 Minutes | 0 (0.0%) | 0 (0.0%) |
| 30 to 34 Minutes | 0 (0.0%) | 3 (2.3%) |
| 35 to 39 Minutes | 0 (0.0%) | 2 (1.5%) |
| 40 to 44 Minutes | 0 (0.0%) | 8 (6.2%) |
| 45 to 59 Minutes | 9 (8.9%) | 1 (0.8%) |
| 60 to 89 Minutes | 17 (16.8%) | 6 (4.6%) |
| 90 or more Minutes | 0 (0.0%) | 0 (0.0%) |
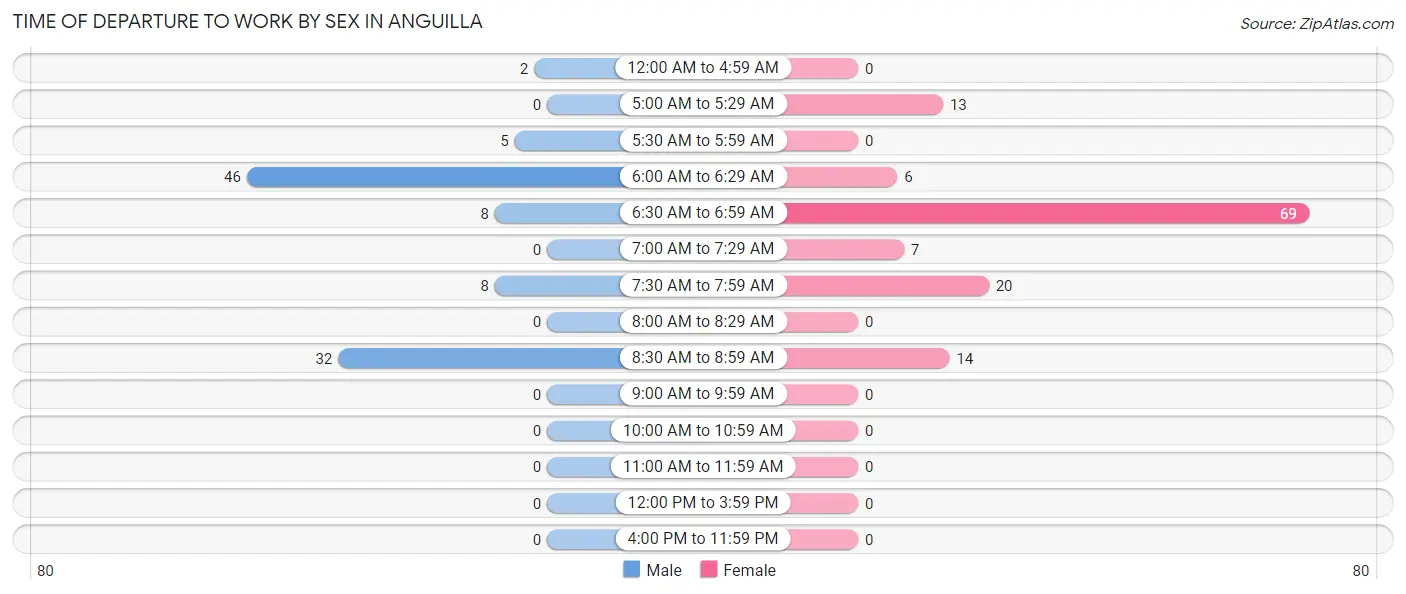
Time of Departure to Work by Sex in Anguilla
The most frequent times of departure to work in Anguilla are 6:00 AM to 6:29 AM (46, 45.5%) for males and 6:30 AM to 6:59 AM (69, 53.5%) for females.
| Time of Departure | Male | Female |
| 12:00 AM to 4:59 AM | 2 (2.0%) | 0 (0.0%) |
| 5:00 AM to 5:29 AM | 0 (0.0%) | 13 (10.1%) |
| 5:30 AM to 5:59 AM | 5 (5.0%) | 0 (0.0%) |
| 6:00 AM to 6:29 AM | 46 (45.5%) | 6 (4.6%) |
| 6:30 AM to 6:59 AM | 8 (7.9%) | 69 (53.5%) |
| 7:00 AM to 7:29 AM | 0 (0.0%) | 7 (5.4%) |
| 7:30 AM to 7:59 AM | 8 (7.9%) | 20 (15.5%) |
| 8:00 AM to 8:29 AM | 0 (0.0%) | 0 (0.0%) |
| 8:30 AM to 8:59 AM | 32 (31.7%) | 14 (10.8%) |
| 9:00 AM to 9:59 AM | 0 (0.0%) | 0 (0.0%) |
| 10:00 AM to 10:59 AM | 0 (0.0%) | 0 (0.0%) |
| 11:00 AM to 11:59 AM | 0 (0.0%) | 0 (0.0%) |
| 12:00 PM to 3:59 PM | 0 (0.0%) | 0 (0.0%) |
| 4:00 PM to 11:59 PM | 0 (0.0%) | 0 (0.0%) |
| Total | 101 (100.0%) | 129 (100.0%) |
Housing Occupancy in Anguilla
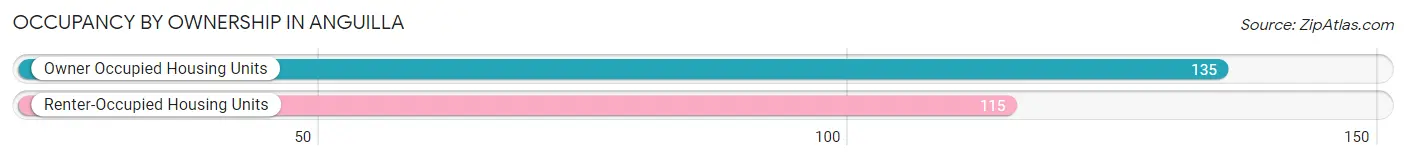
Occupancy by Ownership in Anguilla
Of the total 250 dwellings in Anguilla, owner-occupied units account for 135 (54.0%), while renter-occupied units make up 115 (46.0%).
| Occupancy | # Housing Units | % Housing Units |
| Owner Occupied Housing Units | 135 | 54.0% |
| Renter-Occupied Housing Units | 115 | 46.0% |
| Total Occupied Housing Units | 250 | 100.0% |
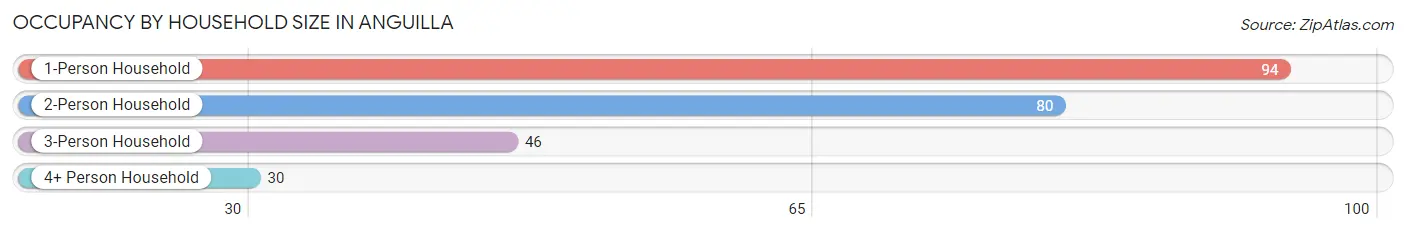
Occupancy by Household Size in Anguilla
| Household Size | # Housing Units | % Housing Units |
| 1-Person Household | 94 | 37.6% |
| 2-Person Household | 80 | 32.0% |
| 3-Person Household | 46 | 18.4% |
| 4+ Person Household | 30 | 12.0% |
| Total Housing Units | 250 | 100.0% |
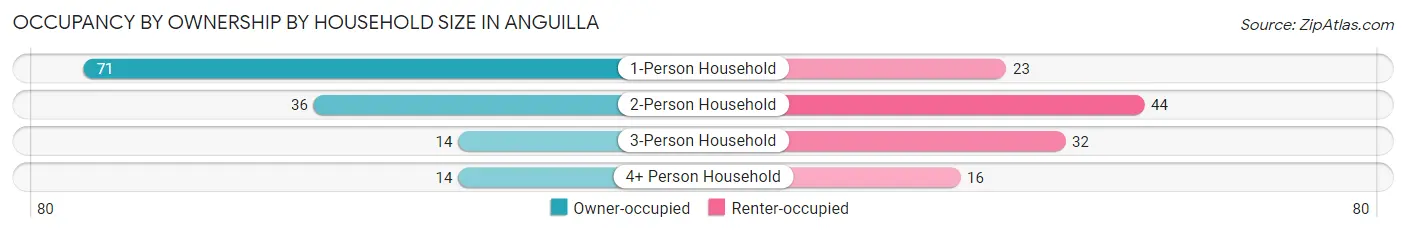
Occupancy by Ownership by Household Size in Anguilla
| Household Size | Owner-occupied | Renter-occupied |
| 1-Person Household | 71 (75.5%) | 23 (24.5%) |
| 2-Person Household | 36 (45.0%) | 44 (55.0%) |
| 3-Person Household | 14 (30.4%) | 32 (69.6%) |
| 4+ Person Household | 14 (46.7%) | 16 (53.3%) |
| Total Housing Units | 135 (54.0%) | 115 (46.0%) |
Occupancy by Educational Attainment in Anguilla
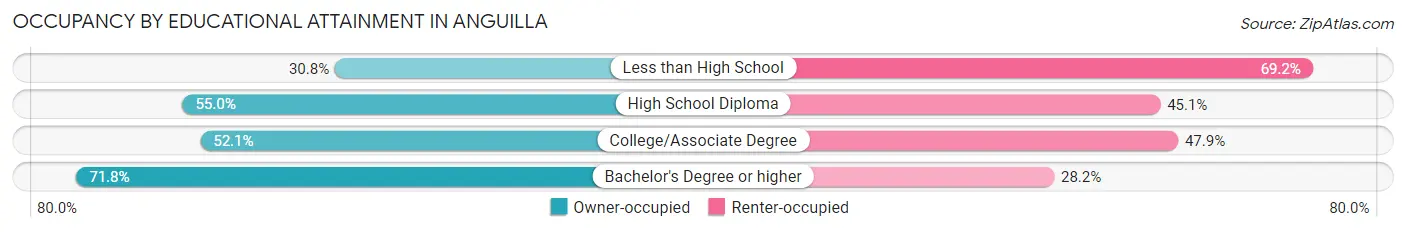
| Household Size | Owner-occupied | Renter-occupied |
| Less than High School | 8 (30.8%) | 18 (69.2%) |
| High School Diploma | 50 (54.9%) | 41 (45.1%) |
| College/Associate Degree | 49 (52.1%) | 45 (47.9%) |
| Bachelor's Degree or higher | 28 (71.8%) | 11 (28.2%) |
Occupancy by Age of Householder in Anguilla
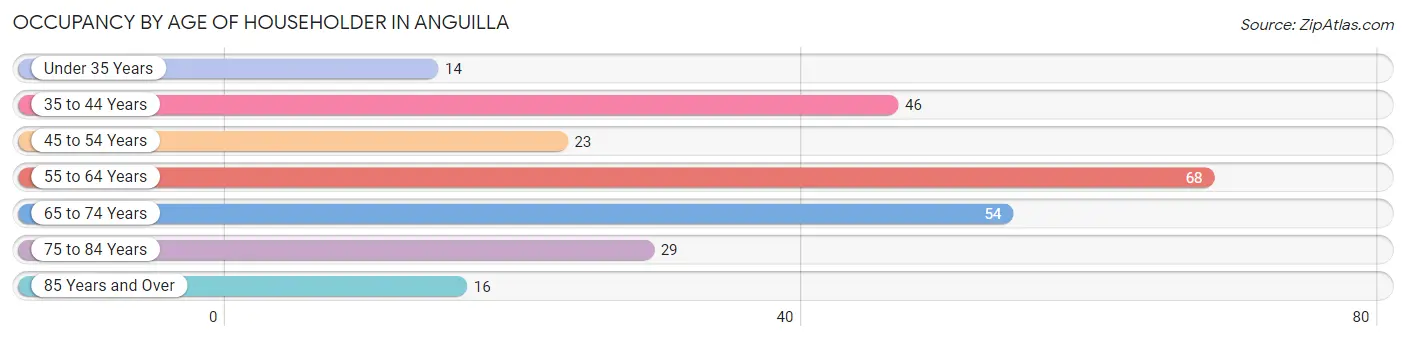
| Age Bracket | # Households | % Households |
| Under 35 Years | 14 | 5.6% |
| 35 to 44 Years | 46 | 18.4% |
| 45 to 54 Years | 23 | 9.2% |
| 55 to 64 Years | 68 | 27.2% |
| 65 to 74 Years | 54 | 21.6% |
| 75 to 84 Years | 29 | 11.6% |
| 85 Years and Over | 16 | 6.4% |
| Total | 250 | 100.0% |
Housing Finances in Anguilla
Median Income by Occupancy in Anguilla
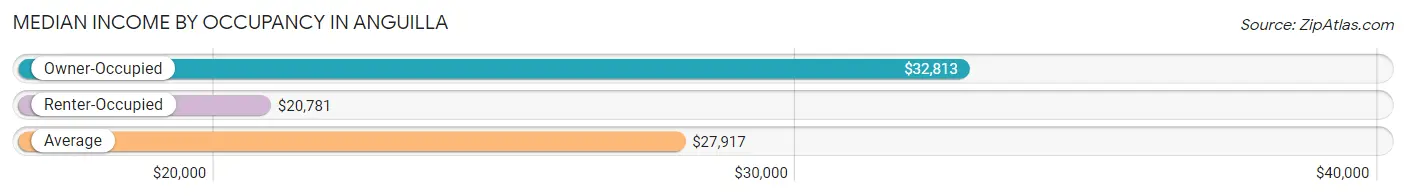
| Occupancy Type | # Households | Median Income |
| Owner-Occupied | 135 (54.0%) | $32,813 |
| Renter-Occupied | 115 (46.0%) | $20,781 |
| Average | 250 (100.0%) | $27,917 |
Occupancy by Householder Income Bracket in Anguilla
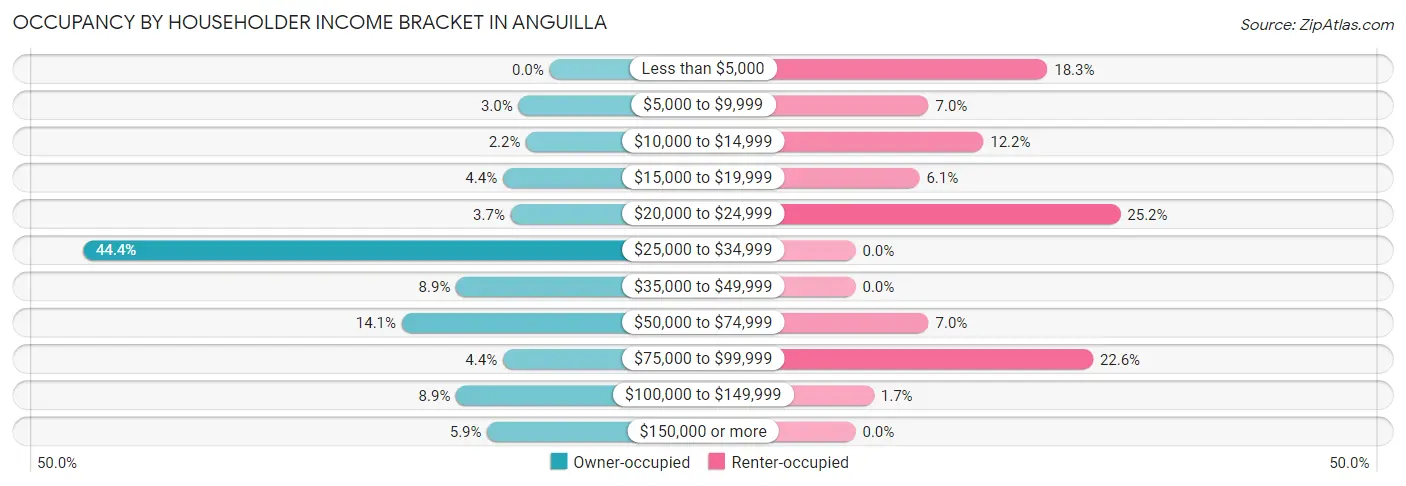
| Income Bracket | Owner-occupied | Renter-occupied |
| Less than $5,000 | 0 (0.0%) | 21 (18.3%) |
| $5,000 to $9,999 | 4 (3.0%) | 8 (7.0%) |
| $10,000 to $14,999 | 3 (2.2%) | 14 (12.2%) |
| $15,000 to $19,999 | 6 (4.4%) | 7 (6.1%) |
| $20,000 to $24,999 | 5 (3.7%) | 29 (25.2%) |
| $25,000 to $34,999 | 60 (44.4%) | 0 (0.0%) |
| $35,000 to $49,999 | 12 (8.9%) | 0 (0.0%) |
| $50,000 to $74,999 | 19 (14.1%) | 8 (7.0%) |
| $75,000 to $99,999 | 6 (4.4%) | 26 (22.6%) |
| $100,000 to $149,999 | 12 (8.9%) | 2 (1.7%) |
| $150,000 or more | 8 (5.9%) | 0 (0.0%) |
| Total | 135 (100.0%) | 115 (100.0%) |
Monthly Housing Cost Tiers in Anguilla
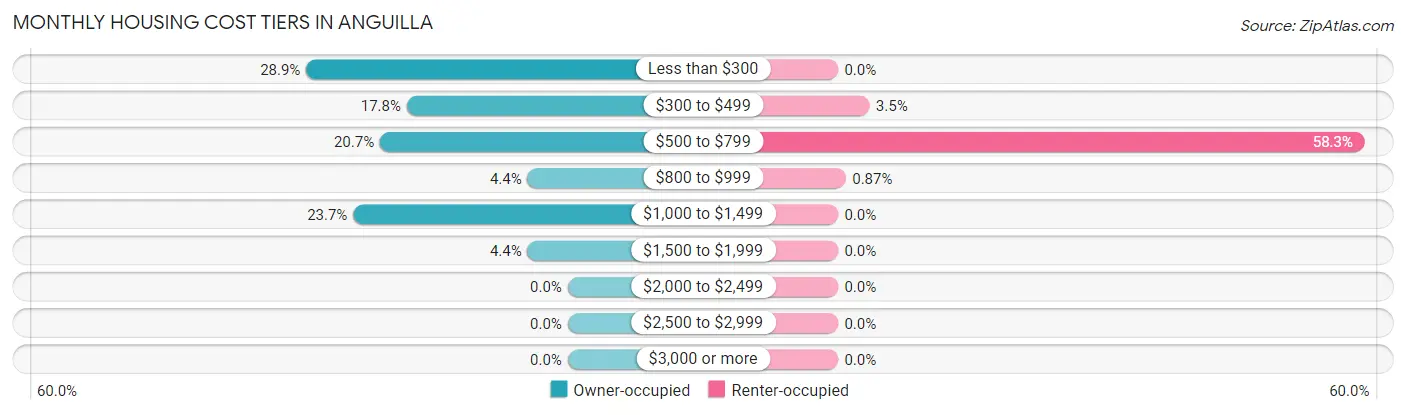
| Monthly Cost | Owner-occupied | Renter-occupied |
| Less than $300 | 39 (28.9%) | 0 (0.0%) |
| $300 to $499 | 24 (17.8%) | 4 (3.5%) |
| $500 to $799 | 28 (20.7%) | 67 (58.3%) |
| $800 to $999 | 6 (4.4%) | 1 (0.9%) |
| $1,000 to $1,499 | 32 (23.7%) | 0 (0.0%) |
| $1,500 to $1,999 | 6 (4.4%) | 0 (0.0%) |
| $2,000 to $2,499 | 0 (0.0%) | 0 (0.0%) |
| $2,500 to $2,999 | 0 (0.0%) | 0 (0.0%) |
| $3,000 or more | 0 (0.0%) | 0 (0.0%) |
| Total | 135 (100.0%) | 115 (100.0%) |
Physical Housing Characteristics in Anguilla
Housing Structures in Anguilla
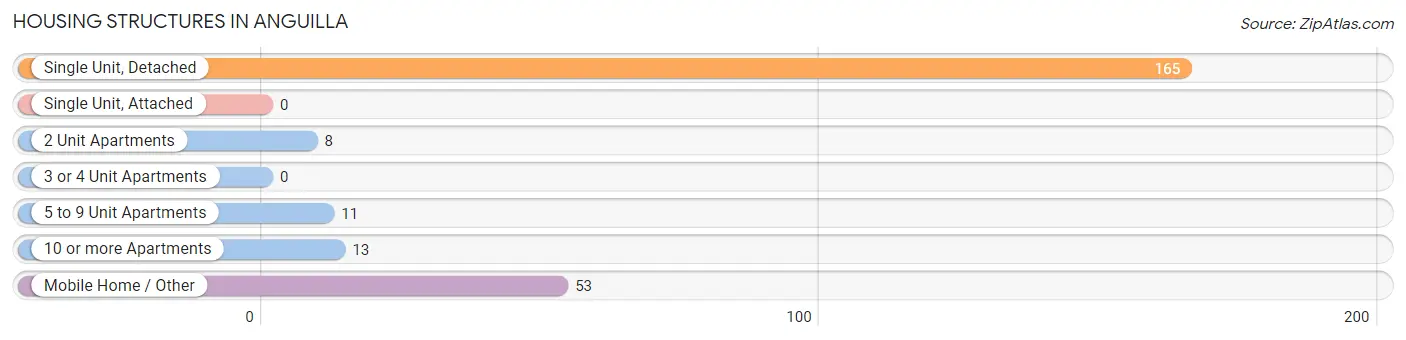
| Structure Type | # Housing Units | % Housing Units |
| Single Unit, Detached | 165 | 66.0% |
| Single Unit, Attached | 0 | 0.0% |
| 2 Unit Apartments | 8 | 3.2% |
| 3 or 4 Unit Apartments | 0 | 0.0% |
| 5 to 9 Unit Apartments | 11 | 4.4% |
| 10 or more Apartments | 13 | 5.2% |
| Mobile Home / Other | 53 | 21.2% |
| Total | 250 | 100.0% |
Housing Structures by Occupancy in Anguilla
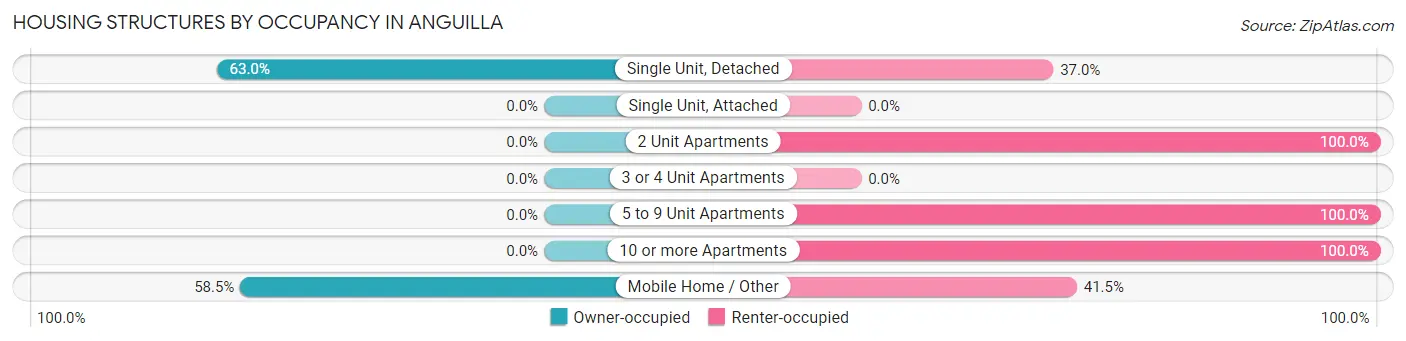
| Structure Type | Owner-occupied | Renter-occupied |
| Single Unit, Detached | 104 (63.0%) | 61 (37.0%) |
| Single Unit, Attached | 0 (0.0%) | 0 (0.0%) |
| 2 Unit Apartments | 0 (0.0%) | 8 (100.0%) |
| 3 or 4 Unit Apartments | 0 (0.0%) | 0 (0.0%) |
| 5 to 9 Unit Apartments | 0 (0.0%) | 11 (100.0%) |
| 10 or more Apartments | 0 (0.0%) | 13 (100.0%) |
| Mobile Home / Other | 31 (58.5%) | 22 (41.5%) |
| Total | 135 (54.0%) | 115 (46.0%) |
Housing Structures by Number of Rooms in Anguilla
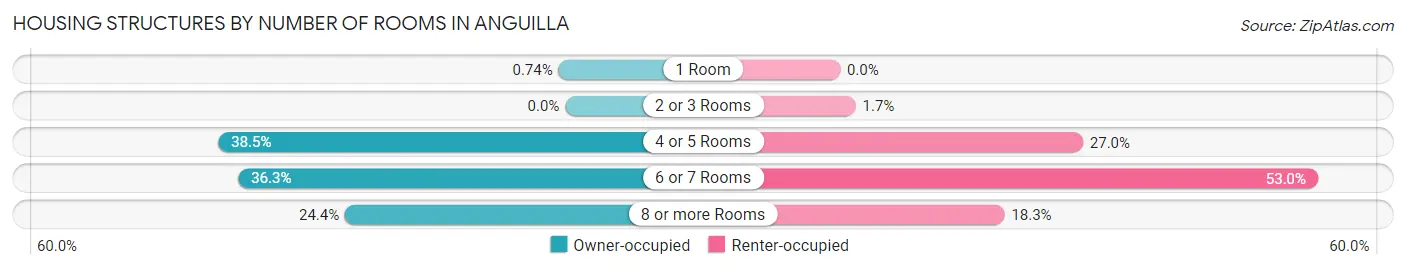
| Number of Rooms | Owner-occupied | Renter-occupied |
| 1 Room | 1 (0.7%) | 0 (0.0%) |
| 2 or 3 Rooms | 0 (0.0%) | 2 (1.7%) |
| 4 or 5 Rooms | 52 (38.5%) | 31 (27.0%) |
| 6 or 7 Rooms | 49 (36.3%) | 61 (53.0%) |
| 8 or more Rooms | 33 (24.4%) | 21 (18.3%) |
| Total | 135 (100.0%) | 115 (100.0%) |
Housing Structure by Heating Type in Anguilla
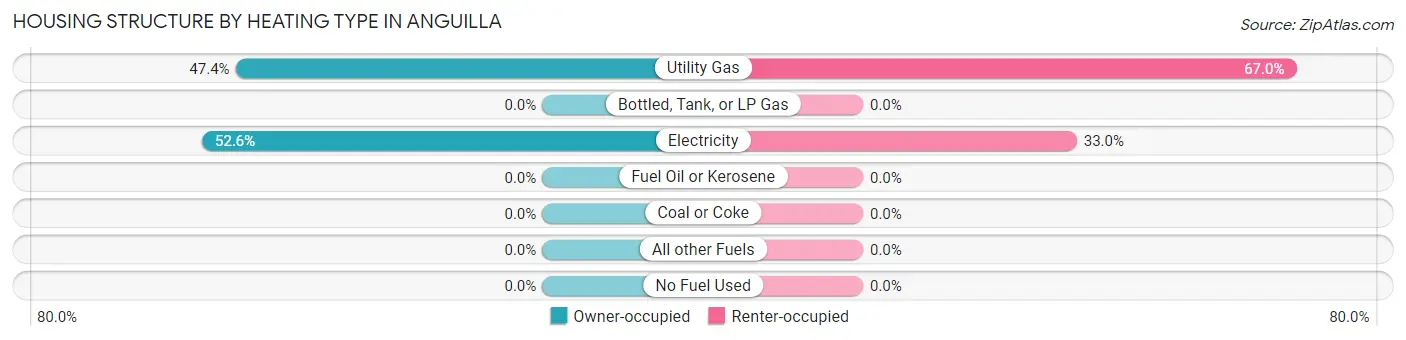
| Heating Type | Owner-occupied | Renter-occupied |
| Utility Gas | 64 (47.4%) | 77 (67.0%) |
| Bottled, Tank, or LP Gas | 0 (0.0%) | 0 (0.0%) |
| Electricity | 71 (52.6%) | 38 (33.0%) |
| Fuel Oil or Kerosene | 0 (0.0%) | 0 (0.0%) |
| Coal or Coke | 0 (0.0%) | 0 (0.0%) |
| All other Fuels | 0 (0.0%) | 0 (0.0%) |
| No Fuel Used | 0 (0.0%) | 0 (0.0%) |
| Total | 135 (100.0%) | 115 (100.0%) |
Household Vehicle Usage in Anguilla
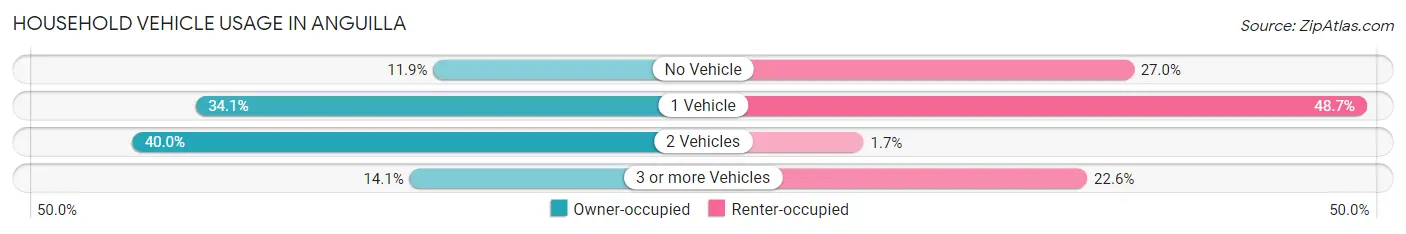
| Vehicles per Household | Owner-occupied | Renter-occupied |
| No Vehicle | 16 (11.8%) | 31 (27.0%) |
| 1 Vehicle | 46 (34.1%) | 56 (48.7%) |
| 2 Vehicles | 54 (40.0%) | 2 (1.7%) |
| 3 or more Vehicles | 19 (14.1%) | 26 (22.6%) |
| Total | 135 (100.0%) | 115 (100.0%) |
Real Estate & Mortgages in Anguilla
Real Estate and Mortgage Overview in Anguilla
| Characteristic | Without Mortgage | With Mortgage |
| Housing Units | 80 | 55 |
| Median Property Value | $46,000 | $108,000 |
| Median Household Income | $29,250 | $5 |
| Monthly Housing Costs | $325 | $0 |
| Real Estate Taxes | $199 | $10 |
Property Value by Mortgage Status in Anguilla
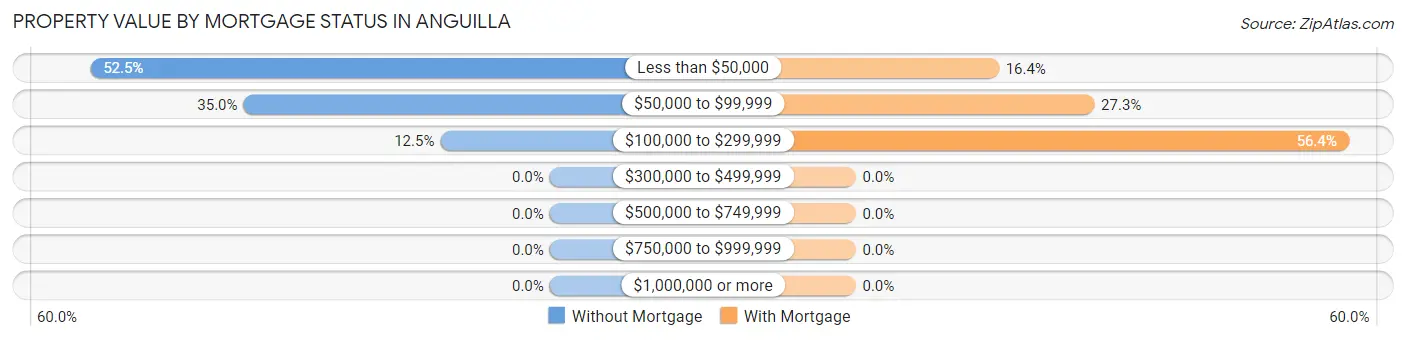
| Property Value | Without Mortgage | With Mortgage |
| Less than $50,000 | 42 (52.5%) | 9 (16.4%) |
| $50,000 to $99,999 | 28 (35.0%) | 15 (27.3%) |
| $100,000 to $299,999 | 10 (12.5%) | 31 (56.4%) |
| $300,000 to $499,999 | 0 (0.0%) | 0 (0.0%) |
| $500,000 to $749,999 | 0 (0.0%) | 0 (0.0%) |
| $750,000 to $999,999 | 0 (0.0%) | 0 (0.0%) |
| $1,000,000 or more | 0 (0.0%) | 0 (0.0%) |
| Total | 80 (100.0%) | 55 (100.0%) |
Household Income by Mortgage Status in Anguilla
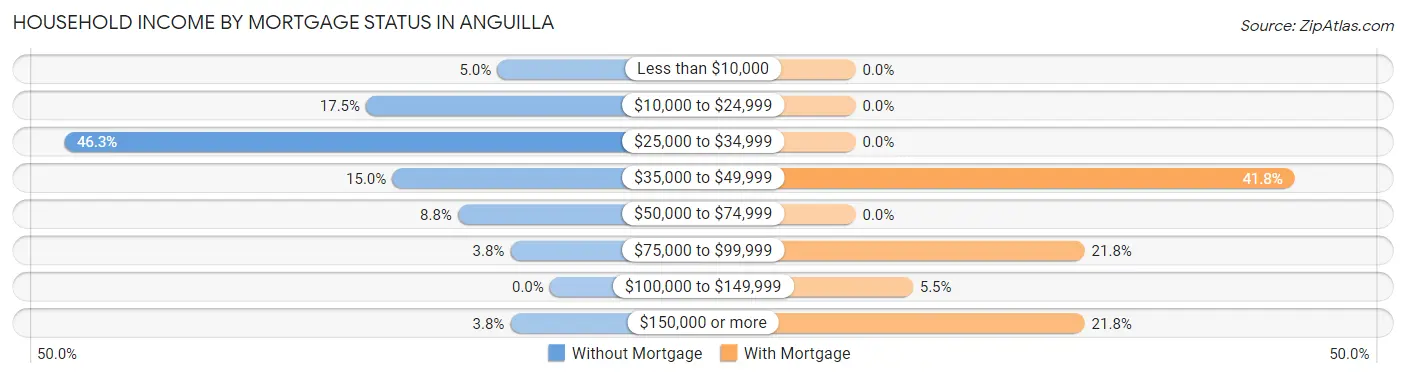
| Household Income | Without Mortgage | With Mortgage |
| Less than $10,000 | 4 (5.0%) | 0 (0.0%) |
| $10,000 to $24,999 | 14 (17.5%) | 0 (0.0%) |
| $25,000 to $34,999 | 37 (46.3%) | 0 (0.0%) |
| $35,000 to $49,999 | 12 (15.0%) | 23 (41.8%) |
| $50,000 to $74,999 | 7 (8.7%) | 0 (0.0%) |
| $75,000 to $99,999 | 3 (3.7%) | 12 (21.8%) |
| $100,000 to $149,999 | 0 (0.0%) | 3 (5.4%) |
| $150,000 or more | 3 (3.7%) | 12 (21.8%) |
| Total | 80 (100.0%) | 55 (100.0%) |
Property Value to Household Income Ratio in Anguilla
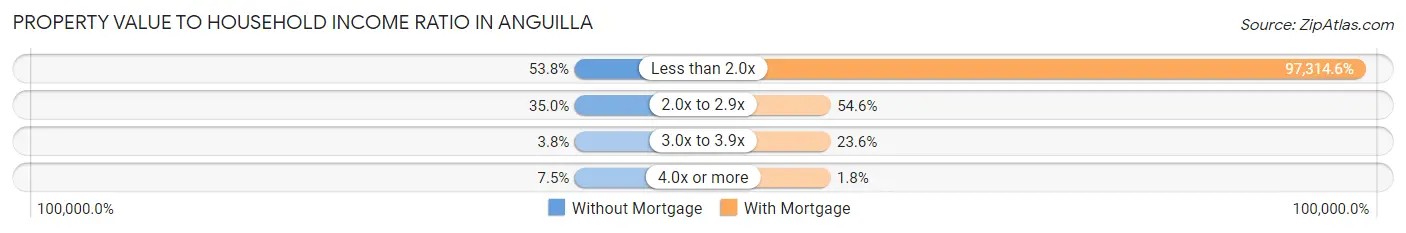
| Value-to-Income Ratio | Without Mortgage | With Mortgage |
| Less than 2.0x | 43 (53.7%) | 53,523 (97,314.5%) |
| 2.0x to 2.9x | 28 (35.0%) | 30 (54.5%) |
| 3.0x to 3.9x | 3 (3.7%) | 13 (23.6%) |
| 4.0x or more | 6 (7.5%) | 1 (1.8%) |
| Total | 80 (100.0%) | 55 (100.0%) |
Real Estate Taxes by Mortgage Status in Anguilla
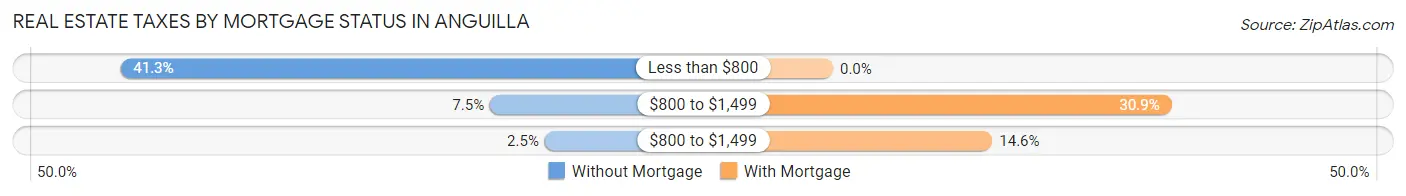
| Property Taxes | Without Mortgage | With Mortgage |
| Less than $800 | 33 (41.2%) | 0 (0.0%) |
| $800 to $1,499 | 6 (7.5%) | 17 (30.9%) |
| $800 to $1,499 | 2 (2.5%) | 8 (14.5%) |
| Total | 80 (100.0%) | 55 (100.0%) |
Health & Disability in Anguilla
Health Insurance Coverage by Age in Anguilla
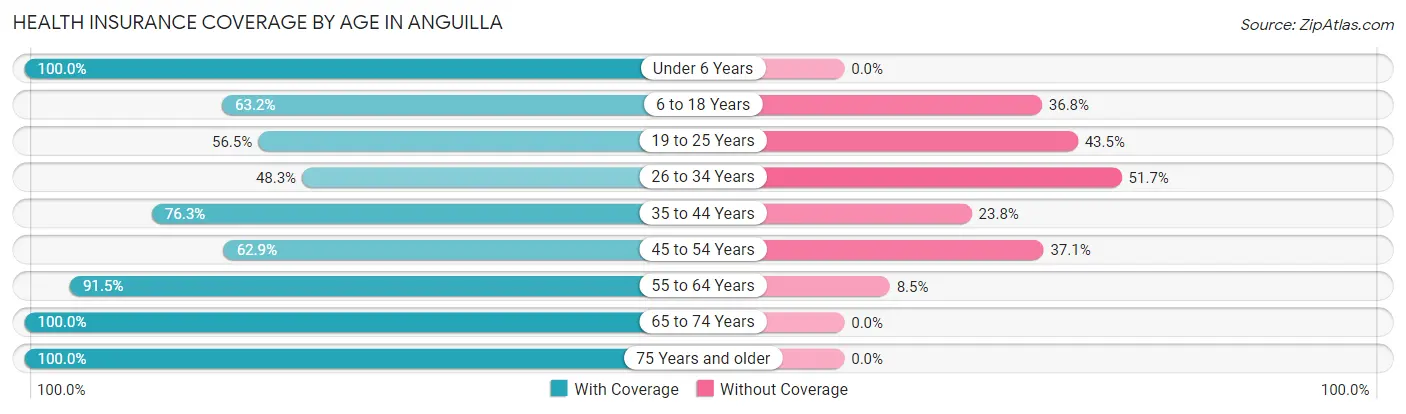
| Age Bracket | With Coverage | Without Coverage |
| Under 6 Years | 18 (100.0%) | 0 (0.0%) |
| 6 to 18 Years | 84 (63.2%) | 49 (36.8%) |
| 19 to 25 Years | 48 (56.5%) | 37 (43.5%) |
| 26 to 34 Years | 14 (48.3%) | 15 (51.7%) |
| 35 to 44 Years | 61 (76.2%) | 19 (23.7%) |
| 45 to 54 Years | 22 (62.9%) | 13 (37.1%) |
| 55 to 64 Years | 108 (91.5%) | 10 (8.5%) |
| 65 to 74 Years | 66 (100.0%) | 0 (0.0%) |
| 75 Years and older | 49 (100.0%) | 0 (0.0%) |
| Total | 470 (76.7%) | 143 (23.3%) |
Health Insurance Coverage by Citizenship Status in Anguilla
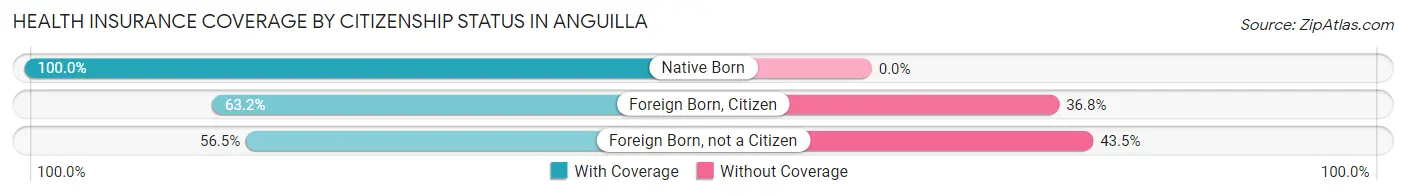
| Citizenship Status | With Coverage | Without Coverage |
| Native Born | 18 (100.0%) | 0 (0.0%) |
| Foreign Born, Citizen | 84 (63.2%) | 49 (36.8%) |
| Foreign Born, not a Citizen | 48 (56.5%) | 37 (43.5%) |
Health Insurance Coverage by Household Income in Anguilla
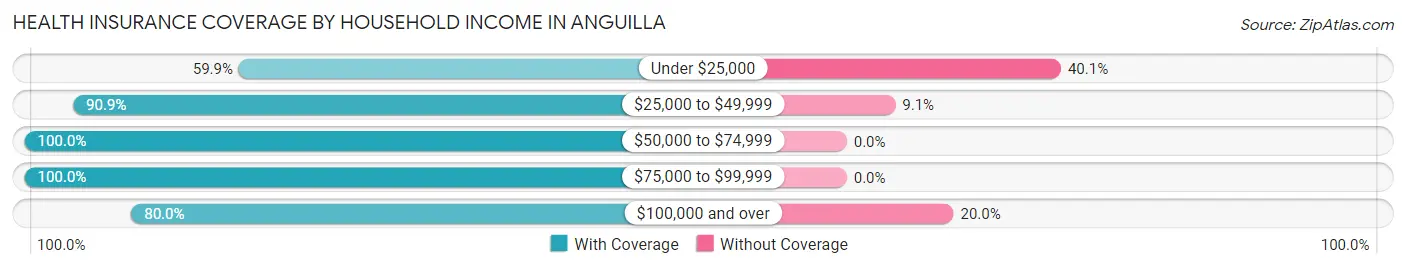
| Household Income | With Coverage | Without Coverage |
| Under $25,000 | 182 (59.9%) | 122 (40.1%) |
| $25,000 to $49,999 | 100 (90.9%) | 10 (9.1%) |
| $50,000 to $74,999 | 87 (100.0%) | 0 (0.0%) |
| $75,000 to $99,999 | 57 (100.0%) | 0 (0.0%) |
| $100,000 and over | 44 (80.0%) | 11 (20.0%) |
Public vs Private Health Insurance Coverage by Age in Anguilla
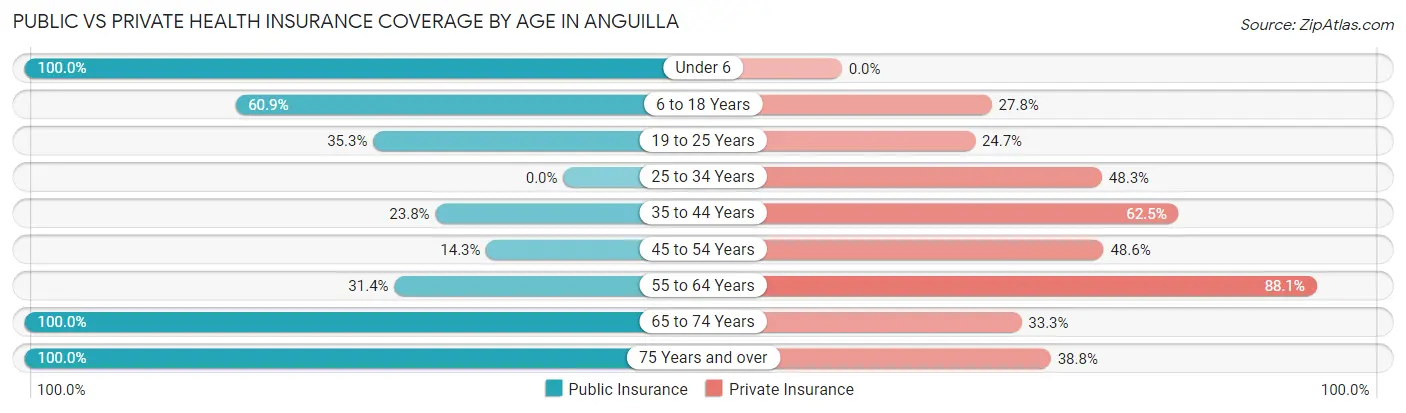
| Age Bracket | Public Insurance | Private Insurance |
| Under 6 | 18 (100.0%) | 0 (0.0%) |
| 6 to 18 Years | 81 (60.9%) | 37 (27.8%) |
| 19 to 25 Years | 30 (35.3%) | 21 (24.7%) |
| 25 to 34 Years | 0 (0.0%) | 14 (48.3%) |
| 35 to 44 Years | 19 (23.7%) | 50 (62.5%) |
| 45 to 54 Years | 5 (14.3%) | 17 (48.6%) |
| 55 to 64 Years | 37 (31.4%) | 104 (88.1%) |
| 65 to 74 Years | 66 (100.0%) | 22 (33.3%) |
| 75 Years and over | 49 (100.0%) | 19 (38.8%) |
| Total | 305 (49.8%) | 284 (46.3%) |
Disability Status by Sex by Age in Anguilla
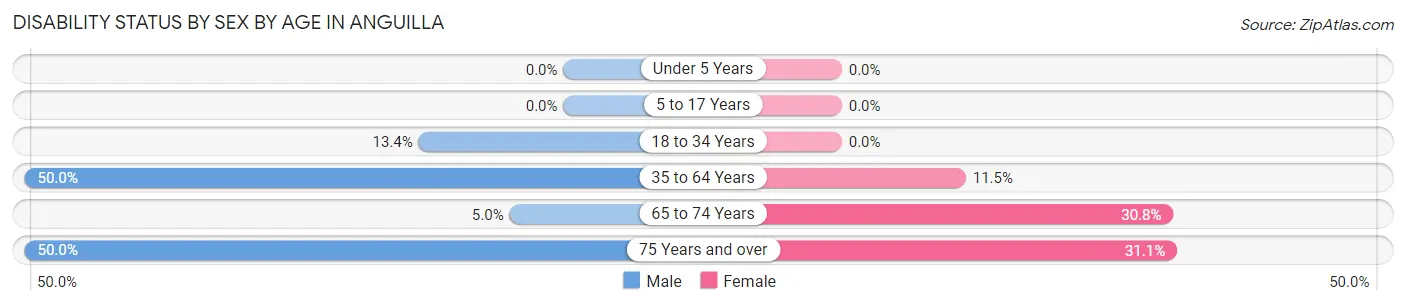
| Age Bracket | Male | Female |
| Under 5 Years | 0 (0.0%) | 0 (0.0%) |
| 5 to 17 Years | 0 (0.0%) | 0 (0.0%) |
| 18 to 34 Years | 18 (13.4%) | 0 (0.0%) |
| 35 to 64 Years | 47 (50.0%) | 16 (11.5%) |
| 65 to 74 Years | 2 (5.0%) | 8 (30.8%) |
| 75 Years and over | 2 (50.0%) | 14 (31.1%) |
Disability Class by Sex by Age in Anguilla
Disability Class: Hearing Difficulty
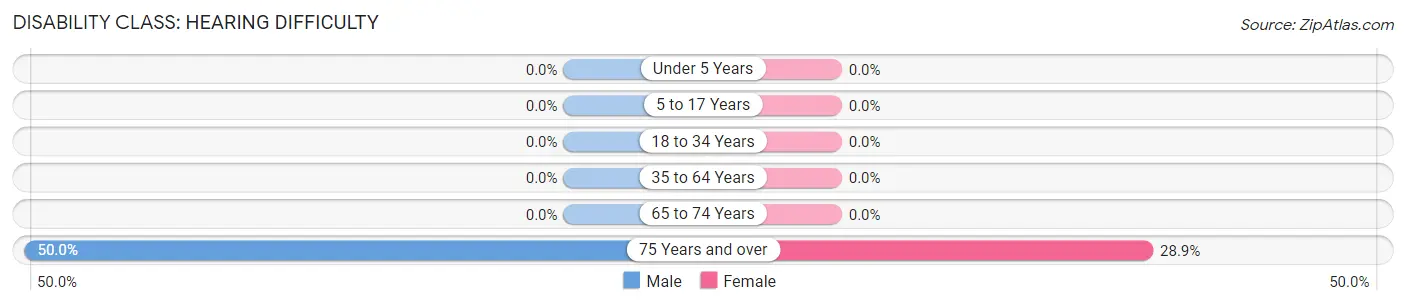
| Age Bracket | Male | Female |
| Under 5 Years | 0 (0.0%) | 0 (0.0%) |
| 5 to 17 Years | 0 (0.0%) | 0 (0.0%) |
| 18 to 34 Years | 0 (0.0%) | 0 (0.0%) |
| 35 to 64 Years | 0 (0.0%) | 0 (0.0%) |
| 65 to 74 Years | 0 (0.0%) | 0 (0.0%) |
| 75 Years and over | 2 (50.0%) | 13 (28.9%) |
Disability Class: Vision Difficulty
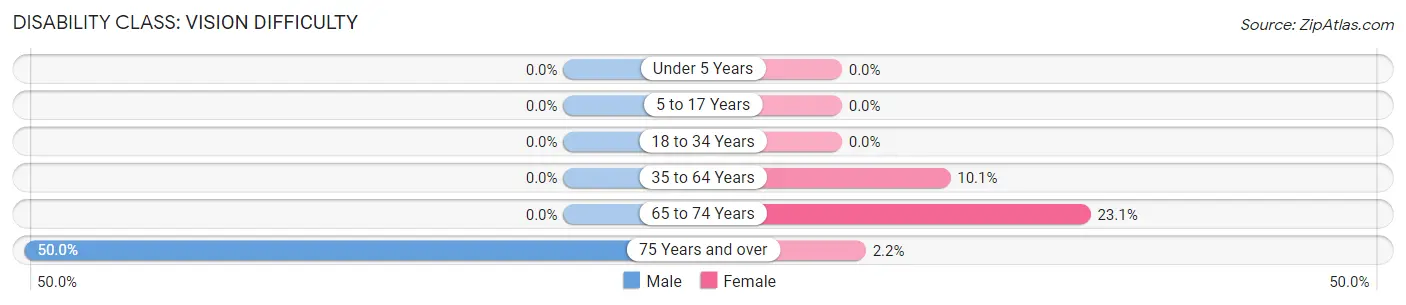
| Age Bracket | Male | Female |
| Under 5 Years | 0 (0.0%) | 0 (0.0%) |
| 5 to 17 Years | 0 (0.0%) | 0 (0.0%) |
| 18 to 34 Years | 0 (0.0%) | 0 (0.0%) |
| 35 to 64 Years | 0 (0.0%) | 14 (10.1%) |
| 65 to 74 Years | 0 (0.0%) | 6 (23.1%) |
| 75 Years and over | 2 (50.0%) | 1 (2.2%) |
Disability Class: Cognitive Difficulty
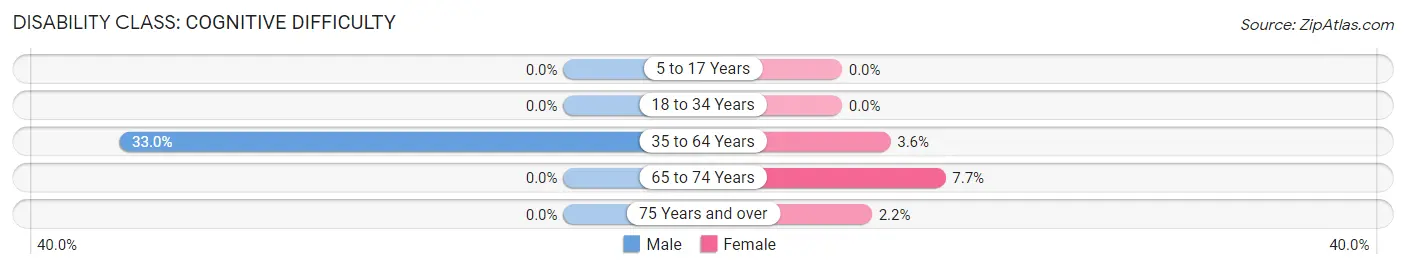
| Age Bracket | Male | Female |
| 5 to 17 Years | 0 (0.0%) | 0 (0.0%) |
| 18 to 34 Years | 0 (0.0%) | 0 (0.0%) |
| 35 to 64 Years | 31 (33.0%) | 5 (3.6%) |
| 65 to 74 Years | 0 (0.0%) | 2 (7.7%) |
| 75 Years and over | 0 (0.0%) | 1 (2.2%) |
Disability Class: Ambulatory Difficulty
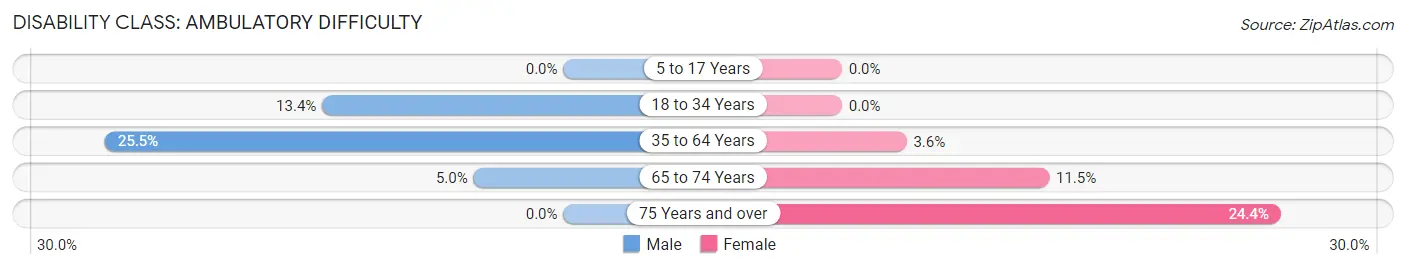
| Age Bracket | Male | Female |
| 5 to 17 Years | 0 (0.0%) | 0 (0.0%) |
| 18 to 34 Years | 18 (13.4%) | 0 (0.0%) |
| 35 to 64 Years | 24 (25.5%) | 5 (3.6%) |
| 65 to 74 Years | 2 (5.0%) | 3 (11.5%) |
| 75 Years and over | 0 (0.0%) | 11 (24.4%) |
Disability Class: Self-Care Difficulty
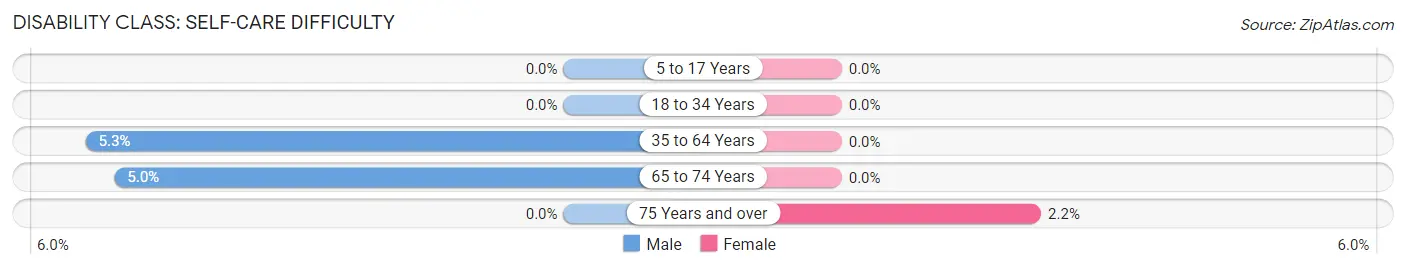
| Age Bracket | Male | Female |
| 5 to 17 Years | 0 (0.0%) | 0 (0.0%) |
| 18 to 34 Years | 0 (0.0%) | 0 (0.0%) |
| 35 to 64 Years | 5 (5.3%) | 0 (0.0%) |
| 65 to 74 Years | 2 (5.0%) | 0 (0.0%) |
| 75 Years and over | 0 (0.0%) | 1 (2.2%) |
Technology Access in Anguilla
Computing Device Access in Anguilla
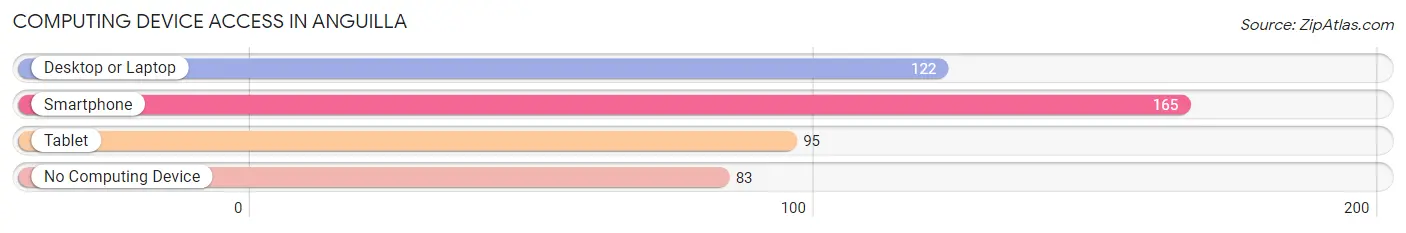
| Device Type | # Households | % Households |
| Desktop or Laptop | 122 | 48.8% |
| Smartphone | 165 | 66.0% |
| Tablet | 95 | 38.0% |
| No Computing Device | 83 | 33.2% |
| Total | 250 | 100.0% |
Internet Access in Anguilla
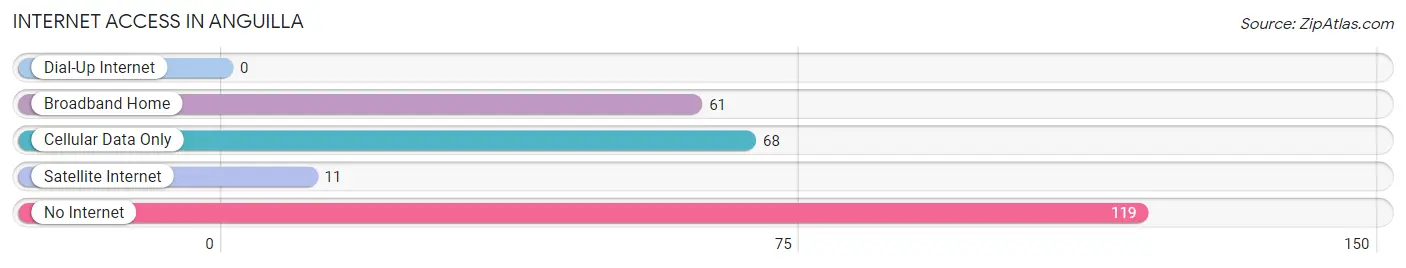
| Internet Type | # Households | % Households |
| Dial-Up Internet | 0 | 0.0% |
| Broadband Home | 61 | 24.4% |
| Cellular Data Only | 68 | 27.2% |
| Satellite Internet | 11 | 4.4% |
| No Internet | 119 | 47.6% |
| Total | 250 | 100.0% |
Anguilla Summary
Anguilla is a British Overseas Territory located in the Caribbean Sea. It is the most northerly of the Leeward Islands in the Lesser Antilles, lying east of Puerto Rico and the Virgin Islands and directly north of Saint Martin. The island is roughly 16 miles long and 3 miles wide, with a total land area of 35 square miles. The capital is The Valley, and the population was estimated to be 13,477 in 2019.
Geography
Anguilla is a flat, low-lying island with a coral and limestone base. It is surrounded by coral reefs and has several small islets and cays. The highest point on the island is Crocus Hill, which rises to 213 feet. The island is mostly covered in scrubland and is home to a variety of wildlife, including iguanas, lizards, and birds.
The climate is tropical, with temperatures ranging from the mid-70s to the mid-80s Fahrenheit year-round. The rainy season runs from May to October, with the heaviest rainfall occurring in September and October.
History
Anguilla was first settled by Amerindian tribes from South America around 4,000 years ago. The island was later colonized by the English in 1650, and it became a British colony in 1825.
Anguilla was part of the British West Indies until 1967, when it joined the short-lived West Indies Federation. After the federation dissolved, Anguilla declared its independence from the United Kingdom in 1967. This led to a brief period of armed conflict between the British and Anguillan forces, which ended in 1969 when the British regained control of the island.
In 1980, Anguilla became a British Dependent Territory, and in 1983 it was granted internal self-government. In 2002, Anguilla was granted full autonomy, and it is now a self-governing British Overseas Territory.
Economy
Anguilla’s economy is largely based on tourism, which accounts for more than half of the island’s GDP. The island is also known for its offshore banking and financial services, which account for a significant portion of its GDP. Other important sectors of the economy include fishing, construction, and manufacturing.
The currency of Anguilla is the East Caribbean dollar, which is pegged to the US dollar. The island has a low unemployment rate and a relatively high standard of living.
Demographics
The population of Anguilla is estimated to be 13,477, with a population density of 382 people per square mile. The majority of the population is of African descent, with smaller numbers of people of European, Asian, and Amerindian descent. The official language is English, and the majority of the population is Christian.
Anguilla has a high literacy rate, with nearly 100% of the population over the age of 15 being able to read and write. The life expectancy is 79 years for men and 83 years for women.
Conclusion
Anguilla is a British Overseas Territory located in the Caribbean Sea. It is a flat, low-lying island with a coral and limestone base, and it is surrounded by coral reefs. The island has a tropical climate and is home to a variety of wildlife. Anguilla was first settled by Amerindian tribes from South America around 4,000 years ago, and it was later colonized by the English in 1650. The economy is largely based on tourism, offshore banking, and financial services, and the currency is the East Caribbean dollar. The population is estimated to be 13,477, with a majority of the population being of African descent. The official language is English, and the majority of the population is Christian.
Common Questions
What is Per Capita Income in Anguilla?
Per Capita income in Anguilla is $18,789.
What is the Median Household income in Anguilla?
Median Household Income in Anguilla is $27,917.
What is Income or Wage Gap in Anguilla?
Income or Wage Gap in Anguilla is 45.9%.
Women in Anguilla earn 54.1 cents for every dollar earned by a man.
What is Family Income Deficit in Anguilla?
Family Income Deficit in Anguilla is $10,559.
Families that are below poverty line in Anguilla earn $10,559 less on average than the poverty threshold level.
What is Inequality or Gini Index in Anguilla?
Inequality or Gini Index in Anguilla is 0.47.
What is the Total Population of Anguilla?
Total Population of Anguilla is 613.
What is the Total Male Population of Anguilla?
Total Male Population of Anguilla is 346.
What is the Total Female Population of Anguilla?
Total Female Population of Anguilla is 267.
What is the Ratio of Males per 100 Females in Anguilla?
There are 129.59 Males per 100 Females in Anguilla.
What is the Ratio of Females per 100 Males in Anguilla?
There are 77.17 Females per 100 Males in Anguilla.
What is the Median Population Age in Anguilla?
Median Population Age in Anguilla is 40.4 Years.
What is the Average Family Size in Anguilla
Average Family Size in Anguilla is 3.3 People.
What is the Average Household Size in Anguilla
Average Household Size in Anguilla is 2.5 People.
How Large is the Labor Force in Anguilla?
There are 272 People in the Labor Forcein in Anguilla.
What is the Percentage of People in the Labor Force in Anguilla?
53.6% of People are in the Labor Force in Anguilla.
What is the Unemployment Rate in Anguilla?
Unemployment Rate in Anguilla is 4.8%.