Ruleville, MS Map & Demographics
Ruleville Map
Ruleville Overview
$20,022
PER CAPITA INCOME
$44,519
AVG FAMILY INCOME
$41,765
AVG HOUSEHOLD INCOME
0.6%
WAGE / INCOME GAP [ % ]
99.4¢/ $1
WAGE / INCOME GAP [ $ ]
0.55
INEQUALITY / GINI INDEX
2,633
TOTAL POPULATION
1,278
MALE POPULATION
1,355
FEMALE POPULATION
94.32
MALES / 100 FEMALES
106.03
FEMALES / 100 MALES
31.3
MEDIAN AGE
4.1
AVG FAMILY SIZE
3.2
AVG HOUSEHOLD SIZE
1,244
LABOR FORCE [ PEOPLE ]
57.9%
PERCENT IN LABOR FORCE
18.1%
UNEMPLOYMENT RATE
Ruleville Zip Codes
Ruleville Area Codes
Income in Ruleville
Income Overview in Ruleville
Per Capita Income in Ruleville is $20,022, while median incomes of families and households are $44,519 and $41,765 respectively.
| Characteristic | Number | Measure |
| Per Capita Income | 2,633 | $20,022 |
| Median Family Income | 489 | $44,519 |
| Mean Family Income | 489 | $58,173 |
| Median Household Income | 736 | $41,765 |
| Mean Household Income | 736 | $62,150 |
| Income Deficit | 489 | $0 |
| Wage / Income Gap (%) | 2,633 | 0.60% |
| Wage / Income Gap ($) | 2,633 | 99.40¢ per $1 |
| Gini / Inequality Index | 2,633 | 0.55 |
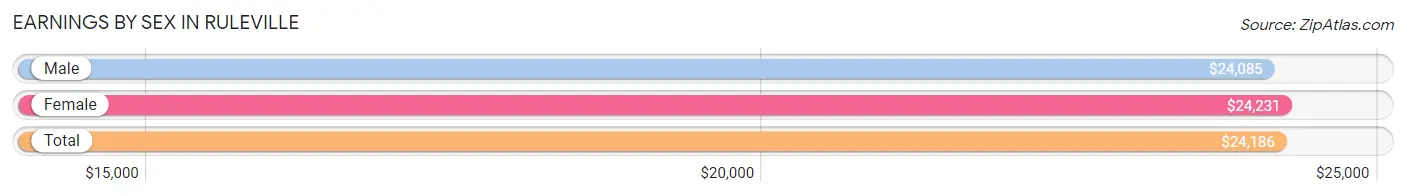
Earnings by Sex in Ruleville
Average Earnings in Ruleville are $24,186, $24,085 for men and $24,231 for women, a difference of 0.6%.
| Sex | Number | Average Earnings |
| Male | 606 (50.3%) | $24,085 |
| Female | 598 (49.7%) | $24,231 |
| Total | 1,204 (100.0%) | $24,186 |
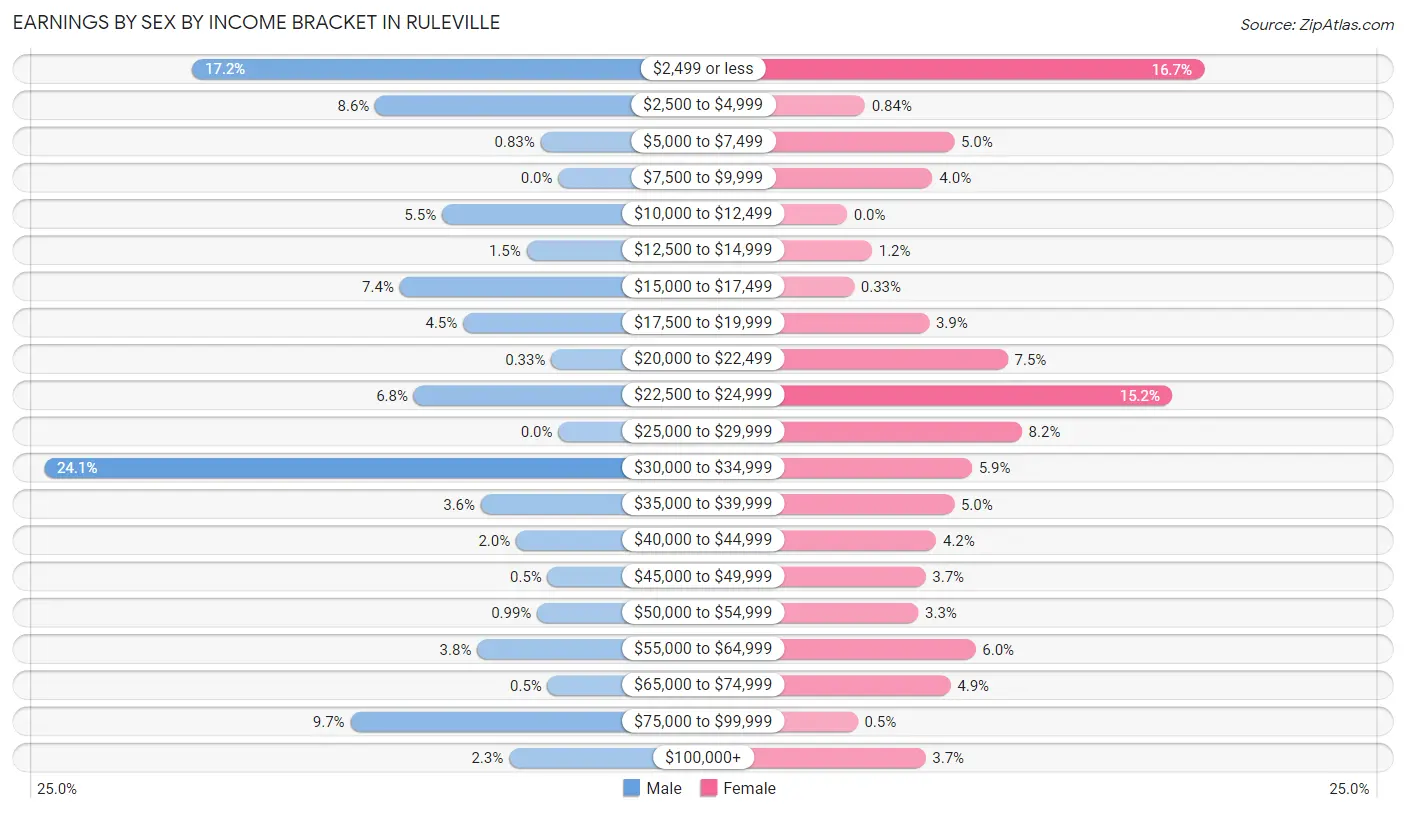
Earnings by Sex by Income Bracket in Ruleville
The most common earnings brackets in Ruleville are $30,000 to $34,999 for men (146 | 24.1%) and $2,499 or less for women (100 | 16.7%).
| Income | Male | Female |
| $2,499 or less | 104 (17.2%) | 100 (16.7%) |
| $2,500 to $4,999 | 52 (8.6%) | 5 (0.8%) |
| $5,000 to $7,499 | 5 (0.8%) | 30 (5.0%) |
| $7,500 to $9,999 | 0 (0.0%) | 24 (4.0%) |
| $10,000 to $12,499 | 33 (5.4%) | 0 (0.0%) |
| $12,500 to $14,999 | 9 (1.5%) | 7 (1.2%) |
| $15,000 to $17,499 | 45 (7.4%) | 2 (0.3%) |
| $17,500 to $19,999 | 27 (4.5%) | 23 (3.8%) |
| $20,000 to $22,499 | 2 (0.3%) | 45 (7.5%) |
| $22,500 to $24,999 | 41 (6.8%) | 91 (15.2%) |
| $25,000 to $29,999 | 0 (0.0%) | 49 (8.2%) |
| $30,000 to $34,999 | 146 (24.1%) | 35 (5.9%) |
| $35,000 to $39,999 | 22 (3.6%) | 30 (5.0%) |
| $40,000 to $44,999 | 12 (2.0%) | 25 (4.2%) |
| $45,000 to $49,999 | 3 (0.5%) | 22 (3.7%) |
| $50,000 to $54,999 | 6 (1.0%) | 20 (3.3%) |
| $55,000 to $64,999 | 23 (3.8%) | 36 (6.0%) |
| $65,000 to $74,999 | 3 (0.5%) | 29 (4.9%) |
| $75,000 to $99,999 | 59 (9.7%) | 3 (0.5%) |
| $100,000+ | 14 (2.3%) | 22 (3.7%) |
| Total | 606 (100.0%) | 598 (100.0%) |
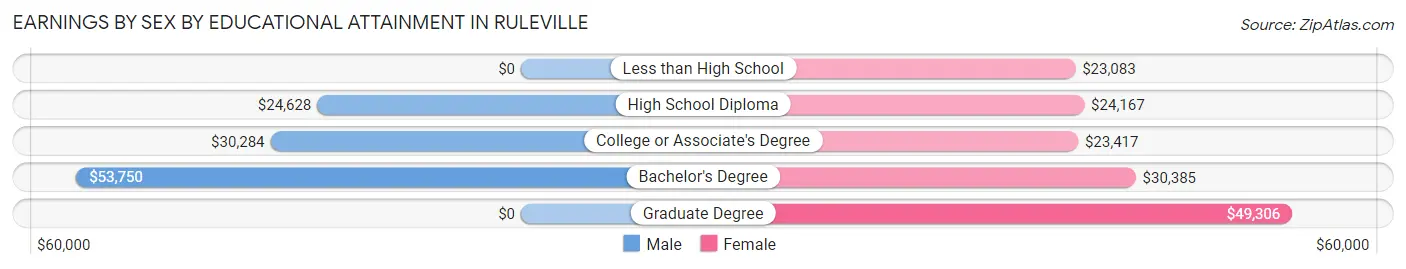
Earnings by Sex by Educational Attainment in Ruleville
Average earnings in Ruleville are $30,186 for men and $28,661 for women, a difference of 5.1%. Men with an educational attainment of bachelor's degree enjoy the highest average annual earnings of $53,750, while those with high school diploma education earn the least with $24,628. Women with an educational attainment of graduate degree earn the most with the average annual earnings of $49,306, while those with less than high school education have the smallest earnings of $23,083.
| Educational Attainment | Male Income | Female Income |
| Less than High School | - | - |
| High School Diploma | $24,628 | $24,167 |
| College or Associate's Degree | $30,284 | $23,417 |
| Bachelor's Degree | $53,750 | $30,385 |
| Graduate Degree | - | - |
| Total | $30,186 | $28,661 |
Family Income in Ruleville
Family Income Brackets in Ruleville
According to the Ruleville family income data, there are 83 families falling into the $50,000 to $74,999 income range, which is the most common income bracket and makes up 17.0% of all families. Conversely, the $150,000 to $199,999 income bracket is the least frequent group with only 8 families (1.6%) belonging to this category.
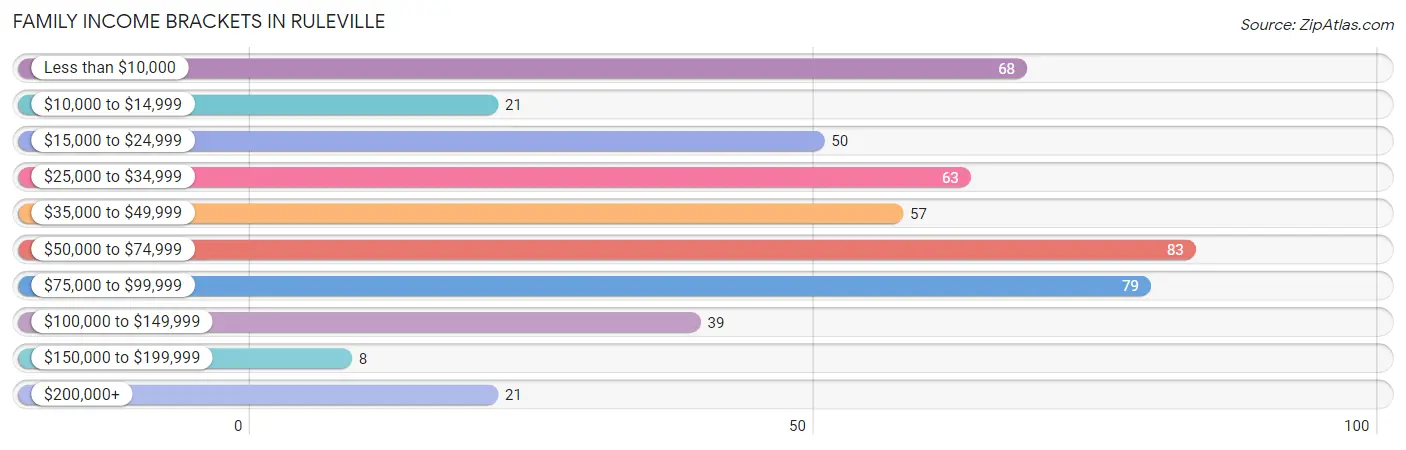
| Income Bracket | # Families | % Families |
| Less than $10,000 | 68 | 13.9% |
| $10,000 to $14,999 | 21 | 4.3% |
| $15,000 to $24,999 | 50 | 10.2% |
| $25,000 to $34,999 | 63 | 12.9% |
| $35,000 to $49,999 | 57 | 11.7% |
| $50,000 to $74,999 | 83 | 17.0% |
| $75,000 to $99,999 | 79 | 16.2% |
| $100,000 to $149,999 | 39 | 8.0% |
| $150,000 to $199,999 | 8 | 1.6% |
| $200,000+ | 21 | 4.3% |
Family Income by Famaliy Size in Ruleville
4-person families (70 | 14.3%) account for the highest median family income in Ruleville with $88,438 per family, while 4-person families (70 | 14.3%) have the highest median income of $22,110 per family member.
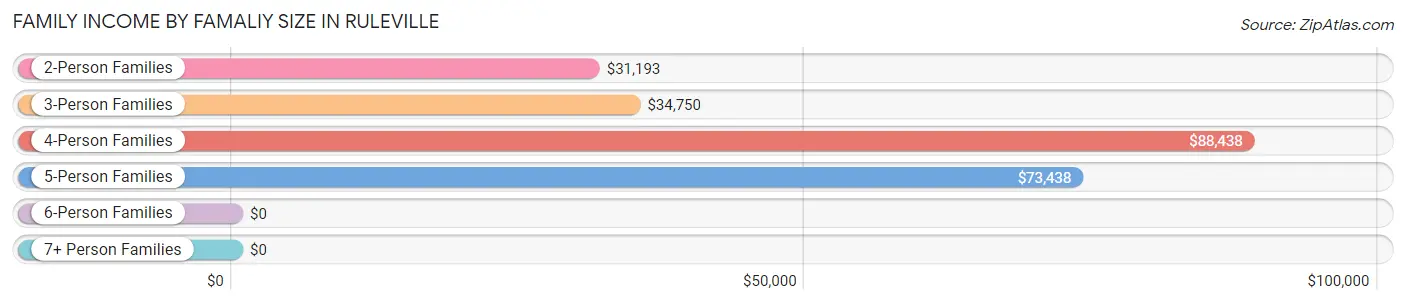
| Income Bracket | # Families | Median Income |
| 2-Person Families | 163 (33.3%) | $31,193 |
| 3-Person Families | 179 (36.6%) | $34,750 |
| 4-Person Families | 70 (14.3%) | $88,438 |
| 5-Person Families | 62 (12.7%) | $73,438 |
| 6-Person Families | 0 (0.0%) | $0 |
| 7+ Person Families | 15 (3.1%) | $0 |
| Total | 489 (100.0%) | $44,519 |
Family Income by Number of Earners in Ruleville
The median family income in Ruleville is $44,519, with families comprising 3+ earners (86) having the highest median family income of $111,042, while families with no earners (114) have the lowest median family income of $10,833, accounting for 17.6% and 23.3% of families, respectively.
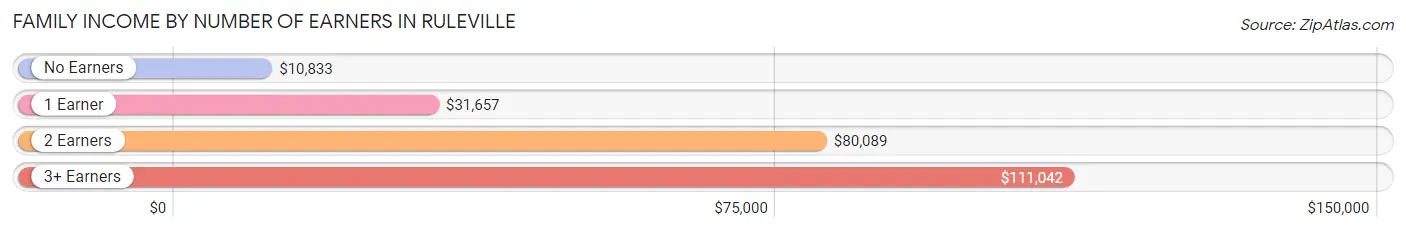
| Number of Earners | # Families | Median Income |
| No Earners | 114 (23.3%) | $10,833 |
| 1 Earner | 189 (38.7%) | $31,657 |
| 2 Earners | 100 (20.4%) | $80,089 |
| 3+ Earners | 86 (17.6%) | $111,042 |
| Total | 489 (100.0%) | $44,519 |
Household Income in Ruleville
Household Income Brackets in Ruleville
With 164 households falling in the category, the $50,000 to $74,999 income range is the most frequent in Ruleville, accounting for 22.3% of all households. In contrast, only 8 households (1.1%) fall into the $150,000 to $199,999 income bracket, making it the least populous group.
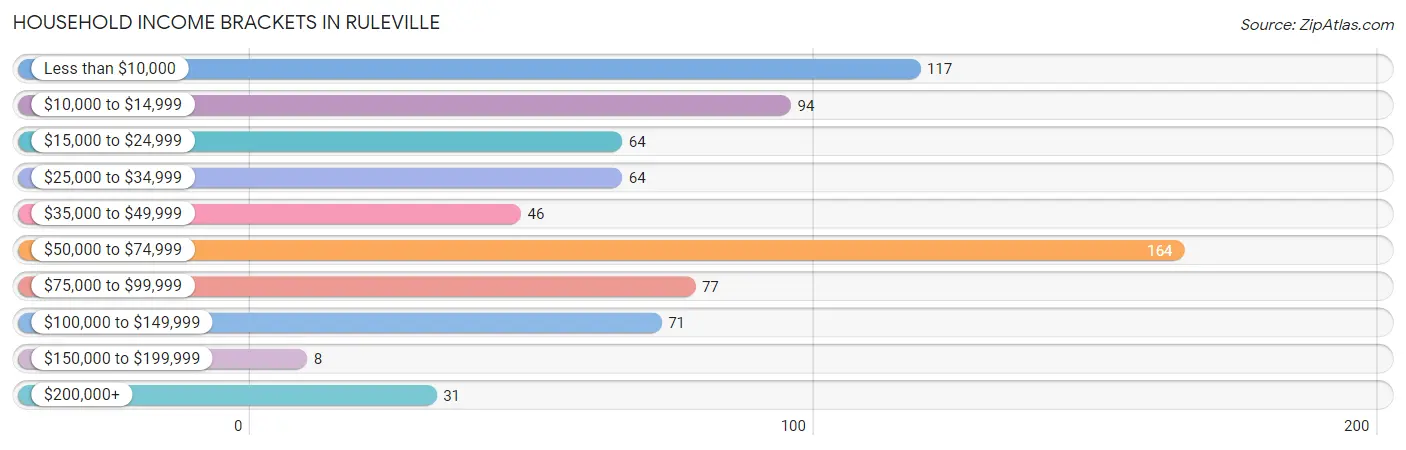
| Income Bracket | # Households | % Households |
| Less than $10,000 | 117 | 15.9% |
| $10,000 to $14,999 | 94 | 12.8% |
| $15,000 to $24,999 | 64 | 8.7% |
| $25,000 to $34,999 | 64 | 8.7% |
| $35,000 to $49,999 | 46 | 6.3% |
| $50,000 to $74,999 | 164 | 22.3% |
| $75,000 to $99,999 | 77 | 10.5% |
| $100,000 to $149,999 | 71 | 9.6% |
| $150,000 to $199,999 | 8 | 1.1% |
| $200,000+ | 31 | 4.2% |
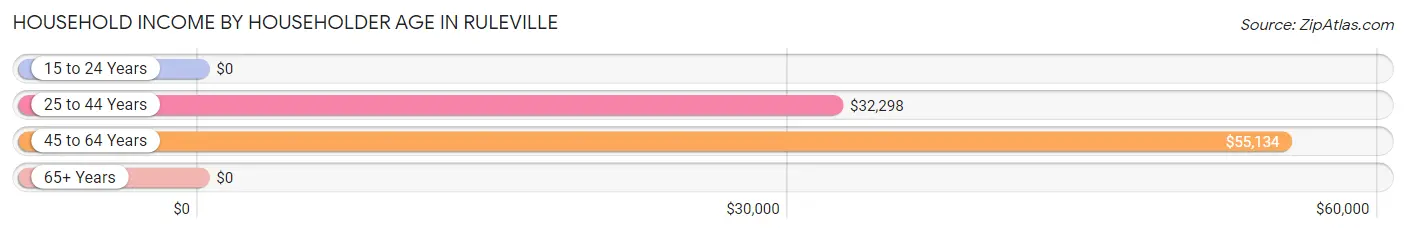
Household Income by Householder Age in Ruleville
The median household income in Ruleville is $41,765, with the highest median household income of $55,134 found in the 45 to 64 years age bracket for the primary householder. A total of 327 households (44.4%) fall into this category.
| Income Bracket | # Households | Median Income |
| 15 to 24 Years | 0 (0.0%) | $0 |
| 25 to 44 Years | 239 (32.5%) | $32,298 |
| 45 to 64 Years | 327 (44.4%) | $55,134 |
| 65+ Years | 170 (23.1%) | $0 |
| Total | 736 (100.0%) | $41,765 |
Poverty in Ruleville
Income Below Poverty by Sex and Age in Ruleville
With 26.0% poverty level for males and 22.7% for females among the residents of Ruleville, 16 and 17 year old males and 45 to 54 year old females are the most vulnerable to poverty, with 12 males (100.0%) and 80 females (37.6%) in their respective age groups living below the poverty level.
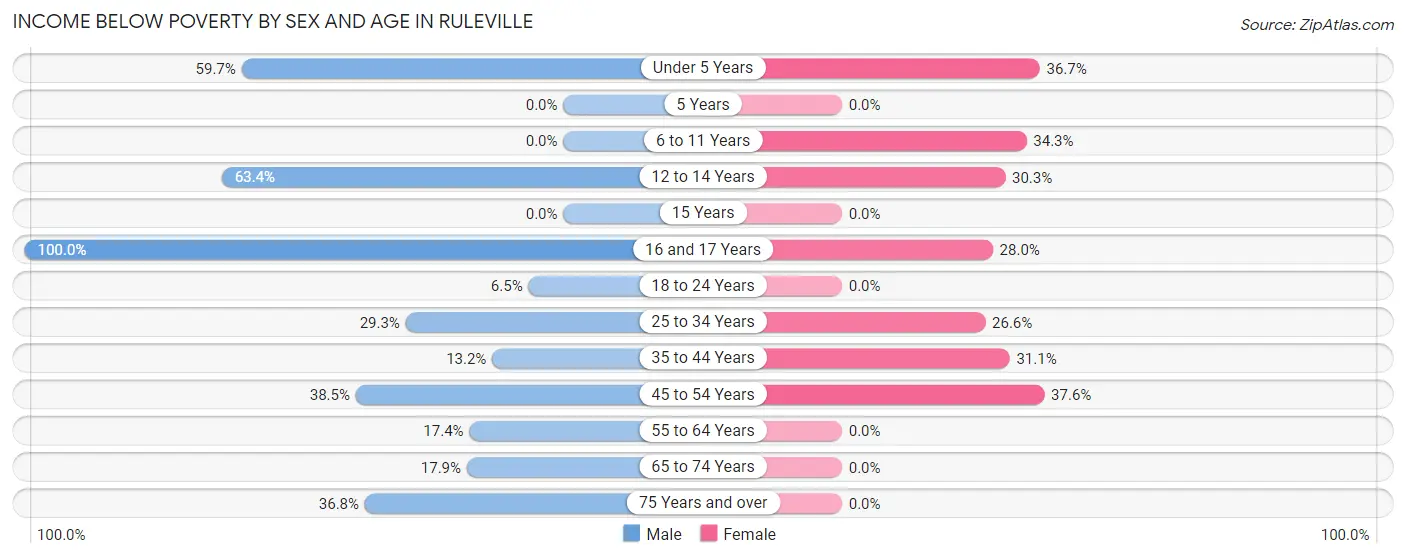
| Age Bracket | Male | Female |
| Under 5 Years | 43 (59.7%) | 40 (36.7%) |
| 5 Years | 0 (0.0%) | 0 (0.0%) |
| 6 to 11 Years | 0 (0.0%) | 37 (34.3%) |
| 12 to 14 Years | 26 (63.4%) | 20 (30.3%) |
| 15 Years | 0 (0.0%) | 0 (0.0%) |
| 16 and 17 Years | 12 (100.0%) | 7 (28.0%) |
| 18 to 24 Years | 13 (6.5%) | 0 (0.0%) |
| 25 to 34 Years | 115 (29.3%) | 50 (26.6%) |
| 35 to 44 Years | 14 (13.2%) | 47 (31.1%) |
| 45 to 54 Years | 42 (38.5%) | 80 (37.6%) |
| 55 to 64 Years | 15 (17.4%) | 0 (0.0%) |
| 65 to 74 Years | 12 (17.9%) | 0 (0.0%) |
| 75 Years and over | 7 (36.8%) | 0 (0.0%) |
| Total | 299 (26.0%) | 281 (22.7%) |
Income Above Poverty by Sex and Age in Ruleville
According to the poverty statistics in Ruleville, males aged 6 to 11 years and females aged 5 years are the age groups that are most secure financially, with 100.0% of males and 100.0% of females in these age groups living above the poverty line.
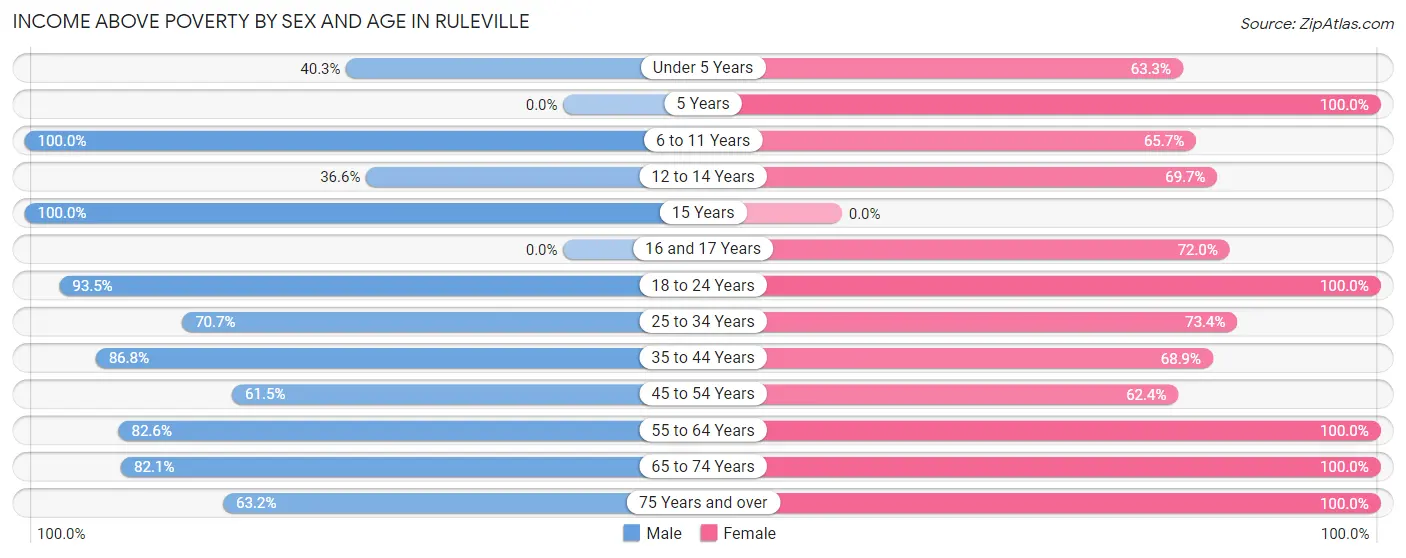
| Age Bracket | Male | Female |
| Under 5 Years | 29 (40.3%) | 69 (63.3%) |
| 5 Years | 0 (0.0%) | 43 (100.0%) |
| 6 to 11 Years | 35 (100.0%) | 71 (65.7%) |
| 12 to 14 Years | 15 (36.6%) | 46 (69.7%) |
| 15 Years | 11 (100.0%) | 0 (0.0%) |
| 16 and 17 Years | 0 (0.0%) | 18 (72.0%) |
| 18 to 24 Years | 188 (93.5%) | 126 (100.0%) |
| 25 to 34 Years | 278 (70.7%) | 138 (73.4%) |
| 35 to 44 Years | 92 (86.8%) | 104 (68.9%) |
| 45 to 54 Years | 67 (61.5%) | 133 (62.4%) |
| 55 to 64 Years | 71 (82.6%) | 88 (100.0%) |
| 65 to 74 Years | 55 (82.1%) | 87 (100.0%) |
| 75 Years and over | 12 (63.2%) | 35 (100.0%) |
| Total | 853 (74.1%) | 958 (77.3%) |
Income Below Poverty Among Married-Couple Families in Ruleville
The poverty statistics for married-couple families in Ruleville show that 4.2% or 8 of the total 193 families live below the poverty line. Families with no children have the highest poverty rate of 6.0%, comprising of 8 families. On the other hand, families with 1 or 2 children have the lowest poverty rate of 0.0%, which includes 0 families.
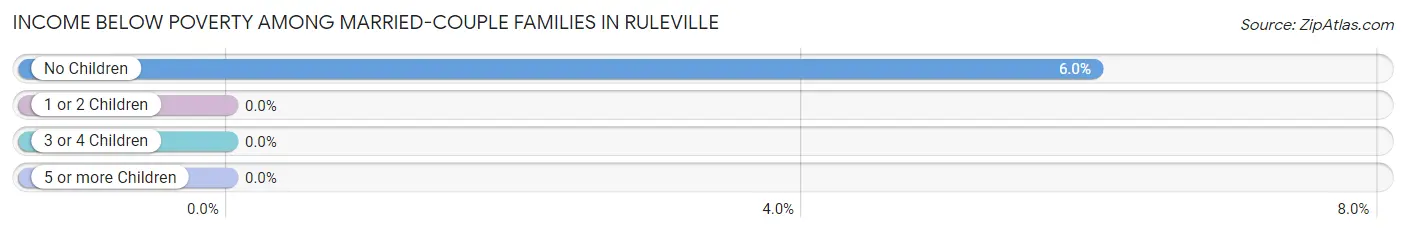
| Children | Above Poverty | Below Poverty |
| No Children | 125 (94.0%) | 8 (6.0%) |
| 1 or 2 Children | 47 (100.0%) | 0 (0.0%) |
| 3 or 4 Children | 13 (100.0%) | 0 (0.0%) |
| 5 or more Children | 0 (0.0%) | 0 (0.0%) |
| Total | 185 (95.9%) | 8 (4.2%) |
Income Below Poverty Among Single-Parent Households in Ruleville
According to the poverty data in Ruleville, 16.3% or 7 single-father households and 40.7% or 103 single-mother households are living below the poverty line. Among single-father households, those with 1 or 2 children have the highest poverty rate, with 7 households (21.9%) experiencing poverty. Likewise, among single-mother households, those with 3 or 4 children have the highest poverty rate, with 14 households (48.3%) falling below the poverty line.
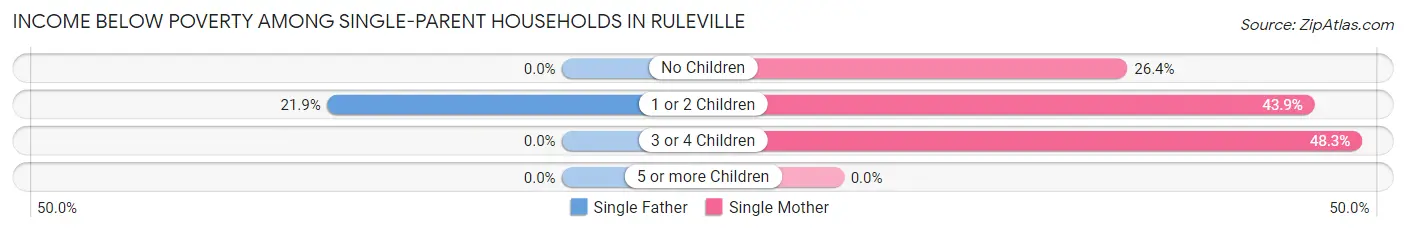
| Children | Single Father | Single Mother |
| No Children | 0 (0.0%) | 14 (26.4%) |
| 1 or 2 Children | 7 (21.9%) | 75 (43.9%) |
| 3 or 4 Children | 0 (0.0%) | 14 (48.3%) |
| 5 or more Children | 0 (0.0%) | 0 (0.0%) |
| Total | 7 (16.3%) | 103 (40.7%) |
Income Below Poverty Among Married-Couple vs Single-Parent Households in Ruleville
The poverty data for Ruleville shows that 8 of the married-couple family households (4.2%) and 110 of the single-parent households (37.2%) are living below the poverty level. Within the married-couple family households, those with no children have the highest poverty rate, with 8 households (6.0%) falling below the poverty line. Among the single-parent households, those with 3 or 4 children have the highest poverty rate, with 14 household (48.3%) living below poverty.
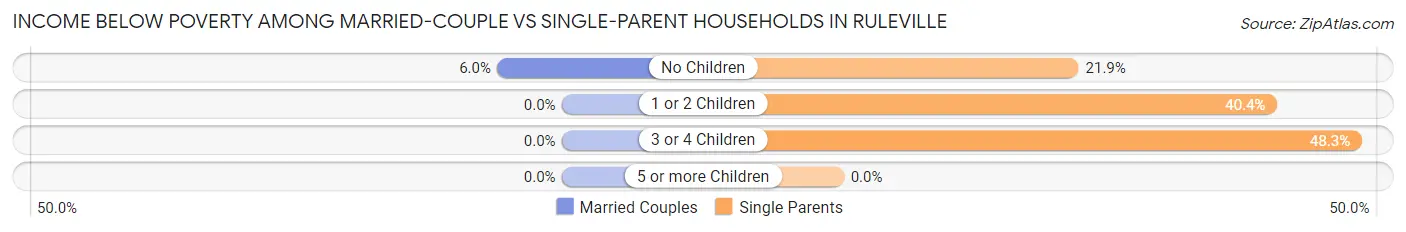
| Children | Married-Couple Families | Single-Parent Households |
| No Children | 8 (6.0%) | 14 (21.9%) |
| 1 or 2 Children | 0 (0.0%) | 82 (40.4%) |
| 3 or 4 Children | 0 (0.0%) | 14 (48.3%) |
| 5 or more Children | 0 (0.0%) | 0 (0.0%) |
| Total | 8 (4.2%) | 110 (37.2%) |
Race in Ruleville
The most populous races in Ruleville are Black / African American (2,286 | 86.8%), White / Caucasian (343 | 13.0%), and Hispanic or Latino (4 | 0.2%).
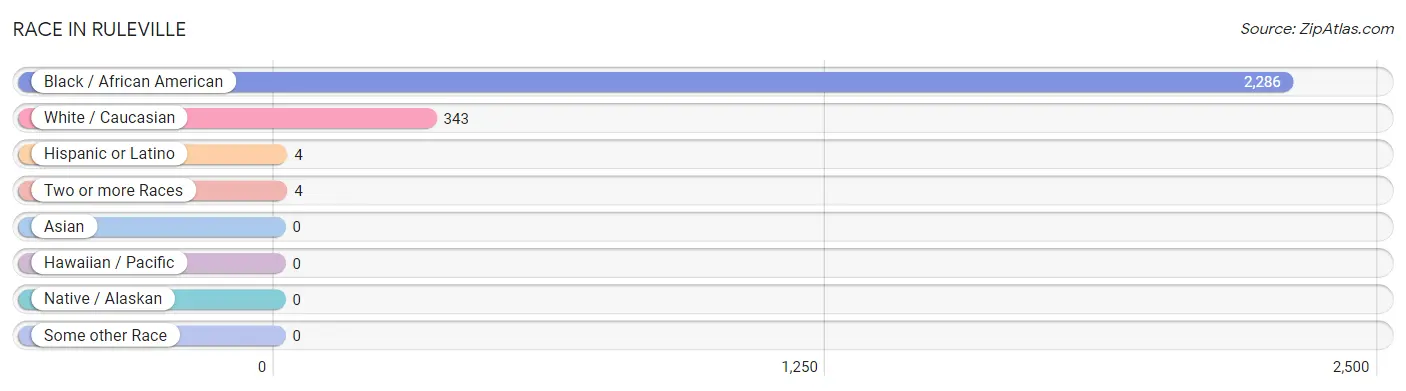
| Race | # Population | % Population |
| Asian | 0 | 0.0% |
| Black / African American | 2,286 | 86.8% |
| Hawaiian / Pacific | 0 | 0.0% |
| Hispanic or Latino | 4 | 0.2% |
| Native / Alaskan | 0 | 0.0% |
| White / Caucasian | 343 | 13.0% |
| Two or more Races | 4 | 0.2% |
| Some other Race | 0 | 0.0% |
| Total | 2,633 | 100.0% |
Ancestry in Ruleville
The most populous ancestries reported in Ruleville are American (107 | 4.1%), Irish (56 | 2.1%), German (53 | 2.0%), English (49 | 1.9%), and French (7 | 0.3%), together accounting for 10.3% of all Ruleville residents.
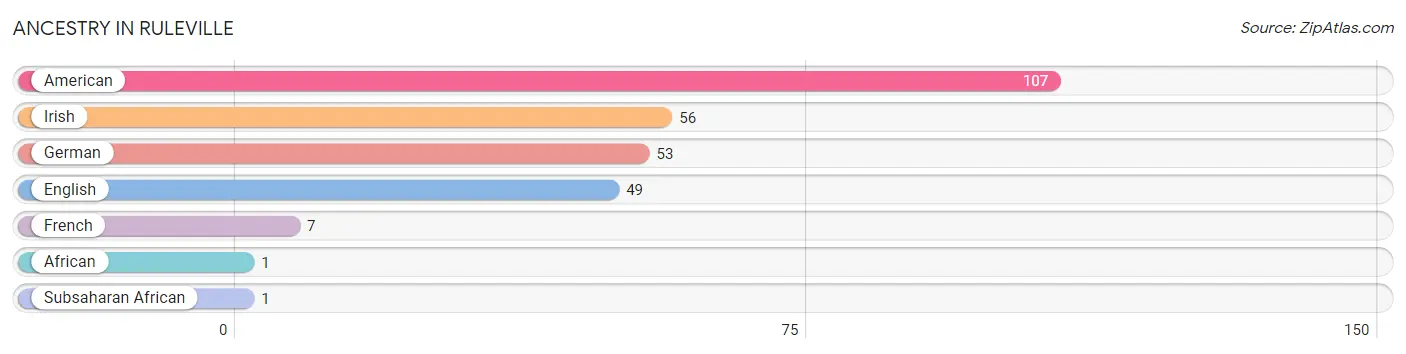
| Ancestry | # Population | % Population |
| African | 1 | 0.0% |
| American | 107 | 4.1% |
| English | 49 | 1.9% |
| French | 7 | 0.3% |
| German | 53 | 2.0% |
| Irish | 56 | 2.1% |
| Subsaharan African | 1 | 0.0% | View All 7 Rows |
Immigrants in Ruleville

| Immigration Origin | # Population | % Population | View All 0 Rows |
Sex and Age in Ruleville
Sex and Age in Ruleville
The most populous age groups in Ruleville are 25 to 29 Years (275 | 21.5%) for men and 45 to 49 Years (133 | 9.8%) for women.
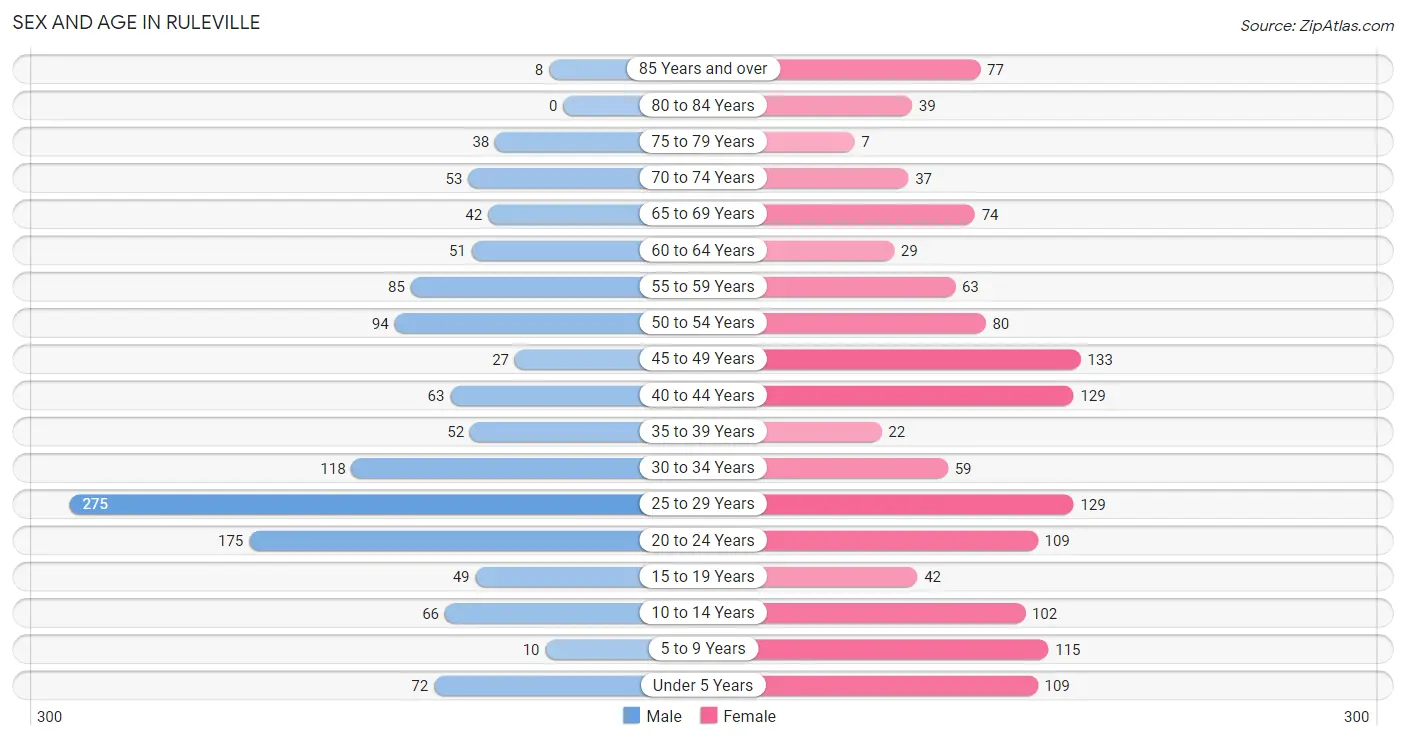
| Age Bracket | Male | Female |
| Under 5 Years | 72 (5.6%) | 109 (8.0%) |
| 5 to 9 Years | 10 (0.8%) | 115 (8.5%) |
| 10 to 14 Years | 66 (5.2%) | 102 (7.5%) |
| 15 to 19 Years | 49 (3.8%) | 42 (3.1%) |
| 20 to 24 Years | 175 (13.7%) | 109 (8.0%) |
| 25 to 29 Years | 275 (21.5%) | 129 (9.5%) |
| 30 to 34 Years | 118 (9.2%) | 59 (4.3%) |
| 35 to 39 Years | 52 (4.1%) | 22 (1.6%) |
| 40 to 44 Years | 63 (4.9%) | 129 (9.5%) |
| 45 to 49 Years | 27 (2.1%) | 133 (9.8%) |
| 50 to 54 Years | 94 (7.4%) | 80 (5.9%) |
| 55 to 59 Years | 85 (6.7%) | 63 (4.6%) |
| 60 to 64 Years | 51 (4.0%) | 29 (2.1%) |
| 65 to 69 Years | 42 (3.3%) | 74 (5.5%) |
| 70 to 74 Years | 53 (4.2%) | 37 (2.7%) |
| 75 to 79 Years | 38 (3.0%) | 7 (0.5%) |
| 80 to 84 Years | 0 (0.0%) | 39 (2.9%) |
| 85 Years and over | 8 (0.6%) | 77 (5.7%) |
| Total | 1,278 (100.0%) | 1,355 (100.0%) |
Families and Households in Ruleville
Median Family Size in Ruleville
The median family size in Ruleville is 4.10 persons per family, with single female/mother families (253 | 51.7%) accounting for the largest median family size of 4.37 persons per family. On the other hand, single male/father families (43 | 8.8%) represent the smallest median family size with 3.21 persons per family.
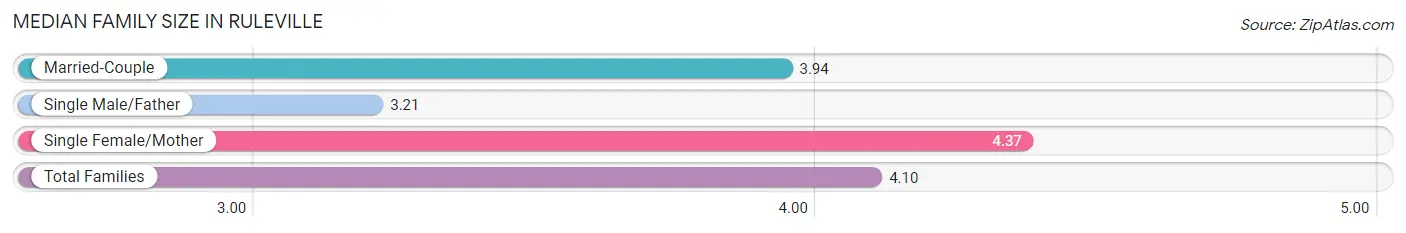
| Family Type | # Families | Family Size |
| Married-Couple | 193 (39.5%) | 3.94 |
| Single Male/Father | 43 (8.8%) | 3.21 |
| Single Female/Mother | 253 (51.7%) | 4.37 |
| Total Families | 489 (100.0%) | 4.10 |
Median Household Size in Ruleville
The median household size in Ruleville is 3.25 persons per household, with single female/mother households (253 | 34.4%) accounting for the largest median household size of 4.68 persons per household. non-family households (247 | 33.6%) represent the smallest median household size with 1.13 persons per household.
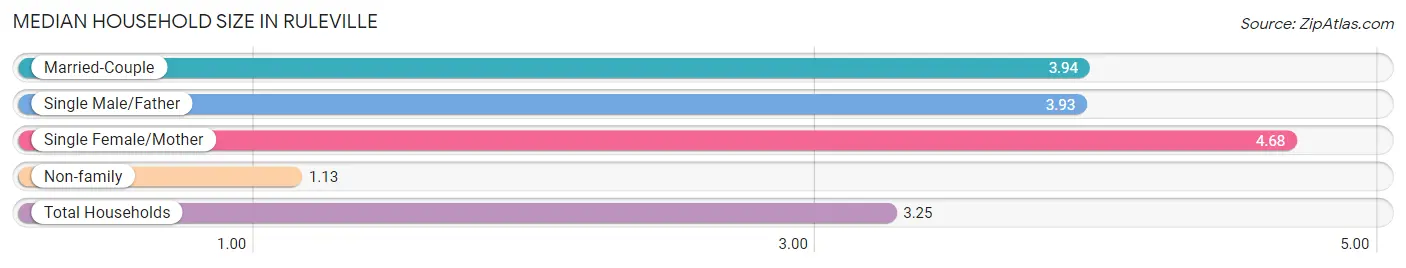
| Household Type | # Households | Household Size |
| Married-Couple | 193 (26.2%) | 3.94 |
| Single Male/Father | 43 (5.8%) | 3.93 |
| Single Female/Mother | 253 (34.4%) | 4.68 |
| Non-family | 247 (33.6%) | 1.13 |
| Total Households | 736 (100.0%) | 3.25 |
Household Size by Marriage Status in Ruleville
Out of a total of 736 households in Ruleville, 489 (66.4%) are family households, while 247 (33.6%) are nonfamily households. The most numerous type of family households are 3-person households, comprising 173, and the most common type of nonfamily households are 1-person households, comprising 214.
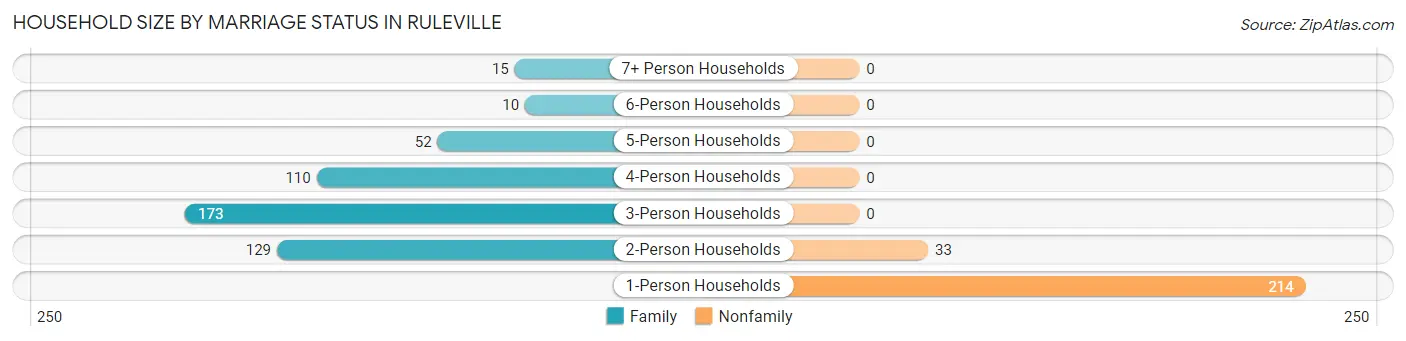
| Household Size | Family Households | Nonfamily Households |
| 1-Person Households | - | 214 (29.1%) |
| 2-Person Households | 129 (17.5%) | 33 (4.5%) |
| 3-Person Households | 173 (23.5%) | 0 (0.0%) |
| 4-Person Households | 110 (14.9%) | 0 (0.0%) |
| 5-Person Households | 52 (7.1%) | 0 (0.0%) |
| 6-Person Households | 10 (1.4%) | 0 (0.0%) |
| 7+ Person Households | 15 (2.0%) | 0 (0.0%) |
| Total | 489 (66.4%) | 247 (33.6%) |
Female Fertility in Ruleville
Fertility by Age in Ruleville
Average fertility rate in Ruleville is 22.0 births per 1,000 women. Women in the age bracket of 20 to 34 years have the highest fertility rate with 47.0 births per 1,000 women. Women in the age bracket of 20 to 34 years acount for 100.0% of all women with births.
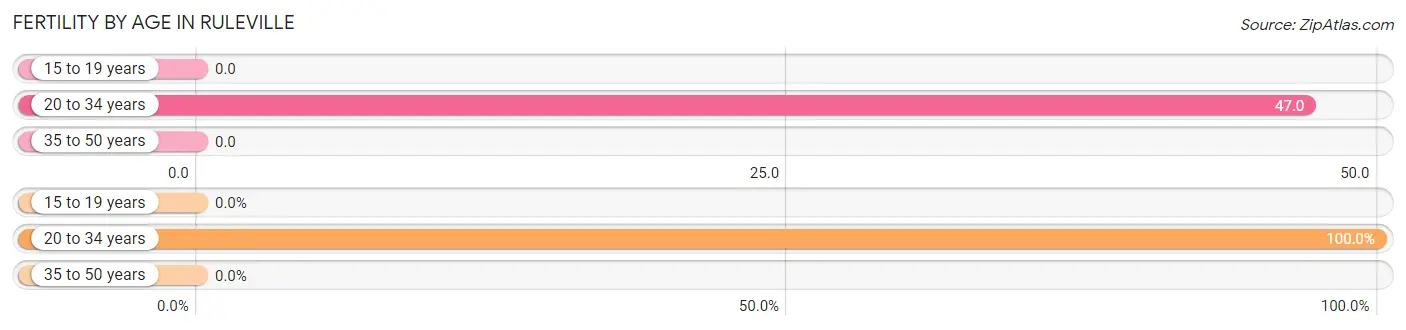
| Age Bracket | Women with Births | Births / 1,000 Women |
| 15 to 19 years | 0 (0.0%) | 0.0 |
| 20 to 34 years | 14 (100.0%) | 47.0 |
| 35 to 50 years | 0 (0.0%) | 0.0 |
| Total | 14 (100.0%) | 22.0 |
Fertility by Age by Marriage Status in Ruleville
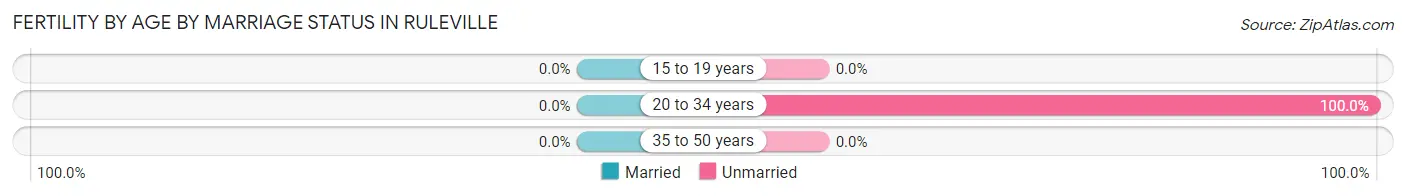
| Age Bracket | Married | Unmarried |
| 15 to 19 years | 0 (0.0%) | 0 (0.0%) |
| 20 to 34 years | 0 (0.0%) | 14 (100.0%) |
| 35 to 50 years | 0 (0.0%) | 0 (0.0%) |
| Total | 0 (0.0%) | 14 (100.0%) |
Fertility by Education in Ruleville
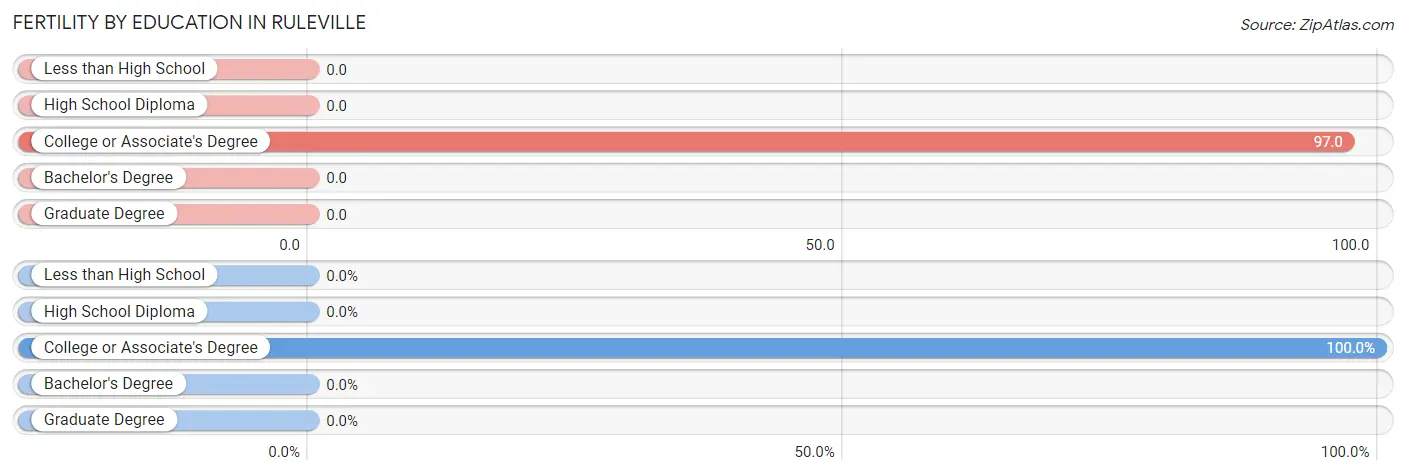
| Educational Attainment | Women with Births | Births / 1,000 Women |
| Less than High School | 0 (0.0%) | 0.0 |
| High School Diploma | 0 (0.0%) | 0.0 |
| College or Associate's Degree | 14 (100.0%) | 97.0 |
| Bachelor's Degree | 0 (0.0%) | 0.0 |
| Graduate Degree | 0 (0.0%) | 0.0 |
| Total | 14 (100.0%) | 22.0 |
Fertility by Education by Marriage Status in Ruleville
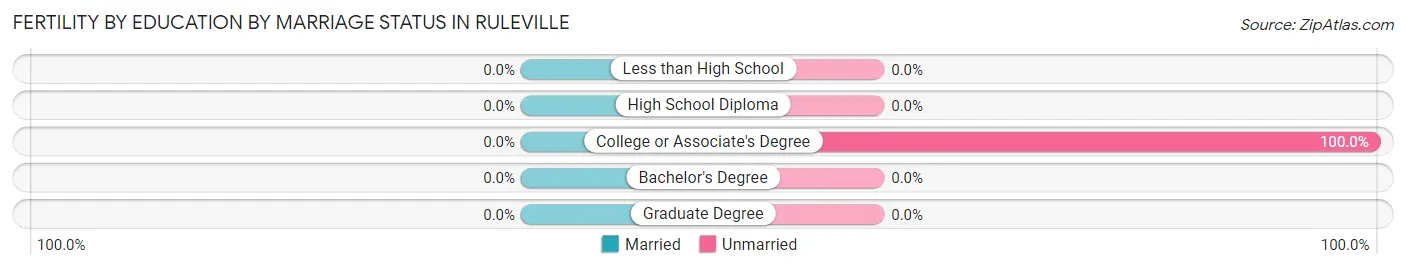
| Educational Attainment | Married | Unmarried |
| Less than High School | 0 (0.0%) | 0 (0.0%) |
| High School Diploma | 0 (0.0%) | 0 (0.0%) |
| College or Associate's Degree | 0 (0.0%) | 14 (100.0%) |
| Bachelor's Degree | 0 (0.0%) | 0 (0.0%) |
| Graduate Degree | 0 (0.0%) | 0 (0.0%) |
| Total | 0 (0.0%) | 14 (100.0%) |
Employment Characteristics in Ruleville
Employment by Class of Employer in Ruleville
Among the 974 employed individuals in Ruleville, private company employees (540 | 55.4%), state government employees (137 | 14.1%), and local government employees (124 | 12.7%) make up the most common classes of employment.
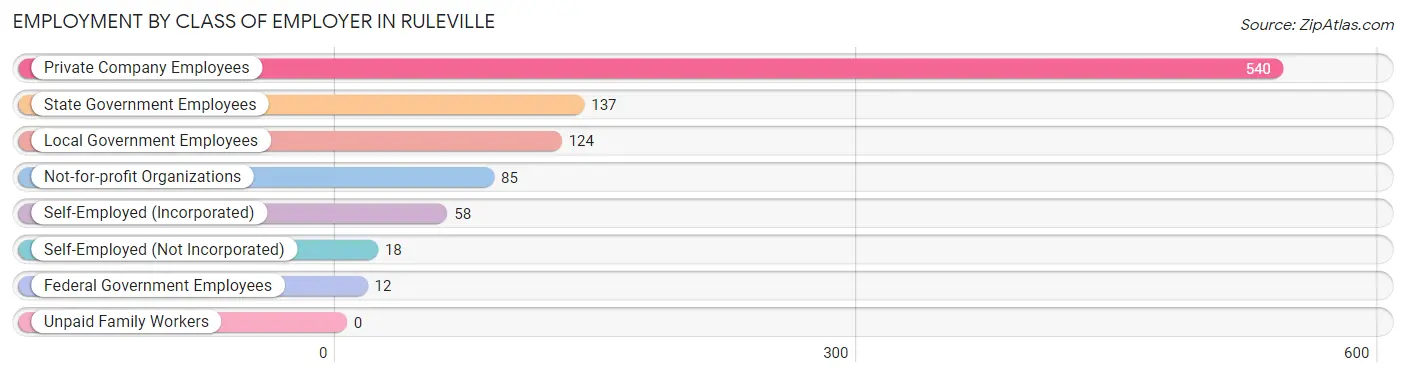
| Employer Class | # Employees | % Employees |
| Private Company Employees | 540 | 55.4% |
| Self-Employed (Incorporated) | 58 | 5.9% |
| Self-Employed (Not Incorporated) | 18 | 1.8% |
| Not-for-profit Organizations | 85 | 8.7% |
| Local Government Employees | 124 | 12.7% |
| State Government Employees | 137 | 14.1% |
| Federal Government Employees | 12 | 1.2% |
| Unpaid Family Workers | 0 | 0.0% |
| Total | 974 | 100.0% |
Employment Status by Age in Ruleville
According to the labor force statistics for Ruleville, out of the total population over 16 years of age (2,148), 57.9% or 1,244 individuals are in the labor force, with 18.1% or 225 of them unemployed. The age group with the highest labor force participation rate is 20 to 24 years, with 83.1% or 236 individuals in the labor force. Within the labor force, the 20 to 24 years age range has the highest percentage of unemployed individuals, with 45.8% or 108 of them being unemployed.
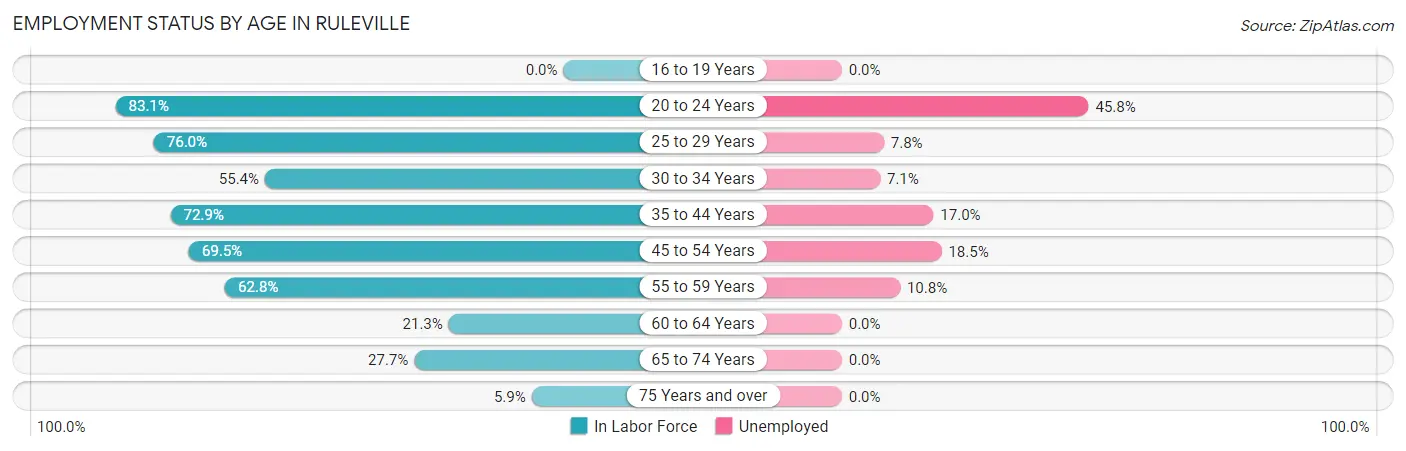
| Age Bracket | In Labor Force | Unemployed |
| 16 to 19 Years | 0 (0.0%) | 0 (0.0%) |
| 20 to 24 Years | 236 (83.1%) | 108 (45.8%) |
| 25 to 29 Years | 307 (76.0%) | 24 (7.8%) |
| 30 to 34 Years | 98 (55.4%) | 7 (7.1%) |
| 35 to 44 Years | 194 (72.9%) | 33 (17.0%) |
| 45 to 54 Years | 232 (69.5%) | 43 (18.5%) |
| 55 to 59 Years | 93 (62.8%) | 10 (10.8%) |
| 60 to 64 Years | 17 (21.3%) | 0 (0.0%) |
| 65 to 74 Years | 57 (27.7%) | 0 (0.0%) |
| 75 Years and over | 10 (5.9%) | 0 (0.0%) |
| Total | 1,244 (57.9%) | 225 (18.1%) |
Employment Status by Educational Attainment in Ruleville
According to labor force statistics for Ruleville, 66.8% of individuals (941) out of the total population between 25 and 64 years of age (1,409) are in the labor force, with 12.4% or 117 of them being unemployed. The group with the highest labor force participation rate are those with the educational attainment of bachelor's degree or higher, with 89.7% or 217 individuals in the labor force. Within the labor force, individuals with high school diploma education have the highest percentage of unemployment, with 21.1% or 89 of them being unemployed.
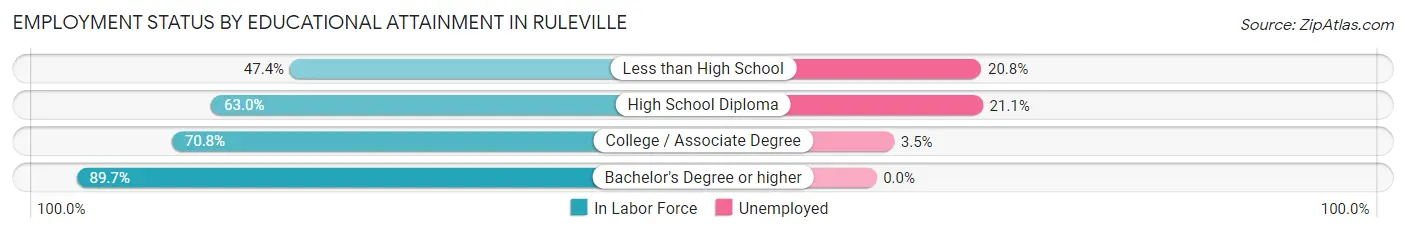
| Educational Attainment | In Labor Force | Unemployed |
| Less than High School | 101 (47.4%) | 44 (20.8%) |
| High School Diploma | 422 (63.0%) | 141 (21.1%) |
| College / Associate Degree | 201 (70.8%) | 10 (3.5%) |
| Bachelor's Degree or higher | 217 (89.7%) | 0 (0.0%) |
| Total | 941 (66.8%) | 175 (12.4%) |
Employment Occupations by Sex in Ruleville
Management, Business, Science and Arts Occupations
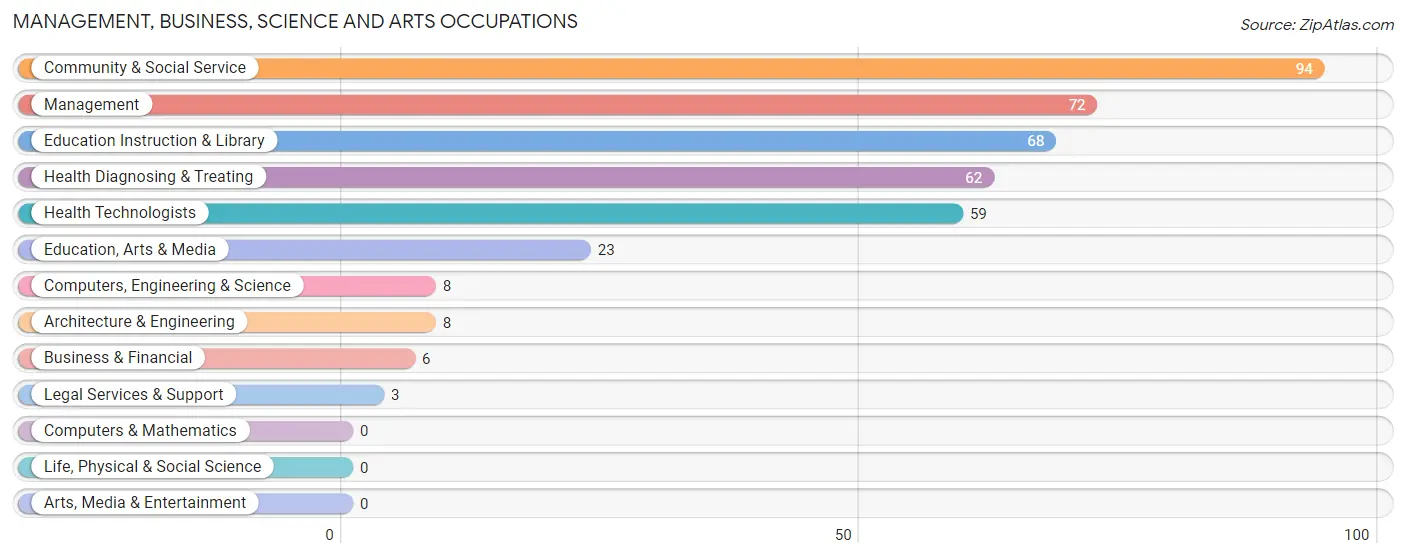
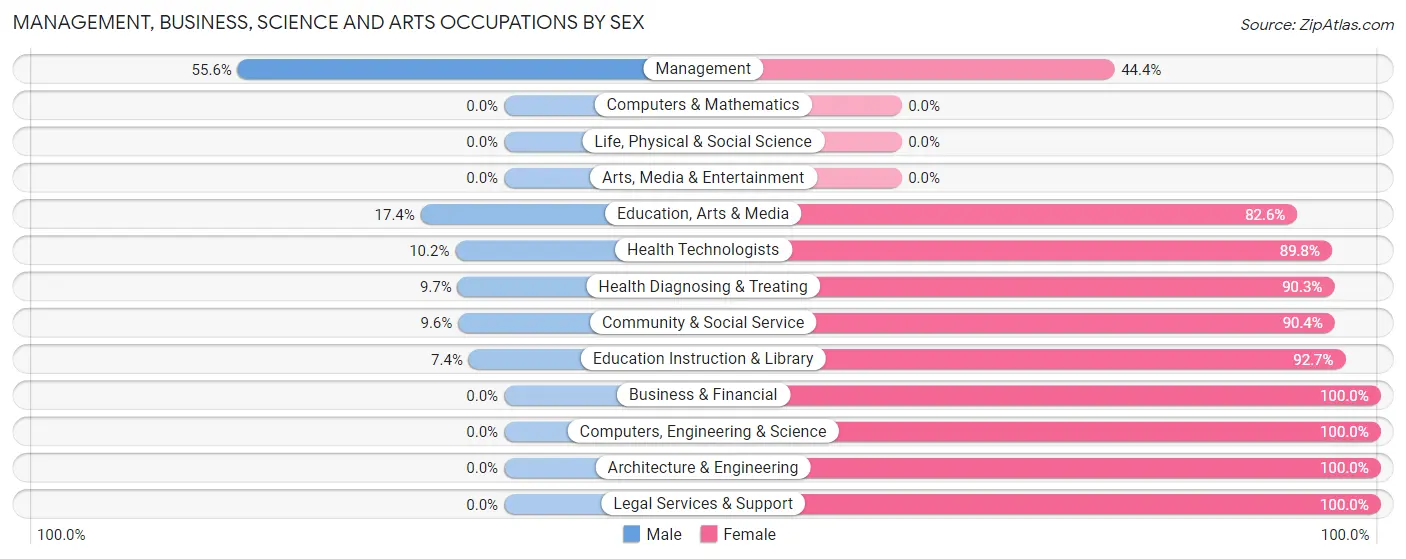
The most common Management, Business, Science and Arts occupations in Ruleville are Community & Social Service (94 | 9.2%), Management (72 | 7.1%), Education Instruction & Library (68 | 6.7%), Health Diagnosing & Treating (62 | 6.1%), and Health Technologists (59 | 5.8%).
Management, Business, Science and Arts Occupations by Sex
Within the Management, Business, Science and Arts occupations in Ruleville, the most male-oriented occupations are Management (55.6%), Education, Arts & Media (17.4%), and Health Technologists (10.2%), while the most female-oriented occupations are Business & Financial (100.0%), Computers, Engineering & Science (100.0%), and Architecture & Engineering (100.0%).
| Occupation | Male | Female |
| Management | 40 (55.6%) | 32 (44.4%) |
| Business & Financial | 0 (0.0%) | 6 (100.0%) |
| Computers, Engineering & Science | 0 (0.0%) | 8 (100.0%) |
| Computers & Mathematics | 0 (0.0%) | 0 (0.0%) |
| Architecture & Engineering | 0 (0.0%) | 8 (100.0%) |
| Life, Physical & Social Science | 0 (0.0%) | 0 (0.0%) |
| Community & Social Service | 9 (9.6%) | 85 (90.4%) |
| Education, Arts & Media | 4 (17.4%) | 19 (82.6%) |
| Legal Services & Support | 0 (0.0%) | 3 (100.0%) |
| Education Instruction & Library | 5 (7.3%) | 63 (92.6%) |
| Arts, Media & Entertainment | 0 (0.0%) | 0 (0.0%) |
| Health Diagnosing & Treating | 6 (9.7%) | 56 (90.3%) |
| Health Technologists | 6 (10.2%) | 53 (89.8%) |
| Total (Category) | 55 (22.7%) | 187 (77.3%) |
| Total (Overall) | 486 (47.7%) | 533 (52.3%) |
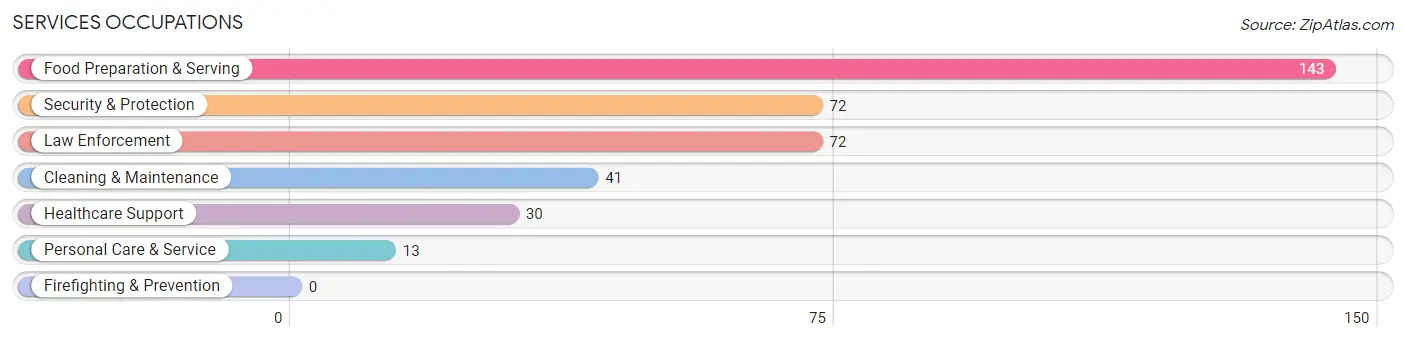
Services Occupations
The most common Services occupations in Ruleville are Food Preparation & Serving (143 | 14.0%), Security & Protection (72 | 7.1%), Law Enforcement (72 | 7.1%), Cleaning & Maintenance (41 | 4.0%), and Healthcare Support (30 | 2.9%).
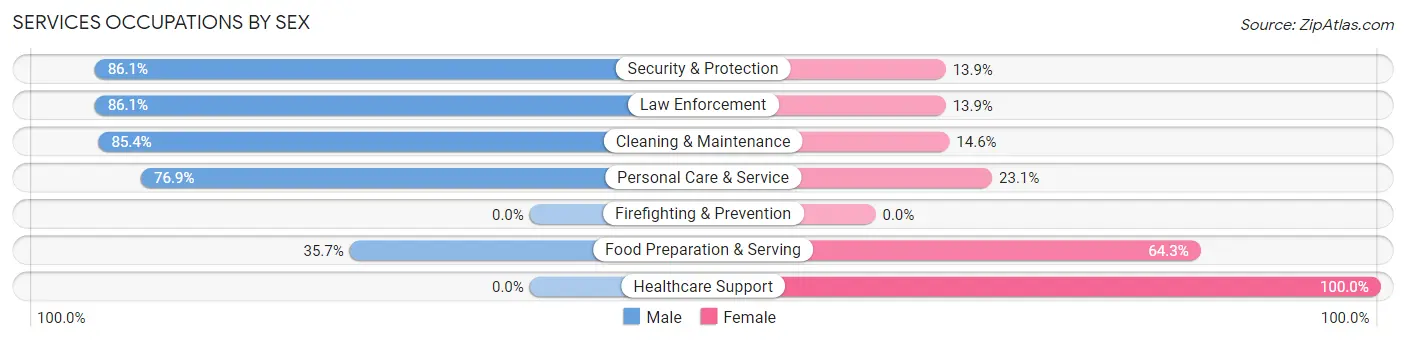
Services Occupations by Sex
Within the Services occupations in Ruleville, the most male-oriented occupations are Security & Protection (86.1%), Law Enforcement (86.1%), and Cleaning & Maintenance (85.4%), while the most female-oriented occupations are Healthcare Support (100.0%), Food Preparation & Serving (64.3%), and Personal Care & Service (23.1%).
| Occupation | Male | Female |
| Healthcare Support | 0 (0.0%) | 30 (100.0%) |
| Security & Protection | 62 (86.1%) | 10 (13.9%) |
| Firefighting & Prevention | 0 (0.0%) | 0 (0.0%) |
| Law Enforcement | 62 (86.1%) | 10 (13.9%) |
| Food Preparation & Serving | 51 (35.7%) | 92 (64.3%) |
| Cleaning & Maintenance | 35 (85.4%) | 6 (14.6%) |
| Personal Care & Service | 10 (76.9%) | 3 (23.1%) |
| Total (Category) | 158 (52.8%) | 141 (47.2%) |
| Total (Overall) | 486 (47.7%) | 533 (52.3%) |
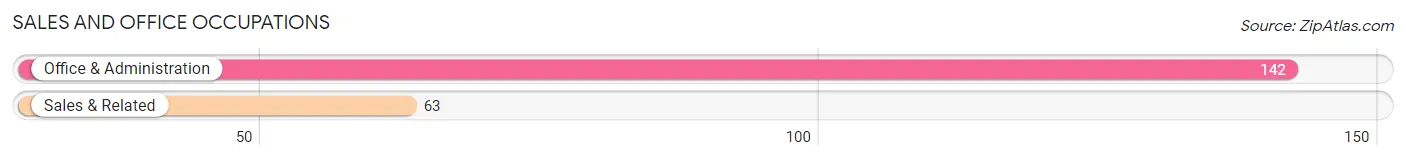
Sales and Office Occupations
The most common Sales and Office occupations in Ruleville are Office & Administration (142 | 13.9%), and Sales & Related (63 | 6.2%).
Sales and Office Occupations by Sex

| Occupation | Male | Female |
| Sales & Related | 17 (27.0%) | 46 (73.0%) |
| Office & Administration | 36 (25.4%) | 106 (74.7%) |
| Total (Category) | 53 (25.9%) | 152 (74.2%) |
| Total (Overall) | 486 (47.7%) | 533 (52.3%) |
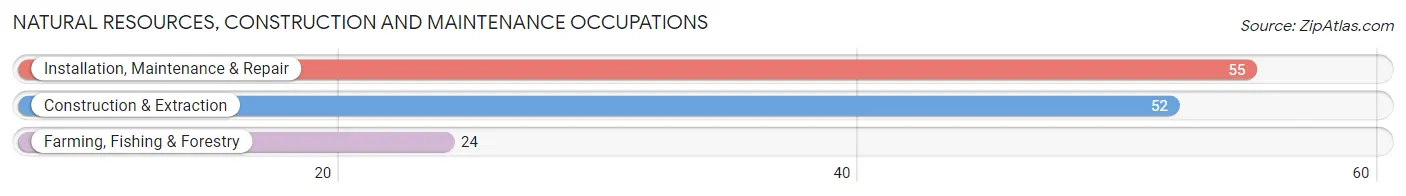
Natural Resources, Construction and Maintenance Occupations
The most common Natural Resources, Construction and Maintenance occupations in Ruleville are Installation, Maintenance & Repair (55 | 5.4%), Construction & Extraction (52 | 5.1%), and Farming, Fishing & Forestry (24 | 2.4%).
Natural Resources, Construction and Maintenance Occupations by Sex
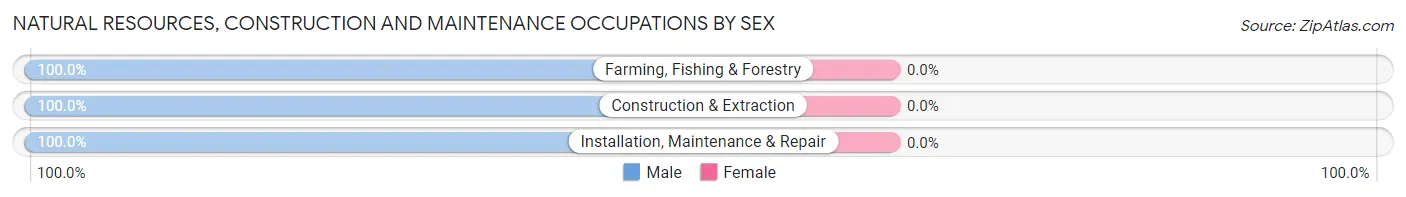
| Occupation | Male | Female |
| Farming, Fishing & Forestry | 24 (100.0%) | 0 (0.0%) |
| Construction & Extraction | 52 (100.0%) | 0 (0.0%) |
| Installation, Maintenance & Repair | 55 (100.0%) | 0 (0.0%) |
| Total (Category) | 131 (100.0%) | 0 (0.0%) |
| Total (Overall) | 486 (47.7%) | 533 (52.3%) |
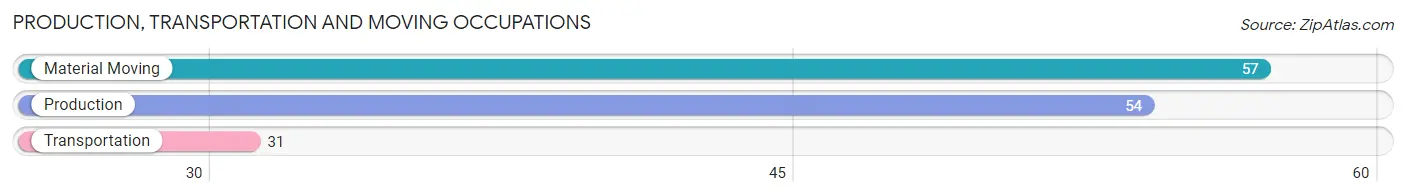
Production, Transportation and Moving Occupations
The most common Production, Transportation and Moving occupations in Ruleville are Material Moving (57 | 5.6%), Production (54 | 5.3%), and Transportation (31 | 3.0%).
Production, Transportation and Moving Occupations by Sex
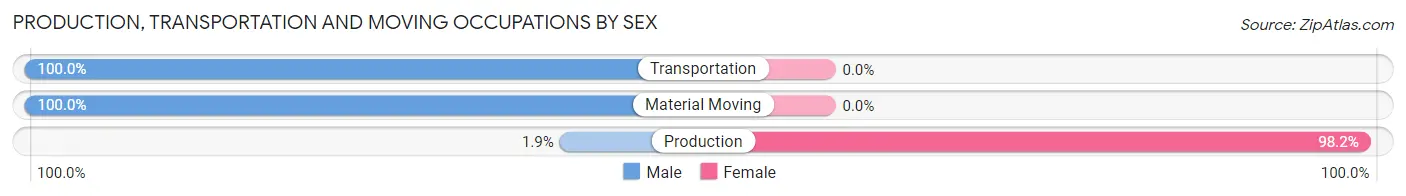
| Occupation | Male | Female |
| Production | 1 (1.8%) | 53 (98.2%) |
| Transportation | 31 (100.0%) | 0 (0.0%) |
| Material Moving | 57 (100.0%) | 0 (0.0%) |
| Total (Category) | 89 (62.7%) | 53 (37.3%) |
| Total (Overall) | 486 (47.7%) | 533 (52.3%) |
Employment Industries by Sex in Ruleville
Employment Industries in Ruleville
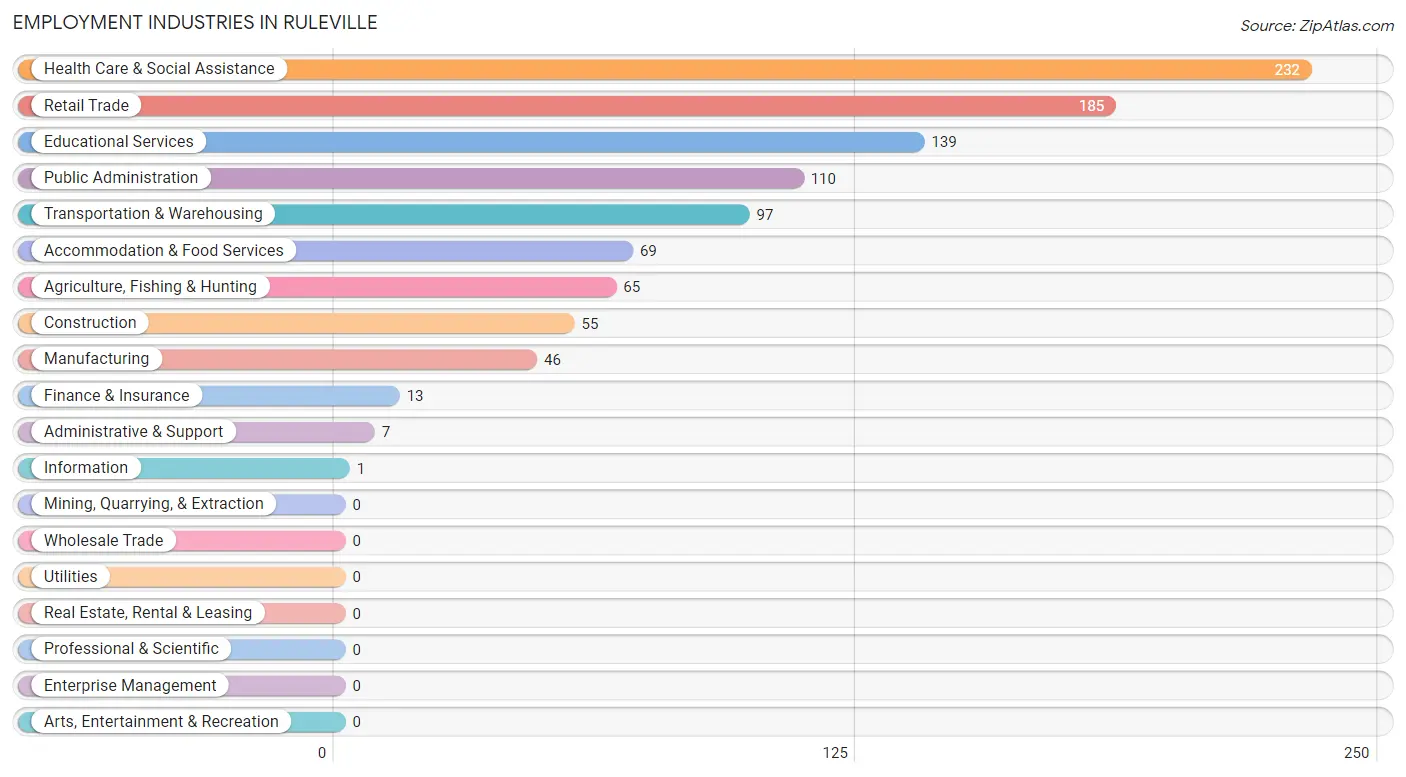
The major employment industries in Ruleville include Health Care & Social Assistance (232 | 22.8%), Retail Trade (185 | 18.2%), Educational Services (139 | 13.6%), Public Administration (110 | 10.8%), and Transportation & Warehousing (97 | 9.5%).
Employment Industries by Sex in Ruleville
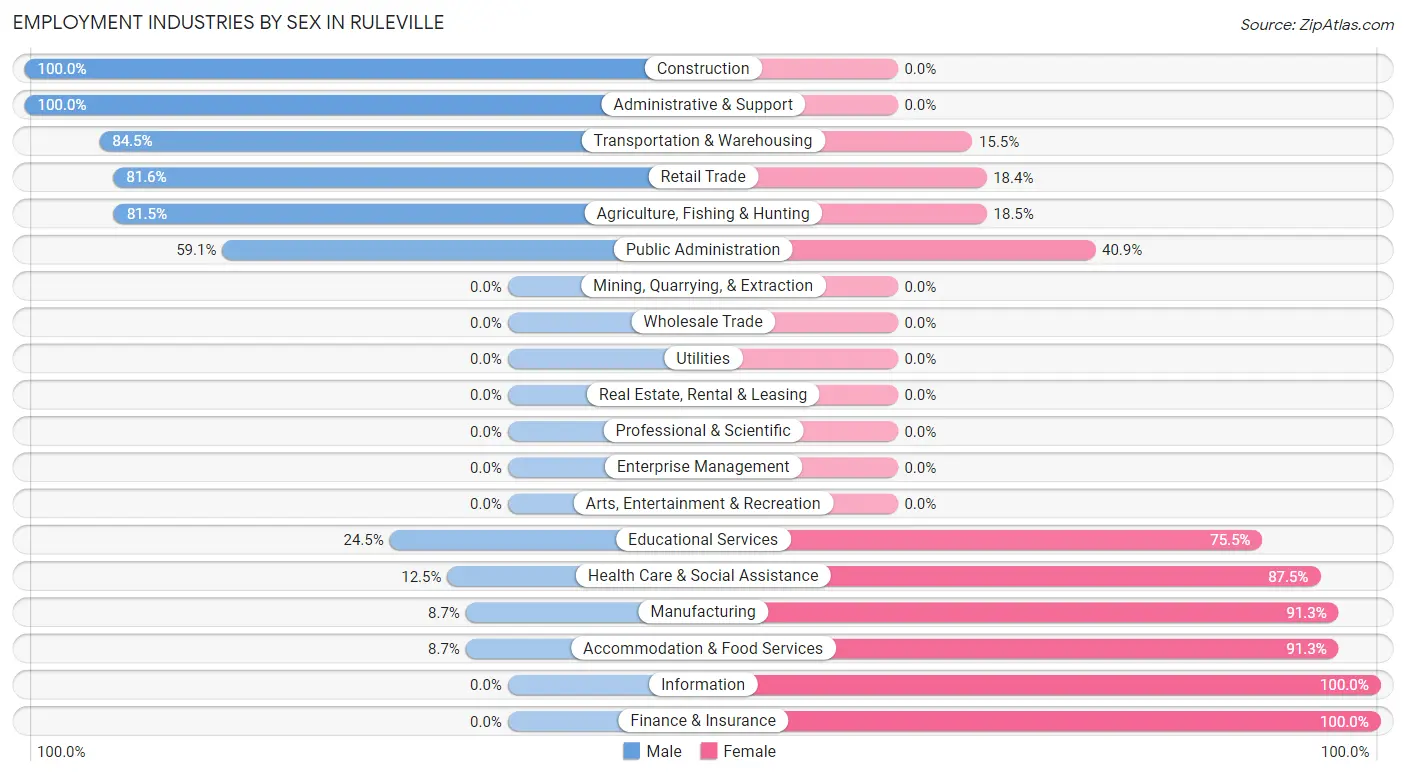
The Ruleville industries that see more men than women are Construction (100.0%), Administrative & Support (100.0%), and Transportation & Warehousing (84.5%), whereas the industries that tend to have a higher number of women are Information (100.0%), Finance & Insurance (100.0%), and Manufacturing (91.3%).
| Industry | Male | Female |
| Agriculture, Fishing & Hunting | 53 (81.5%) | 12 (18.5%) |
| Mining, Quarrying, & Extraction | 0 (0.0%) | 0 (0.0%) |
| Construction | 55 (100.0%) | 0 (0.0%) |
| Manufacturing | 4 (8.7%) | 42 (91.3%) |
| Wholesale Trade | 0 (0.0%) | 0 (0.0%) |
| Retail Trade | 151 (81.6%) | 34 (18.4%) |
| Transportation & Warehousing | 82 (84.5%) | 15 (15.5%) |
| Utilities | 0 (0.0%) | 0 (0.0%) |
| Information | 0 (0.0%) | 1 (100.0%) |
| Finance & Insurance | 0 (0.0%) | 13 (100.0%) |
| Real Estate, Rental & Leasing | 0 (0.0%) | 0 (0.0%) |
| Professional & Scientific | 0 (0.0%) | 0 (0.0%) |
| Enterprise Management | 0 (0.0%) | 0 (0.0%) |
| Administrative & Support | 7 (100.0%) | 0 (0.0%) |
| Educational Services | 34 (24.5%) | 105 (75.5%) |
| Health Care & Social Assistance | 29 (12.5%) | 203 (87.5%) |
| Arts, Entertainment & Recreation | 0 (0.0%) | 0 (0.0%) |
| Accommodation & Food Services | 6 (8.7%) | 63 (91.3%) |
| Public Administration | 65 (59.1%) | 45 (40.9%) |
| Total | 486 (47.7%) | 533 (52.3%) |
Education in Ruleville
School Enrollment in Ruleville
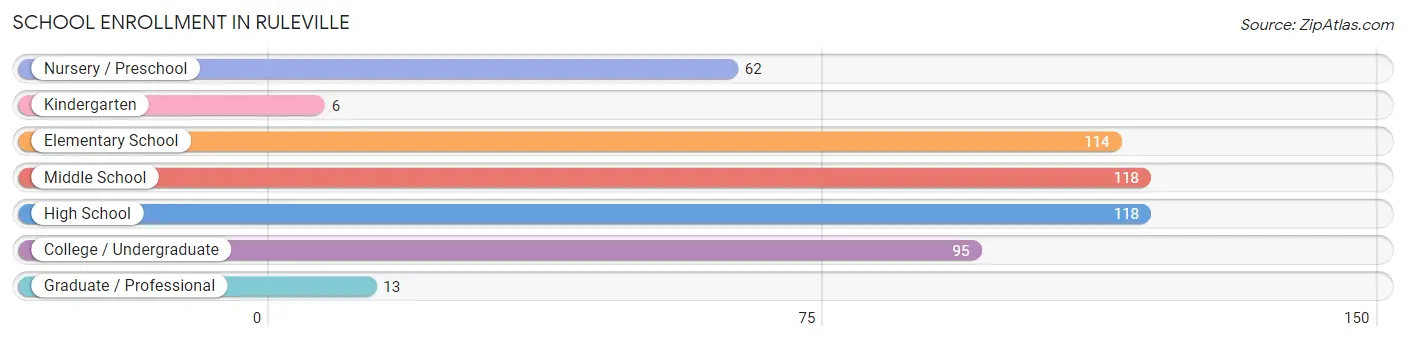
The most common levels of schooling among the 526 students in Ruleville are middle school (118 | 22.4%), high school (118 | 22.4%), and elementary school (114 | 21.7%).
| School Level | # Students | % Students |
| Nursery / Preschool | 62 | 11.8% |
| Kindergarten | 6 | 1.1% |
| Elementary School | 114 | 21.7% |
| Middle School | 118 | 22.4% |
| High School | 118 | 22.4% |
| College / Undergraduate | 95 | 18.1% |
| Graduate / Professional | 13 | 2.5% |
| Total | 526 | 100.0% |
School Enrollment by Age by Funding Source in Ruleville
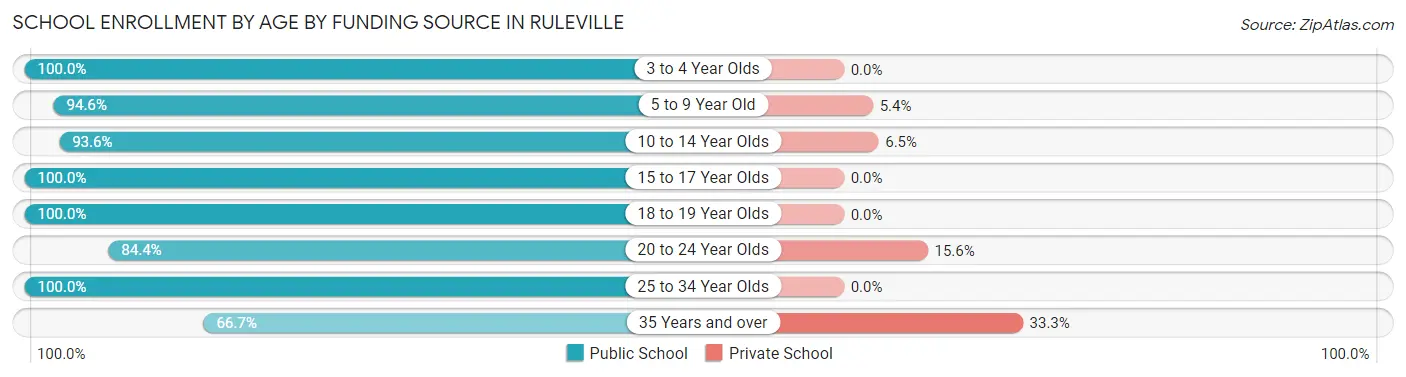
Out of a total of 526 students who are enrolled in schools in Ruleville, 39 (7.4%) attend a private institution, while the remaining 487 (92.6%) are enrolled in public schools. The age group of 35 years and over has the highest likelihood of being enrolled in private schools, with 13 (33.3% in the age bracket) enrolled. Conversely, the age group of 3 to 4 year olds has the lowest likelihood of being enrolled in a private school, with 46 (100.0% in the age bracket) attending a public institution.
| Age Bracket | Public School | Private School |
| 3 to 4 Year Olds | 46 (100.0%) | 0 (0.0%) |
| 5 to 9 Year Old | 105 (94.6%) | 6 (5.4%) |
| 10 to 14 Year Olds | 145 (93.5%) | 10 (6.5%) |
| 15 to 17 Year Olds | 48 (100.0%) | 0 (0.0%) |
| 18 to 19 Year Olds | 43 (100.0%) | 0 (0.0%) |
| 20 to 24 Year Olds | 54 (84.4%) | 10 (15.6%) |
| 25 to 34 Year Olds | 20 (100.0%) | 0 (0.0%) |
| 35 Years and over | 26 (66.7%) | 13 (33.3%) |
| Total | 487 (92.6%) | 39 (7.4%) |
Educational Attainment by Field of Study in Ruleville
Arts & humanities (61 | 21.9%), science & technology (55 | 19.8%), education (54 | 19.4%), business (46 | 16.6%), and social sciences (22 | 7.9%) are the most common fields of study among 278 individuals in Ruleville who have obtained a bachelor's degree or higher.
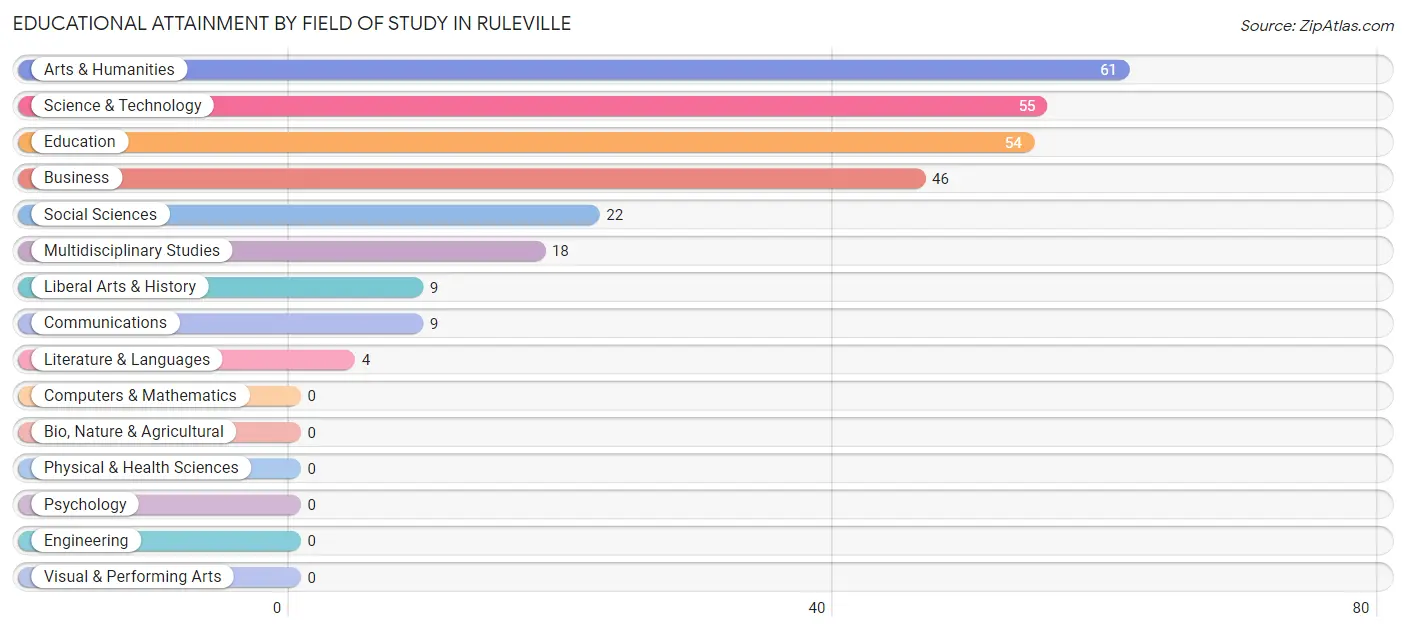
| Field of Study | # Graduates | % Graduates |
| Computers & Mathematics | 0 | 0.0% |
| Bio, Nature & Agricultural | 0 | 0.0% |
| Physical & Health Sciences | 0 | 0.0% |
| Psychology | 0 | 0.0% |
| Social Sciences | 22 | 7.9% |
| Engineering | 0 | 0.0% |
| Multidisciplinary Studies | 18 | 6.5% |
| Science & Technology | 55 | 19.8% |
| Business | 46 | 16.6% |
| Education | 54 | 19.4% |
| Literature & Languages | 4 | 1.4% |
| Liberal Arts & History | 9 | 3.2% |
| Visual & Performing Arts | 0 | 0.0% |
| Communications | 9 | 3.2% |
| Arts & Humanities | 61 | 21.9% |
| Total | 278 | 100.0% |
Transportation & Commute in Ruleville
Vehicle Availability by Sex in Ruleville
The most prevalent vehicle ownership categories in Ruleville are males with 5 or more vehicles (106, accounting for 22.4%) and females with 5 or more vehicles (26, making up 21.2%).
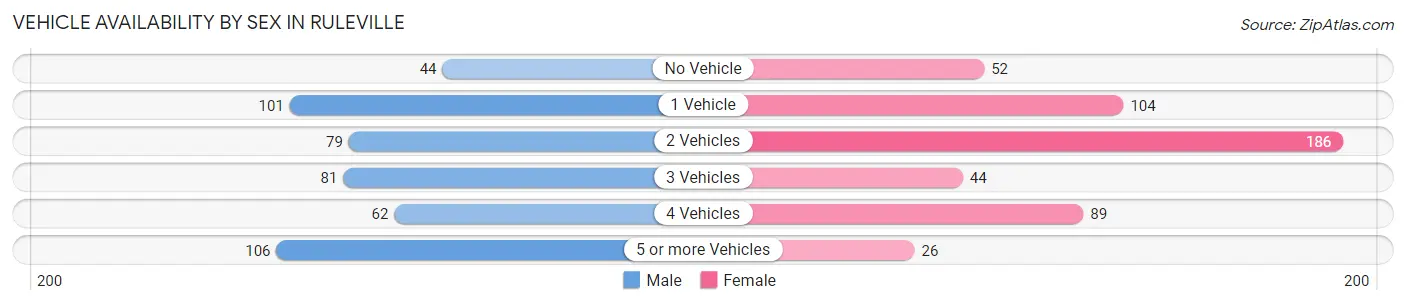
| Vehicles Available | Male | Female |
| No Vehicle | 44 (9.3%) | 52 (10.4%) |
| 1 Vehicle | 101 (21.3%) | 104 (20.8%) |
| 2 Vehicles | 79 (16.7%) | 186 (37.1%) |
| 3 Vehicles | 81 (17.1%) | 44 (8.8%) |
| 4 Vehicles | 62 (13.1%) | 89 (17.8%) |
| 5 or more Vehicles | 106 (22.4%) | 26 (5.2%) |
| Total | 473 (100.0%) | 501 (100.0%) |
Commute Time in Ruleville
The most frequently occuring commute durations in Ruleville are 5 to 9 minutes (227 commuters, 23.9%), 15 to 19 minutes (185 commuters, 19.5%), and 25 to 29 minutes (129 commuters, 13.6%).
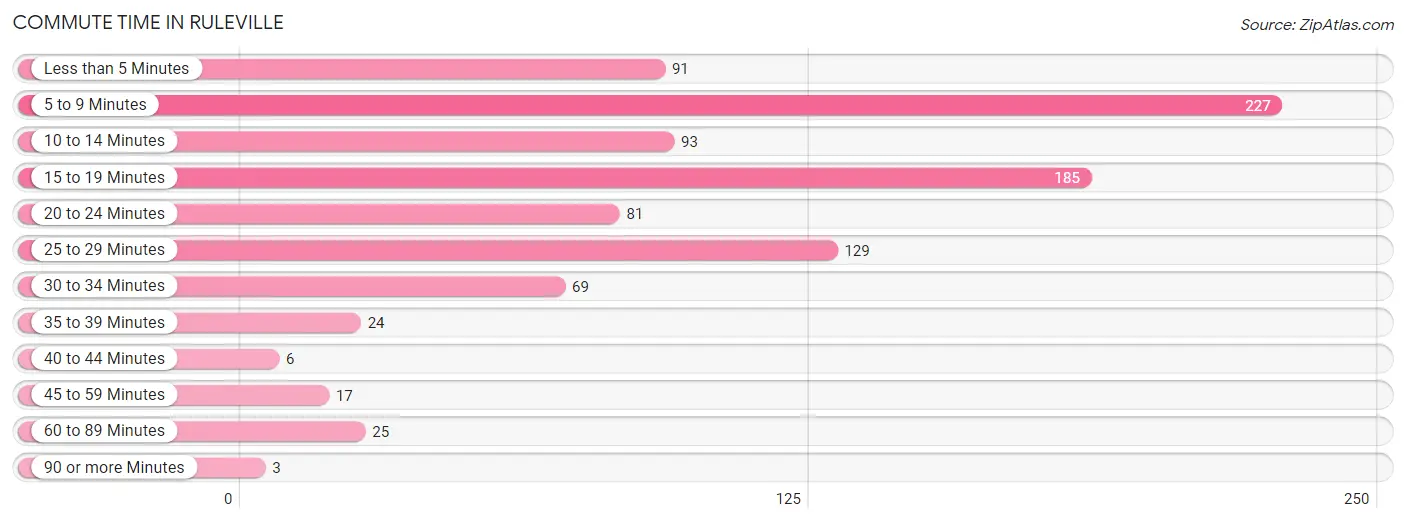
| Commute Time | # Commuters | % Commuters |
| Less than 5 Minutes | 91 | 9.6% |
| 5 to 9 Minutes | 227 | 23.9% |
| 10 to 14 Minutes | 93 | 9.8% |
| 15 to 19 Minutes | 185 | 19.5% |
| 20 to 24 Minutes | 81 | 8.5% |
| 25 to 29 Minutes | 129 | 13.6% |
| 30 to 34 Minutes | 69 | 7.3% |
| 35 to 39 Minutes | 24 | 2.5% |
| 40 to 44 Minutes | 6 | 0.6% |
| 45 to 59 Minutes | 17 | 1.8% |
| 60 to 89 Minutes | 25 | 2.6% |
| 90 or more Minutes | 3 | 0.3% |
Commute Time by Sex in Ruleville
The most common commute times in Ruleville are 5 to 9 minutes (114 commuters, 24.7%) for males and 5 to 9 minutes (113 commuters, 23.1%) for females.
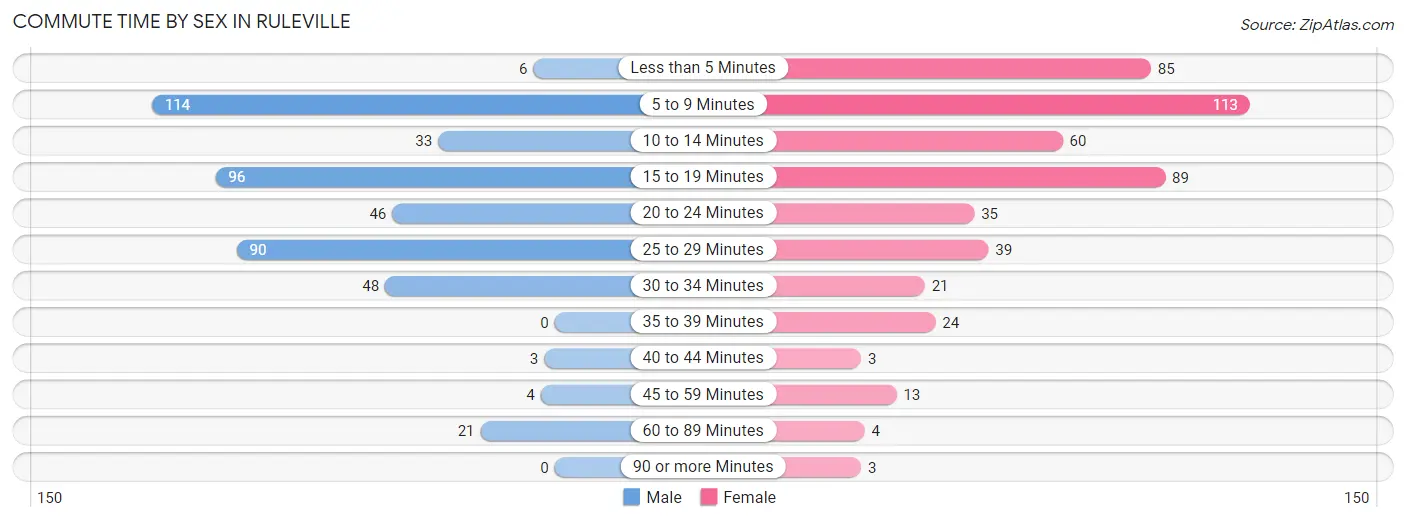
| Commute Time | Male | Female |
| Less than 5 Minutes | 6 (1.3%) | 85 (17.4%) |
| 5 to 9 Minutes | 114 (24.7%) | 113 (23.1%) |
| 10 to 14 Minutes | 33 (7.2%) | 60 (12.3%) |
| 15 to 19 Minutes | 96 (20.8%) | 89 (18.2%) |
| 20 to 24 Minutes | 46 (10.0%) | 35 (7.2%) |
| 25 to 29 Minutes | 90 (19.5%) | 39 (8.0%) |
| 30 to 34 Minutes | 48 (10.4%) | 21 (4.3%) |
| 35 to 39 Minutes | 0 (0.0%) | 24 (4.9%) |
| 40 to 44 Minutes | 3 (0.6%) | 3 (0.6%) |
| 45 to 59 Minutes | 4 (0.9%) | 13 (2.7%) |
| 60 to 89 Minutes | 21 (4.6%) | 4 (0.8%) |
| 90 or more Minutes | 0 (0.0%) | 3 (0.6%) |
Time of Departure to Work by Sex in Ruleville
The most frequent times of departure to work in Ruleville are 6:30 AM to 6:59 AM (117, 25.4%) for males and 7:30 AM to 7:59 AM (118, 24.1%) for females.
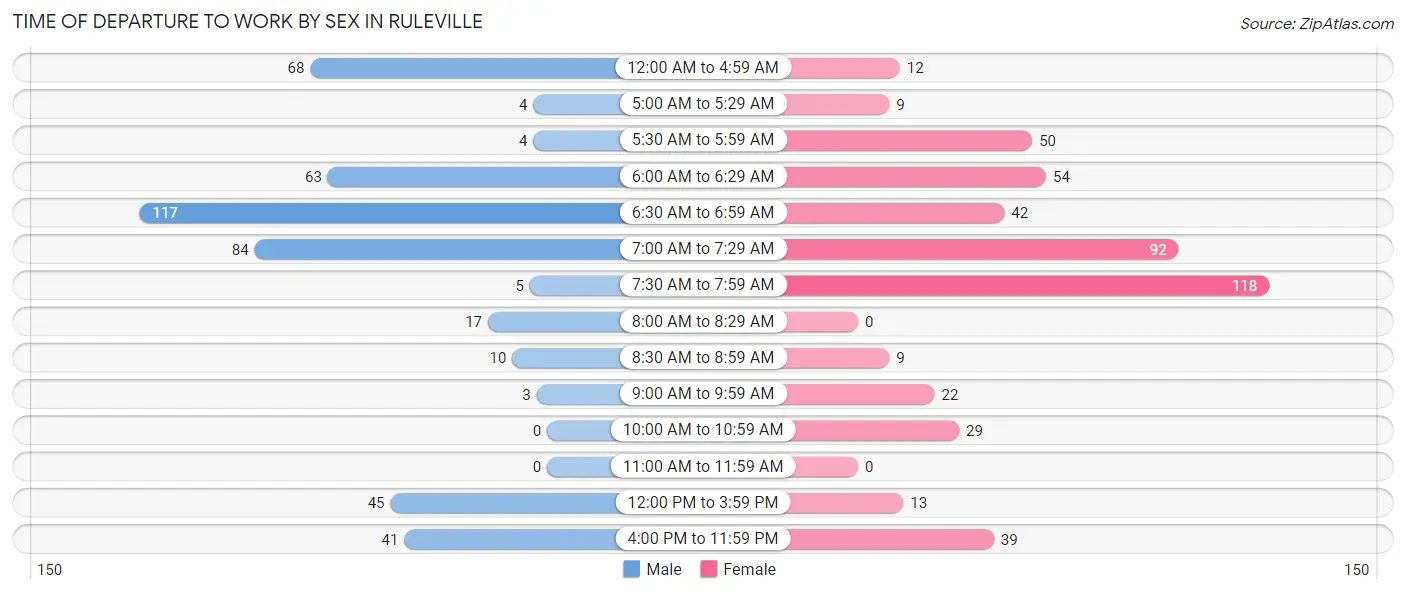
| Time of Departure | Male | Female |
| 12:00 AM to 4:59 AM | 68 (14.7%) | 12 (2.5%) |
| 5:00 AM to 5:29 AM | 4 (0.9%) | 9 (1.8%) |
| 5:30 AM to 5:59 AM | 4 (0.9%) | 50 (10.2%) |
| 6:00 AM to 6:29 AM | 63 (13.7%) | 54 (11.0%) |
| 6:30 AM to 6:59 AM | 117 (25.4%) | 42 (8.6%) |
| 7:00 AM to 7:29 AM | 84 (18.2%) | 92 (18.8%) |
| 7:30 AM to 7:59 AM | 5 (1.1%) | 118 (24.1%) |
| 8:00 AM to 8:29 AM | 17 (3.7%) | 0 (0.0%) |
| 8:30 AM to 8:59 AM | 10 (2.2%) | 9 (1.8%) |
| 9:00 AM to 9:59 AM | 3 (0.6%) | 22 (4.5%) |
| 10:00 AM to 10:59 AM | 0 (0.0%) | 29 (5.9%) |
| 11:00 AM to 11:59 AM | 0 (0.0%) | 0 (0.0%) |
| 12:00 PM to 3:59 PM | 45 (9.8%) | 13 (2.7%) |
| 4:00 PM to 11:59 PM | 41 (8.9%) | 39 (8.0%) |
| Total | 461 (100.0%) | 489 (100.0%) |
Housing Occupancy in Ruleville
Occupancy by Ownership in Ruleville
Of the total 736 dwellings in Ruleville, owner-occupied units account for 362 (49.2%), while renter-occupied units make up 374 (50.8%).
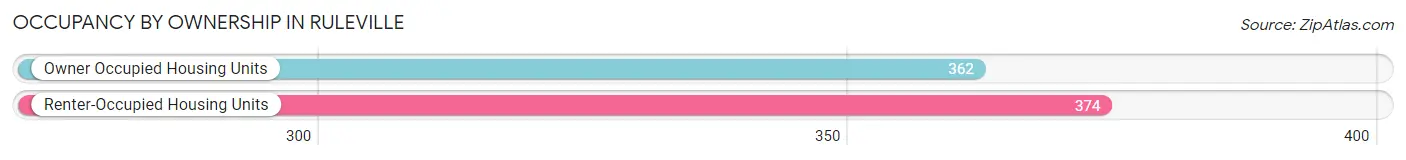
| Occupancy | # Housing Units | % Housing Units |
| Owner Occupied Housing Units | 362 | 49.2% |
| Renter-Occupied Housing Units | 374 | 50.8% |
| Total Occupied Housing Units | 736 | 100.0% |
Occupancy by Household Size in Ruleville
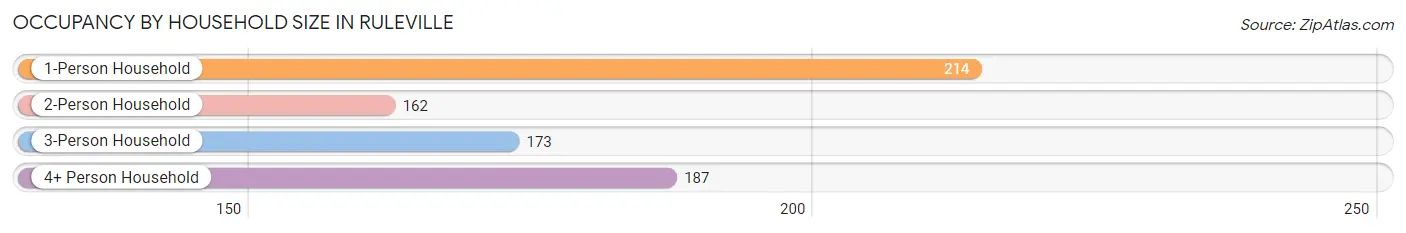
| Household Size | # Housing Units | % Housing Units |
| 1-Person Household | 214 | 29.1% |
| 2-Person Household | 162 | 22.0% |
| 3-Person Household | 173 | 23.5% |
| 4+ Person Household | 187 | 25.4% |
| Total Housing Units | 736 | 100.0% |
Occupancy by Ownership by Household Size in Ruleville
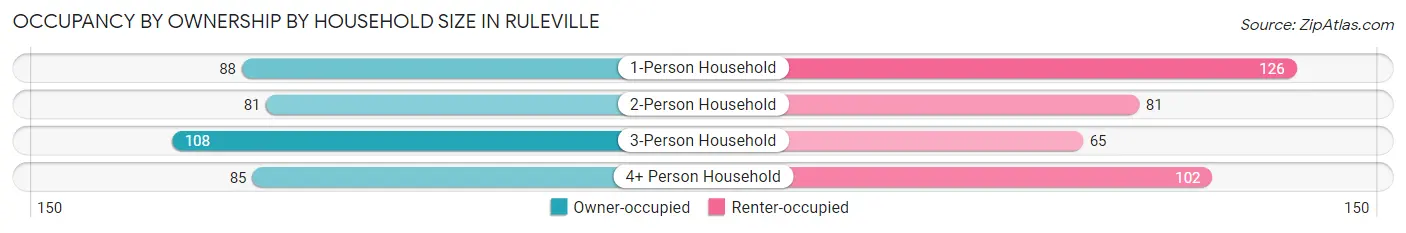
| Household Size | Owner-occupied | Renter-occupied |
| 1-Person Household | 88 (41.1%) | 126 (58.9%) |
| 2-Person Household | 81 (50.0%) | 81 (50.0%) |
| 3-Person Household | 108 (62.4%) | 65 (37.6%) |
| 4+ Person Household | 85 (45.5%) | 102 (54.5%) |
| Total Housing Units | 362 (49.2%) | 374 (50.8%) |
Occupancy by Educational Attainment in Ruleville
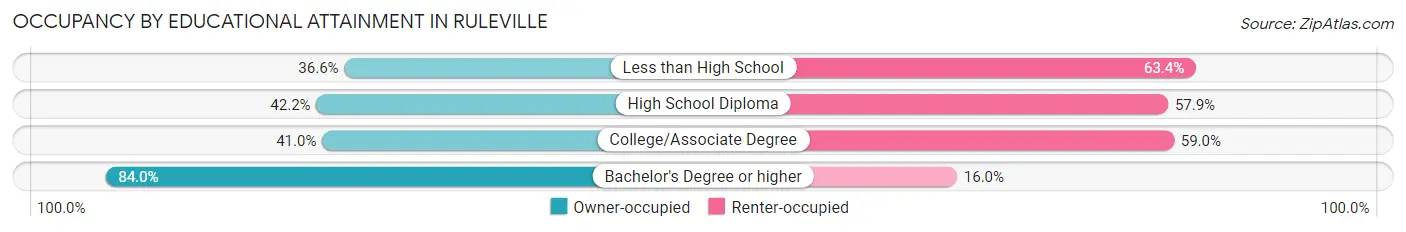
| Household Size | Owner-occupied | Renter-occupied |
| Less than High School | 60 (36.6%) | 104 (63.4%) |
| High School Diploma | 110 (42.1%) | 151 (57.9%) |
| College/Associate Degree | 66 (41.0%) | 95 (59.0%) |
| Bachelor's Degree or higher | 126 (84.0%) | 24 (16.0%) |
Occupancy by Age of Householder in Ruleville
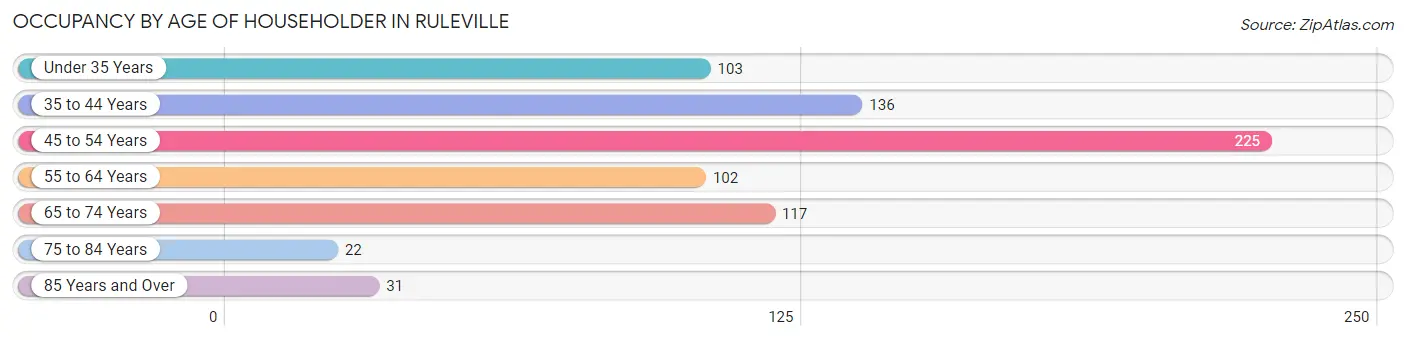
| Age Bracket | # Households | % Households |
| Under 35 Years | 103 | 14.0% |
| 35 to 44 Years | 136 | 18.5% |
| 45 to 54 Years | 225 | 30.6% |
| 55 to 64 Years | 102 | 13.9% |
| 65 to 74 Years | 117 | 15.9% |
| 75 to 84 Years | 22 | 3.0% |
| 85 Years and Over | 31 | 4.2% |
| Total | 736 | 100.0% |
Housing Finances in Ruleville
Median Income by Occupancy in Ruleville
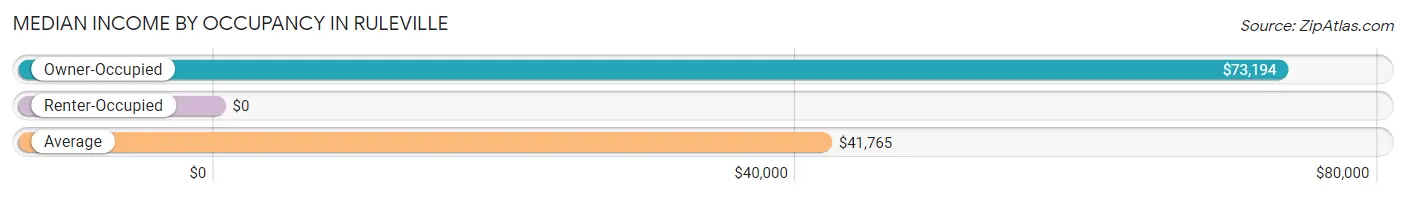
| Occupancy Type | # Households | Median Income |
| Owner-Occupied | 362 (49.2%) | $73,194 |
| Renter-Occupied | 374 (50.8%) | $0 |
| Average | 736 (100.0%) | $41,765 |
Occupancy by Householder Income Bracket in Ruleville
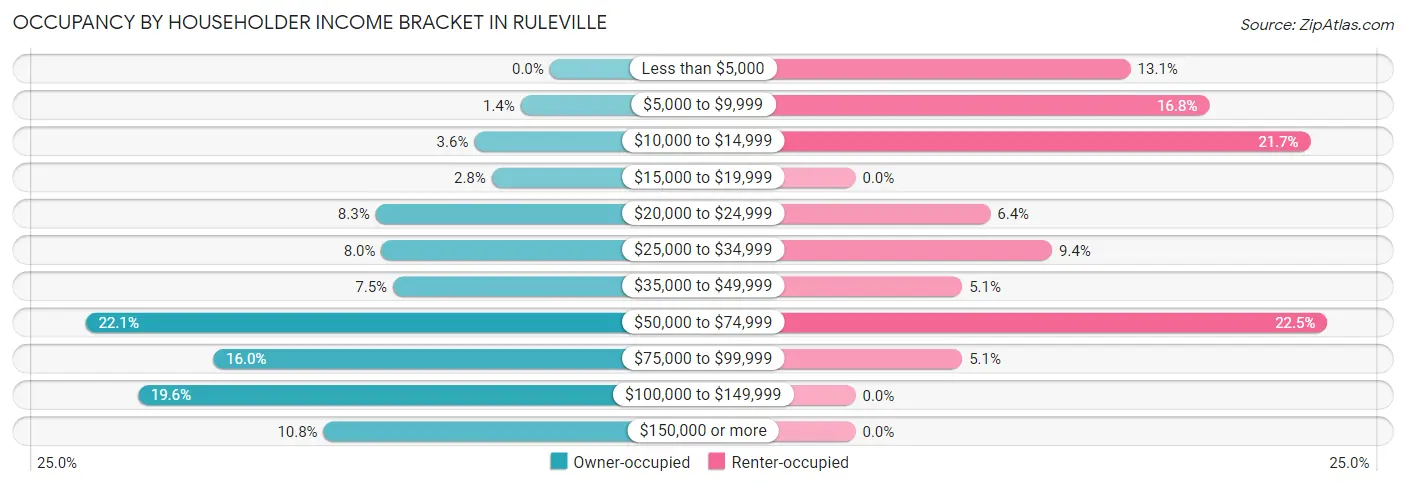
| Income Bracket | Owner-occupied | Renter-occupied |
| Less than $5,000 | 0 (0.0%) | 49 (13.1%) |
| $5,000 to $9,999 | 5 (1.4%) | 63 (16.8%) |
| $10,000 to $14,999 | 13 (3.6%) | 81 (21.7%) |
| $15,000 to $19,999 | 10 (2.8%) | 0 (0.0%) |
| $20,000 to $24,999 | 30 (8.3%) | 24 (6.4%) |
| $25,000 to $34,999 | 29 (8.0%) | 35 (9.4%) |
| $35,000 to $49,999 | 27 (7.5%) | 19 (5.1%) |
| $50,000 to $74,999 | 80 (22.1%) | 84 (22.5%) |
| $75,000 to $99,999 | 58 (16.0%) | 19 (5.1%) |
| $100,000 to $149,999 | 71 (19.6%) | 0 (0.0%) |
| $150,000 or more | 39 (10.8%) | 0 (0.0%) |
| Total | 362 (100.0%) | 374 (100.0%) |
Monthly Housing Cost Tiers in Ruleville
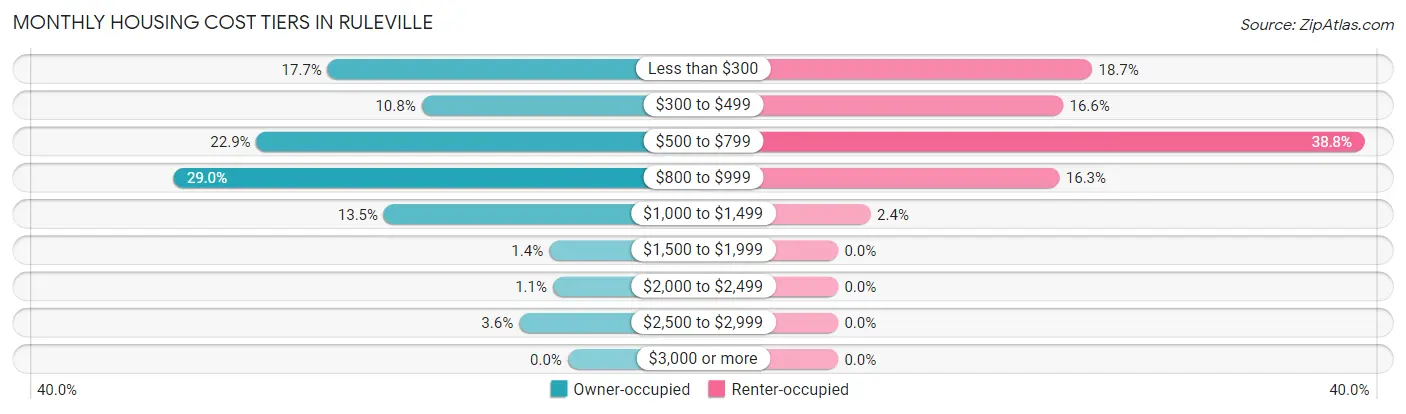
| Monthly Cost | Owner-occupied | Renter-occupied |
| Less than $300 | 64 (17.7%) | 70 (18.7%) |
| $300 to $499 | 39 (10.8%) | 62 (16.6%) |
| $500 to $799 | 83 (22.9%) | 145 (38.8%) |
| $800 to $999 | 105 (29.0%) | 61 (16.3%) |
| $1,000 to $1,499 | 49 (13.5%) | 9 (2.4%) |
| $1,500 to $1,999 | 5 (1.4%) | 0 (0.0%) |
| $2,000 to $2,499 | 4 (1.1%) | 0 (0.0%) |
| $2,500 to $2,999 | 13 (3.6%) | 0 (0.0%) |
| $3,000 or more | 0 (0.0%) | 0 (0.0%) |
| Total | 362 (100.0%) | 374 (100.0%) |
Physical Housing Characteristics in Ruleville
Housing Structures in Ruleville
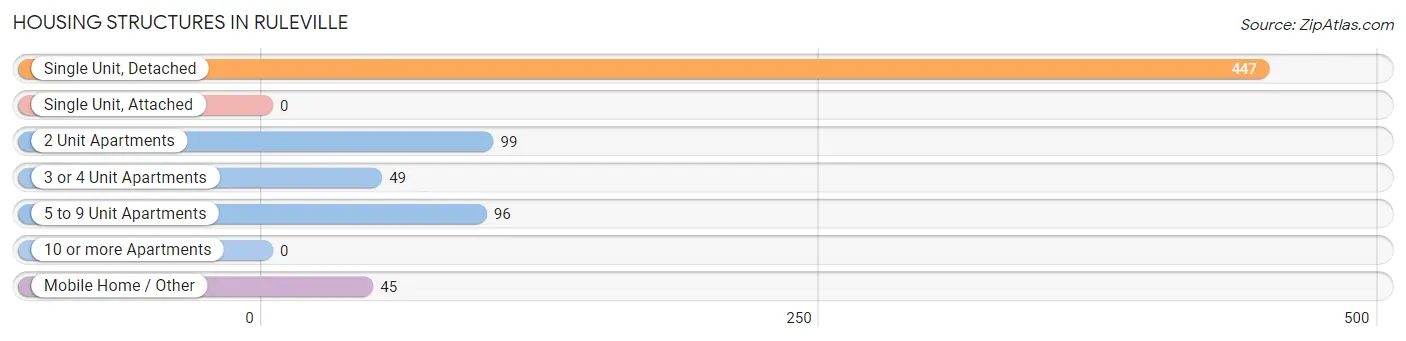
| Structure Type | # Housing Units | % Housing Units |
| Single Unit, Detached | 447 | 60.7% |
| Single Unit, Attached | 0 | 0.0% |
| 2 Unit Apartments | 99 | 13.5% |
| 3 or 4 Unit Apartments | 49 | 6.7% |
| 5 to 9 Unit Apartments | 96 | 13.0% |
| 10 or more Apartments | 0 | 0.0% |
| Mobile Home / Other | 45 | 6.1% |
| Total | 736 | 100.0% |
Housing Structures by Occupancy in Ruleville
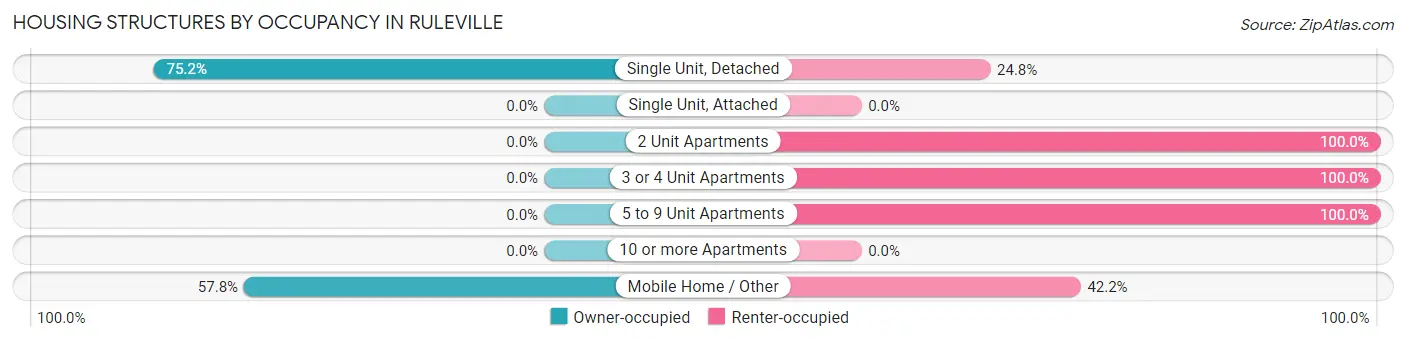
| Structure Type | Owner-occupied | Renter-occupied |
| Single Unit, Detached | 336 (75.2%) | 111 (24.8%) |
| Single Unit, Attached | 0 (0.0%) | 0 (0.0%) |
| 2 Unit Apartments | 0 (0.0%) | 99 (100.0%) |
| 3 or 4 Unit Apartments | 0 (0.0%) | 49 (100.0%) |
| 5 to 9 Unit Apartments | 0 (0.0%) | 96 (100.0%) |
| 10 or more Apartments | 0 (0.0%) | 0 (0.0%) |
| Mobile Home / Other | 26 (57.8%) | 19 (42.2%) |
| Total | 362 (49.2%) | 374 (50.8%) |
Housing Structures by Number of Rooms in Ruleville
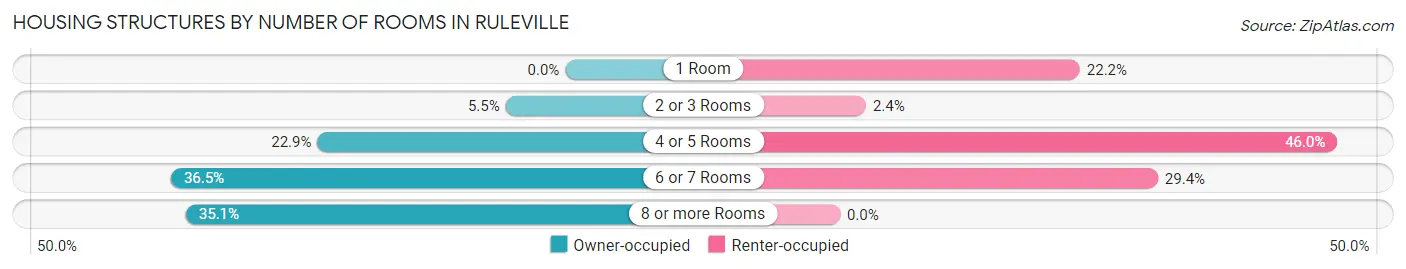
| Number of Rooms | Owner-occupied | Renter-occupied |
| 1 Room | 0 (0.0%) | 83 (22.2%) |
| 2 or 3 Rooms | 20 (5.5%) | 9 (2.4%) |
| 4 or 5 Rooms | 83 (22.9%) | 172 (46.0%) |
| 6 or 7 Rooms | 132 (36.5%) | 110 (29.4%) |
| 8 or more Rooms | 127 (35.1%) | 0 (0.0%) |
| Total | 362 (100.0%) | 374 (100.0%) |
Housing Structure by Heating Type in Ruleville
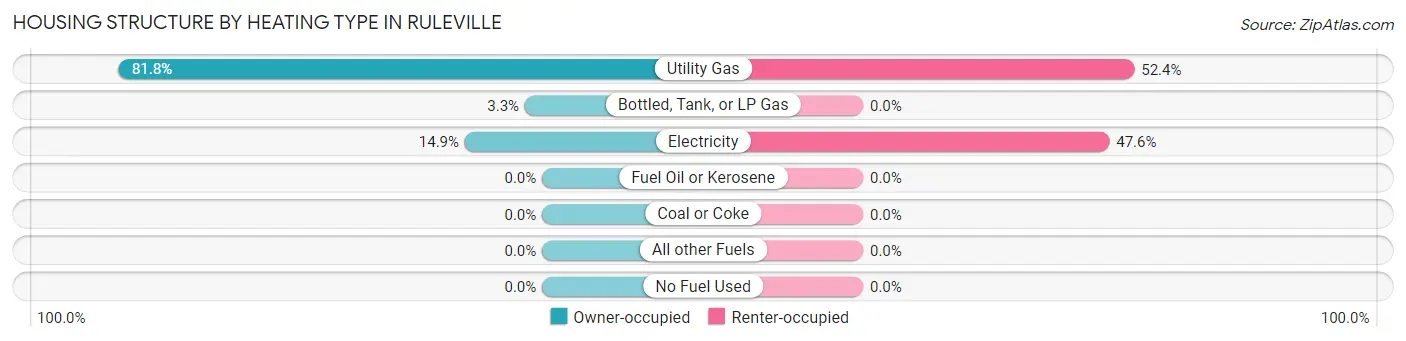
| Heating Type | Owner-occupied | Renter-occupied |
| Utility Gas | 296 (81.8%) | 196 (52.4%) |
| Bottled, Tank, or LP Gas | 12 (3.3%) | 0 (0.0%) |
| Electricity | 54 (14.9%) | 178 (47.6%) |
| Fuel Oil or Kerosene | 0 (0.0%) | 0 (0.0%) |
| Coal or Coke | 0 (0.0%) | 0 (0.0%) |
| All other Fuels | 0 (0.0%) | 0 (0.0%) |
| No Fuel Used | 0 (0.0%) | 0 (0.0%) |
| Total | 362 (100.0%) | 374 (100.0%) |
Household Vehicle Usage in Ruleville
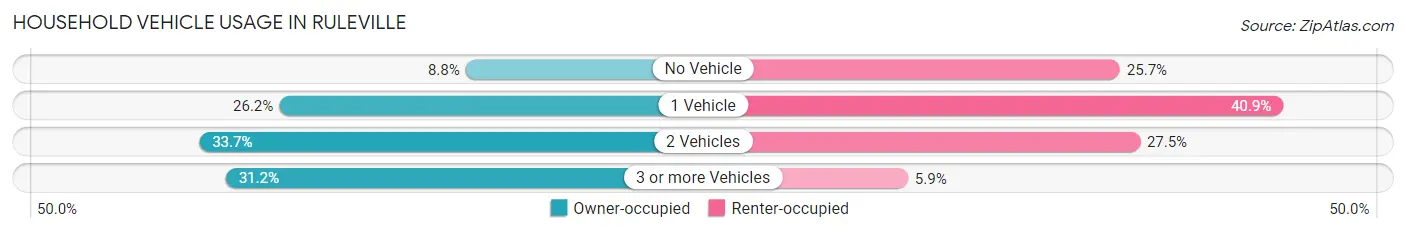
| Vehicles per Household | Owner-occupied | Renter-occupied |
| No Vehicle | 32 (8.8%) | 96 (25.7%) |
| 1 Vehicle | 95 (26.2%) | 153 (40.9%) |
| 2 Vehicles | 122 (33.7%) | 103 (27.5%) |
| 3 or more Vehicles | 113 (31.2%) | 22 (5.9%) |
| Total | 362 (100.0%) | 374 (100.0%) |
Real Estate & Mortgages in Ruleville
Real Estate and Mortgage Overview in Ruleville
| Characteristic | Without Mortgage | With Mortgage |
| Housing Units | 158 | 204 |
| Median Property Value | $76,500 | $94,800 |
| Median Household Income | $40,714 | $27 |
| Monthly Housing Costs | $416 | $0 |
| Real Estate Taxes | - | - |
Property Value by Mortgage Status in Ruleville
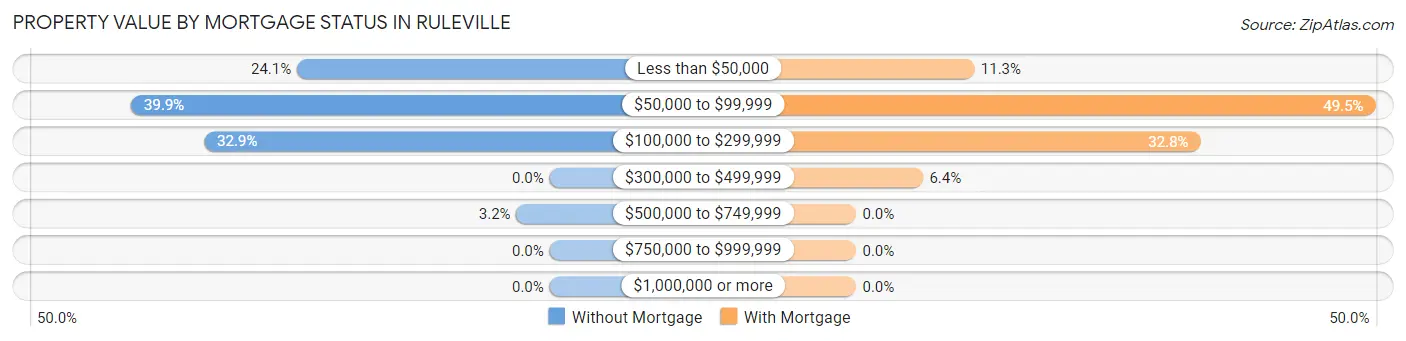
| Property Value | Without Mortgage | With Mortgage |
| Less than $50,000 | 38 (24.0%) | 23 (11.3%) |
| $50,000 to $99,999 | 63 (39.9%) | 101 (49.5%) |
| $100,000 to $299,999 | 52 (32.9%) | 67 (32.8%) |
| $300,000 to $499,999 | 0 (0.0%) | 13 (6.4%) |
| $500,000 to $749,999 | 5 (3.2%) | 0 (0.0%) |
| $750,000 to $999,999 | 0 (0.0%) | 0 (0.0%) |
| $1,000,000 or more | 0 (0.0%) | 0 (0.0%) |
| Total | 158 (100.0%) | 204 (100.0%) |
Household Income by Mortgage Status in Ruleville
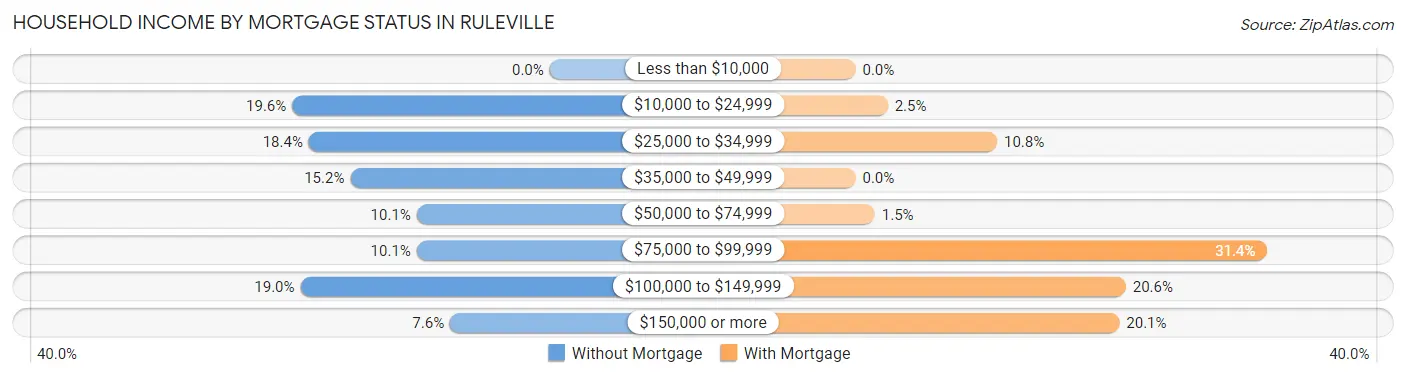
| Household Income | Without Mortgage | With Mortgage |
| Less than $10,000 | 0 (0.0%) | 0 (0.0%) |
| $10,000 to $24,999 | 31 (19.6%) | 5 (2.5%) |
| $25,000 to $34,999 | 29 (18.3%) | 22 (10.8%) |
| $35,000 to $49,999 | 24 (15.2%) | 0 (0.0%) |
| $50,000 to $74,999 | 16 (10.1%) | 3 (1.5%) |
| $75,000 to $99,999 | 16 (10.1%) | 64 (31.4%) |
| $100,000 to $149,999 | 30 (19.0%) | 42 (20.6%) |
| $150,000 or more | 12 (7.6%) | 41 (20.1%) |
| Total | 158 (100.0%) | 204 (100.0%) |
Property Value to Household Income Ratio in Ruleville
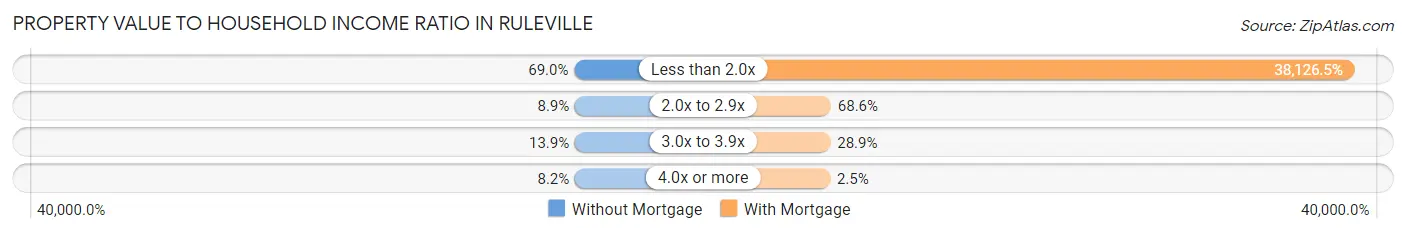
| Value-to-Income Ratio | Without Mortgage | With Mortgage |
| Less than 2.0x | 109 (69.0%) | 77,778 (38,126.5%) |
| 2.0x to 2.9x | 14 (8.9%) | 140 (68.6%) |
| 3.0x to 3.9x | 22 (13.9%) | 59 (28.9%) |
| 4.0x or more | 13 (8.2%) | 5 (2.5%) |
| Total | 158 (100.0%) | 204 (100.0%) |
Real Estate Taxes by Mortgage Status in Ruleville
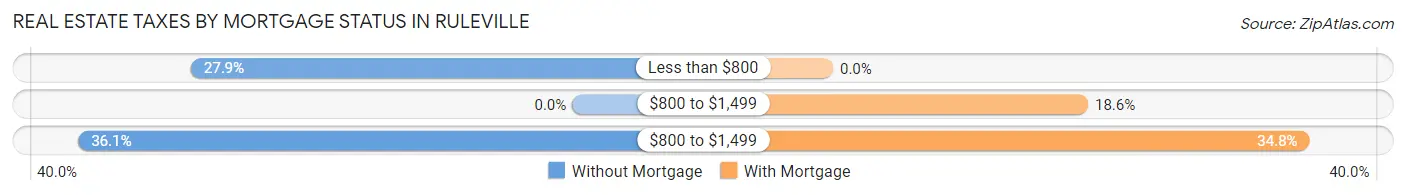
| Property Taxes | Without Mortgage | With Mortgage |
| Less than $800 | 44 (27.9%) | 0 (0.0%) |
| $800 to $1,499 | 0 (0.0%) | 38 (18.6%) |
| $800 to $1,499 | 57 (36.1%) | 71 (34.8%) |
| Total | 158 (100.0%) | 204 (100.0%) |
Health & Disability in Ruleville
Health Insurance Coverage by Age in Ruleville
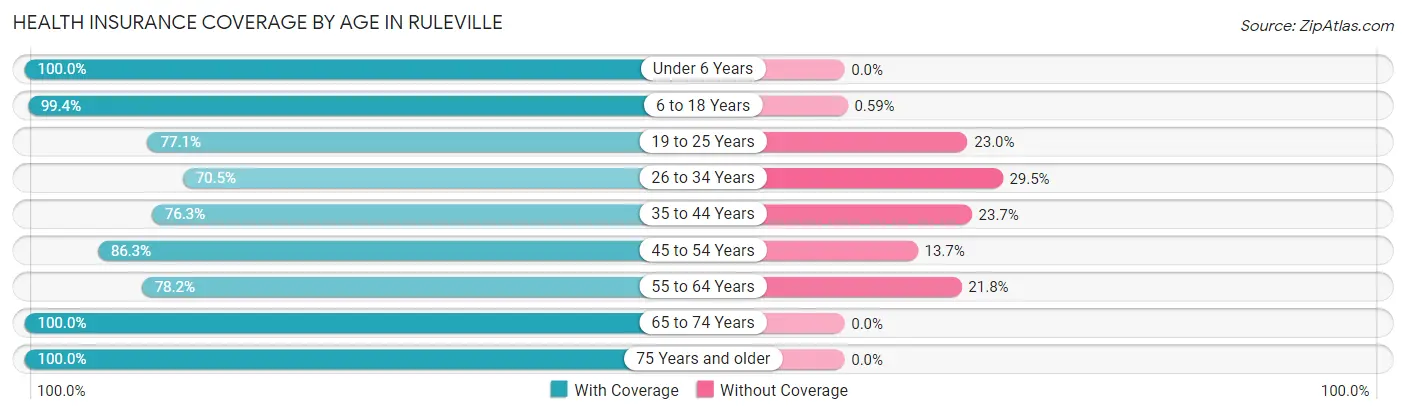
| Age Bracket | With Coverage | Without Coverage |
| Under 6 Years | 224 (100.0%) | 0 (0.0%) |
| 6 to 18 Years | 339 (99.4%) | 2 (0.6%) |
| 19 to 25 Years | 319 (77.0%) | 95 (23.0%) |
| 26 to 34 Years | 318 (70.5%) | 133 (29.5%) |
| 35 to 44 Years | 196 (76.3%) | 61 (23.7%) |
| 45 to 54 Years | 278 (86.3%) | 44 (13.7%) |
| 55 to 64 Years | 136 (78.2%) | 38 (21.8%) |
| 65 to 74 Years | 154 (100.0%) | 0 (0.0%) |
| 75 Years and older | 54 (100.0%) | 0 (0.0%) |
| Total | 2,018 (84.4%) | 373 (15.6%) |
Health Insurance Coverage by Citizenship Status in Ruleville
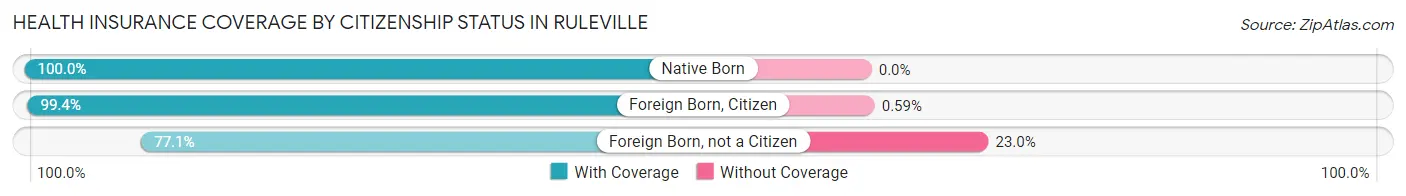
| Citizenship Status | With Coverage | Without Coverage |
| Native Born | 224 (100.0%) | 0 (0.0%) |
| Foreign Born, Citizen | 339 (99.4%) | 2 (0.6%) |
| Foreign Born, not a Citizen | 319 (77.0%) | 95 (23.0%) |
Health Insurance Coverage by Household Income in Ruleville
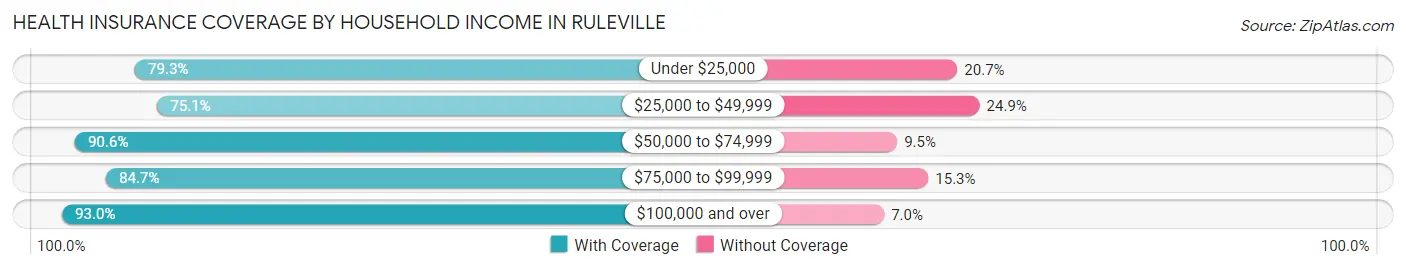
| Household Income | With Coverage | Without Coverage |
| Under $25,000 | 463 (79.3%) | 121 (20.7%) |
| $25,000 to $49,999 | 338 (75.1%) | 112 (24.9%) |
| $50,000 to $74,999 | 479 (90.5%) | 50 (9.5%) |
| $75,000 to $99,999 | 327 (84.7%) | 59 (15.3%) |
| $100,000 and over | 411 (93.0%) | 31 (7.0%) |
Public vs Private Health Insurance Coverage by Age in Ruleville
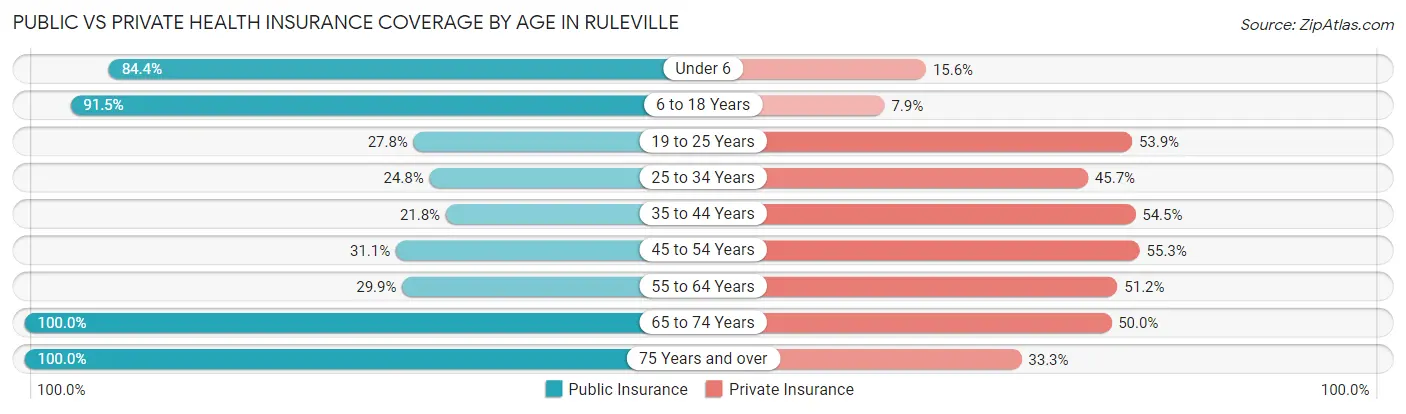
| Age Bracket | Public Insurance | Private Insurance |
| Under 6 | 189 (84.4%) | 35 (15.6%) |
| 6 to 18 Years | 312 (91.5%) | 27 (7.9%) |
| 19 to 25 Years | 115 (27.8%) | 223 (53.9%) |
| 25 to 34 Years | 112 (24.8%) | 206 (45.7%) |
| 35 to 44 Years | 56 (21.8%) | 140 (54.5%) |
| 45 to 54 Years | 100 (31.1%) | 178 (55.3%) |
| 55 to 64 Years | 52 (29.9%) | 89 (51.1%) |
| 65 to 74 Years | 154 (100.0%) | 77 (50.0%) |
| 75 Years and over | 54 (100.0%) | 18 (33.3%) |
| Total | 1,144 (47.8%) | 993 (41.5%) |
Disability Status by Sex by Age in Ruleville
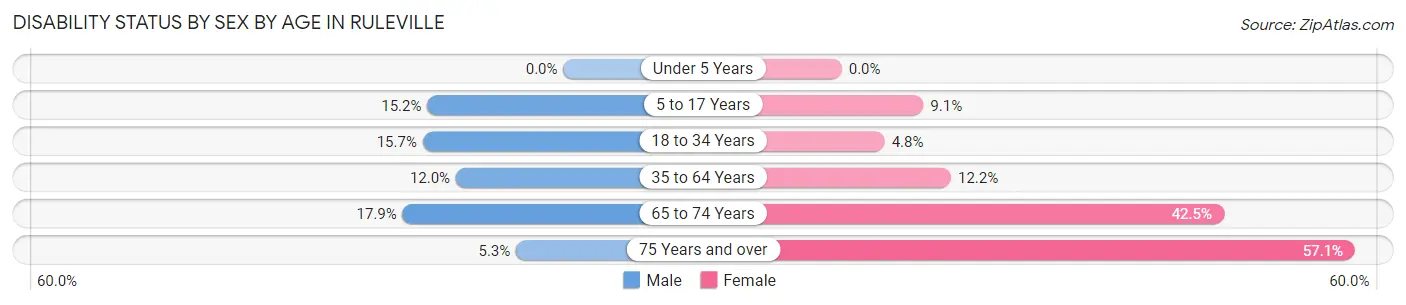
| Age Bracket | Male | Female |
| Under 5 Years | 0 (0.0%) | 0 (0.0%) |
| 5 to 17 Years | 15 (15.1%) | 22 (9.1%) |
| 18 to 34 Years | 93 (15.7%) | 15 (4.8%) |
| 35 to 64 Years | 36 (12.0%) | 55 (12.2%) |
| 65 to 74 Years | 12 (17.9%) | 37 (42.5%) |
| 75 Years and over | 1 (5.3%) | 20 (57.1%) |
Disability Class by Sex by Age in Ruleville
Disability Class: Hearing Difficulty
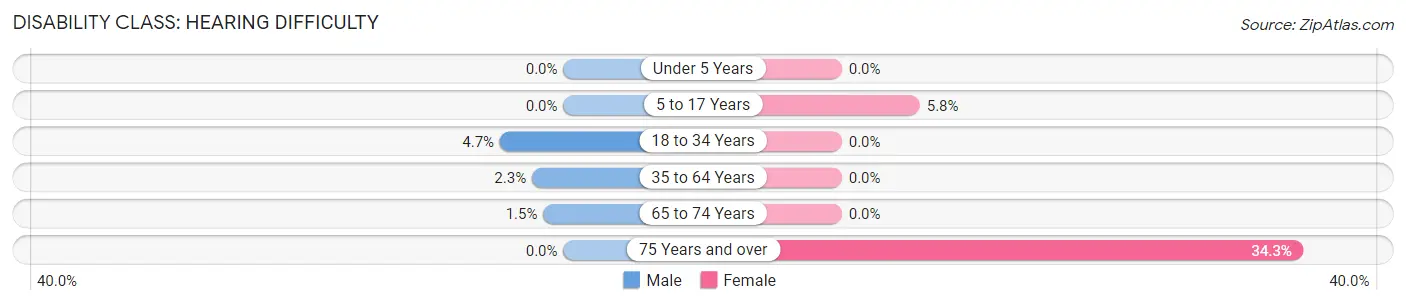
| Age Bracket | Male | Female |
| Under 5 Years | 0 (0.0%) | 0 (0.0%) |
| 5 to 17 Years | 0 (0.0%) | 14 (5.8%) |
| 18 to 34 Years | 28 (4.7%) | 0 (0.0%) |
| 35 to 64 Years | 7 (2.3%) | 0 (0.0%) |
| 65 to 74 Years | 1 (1.5%) | 0 (0.0%) |
| 75 Years and over | 0 (0.0%) | 12 (34.3%) |
Disability Class: Vision Difficulty
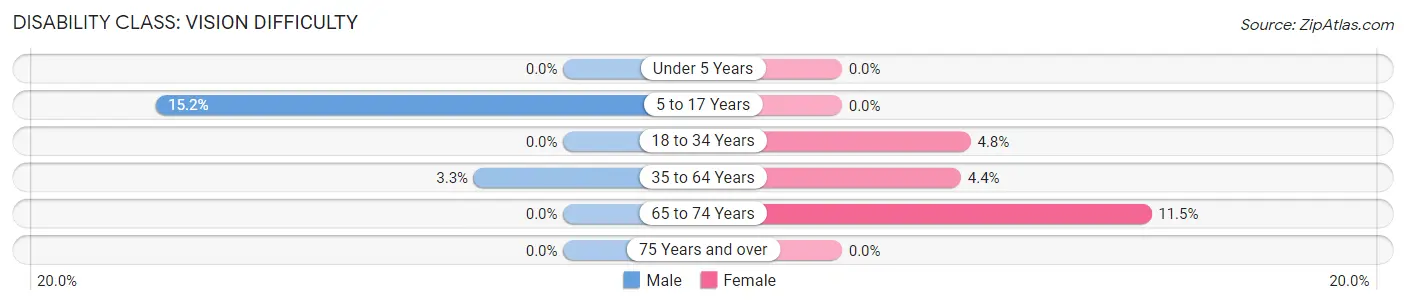
| Age Bracket | Male | Female |
| Under 5 Years | 0 (0.0%) | 0 (0.0%) |
| 5 to 17 Years | 15 (15.1%) | 0 (0.0%) |
| 18 to 34 Years | 0 (0.0%) | 15 (4.8%) |
| 35 to 64 Years | 10 (3.3%) | 20 (4.4%) |
| 65 to 74 Years | 0 (0.0%) | 10 (11.5%) |
| 75 Years and over | 0 (0.0%) | 0 (0.0%) |
Disability Class: Cognitive Difficulty
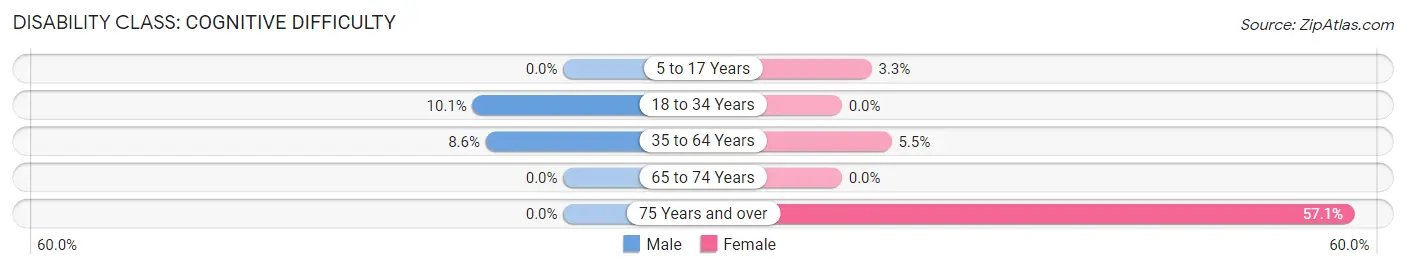
| Age Bracket | Male | Female |
| 5 to 17 Years | 0 (0.0%) | 8 (3.3%) |
| 18 to 34 Years | 60 (10.1%) | 0 (0.0%) |
| 35 to 64 Years | 26 (8.6%) | 25 (5.5%) |
| 65 to 74 Years | 0 (0.0%) | 0 (0.0%) |
| 75 Years and over | 0 (0.0%) | 20 (57.1%) |
Disability Class: Ambulatory Difficulty
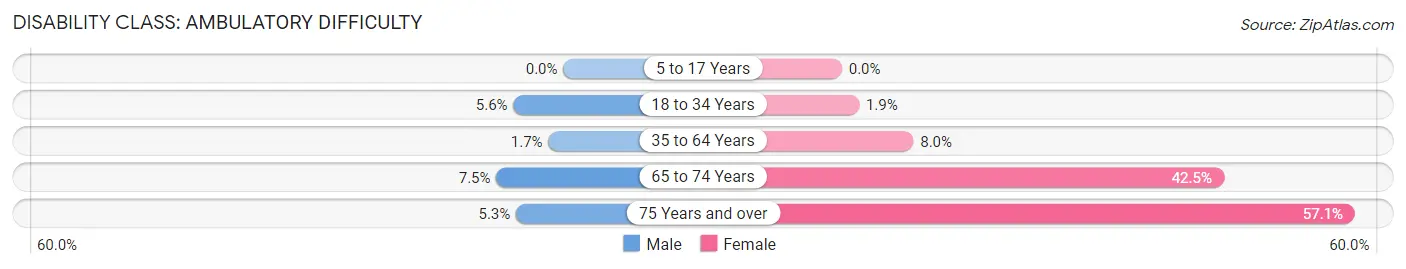
| Age Bracket | Male | Female |
| 5 to 17 Years | 0 (0.0%) | 0 (0.0%) |
| 18 to 34 Years | 33 (5.6%) | 6 (1.9%) |
| 35 to 64 Years | 5 (1.7%) | 36 (8.0%) |
| 65 to 74 Years | 5 (7.5%) | 37 (42.5%) |
| 75 Years and over | 1 (5.3%) | 20 (57.1%) |
Disability Class: Self-Care Difficulty
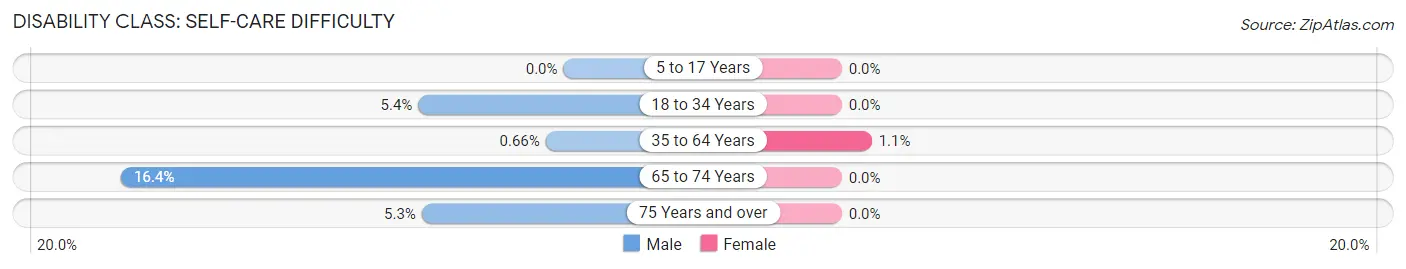
| Age Bracket | Male | Female |
| 5 to 17 Years | 0 (0.0%) | 0 (0.0%) |
| 18 to 34 Years | 32 (5.4%) | 0 (0.0%) |
| 35 to 64 Years | 2 (0.7%) | 5 (1.1%) |
| 65 to 74 Years | 11 (16.4%) | 0 (0.0%) |
| 75 Years and over | 1 (5.3%) | 0 (0.0%) |
Technology Access in Ruleville
Computing Device Access in Ruleville
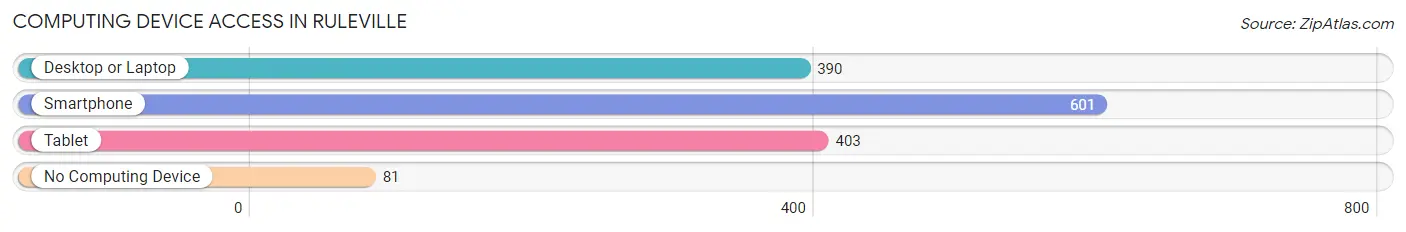
| Device Type | # Households | % Households |
| Desktop or Laptop | 390 | 53.0% |
| Smartphone | 601 | 81.7% |
| Tablet | 403 | 54.8% |
| No Computing Device | 81 | 11.0% |
| Total | 736 | 100.0% |
Internet Access in Ruleville
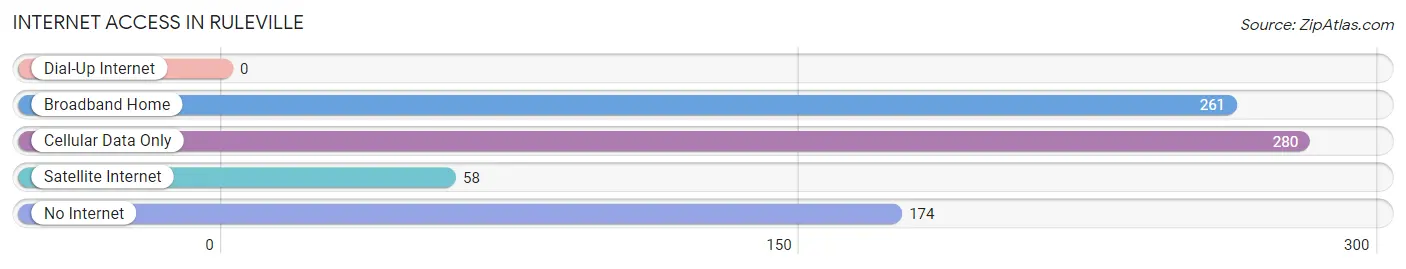
| Internet Type | # Households | % Households |
| Dial-Up Internet | 0 | 0.0% |
| Broadband Home | 261 | 35.5% |
| Cellular Data Only | 280 | 38.0% |
| Satellite Internet | 58 | 7.9% |
| No Internet | 174 | 23.6% |
| Total | 736 | 100.0% |
Ruleville Summary
History
Ruleville, Mississippi is a small city located in Sunflower County in the Mississippi Delta region. It was founded in 1885 by William Henry Rule, a former Confederate soldier, and was named after him. The city was incorporated in 1891 and has a population of approximately 4,500 people.
Ruleville has a long and rich history. It was a major center of the civil rights movement in the 1960s, and was the birthplace of Fannie Lou Hamer, a civil rights activist and leader of the Mississippi Freedom Democratic Party. In 1964, Hamer and other activists organized the Freedom Summer project, which aimed to register African-American voters in the state. The project was met with resistance from local white supremacists, and Hamer was arrested and beaten while in jail.
The city was also the site of the first Freedom School, which was established in 1964 to provide educational opportunities for African-American students. The school was closed in 1969, but its legacy lives on in the form of the Fannie Lou Hamer Freedom School, which was established in 2004.
Geography
Ruleville is located in the Mississippi Delta region, which is a flat, alluvial plain that stretches from the Yazoo River in the north to the Mississippi River in the south. The city is situated on the banks of the Sunflower River, which flows through the city and is a major source of water for the area.
The city has a humid subtropical climate, with hot, humid summers and mild winters. The average annual temperature is around 70°F (21°C), and the average annual precipitation is around 50 inches (127 cm).
Economy
The economy of Ruleville is largely based on agriculture. The city is home to several large farms, and the surrounding area is known for its cotton production. Other crops grown in the area include corn, soybeans, and rice.
The city is also home to several manufacturing companies, including a furniture factory, a paper mill, and a plastics plant. The city is also home to a number of small businesses, including restaurants, retail stores, and service providers.
Demographics
As of the 2010 census, the population of Ruleville was 4,541. The racial makeup of the city was 57.3% African American, 40.2% White, 0.3% Native American, 0.2% Asian, 0.1% Pacific Islander, 0.7% from other races, and 1.4% from two or more races. Hispanic or Latino of any race were 1.7% of the population.
The median household income in Ruleville was $25,938, and the median family income was $31,250. The per capita income for the city was $14,845. About 24.3% of families and 28.2% of the population were below the poverty line, including 37.2% of those under age 18 and 22.2% of those age 65 or over.
Common Questions
What is Per Capita Income in Ruleville?
Per Capita income in Ruleville is $20,022.
What is the Median Family Income in Ruleville?
Median Family Income in Ruleville is $44,519.
What is the Median Household income in Ruleville?
Median Household Income in Ruleville is $41,765.
What is Income or Wage Gap in Ruleville?
Income or Wage Gap in Ruleville is 0.6%.
Women in Ruleville earn 99.4 cents for every dollar earned by a man.
What is Inequality or Gini Index in Ruleville?
Inequality or Gini Index in Ruleville is 0.55.
What is the Total Population of Ruleville?
Total Population of Ruleville is 2,633.
What is the Total Male Population of Ruleville?
Total Male Population of Ruleville is 1,278.
What is the Total Female Population of Ruleville?
Total Female Population of Ruleville is 1,355.
What is the Ratio of Males per 100 Females in Ruleville?
There are 94.32 Males per 100 Females in Ruleville.
What is the Ratio of Females per 100 Males in Ruleville?
There are 106.03 Females per 100 Males in Ruleville.
What is the Median Population Age in Ruleville?
Median Population Age in Ruleville is 31.3 Years.
What is the Average Family Size in Ruleville
Average Family Size in Ruleville is 4.1 People.
What is the Average Household Size in Ruleville
Average Household Size in Ruleville is 3.2 People.
How Large is the Labor Force in Ruleville?
There are 1,244 People in the Labor Forcein in Ruleville.
What is the Percentage of People in the Labor Force in Ruleville?
57.9% of People are in the Labor Force in Ruleville.
What is the Unemployment Rate in Ruleville?
Unemployment Rate in Ruleville is 18.1%.