Itta Bena, MS Map & Demographics
Itta Bena Map
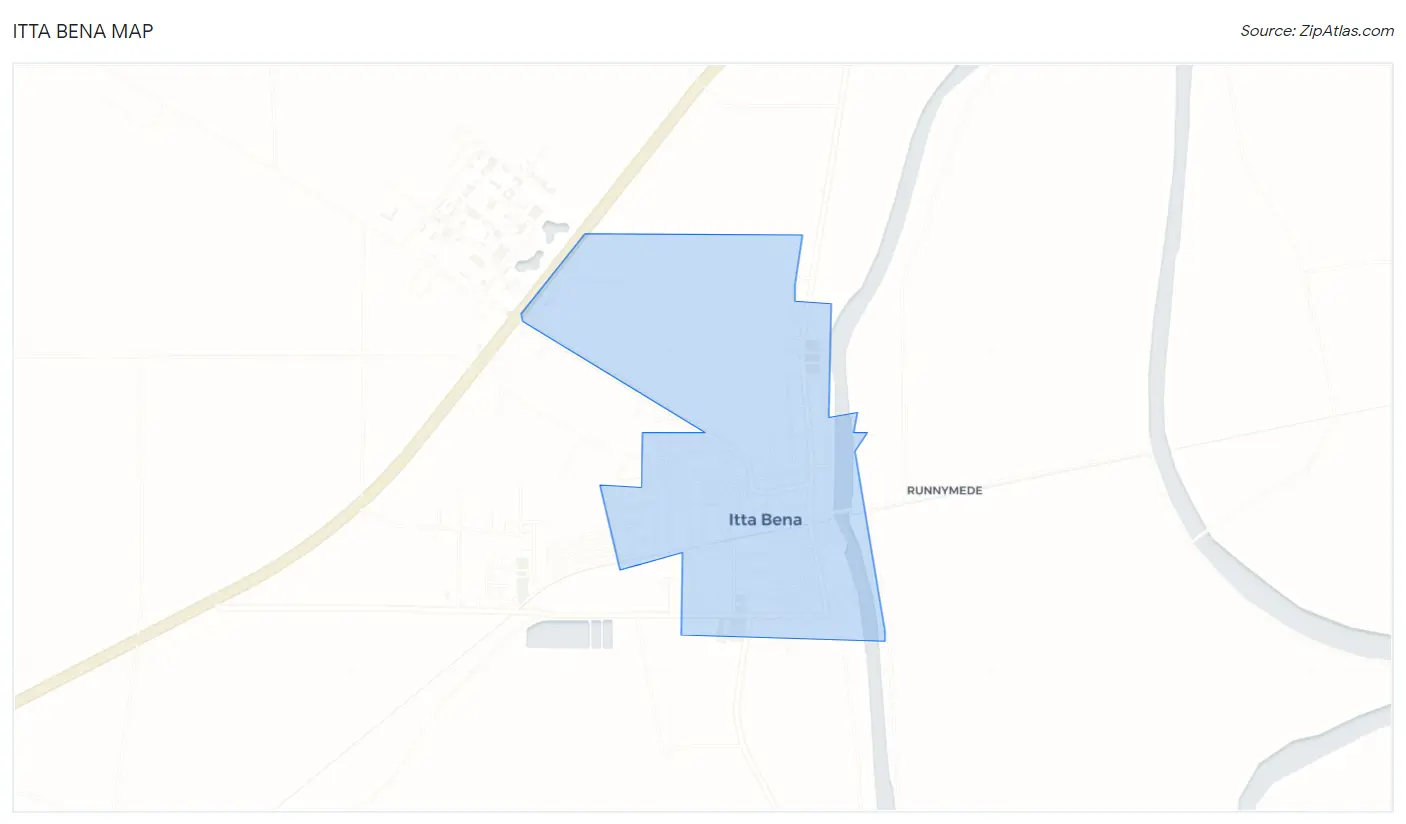
Itta Bena Overview
$13,923
PER CAPITA INCOME
$33,895
AVG FAMILY INCOME
$25,114
AVG HOUSEHOLD INCOME
0.47
INEQUALITY / GINI INDEX
1,532
TOTAL POPULATION
685
MALE POPULATION
847
FEMALE POPULATION
80.87
MALES / 100 FEMALES
123.65
FEMALES / 100 MALES
38.6
MEDIAN AGE
3.4
AVG FAMILY SIZE
2.5
AVG HOUSEHOLD SIZE
694
LABOR FORCE [ PEOPLE ]
55.1%
PERCENT IN LABOR FORCE
28.4%
UNEMPLOYMENT RATE
Itta Bena Zip Codes
Itta Bena Area Codes
Income in Itta Bena
Income Overview in Itta Bena
Per Capita Income in Itta Bena is $13,923, while median incomes of families and households are $33,895 and $25,114 respectively.
| Characteristic | Number | Measure |
| Per Capita Income | 1,532 | $13,923 |
| Median Family Income | 348 | $33,895 |
| Mean Family Income | 348 | $39,202 |
| Median Household Income | 605 | $25,114 |
| Mean Household Income | 605 | $32,516 |
| Income Deficit | 348 | $0 |
| Wage / Income Gap (%) | 1,532 | 0.00% |
| Wage / Income Gap ($) | 1,532 | 100.00¢ per $1 |
| Gini / Inequality Index | 1,532 | 0.47 |
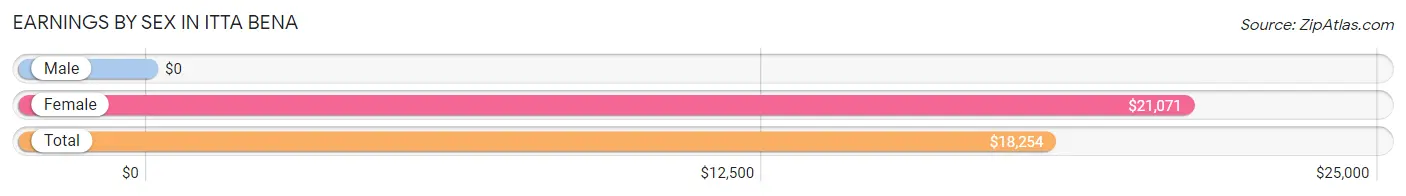
Earnings by Sex in Itta Bena
| Sex | Number | Average Earnings |
| Male | 238 (37.9%) | $0 |
| Female | 390 (62.1%) | $21,071 |
| Total | 628 (100.0%) | $18,254 |
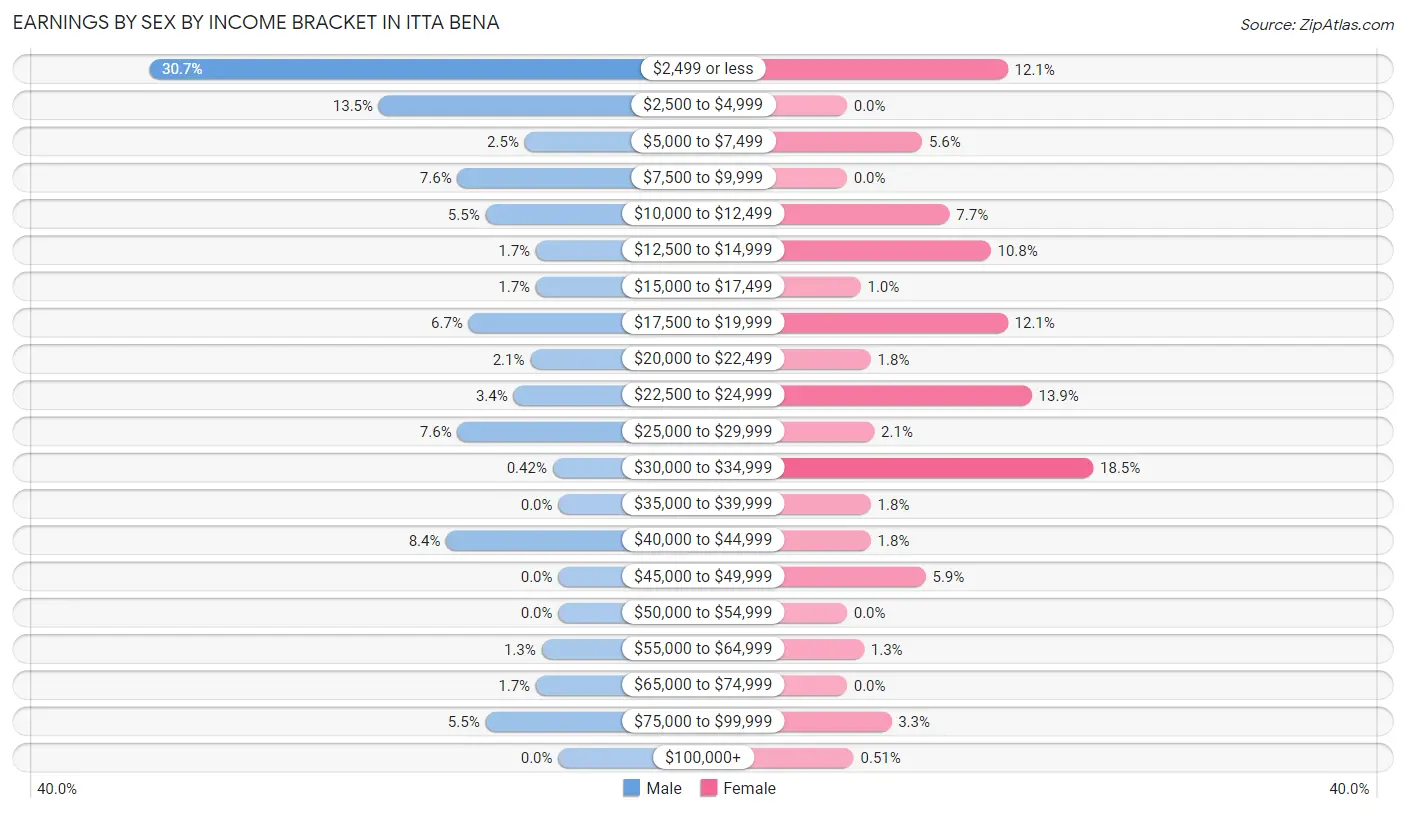
Earnings by Sex by Income Bracket in Itta Bena
The most common earnings brackets in Itta Bena are $2,499 or less for men (73 | 30.7%) and $30,000 to $34,999 for women (72 | 18.5%).
| Income | Male | Female |
| $2,499 or less | 73 (30.7%) | 47 (12.0%) |
| $2,500 to $4,999 | 32 (13.5%) | 0 (0.0%) |
| $5,000 to $7,499 | 6 (2.5%) | 22 (5.6%) |
| $7,500 to $9,999 | 18 (7.6%) | 0 (0.0%) |
| $10,000 to $12,499 | 13 (5.5%) | 30 (7.7%) |
| $12,500 to $14,999 | 4 (1.7%) | 42 (10.8%) |
| $15,000 to $17,499 | 4 (1.7%) | 4 (1.0%) |
| $17,500 to $19,999 | 16 (6.7%) | 47 (12.0%) |
| $20,000 to $22,499 | 5 (2.1%) | 7 (1.8%) |
| $22,500 to $24,999 | 8 (3.4%) | 54 (13.9%) |
| $25,000 to $29,999 | 18 (7.6%) | 8 (2.1%) |
| $30,000 to $34,999 | 1 (0.4%) | 72 (18.5%) |
| $35,000 to $39,999 | 0 (0.0%) | 7 (1.8%) |
| $40,000 to $44,999 | 20 (8.4%) | 7 (1.8%) |
| $45,000 to $49,999 | 0 (0.0%) | 23 (5.9%) |
| $50,000 to $54,999 | 0 (0.0%) | 0 (0.0%) |
| $55,000 to $64,999 | 3 (1.3%) | 5 (1.3%) |
| $65,000 to $74,999 | 4 (1.7%) | 0 (0.0%) |
| $75,000 to $99,999 | 13 (5.5%) | 13 (3.3%) |
| $100,000+ | 0 (0.0%) | 2 (0.5%) |
| Total | 238 (100.0%) | 390 (100.0%) |
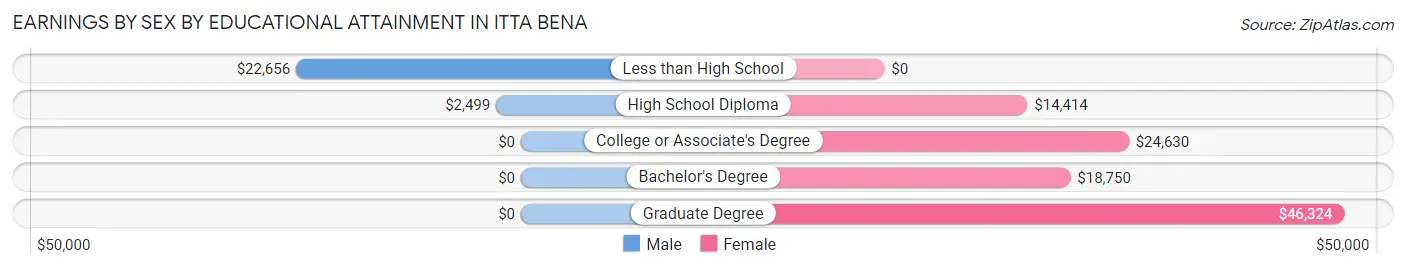
Earnings by Sex by Educational Attainment in Itta Bena
| Educational Attainment | Male Income | Female Income |
| Less than High School | $22,656 | $0 |
| High School Diploma | $2,499 | $14,414 |
| College or Associate's Degree | - | - |
| Bachelor's Degree | - | - |
| Graduate Degree | - | - |
| Total | - | - |
Family Income in Itta Bena
Family Income Brackets in Itta Bena
According to the Itta Bena family income data, there are 83 families falling into the $35,000 to $49,999 income range, which is the most common income bracket and makes up 23.8% of all families.
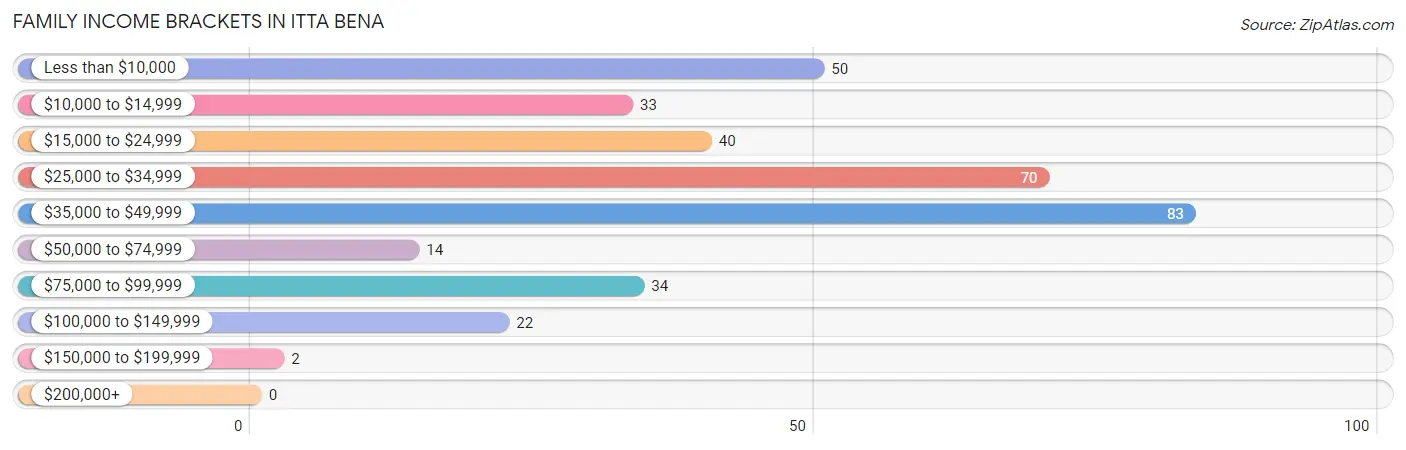
| Income Bracket | # Families | % Families |
| Less than $10,000 | 50 | 14.4% |
| $10,000 to $14,999 | 33 | 9.5% |
| $15,000 to $24,999 | 40 | 11.5% |
| $25,000 to $34,999 | 70 | 20.1% |
| $35,000 to $49,999 | 83 | 23.9% |
| $50,000 to $74,999 | 14 | 4.0% |
| $75,000 to $99,999 | 34 | 9.8% |
| $100,000 to $149,999 | 22 | 6.3% |
| $150,000 to $199,999 | 2 | 0.6% |
| $200,000+ | 0 | 0.0% |
Family Income by Famaliy Size in Itta Bena
5-person families (18 | 5.2%) account for the highest median family income in Itta Bena with $43,125 per family, while 2-person families (160 | 46.0%) have the highest median income of $16,250 per family member.
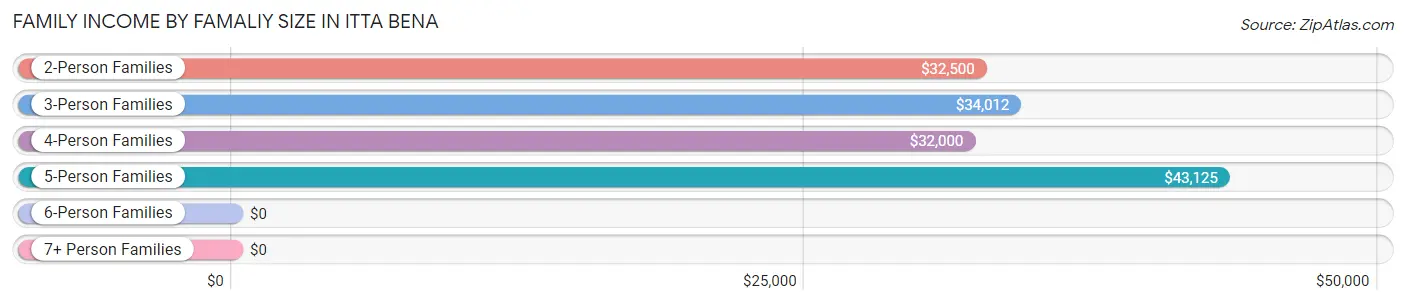
| Income Bracket | # Families | Median Income |
| 2-Person Families | 160 (46.0%) | $32,500 |
| 3-Person Families | 134 (38.5%) | $34,012 |
| 4-Person Families | 32 (9.2%) | $32,000 |
| 5-Person Families | 18 (5.2%) | $43,125 |
| 6-Person Families | 4 (1.1%) | $0 |
| 7+ Person Families | 0 (0.0%) | $0 |
| Total | 348 (100.0%) | $33,895 |
Family Income by Number of Earners in Itta Bena
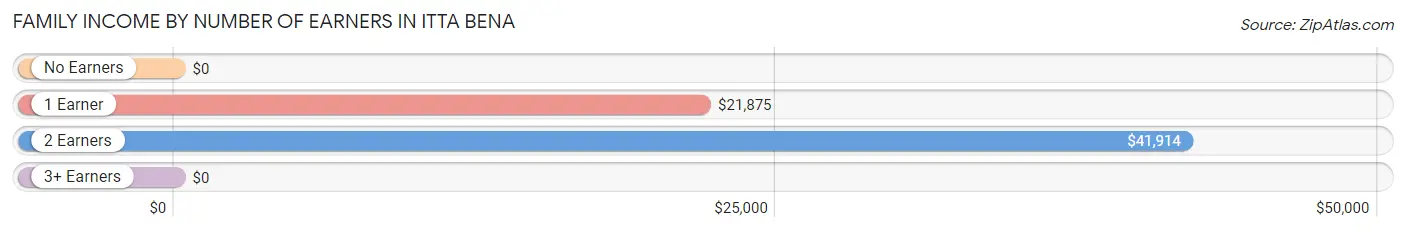
| Number of Earners | # Families | Median Income |
| No Earners | 51 (14.7%) | $0 |
| 1 Earner | 156 (44.8%) | $21,875 |
| 2 Earners | 141 (40.5%) | $41,914 |
| 3+ Earners | 0 (0.0%) | $0 |
| Total | 348 (100.0%) | $33,895 |
Household Income in Itta Bena
Household Income Brackets in Itta Bena
With 120 households falling in the category, the less than $10,000 income range is the most frequent in Itta Bena, accounting for 19.8% of all households.
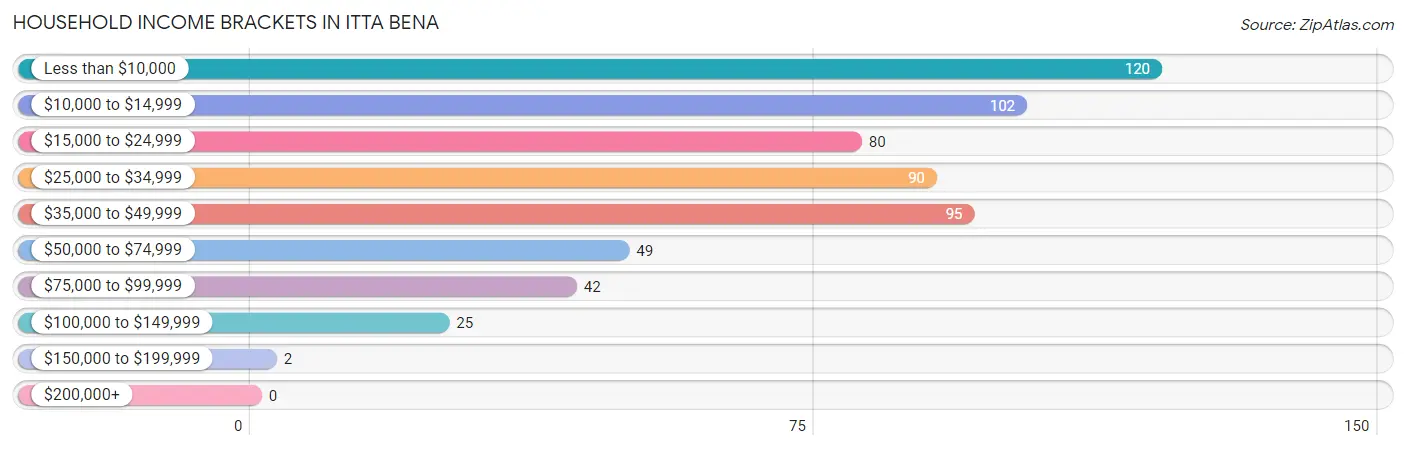
| Income Bracket | # Households | % Households |
| Less than $10,000 | 120 | 19.8% |
| $10,000 to $14,999 | 102 | 16.9% |
| $15,000 to $24,999 | 80 | 13.2% |
| $25,000 to $34,999 | 90 | 14.9% |
| $35,000 to $49,999 | 95 | 15.7% |
| $50,000 to $74,999 | 49 | 8.1% |
| $75,000 to $99,999 | 42 | 6.9% |
| $100,000 to $149,999 | 25 | 4.1% |
| $150,000 to $199,999 | 2 | 0.3% |
| $200,000+ | 0 | 0.0% |
Household Income by Householder Age in Itta Bena
The median household income in Itta Bena is $25,114, with the highest median household income of $33,603 found in the 45 to 64 years age bracket for the primary householder. A total of 295 households (48.8%) fall into this category. Meanwhile, the 15 to 24 years age bracket for the primary householder has the lowest median household income of $0, with 20 households (3.3%) in this group.
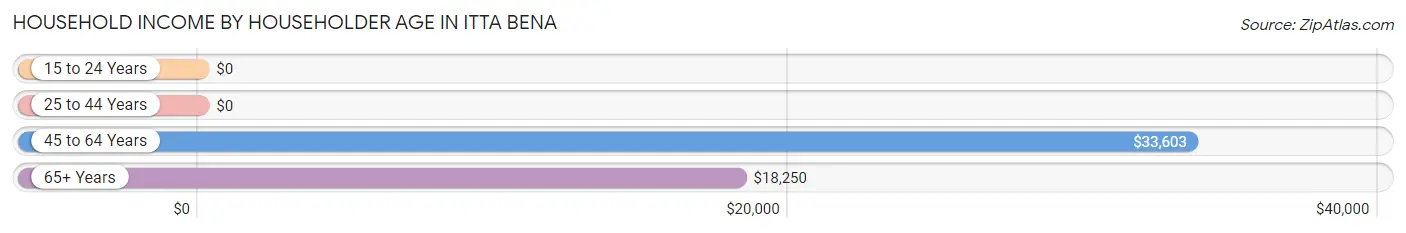
| Income Bracket | # Households | Median Income |
| 15 to 24 Years | 20 (3.3%) | $0 |
| 25 to 44 Years | 73 (12.1%) | $0 |
| 45 to 64 Years | 295 (48.8%) | $33,603 |
| 65+ Years | 217 (35.9%) | $18,250 |
| Total | 605 (100.0%) | $25,114 |
Poverty in Itta Bena
Income Below Poverty by Sex and Age in Itta Bena
With 23.4% poverty level for males and 42.6% for females among the residents of Itta Bena, 65 to 74 year old males and under 5 year old females are the most vulnerable to poverty, with 47 males (48.4%) and 44 females (100.0%) in their respective age groups living below the poverty level.
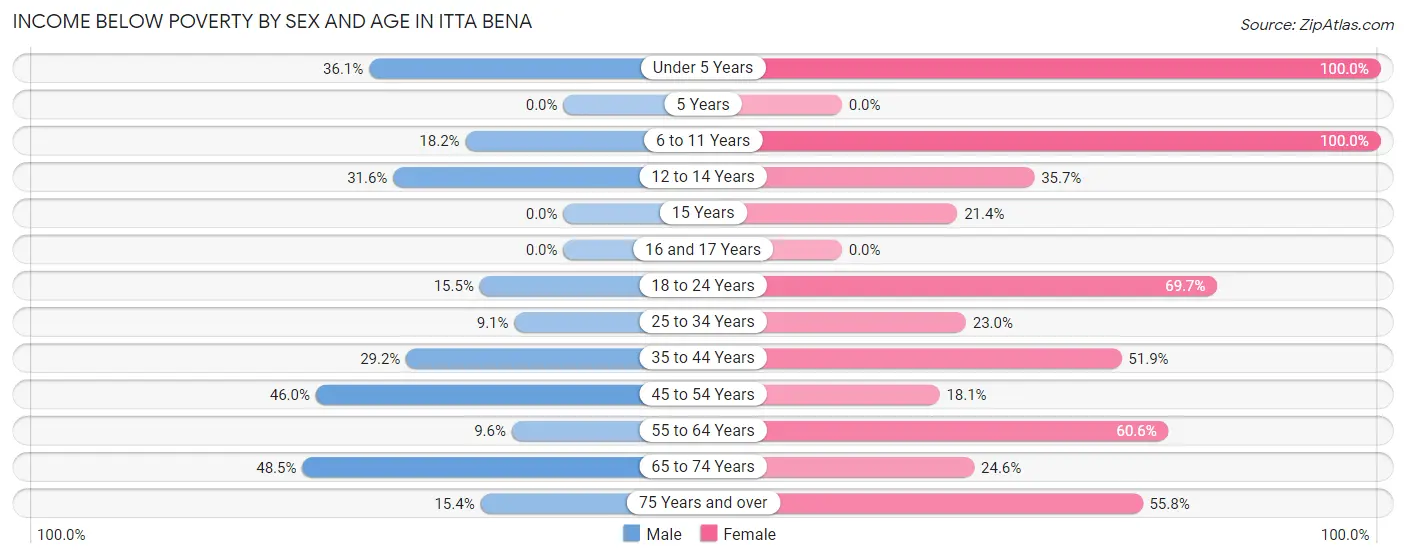
| Age Bracket | Male | Female |
| Under 5 Years | 31 (36.0%) | 44 (100.0%) |
| 5 Years | 0 (0.0%) | 0 (0.0%) |
| 6 to 11 Years | 2 (18.2%) | 23 (100.0%) |
| 12 to 14 Years | 12 (31.6%) | 10 (35.7%) |
| 15 Years | 0 (0.0%) | 6 (21.4%) |
| 16 and 17 Years | 0 (0.0%) | 0 (0.0%) |
| 18 to 24 Years | 9 (15.5%) | 69 (69.7%) |
| 25 to 34 Years | 15 (9.1%) | 26 (23.0%) |
| 35 to 44 Years | 14 (29.2%) | 41 (51.9%) |
| 45 to 54 Years | 17 (46.0%) | 33 (18.1%) |
| 55 to 64 Years | 9 (9.6%) | 57 (60.6%) |
| 65 to 74 Years | 47 (48.4%) | 28 (24.6%) |
| 75 Years and over | 4 (15.4%) | 24 (55.8%) |
| Total | 160 (23.4%) | 361 (42.6%) |
Income Above Poverty by Sex and Age in Itta Bena
According to the poverty statistics in Itta Bena, males aged 15 years and females aged 45 to 54 years are the age groups that are most secure financially, with 100.0% of males and 81.9% of females in these age groups living above the poverty line.
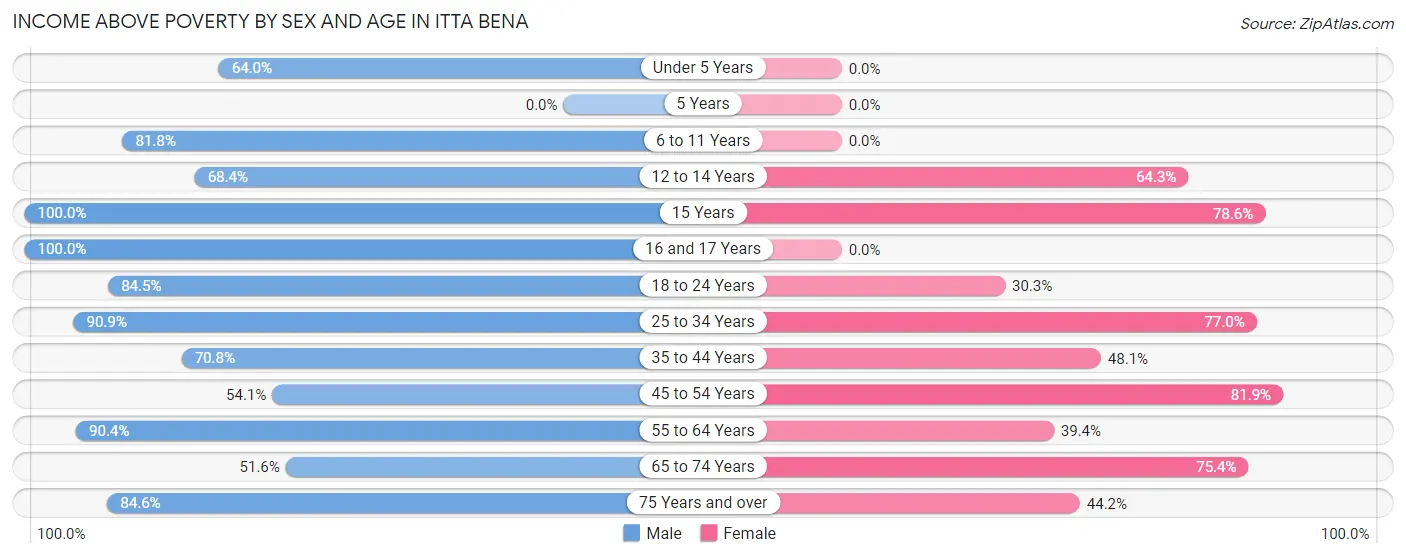
| Age Bracket | Male | Female |
| Under 5 Years | 55 (63.9%) | 0 (0.0%) |
| 5 Years | 0 (0.0%) | 0 (0.0%) |
| 6 to 11 Years | 9 (81.8%) | 0 (0.0%) |
| 12 to 14 Years | 26 (68.4%) | 18 (64.3%) |
| 15 Years | 14 (100.0%) | 22 (78.6%) |
| 16 and 17 Years | 11 (100.0%) | 0 (0.0%) |
| 18 to 24 Years | 49 (84.5%) | 30 (30.3%) |
| 25 to 34 Years | 150 (90.9%) | 87 (77.0%) |
| 35 to 44 Years | 34 (70.8%) | 38 (48.1%) |
| 45 to 54 Years | 20 (54.0%) | 149 (81.9%) |
| 55 to 64 Years | 85 (90.4%) | 37 (39.4%) |
| 65 to 74 Years | 50 (51.5%) | 86 (75.4%) |
| 75 Years and over | 22 (84.6%) | 19 (44.2%) |
| Total | 525 (76.6%) | 486 (57.4%) |
Income Below Poverty Among Married-Couple Families in Itta Bena
The poverty statistics for married-couple families in Itta Bena show that 25.3% or 22 of the total 87 families live below the poverty line. Families with 3 or 4 children have the highest poverty rate of 100.0%, comprising of 4 families. On the other hand, families with 1 or 2 children have the lowest poverty rate of 10.5%, which includes 2 families.
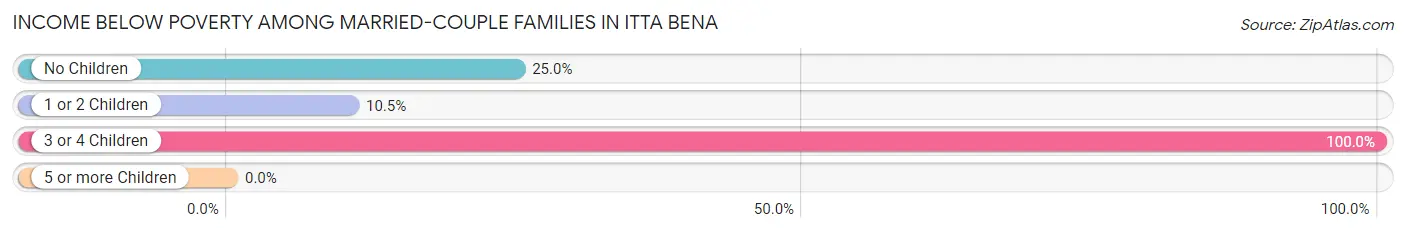
| Children | Above Poverty | Below Poverty |
| No Children | 48 (75.0%) | 16 (25.0%) |
| 1 or 2 Children | 17 (89.5%) | 2 (10.5%) |
| 3 or 4 Children | 0 (0.0%) | 4 (100.0%) |
| 5 or more Children | 0 (0.0%) | 0 (0.0%) |
| Total | 65 (74.7%) | 22 (25.3%) |
Income Below Poverty Among Single-Parent Households in Itta Bena
According to the poverty data in Itta Bena, 38.5% or 5 single-father households and 33.9% or 84 single-mother households are living below the poverty line. Among single-father households, those with 1 or 2 children have the highest poverty rate, with 5 households (38.5%) experiencing poverty. Likewise, among single-mother households, those with 3 or 4 children have the highest poverty rate, with 4 households (100.0%) falling below the poverty line.
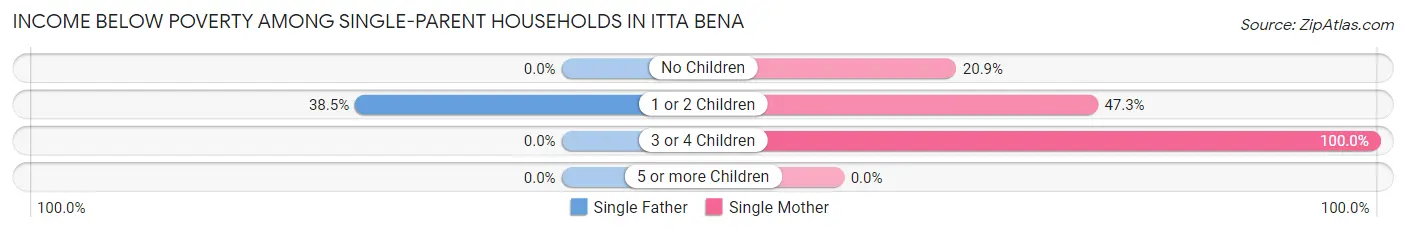
| Children | Single Father | Single Mother |
| No Children | 0 (0.0%) | 28 (20.9%) |
| 1 or 2 Children | 5 (38.5%) | 52 (47.3%) |
| 3 or 4 Children | 0 (0.0%) | 4 (100.0%) |
| 5 or more Children | 0 (0.0%) | 0 (0.0%) |
| Total | 5 (38.5%) | 84 (33.9%) |
Income Below Poverty Among Married-Couple vs Single-Parent Households in Itta Bena
The poverty data for Itta Bena shows that 22 of the married-couple family households (25.3%) and 89 of the single-parent households (34.1%) are living below the poverty level. Within the married-couple family households, those with 3 or 4 children have the highest poverty rate, with 4 households (100.0%) falling below the poverty line. Among the single-parent households, those with 3 or 4 children have the highest poverty rate, with 4 household (100.0%) living below poverty.
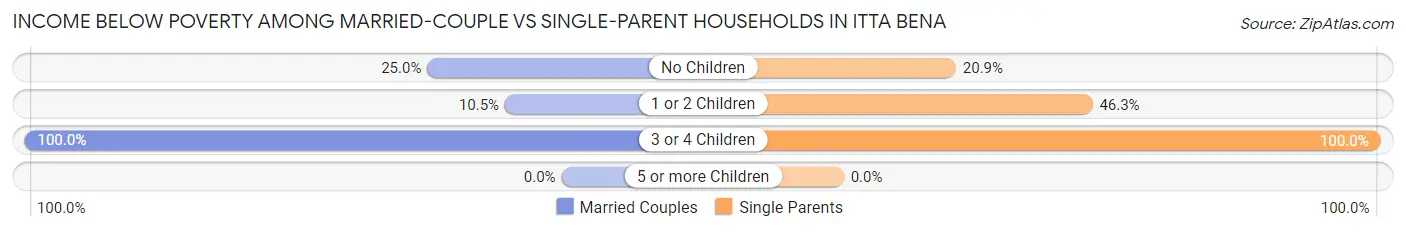
| Children | Married-Couple Families | Single-Parent Households |
| No Children | 16 (25.0%) | 28 (20.9%) |
| 1 or 2 Children | 2 (10.5%) | 57 (46.3%) |
| 3 or 4 Children | 4 (100.0%) | 4 (100.0%) |
| 5 or more Children | 0 (0.0%) | 0 (0.0%) |
| Total | 22 (25.3%) | 89 (34.1%) |
Race in Itta Bena
The most populous races in Itta Bena are Black / African American (1,433 | 93.5%), White / Caucasian (79 | 5.2%), and Two or more Races (20 | 1.3%).
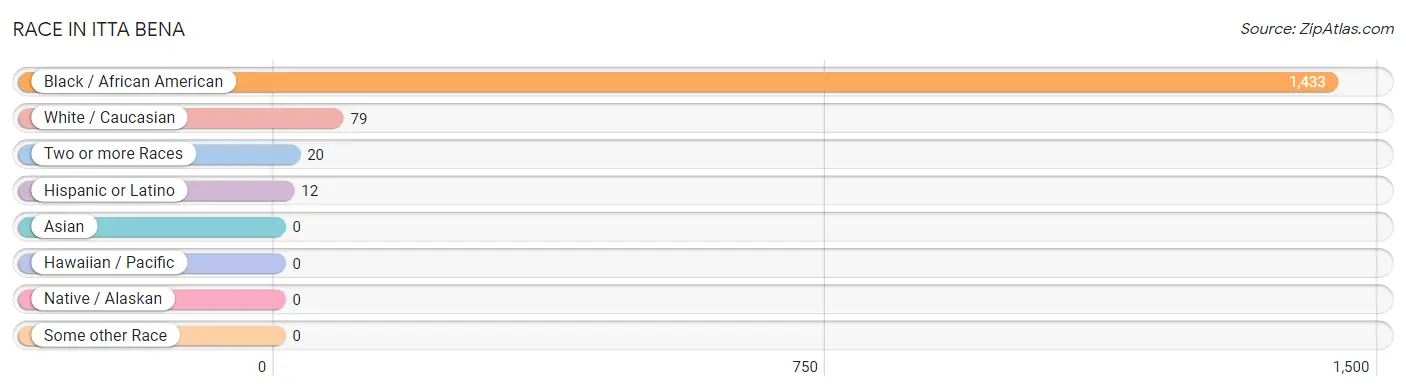
| Race | # Population | % Population |
| Asian | 0 | 0.0% |
| Black / African American | 1,433 | 93.5% |
| Hawaiian / Pacific | 0 | 0.0% |
| Hispanic or Latino | 12 | 0.8% |
| Native / Alaskan | 0 | 0.0% |
| White / Caucasian | 79 | 5.2% |
| Two or more Races | 20 | 1.3% |
| Some other Race | 0 | 0.0% |
| Total | 1,532 | 100.0% |
Ancestry in Itta Bena
The most populous ancestries reported in Itta Bena are American (333 | 21.7%), Mexican (12 | 0.8%), African (4 | 0.3%), Subsaharan African (4 | 0.3%), and Irish (3 | 0.2%), together accounting for 23.2% of all Itta Bena residents.
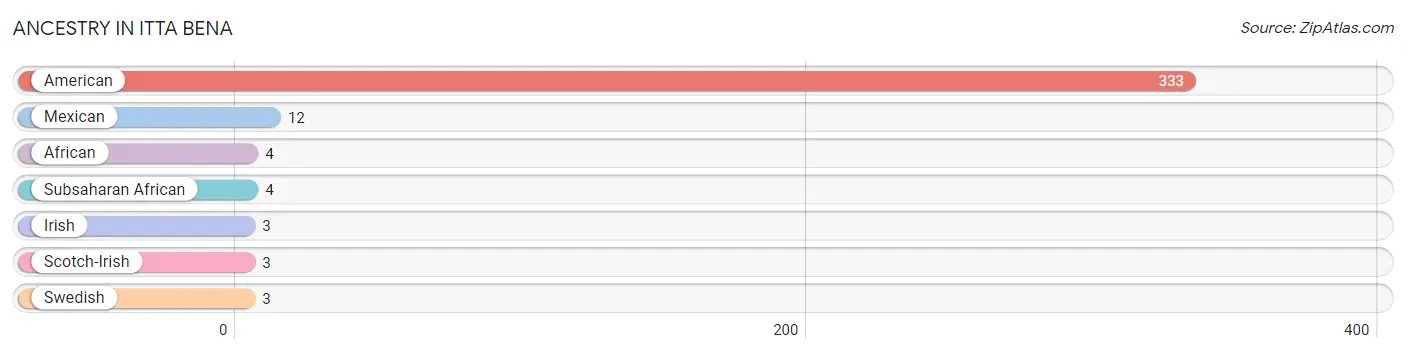
| Ancestry | # Population | % Population |
| African | 4 | 0.3% |
| American | 333 | 21.7% |
| Irish | 3 | 0.2% |
| Mexican | 12 | 0.8% |
| Scotch-Irish | 3 | 0.2% |
| Subsaharan African | 4 | 0.3% |
| Swedish | 3 | 0.2% | View All 7 Rows |
Immigrants in Itta Bena

| Immigration Origin | # Population | % Population | View All 0 Rows |
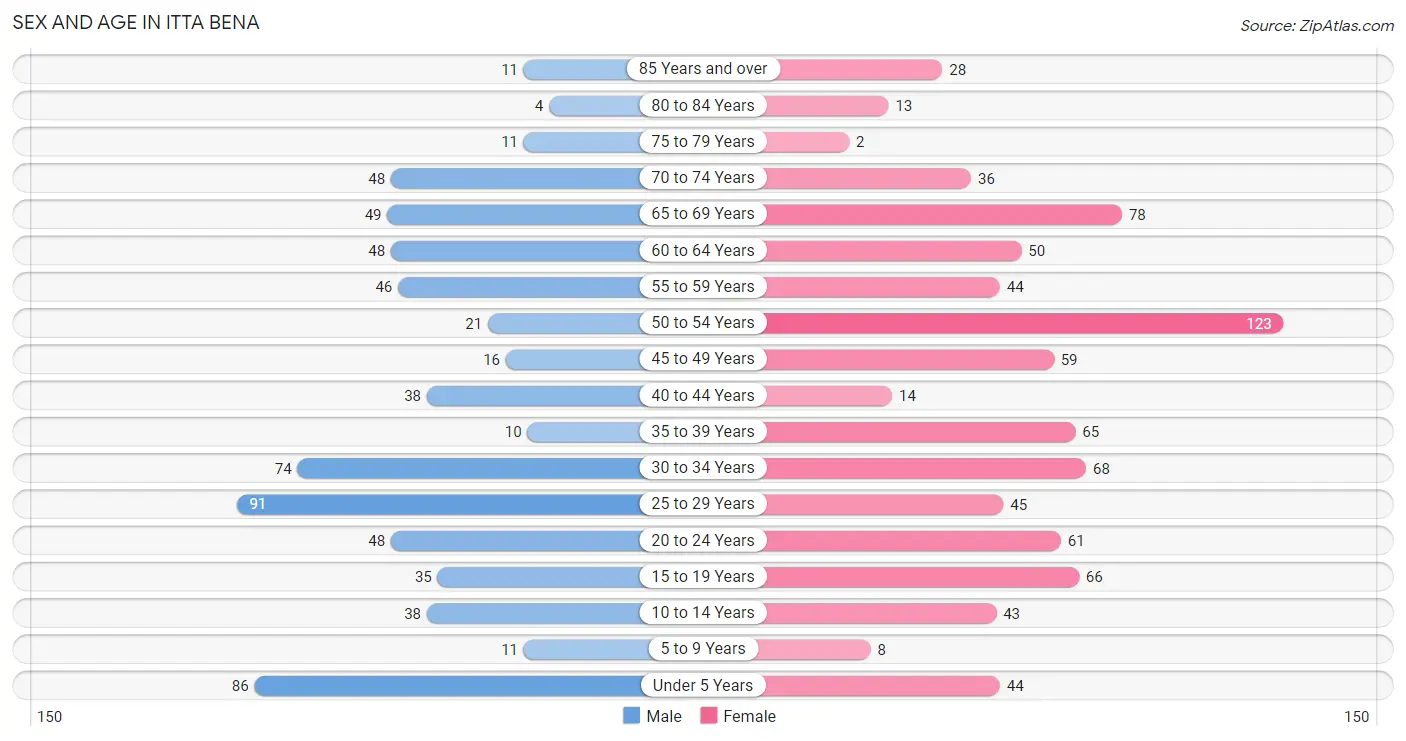
Sex and Age in Itta Bena
Sex and Age in Itta Bena
The most populous age groups in Itta Bena are 25 to 29 Years (91 | 13.3%) for men and 50 to 54 Years (123 | 14.5%) for women.
| Age Bracket | Male | Female |
| Under 5 Years | 86 (12.6%) | 44 (5.2%) |
| 5 to 9 Years | 11 (1.6%) | 8 (0.9%) |
| 10 to 14 Years | 38 (5.6%) | 43 (5.1%) |
| 15 to 19 Years | 35 (5.1%) | 66 (7.8%) |
| 20 to 24 Years | 48 (7.0%) | 61 (7.2%) |
| 25 to 29 Years | 91 (13.3%) | 45 (5.3%) |
| 30 to 34 Years | 74 (10.8%) | 68 (8.0%) |
| 35 to 39 Years | 10 (1.5%) | 65 (7.7%) |
| 40 to 44 Years | 38 (5.6%) | 14 (1.7%) |
| 45 to 49 Years | 16 (2.3%) | 59 (7.0%) |
| 50 to 54 Years | 21 (3.1%) | 123 (14.5%) |
| 55 to 59 Years | 46 (6.7%) | 44 (5.2%) |
| 60 to 64 Years | 48 (7.0%) | 50 (5.9%) |
| 65 to 69 Years | 49 (7.1%) | 78 (9.2%) |
| 70 to 74 Years | 48 (7.0%) | 36 (4.3%) |
| 75 to 79 Years | 11 (1.6%) | 2 (0.2%) |
| 80 to 84 Years | 4 (0.6%) | 13 (1.5%) |
| 85 Years and over | 11 (1.6%) | 28 (3.3%) |
| Total | 685 (100.0%) | 847 (100.0%) |
Families and Households in Itta Bena
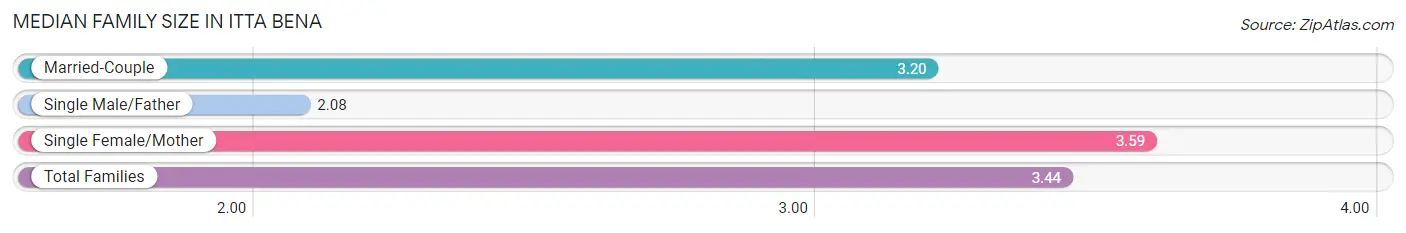
Median Family Size in Itta Bena
The median family size in Itta Bena is 3.44 persons per family, with single female/mother families (248 | 71.3%) accounting for the largest median family size of 3.59 persons per family. On the other hand, single male/father families (13 | 3.7%) represent the smallest median family size with 2.08 persons per family.
| Family Type | # Families | Family Size |
| Married-Couple | 87 (25.0%) | 3.20 |
| Single Male/Father | 13 (3.7%) | 2.08 |
| Single Female/Mother | 248 (71.3%) | 3.59 |
| Total Families | 348 (100.0%) | 3.44 |
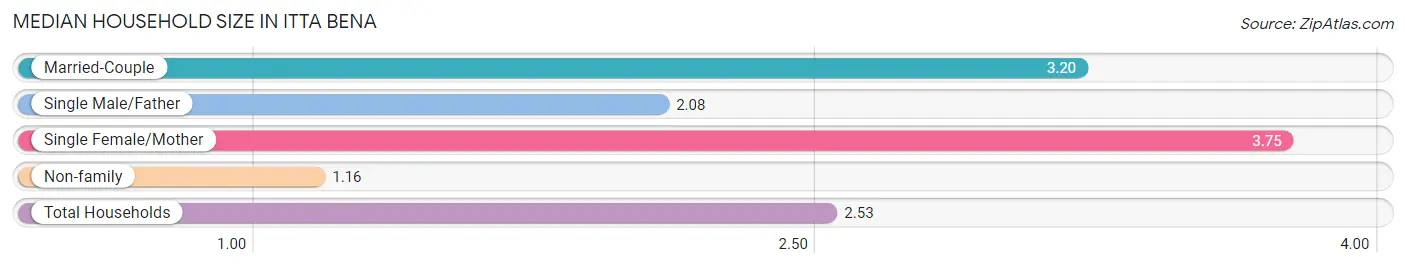
Median Household Size in Itta Bena
The median household size in Itta Bena is 2.53 persons per household, with single female/mother households (248 | 41.0%) accounting for the largest median household size of 3.75 persons per household. non-family households (257 | 42.5%) represent the smallest median household size with 1.16 persons per household.
| Household Type | # Households | Household Size |
| Married-Couple | 87 (14.4%) | 3.20 |
| Single Male/Father | 13 (2.1%) | 2.08 |
| Single Female/Mother | 248 (41.0%) | 3.75 |
| Non-family | 257 (42.5%) | 1.16 |
| Total Households | 605 (100.0%) | 2.53 |
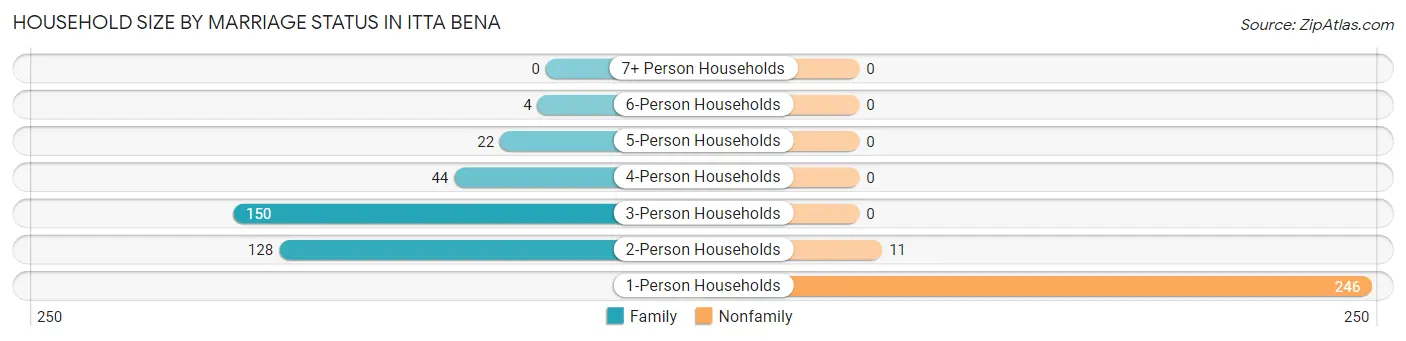
Household Size by Marriage Status in Itta Bena
Out of a total of 605 households in Itta Bena, 348 (57.5%) are family households, while 257 (42.5%) are nonfamily households. The most numerous type of family households are 3-person households, comprising 150, and the most common type of nonfamily households are 1-person households, comprising 246.
| Household Size | Family Households | Nonfamily Households |
| 1-Person Households | - | 246 (40.7%) |
| 2-Person Households | 128 (21.2%) | 11 (1.8%) |
| 3-Person Households | 150 (24.8%) | 0 (0.0%) |
| 4-Person Households | 44 (7.3%) | 0 (0.0%) |
| 5-Person Households | 22 (3.6%) | 0 (0.0%) |
| 6-Person Households | 4 (0.7%) | 0 (0.0%) |
| 7+ Person Households | 0 (0.0%) | 0 (0.0%) |
| Total | 348 (57.5%) | 257 (42.5%) |
Female Fertility in Itta Bena
Fertility by Age in Itta Bena
Average fertility rate in Itta Bena is 31.0 births per 1,000 women. Women in the age bracket of 35 to 50 years have the highest fertility rate with 46.0 births per 1,000 women. Women in the age bracket of 35 to 50 years acount for 58.3% of all women with births.
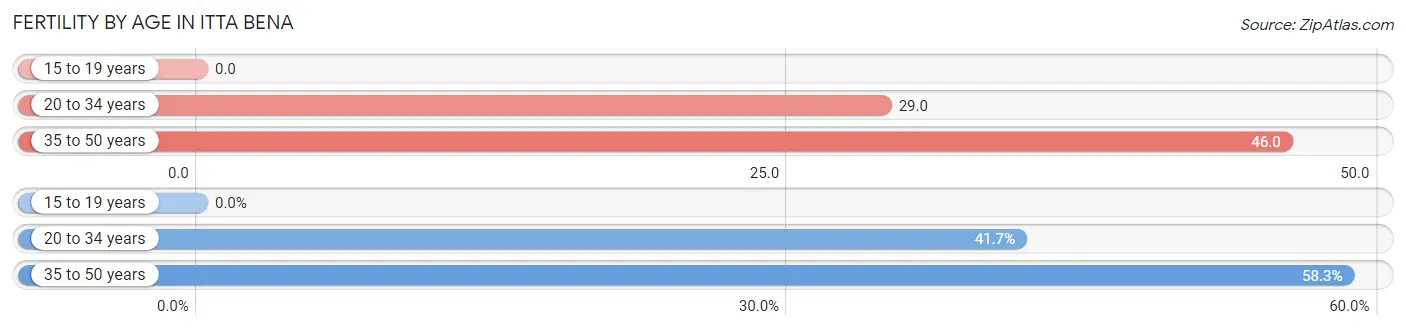
| Age Bracket | Women with Births | Births / 1,000 Women |
| 15 to 19 years | 0 (0.0%) | 0.0 |
| 20 to 34 years | 5 (41.7%) | 29.0 |
| 35 to 50 years | 7 (58.3%) | 46.0 |
| Total | 12 (100.0%) | 31.0 |
Fertility by Age by Marriage Status in Itta Bena
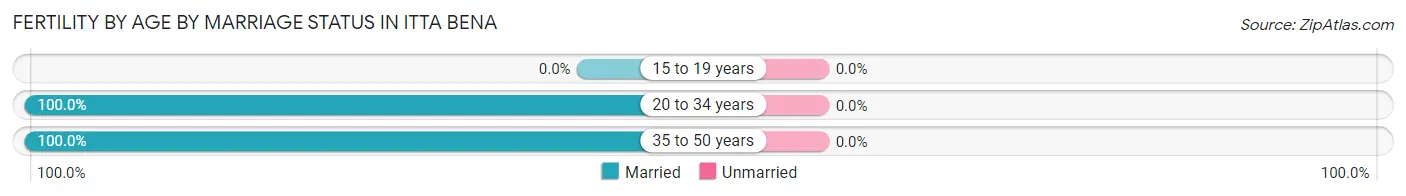
| Age Bracket | Married | Unmarried |
| 15 to 19 years | 0 (0.0%) | 0 (0.0%) |
| 20 to 34 years | 5 (100.0%) | 0 (0.0%) |
| 35 to 50 years | 7 (100.0%) | 0 (0.0%) |
| Total | 12 (100.0%) | 0 (0.0%) |
Fertility by Education in Itta Bena
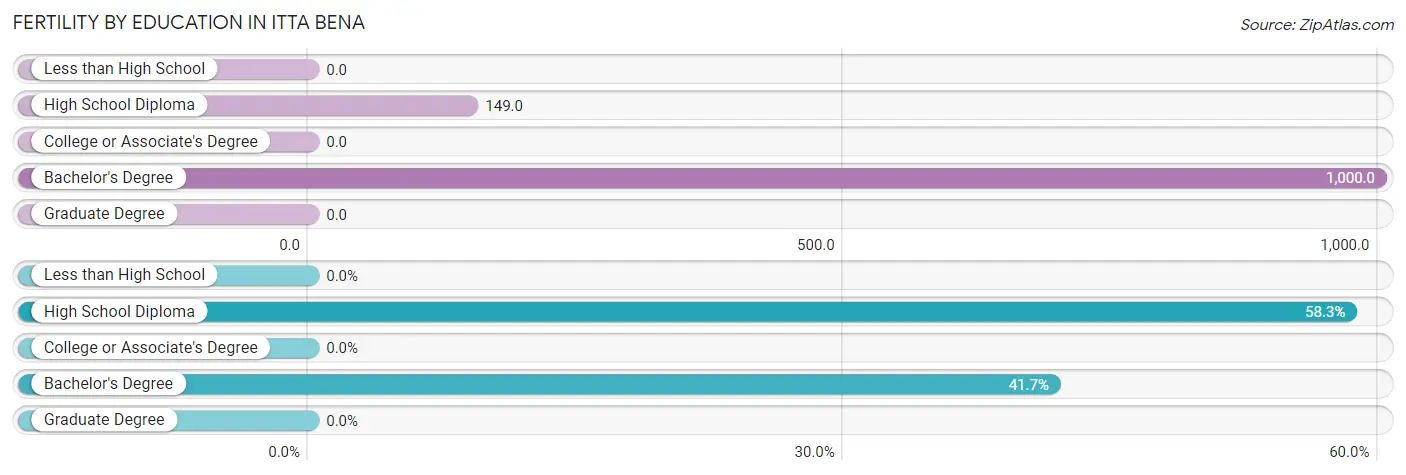
| Educational Attainment | Women with Births | Births / 1,000 Women |
| Less than High School | 0 (0.0%) | 0.0 |
| High School Diploma | 7 (58.3%) | 149.0 |
| College or Associate's Degree | 0 (0.0%) | 0.0 |
| Bachelor's Degree | 5 (41.7%) | 1,000.0 |
| Graduate Degree | 0 (0.0%) | 0.0 |
| Total | 12 (100.0%) | 31.0 |
Fertility by Education by Marriage Status in Itta Bena
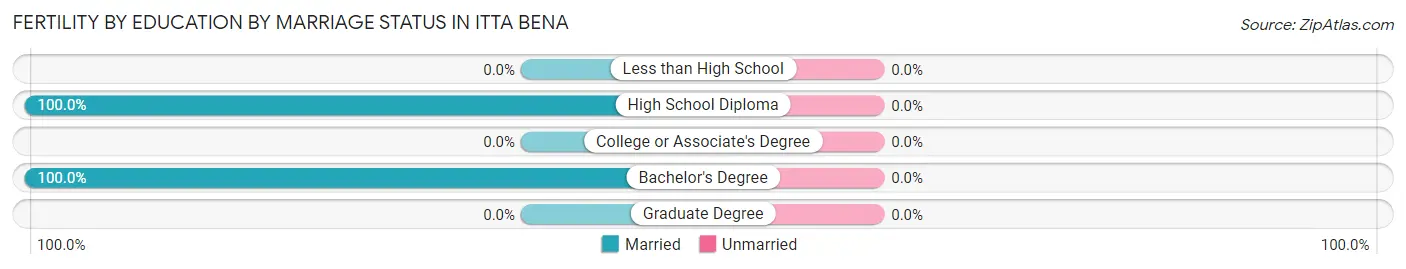
| Educational Attainment | Married | Unmarried |
| Less than High School | 0 (0.0%) | 0 (0.0%) |
| High School Diploma | 7 (100.0%) | 0 (0.0%) |
| College or Associate's Degree | 0 (0.0%) | 0 (0.0%) |
| Bachelor's Degree | 5 (100.0%) | 0 (0.0%) |
| Graduate Degree | 0 (0.0%) | 0 (0.0%) |
| Total | 12 (100.0%) | 0 (0.0%) |
Employment Characteristics in Itta Bena
Employment by Class of Employer in Itta Bena
Among the 442 employed individuals in Itta Bena, private company employees (295 | 66.7%), state government employees (63 | 14.2%), and local government employees (56 | 12.7%) make up the most common classes of employment.
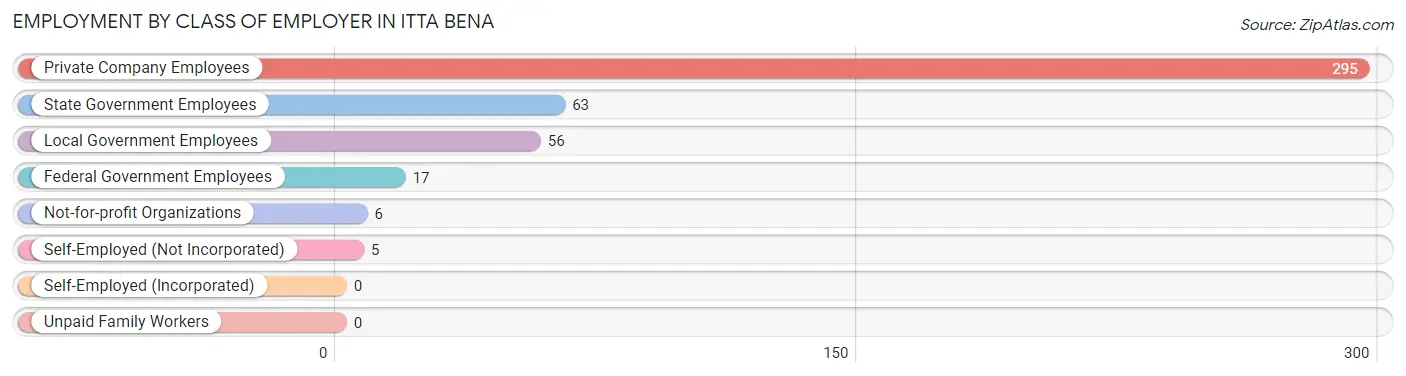
| Employer Class | # Employees | % Employees |
| Private Company Employees | 295 | 66.7% |
| Self-Employed (Incorporated) | 0 | 0.0% |
| Self-Employed (Not Incorporated) | 5 | 1.1% |
| Not-for-profit Organizations | 6 | 1.4% |
| Local Government Employees | 56 | 12.7% |
| State Government Employees | 63 | 14.2% |
| Federal Government Employees | 17 | 3.8% |
| Unpaid Family Workers | 0 | 0.0% |
| Total | 442 | 100.0% |
Employment Status by Age in Itta Bena
According to the labor force statistics for Itta Bena, out of the total population over 16 years of age (1,260), 55.1% or 694 individuals are in the labor force, with 28.4% or 197 of them unemployed. The age group with the highest labor force participation rate is 30 to 34 years, with 85.9% or 122 individuals in the labor force. Within the labor force, the 25 to 29 years age range has the highest percentage of unemployed individuals, with 71.0% or 76 of them being unemployed.
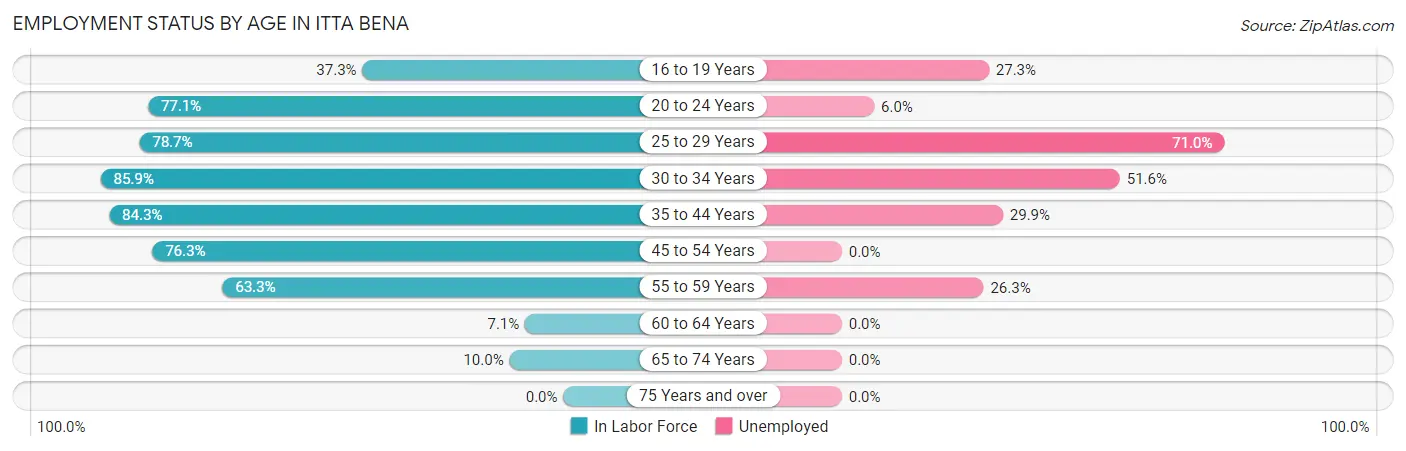
| Age Bracket | In Labor Force | Unemployed |
| 16 to 19 Years | 22 (37.3%) | 6 (27.3%) |
| 20 to 24 Years | 84 (77.1%) | 5 (6.0%) |
| 25 to 29 Years | 107 (78.7%) | 76 (71.0%) |
| 30 to 34 Years | 122 (85.9%) | 63 (51.6%) |
| 35 to 44 Years | 107 (84.3%) | 32 (29.9%) |
| 45 to 54 Years | 167 (76.3%) | 0 (0.0%) |
| 55 to 59 Years | 57 (63.3%) | 15 (26.3%) |
| 60 to 64 Years | 7 (7.1%) | 0 (0.0%) |
| 65 to 74 Years | 21 (10.0%) | 0 (0.0%) |
| 75 Years and over | 0 (0.0%) | 0 (0.0%) |
| Total | 694 (55.1%) | 197 (28.4%) |
Employment Status by Educational Attainment in Itta Bena
According to labor force statistics for Itta Bena, 69.8% of individuals (567) out of the total population between 25 and 64 years of age (812) are in the labor force, with 32.8% or 186 of them being unemployed. The group with the highest labor force participation rate are those with the educational attainment of college / associate degree, with 83.6% or 286 individuals in the labor force. Within the labor force, individuals with less than high school education have the highest percentage of unemployment, with 57.1% or 16 of them being unemployed.
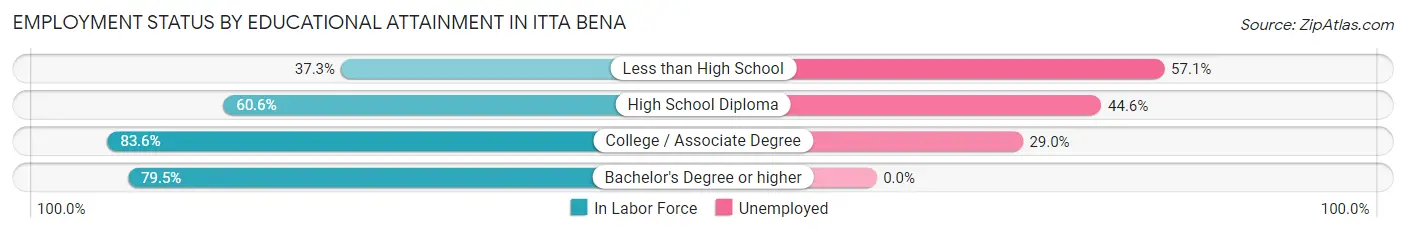
| Educational Attainment | In Labor Force | Unemployed |
| Less than High School | 28 (37.3%) | 43 (57.1%) |
| High School Diploma | 195 (60.6%) | 144 (44.6%) |
| College / Associate Degree | 286 (83.6%) | 99 (29.0%) |
| Bachelor's Degree or higher | 58 (79.5%) | 0 (0.0%) |
| Total | 567 (69.8%) | 266 (32.8%) |
Employment Occupations by Sex in Itta Bena
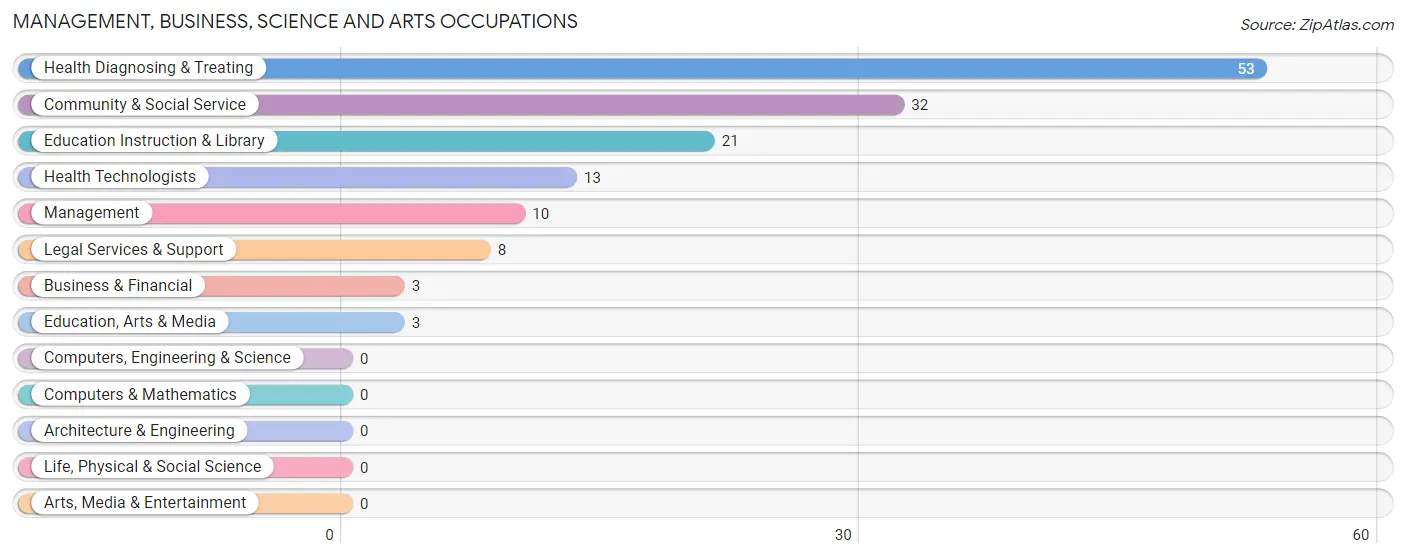
Management, Business, Science and Arts Occupations
The most common Management, Business, Science and Arts occupations in Itta Bena are Health Diagnosing & Treating (53 | 10.7%), Community & Social Service (32 | 6.4%), Education Instruction & Library (21 | 4.2%), Health Technologists (13 | 2.6%), and Management (10 | 2.0%).
Management, Business, Science and Arts Occupations by Sex
Within the Management, Business, Science and Arts occupations in Itta Bena, the most male-oriented occupations are Education, Arts & Media (100.0%), Management (40.0%), and Community & Social Service (9.4%), while the most female-oriented occupations are Business & Financial (100.0%), Legal Services & Support (100.0%), and Education Instruction & Library (100.0%).
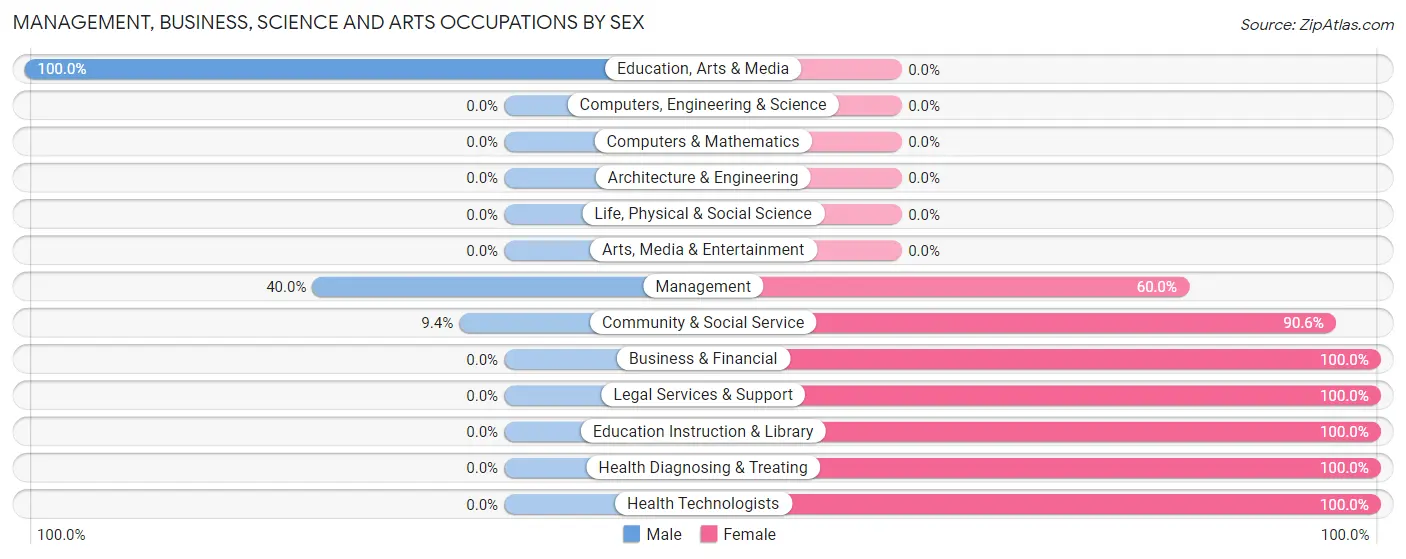
| Occupation | Male | Female |
| Management | 4 (40.0%) | 6 (60.0%) |
| Business & Financial | 0 (0.0%) | 3 (100.0%) |
| Computers, Engineering & Science | 0 (0.0%) | 0 (0.0%) |
| Computers & Mathematics | 0 (0.0%) | 0 (0.0%) |
| Architecture & Engineering | 0 (0.0%) | 0 (0.0%) |
| Life, Physical & Social Science | 0 (0.0%) | 0 (0.0%) |
| Community & Social Service | 3 (9.4%) | 29 (90.6%) |
| Education, Arts & Media | 3 (100.0%) | 0 (0.0%) |
| Legal Services & Support | 0 (0.0%) | 8 (100.0%) |
| Education Instruction & Library | 0 (0.0%) | 21 (100.0%) |
| Arts, Media & Entertainment | 0 (0.0%) | 0 (0.0%) |
| Health Diagnosing & Treating | 0 (0.0%) | 53 (100.0%) |
| Health Technologists | 0 (0.0%) | 13 (100.0%) |
| Total (Category) | 7 (7.1%) | 91 (92.9%) |
| Total (Overall) | 154 (31.0%) | 343 (69.0%) |
Services Occupations
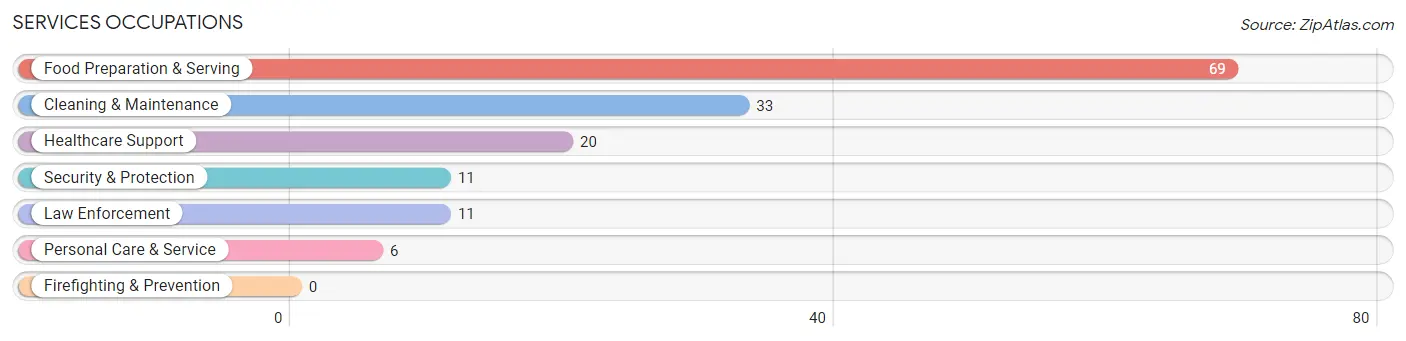
The most common Services occupations in Itta Bena are Food Preparation & Serving (69 | 13.9%), Cleaning & Maintenance (33 | 6.6%), Healthcare Support (20 | 4.0%), Security & Protection (11 | 2.2%), and Law Enforcement (11 | 2.2%).
Services Occupations by Sex
Within the Services occupations in Itta Bena, the most male-oriented occupations are Cleaning & Maintenance (100.0%), and Food Preparation & Serving (1.5%), while the most female-oriented occupations are Healthcare Support (100.0%), Security & Protection (100.0%), and Law Enforcement (100.0%).
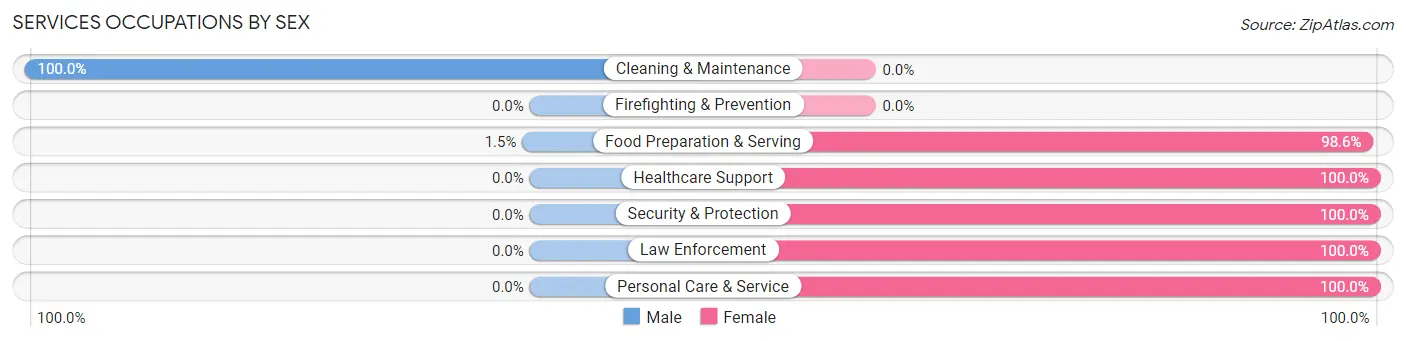
| Occupation | Male | Female |
| Healthcare Support | 0 (0.0%) | 20 (100.0%) |
| Security & Protection | 0 (0.0%) | 11 (100.0%) |
| Firefighting & Prevention | 0 (0.0%) | 0 (0.0%) |
| Law Enforcement | 0 (0.0%) | 11 (100.0%) |
| Food Preparation & Serving | 1 (1.5%) | 68 (98.6%) |
| Cleaning & Maintenance | 33 (100.0%) | 0 (0.0%) |
| Personal Care & Service | 0 (0.0%) | 6 (100.0%) |
| Total (Category) | 34 (24.5%) | 105 (75.5%) |
| Total (Overall) | 154 (31.0%) | 343 (69.0%) |
Sales and Office Occupations
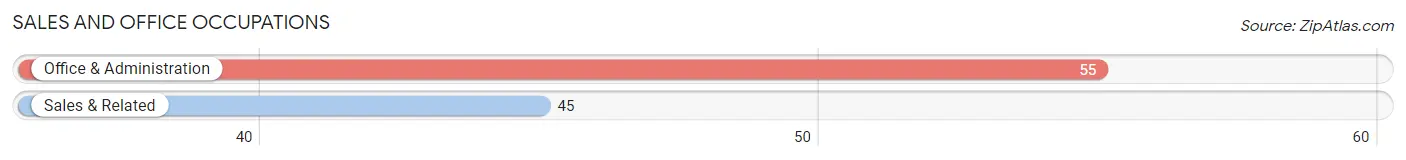
The most common Sales and Office occupations in Itta Bena are Office & Administration (55 | 11.1%), and Sales & Related (45 | 9.0%).
Sales and Office Occupations by Sex
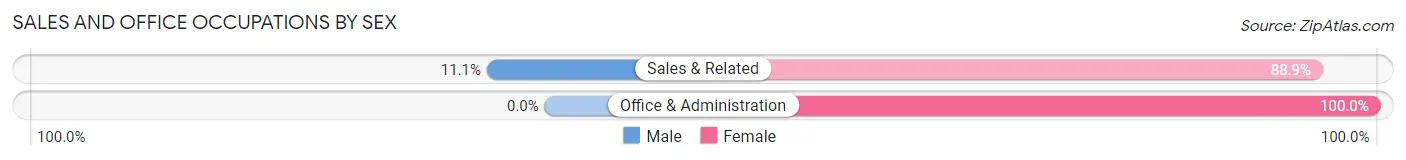
| Occupation | Male | Female |
| Sales & Related | 5 (11.1%) | 40 (88.9%) |
| Office & Administration | 0 (0.0%) | 55 (100.0%) |
| Total (Category) | 5 (5.0%) | 95 (95.0%) |
| Total (Overall) | 154 (31.0%) | 343 (69.0%) |
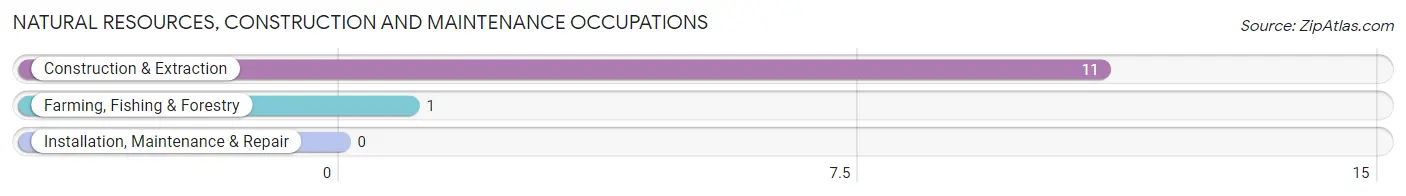
Natural Resources, Construction and Maintenance Occupations
The most common Natural Resources, Construction and Maintenance occupations in Itta Bena are Construction & Extraction (11 | 2.2%), and Farming, Fishing & Forestry (1 | 0.2%).
Natural Resources, Construction and Maintenance Occupations by Sex
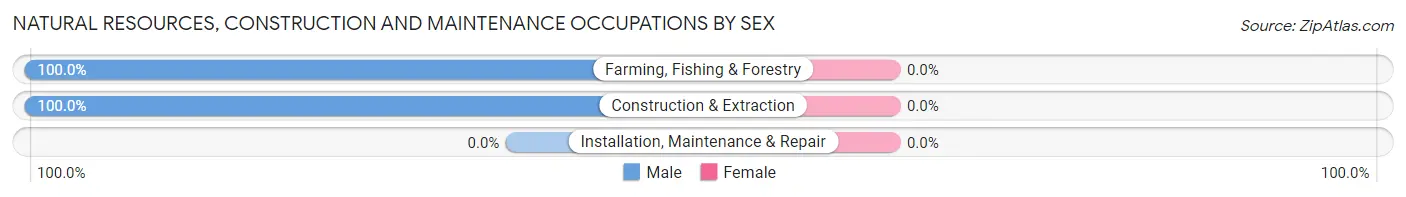
| Occupation | Male | Female |
| Farming, Fishing & Forestry | 1 (100.0%) | 0 (0.0%) |
| Construction & Extraction | 11 (100.0%) | 0 (0.0%) |
| Installation, Maintenance & Repair | 0 (0.0%) | 0 (0.0%) |
| Total (Category) | 12 (100.0%) | 0 (0.0%) |
| Total (Overall) | 154 (31.0%) | 343 (69.0%) |
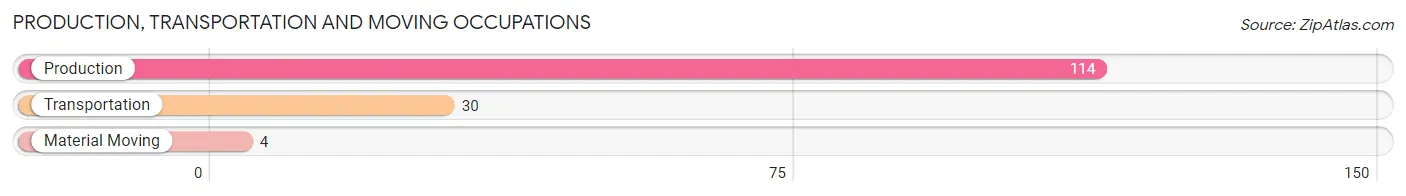
Production, Transportation and Moving Occupations
The most common Production, Transportation and Moving occupations in Itta Bena are Production (114 | 22.9%), Transportation (30 | 6.0%), and Material Moving (4 | 0.8%).
Production, Transportation and Moving Occupations by Sex
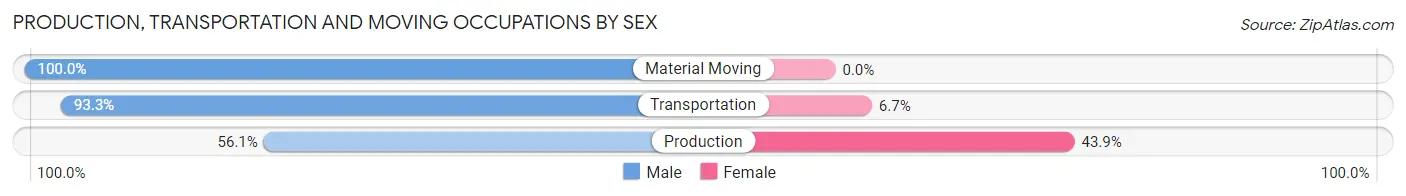
| Occupation | Male | Female |
| Production | 64 (56.1%) | 50 (43.9%) |
| Transportation | 28 (93.3%) | 2 (6.7%) |
| Material Moving | 4 (100.0%) | 0 (0.0%) |
| Total (Category) | 96 (64.9%) | 52 (35.1%) |
| Total (Overall) | 154 (31.0%) | 343 (69.0%) |
Employment Industries by Sex in Itta Bena
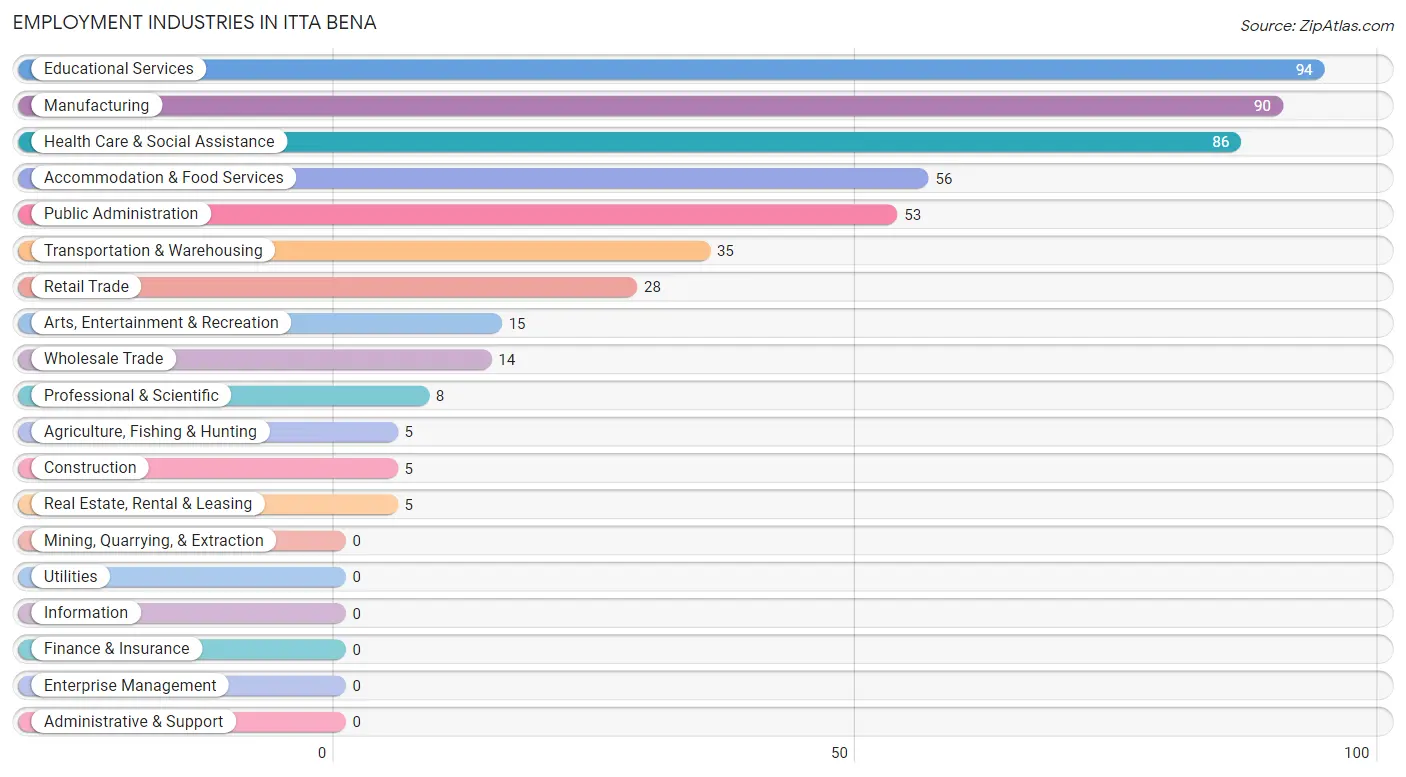
Employment Industries in Itta Bena
The major employment industries in Itta Bena include Educational Services (94 | 18.9%), Manufacturing (90 | 18.1%), Health Care & Social Assistance (86 | 17.3%), Accommodation & Food Services (56 | 11.3%), and Public Administration (53 | 10.7%).
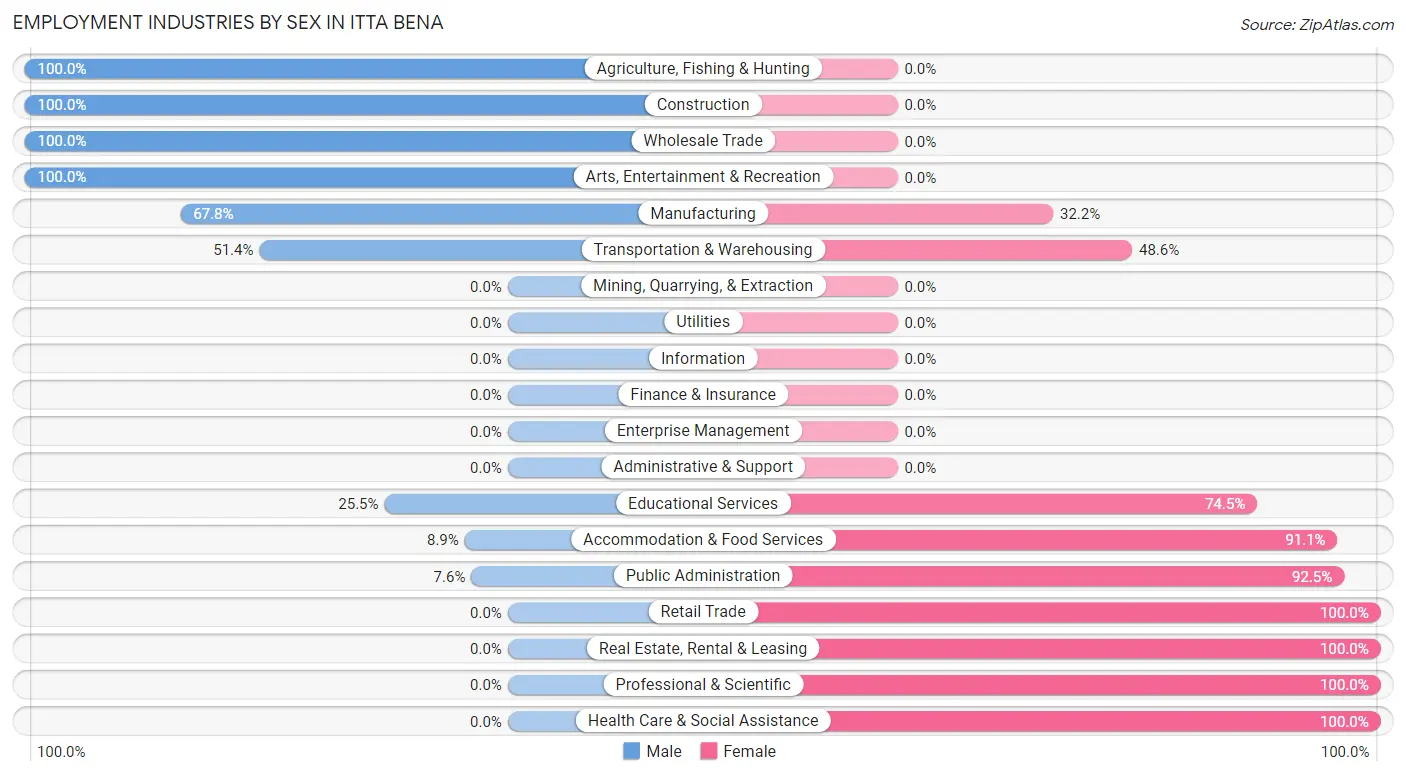
Employment Industries by Sex in Itta Bena
The Itta Bena industries that see more men than women are Agriculture, Fishing & Hunting (100.0%), Construction (100.0%), and Wholesale Trade (100.0%), whereas the industries that tend to have a higher number of women are Retail Trade (100.0%), Real Estate, Rental & Leasing (100.0%), and Professional & Scientific (100.0%).
| Industry | Male | Female |
| Agriculture, Fishing & Hunting | 5 (100.0%) | 0 (0.0%) |
| Mining, Quarrying, & Extraction | 0 (0.0%) | 0 (0.0%) |
| Construction | 5 (100.0%) | 0 (0.0%) |
| Manufacturing | 61 (67.8%) | 29 (32.2%) |
| Wholesale Trade | 14 (100.0%) | 0 (0.0%) |
| Retail Trade | 0 (0.0%) | 28 (100.0%) |
| Transportation & Warehousing | 18 (51.4%) | 17 (48.6%) |
| Utilities | 0 (0.0%) | 0 (0.0%) |
| Information | 0 (0.0%) | 0 (0.0%) |
| Finance & Insurance | 0 (0.0%) | 0 (0.0%) |
| Real Estate, Rental & Leasing | 0 (0.0%) | 5 (100.0%) |
| Professional & Scientific | 0 (0.0%) | 8 (100.0%) |
| Enterprise Management | 0 (0.0%) | 0 (0.0%) |
| Administrative & Support | 0 (0.0%) | 0 (0.0%) |
| Educational Services | 24 (25.5%) | 70 (74.5%) |
| Health Care & Social Assistance | 0 (0.0%) | 86 (100.0%) |
| Arts, Entertainment & Recreation | 15 (100.0%) | 0 (0.0%) |
| Accommodation & Food Services | 5 (8.9%) | 51 (91.1%) |
| Public Administration | 4 (7.5%) | 49 (92.4%) |
| Total | 154 (31.0%) | 343 (69.0%) |
Education in Itta Bena
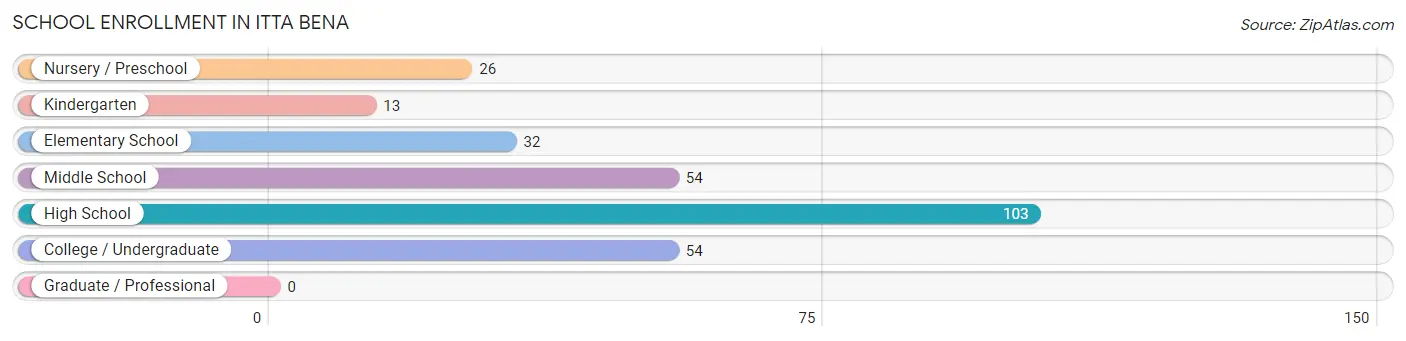
School Enrollment in Itta Bena
The most common levels of schooling among the 282 students in Itta Bena are high school (103 | 36.5%), middle school (54 | 19.2%), and college / undergraduate (54 | 19.2%).
| School Level | # Students | % Students |
| Nursery / Preschool | 26 | 9.2% |
| Kindergarten | 13 | 4.6% |
| Elementary School | 32 | 11.4% |
| Middle School | 54 | 19.2% |
| High School | 103 | 36.5% |
| College / Undergraduate | 54 | 19.2% |
| Graduate / Professional | 0 | 0.0% |
| Total | 282 | 100.0% |
School Enrollment by Age by Funding Source in Itta Bena
Out of a total of 282 students who are enrolled in schools in Itta Bena, 5 (1.8%) attend a private institution, while the remaining 277 (98.2%) are enrolled in public schools. The age group of 5 to 9 year old has the highest likelihood of being enrolled in private schools, with 5 (29.4% in the age bracket) enrolled. Conversely, the age group of 3 to 4 year olds has the lowest likelihood of being enrolled in a private school, with 39 (100.0% in the age bracket) attending a public institution.
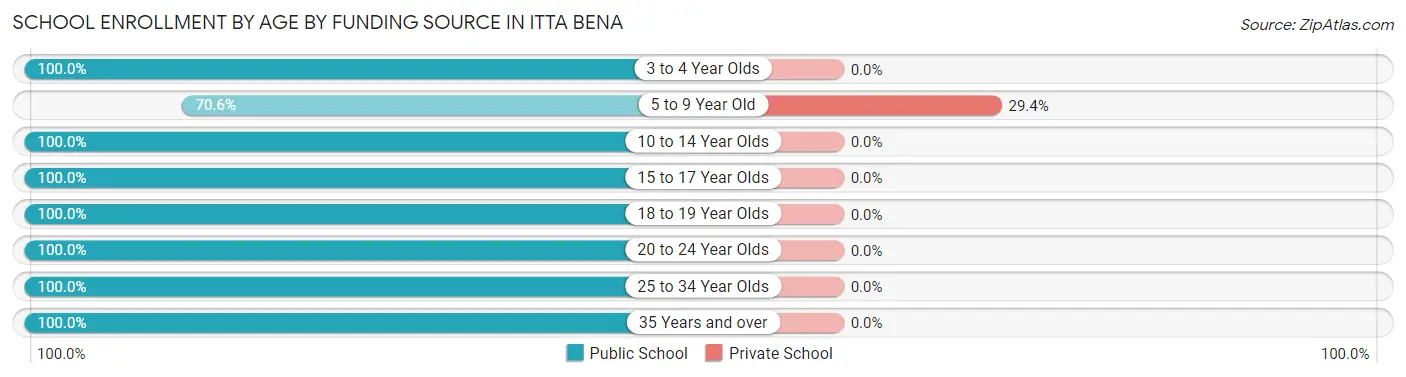
| Age Bracket | Public School | Private School |
| 3 to 4 Year Olds | 39 (100.0%) | 0 (0.0%) |
| 5 to 9 Year Old | 12 (70.6%) | 5 (29.4%) |
| 10 to 14 Year Olds | 72 (100.0%) | 0 (0.0%) |
| 15 to 17 Year Olds | 53 (100.0%) | 0 (0.0%) |
| 18 to 19 Year Olds | 41 (100.0%) | 0 (0.0%) |
| 20 to 24 Year Olds | 32 (100.0%) | 0 (0.0%) |
| 25 to 34 Year Olds | 24 (100.0%) | 0 (0.0%) |
| 35 Years and over | 4 (100.0%) | 0 (0.0%) |
| Total | 277 (98.2%) | 5 (1.8%) |
Educational Attainment by Field of Study in Itta Bena
Education (43 | 34.7%), business (25 | 20.2%), social sciences (16 | 12.9%), engineering (15 | 12.1%), and arts & humanities (9 | 7.3%) are the most common fields of study among 124 individuals in Itta Bena who have obtained a bachelor's degree or higher.
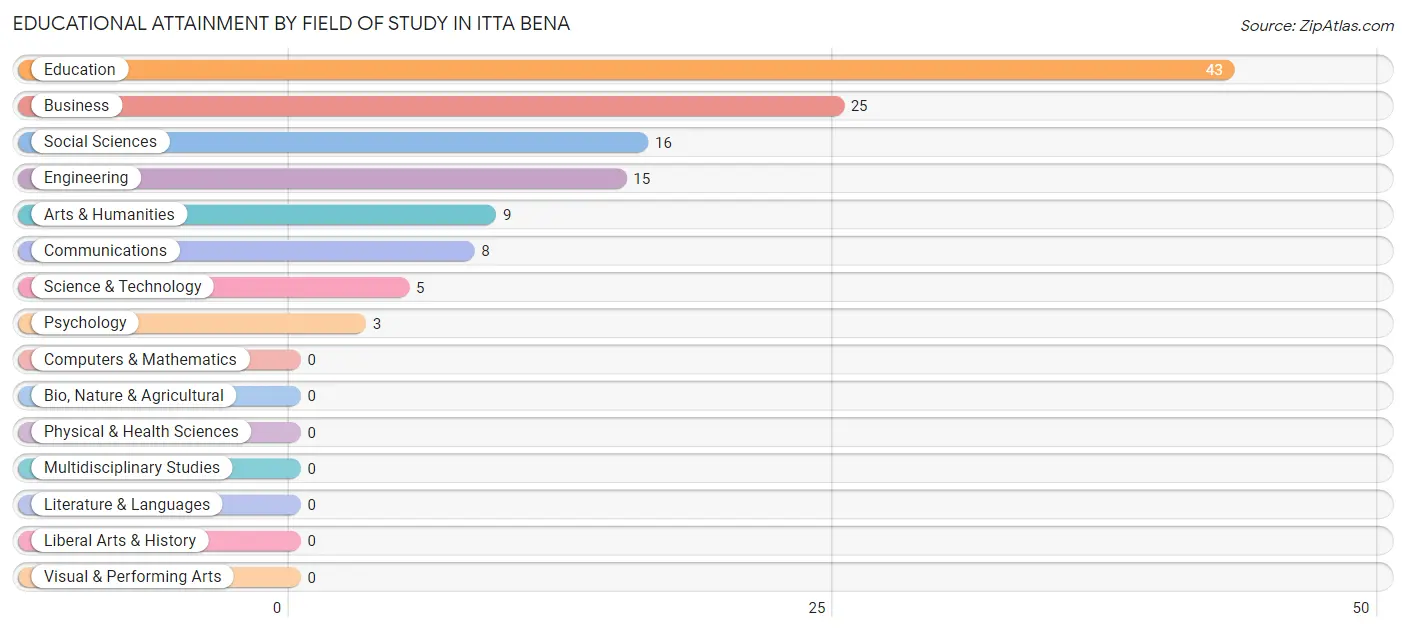
| Field of Study | # Graduates | % Graduates |
| Computers & Mathematics | 0 | 0.0% |
| Bio, Nature & Agricultural | 0 | 0.0% |
| Physical & Health Sciences | 0 | 0.0% |
| Psychology | 3 | 2.4% |
| Social Sciences | 16 | 12.9% |
| Engineering | 15 | 12.1% |
| Multidisciplinary Studies | 0 | 0.0% |
| Science & Technology | 5 | 4.0% |
| Business | 25 | 20.2% |
| Education | 43 | 34.7% |
| Literature & Languages | 0 | 0.0% |
| Liberal Arts & History | 0 | 0.0% |
| Visual & Performing Arts | 0 | 0.0% |
| Communications | 8 | 6.5% |
| Arts & Humanities | 9 | 7.3% |
| Total | 124 | 100.0% |
Transportation & Commute in Itta Bena
Vehicle Availability by Sex in Itta Bena
The most prevalent vehicle ownership categories in Itta Bena are males with 1 vehicle (69, accounting for 50.4%) and females with 1 vehicle (143, making up 22.6%).
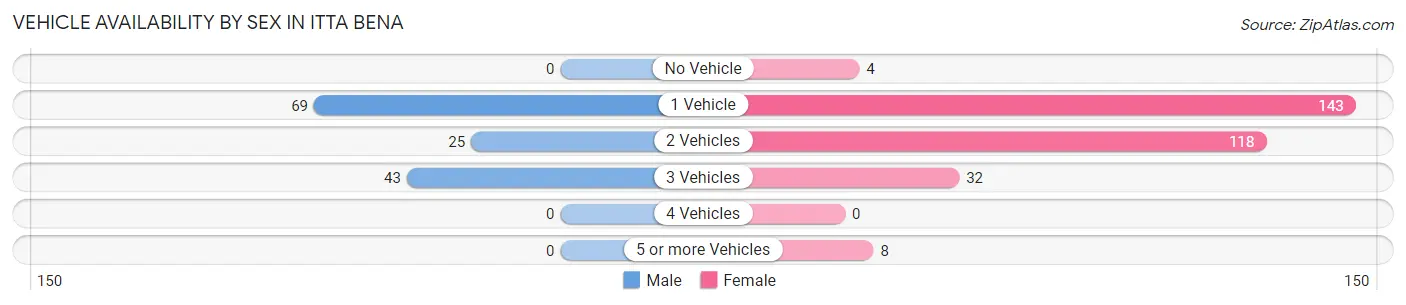
| Vehicles Available | Male | Female |
| No Vehicle | 0 (0.0%) | 4 (1.3%) |
| 1 Vehicle | 69 (50.4%) | 143 (46.9%) |
| 2 Vehicles | 25 (18.2%) | 118 (38.7%) |
| 3 Vehicles | 43 (31.4%) | 32 (10.5%) |
| 4 Vehicles | 0 (0.0%) | 0 (0.0%) |
| 5 or more Vehicles | 0 (0.0%) | 8 (2.6%) |
| Total | 137 (100.0%) | 305 (100.0%) |
Commute Time in Itta Bena
The most frequently occuring commute durations in Itta Bena are 15 to 19 minutes (173 commuters, 39.1%), 20 to 24 minutes (81 commuters, 18.3%), and 30 to 34 minutes (71 commuters, 16.1%).
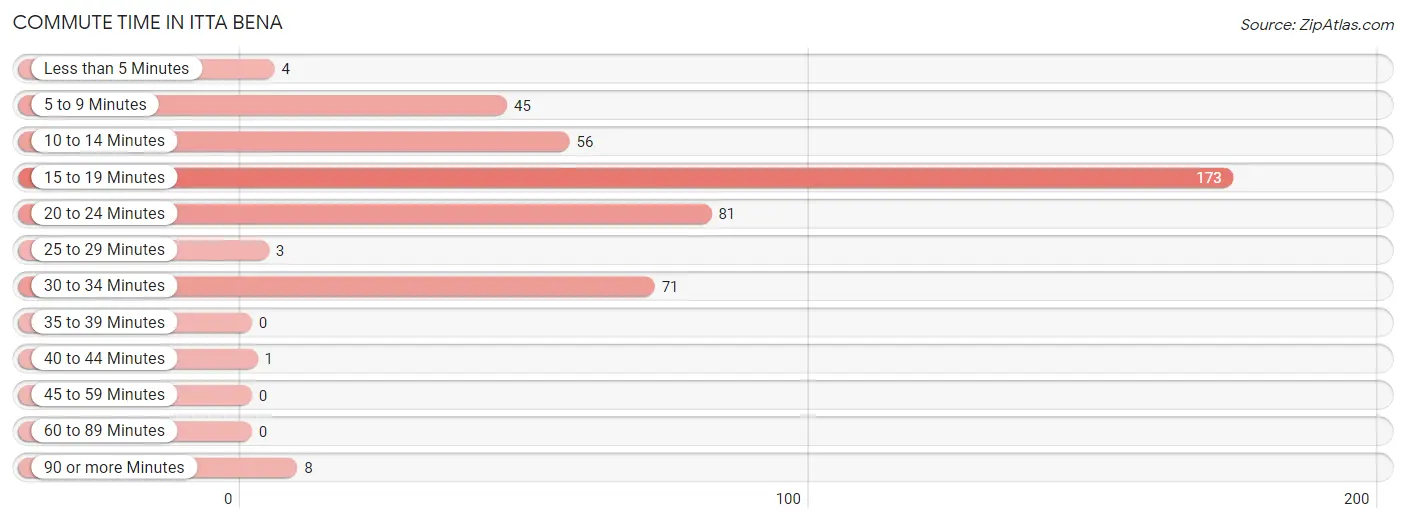
| Commute Time | # Commuters | % Commuters |
| Less than 5 Minutes | 4 | 0.9% |
| 5 to 9 Minutes | 45 | 10.2% |
| 10 to 14 Minutes | 56 | 12.7% |
| 15 to 19 Minutes | 173 | 39.1% |
| 20 to 24 Minutes | 81 | 18.3% |
| 25 to 29 Minutes | 3 | 0.7% |
| 30 to 34 Minutes | 71 | 16.1% |
| 35 to 39 Minutes | 0 | 0.0% |
| 40 to 44 Minutes | 1 | 0.2% |
| 45 to 59 Minutes | 0 | 0.0% |
| 60 to 89 Minutes | 0 | 0.0% |
| 90 or more Minutes | 8 | 1.8% |
Commute Time by Sex in Itta Bena
The most common commute times in Itta Bena are 15 to 19 minutes (55 commuters, 40.2%) for males and 15 to 19 minutes (118 commuters, 38.7%) for females.
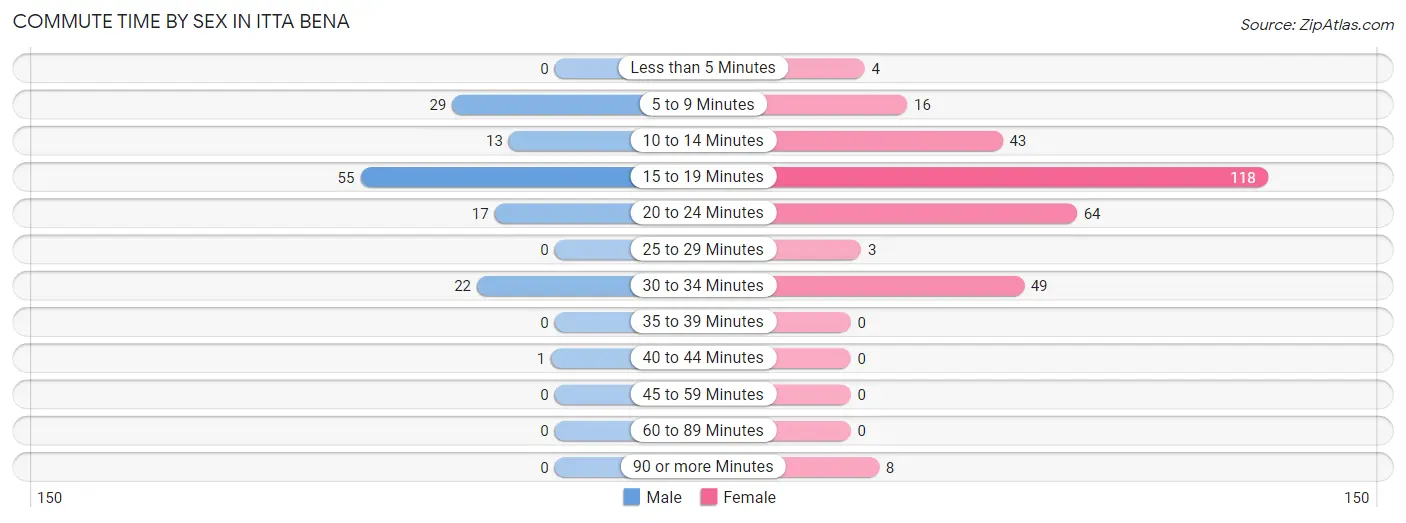
| Commute Time | Male | Female |
| Less than 5 Minutes | 0 (0.0%) | 4 (1.3%) |
| 5 to 9 Minutes | 29 (21.2%) | 16 (5.2%) |
| 10 to 14 Minutes | 13 (9.5%) | 43 (14.1%) |
| 15 to 19 Minutes | 55 (40.2%) | 118 (38.7%) |
| 20 to 24 Minutes | 17 (12.4%) | 64 (21.0%) |
| 25 to 29 Minutes | 0 (0.0%) | 3 (1.0%) |
| 30 to 34 Minutes | 22 (16.1%) | 49 (16.1%) |
| 35 to 39 Minutes | 0 (0.0%) | 0 (0.0%) |
| 40 to 44 Minutes | 1 (0.7%) | 0 (0.0%) |
| 45 to 59 Minutes | 0 (0.0%) | 0 (0.0%) |
| 60 to 89 Minutes | 0 (0.0%) | 0 (0.0%) |
| 90 or more Minutes | 0 (0.0%) | 8 (2.6%) |
Time of Departure to Work by Sex in Itta Bena
The most frequent times of departure to work in Itta Bena are 6:30 AM to 6:59 AM (72, 52.5%) for males and 7:00 AM to 7:29 AM (121, 39.7%) for females.
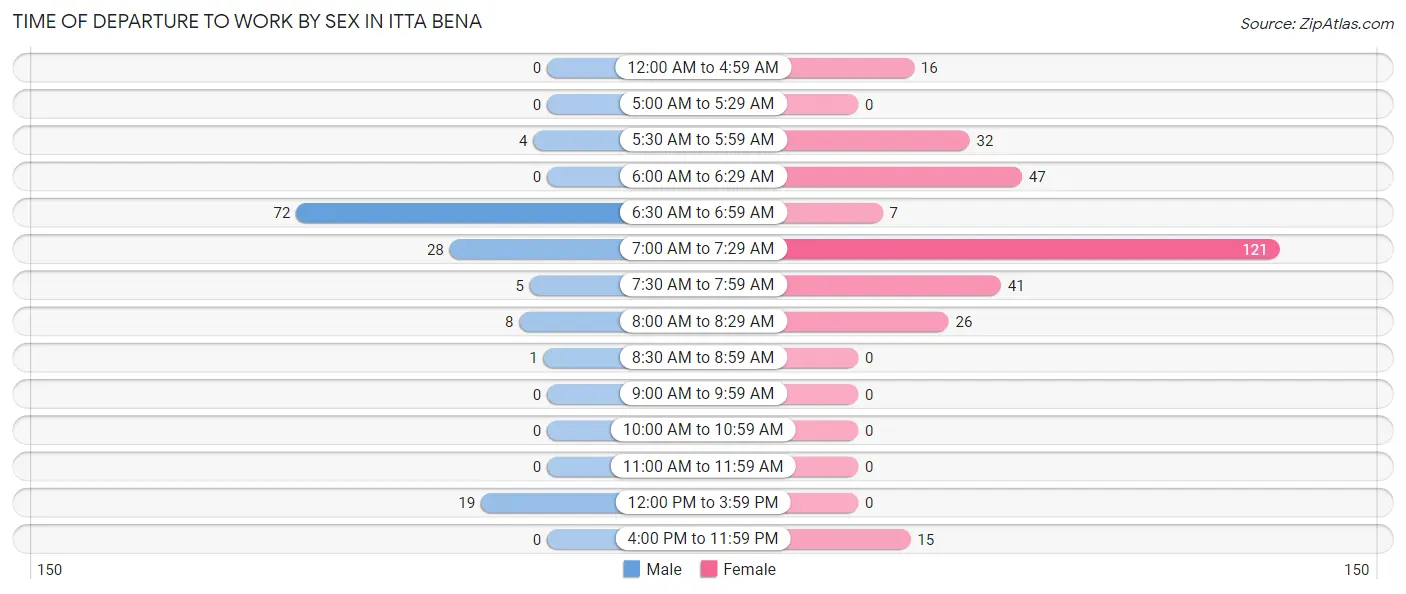
| Time of Departure | Male | Female |
| 12:00 AM to 4:59 AM | 0 (0.0%) | 16 (5.2%) |
| 5:00 AM to 5:29 AM | 0 (0.0%) | 0 (0.0%) |
| 5:30 AM to 5:59 AM | 4 (2.9%) | 32 (10.5%) |
| 6:00 AM to 6:29 AM | 0 (0.0%) | 47 (15.4%) |
| 6:30 AM to 6:59 AM | 72 (52.5%) | 7 (2.3%) |
| 7:00 AM to 7:29 AM | 28 (20.4%) | 121 (39.7%) |
| 7:30 AM to 7:59 AM | 5 (3.6%) | 41 (13.4%) |
| 8:00 AM to 8:29 AM | 8 (5.8%) | 26 (8.5%) |
| 8:30 AM to 8:59 AM | 1 (0.7%) | 0 (0.0%) |
| 9:00 AM to 9:59 AM | 0 (0.0%) | 0 (0.0%) |
| 10:00 AM to 10:59 AM | 0 (0.0%) | 0 (0.0%) |
| 11:00 AM to 11:59 AM | 0 (0.0%) | 0 (0.0%) |
| 12:00 PM to 3:59 PM | 19 (13.9%) | 0 (0.0%) |
| 4:00 PM to 11:59 PM | 0 (0.0%) | 15 (4.9%) |
| Total | 137 (100.0%) | 305 (100.0%) |
Housing Occupancy in Itta Bena
Occupancy by Ownership in Itta Bena
Of the total 605 dwellings in Itta Bena, owner-occupied units account for 232 (38.4%), while renter-occupied units make up 373 (61.7%).
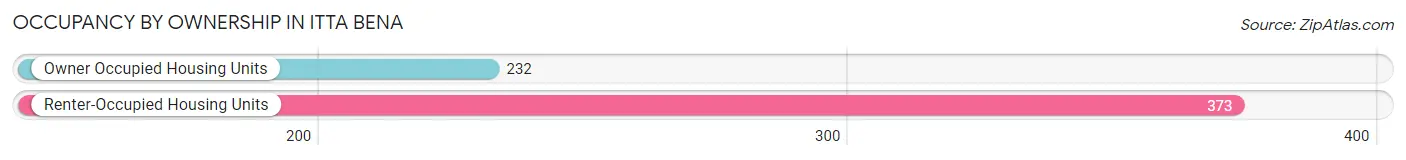
| Occupancy | # Housing Units | % Housing Units |
| Owner Occupied Housing Units | 232 | 38.4% |
| Renter-Occupied Housing Units | 373 | 61.7% |
| Total Occupied Housing Units | 605 | 100.0% |
Occupancy by Household Size in Itta Bena
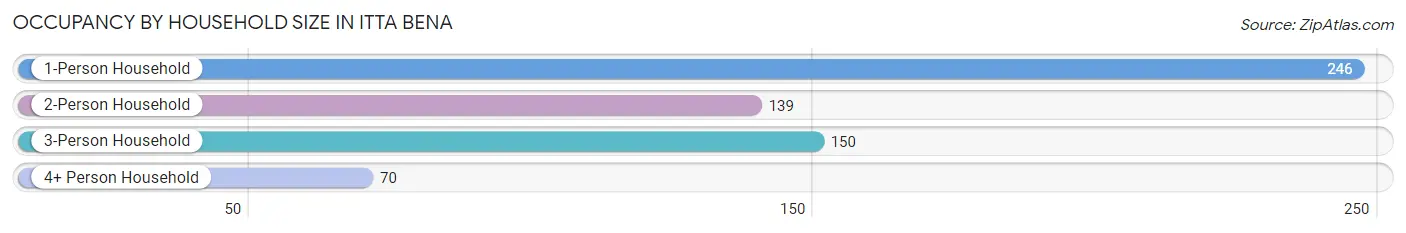
| Household Size | # Housing Units | % Housing Units |
| 1-Person Household | 246 | 40.7% |
| 2-Person Household | 139 | 23.0% |
| 3-Person Household | 150 | 24.8% |
| 4+ Person Household | 70 | 11.6% |
| Total Housing Units | 605 | 100.0% |
Occupancy by Ownership by Household Size in Itta Bena
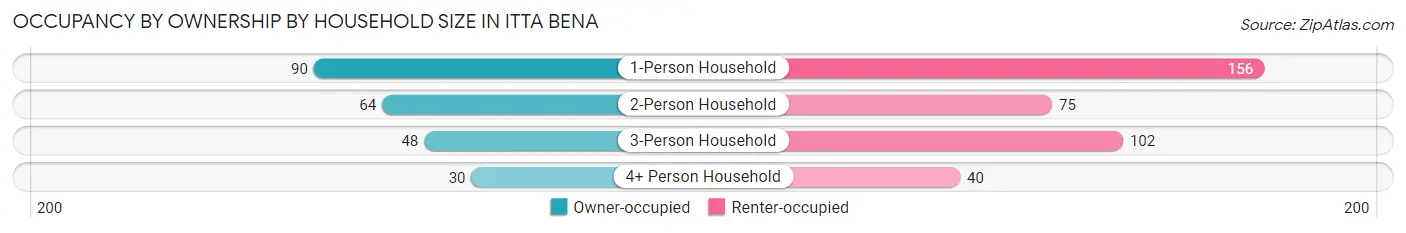
| Household Size | Owner-occupied | Renter-occupied |
| 1-Person Household | 90 (36.6%) | 156 (63.4%) |
| 2-Person Household | 64 (46.0%) | 75 (54.0%) |
| 3-Person Household | 48 (32.0%) | 102 (68.0%) |
| 4+ Person Household | 30 (42.9%) | 40 (57.1%) |
| Total Housing Units | 232 (38.4%) | 373 (61.7%) |
Occupancy by Educational Attainment in Itta Bena
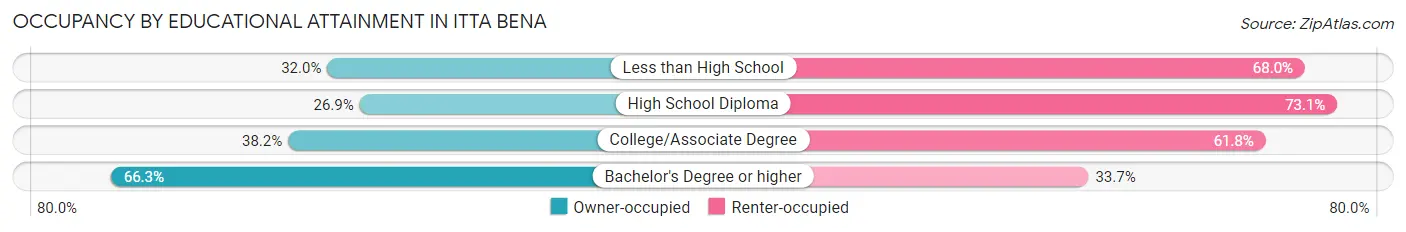
| Household Size | Owner-occupied | Renter-occupied |
| Less than High School | 40 (32.0%) | 85 (68.0%) |
| High School Diploma | 43 (26.9%) | 117 (73.1%) |
| College/Associate Degree | 86 (38.2%) | 139 (61.8%) |
| Bachelor's Degree or higher | 63 (66.3%) | 32 (33.7%) |
Occupancy by Age of Householder in Itta Bena
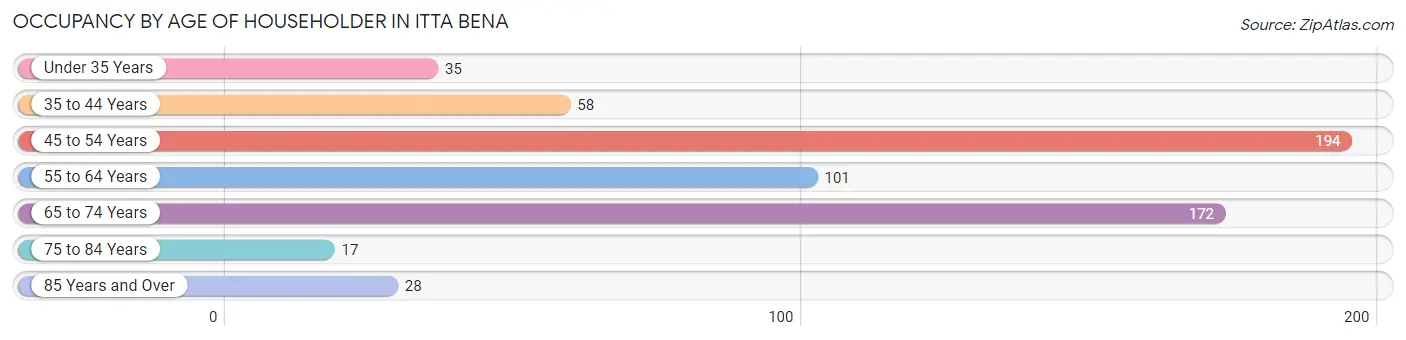
| Age Bracket | # Households | % Households |
| Under 35 Years | 35 | 5.8% |
| 35 to 44 Years | 58 | 9.6% |
| 45 to 54 Years | 194 | 32.1% |
| 55 to 64 Years | 101 | 16.7% |
| 65 to 74 Years | 172 | 28.4% |
| 75 to 84 Years | 17 | 2.8% |
| 85 Years and Over | 28 | 4.6% |
| Total | 605 | 100.0% |
Housing Finances in Itta Bena
Median Income by Occupancy in Itta Bena
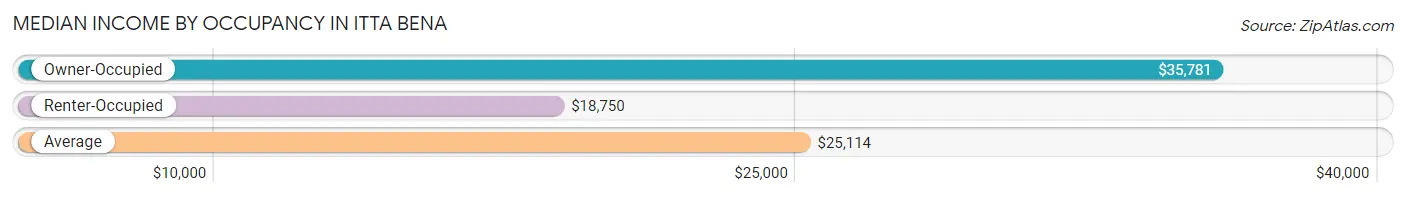
| Occupancy Type | # Households | Median Income |
| Owner-Occupied | 232 (38.4%) | $35,781 |
| Renter-Occupied | 373 (61.7%) | $18,750 |
| Average | 605 (100.0%) | $25,114 |
Occupancy by Householder Income Bracket in Itta Bena
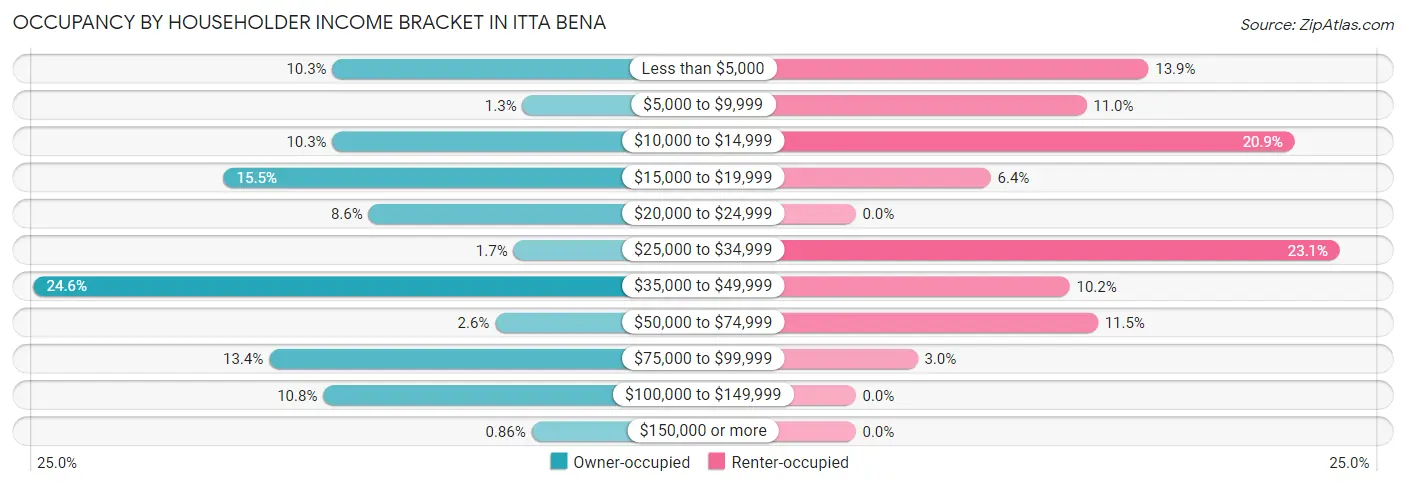
| Income Bracket | Owner-occupied | Renter-occupied |
| Less than $5,000 | 24 (10.3%) | 52 (13.9%) |
| $5,000 to $9,999 | 3 (1.3%) | 41 (11.0%) |
| $10,000 to $14,999 | 24 (10.3%) | 78 (20.9%) |
| $15,000 to $19,999 | 36 (15.5%) | 24 (6.4%) |
| $20,000 to $24,999 | 20 (8.6%) | 0 (0.0%) |
| $25,000 to $34,999 | 4 (1.7%) | 86 (23.1%) |
| $35,000 to $49,999 | 57 (24.6%) | 38 (10.2%) |
| $50,000 to $74,999 | 6 (2.6%) | 43 (11.5%) |
| $75,000 to $99,999 | 31 (13.4%) | 11 (2.9%) |
| $100,000 to $149,999 | 25 (10.8%) | 0 (0.0%) |
| $150,000 or more | 2 (0.9%) | 0 (0.0%) |
| Total | 232 (100.0%) | 373 (100.0%) |
Monthly Housing Cost Tiers in Itta Bena
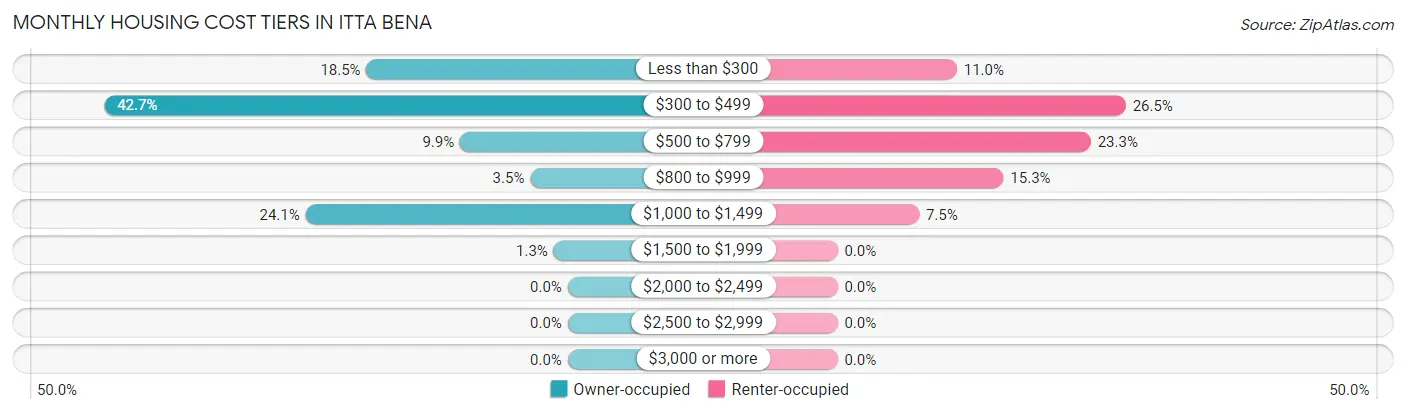
| Monthly Cost | Owner-occupied | Renter-occupied |
| Less than $300 | 43 (18.5%) | 41 (11.0%) |
| $300 to $499 | 99 (42.7%) | 99 (26.5%) |
| $500 to $799 | 23 (9.9%) | 87 (23.3%) |
| $800 to $999 | 8 (3.5%) | 57 (15.3%) |
| $1,000 to $1,499 | 56 (24.1%) | 28 (7.5%) |
| $1,500 to $1,999 | 3 (1.3%) | 0 (0.0%) |
| $2,000 to $2,499 | 0 (0.0%) | 0 (0.0%) |
| $2,500 to $2,999 | 0 (0.0%) | 0 (0.0%) |
| $3,000 or more | 0 (0.0%) | 0 (0.0%) |
| Total | 232 (100.0%) | 373 (100.0%) |
Physical Housing Characteristics in Itta Bena
Housing Structures in Itta Bena
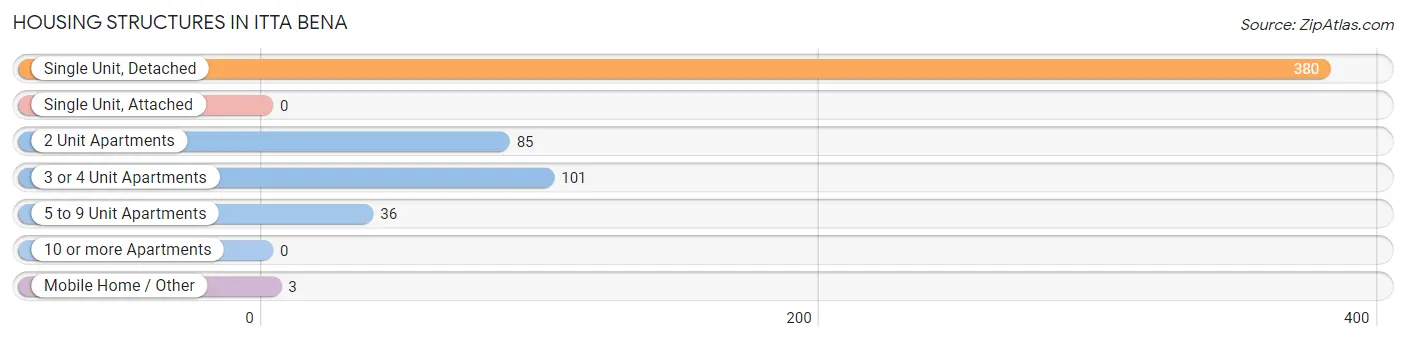
| Structure Type | # Housing Units | % Housing Units |
| Single Unit, Detached | 380 | 62.8% |
| Single Unit, Attached | 0 | 0.0% |
| 2 Unit Apartments | 85 | 14.1% |
| 3 or 4 Unit Apartments | 101 | 16.7% |
| 5 to 9 Unit Apartments | 36 | 5.9% |
| 10 or more Apartments | 0 | 0.0% |
| Mobile Home / Other | 3 | 0.5% |
| Total | 605 | 100.0% |
Housing Structures by Occupancy in Itta Bena
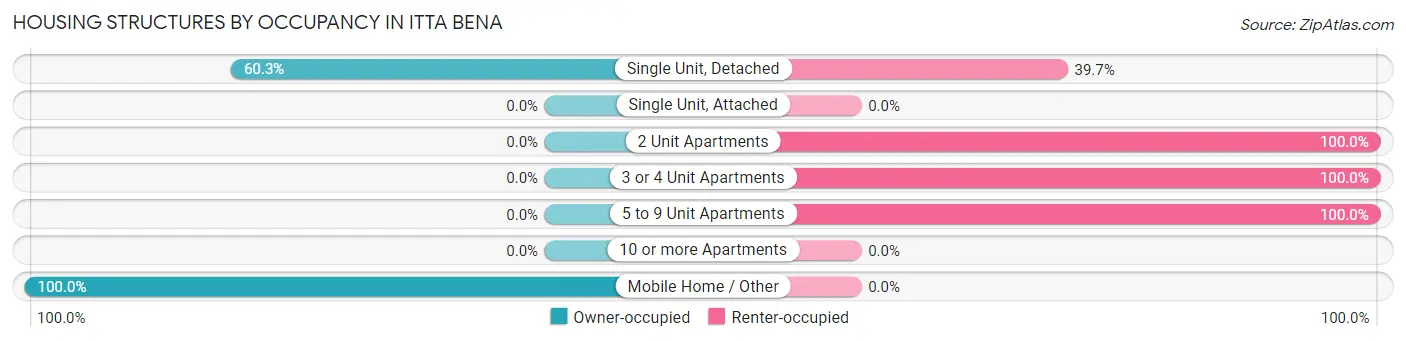
| Structure Type | Owner-occupied | Renter-occupied |
| Single Unit, Detached | 229 (60.3%) | 151 (39.7%) |
| Single Unit, Attached | 0 (0.0%) | 0 (0.0%) |
| 2 Unit Apartments | 0 (0.0%) | 85 (100.0%) |
| 3 or 4 Unit Apartments | 0 (0.0%) | 101 (100.0%) |
| 5 to 9 Unit Apartments | 0 (0.0%) | 36 (100.0%) |
| 10 or more Apartments | 0 (0.0%) | 0 (0.0%) |
| Mobile Home / Other | 3 (100.0%) | 0 (0.0%) |
| Total | 232 (38.4%) | 373 (61.7%) |
Housing Structures by Number of Rooms in Itta Bena
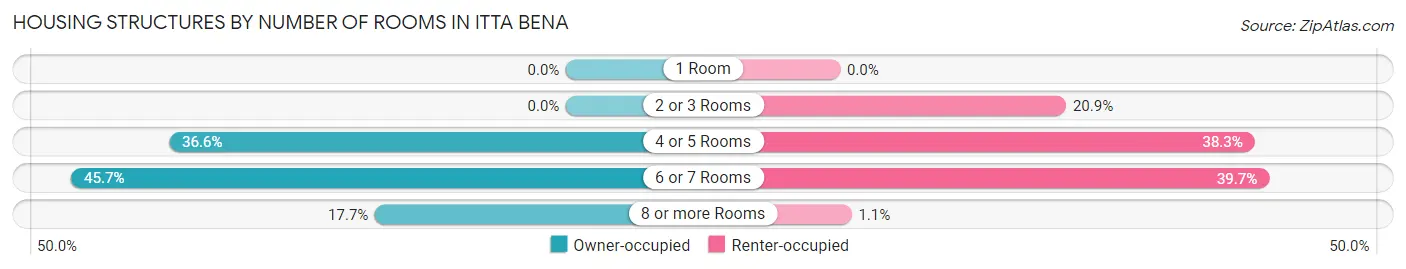
| Number of Rooms | Owner-occupied | Renter-occupied |
| 1 Room | 0 (0.0%) | 0 (0.0%) |
| 2 or 3 Rooms | 0 (0.0%) | 78 (20.9%) |
| 4 or 5 Rooms | 85 (36.6%) | 143 (38.3%) |
| 6 or 7 Rooms | 106 (45.7%) | 148 (39.7%) |
| 8 or more Rooms | 41 (17.7%) | 4 (1.1%) |
| Total | 232 (100.0%) | 373 (100.0%) |
Housing Structure by Heating Type in Itta Bena
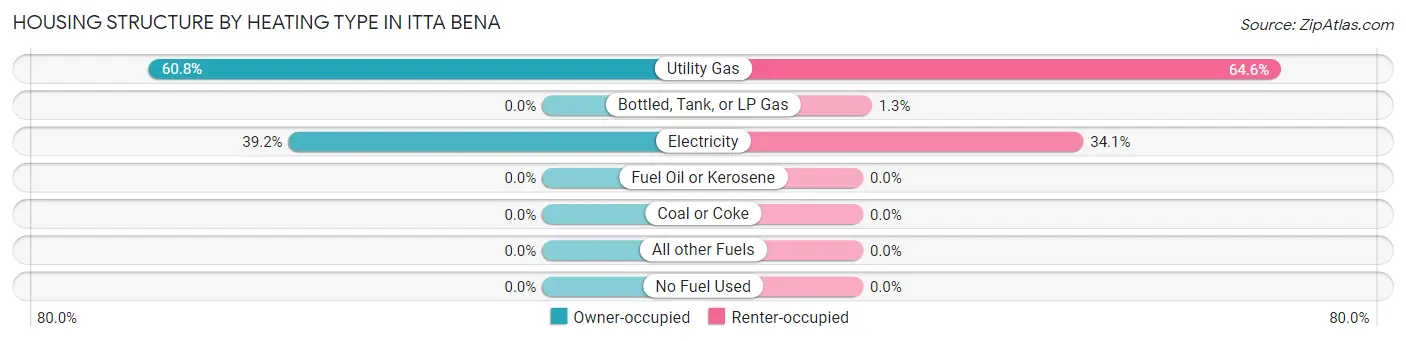
| Heating Type | Owner-occupied | Renter-occupied |
| Utility Gas | 141 (60.8%) | 241 (64.6%) |
| Bottled, Tank, or LP Gas | 0 (0.0%) | 5 (1.3%) |
| Electricity | 91 (39.2%) | 127 (34.1%) |
| Fuel Oil or Kerosene | 0 (0.0%) | 0 (0.0%) |
| Coal or Coke | 0 (0.0%) | 0 (0.0%) |
| All other Fuels | 0 (0.0%) | 0 (0.0%) |
| No Fuel Used | 0 (0.0%) | 0 (0.0%) |
| Total | 232 (100.0%) | 373 (100.0%) |
Household Vehicle Usage in Itta Bena
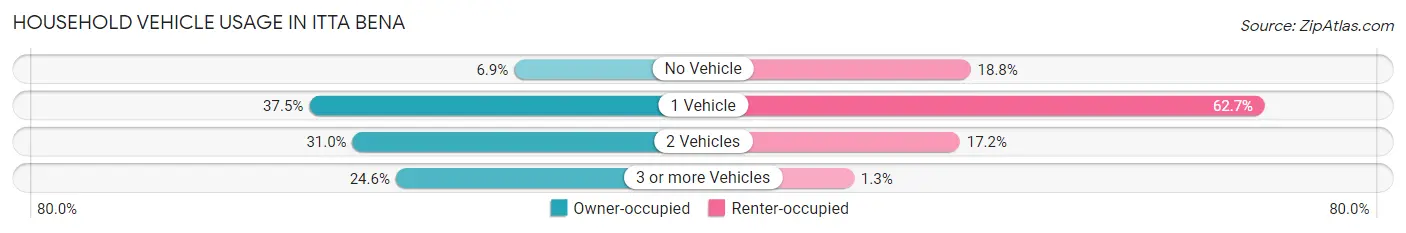
| Vehicles per Household | Owner-occupied | Renter-occupied |
| No Vehicle | 16 (6.9%) | 70 (18.8%) |
| 1 Vehicle | 87 (37.5%) | 234 (62.7%) |
| 2 Vehicles | 72 (31.0%) | 64 (17.2%) |
| 3 or more Vehicles | 57 (24.6%) | 5 (1.3%) |
| Total | 232 (100.0%) | 373 (100.0%) |
Real Estate & Mortgages in Itta Bena
Real Estate and Mortgage Overview in Itta Bena
| Characteristic | Without Mortgage | With Mortgage |
| Housing Units | 153 | 79 |
| Median Property Value | $80,200 | $118,400 |
| Median Household Income | $19,570 | $2 |
| Monthly Housing Costs | $341 | $0 |
| Real Estate Taxes | $674 | $18 |
Property Value by Mortgage Status in Itta Bena
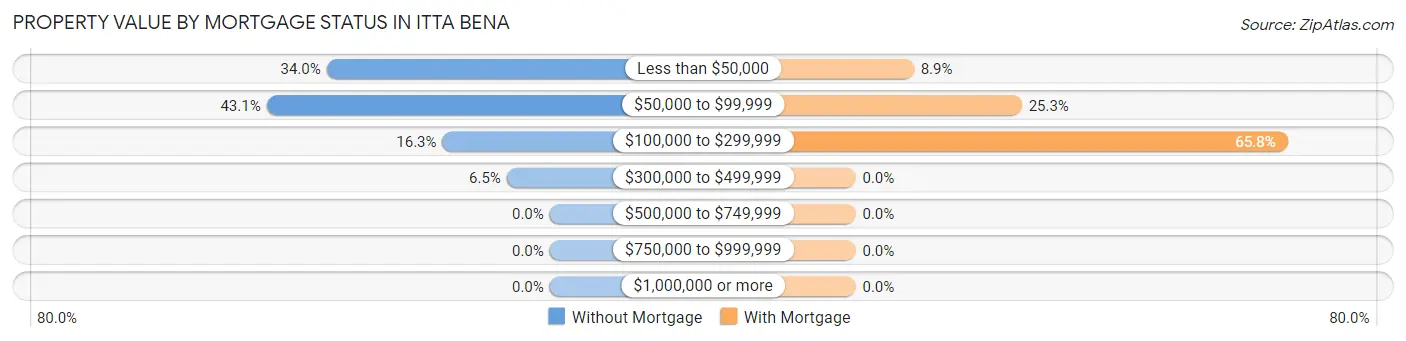
| Property Value | Without Mortgage | With Mortgage |
| Less than $50,000 | 52 (34.0%) | 7 (8.9%) |
| $50,000 to $99,999 | 66 (43.1%) | 20 (25.3%) |
| $100,000 to $299,999 | 25 (16.3%) | 52 (65.8%) |
| $300,000 to $499,999 | 10 (6.5%) | 0 (0.0%) |
| $500,000 to $749,999 | 0 (0.0%) | 0 (0.0%) |
| $750,000 to $999,999 | 0 (0.0%) | 0 (0.0%) |
| $1,000,000 or more | 0 (0.0%) | 0 (0.0%) |
| Total | 153 (100.0%) | 79 (100.0%) |
Household Income by Mortgage Status in Itta Bena
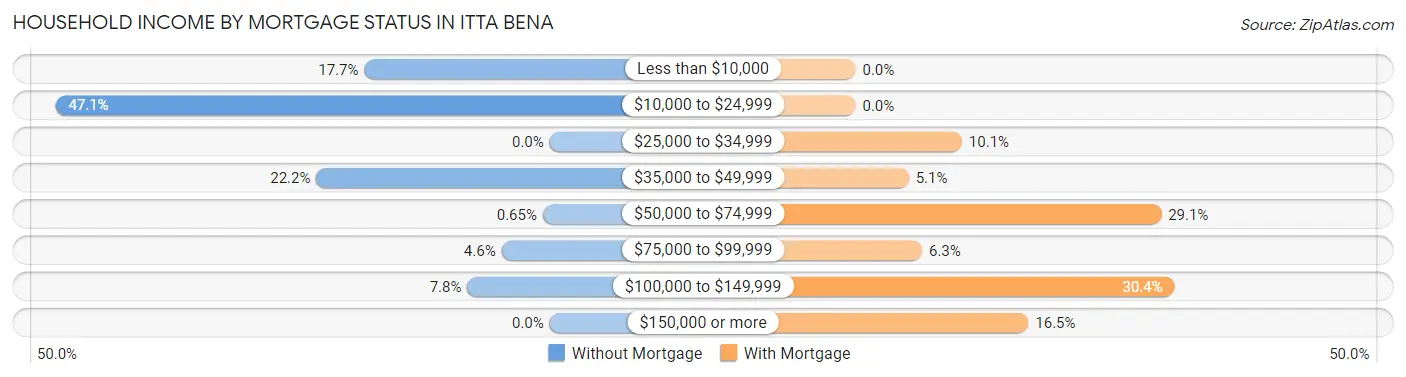
| Household Income | Without Mortgage | With Mortgage |
| Less than $10,000 | 27 (17.6%) | 0 (0.0%) |
| $10,000 to $24,999 | 72 (47.1%) | 0 (0.0%) |
| $25,000 to $34,999 | 0 (0.0%) | 8 (10.1%) |
| $35,000 to $49,999 | 34 (22.2%) | 4 (5.1%) |
| $50,000 to $74,999 | 1 (0.6%) | 23 (29.1%) |
| $75,000 to $99,999 | 7 (4.6%) | 5 (6.3%) |
| $100,000 to $149,999 | 12 (7.8%) | 24 (30.4%) |
| $150,000 or more | 0 (0.0%) | 13 (16.5%) |
| Total | 153 (100.0%) | 79 (100.0%) |
Property Value to Household Income Ratio in Itta Bena
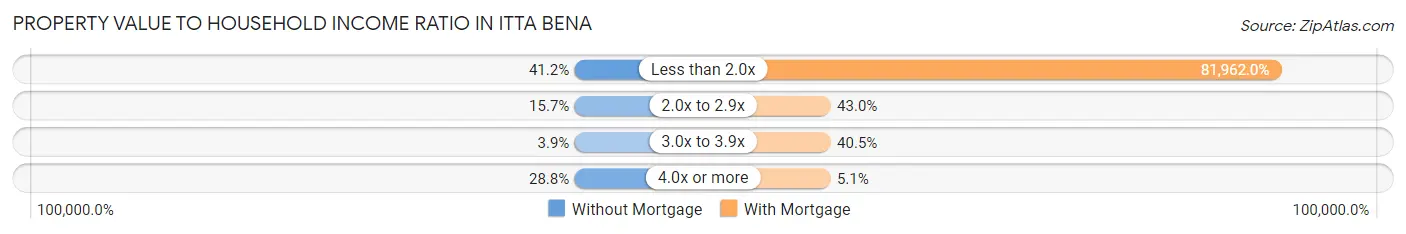
| Value-to-Income Ratio | Without Mortgage | With Mortgage |
| Less than 2.0x | 63 (41.2%) | 64,750 (81,962.0%) |
| 2.0x to 2.9x | 24 (15.7%) | 34 (43.0%) |
| 3.0x to 3.9x | 6 (3.9%) | 32 (40.5%) |
| 4.0x or more | 44 (28.8%) | 4 (5.1%) |
| Total | 153 (100.0%) | 79 (100.0%) |
Real Estate Taxes by Mortgage Status in Itta Bena
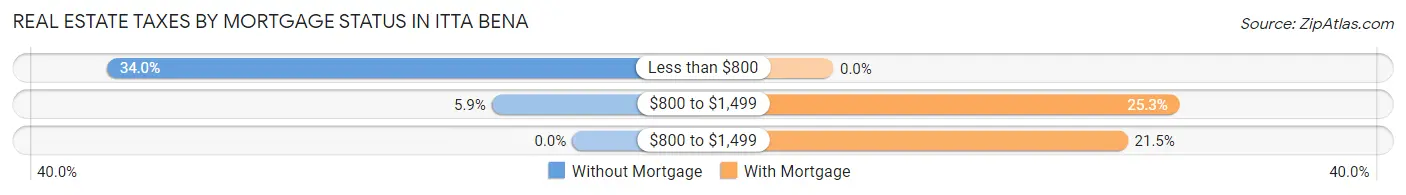
| Property Taxes | Without Mortgage | With Mortgage |
| Less than $800 | 52 (34.0%) | 0 (0.0%) |
| $800 to $1,499 | 9 (5.9%) | 20 (25.3%) |
| $800 to $1,499 | 0 (0.0%) | 17 (21.5%) |
| Total | 153 (100.0%) | 79 (100.0%) |
Health & Disability in Itta Bena
Health Insurance Coverage by Age in Itta Bena
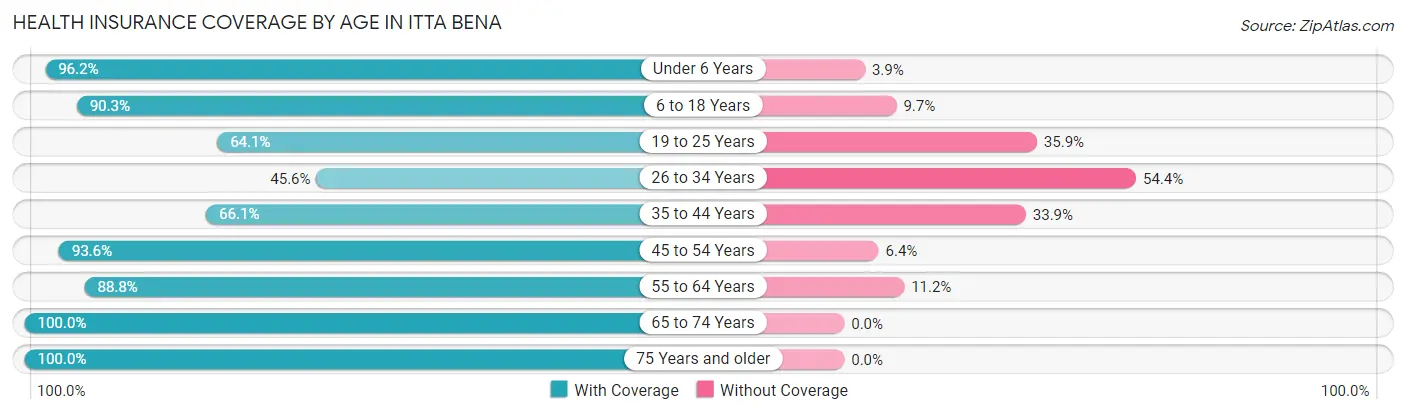
| Age Bracket | With Coverage | Without Coverage |
| Under 6 Years | 125 (96.2%) | 5 (3.8%) |
| 6 to 18 Years | 167 (90.3%) | 18 (9.7%) |
| 19 to 25 Years | 91 (64.1%) | 51 (35.9%) |
| 26 to 34 Years | 119 (45.6%) | 142 (54.4%) |
| 35 to 44 Years | 84 (66.1%) | 43 (33.9%) |
| 45 to 54 Years | 205 (93.6%) | 14 (6.4%) |
| 55 to 64 Years | 167 (88.8%) | 21 (11.2%) |
| 65 to 74 Years | 211 (100.0%) | 0 (0.0%) |
| 75 Years and older | 69 (100.0%) | 0 (0.0%) |
| Total | 1,238 (80.8%) | 294 (19.2%) |
Health Insurance Coverage by Citizenship Status in Itta Bena
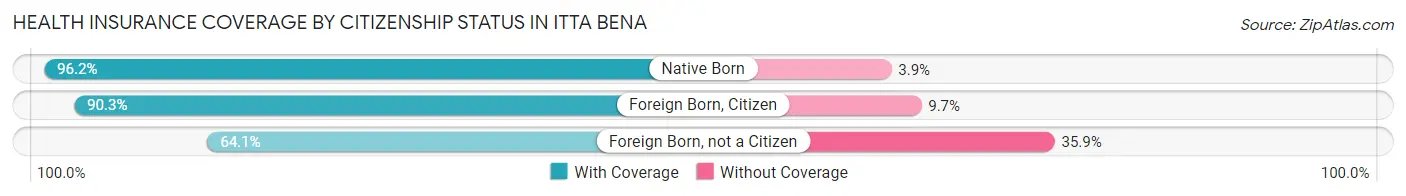
| Citizenship Status | With Coverage | Without Coverage |
| Native Born | 125 (96.2%) | 5 (3.8%) |
| Foreign Born, Citizen | 167 (90.3%) | 18 (9.7%) |
| Foreign Born, not a Citizen | 91 (64.1%) | 51 (35.9%) |
Health Insurance Coverage by Household Income in Itta Bena
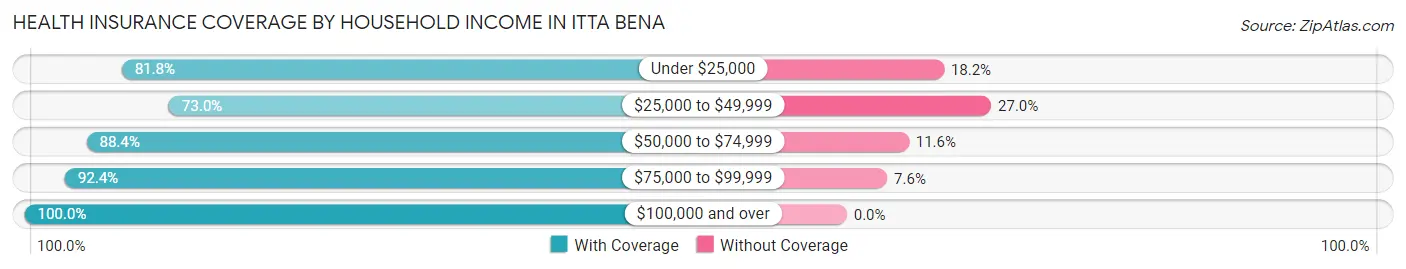
| Household Income | With Coverage | Without Coverage |
| Under $25,000 | 490 (81.8%) | 109 (18.2%) |
| $25,000 to $49,999 | 429 (73.0%) | 159 (27.0%) |
| $50,000 to $74,999 | 99 (88.4%) | 13 (11.6%) |
| $75,000 to $99,999 | 159 (92.4%) | 13 (7.6%) |
| $100,000 and over | 61 (100.0%) | 0 (0.0%) |
Public vs Private Health Insurance Coverage by Age in Itta Bena
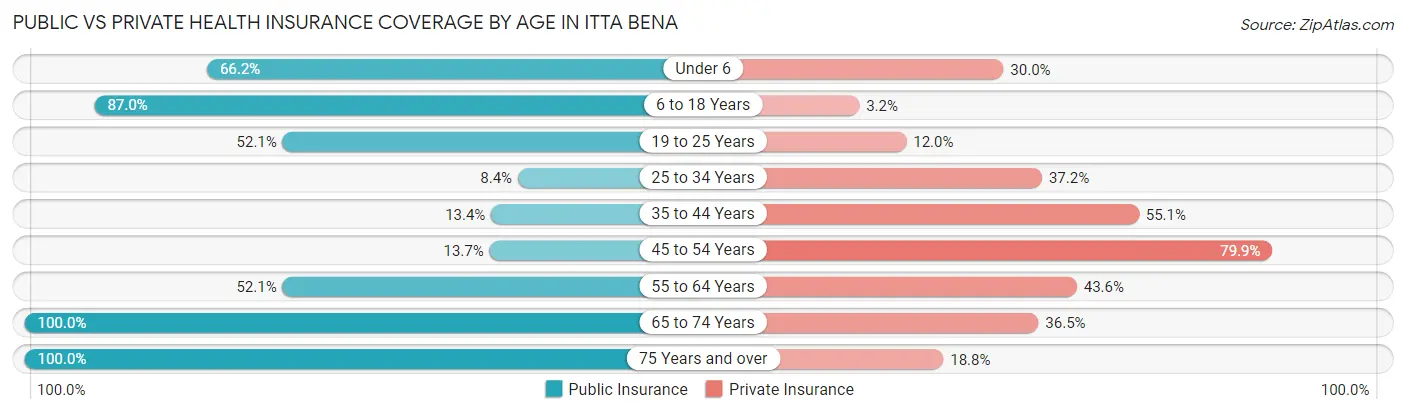
| Age Bracket | Public Insurance | Private Insurance |
| Under 6 | 86 (66.1%) | 39 (30.0%) |
| 6 to 18 Years | 161 (87.0%) | 6 (3.2%) |
| 19 to 25 Years | 74 (52.1%) | 17 (12.0%) |
| 25 to 34 Years | 22 (8.4%) | 97 (37.2%) |
| 35 to 44 Years | 17 (13.4%) | 70 (55.1%) |
| 45 to 54 Years | 30 (13.7%) | 175 (79.9%) |
| 55 to 64 Years | 98 (52.1%) | 82 (43.6%) |
| 65 to 74 Years | 211 (100.0%) | 77 (36.5%) |
| 75 Years and over | 69 (100.0%) | 13 (18.8%) |
| Total | 768 (50.1%) | 576 (37.6%) |
Disability Status by Sex by Age in Itta Bena
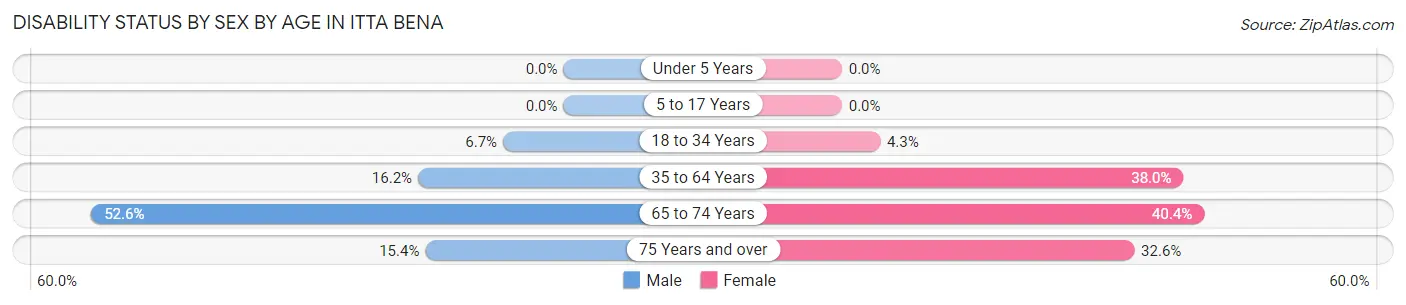
| Age Bracket | Male | Female |
| Under 5 Years | 0 (0.0%) | 0 (0.0%) |
| 5 to 17 Years | 0 (0.0%) | 0 (0.0%) |
| 18 to 34 Years | 15 (6.7%) | 9 (4.3%) |
| 35 to 64 Years | 29 (16.2%) | 135 (38.0%) |
| 65 to 74 Years | 51 (52.6%) | 46 (40.4%) |
| 75 Years and over | 4 (15.4%) | 14 (32.6%) |
Disability Class by Sex by Age in Itta Bena
Disability Class: Hearing Difficulty
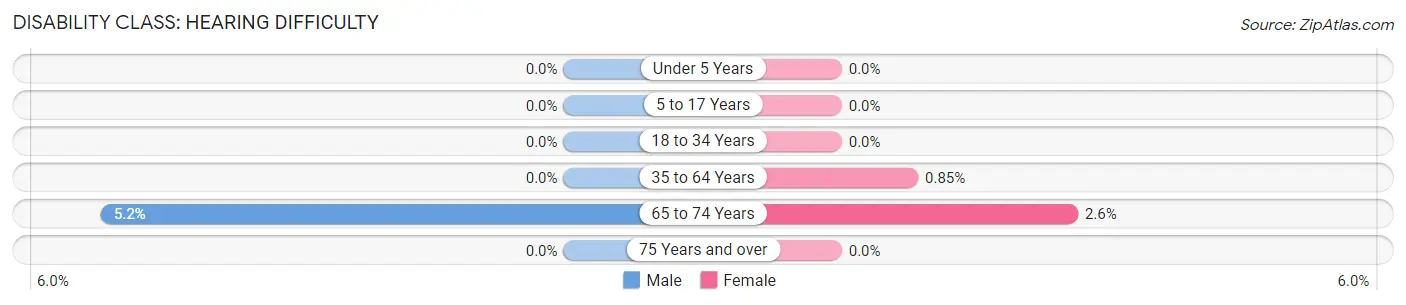
| Age Bracket | Male | Female |
| Under 5 Years | 0 (0.0%) | 0 (0.0%) |
| 5 to 17 Years | 0 (0.0%) | 0 (0.0%) |
| 18 to 34 Years | 0 (0.0%) | 0 (0.0%) |
| 35 to 64 Years | 0 (0.0%) | 3 (0.9%) |
| 65 to 74 Years | 5 (5.1%) | 3 (2.6%) |
| 75 Years and over | 0 (0.0%) | 0 (0.0%) |
Disability Class: Vision Difficulty
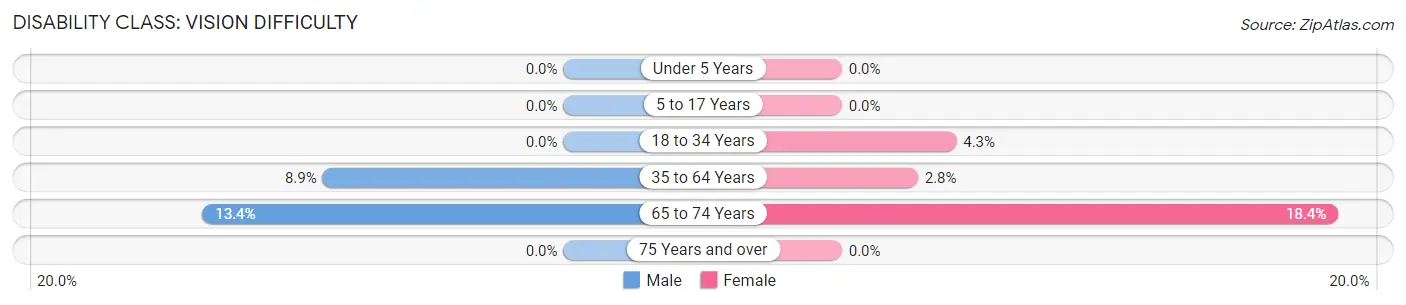
| Age Bracket | Male | Female |
| Under 5 Years | 0 (0.0%) | 0 (0.0%) |
| 5 to 17 Years | 0 (0.0%) | 0 (0.0%) |
| 18 to 34 Years | 0 (0.0%) | 9 (4.3%) |
| 35 to 64 Years | 16 (8.9%) | 10 (2.8%) |
| 65 to 74 Years | 13 (13.4%) | 21 (18.4%) |
| 75 Years and over | 0 (0.0%) | 0 (0.0%) |
Disability Class: Cognitive Difficulty
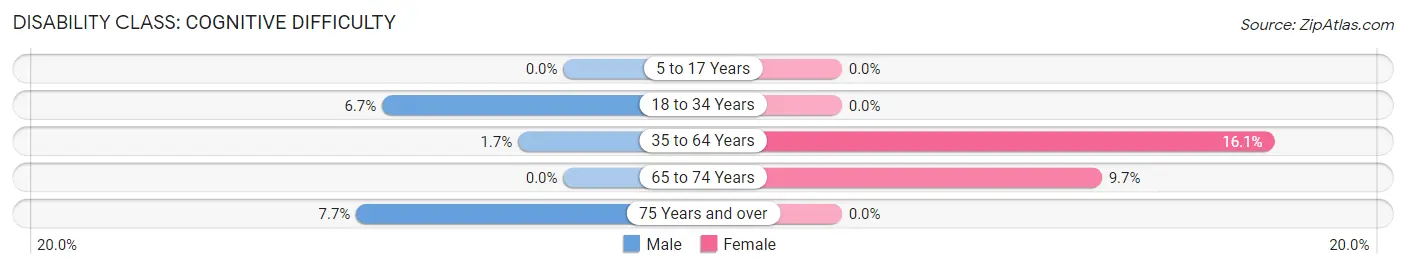
| Age Bracket | Male | Female |
| 5 to 17 Years | 0 (0.0%) | 0 (0.0%) |
| 18 to 34 Years | 15 (6.7%) | 0 (0.0%) |
| 35 to 64 Years | 3 (1.7%) | 57 (16.1%) |
| 65 to 74 Years | 0 (0.0%) | 11 (9.7%) |
| 75 Years and over | 2 (7.7%) | 0 (0.0%) |
Disability Class: Ambulatory Difficulty
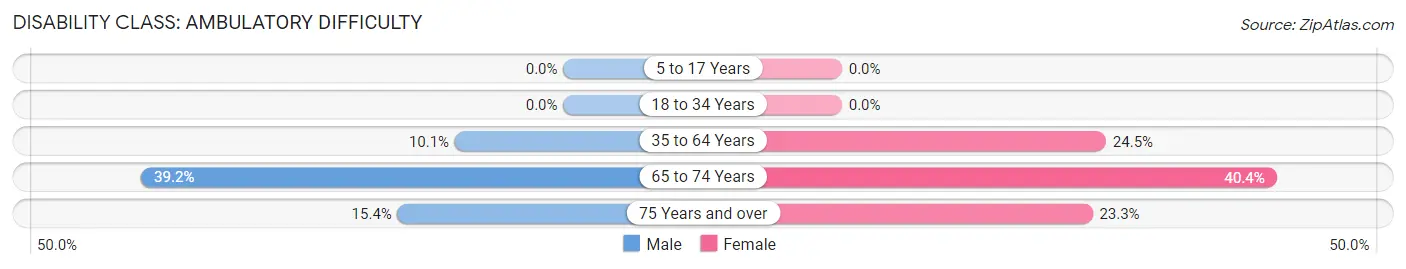
| Age Bracket | Male | Female |
| 5 to 17 Years | 0 (0.0%) | 0 (0.0%) |
| 18 to 34 Years | 0 (0.0%) | 0 (0.0%) |
| 35 to 64 Years | 18 (10.1%) | 87 (24.5%) |
| 65 to 74 Years | 38 (39.2%) | 46 (40.4%) |
| 75 Years and over | 4 (15.4%) | 10 (23.3%) |
Disability Class: Self-Care Difficulty
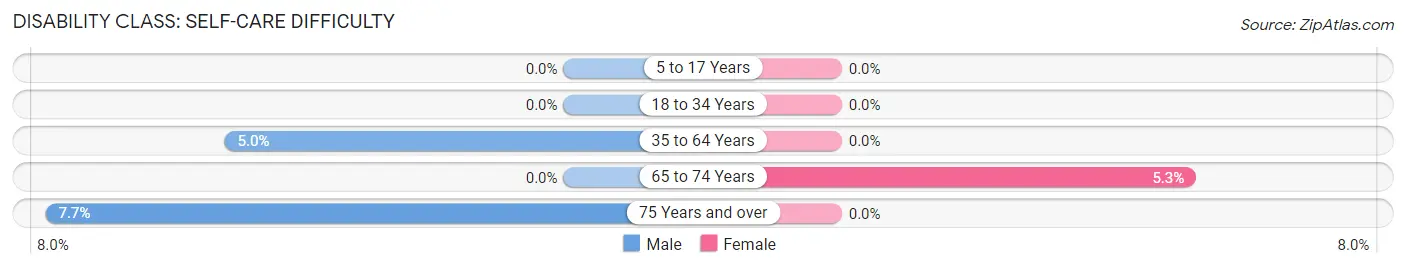
| Age Bracket | Male | Female |
| 5 to 17 Years | 0 (0.0%) | 0 (0.0%) |
| 18 to 34 Years | 0 (0.0%) | 0 (0.0%) |
| 35 to 64 Years | 9 (5.0%) | 0 (0.0%) |
| 65 to 74 Years | 0 (0.0%) | 6 (5.3%) |
| 75 Years and over | 2 (7.7%) | 0 (0.0%) |
Technology Access in Itta Bena
Computing Device Access in Itta Bena
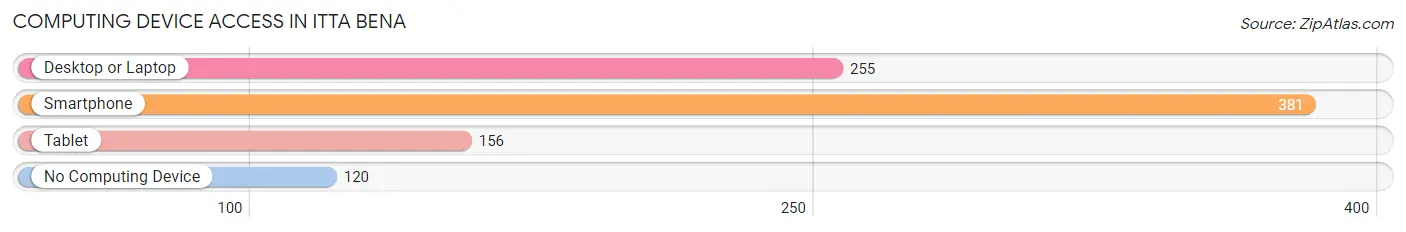
| Device Type | # Households | % Households |
| Desktop or Laptop | 255 | 42.1% |
| Smartphone | 381 | 63.0% |
| Tablet | 156 | 25.8% |
| No Computing Device | 120 | 19.8% |
| Total | 605 | 100.0% |
Internet Access in Itta Bena
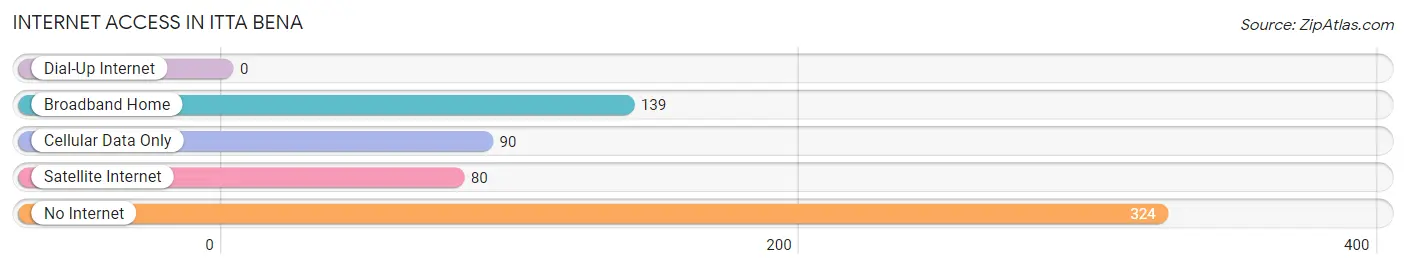
| Internet Type | # Households | % Households |
| Dial-Up Internet | 0 | 0.0% |
| Broadband Home | 139 | 23.0% |
| Cellular Data Only | 90 | 14.9% |
| Satellite Internet | 80 | 13.2% |
| No Internet | 324 | 53.5% |
| Total | 605 | 100.0% |
Itta Bena Summary
Itta Bena is a small town located in the Mississippi Delta region of the United States. It is located in the heart of the Mississippi Delta, about halfway between Memphis, Tennessee and Vicksburg, Mississippi. It is the county seat of Leflore County, Mississippi. Itta Bena is a small town with a population of 1,764 people, according to the 2010 census.
Geography
Itta Bena is located in the Mississippi Delta region of the United States. It is located in the heart of the Mississippi Delta, about halfway between Memphis, Tennessee and Vicksburg, Mississippi. It is the county seat of Leflore County, Mississippi. Itta Bena is situated on the banks of the Yazoo River, which is a tributary of the Mississippi River. The town is located in the Yazoo-Mississippi Delta, which is a flat, alluvial plain that is composed of rich, fertile soil. The town is located in the Yazoo-Mississippi Delta National Heritage Area, which is a federally designated area that is dedicated to preserving the cultural and natural resources of the region.
History
Itta Bena was founded in 1882 by the Leflore County Board of Supervisors. The town was named after the Choctaw phrase “itah benah”, which means “beautiful land”. The town was originally a trading post for the local Choctaw and Chickasaw tribes. It was also a stop on the Yazoo and Mississippi Valley Railroad. The town was incorporated in 1887.
In the early 1900s, Itta Bena was a thriving agricultural center. The town was home to several cotton gins, a sawmill, and a gristmill. The town was also home to several churches, schools, and businesses.
In the 1950s, the town began to decline as the local economy shifted away from agriculture. The town’s population decreased as people moved away in search of better economic opportunities.
Economy
Itta Bena’s economy is largely based on agriculture. The town is home to several cotton gins, a sawmill, and a gristmill. The town is also home to several churches, schools, and businesses.
The town is also home to several manufacturing companies, including a furniture factory, a woodworking plant, and a plastics plant. The town is also home to several retail stores, including a grocery store, a hardware store, and a clothing store.
Demographics
According to the 2010 census, the population of Itta Bena was 1,764 people. The town is predominantly African American, with a population that is 97.3% African American. The median household income in the town is $20,938, and the median age is 36.7 years.
Conclusion
Itta Bena is a small town located in the Mississippi Delta region of the United States. It is located in the heart of the Mississippi Delta, about halfway between Memphis, Tennessee and Vicksburg, Mississippi. It is the county seat of Leflore County, Mississippi. Itta Bena is a small town with a population of 1,764 people, according to the 2010 census. The town’s economy is largely based on agriculture, and it is home to several manufacturing companies, retail stores, churches, schools, and businesses. The town is predominantly African American, with a population that is 97.3% African American.
Common Questions
What is Per Capita Income in Itta Bena?
Per Capita income in Itta Bena is $13,923.
What is the Median Family Income in Itta Bena?
Median Family Income in Itta Bena is $33,895.
What is the Median Household income in Itta Bena?
Median Household Income in Itta Bena is $25,114.
What is Inequality or Gini Index in Itta Bena?
Inequality or Gini Index in Itta Bena is 0.47.
What is the Total Population of Itta Bena?
Total Population of Itta Bena is 1,532.
What is the Total Male Population of Itta Bena?
Total Male Population of Itta Bena is 685.
What is the Total Female Population of Itta Bena?
Total Female Population of Itta Bena is 847.
What is the Ratio of Males per 100 Females in Itta Bena?
There are 80.87 Males per 100 Females in Itta Bena.
What is the Ratio of Females per 100 Males in Itta Bena?
There are 123.65 Females per 100 Males in Itta Bena.
What is the Median Population Age in Itta Bena?
Median Population Age in Itta Bena is 38.6 Years.
What is the Average Family Size in Itta Bena
Average Family Size in Itta Bena is 3.4 People.
What is the Average Household Size in Itta Bena
Average Household Size in Itta Bena is 2.5 People.
How Large is the Labor Force in Itta Bena?
There are 694 People in the Labor Forcein in Itta Bena.
What is the Percentage of People in the Labor Force in Itta Bena?
55.1% of People are in the Labor Force in Itta Bena.
What is the Unemployment Rate in Itta Bena?
Unemployment Rate in Itta Bena is 28.4%.