Mendenhall, MS Map & Demographics
Mendenhall Map
Mendenhall Overview
$23,271
PER CAPITA INCOME
$48,698
AVG FAMILY INCOME
$35,956
AVG HOUSEHOLD INCOME
9.1%
WAGE / INCOME GAP [ % ]
90.9¢/ $1
WAGE / INCOME GAP [ $ ]
$10,536
FAMILY INCOME DEFICIT
0.52
INEQUALITY / GINI INDEX
2,593
TOTAL POPULATION
1,078
MALE POPULATION
1,515
FEMALE POPULATION
71.16
MALES / 100 FEMALES
140.54
FEMALES / 100 MALES
39.0
MEDIAN AGE
3.3
AVG FAMILY SIZE
2.5
AVG HOUSEHOLD SIZE
1,016
LABOR FORCE [ PEOPLE ]
49.3%
PERCENT IN LABOR FORCE
8.1%
UNEMPLOYMENT RATE
Mendenhall Zip Codes
Mendenhall Area Codes
Income in Mendenhall
Income Overview in Mendenhall
Per Capita Income in Mendenhall is $23,271, while median incomes of families and households are $48,698 and $35,956 respectively.
| Characteristic | Number | Measure |
| Per Capita Income | 2,593 | $23,271 |
| Median Family Income | 589 | $48,698 |
| Mean Family Income | 589 | $76,581 |
| Median Household Income | 1,000 | $35,956 |
| Mean Household Income | 1,000 | $57,101 |
| Income Deficit | 589 | $10,536 |
| Wage / Income Gap (%) | 2,593 | 9.10% |
| Wage / Income Gap ($) | 2,593 | 90.90¢ per $1 |
| Gini / Inequality Index | 2,593 | 0.52 |
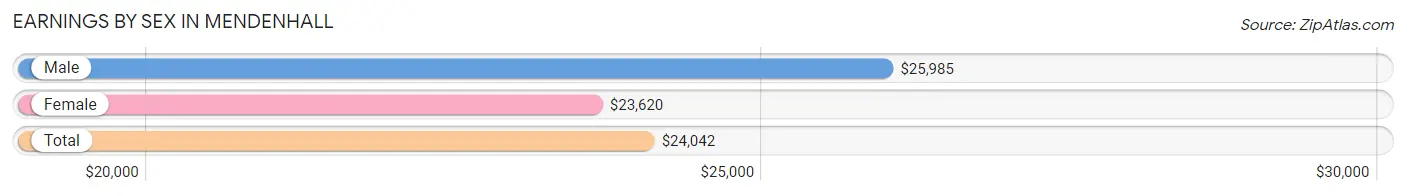
Earnings by Sex in Mendenhall
Average Earnings in Mendenhall are $24,042, $25,985 for men and $23,620 for women, a difference of 9.1%.
| Sex | Number | Average Earnings |
| Male | 508 (45.2%) | $25,985 |
| Female | 617 (54.8%) | $23,620 |
| Total | 1,125 (100.0%) | $24,042 |
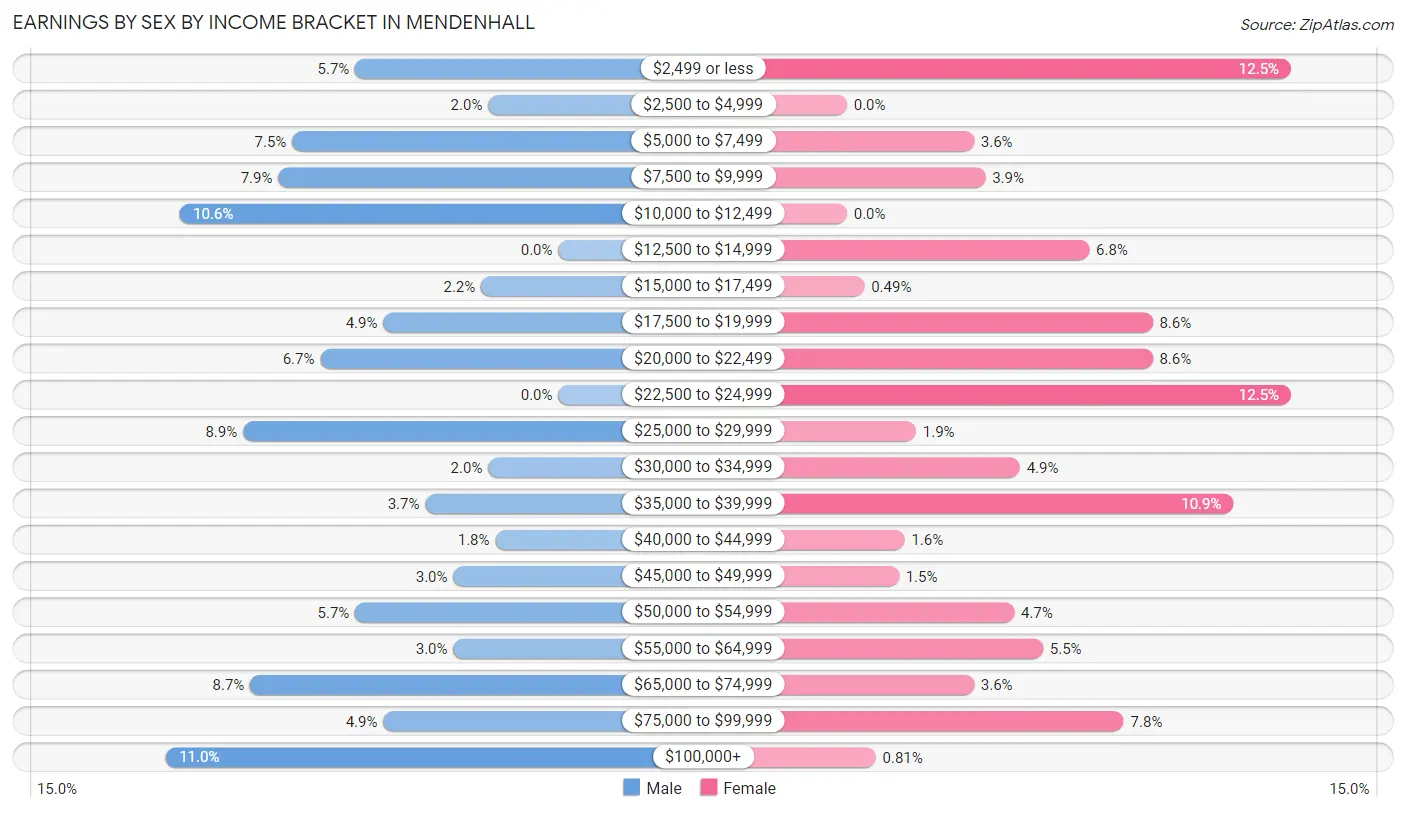
Earnings by Sex by Income Bracket in Mendenhall
The most common earnings brackets in Mendenhall are $100,000+ for men (56 | 11.0%) and $2,499 or less for women (77 | 12.5%).
| Income | Male | Female |
| $2,499 or less | 29 (5.7%) | 77 (12.5%) |
| $2,500 to $4,999 | 10 (2.0%) | 0 (0.0%) |
| $5,000 to $7,499 | 38 (7.5%) | 22 (3.6%) |
| $7,500 to $9,999 | 40 (7.9%) | 24 (3.9%) |
| $10,000 to $12,499 | 54 (10.6%) | 0 (0.0%) |
| $12,500 to $14,999 | 0 (0.0%) | 42 (6.8%) |
| $15,000 to $17,499 | 11 (2.2%) | 3 (0.5%) |
| $17,500 to $19,999 | 25 (4.9%) | 53 (8.6%) |
| $20,000 to $22,499 | 34 (6.7%) | 53 (8.6%) |
| $22,500 to $24,999 | 0 (0.0%) | 77 (12.5%) |
| $25,000 to $29,999 | 45 (8.9%) | 12 (1.9%) |
| $30,000 to $34,999 | 10 (2.0%) | 30 (4.9%) |
| $35,000 to $39,999 | 19 (3.7%) | 67 (10.9%) |
| $40,000 to $44,999 | 9 (1.8%) | 10 (1.6%) |
| $45,000 to $49,999 | 15 (2.9%) | 9 (1.5%) |
| $50,000 to $54,999 | 29 (5.7%) | 29 (4.7%) |
| $55,000 to $64,999 | 15 (2.9%) | 34 (5.5%) |
| $65,000 to $74,999 | 44 (8.7%) | 22 (3.6%) |
| $75,000 to $99,999 | 25 (4.9%) | 48 (7.8%) |
| $100,000+ | 56 (11.0%) | 5 (0.8%) |
| Total | 508 (100.0%) | 617 (100.0%) |
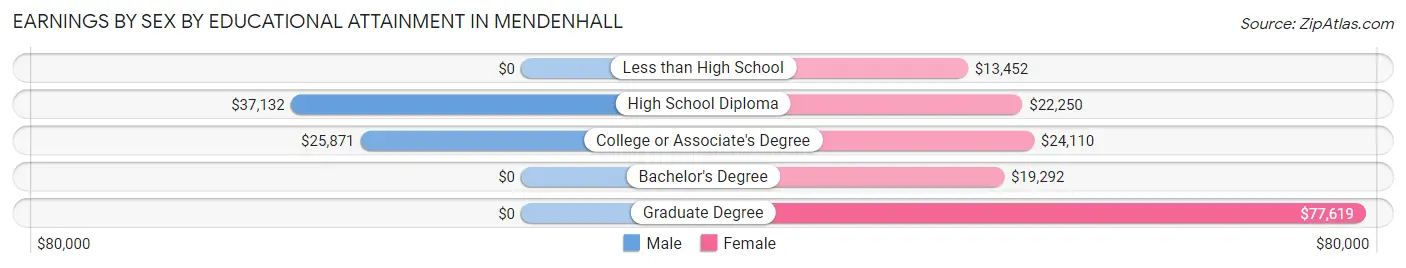
Earnings by Sex by Educational Attainment in Mendenhall
Average earnings in Mendenhall are $42,778 for men and $23,814 for women, a difference of 44.3%. Men with an educational attainment of high school diploma enjoy the highest average annual earnings of $37,132, while those with college or associate's degree education earn the least with $25,871. Women with an educational attainment of graduate degree earn the most with the average annual earnings of $77,619, while those with less than high school education have the smallest earnings of $13,452.
| Educational Attainment | Male Income | Female Income |
| Less than High School | - | - |
| High School Diploma | $37,132 | $22,250 |
| College or Associate's Degree | $25,871 | $24,110 |
| Bachelor's Degree | - | - |
| Graduate Degree | - | - |
| Total | $42,778 | $23,814 |
Family Income in Mendenhall
Family Income Brackets in Mendenhall
According to the Mendenhall family income data, there are 132 families falling into the $35,000 to $49,999 income range, which is the most common income bracket and makes up 22.4% of all families. Conversely, the $75,000 to $99,999 income bracket is the least frequent group with only 13 families (2.2%) belonging to this category.
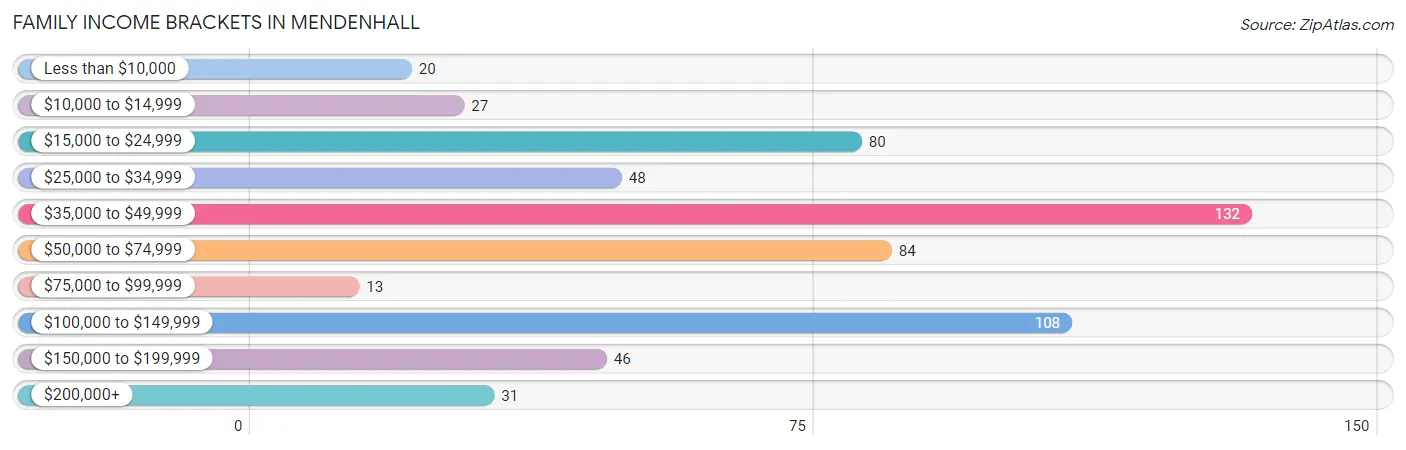
| Income Bracket | # Families | % Families |
| Less than $10,000 | 20 | 3.4% |
| $10,000 to $14,999 | 27 | 4.6% |
| $15,000 to $24,999 | 80 | 13.6% |
| $25,000 to $34,999 | 48 | 8.1% |
| $35,000 to $49,999 | 132 | 22.4% |
| $50,000 to $74,999 | 84 | 14.3% |
| $75,000 to $99,999 | 13 | 2.2% |
| $100,000 to $149,999 | 108 | 18.3% |
| $150,000 to $199,999 | 46 | 7.8% |
| $200,000+ | 31 | 5.3% |
Family Income by Famaliy Size in Mendenhall
6-person families (58 | 9.9%) account for the highest median family income in Mendenhall with $170,774 per family, while 6-person families (58 | 9.9%) have the highest median income of $28,462 per family member.
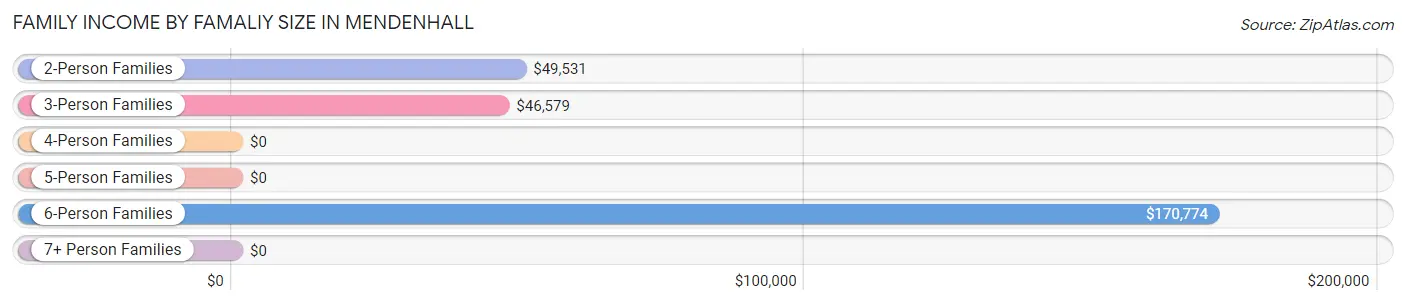
| Income Bracket | # Families | Median Income |
| 2-Person Families | 239 (40.6%) | $49,531 |
| 3-Person Families | 136 (23.1%) | $46,579 |
| 4-Person Families | 61 (10.4%) | $0 |
| 5-Person Families | 82 (13.9%) | $0 |
| 6-Person Families | 58 (9.9%) | $170,774 |
| 7+ Person Families | 13 (2.2%) | $0 |
| Total | 589 (100.0%) | $48,698 |
Family Income by Number of Earners in Mendenhall
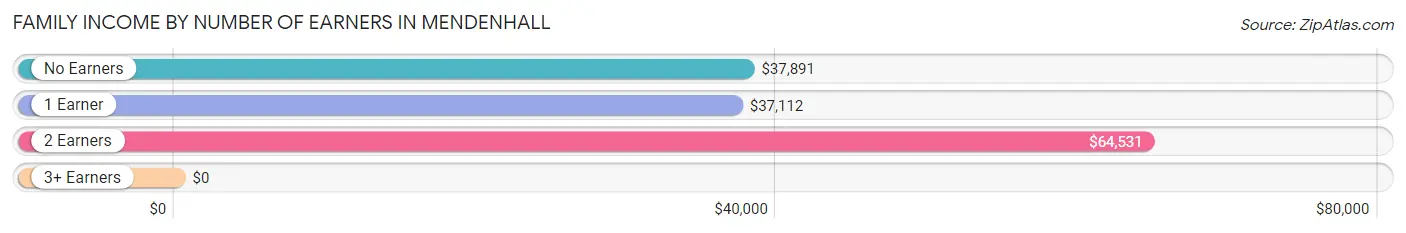
| Number of Earners | # Families | Median Income |
| No Earners | 93 (15.8%) | $37,891 |
| 1 Earner | 235 (39.9%) | $37,112 |
| 2 Earners | 207 (35.1%) | $64,531 |
| 3+ Earners | 54 (9.2%) | $0 |
| Total | 589 (100.0%) | $48,698 |
Household Income in Mendenhall
Household Income Brackets in Mendenhall
With 162 households falling in the category, the $15,000 to $24,999 income range is the most frequent in Mendenhall, accounting for 16.2% of all households. In contrast, only 19 households (1.9%) fall into the $75,000 to $99,999 income bracket, making it the least populous group.
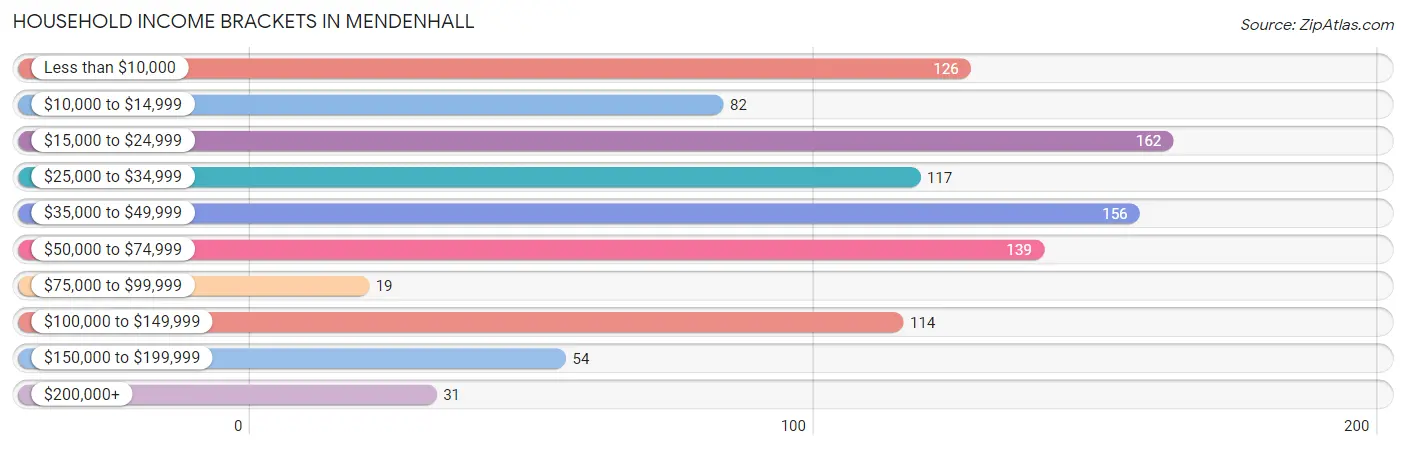
| Income Bracket | # Households | % Households |
| Less than $10,000 | 126 | 12.6% |
| $10,000 to $14,999 | 82 | 8.2% |
| $15,000 to $24,999 | 162 | 16.2% |
| $25,000 to $34,999 | 117 | 11.7% |
| $35,000 to $49,999 | 156 | 15.6% |
| $50,000 to $74,999 | 139 | 13.9% |
| $75,000 to $99,999 | 19 | 1.9% |
| $100,000 to $149,999 | 114 | 11.4% |
| $150,000 to $199,999 | 54 | 5.4% |
| $200,000+ | 31 | 3.1% |
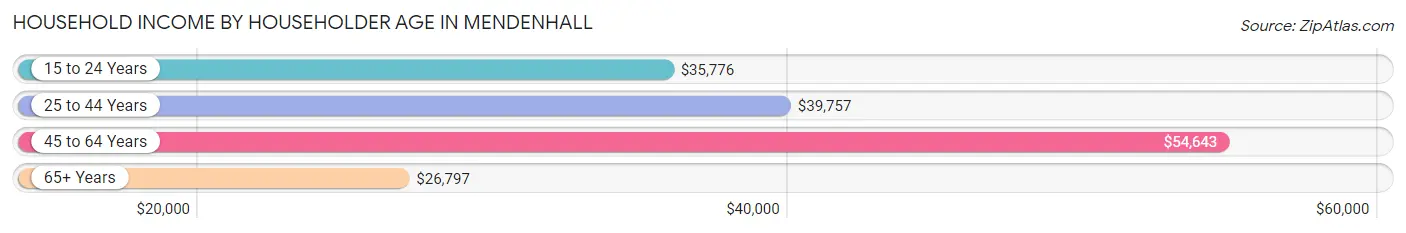
Household Income by Householder Age in Mendenhall
The median household income in Mendenhall is $35,956, with the highest median household income of $54,643 found in the 45 to 64 years age bracket for the primary householder. A total of 372 households (37.2%) fall into this category. Meanwhile, the 65+ years age bracket for the primary householder has the lowest median household income of $26,797, with 371 households (37.1%) in this group.
| Income Bracket | # Households | Median Income |
| 15 to 24 Years | 58 (5.8%) | $35,776 |
| 25 to 44 Years | 199 (19.9%) | $39,757 |
| 45 to 64 Years | 372 (37.2%) | $54,643 |
| 65+ Years | 371 (37.1%) | $26,797 |
| Total | 1,000 (100.0%) | $35,956 |
Poverty in Mendenhall
Income Below Poverty by Sex and Age in Mendenhall
With 37.8% poverty level for males and 34.4% for females among the residents of Mendenhall, 16 and 17 year old males and 12 to 14 year old females are the most vulnerable to poverty, with 26 males (72.2%) and 43 females (57.3%) in their respective age groups living below the poverty level.
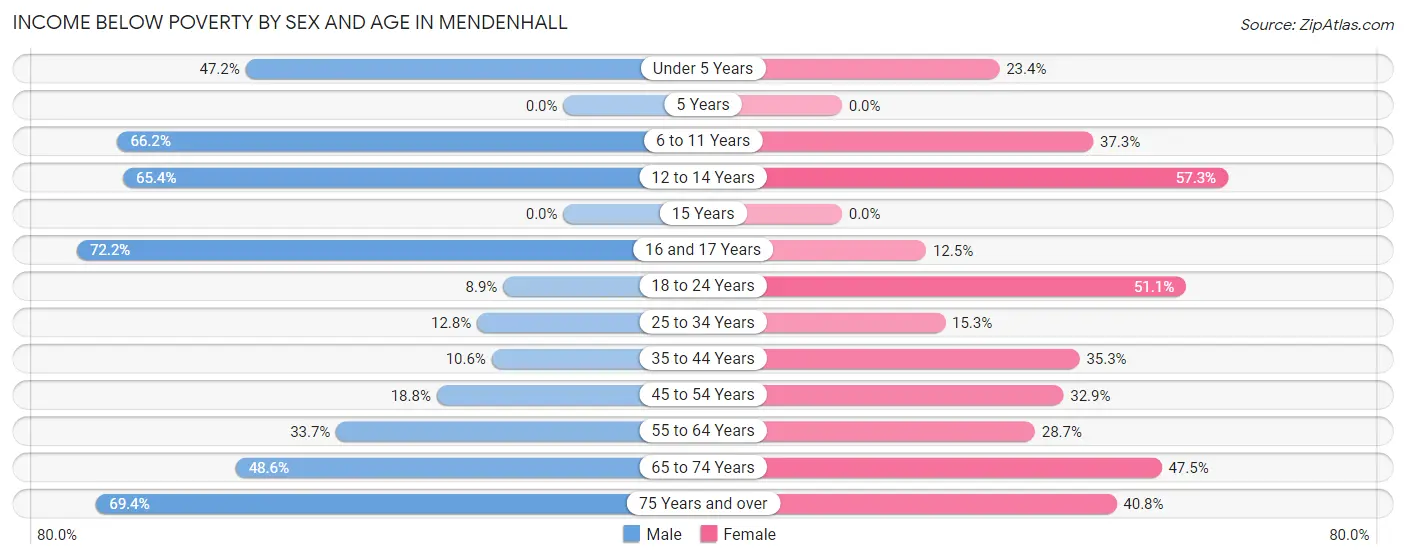
| Age Bracket | Male | Female |
| Under 5 Years | 42 (47.2%) | 36 (23.4%) |
| 5 Years | 0 (0.0%) | 0 (0.0%) |
| 6 to 11 Years | 47 (66.2%) | 25 (37.3%) |
| 12 to 14 Years | 34 (65.4%) | 43 (57.3%) |
| 15 Years | 0 (0.0%) | 0 (0.0%) |
| 16 and 17 Years | 26 (72.2%) | 11 (12.5%) |
| 18 to 24 Years | 10 (8.9%) | 69 (51.1%) |
| 25 to 34 Years | 10 (12.8%) | 23 (15.3%) |
| 35 to 44 Years | 5 (10.6%) | 60 (35.3%) |
| 45 to 54 Years | 22 (18.8%) | 49 (32.9%) |
| 55 to 64 Years | 57 (33.7%) | 45 (28.7%) |
| 65 to 74 Years | 107 (48.6%) | 103 (47.5%) |
| 75 Years and over | 43 (69.4%) | 53 (40.8%) |
| Total | 403 (37.8%) | 517 (34.4%) |
Income Above Poverty by Sex and Age in Mendenhall
According to the poverty statistics in Mendenhall, males aged 5 years and females aged 15 years are the age groups that are most secure financially, with 100.0% of males and 100.0% of females in these age groups living above the poverty line.
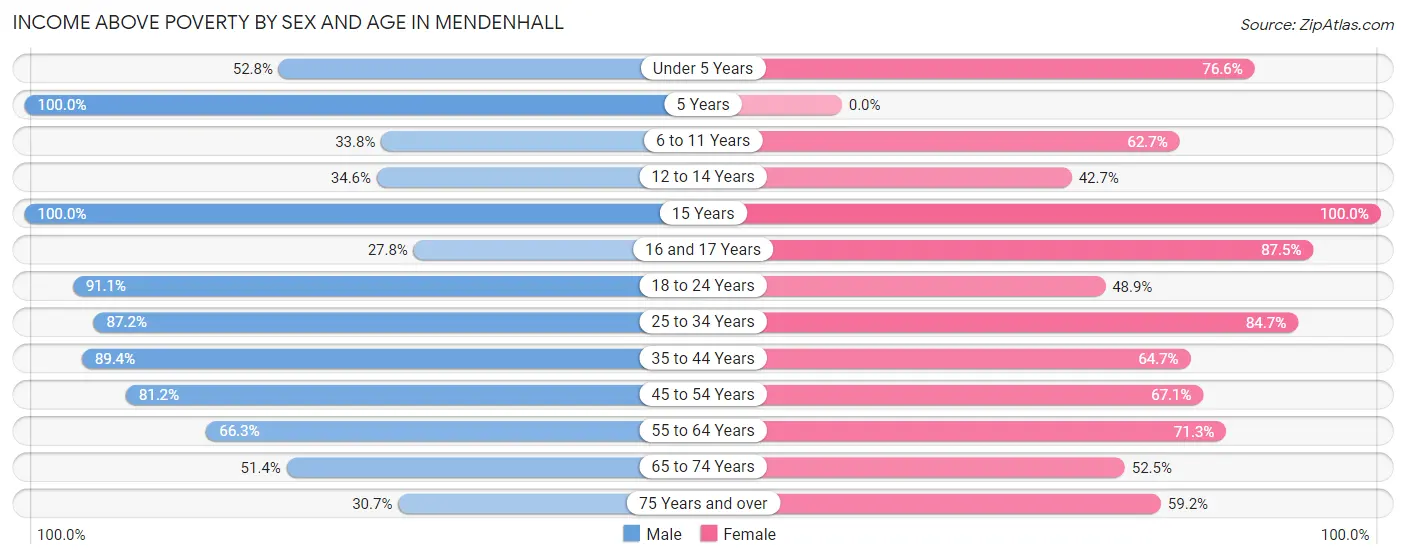
| Age Bracket | Male | Female |
| Under 5 Years | 47 (52.8%) | 118 (76.6%) |
| 5 Years | 4 (100.0%) | 0 (0.0%) |
| 6 to 11 Years | 24 (33.8%) | 42 (62.7%) |
| 12 to 14 Years | 18 (34.6%) | 32 (42.7%) |
| 15 Years | 10 (100.0%) | 10 (100.0%) |
| 16 and 17 Years | 10 (27.8%) | 77 (87.5%) |
| 18 to 24 Years | 102 (91.1%) | 66 (48.9%) |
| 25 to 34 Years | 68 (87.2%) | 127 (84.7%) |
| 35 to 44 Years | 42 (89.4%) | 110 (64.7%) |
| 45 to 54 Years | 95 (81.2%) | 100 (67.1%) |
| 55 to 64 Years | 112 (66.3%) | 112 (71.3%) |
| 65 to 74 Years | 113 (51.4%) | 114 (52.5%) |
| 75 Years and over | 19 (30.6%) | 77 (59.2%) |
| Total | 664 (62.2%) | 985 (65.6%) |
Income Below Poverty Among Married-Couple Families in Mendenhall
The poverty statistics for married-couple families in Mendenhall show that 14.8% or 46 of the total 310 families live below the poverty line. Families with no children have the highest poverty rate of 21.5%, comprising of 46 families. On the other hand, families with 1 or 2 children have the lowest poverty rate of 0.0%, which includes 0 families.
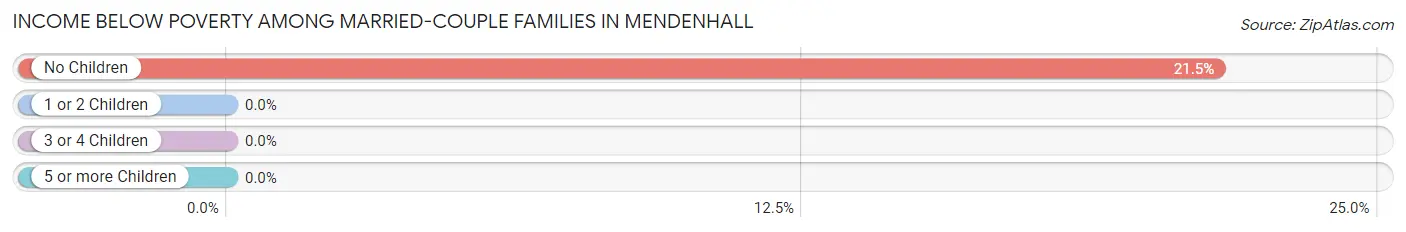
| Children | Above Poverty | Below Poverty |
| No Children | 168 (78.5%) | 46 (21.5%) |
| 1 or 2 Children | 59 (100.0%) | 0 (0.0%) |
| 3 or 4 Children | 37 (100.0%) | 0 (0.0%) |
| 5 or more Children | 0 (0.0%) | 0 (0.0%) |
| Total | 264 (85.2%) | 46 (14.8%) |
Income Below Poverty Among Single-Parent Households in Mendenhall
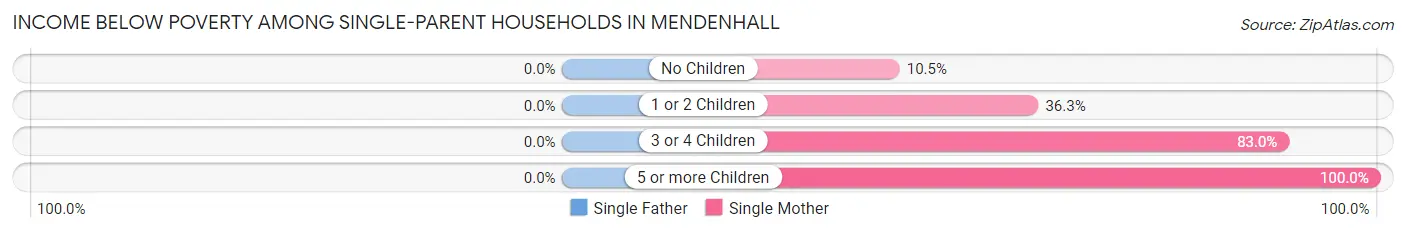
| Children | Single Father | Single Mother |
| No Children | 0 (0.0%) | 7 (10.4%) |
| 1 or 2 Children | 0 (0.0%) | 45 (36.3%) |
| 3 or 4 Children | 0 (0.0%) | 39 (83.0%) |
| 5 or more Children | 0 (0.0%) | 13 (100.0%) |
| Total | 0 (0.0%) | 104 (41.4%) |
Income Below Poverty Among Married-Couple vs Single-Parent Households in Mendenhall
The poverty data for Mendenhall shows that 46 of the married-couple family households (14.8%) and 104 of the single-parent households (37.3%) are living below the poverty level. Within the married-couple family households, those with no children have the highest poverty rate, with 46 households (21.5%) falling below the poverty line. Among the single-parent households, those with 5 or more children have the highest poverty rate, with 13 household (100.0%) living below poverty.
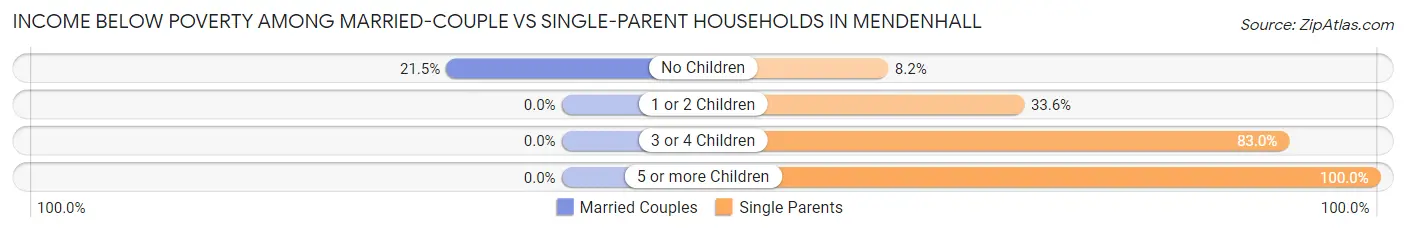
| Children | Married-Couple Families | Single-Parent Households |
| No Children | 46 (21.5%) | 7 (8.2%) |
| 1 or 2 Children | 0 (0.0%) | 45 (33.6%) |
| 3 or 4 Children | 0 (0.0%) | 39 (83.0%) |
| 5 or more Children | 0 (0.0%) | 13 (100.0%) |
| Total | 46 (14.8%) | 104 (37.3%) |
Race in Mendenhall
The most populous races in Mendenhall are Black / African American (1,403 | 54.1%), White / Caucasian (1,168 | 45.0%), and Two or more Races (22 | 0.9%).
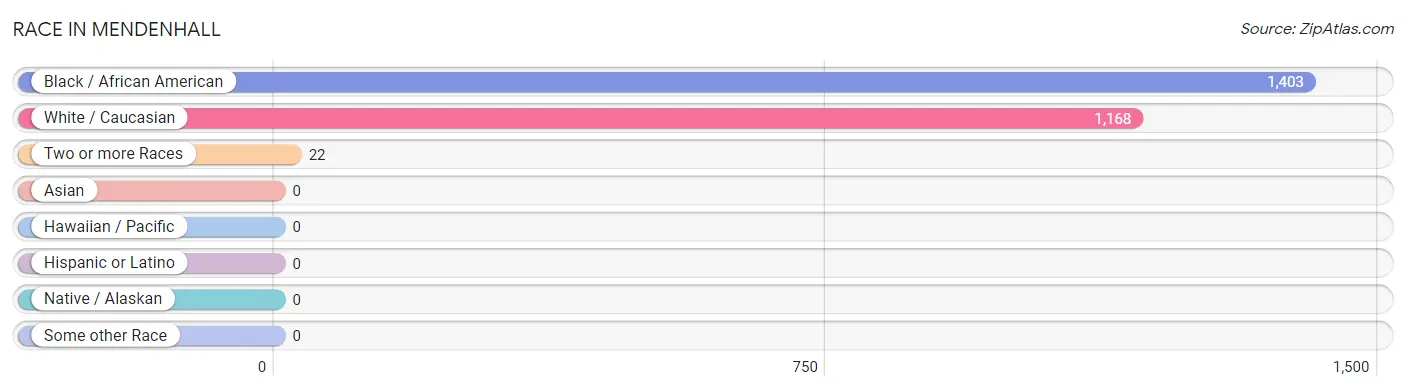
| Race | # Population | % Population |
| Asian | 0 | 0.0% |
| Black / African American | 1,403 | 54.1% |
| Hawaiian / Pacific | 0 | 0.0% |
| Hispanic or Latino | 0 | 0.0% |
| Native / Alaskan | 0 | 0.0% |
| White / Caucasian | 1,168 | 45.0% |
| Two or more Races | 22 | 0.9% |
| Some other Race | 0 | 0.0% |
| Total | 2,593 | 100.0% |
Ancestry in Mendenhall
The most populous ancestries reported in Mendenhall are English (261 | 10.1%), American (237 | 9.1%), Irish (130 | 5.0%), German (68 | 2.6%), and Scottish (51 | 2.0%), together accounting for 28.8% of all Mendenhall residents.
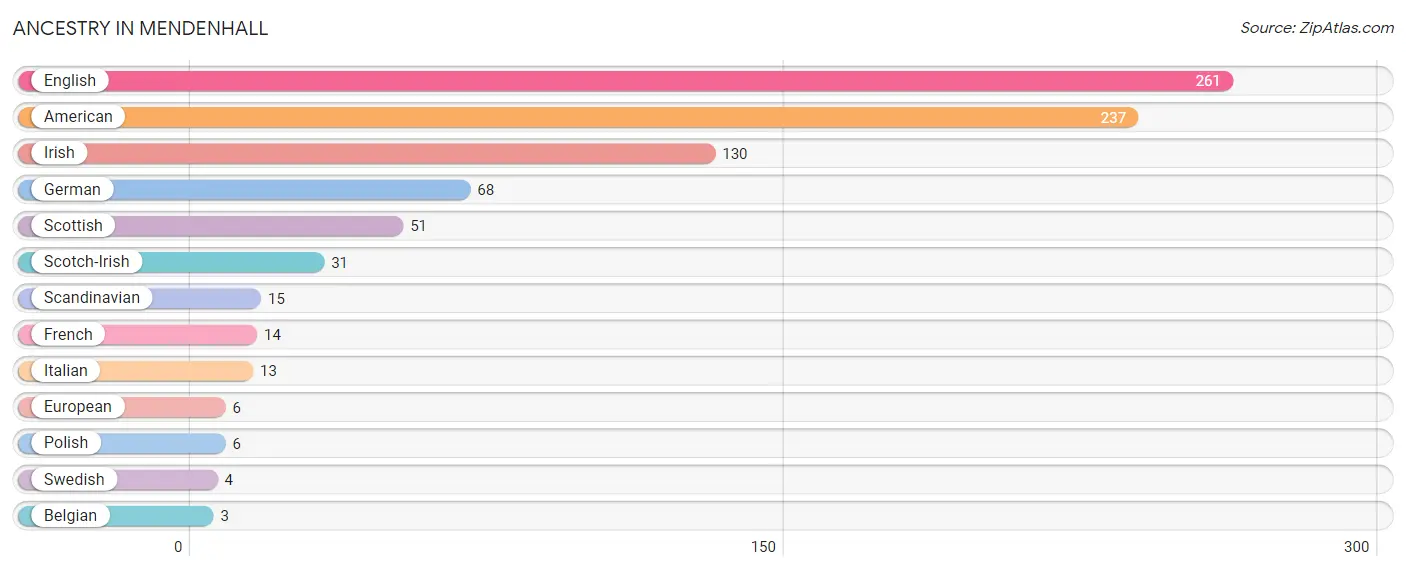
| Ancestry | # Population | % Population |
| American | 237 | 9.1% |
| Belgian | 3 | 0.1% |
| English | 261 | 10.1% |
| European | 6 | 0.2% |
| French | 14 | 0.5% |
| German | 68 | 2.6% |
| Irish | 130 | 5.0% |
| Italian | 13 | 0.5% |
| Polish | 6 | 0.2% |
| Scandinavian | 15 | 0.6% |
| Scotch-Irish | 31 | 1.2% |
| Scottish | 51 | 2.0% |
| Swedish | 4 | 0.2% | View All 13 Rows |
Immigrants in Mendenhall

| Immigration Origin | # Population | % Population | View All 0 Rows |
Sex and Age in Mendenhall
Sex and Age in Mendenhall
The most populous age groups in Mendenhall are 65 to 69 Years (175 | 16.2%) for men and Under 5 Years (154 | 10.2%) for women.
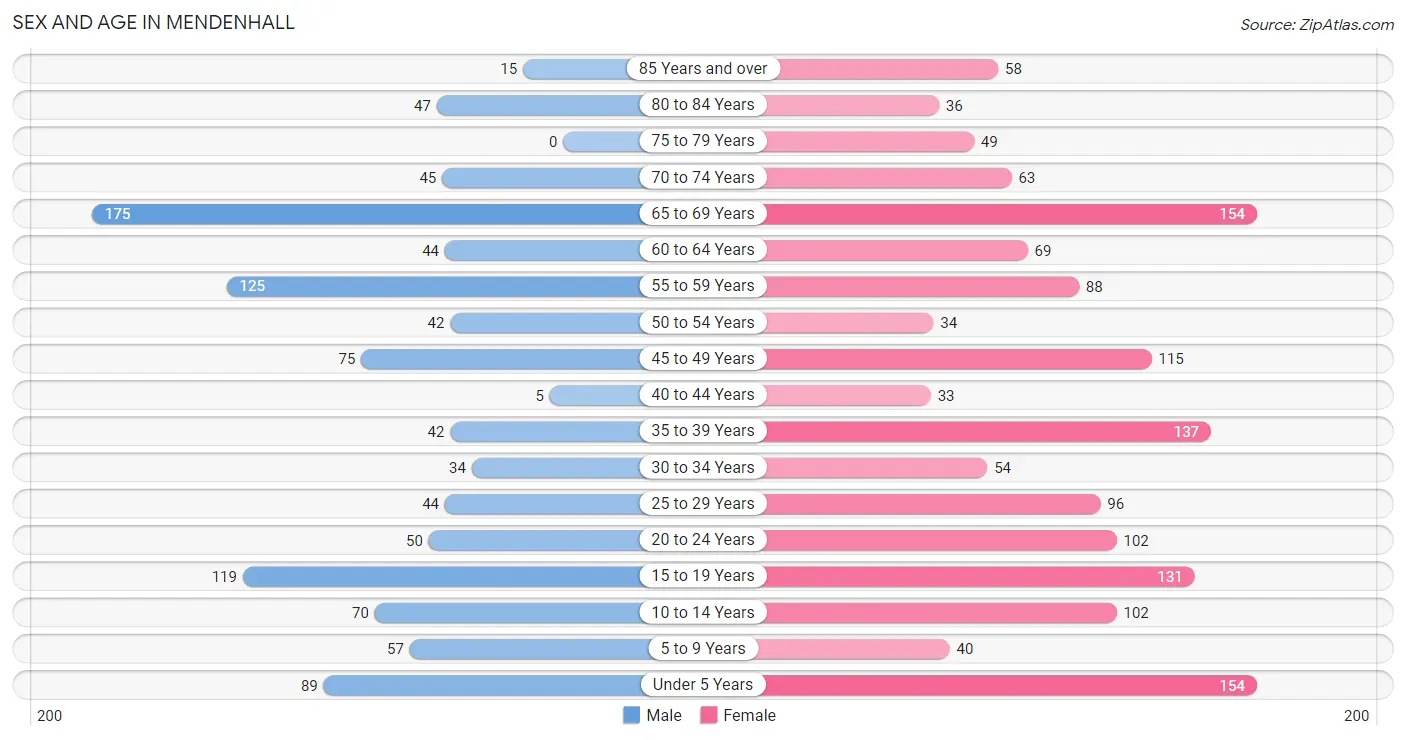
| Age Bracket | Male | Female |
| Under 5 Years | 89 (8.3%) | 154 (10.2%) |
| 5 to 9 Years | 57 (5.3%) | 40 (2.6%) |
| 10 to 14 Years | 70 (6.5%) | 102 (6.7%) |
| 15 to 19 Years | 119 (11.0%) | 131 (8.6%) |
| 20 to 24 Years | 50 (4.6%) | 102 (6.7%) |
| 25 to 29 Years | 44 (4.1%) | 96 (6.3%) |
| 30 to 34 Years | 34 (3.2%) | 54 (3.6%) |
| 35 to 39 Years | 42 (3.9%) | 137 (9.0%) |
| 40 to 44 Years | 5 (0.5%) | 33 (2.2%) |
| 45 to 49 Years | 75 (7.0%) | 115 (7.6%) |
| 50 to 54 Years | 42 (3.9%) | 34 (2.2%) |
| 55 to 59 Years | 125 (11.6%) | 88 (5.8%) |
| 60 to 64 Years | 44 (4.1%) | 69 (4.5%) |
| 65 to 69 Years | 175 (16.2%) | 154 (10.2%) |
| 70 to 74 Years | 45 (4.2%) | 63 (4.2%) |
| 75 to 79 Years | 0 (0.0%) | 49 (3.2%) |
| 80 to 84 Years | 47 (4.4%) | 36 (2.4%) |
| 85 Years and over | 15 (1.4%) | 58 (3.8%) |
| Total | 1,078 (100.0%) | 1,515 (100.0%) |
Families and Households in Mendenhall
Median Family Size in Mendenhall
The median family size in Mendenhall is 3.34 persons per family, with single female/mother families (251 | 42.6%) accounting for the largest median family size of 3.99 persons per family. On the other hand, single male/father families (28 | 4.8%) represent the smallest median family size with 2.64 persons per family.
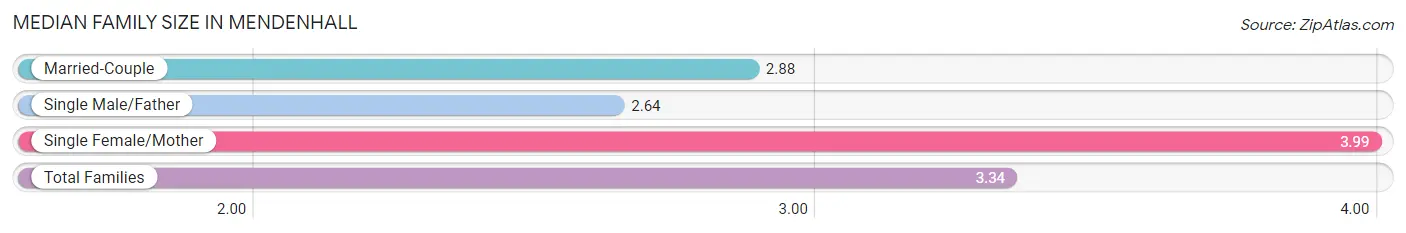
| Family Type | # Families | Family Size |
| Married-Couple | 310 (52.6%) | 2.88 |
| Single Male/Father | 28 (4.8%) | 2.64 |
| Single Female/Mother | 251 (42.6%) | 3.99 |
| Total Families | 589 (100.0%) | 3.34 |
Median Household Size in Mendenhall
The median household size in Mendenhall is 2.54 persons per household, with single female/mother households (251 | 25.1%) accounting for the largest median household size of 3.99 persons per household. non-family households (411 | 41.1%) represent the smallest median household size with 1.36 persons per household.
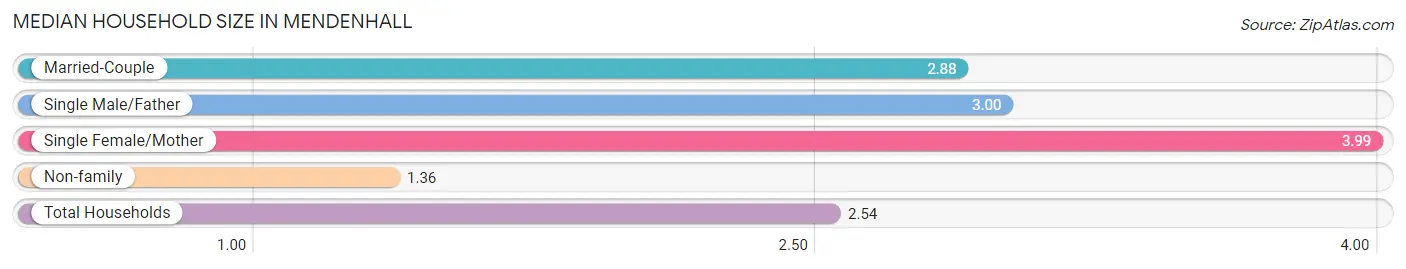
| Household Type | # Households | Household Size |
| Married-Couple | 310 (31.0%) | 2.88 |
| Single Male/Father | 28 (2.8%) | 3.00 |
| Single Female/Mother | 251 (25.1%) | 3.99 |
| Non-family | 411 (41.1%) | 1.36 |
| Total Households | 1,000 (100.0%) | 2.54 |
Household Size by Marriage Status in Mendenhall
Out of a total of 1,000 households in Mendenhall, 589 (58.9%) are family households, while 411 (41.1%) are nonfamily households. The most numerous type of family households are 2-person households, comprising 229, and the most common type of nonfamily households are 1-person households, comprising 325.
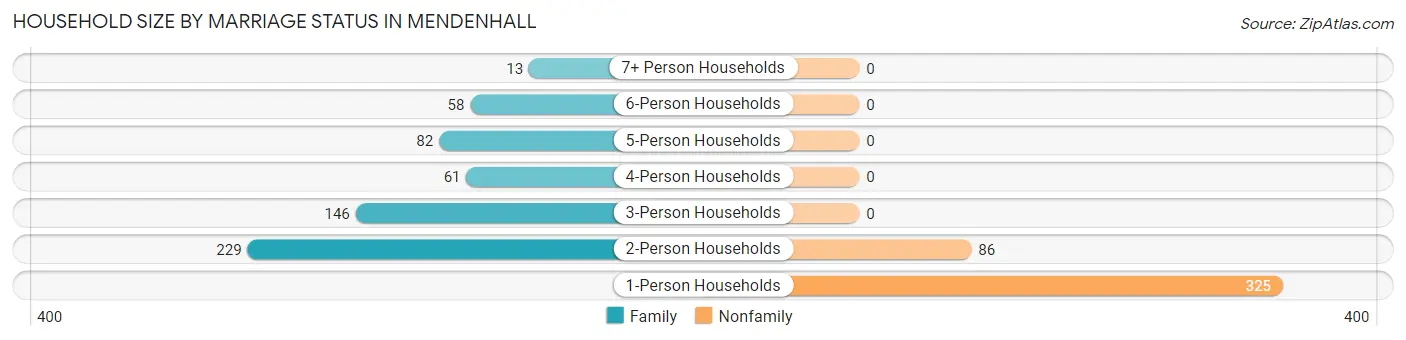
| Household Size | Family Households | Nonfamily Households |
| 1-Person Households | - | 325 (32.5%) |
| 2-Person Households | 229 (22.9%) | 86 (8.6%) |
| 3-Person Households | 146 (14.6%) | 0 (0.0%) |
| 4-Person Households | 61 (6.1%) | 0 (0.0%) |
| 5-Person Households | 82 (8.2%) | 0 (0.0%) |
| 6-Person Households | 58 (5.8%) | 0 (0.0%) |
| 7+ Person Households | 13 (1.3%) | 0 (0.0%) |
| Total | 589 (58.9%) | 411 (41.1%) |
Female Fertility in Mendenhall
Fertility by Age in Mendenhall
Average fertility rate in Mendenhall is 87.0 births per 1,000 women. Women in the age bracket of 35 to 50 years have the highest fertility rate with 154.0 births per 1,000 women. Women in the age bracket of 35 to 50 years acount for 78.0% of all women with births.
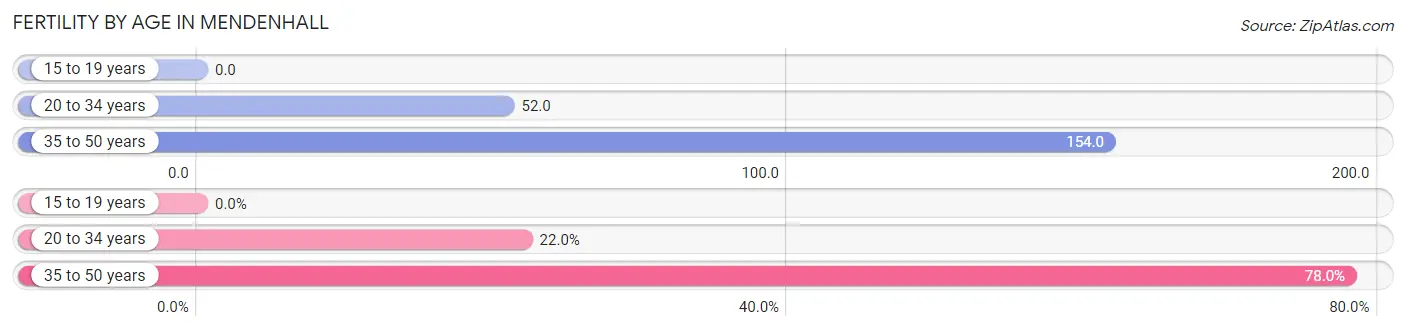
| Age Bracket | Women with Births | Births / 1,000 Women |
| 15 to 19 years | 0 (0.0%) | 0.0 |
| 20 to 34 years | 13 (22.0%) | 52.0 |
| 35 to 50 years | 46 (78.0%) | 154.0 |
| Total | 59 (100.0%) | 87.0 |
Fertility by Age by Marriage Status in Mendenhall
64.4% of women with births (59) in Mendenhall are married. The highest percentage of unmarried women with births falls into 35 to 50 years age bracket with 45.7% of them unmarried at the time of birth, while the lowest percentage of unmarried women with births belong to 20 to 34 years age bracket with 0.0% of them unmarried.
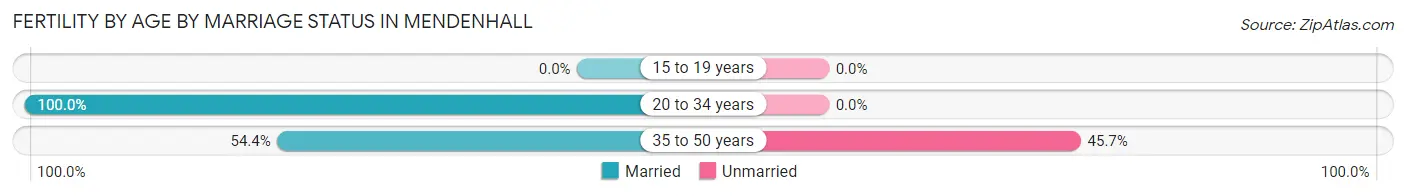
| Age Bracket | Married | Unmarried |
| 15 to 19 years | 0 (0.0%) | 0 (0.0%) |
| 20 to 34 years | 13 (100.0%) | 0 (0.0%) |
| 35 to 50 years | 25 (54.3%) | 21 (45.7%) |
| Total | 38 (64.4%) | 21 (35.6%) |
Fertility by Education in Mendenhall
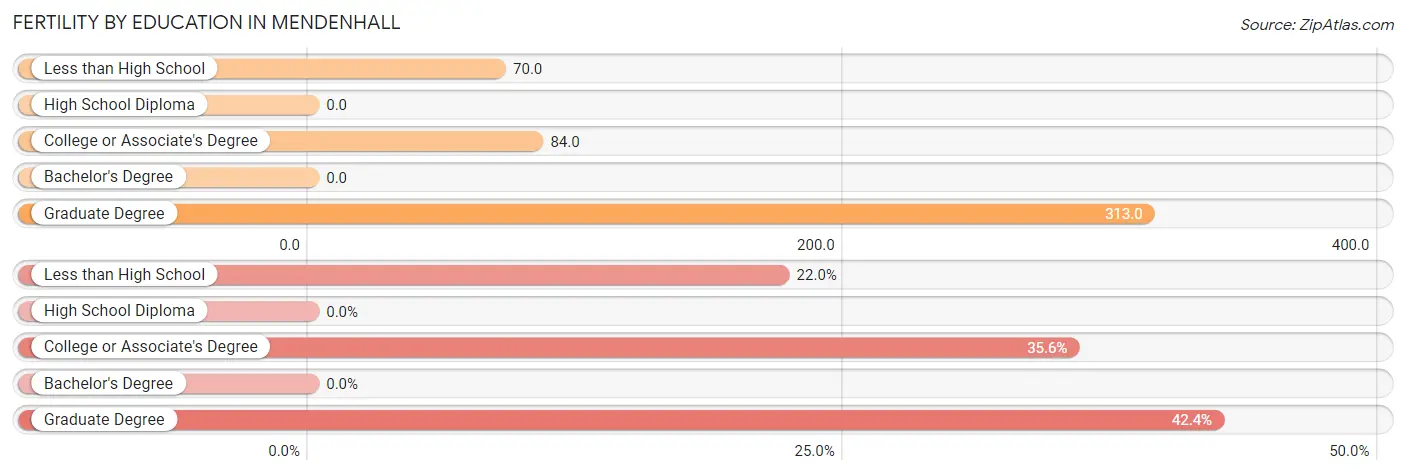
| Educational Attainment | Women with Births | Births / 1,000 Women |
| Less than High School | 13 (22.0%) | 70.0 |
| High School Diploma | 0 (0.0%) | 0.0 |
| College or Associate's Degree | 21 (35.6%) | 84.0 |
| Bachelor's Degree | 0 (0.0%) | 0.0 |
| Graduate Degree | 25 (42.4%) | 313.0 |
| Total | 59 (100.0%) | 87.0 |
Fertility by Education by Marriage Status in Mendenhall
35.6% of women with births in Mendenhall are unmarried. Women with the educational attainment of less than high school are most likely to be married with 100.0% of them married at childbirth, while women with the educational attainment of college or associate's degree are least likely to be married with 100.0% of them unmarried at childbirth.
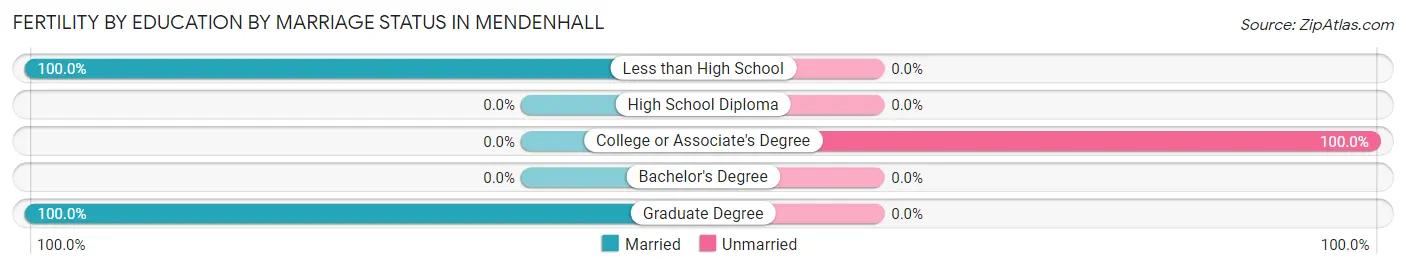
| Educational Attainment | Married | Unmarried |
| Less than High School | 13 (100.0%) | 0 (0.0%) |
| High School Diploma | 0 (0.0%) | 0 (0.0%) |
| College or Associate's Degree | 0 (0.0%) | 21 (100.0%) |
| Bachelor's Degree | 0 (0.0%) | 0 (0.0%) |
| Graduate Degree | 25 (100.0%) | 0 (0.0%) |
| Total | 38 (64.4%) | 21 (35.6%) |
Employment Characteristics in Mendenhall
Employment by Class of Employer in Mendenhall
Among the 934 employed individuals in Mendenhall, private company employees (518 | 55.5%), local government employees (202 | 21.6%), and state government employees (85 | 9.1%) make up the most common classes of employment.
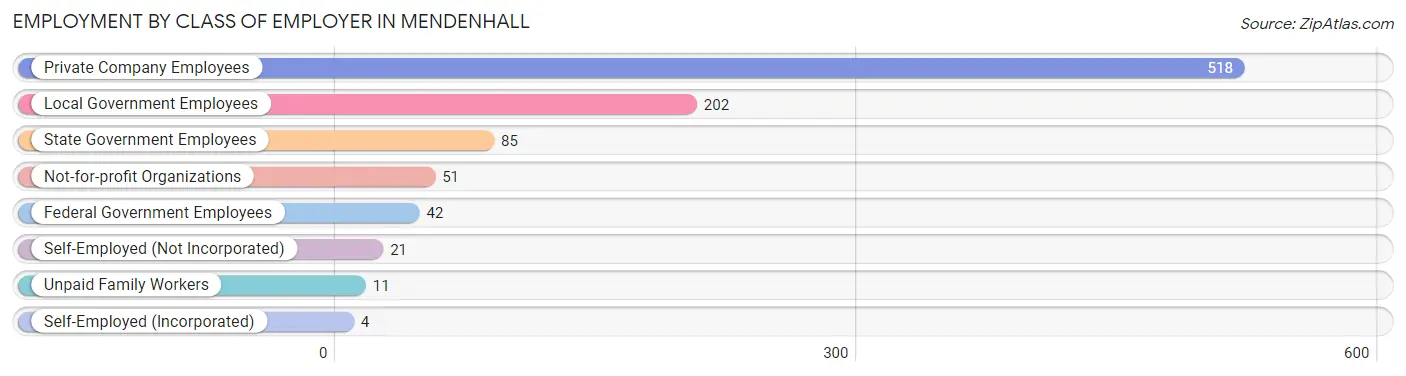
| Employer Class | # Employees | % Employees |
| Private Company Employees | 518 | 55.5% |
| Self-Employed (Incorporated) | 4 | 0.4% |
| Self-Employed (Not Incorporated) | 21 | 2.2% |
| Not-for-profit Organizations | 51 | 5.5% |
| Local Government Employees | 202 | 21.6% |
| State Government Employees | 85 | 9.1% |
| Federal Government Employees | 42 | 4.5% |
| Unpaid Family Workers | 11 | 1.2% |
| Total | 934 | 100.0% |
Employment Status by Age in Mendenhall
According to the labor force statistics for Mendenhall, out of the total population over 16 years of age (2,061), 49.3% or 1,016 individuals are in the labor force, with 8.1% or 82 of them unemployed. The age group with the highest labor force participation rate is 30 to 34 years, with 100.0% or 88 individuals in the labor force. Within the labor force, the 30 to 34 years age range has the highest percentage of unemployed individuals, with 38.6% or 34 of them being unemployed.
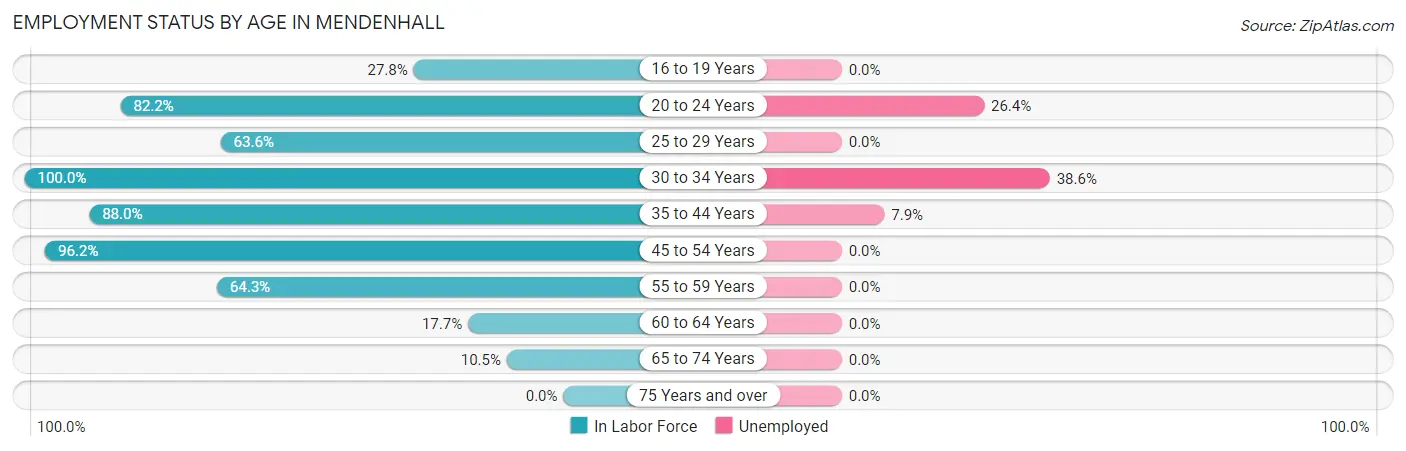
| Age Bracket | In Labor Force | Unemployed |
| 16 to 19 Years | 64 (27.8%) | 0 (0.0%) |
| 20 to 24 Years | 125 (82.2%) | 33 (26.4%) |
| 25 to 29 Years | 89 (63.6%) | 0 (0.0%) |
| 30 to 34 Years | 88 (100.0%) | 34 (38.6%) |
| 35 to 44 Years | 191 (88.0%) | 15 (7.9%) |
| 45 to 54 Years | 256 (96.2%) | 0 (0.0%) |
| 55 to 59 Years | 137 (64.3%) | 0 (0.0%) |
| 60 to 64 Years | 20 (17.7%) | 0 (0.0%) |
| 65 to 74 Years | 46 (10.5%) | 0 (0.0%) |
| 75 Years and over | 0 (0.0%) | 0 (0.0%) |
| Total | 1,016 (49.3%) | 82 (8.1%) |
Employment Status by Educational Attainment in Mendenhall
According to labor force statistics for Mendenhall, 75.3% of individuals (781) out of the total population between 25 and 64 years of age (1,037) are in the labor force, with 6.3% or 49 of them being unemployed. The group with the highest labor force participation rate are those with the educational attainment of less than high school, with 96.8% or 92 individuals in the labor force. Within the labor force, individuals with less than high school education have the highest percentage of unemployment, with 14.1% or 13 of them being unemployed.
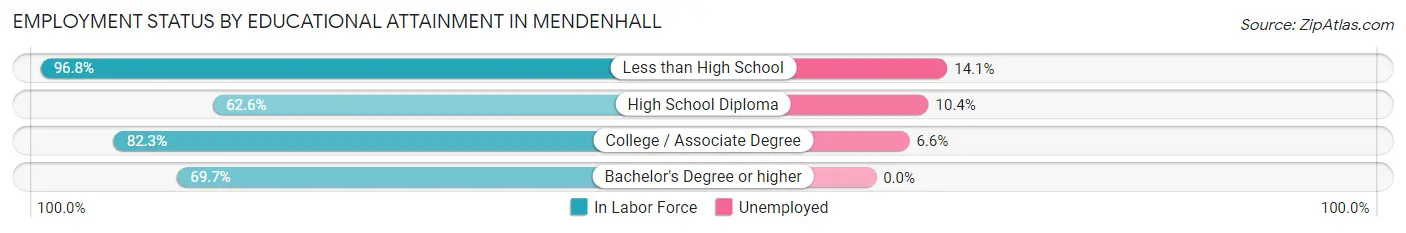
| Educational Attainment | In Labor Force | Unemployed |
| Less than High School | 92 (96.8%) | 13 (14.1%) |
| High School Diploma | 144 (62.6%) | 24 (10.4%) |
| College / Associate Degree | 317 (82.3%) | 25 (6.6%) |
| Bachelor's Degree or higher | 228 (69.7%) | 0 (0.0%) |
| Total | 781 (75.3%) | 65 (6.3%) |
Employment Occupations by Sex in Mendenhall
Management, Business, Science and Arts Occupations
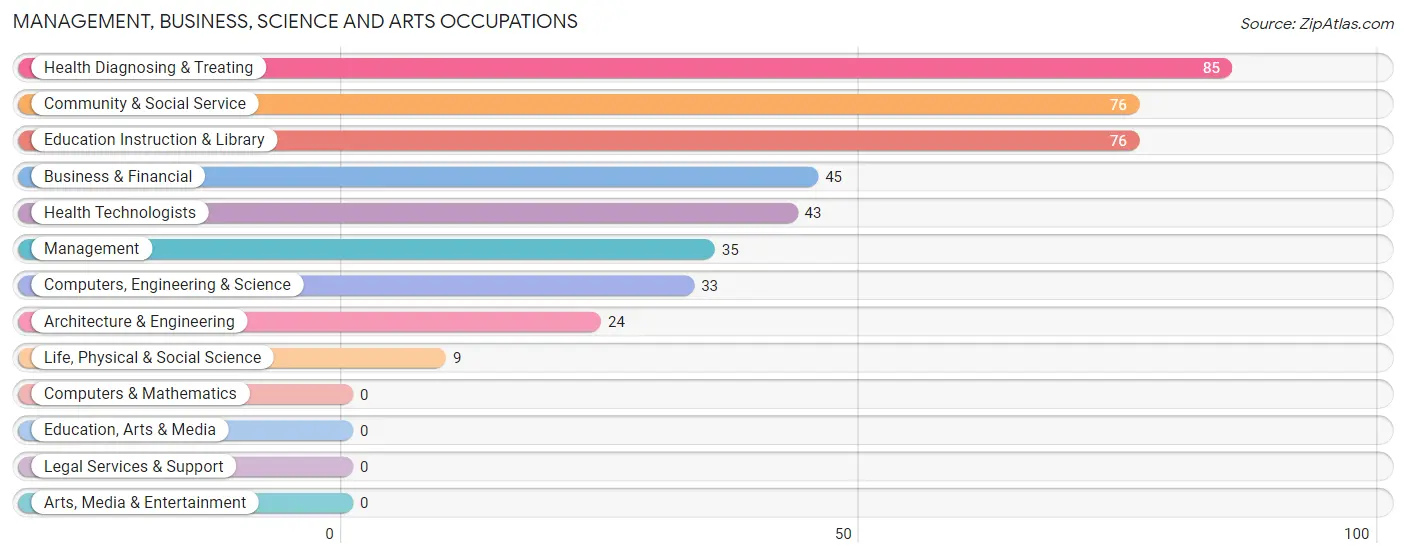
The most common Management, Business, Science and Arts occupations in Mendenhall are Health Diagnosing & Treating (85 | 9.1%), Community & Social Service (76 | 8.1%), Education Instruction & Library (76 | 8.1%), Business & Financial (45 | 4.8%), and Health Technologists (43 | 4.6%).
Management, Business, Science and Arts Occupations by Sex
Within the Management, Business, Science and Arts occupations in Mendenhall, the most male-oriented occupations are Computers, Engineering & Science (100.0%), Architecture & Engineering (100.0%), and Life, Physical & Social Science (100.0%), while the most female-oriented occupations are Health Diagnosing & Treating (88.2%), Health Technologists (76.7%), and Community & Social Service (69.7%).
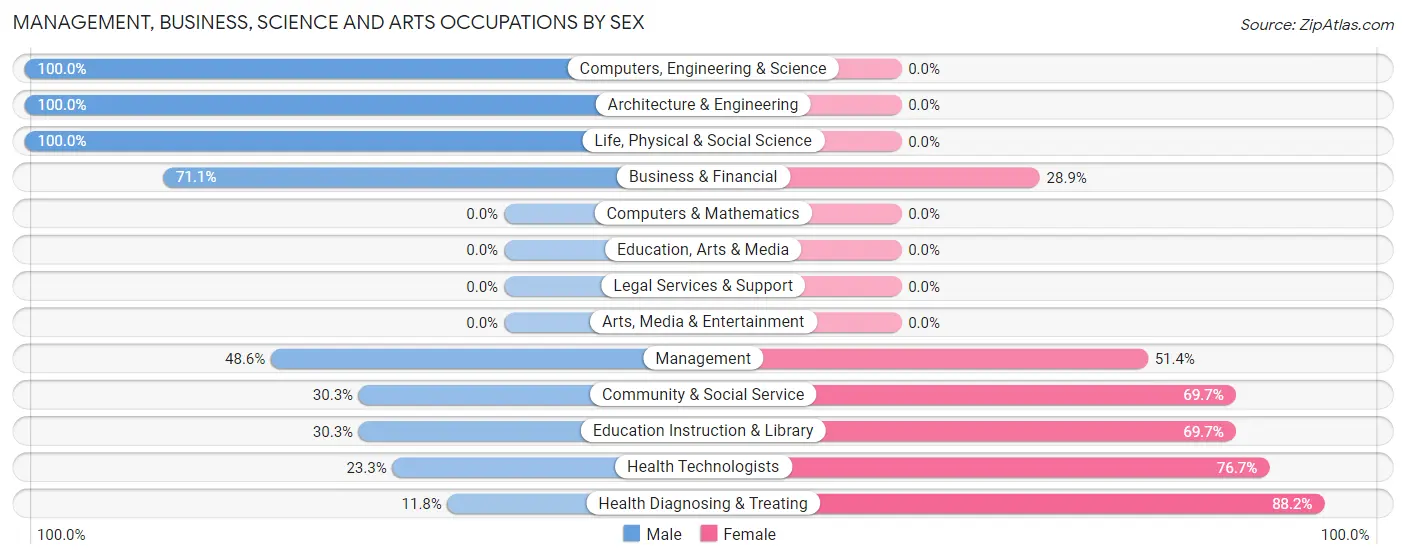
| Occupation | Male | Female |
| Management | 17 (48.6%) | 18 (51.4%) |
| Business & Financial | 32 (71.1%) | 13 (28.9%) |
| Computers, Engineering & Science | 33 (100.0%) | 0 (0.0%) |
| Computers & Mathematics | 0 (0.0%) | 0 (0.0%) |
| Architecture & Engineering | 24 (100.0%) | 0 (0.0%) |
| Life, Physical & Social Science | 9 (100.0%) | 0 (0.0%) |
| Community & Social Service | 23 (30.3%) | 53 (69.7%) |
| Education, Arts & Media | 0 (0.0%) | 0 (0.0%) |
| Legal Services & Support | 0 (0.0%) | 0 (0.0%) |
| Education Instruction & Library | 23 (30.3%) | 53 (69.7%) |
| Arts, Media & Entertainment | 0 (0.0%) | 0 (0.0%) |
| Health Diagnosing & Treating | 10 (11.8%) | 75 (88.2%) |
| Health Technologists | 10 (23.3%) | 33 (76.7%) |
| Total (Category) | 115 (42.0%) | 159 (58.0%) |
| Total (Overall) | 395 (42.3%) | 539 (57.7%) |
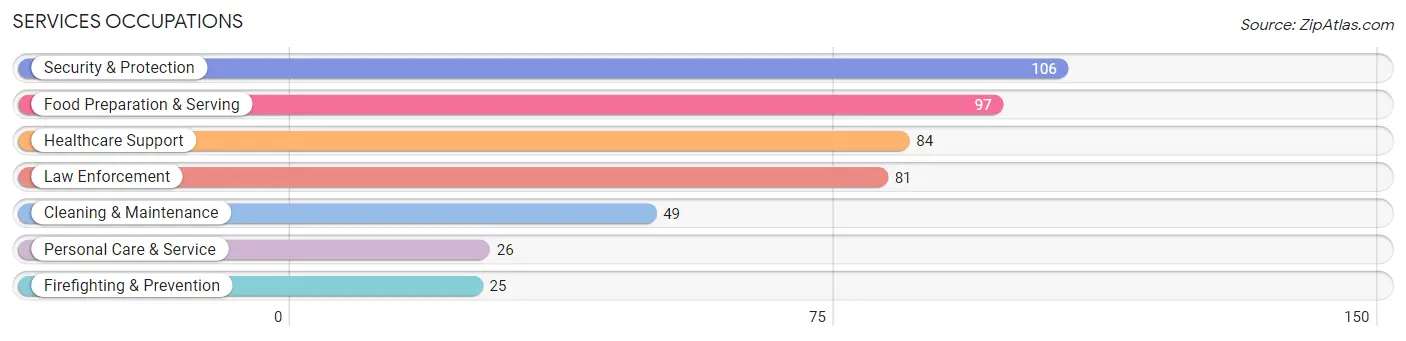
Services Occupations
The most common Services occupations in Mendenhall are Security & Protection (106 | 11.4%), Food Preparation & Serving (97 | 10.4%), Healthcare Support (84 | 9.0%), Law Enforcement (81 | 8.7%), and Cleaning & Maintenance (49 | 5.2%).
Services Occupations by Sex
Within the Services occupations in Mendenhall, the most male-oriented occupations are Cleaning & Maintenance (87.8%), Food Preparation & Serving (34.0%), and Law Enforcement (12.3%), while the most female-oriented occupations are Firefighting & Prevention (100.0%), Security & Protection (90.6%), and Healthcare Support (90.5%).
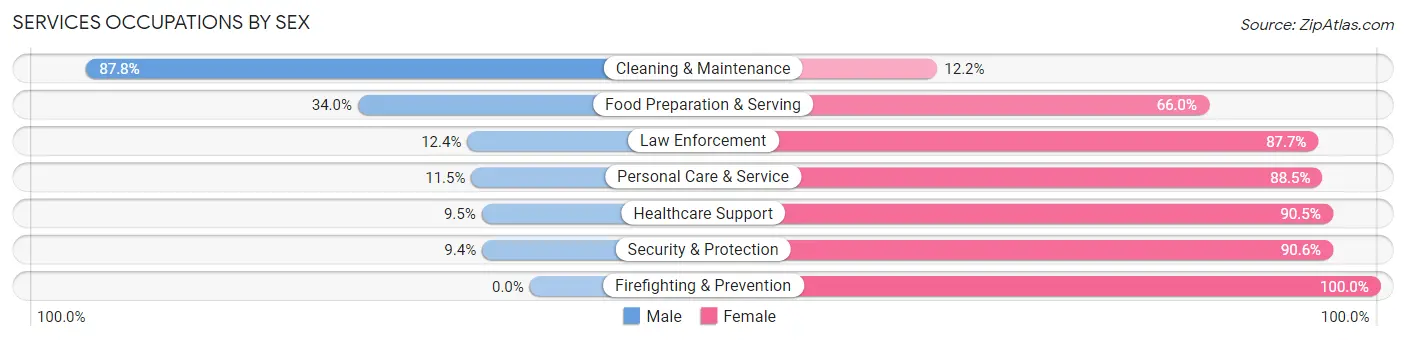
| Occupation | Male | Female |
| Healthcare Support | 8 (9.5%) | 76 (90.5%) |
| Security & Protection | 10 (9.4%) | 96 (90.6%) |
| Firefighting & Prevention | 0 (0.0%) | 25 (100.0%) |
| Law Enforcement | 10 (12.3%) | 71 (87.6%) |
| Food Preparation & Serving | 33 (34.0%) | 64 (66.0%) |
| Cleaning & Maintenance | 43 (87.8%) | 6 (12.2%) |
| Personal Care & Service | 3 (11.5%) | 23 (88.5%) |
| Total (Category) | 97 (26.8%) | 265 (73.2%) |
| Total (Overall) | 395 (42.3%) | 539 (57.7%) |
Sales and Office Occupations
The most common Sales and Office occupations in Mendenhall are Office & Administration (109 | 11.7%), and Sales & Related (29 | 3.1%).

Sales and Office Occupations by Sex
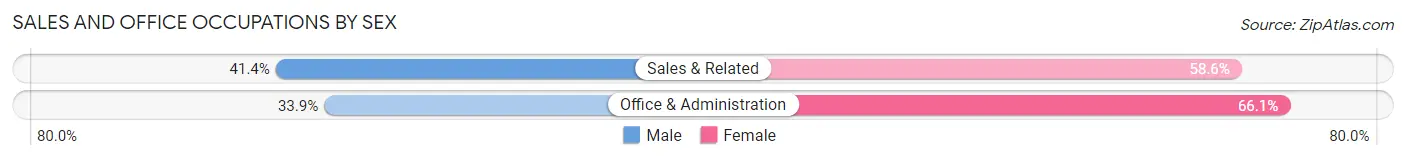
| Occupation | Male | Female |
| Sales & Related | 12 (41.4%) | 17 (58.6%) |
| Office & Administration | 37 (33.9%) | 72 (66.1%) |
| Total (Category) | 49 (35.5%) | 89 (64.5%) |
| Total (Overall) | 395 (42.3%) | 539 (57.7%) |
Natural Resources, Construction and Maintenance Occupations
The most common Natural Resources, Construction and Maintenance occupations in Mendenhall are Installation, Maintenance & Repair (42 | 4.5%), and Construction & Extraction (28 | 3.0%).

Natural Resources, Construction and Maintenance Occupations by Sex
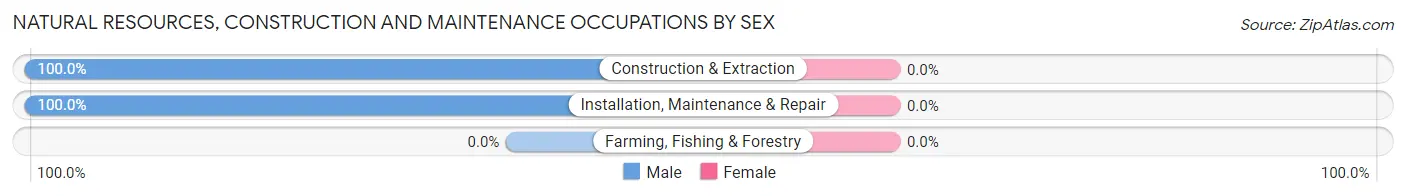
| Occupation | Male | Female |
| Farming, Fishing & Forestry | 0 (0.0%) | 0 (0.0%) |
| Construction & Extraction | 28 (100.0%) | 0 (0.0%) |
| Installation, Maintenance & Repair | 42 (100.0%) | 0 (0.0%) |
| Total (Category) | 70 (100.0%) | 0 (0.0%) |
| Total (Overall) | 395 (42.3%) | 539 (57.7%) |
Production, Transportation and Moving Occupations
The most common Production, Transportation and Moving occupations in Mendenhall are Production (68 | 7.3%), and Transportation (22 | 2.4%).
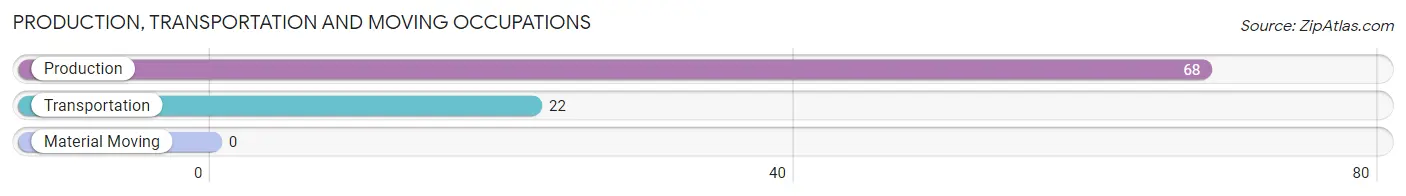
Production, Transportation and Moving Occupations by Sex
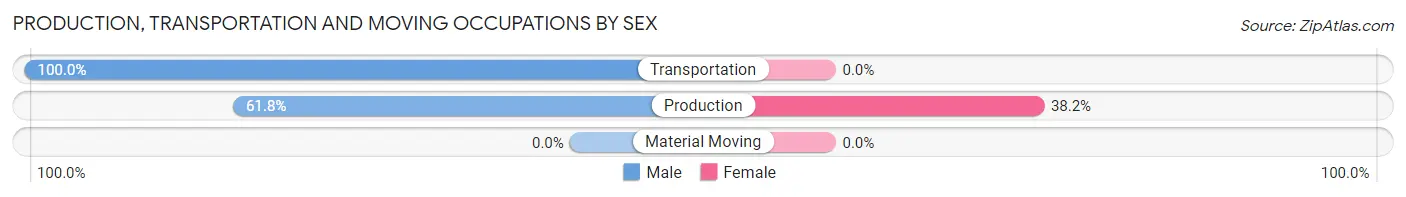
| Occupation | Male | Female |
| Production | 42 (61.8%) | 26 (38.2%) |
| Transportation | 22 (100.0%) | 0 (0.0%) |
| Material Moving | 0 (0.0%) | 0 (0.0%) |
| Total (Category) | 64 (71.1%) | 26 (28.9%) |
| Total (Overall) | 395 (42.3%) | 539 (57.7%) |
Employment Industries by Sex in Mendenhall
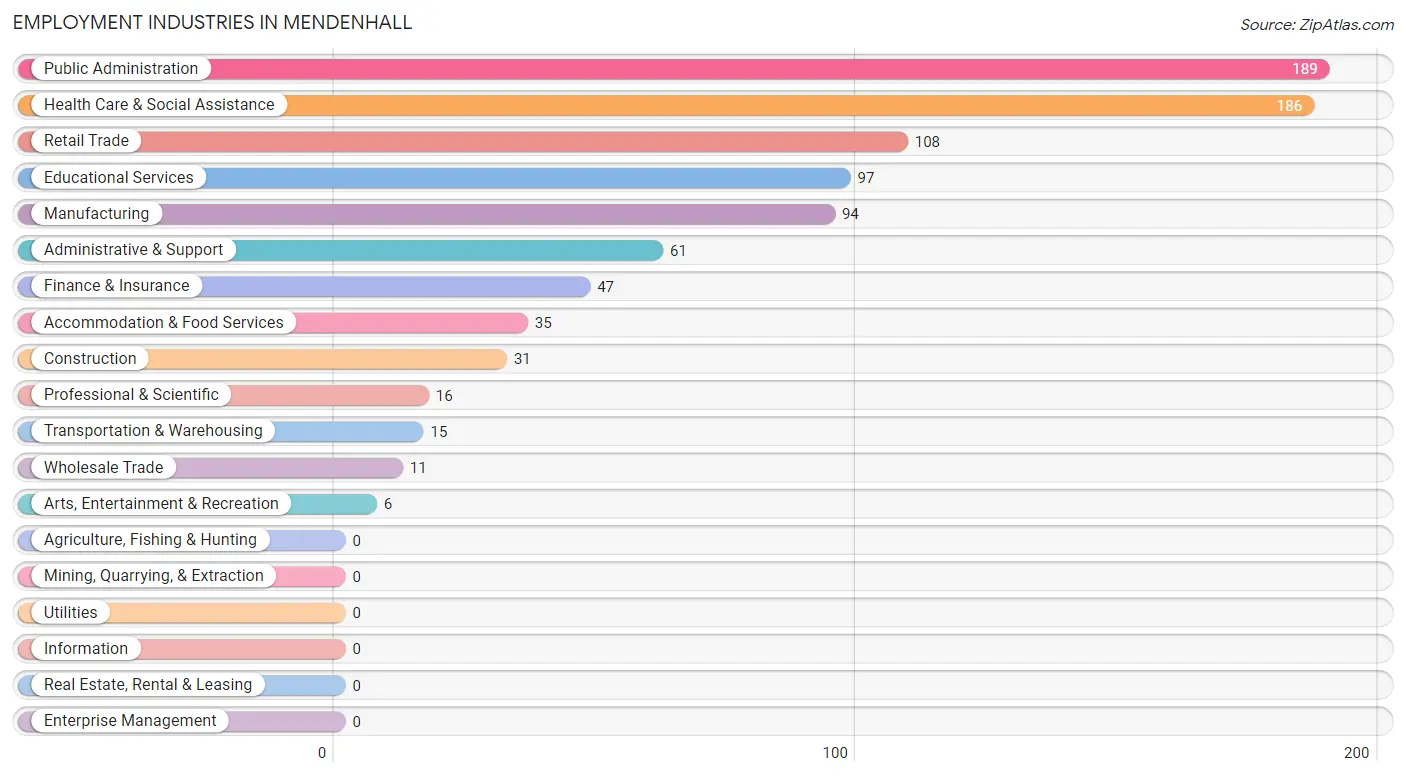
Employment Industries in Mendenhall
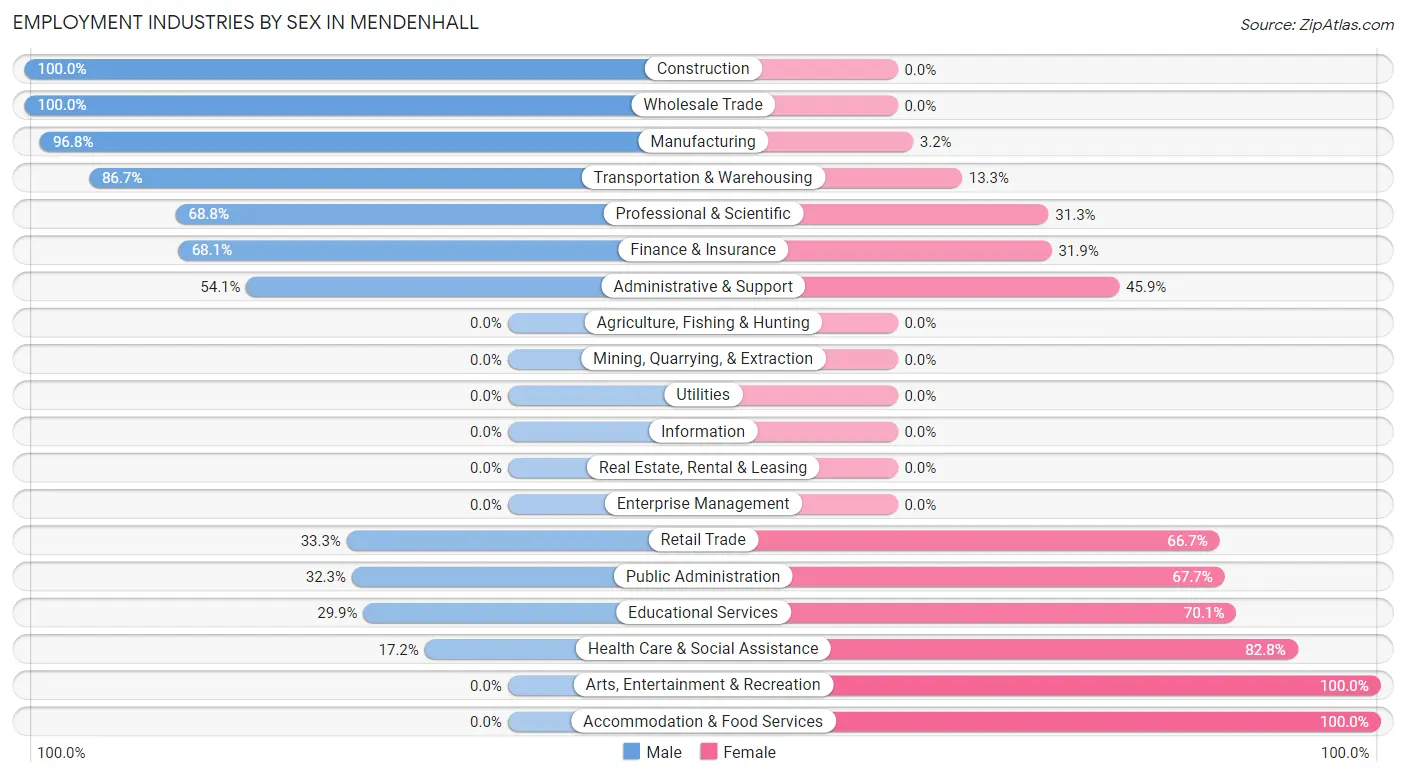
The major employment industries in Mendenhall include Public Administration (189 | 20.2%), Health Care & Social Assistance (186 | 19.9%), Retail Trade (108 | 11.6%), Educational Services (97 | 10.4%), and Manufacturing (94 | 10.1%).
Employment Industries by Sex in Mendenhall
The Mendenhall industries that see more men than women are Construction (100.0%), Wholesale Trade (100.0%), and Manufacturing (96.8%), whereas the industries that tend to have a higher number of women are Arts, Entertainment & Recreation (100.0%), Accommodation & Food Services (100.0%), and Health Care & Social Assistance (82.8%).
| Industry | Male | Female |
| Agriculture, Fishing & Hunting | 0 (0.0%) | 0 (0.0%) |
| Mining, Quarrying, & Extraction | 0 (0.0%) | 0 (0.0%) |
| Construction | 31 (100.0%) | 0 (0.0%) |
| Manufacturing | 91 (96.8%) | 3 (3.2%) |
| Wholesale Trade | 11 (100.0%) | 0 (0.0%) |
| Retail Trade | 36 (33.3%) | 72 (66.7%) |
| Transportation & Warehousing | 13 (86.7%) | 2 (13.3%) |
| Utilities | 0 (0.0%) | 0 (0.0%) |
| Information | 0 (0.0%) | 0 (0.0%) |
| Finance & Insurance | 32 (68.1%) | 15 (31.9%) |
| Real Estate, Rental & Leasing | 0 (0.0%) | 0 (0.0%) |
| Professional & Scientific | 11 (68.8%) | 5 (31.2%) |
| Enterprise Management | 0 (0.0%) | 0 (0.0%) |
| Administrative & Support | 33 (54.1%) | 28 (45.9%) |
| Educational Services | 29 (29.9%) | 68 (70.1%) |
| Health Care & Social Assistance | 32 (17.2%) | 154 (82.8%) |
| Arts, Entertainment & Recreation | 0 (0.0%) | 6 (100.0%) |
| Accommodation & Food Services | 0 (0.0%) | 35 (100.0%) |
| Public Administration | 61 (32.3%) | 128 (67.7%) |
| Total | 395 (42.3%) | 539 (57.7%) |
Education in Mendenhall
School Enrollment in Mendenhall
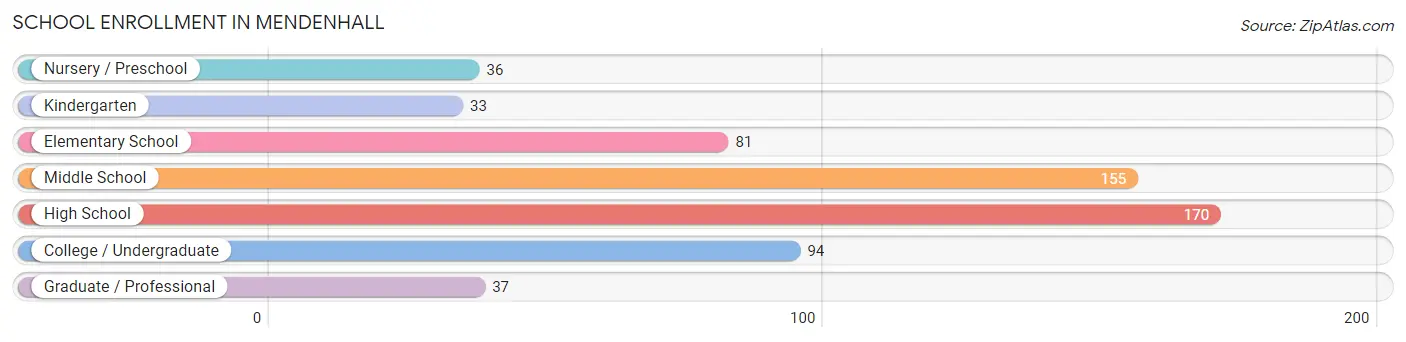
The most common levels of schooling among the 606 students in Mendenhall are high school (170 | 28.1%), middle school (155 | 25.6%), and college / undergraduate (94 | 15.5%).
| School Level | # Students | % Students |
| Nursery / Preschool | 36 | 5.9% |
| Kindergarten | 33 | 5.4% |
| Elementary School | 81 | 13.4% |
| Middle School | 155 | 25.6% |
| High School | 170 | 28.1% |
| College / Undergraduate | 94 | 15.5% |
| Graduate / Professional | 37 | 6.1% |
| Total | 606 | 100.0% |
School Enrollment by Age by Funding Source in Mendenhall
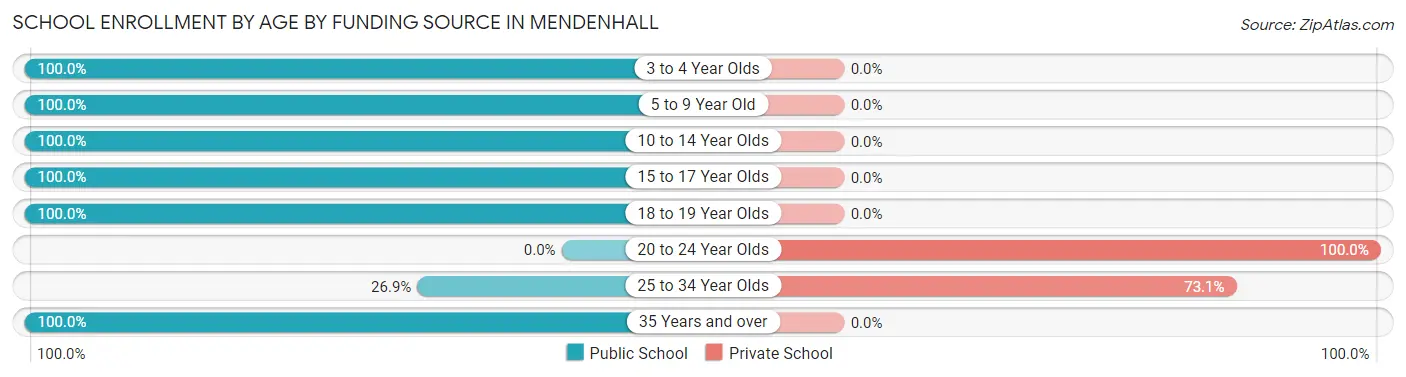
Out of a total of 606 students who are enrolled in schools in Mendenhall, 71 (11.7%) attend a private institution, while the remaining 535 (88.3%) are enrolled in public schools. The age group of 20 to 24 year olds has the highest likelihood of being enrolled in private schools, with 3 (100.0% in the age bracket) enrolled. Conversely, the age group of 3 to 4 year olds has the lowest likelihood of being enrolled in a private school, with 36 (100.0% in the age bracket) attending a public institution.
| Age Bracket | Public School | Private School |
| 3 to 4 Year Olds | 36 (100.0%) | 0 (0.0%) |
| 5 to 9 Year Old | 97 (100.0%) | 0 (0.0%) |
| 10 to 14 Year Olds | 172 (100.0%) | 0 (0.0%) |
| 15 to 17 Year Olds | 144 (100.0%) | 0 (0.0%) |
| 18 to 19 Year Olds | 26 (100.0%) | 0 (0.0%) |
| 20 to 24 Year Olds | 0 (0.0%) | 3 (100.0%) |
| 25 to 34 Year Olds | 25 (26.9%) | 68 (73.1%) |
| 35 Years and over | 35 (100.0%) | 0 (0.0%) |
| Total | 535 (88.3%) | 71 (11.7%) |
Educational Attainment by Field of Study in Mendenhall
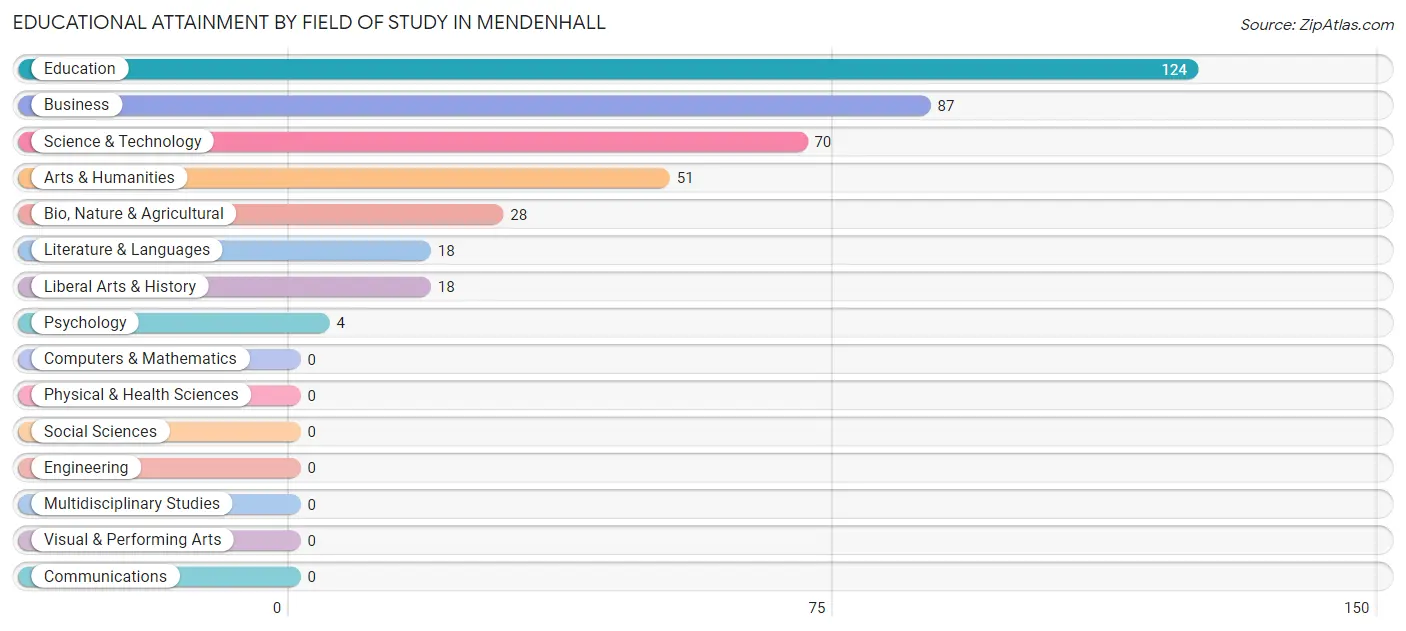
Education (124 | 31.0%), business (87 | 21.7%), science & technology (70 | 17.5%), arts & humanities (51 | 12.8%), and bio, nature & agricultural (28 | 7.0%) are the most common fields of study among 400 individuals in Mendenhall who have obtained a bachelor's degree or higher.
| Field of Study | # Graduates | % Graduates |
| Computers & Mathematics | 0 | 0.0% |
| Bio, Nature & Agricultural | 28 | 7.0% |
| Physical & Health Sciences | 0 | 0.0% |
| Psychology | 4 | 1.0% |
| Social Sciences | 0 | 0.0% |
| Engineering | 0 | 0.0% |
| Multidisciplinary Studies | 0 | 0.0% |
| Science & Technology | 70 | 17.5% |
| Business | 87 | 21.7% |
| Education | 124 | 31.0% |
| Literature & Languages | 18 | 4.5% |
| Liberal Arts & History | 18 | 4.5% |
| Visual & Performing Arts | 0 | 0.0% |
| Communications | 0 | 0.0% |
| Arts & Humanities | 51 | 12.8% |
| Total | 400 | 100.0% |
Transportation & Commute in Mendenhall
Vehicle Availability by Sex in Mendenhall
The most prevalent vehicle ownership categories in Mendenhall are males with 2 vehicles (149, accounting for 37.7%) and females with 2 vehicles (196, making up 27.6%).
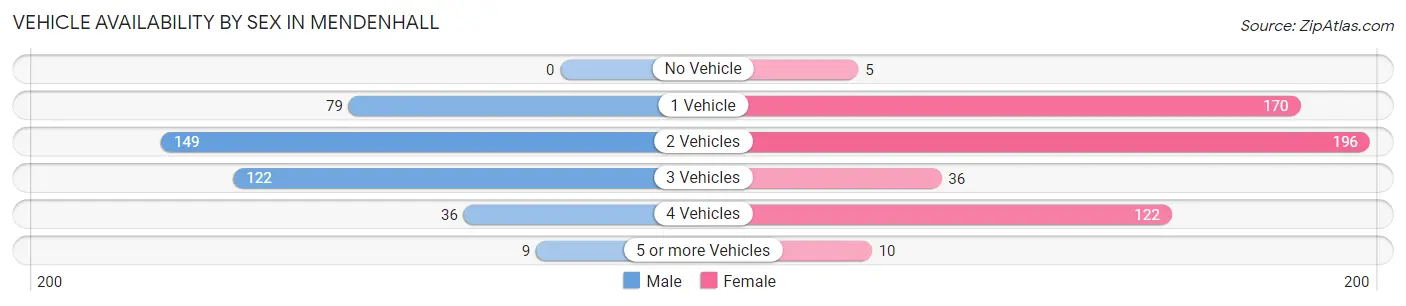
| Vehicles Available | Male | Female |
| No Vehicle | 0 (0.0%) | 5 (0.9%) |
| 1 Vehicle | 79 (20.0%) | 170 (31.5%) |
| 2 Vehicles | 149 (37.7%) | 196 (36.4%) |
| 3 Vehicles | 122 (30.9%) | 36 (6.7%) |
| 4 Vehicles | 36 (9.1%) | 122 (22.6%) |
| 5 or more Vehicles | 9 (2.3%) | 10 (1.9%) |
| Total | 395 (100.0%) | 539 (100.0%) |
Commute Time in Mendenhall
The most frequently occuring commute durations in Mendenhall are 10 to 14 minutes (189 commuters, 20.2%), 5 to 9 minutes (160 commuters, 17.1%), and 45 to 59 minutes (150 commuters, 16.1%).
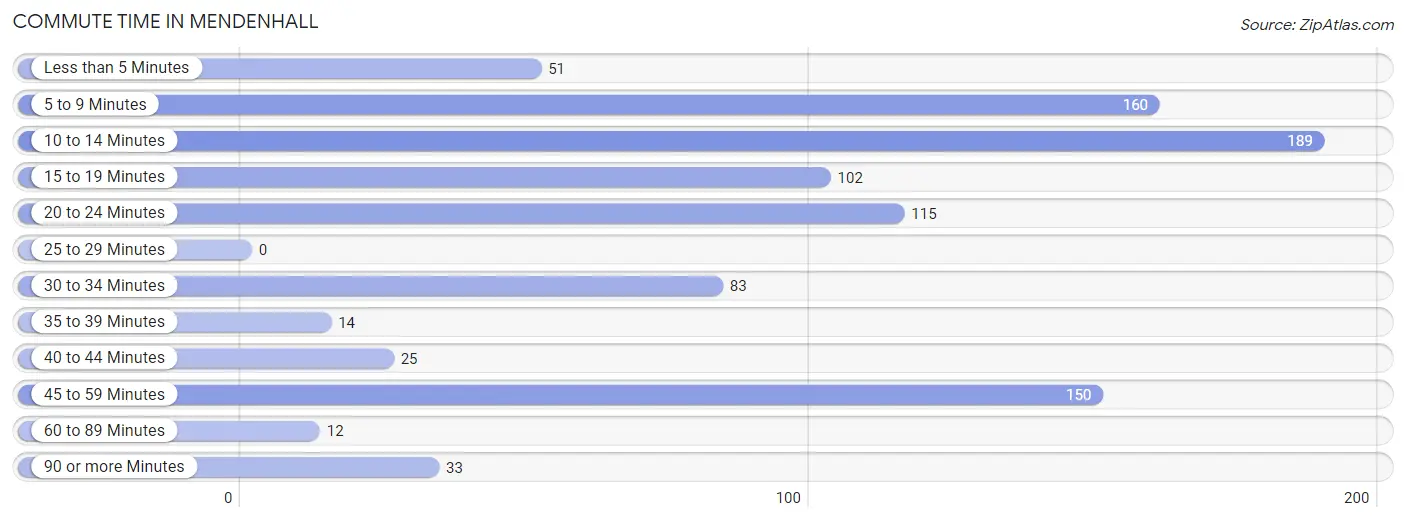
| Commute Time | # Commuters | % Commuters |
| Less than 5 Minutes | 51 | 5.5% |
| 5 to 9 Minutes | 160 | 17.1% |
| 10 to 14 Minutes | 189 | 20.2% |
| 15 to 19 Minutes | 102 | 10.9% |
| 20 to 24 Minutes | 115 | 12.3% |
| 25 to 29 Minutes | 0 | 0.0% |
| 30 to 34 Minutes | 83 | 8.9% |
| 35 to 39 Minutes | 14 | 1.5% |
| 40 to 44 Minutes | 25 | 2.7% |
| 45 to 59 Minutes | 150 | 16.1% |
| 60 to 89 Minutes | 12 | 1.3% |
| 90 or more Minutes | 33 | 3.5% |
Commute Time by Sex in Mendenhall
The most common commute times in Mendenhall are 10 to 14 minutes (93 commuters, 23.5%) for males and 5 to 9 minutes (111 commuters, 20.6%) for females.
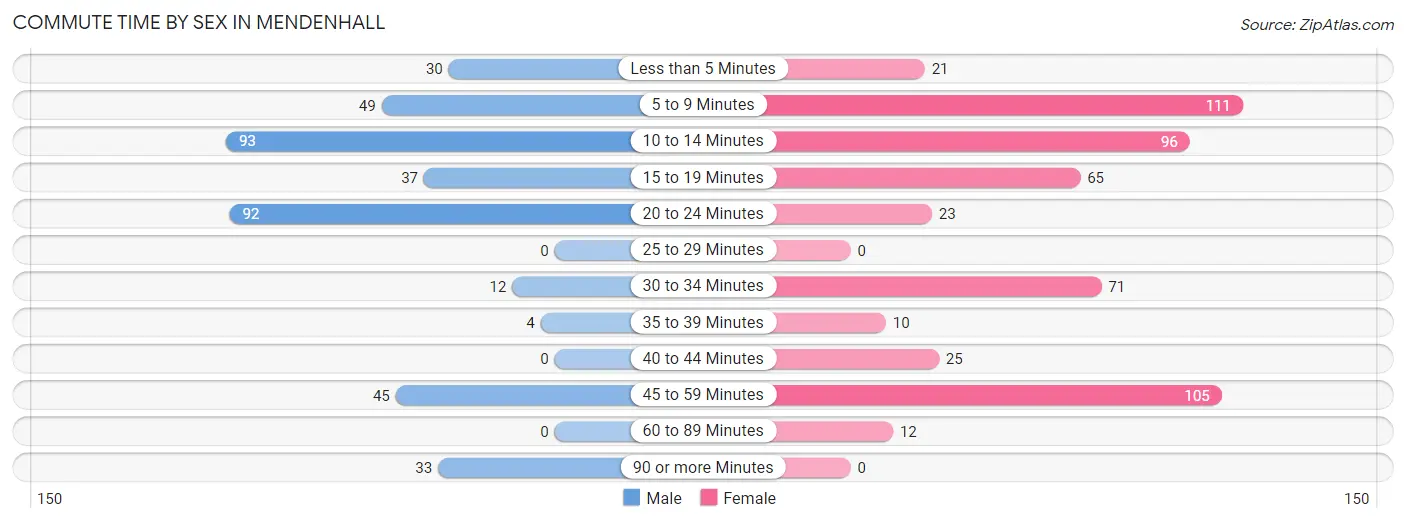
| Commute Time | Male | Female |
| Less than 5 Minutes | 30 (7.6%) | 21 (3.9%) |
| 5 to 9 Minutes | 49 (12.4%) | 111 (20.6%) |
| 10 to 14 Minutes | 93 (23.5%) | 96 (17.8%) |
| 15 to 19 Minutes | 37 (9.4%) | 65 (12.1%) |
| 20 to 24 Minutes | 92 (23.3%) | 23 (4.3%) |
| 25 to 29 Minutes | 0 (0.0%) | 0 (0.0%) |
| 30 to 34 Minutes | 12 (3.0%) | 71 (13.2%) |
| 35 to 39 Minutes | 4 (1.0%) | 10 (1.9%) |
| 40 to 44 Minutes | 0 (0.0%) | 25 (4.6%) |
| 45 to 59 Minutes | 45 (11.4%) | 105 (19.5%) |
| 60 to 89 Minutes | 0 (0.0%) | 12 (2.2%) |
| 90 or more Minutes | 33 (8.4%) | 0 (0.0%) |
Time of Departure to Work by Sex in Mendenhall
The most frequent times of departure to work in Mendenhall are 7:30 AM to 7:59 AM (76, 19.2%) for males and 7:00 AM to 7:29 AM (96, 17.8%) for females.
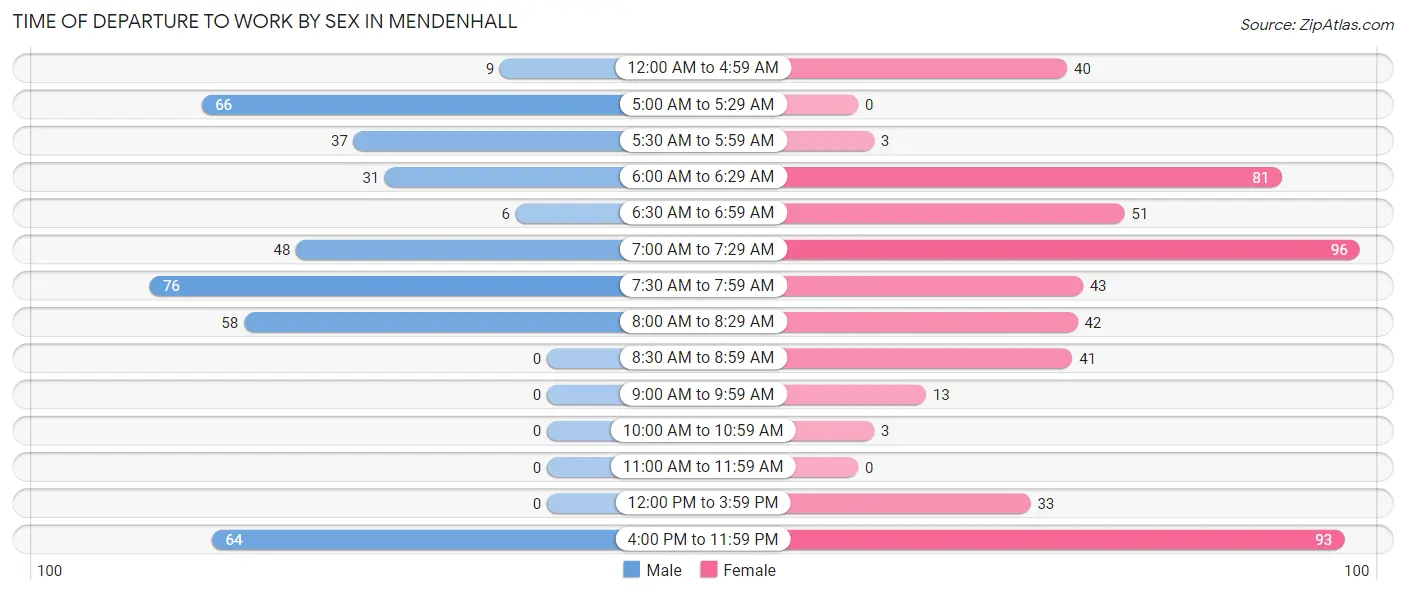
| Time of Departure | Male | Female |
| 12:00 AM to 4:59 AM | 9 (2.3%) | 40 (7.4%) |
| 5:00 AM to 5:29 AM | 66 (16.7%) | 0 (0.0%) |
| 5:30 AM to 5:59 AM | 37 (9.4%) | 3 (0.6%) |
| 6:00 AM to 6:29 AM | 31 (7.9%) | 81 (15.0%) |
| 6:30 AM to 6:59 AM | 6 (1.5%) | 51 (9.5%) |
| 7:00 AM to 7:29 AM | 48 (12.1%) | 96 (17.8%) |
| 7:30 AM to 7:59 AM | 76 (19.2%) | 43 (8.0%) |
| 8:00 AM to 8:29 AM | 58 (14.7%) | 42 (7.8%) |
| 8:30 AM to 8:59 AM | 0 (0.0%) | 41 (7.6%) |
| 9:00 AM to 9:59 AM | 0 (0.0%) | 13 (2.4%) |
| 10:00 AM to 10:59 AM | 0 (0.0%) | 3 (0.6%) |
| 11:00 AM to 11:59 AM | 0 (0.0%) | 0 (0.0%) |
| 12:00 PM to 3:59 PM | 0 (0.0%) | 33 (6.1%) |
| 4:00 PM to 11:59 PM | 64 (16.2%) | 93 (17.2%) |
| Total | 395 (100.0%) | 539 (100.0%) |
Housing Occupancy in Mendenhall
Occupancy by Ownership in Mendenhall
Of the total 1,000 dwellings in Mendenhall, owner-occupied units account for 628 (62.8%), while renter-occupied units make up 372 (37.2%).
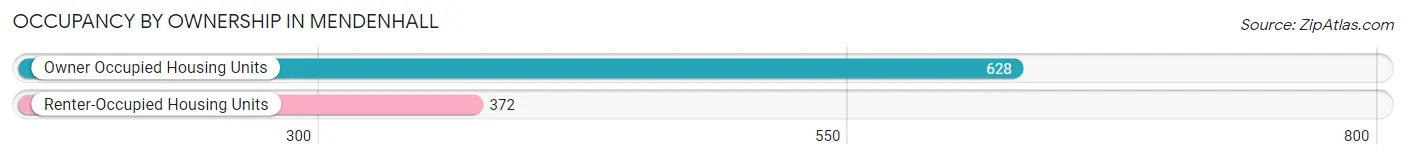
| Occupancy | # Housing Units | % Housing Units |
| Owner Occupied Housing Units | 628 | 62.8% |
| Renter-Occupied Housing Units | 372 | 37.2% |
| Total Occupied Housing Units | 1,000 | 100.0% |
Occupancy by Household Size in Mendenhall
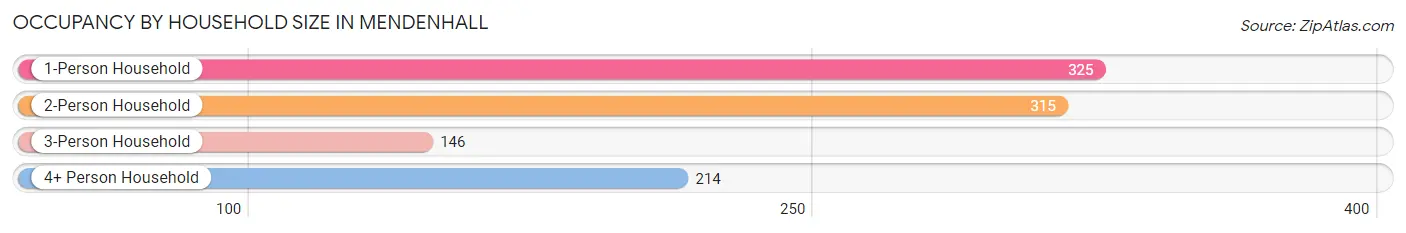
| Household Size | # Housing Units | % Housing Units |
| 1-Person Household | 325 | 32.5% |
| 2-Person Household | 315 | 31.5% |
| 3-Person Household | 146 | 14.6% |
| 4+ Person Household | 214 | 21.4% |
| Total Housing Units | 1,000 | 100.0% |
Occupancy by Ownership by Household Size in Mendenhall
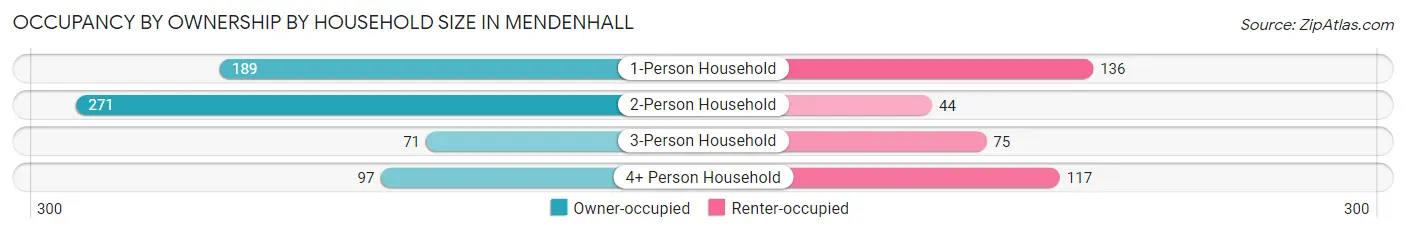
| Household Size | Owner-occupied | Renter-occupied |
| 1-Person Household | 189 (58.2%) | 136 (41.8%) |
| 2-Person Household | 271 (86.0%) | 44 (14.0%) |
| 3-Person Household | 71 (48.6%) | 75 (51.4%) |
| 4+ Person Household | 97 (45.3%) | 117 (54.7%) |
| Total Housing Units | 628 (62.8%) | 372 (37.2%) |
Occupancy by Educational Attainment in Mendenhall
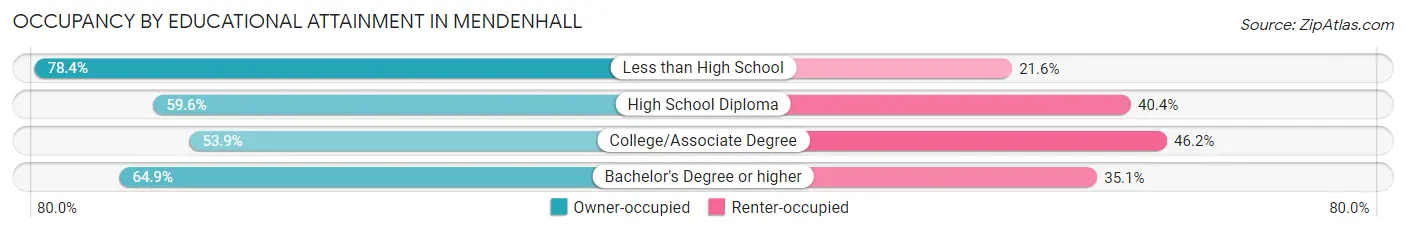
| Household Size | Owner-occupied | Renter-occupied |
| Less than High School | 149 (78.4%) | 41 (21.6%) |
| High School Diploma | 137 (59.6%) | 93 (40.4%) |
| College/Associate Degree | 168 (53.8%) | 144 (46.2%) |
| Bachelor's Degree or higher | 174 (64.9%) | 94 (35.1%) |
Occupancy by Age of Householder in Mendenhall
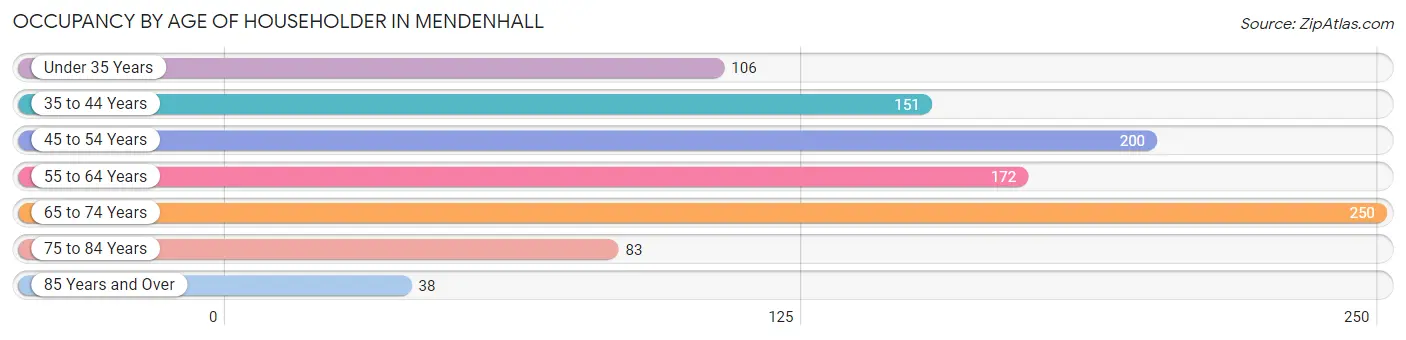
| Age Bracket | # Households | % Households |
| Under 35 Years | 106 | 10.6% |
| 35 to 44 Years | 151 | 15.1% |
| 45 to 54 Years | 200 | 20.0% |
| 55 to 64 Years | 172 | 17.2% |
| 65 to 74 Years | 250 | 25.0% |
| 75 to 84 Years | 83 | 8.3% |
| 85 Years and Over | 38 | 3.8% |
| Total | 1,000 | 100.0% |
Housing Finances in Mendenhall
Median Income by Occupancy in Mendenhall
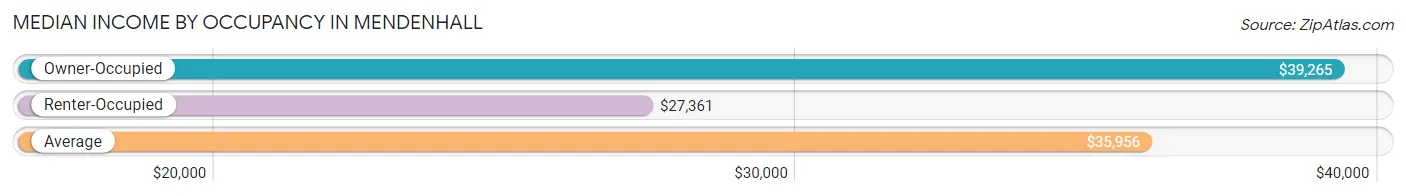
| Occupancy Type | # Households | Median Income |
| Owner-Occupied | 628 (62.8%) | $39,265 |
| Renter-Occupied | 372 (37.2%) | $27,361 |
| Average | 1,000 (100.0%) | $35,956 |
Occupancy by Householder Income Bracket in Mendenhall
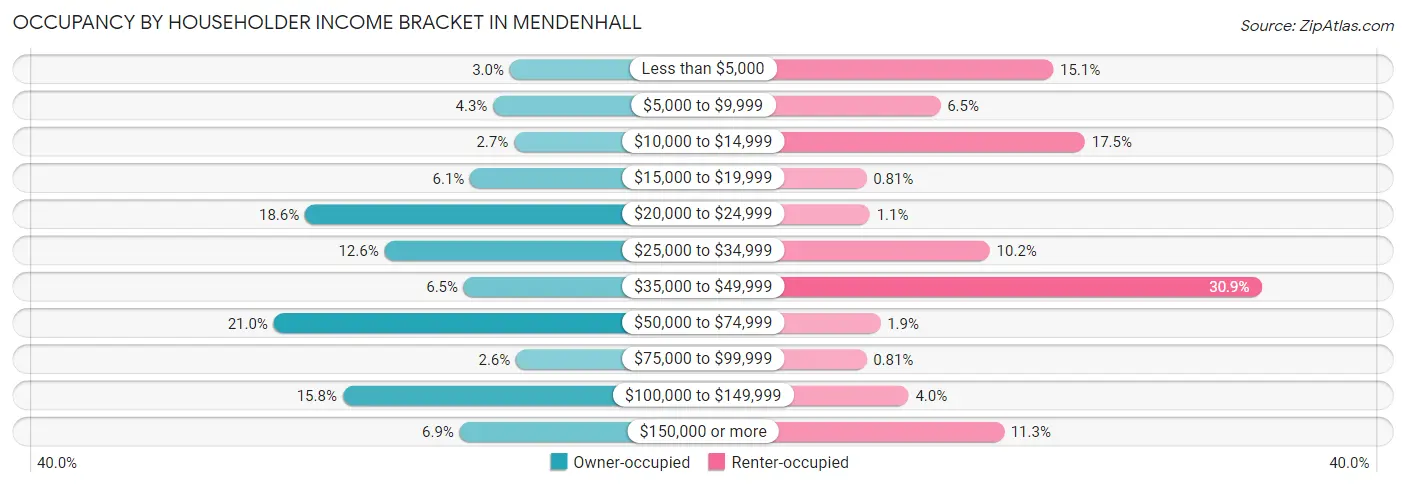
| Income Bracket | Owner-occupied | Renter-occupied |
| Less than $5,000 | 19 (3.0%) | 56 (15.0%) |
| $5,000 to $9,999 | 27 (4.3%) | 24 (6.5%) |
| $10,000 to $14,999 | 17 (2.7%) | 65 (17.5%) |
| $15,000 to $19,999 | 38 (6.0%) | 3 (0.8%) |
| $20,000 to $24,999 | 117 (18.6%) | 4 (1.1%) |
| $25,000 to $34,999 | 79 (12.6%) | 38 (10.2%) |
| $35,000 to $49,999 | 41 (6.5%) | 115 (30.9%) |
| $50,000 to $74,999 | 132 (21.0%) | 7 (1.9%) |
| $75,000 to $99,999 | 16 (2.5%) | 3 (0.8%) |
| $100,000 to $149,999 | 99 (15.8%) | 15 (4.0%) |
| $150,000 or more | 43 (6.9%) | 42 (11.3%) |
| Total | 628 (100.0%) | 372 (100.0%) |
Monthly Housing Cost Tiers in Mendenhall
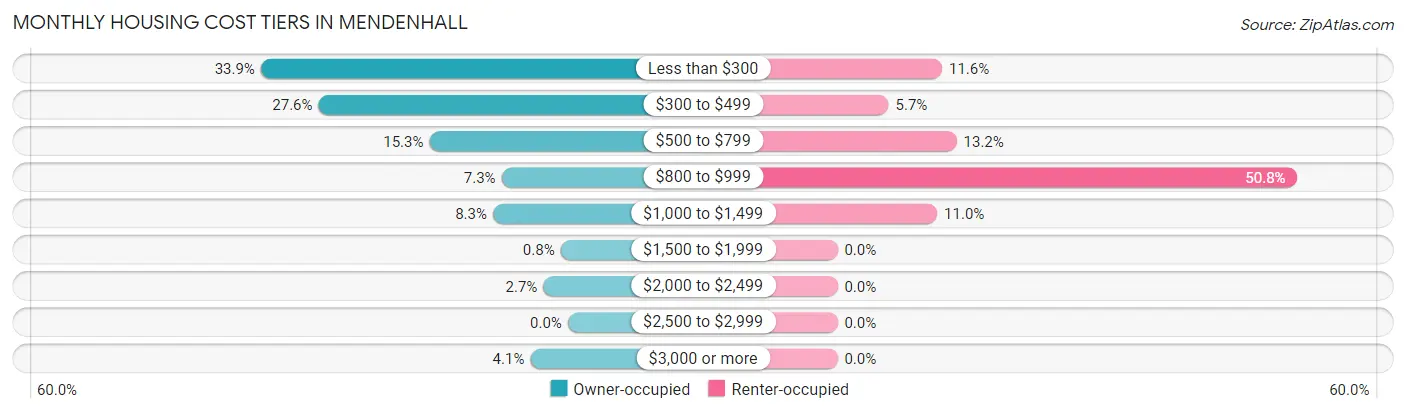
| Monthly Cost | Owner-occupied | Renter-occupied |
| Less than $300 | 213 (33.9%) | 43 (11.6%) |
| $300 to $499 | 173 (27.6%) | 21 (5.7%) |
| $500 to $799 | 96 (15.3%) | 49 (13.2%) |
| $800 to $999 | 46 (7.3%) | 189 (50.8%) |
| $1,000 to $1,499 | 52 (8.3%) | 41 (11.0%) |
| $1,500 to $1,999 | 5 (0.8%) | 0 (0.0%) |
| $2,000 to $2,499 | 17 (2.7%) | 0 (0.0%) |
| $2,500 to $2,999 | 0 (0.0%) | 0 (0.0%) |
| $3,000 or more | 26 (4.1%) | 0 (0.0%) |
| Total | 628 (100.0%) | 372 (100.0%) |
Physical Housing Characteristics in Mendenhall
Housing Structures in Mendenhall
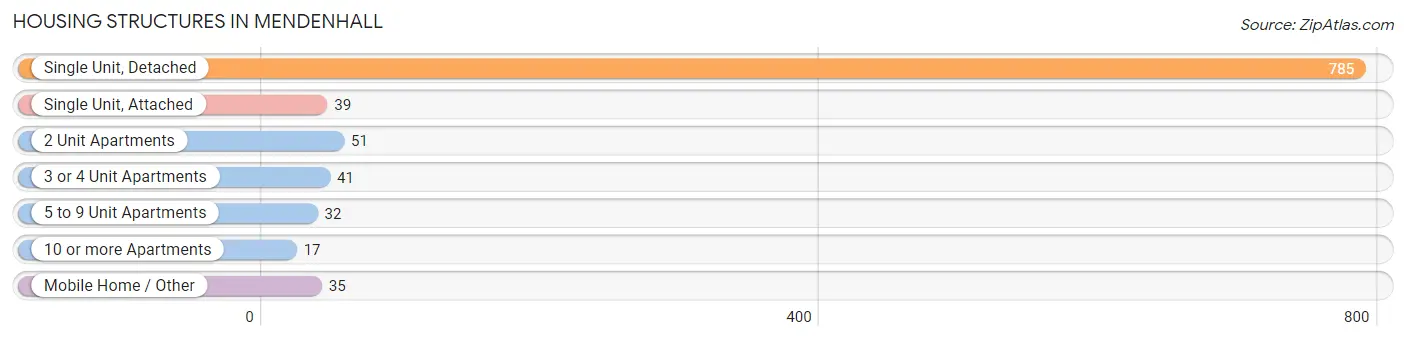
| Structure Type | # Housing Units | % Housing Units |
| Single Unit, Detached | 785 | 78.5% |
| Single Unit, Attached | 39 | 3.9% |
| 2 Unit Apartments | 51 | 5.1% |
| 3 or 4 Unit Apartments | 41 | 4.1% |
| 5 to 9 Unit Apartments | 32 | 3.2% |
| 10 or more Apartments | 17 | 1.7% |
| Mobile Home / Other | 35 | 3.5% |
| Total | 1,000 | 100.0% |
Housing Structures by Occupancy in Mendenhall
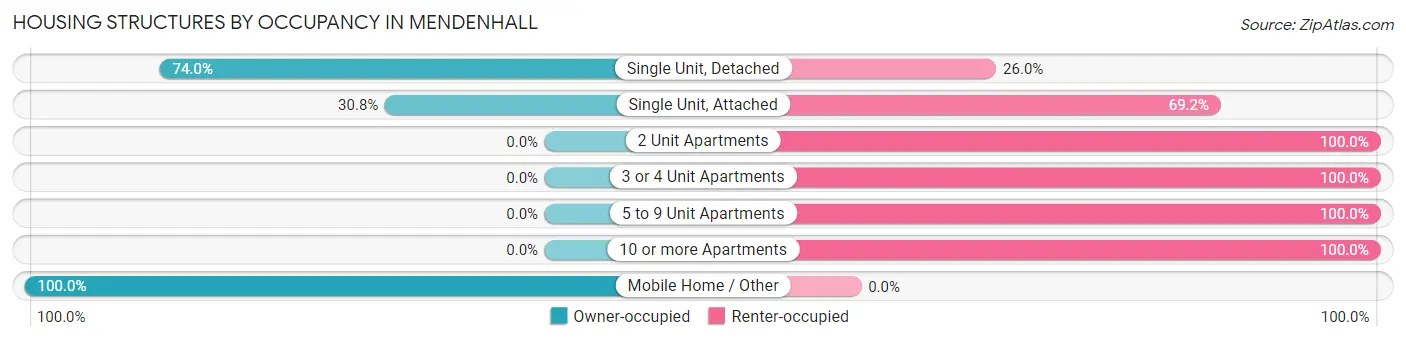
| Structure Type | Owner-occupied | Renter-occupied |
| Single Unit, Detached | 581 (74.0%) | 204 (26.0%) |
| Single Unit, Attached | 12 (30.8%) | 27 (69.2%) |
| 2 Unit Apartments | 0 (0.0%) | 51 (100.0%) |
| 3 or 4 Unit Apartments | 0 (0.0%) | 41 (100.0%) |
| 5 to 9 Unit Apartments | 0 (0.0%) | 32 (100.0%) |
| 10 or more Apartments | 0 (0.0%) | 17 (100.0%) |
| Mobile Home / Other | 35 (100.0%) | 0 (0.0%) |
| Total | 628 (62.8%) | 372 (37.2%) |
Housing Structures by Number of Rooms in Mendenhall
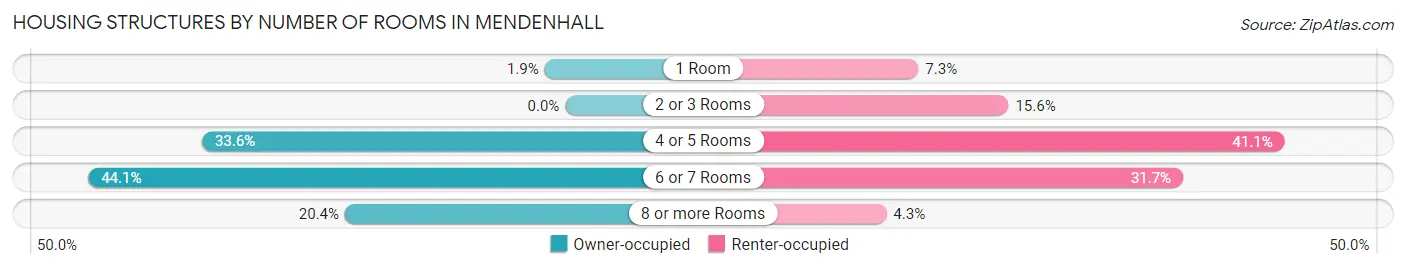
| Number of Rooms | Owner-occupied | Renter-occupied |
| 1 Room | 12 (1.9%) | 27 (7.3%) |
| 2 or 3 Rooms | 0 (0.0%) | 58 (15.6%) |
| 4 or 5 Rooms | 211 (33.6%) | 153 (41.1%) |
| 6 or 7 Rooms | 277 (44.1%) | 118 (31.7%) |
| 8 or more Rooms | 128 (20.4%) | 16 (4.3%) |
| Total | 628 (100.0%) | 372 (100.0%) |
Housing Structure by Heating Type in Mendenhall
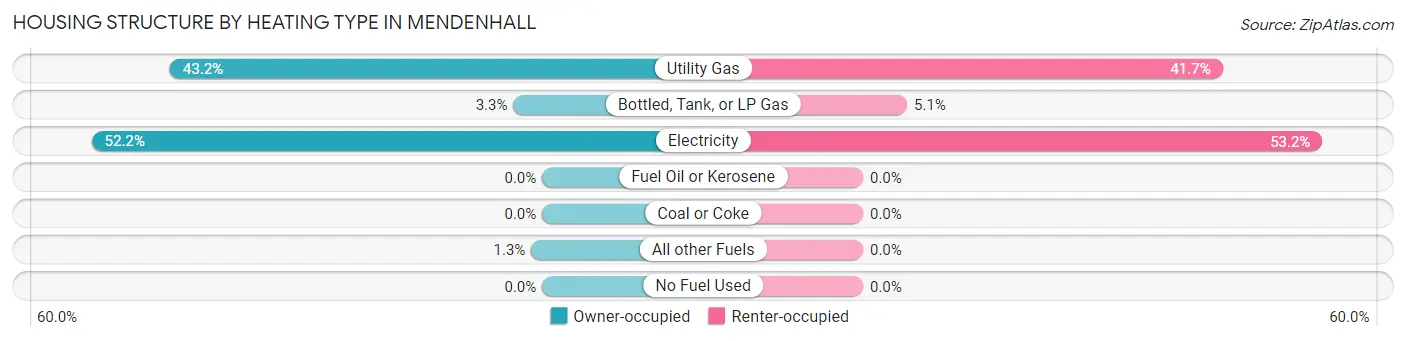
| Heating Type | Owner-occupied | Renter-occupied |
| Utility Gas | 271 (43.1%) | 155 (41.7%) |
| Bottled, Tank, or LP Gas | 21 (3.3%) | 19 (5.1%) |
| Electricity | 328 (52.2%) | 198 (53.2%) |
| Fuel Oil or Kerosene | 0 (0.0%) | 0 (0.0%) |
| Coal or Coke | 0 (0.0%) | 0 (0.0%) |
| All other Fuels | 8 (1.3%) | 0 (0.0%) |
| No Fuel Used | 0 (0.0%) | 0 (0.0%) |
| Total | 628 (100.0%) | 372 (100.0%) |
Household Vehicle Usage in Mendenhall
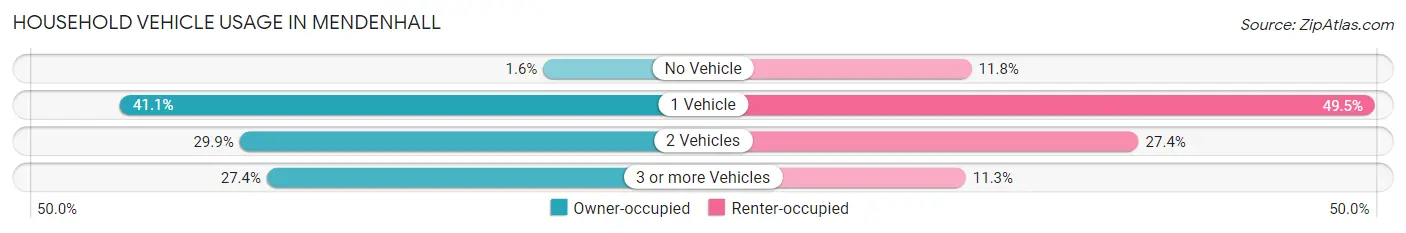
| Vehicles per Household | Owner-occupied | Renter-occupied |
| No Vehicle | 10 (1.6%) | 44 (11.8%) |
| 1 Vehicle | 258 (41.1%) | 184 (49.5%) |
| 2 Vehicles | 188 (29.9%) | 102 (27.4%) |
| 3 or more Vehicles | 172 (27.4%) | 42 (11.3%) |
| Total | 628 (100.0%) | 372 (100.0%) |
Real Estate & Mortgages in Mendenhall
Real Estate and Mortgage Overview in Mendenhall
| Characteristic | Without Mortgage | With Mortgage |
| Housing Units | 434 | 194 |
| Median Property Value | $99,300 | $125,900 |
| Median Household Income | $32,596 | $43 |
| Monthly Housing Costs | $305 | $26 |
| Real Estate Taxes | $737 | $72 |
Property Value by Mortgage Status in Mendenhall
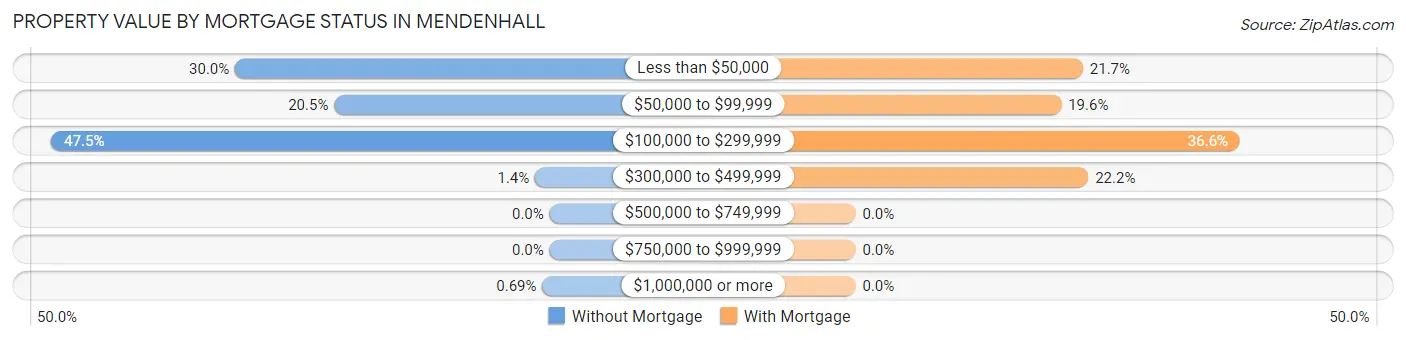
| Property Value | Without Mortgage | With Mortgage |
| Less than $50,000 | 130 (29.9%) | 42 (21.6%) |
| $50,000 to $99,999 | 89 (20.5%) | 38 (19.6%) |
| $100,000 to $299,999 | 206 (47.5%) | 71 (36.6%) |
| $300,000 to $499,999 | 6 (1.4%) | 43 (22.2%) |
| $500,000 to $749,999 | 0 (0.0%) | 0 (0.0%) |
| $750,000 to $999,999 | 0 (0.0%) | 0 (0.0%) |
| $1,000,000 or more | 3 (0.7%) | 0 (0.0%) |
| Total | 434 (100.0%) | 194 (100.0%) |
Household Income by Mortgage Status in Mendenhall
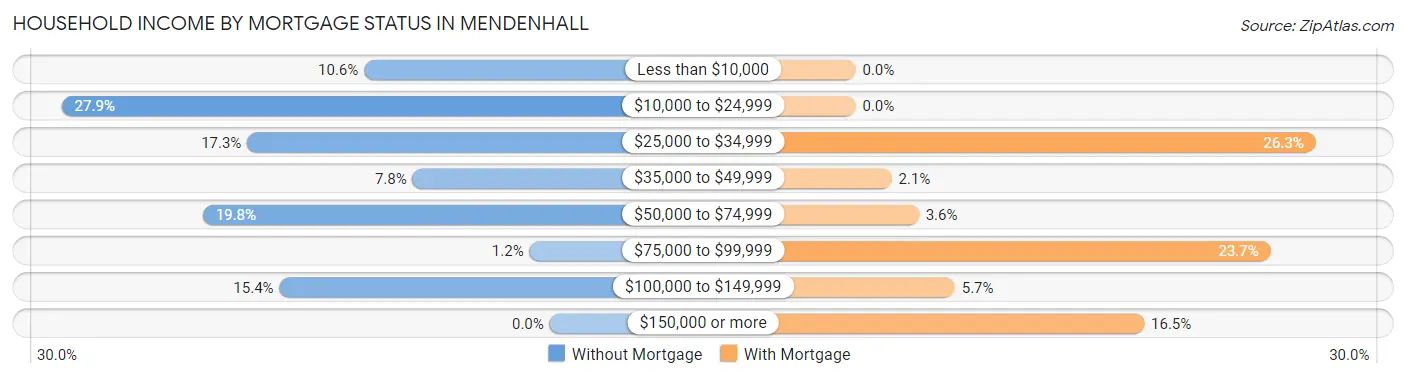
| Household Income | Without Mortgage | With Mortgage |
| Less than $10,000 | 46 (10.6%) | 0 (0.0%) |
| $10,000 to $24,999 | 121 (27.9%) | 0 (0.0%) |
| $25,000 to $34,999 | 75 (17.3%) | 51 (26.3%) |
| $35,000 to $49,999 | 34 (7.8%) | 4 (2.1%) |
| $50,000 to $74,999 | 86 (19.8%) | 7 (3.6%) |
| $75,000 to $99,999 | 5 (1.1%) | 46 (23.7%) |
| $100,000 to $149,999 | 67 (15.4%) | 11 (5.7%) |
| $150,000 or more | 0 (0.0%) | 32 (16.5%) |
| Total | 434 (100.0%) | 194 (100.0%) |
Property Value to Household Income Ratio in Mendenhall
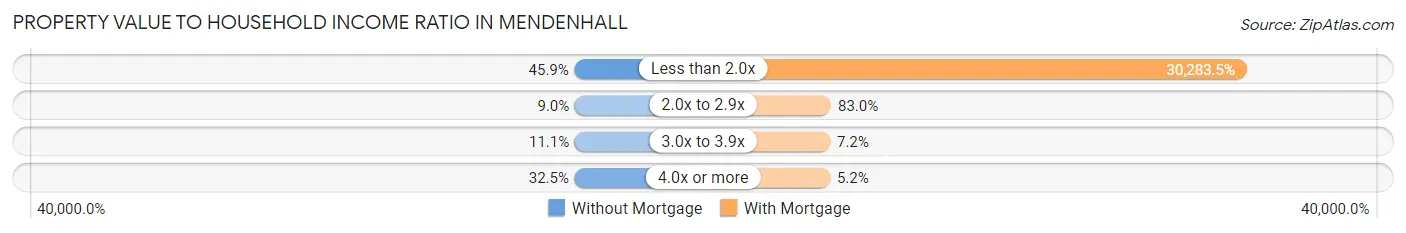
| Value-to-Income Ratio | Without Mortgage | With Mortgage |
| Less than 2.0x | 199 (45.9%) | 58,750 (30,283.5%) |
| 2.0x to 2.9x | 39 (9.0%) | 161 (83.0%) |
| 3.0x to 3.9x | 48 (11.1%) | 14 (7.2%) |
| 4.0x or more | 141 (32.5%) | 10 (5.1%) |
| Total | 434 (100.0%) | 194 (100.0%) |
Real Estate Taxes by Mortgage Status in Mendenhall
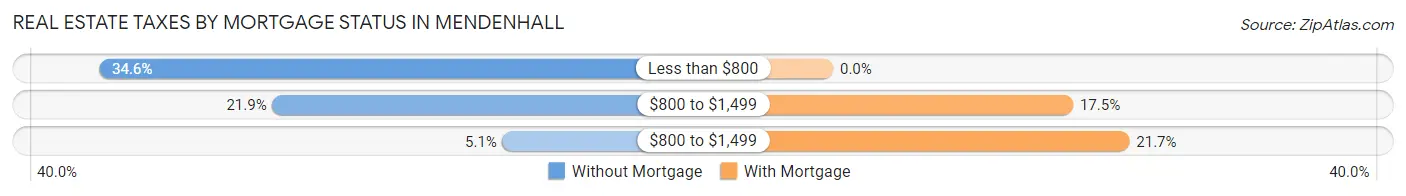
| Property Taxes | Without Mortgage | With Mortgage |
| Less than $800 | 150 (34.6%) | 0 (0.0%) |
| $800 to $1,499 | 95 (21.9%) | 34 (17.5%) |
| $800 to $1,499 | 22 (5.1%) | 42 (21.6%) |
| Total | 434 (100.0%) | 194 (100.0%) |
Health & Disability in Mendenhall
Health Insurance Coverage by Age in Mendenhall
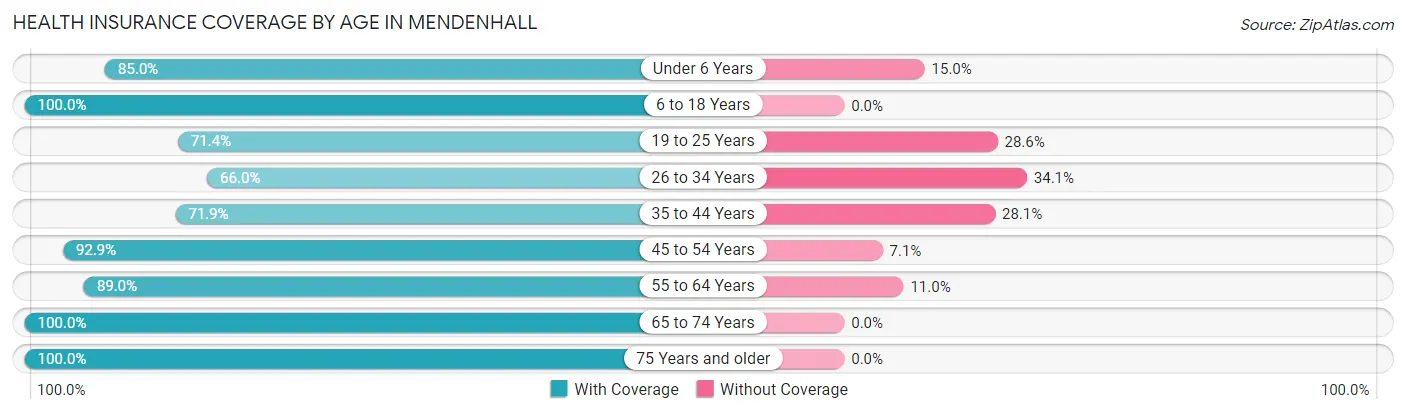
| Age Bracket | With Coverage | Without Coverage |
| Under 6 Years | 210 (85.0%) | 37 (15.0%) |
| 6 to 18 Years | 468 (100.0%) | 0 (0.0%) |
| 19 to 25 Years | 165 (71.4%) | 66 (28.6%) |
| 26 to 34 Years | 122 (65.9%) | 63 (34.1%) |
| 35 to 44 Years | 156 (71.9%) | 61 (28.1%) |
| 45 to 54 Years | 247 (92.9%) | 19 (7.1%) |
| 55 to 64 Years | 290 (89.0%) | 36 (11.0%) |
| 65 to 74 Years | 437 (100.0%) | 0 (0.0%) |
| 75 Years and older | 192 (100.0%) | 0 (0.0%) |
| Total | 2,287 (89.0%) | 282 (11.0%) |
Health Insurance Coverage by Citizenship Status in Mendenhall
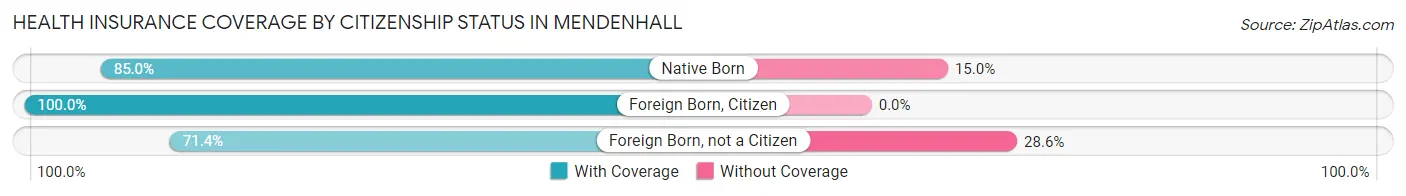
| Citizenship Status | With Coverage | Without Coverage |
| Native Born | 210 (85.0%) | 37 (15.0%) |
| Foreign Born, Citizen | 468 (100.0%) | 0 (0.0%) |
| Foreign Born, not a Citizen | 165 (71.4%) | 66 (28.6%) |
Health Insurance Coverage by Household Income in Mendenhall
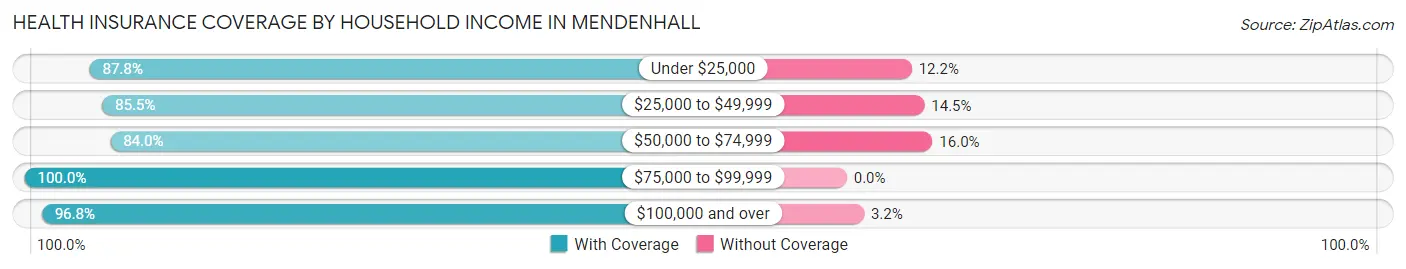
| Household Income | With Coverage | Without Coverage |
| Under $25,000 | 722 (87.8%) | 100 (12.2%) |
| $25,000 to $49,999 | 588 (85.5%) | 100 (14.5%) |
| $50,000 to $74,999 | 267 (84.0%) | 51 (16.0%) |
| $75,000 to $99,999 | 55 (100.0%) | 0 (0.0%) |
| $100,000 and over | 634 (96.8%) | 21 (3.2%) |
Public vs Private Health Insurance Coverage by Age in Mendenhall
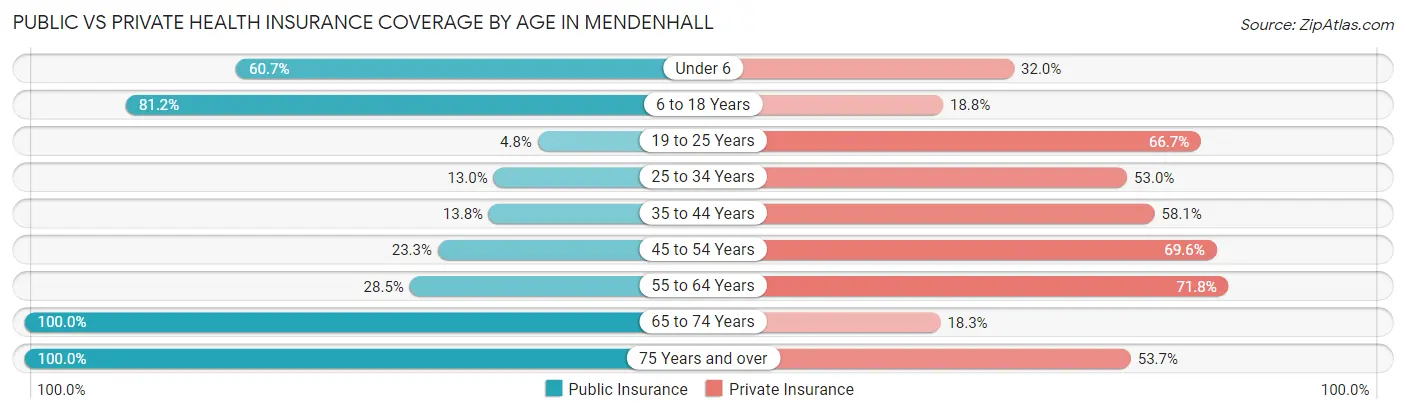
| Age Bracket | Public Insurance | Private Insurance |
| Under 6 | 150 (60.7%) | 79 (32.0%) |
| 6 to 18 Years | 380 (81.2%) | 88 (18.8%) |
| 19 to 25 Years | 11 (4.8%) | 154 (66.7%) |
| 25 to 34 Years | 24 (13.0%) | 98 (53.0%) |
| 35 to 44 Years | 30 (13.8%) | 126 (58.1%) |
| 45 to 54 Years | 62 (23.3%) | 185 (69.6%) |
| 55 to 64 Years | 93 (28.5%) | 234 (71.8%) |
| 65 to 74 Years | 437 (100.0%) | 80 (18.3%) |
| 75 Years and over | 192 (100.0%) | 103 (53.6%) |
| Total | 1,379 (53.7%) | 1,147 (44.7%) |
Disability Status by Sex by Age in Mendenhall
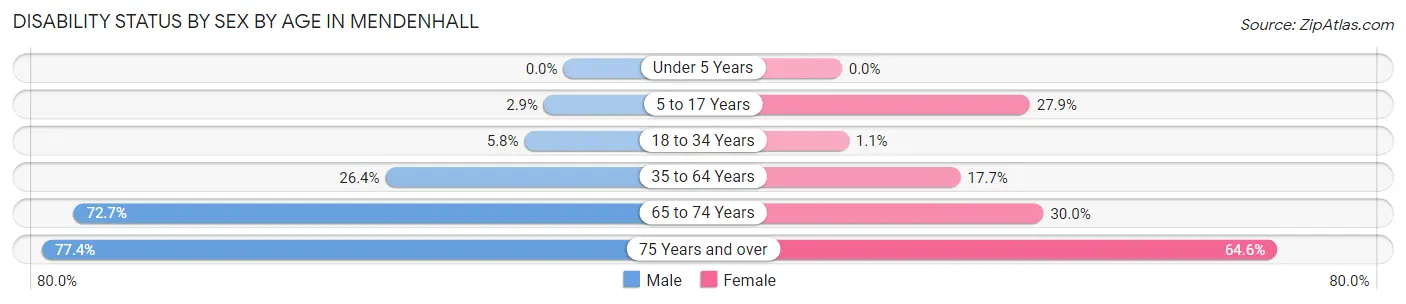
| Age Bracket | Male | Female |
| Under 5 Years | 0 (0.0%) | 0 (0.0%) |
| 5 to 17 Years | 5 (2.9%) | 67 (27.9%) |
| 18 to 34 Years | 11 (5.8%) | 3 (1.1%) |
| 35 to 64 Years | 88 (26.4%) | 84 (17.6%) |
| 65 to 74 Years | 160 (72.7%) | 65 (29.9%) |
| 75 Years and over | 48 (77.4%) | 84 (64.6%) |
Disability Class by Sex by Age in Mendenhall
Disability Class: Hearing Difficulty
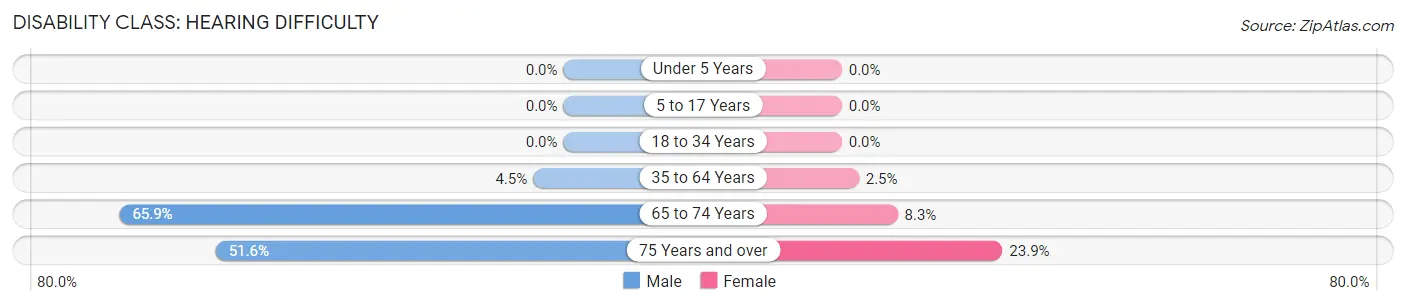
| Age Bracket | Male | Female |
| Under 5 Years | 0 (0.0%) | 0 (0.0%) |
| 5 to 17 Years | 0 (0.0%) | 0 (0.0%) |
| 18 to 34 Years | 0 (0.0%) | 0 (0.0%) |
| 35 to 64 Years | 15 (4.5%) | 12 (2.5%) |
| 65 to 74 Years | 145 (65.9%) | 18 (8.3%) |
| 75 Years and over | 32 (51.6%) | 31 (23.8%) |
Disability Class: Vision Difficulty
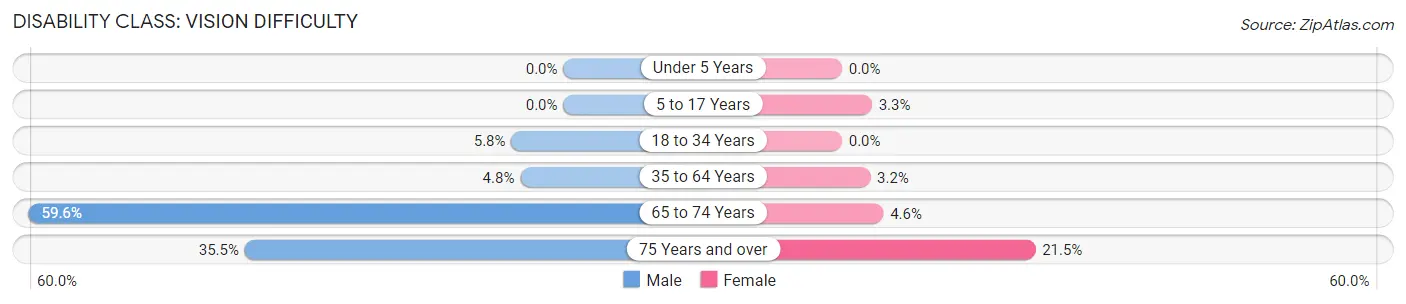
| Age Bracket | Male | Female |
| Under 5 Years | 0 (0.0%) | 0 (0.0%) |
| 5 to 17 Years | 0 (0.0%) | 8 (3.3%) |
| 18 to 34 Years | 11 (5.8%) | 0 (0.0%) |
| 35 to 64 Years | 16 (4.8%) | 15 (3.2%) |
| 65 to 74 Years | 131 (59.6%) | 10 (4.6%) |
| 75 Years and over | 22 (35.5%) | 28 (21.5%) |
Disability Class: Cognitive Difficulty
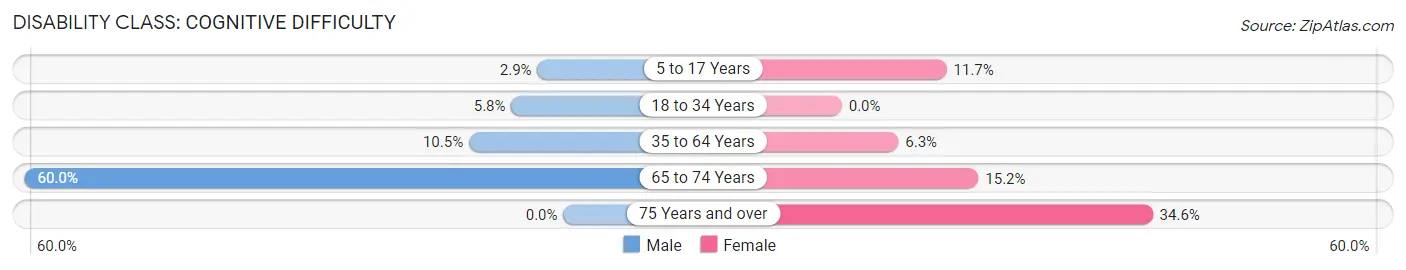
| Age Bracket | Male | Female |
| 5 to 17 Years | 5 (2.9%) | 28 (11.7%) |
| 18 to 34 Years | 11 (5.8%) | 0 (0.0%) |
| 35 to 64 Years | 35 (10.5%) | 30 (6.3%) |
| 65 to 74 Years | 132 (60.0%) | 33 (15.2%) |
| 75 Years and over | 0 (0.0%) | 45 (34.6%) |
Disability Class: Ambulatory Difficulty
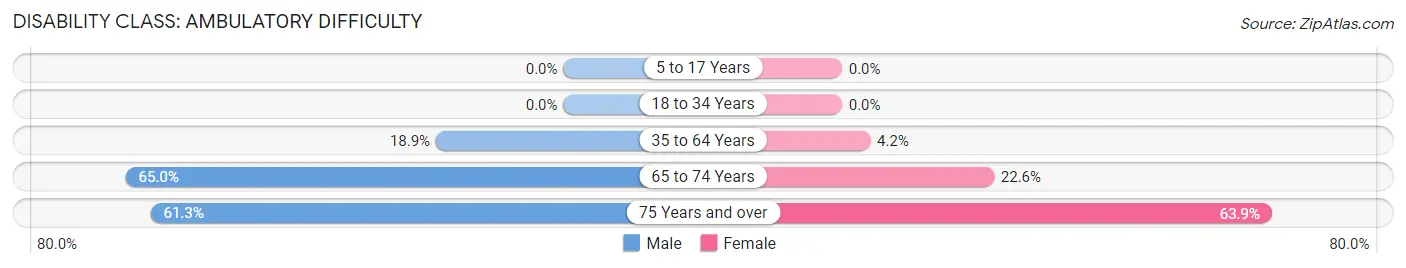
| Age Bracket | Male | Female |
| 5 to 17 Years | 0 (0.0%) | 0 (0.0%) |
| 18 to 34 Years | 0 (0.0%) | 0 (0.0%) |
| 35 to 64 Years | 63 (18.9%) | 20 (4.2%) |
| 65 to 74 Years | 143 (65.0%) | 49 (22.6%) |
| 75 Years and over | 38 (61.3%) | 83 (63.8%) |
Disability Class: Self-Care Difficulty
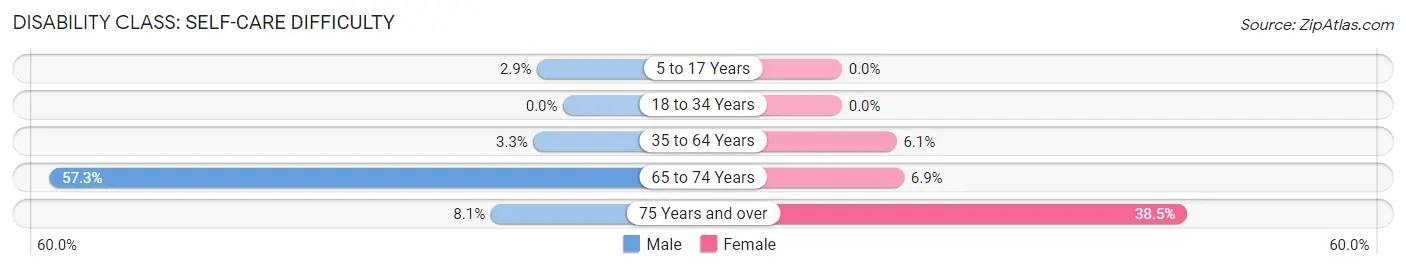
| Age Bracket | Male | Female |
| 5 to 17 Years | 5 (2.9%) | 0 (0.0%) |
| 18 to 34 Years | 0 (0.0%) | 0 (0.0%) |
| 35 to 64 Years | 11 (3.3%) | 29 (6.1%) |
| 65 to 74 Years | 126 (57.3%) | 15 (6.9%) |
| 75 Years and over | 5 (8.1%) | 50 (38.5%) |
Technology Access in Mendenhall
Computing Device Access in Mendenhall
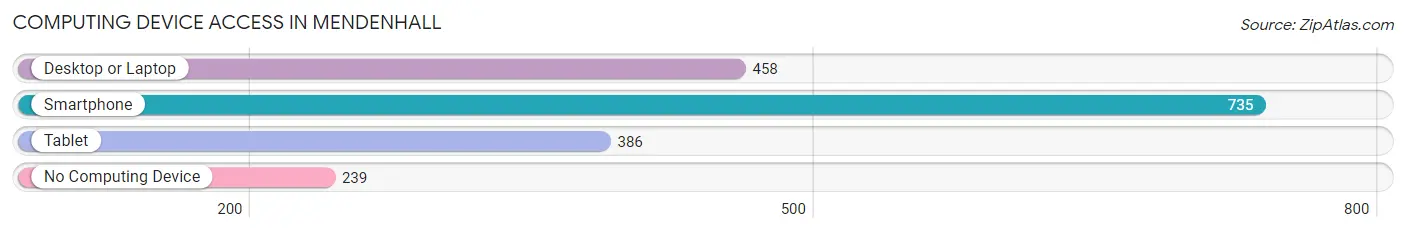
| Device Type | # Households | % Households |
| Desktop or Laptop | 458 | 45.8% |
| Smartphone | 735 | 73.5% |
| Tablet | 386 | 38.6% |
| No Computing Device | 239 | 23.9% |
| Total | 1,000 | 100.0% |
Internet Access in Mendenhall
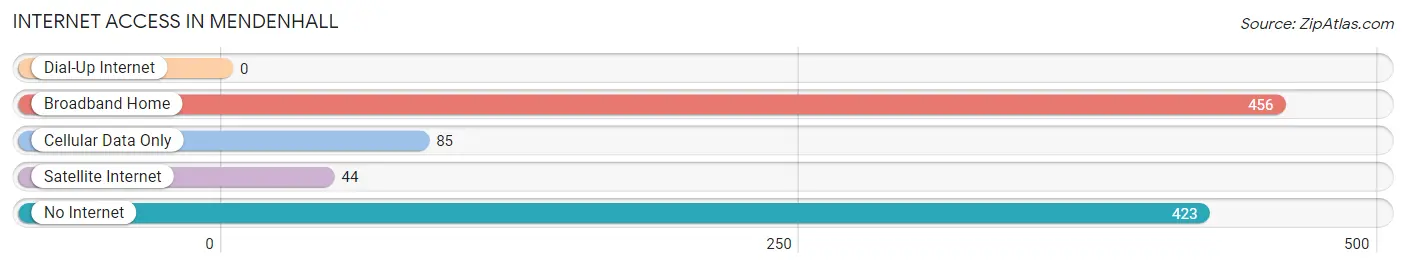
| Internet Type | # Households | % Households |
| Dial-Up Internet | 0 | 0.0% |
| Broadband Home | 456 | 45.6% |
| Cellular Data Only | 85 | 8.5% |
| Satellite Internet | 44 | 4.4% |
| No Internet | 423 | 42.3% |
| Total | 1,000 | 100.0% |
Mendenhall Summary
Mendenhall is a city located in Simpson County, Mississippi. It is part of the Jackson Metropolitan Statistical Area. The city has a population of approximately 4,000 people and is located about 25 miles southeast of Jackson, the state capital.
History
Mendenhall was founded in 1854 by a group of settlers from North Carolina. The town was named after the Mendenhall family, who were among the first settlers. The town was incorporated in 1858 and was the first town in Simpson County.
In the late 19th century, Mendenhall was a thriving agricultural center. The town was home to several cotton gins, a sawmill, and a gristmill. The town also had a railroad station, which connected it to other towns in the area.
In the early 20th century, Mendenhall experienced a period of growth and development. The town was home to several businesses, including a bank, a hotel, and a movie theater. The town also had a public school system, which was established in 1910.
Geography
Mendenhall is located in the southeastern part of Simpson County. The city is situated on the banks of the Pearl River, which flows through the city. The city is surrounded by rolling hills and forests. The climate in Mendenhall is humid subtropical, with hot summers and mild winters.
Economy
Mendenhall’s economy is largely based on agriculture. The city is home to several farms, which produce cotton, soybeans, corn, and other crops. The city also has several manufacturing plants, which produce furniture, clothing, and other products.
The city is also home to several retail stores, restaurants, and other businesses. The city is also home to several medical facilities, including a hospital and several clinics.
Demographics
As of the 2010 census, the population of Mendenhall was 4,039. The racial makeup of the city was 79.3% White, 18.2% African American, 0.3% Native American, 0.3% Asian, 0.1% Pacific Islander, 0.7% from other races, and 1.4% from two or more races. Hispanic or Latino of any race were 1.7% of the population.
The median household income in Mendenhall was $31,250, and the median family income was $37,500. The per capita income in Mendenhall was $17,845. About 17.2% of families and 20.3% of the population were below the poverty line, including 28.2% of those under age 18 and 16.2% of those age 65 or over.
Mendenhall is a small city with a rich history and a diverse economy. The city is home to several businesses, farms, and medical facilities, and is a great place to live and work.
Common Questions
What is Per Capita Income in Mendenhall?
Per Capita income in Mendenhall is $23,271.
What is the Median Family Income in Mendenhall?
Median Family Income in Mendenhall is $48,698.
What is the Median Household income in Mendenhall?
Median Household Income in Mendenhall is $35,956.
What is Income or Wage Gap in Mendenhall?
Income or Wage Gap in Mendenhall is 9.1%.
Women in Mendenhall earn 90.9 cents for every dollar earned by a man.
What is Family Income Deficit in Mendenhall?
Family Income Deficit in Mendenhall is $10,536.
Families that are below poverty line in Mendenhall earn $10,536 less on average than the poverty threshold level.
What is Inequality or Gini Index in Mendenhall?
Inequality or Gini Index in Mendenhall is 0.52.
What is the Total Population of Mendenhall?
Total Population of Mendenhall is 2,593.
What is the Total Male Population of Mendenhall?
Total Male Population of Mendenhall is 1,078.
What is the Total Female Population of Mendenhall?
Total Female Population of Mendenhall is 1,515.
What is the Ratio of Males per 100 Females in Mendenhall?
There are 71.16 Males per 100 Females in Mendenhall.
What is the Ratio of Females per 100 Males in Mendenhall?
There are 140.54 Females per 100 Males in Mendenhall.
What is the Median Population Age in Mendenhall?
Median Population Age in Mendenhall is 39.0 Years.
What is the Average Family Size in Mendenhall
Average Family Size in Mendenhall is 3.3 People.
What is the Average Household Size in Mendenhall
Average Household Size in Mendenhall is 2.5 People.
How Large is the Labor Force in Mendenhall?
There are 1,016 People in the Labor Forcein in Mendenhall.
What is the Percentage of People in the Labor Force in Mendenhall?
49.3% of People are in the Labor Force in Mendenhall.
What is the Unemployment Rate in Mendenhall?
Unemployment Rate in Mendenhall is 8.1%.