Lauderdale, MS Map & Demographics
Lauderdale Map
Lauderdale Overview
$31,446
PER CAPITA INCOME
$115,887
AVG FAMILY INCOME
0.49
INEQUALITY / GINI INDEX
214
TOTAL POPULATION
150
MALE POPULATION
64
FEMALE POPULATION
234.38
MALES / 100 FEMALES
42.67
FEMALES / 100 MALES
40.8
MEDIAN AGE
2.9
AVG FAMILY SIZE
1.5
AVG HOUSEHOLD SIZE
104
LABOR FORCE [ PEOPLE ]
53.6%
PERCENT IN LABOR FORCE
8.7%
UNEMPLOYMENT RATE
Lauderdale Zip Codes
Lauderdale Area Codes
Income in Lauderdale
Income Overview in Lauderdale
| Characteristic | Number | Measure |
| Per Capita Income | 214 | $31,446 |
| Median Family Income | 40 | $115,887 |
| Mean Family Income | 40 | $110,605 |
| Median Household Income | 139 | $0 |
| Mean Household Income | 139 | $48,072 |
| Income Deficit | 40 | $0 |
| Wage / Income Gap (%) | 214 | 0.00% |
| Wage / Income Gap ($) | 214 | 100.00¢ per $1 |
| Gini / Inequality Index | 214 | 0.49 |
Earnings by Sex in Lauderdale
| Sex | Number | Average Earnings |
| Male | 95 (91.3%) | $0 |
| Female | 9 (8.6%) | $0 |
| Total | 104 (100.0%) | $0 |
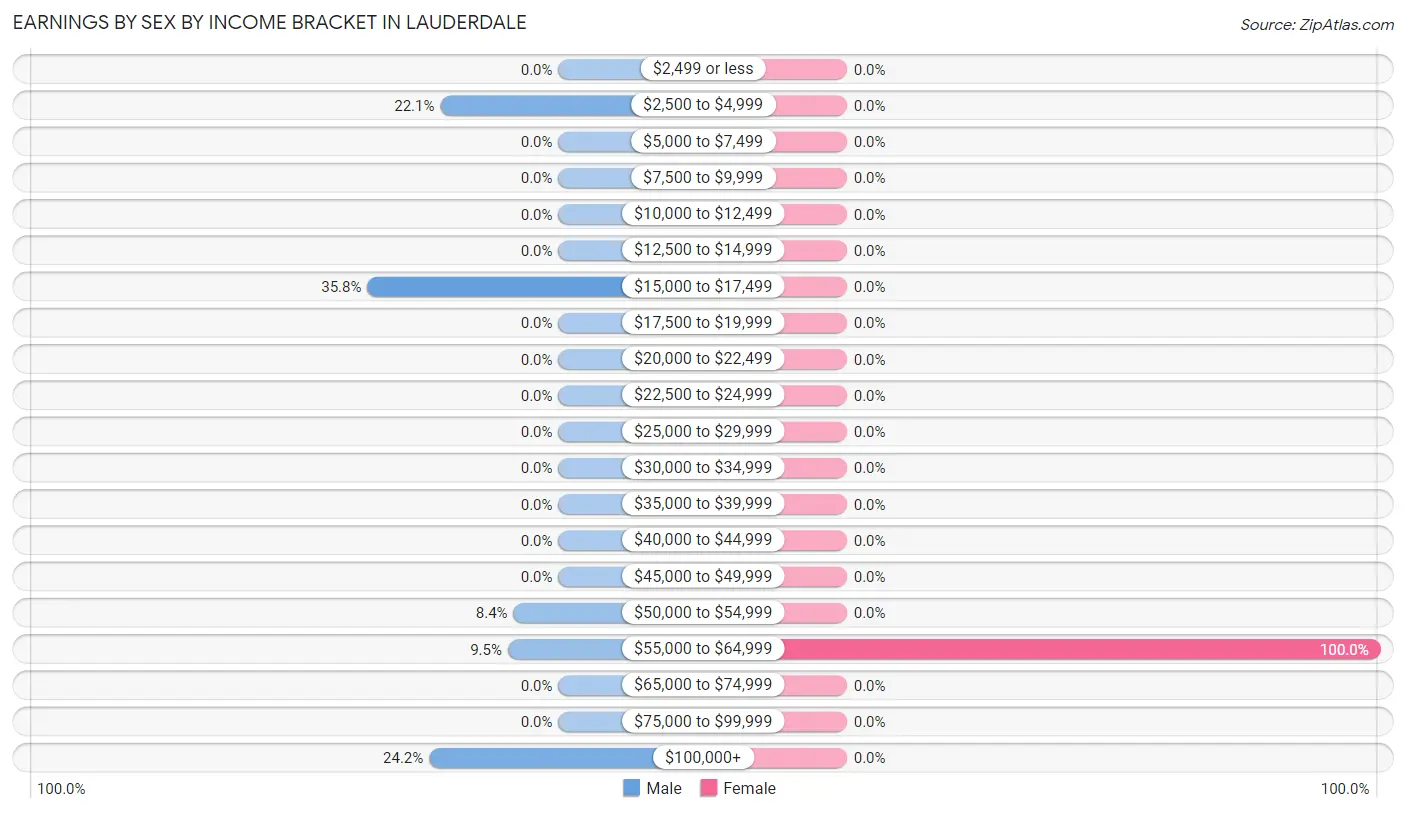
Earnings by Sex by Income Bracket in Lauderdale
The most common earnings brackets in Lauderdale are $15,000 to $17,499 for men (34 | 35.8%) and $55,000 to $64,999 for women (9 | 100.0%).
| Income | Male | Female |
| $2,499 or less | 0 (0.0%) | 0 (0.0%) |
| $2,500 to $4,999 | 21 (22.1%) | 0 (0.0%) |
| $5,000 to $7,499 | 0 (0.0%) | 0 (0.0%) |
| $7,500 to $9,999 | 0 (0.0%) | 0 (0.0%) |
| $10,000 to $12,499 | 0 (0.0%) | 0 (0.0%) |
| $12,500 to $14,999 | 0 (0.0%) | 0 (0.0%) |
| $15,000 to $17,499 | 34 (35.8%) | 0 (0.0%) |
| $17,500 to $19,999 | 0 (0.0%) | 0 (0.0%) |
| $20,000 to $22,499 | 0 (0.0%) | 0 (0.0%) |
| $22,500 to $24,999 | 0 (0.0%) | 0 (0.0%) |
| $25,000 to $29,999 | 0 (0.0%) | 0 (0.0%) |
| $30,000 to $34,999 | 0 (0.0%) | 0 (0.0%) |
| $35,000 to $39,999 | 0 (0.0%) | 0 (0.0%) |
| $40,000 to $44,999 | 0 (0.0%) | 0 (0.0%) |
| $45,000 to $49,999 | 0 (0.0%) | 0 (0.0%) |
| $50,000 to $54,999 | 8 (8.4%) | 0 (0.0%) |
| $55,000 to $64,999 | 9 (9.5%) | 9 (100.0%) |
| $65,000 to $74,999 | 0 (0.0%) | 0 (0.0%) |
| $75,000 to $99,999 | 0 (0.0%) | 0 (0.0%) |
| $100,000+ | 23 (24.2%) | 0 (0.0%) |
| Total | 95 (100.0%) | 9 (100.0%) |
Earnings by Sex by Educational Attainment in Lauderdale
| Educational Attainment | Male Income | Female Income |
| Less than High School | - | - |
| High School Diploma | - | - |
| College or Associate's Degree | - | - |
| Bachelor's Degree | - | - |
| Graduate Degree | - | - |
| Total | - | - |
Family Income in Lauderdale
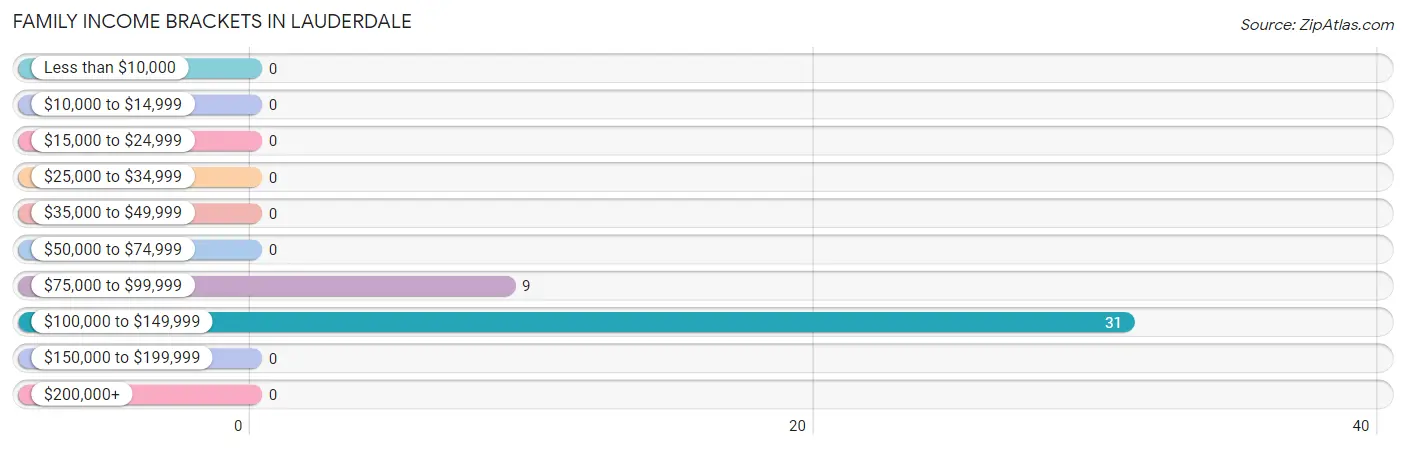
Family Income Brackets in Lauderdale
According to the Lauderdale family income data, there are 31 families falling into the $100,000 to $149,999 income range, which is the most common income bracket and makes up 77.5% of all families.
| Income Bracket | # Families | % Families |
| Less than $10,000 | 0 | 0.0% |
| $10,000 to $14,999 | 0 | 0.0% |
| $15,000 to $24,999 | 0 | 0.0% |
| $25,000 to $34,999 | 0 | 0.0% |
| $35,000 to $49,999 | 0 | 0.0% |
| $50,000 to $74,999 | 0 | 0.0% |
| $75,000 to $99,999 | 9 | 22.5% |
| $100,000 to $149,999 | 31 | 77.5% |
| $150,000 to $199,999 | 0 | 0.0% |
| $200,000+ | 0 | 0.0% |
Family Income by Famaliy Size in Lauderdale
| Income Bracket | # Families | Median Income |
| 2-Person Families | 17 (42.5%) | $0 |
| 3-Person Families | 0 (0.0%) | $0 |
| 4-Person Families | 23 (57.5%) | $0 |
| 5-Person Families | 0 (0.0%) | $0 |
| 6-Person Families | 0 (0.0%) | $0 |
| 7+ Person Families | 0 (0.0%) | $0 |
| Total | 40 (100.0%) | $115,887 |
Family Income by Number of Earners in Lauderdale
| Number of Earners | # Families | Median Income |
| No Earners | 0 (0.0%) | $0 |
| 1 Earner | 9 (22.5%) | $0 |
| 2 Earners | 31 (77.5%) | $0 |
| 3+ Earners | 0 (0.0%) | $0 |
| Total | 40 (100.0%) | $115,887 |
Household Income in Lauderdale
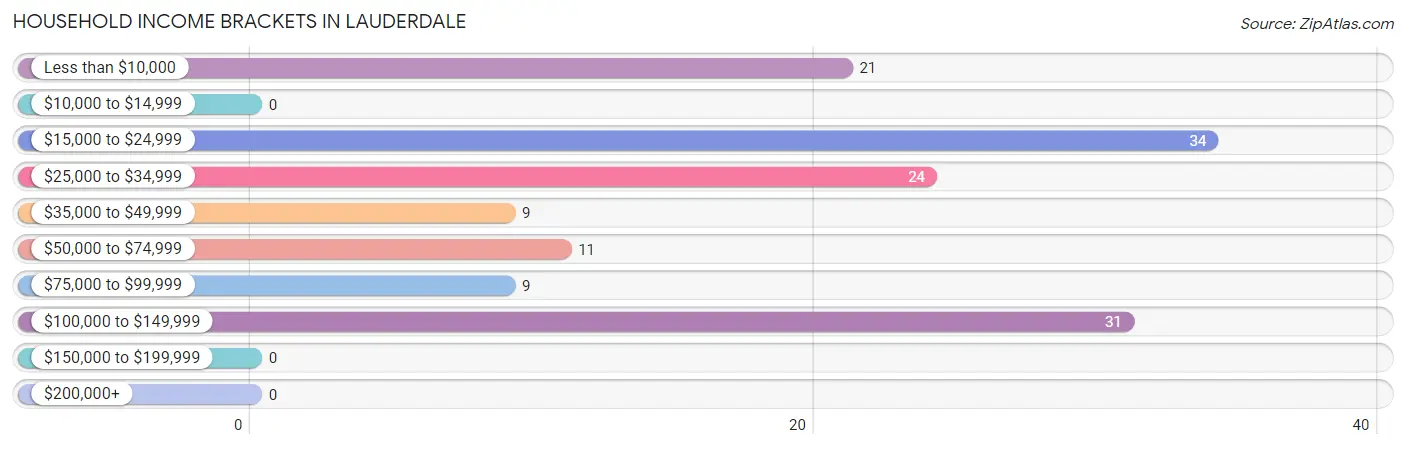
Household Income Brackets in Lauderdale
With 34 households falling in the category, the $15,000 to $24,999 income range is the most frequent in Lauderdale, accounting for 24.5% of all households.
| Income Bracket | # Households | % Households |
| Less than $10,000 | 21 | 15.1% |
| $10,000 to $14,999 | 0 | 0.0% |
| $15,000 to $24,999 | 34 | 24.5% |
| $25,000 to $34,999 | 24 | 17.3% |
| $35,000 to $49,999 | 9 | 6.5% |
| $50,000 to $74,999 | 11 | 7.9% |
| $75,000 to $99,999 | 9 | 6.5% |
| $100,000 to $149,999 | 31 | 22.3% |
| $150,000 to $199,999 | 0 | 0.0% |
| $200,000+ | 0 | 0.0% |
Household Income by Householder Age in Lauderdale
The median household income in Lauderdale is $0, with the highest median household income of $2,499 found in the 45 to 64 years age bracket for the primary householder. A total of 38 households (27.3%) fall into this category.
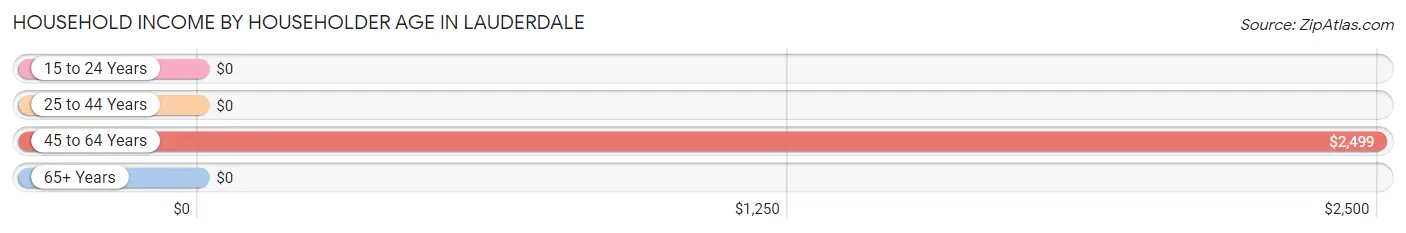
| Income Bracket | # Households | Median Income |
| 15 to 24 Years | 0 (0.0%) | $0 |
| 25 to 44 Years | 57 (41.0%) | $0 |
| 45 to 64 Years | 38 (27.3%) | $2,499 |
| 65+ Years | 44 (31.7%) | $0 |
| Total | 139 (100.0%) | $0 |
Poverty in Lauderdale
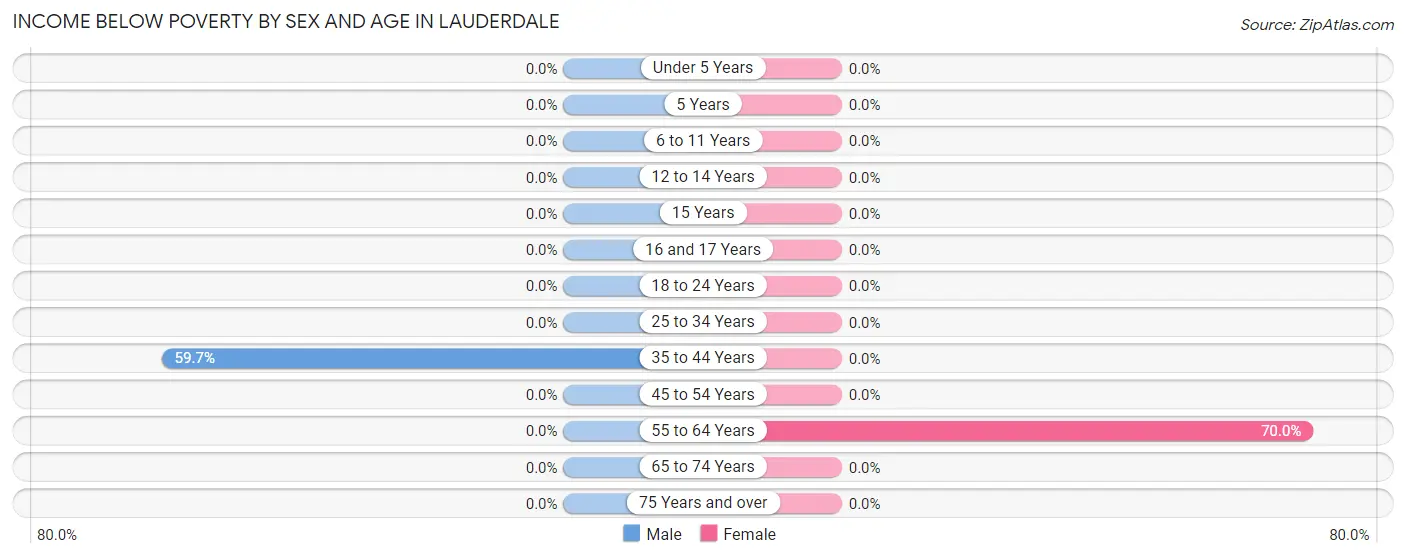
Income Below Poverty by Sex and Age in Lauderdale
With 22.7% poverty level for males and 32.8% for females among the residents of Lauderdale, 35 to 44 year old males and 55 to 64 year old females are the most vulnerable to poverty, with 34 males (59.7%) and 21 females (70.0%) in their respective age groups living below the poverty level.
| Age Bracket | Male | Female |
| Under 5 Years | 0 (0.0%) | 0 (0.0%) |
| 5 Years | 0 (0.0%) | 0 (0.0%) |
| 6 to 11 Years | 0 (0.0%) | 0 (0.0%) |
| 12 to 14 Years | 0 (0.0%) | 0 (0.0%) |
| 15 Years | 0 (0.0%) | 0 (0.0%) |
| 16 and 17 Years | 0 (0.0%) | 0 (0.0%) |
| 18 to 24 Years | 0 (0.0%) | 0 (0.0%) |
| 25 to 34 Years | 0 (0.0%) | 0 (0.0%) |
| 35 to 44 Years | 34 (59.7%) | 0 (0.0%) |
| 45 to 54 Years | 0 (0.0%) | 0 (0.0%) |
| 55 to 64 Years | 0 (0.0%) | 21 (70.0%) |
| 65 to 74 Years | 0 (0.0%) | 0 (0.0%) |
| 75 Years and over | 0 (0.0%) | 0 (0.0%) |
| Total | 34 (22.7%) | 21 (32.8%) |
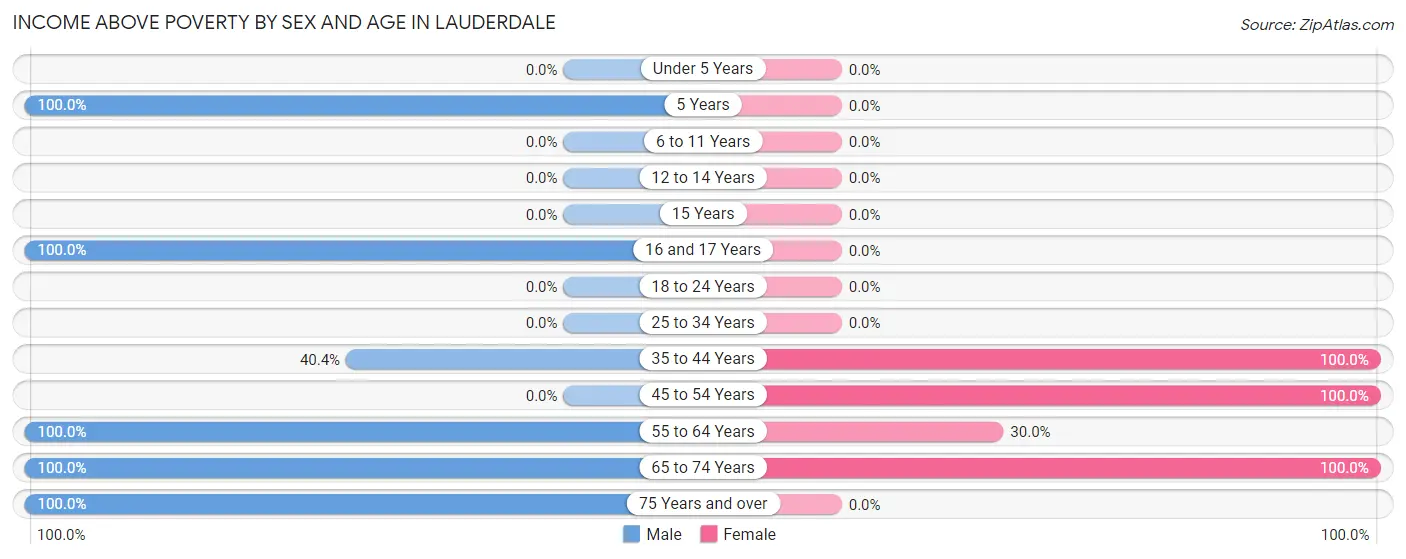
Income Above Poverty by Sex and Age in Lauderdale
According to the poverty statistics in Lauderdale, males aged 5 years and females aged 35 to 44 years are the age groups that are most secure financially, with 100.0% of males and 100.0% of females in these age groups living above the poverty line.
| Age Bracket | Male | Female |
| Under 5 Years | 0 (0.0%) | 0 (0.0%) |
| 5 Years | 20 (100.0%) | 0 (0.0%) |
| 6 to 11 Years | 0 (0.0%) | 0 (0.0%) |
| 12 to 14 Years | 0 (0.0%) | 0 (0.0%) |
| 15 Years | 0 (0.0%) | 0 (0.0%) |
| 16 and 17 Years | 21 (100.0%) | 0 (0.0%) |
| 18 to 24 Years | 0 (0.0%) | 0 (0.0%) |
| 25 to 34 Years | 0 (0.0%) | 0 (0.0%) |
| 35 to 44 Years | 23 (40.4%) | 16 (100.0%) |
| 45 to 54 Years | 0 (0.0%) | 9 (100.0%) |
| 55 to 64 Years | 17 (100.0%) | 9 (30.0%) |
| 65 to 74 Years | 11 (100.0%) | 9 (100.0%) |
| 75 Years and over | 24 (100.0%) | 0 (0.0%) |
| Total | 116 (77.3%) | 43 (67.2%) |
Income Below Poverty Among Married-Couple Families in Lauderdale
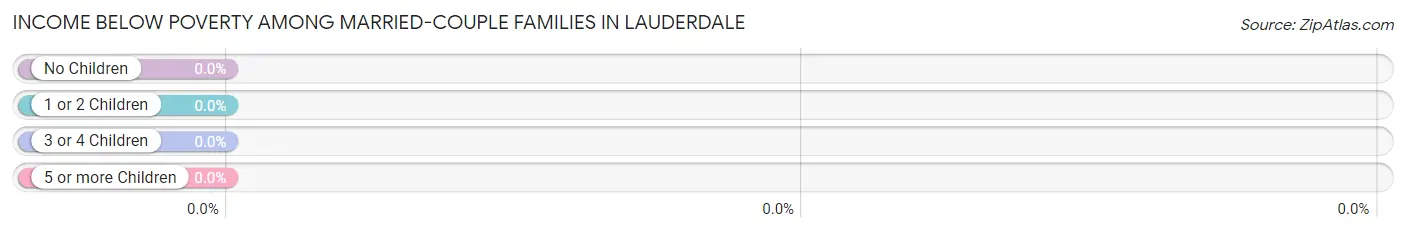
| Children | Above Poverty | Below Poverty |
| No Children | 17 (100.0%) | 0 (0.0%) |
| 1 or 2 Children | 23 (100.0%) | 0 (0.0%) |
| 3 or 4 Children | 0 (0.0%) | 0 (0.0%) |
| 5 or more Children | 0 (0.0%) | 0 (0.0%) |
| Total | 40 (100.0%) | 0 (0.0%) |
Income Below Poverty Among Single-Parent Households in Lauderdale
| Children | Single Father | Single Mother |
| No Children | 0 (0.0%) | 0 (0.0%) |
| 1 or 2 Children | 0 (0.0%) | 0 (0.0%) |
| 3 or 4 Children | 0 (0.0%) | 0 (0.0%) |
| 5 or more Children | 0 (0.0%) | 0 (0.0%) |
| Total | 0 (0.0%) | 0 (0.0%) |
Income Below Poverty Among Married-Couple vs Single-Parent Households in Lauderdale
| Children | Married-Couple Families | Single-Parent Households |
| No Children | 0 (0.0%) | 0 (0.0%) |
| 1 or 2 Children | 0 (0.0%) | 0 (0.0%) |
| 3 or 4 Children | 0 (0.0%) | 0 (0.0%) |
| 5 or more Children | 0 (0.0%) | 0 (0.0%) |
| Total | 0 (0.0%) | 0 (0.0%) |
Race in Lauderdale
The most populous races in Lauderdale are White / Caucasian (148 | 69.2%), and Black / African American (66 | 30.8%).
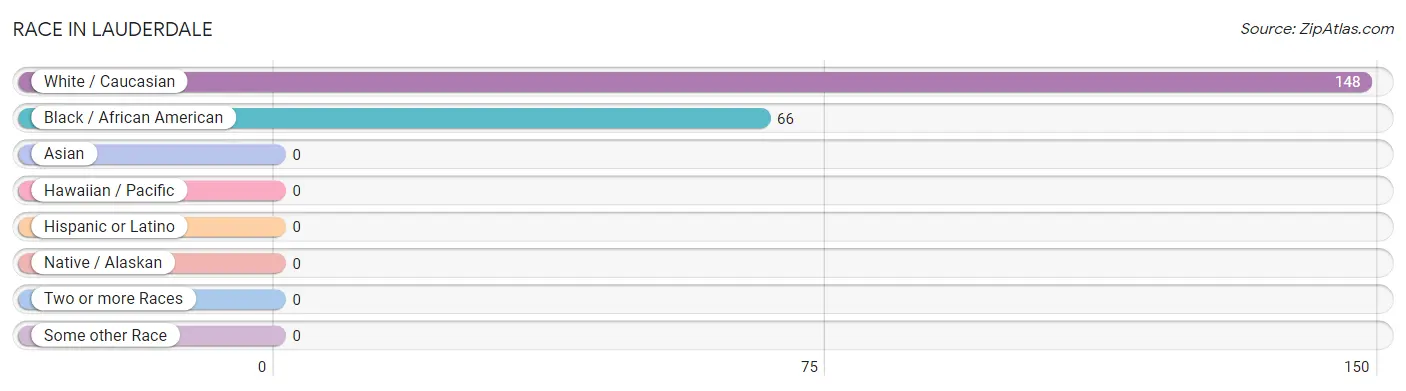
| Race | # Population | % Population |
| Asian | 0 | 0.0% |
| Black / African American | 66 | 30.8% |
| Hawaiian / Pacific | 0 | 0.0% |
| Hispanic or Latino | 0 | 0.0% |
| Native / Alaskan | 0 | 0.0% |
| White / Caucasian | 148 | 69.2% |
| Two or more Races | 0 | 0.0% |
| Some other Race | 0 | 0.0% |
| Total | 214 | 100.0% |
Ancestry in Lauderdale
The most populous ancestries reported in Lauderdale are English (42 | 19.6%), Scotch-Irish (24 | 11.2%), and German (9 | 4.2%), together accounting for 35.1% of all Lauderdale residents.
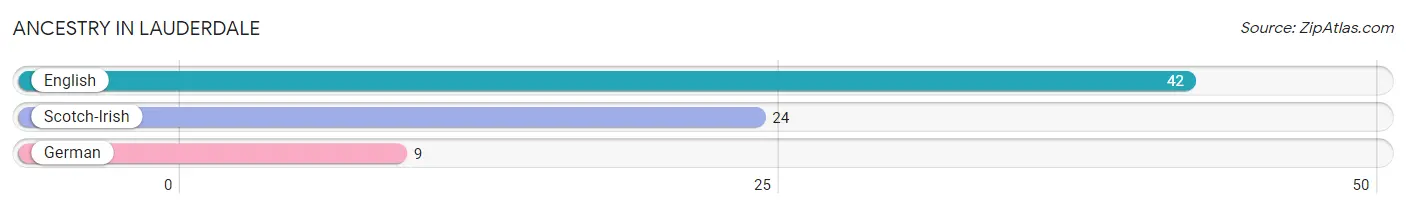
| Ancestry | # Population | % Population |
| English | 42 | 19.6% |
| German | 9 | 4.2% |
| Scotch-Irish | 24 | 11.2% | View All 3 Rows |
Immigrants in Lauderdale

| Immigration Origin | # Population | % Population | View All 0 Rows |
Sex and Age in Lauderdale
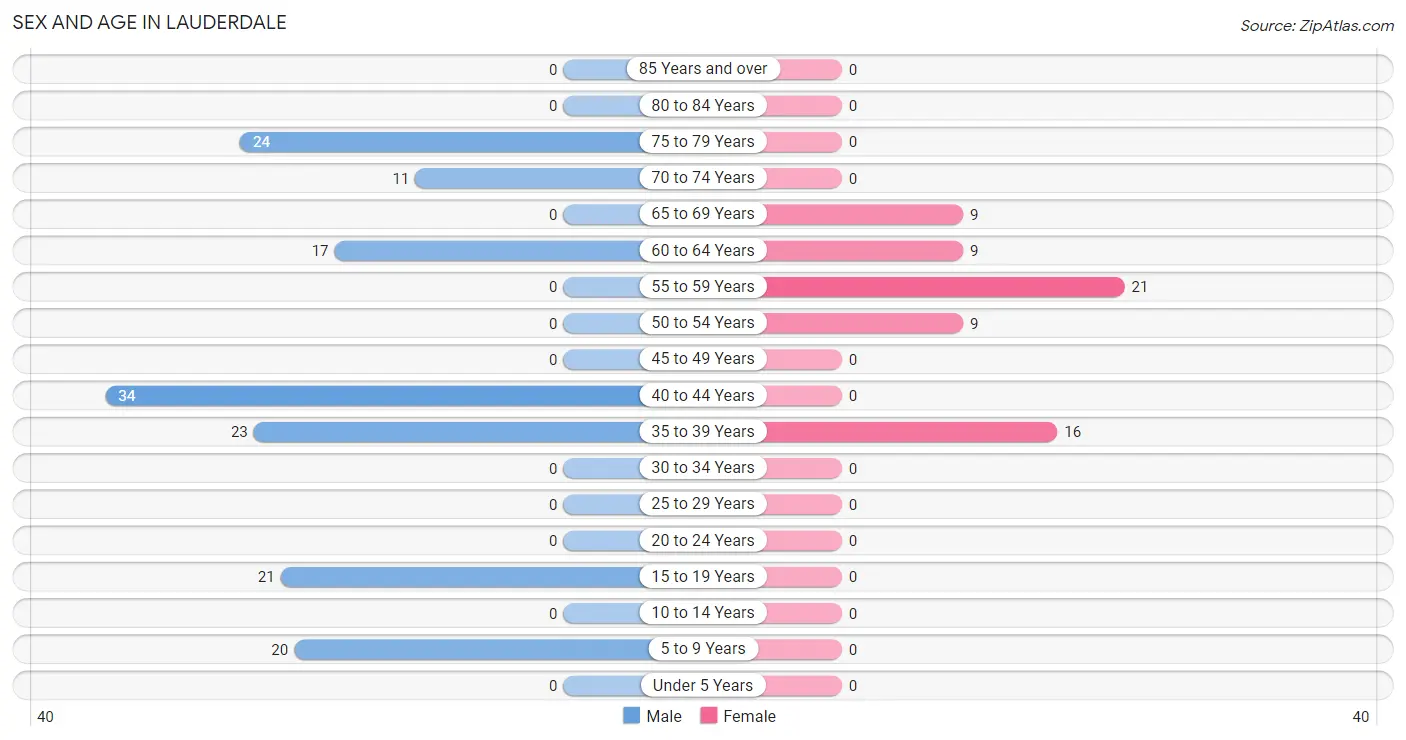
Sex and Age in Lauderdale
The most populous age groups in Lauderdale are 40 to 44 Years (34 | 22.7%) for men and 55 to 59 Years (21 | 32.8%) for women.
| Age Bracket | Male | Female |
| Under 5 Years | 0 (0.0%) | 0 (0.0%) |
| 5 to 9 Years | 20 (13.3%) | 0 (0.0%) |
| 10 to 14 Years | 0 (0.0%) | 0 (0.0%) |
| 15 to 19 Years | 21 (14.0%) | 0 (0.0%) |
| 20 to 24 Years | 0 (0.0%) | 0 (0.0%) |
| 25 to 29 Years | 0 (0.0%) | 0 (0.0%) |
| 30 to 34 Years | 0 (0.0%) | 0 (0.0%) |
| 35 to 39 Years | 23 (15.3%) | 16 (25.0%) |
| 40 to 44 Years | 34 (22.7%) | 0 (0.0%) |
| 45 to 49 Years | 0 (0.0%) | 0 (0.0%) |
| 50 to 54 Years | 0 (0.0%) | 9 (14.1%) |
| 55 to 59 Years | 0 (0.0%) | 21 (32.8%) |
| 60 to 64 Years | 17 (11.3%) | 9 (14.1%) |
| 65 to 69 Years | 0 (0.0%) | 9 (14.1%) |
| 70 to 74 Years | 11 (7.3%) | 0 (0.0%) |
| 75 to 79 Years | 24 (16.0%) | 0 (0.0%) |
| 80 to 84 Years | 0 (0.0%) | 0 (0.0%) |
| 85 Years and over | 0 (0.0%) | 0 (0.0%) |
| Total | 150 (100.0%) | 64 (100.0%) |
Families and Households in Lauderdale
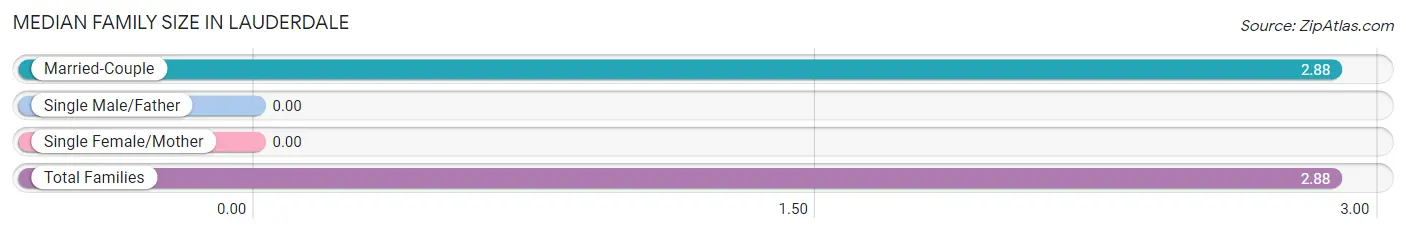
Median Family Size in Lauderdale
| Family Type | # Families | Family Size |
| Married-Couple | 40 (100.0%) | 2.88 |
| Single Male/Father | 0 (0.0%) | - |
| Single Female/Mother | 0 (0.0%) | - |
| Total Families | 40 (100.0%) | 2.88 |
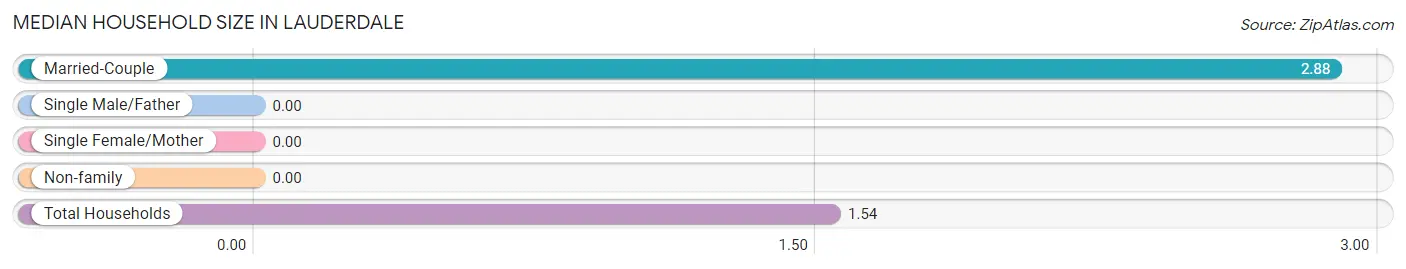
Median Household Size in Lauderdale
| Household Type | # Households | Household Size |
| Married-Couple | 40 (28.8%) | 2.88 |
| Single Male/Father | 0 (0.0%) | - |
| Single Female/Mother | 0 (0.0%) | - |
| Non-family | 99 (71.2%) | - |
| Total Households | 139 (100.0%) | 1.54 |
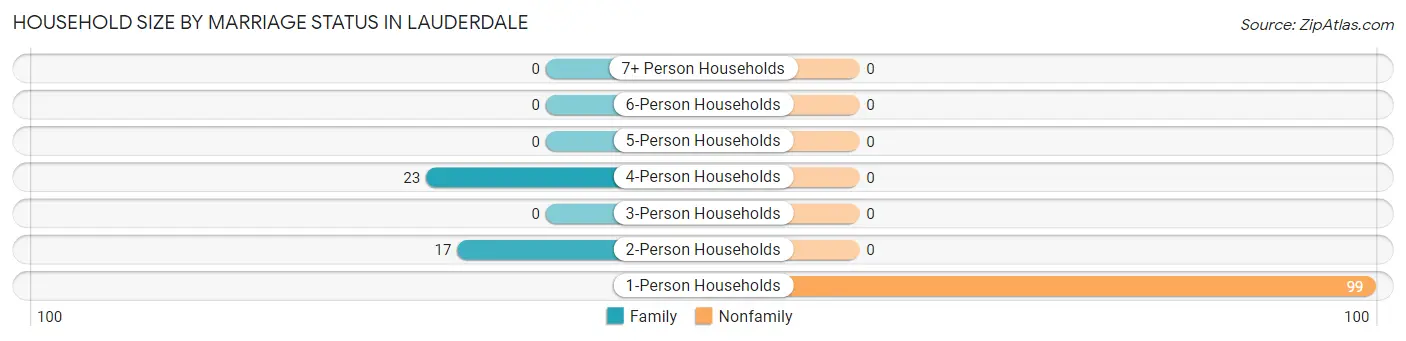
Household Size by Marriage Status in Lauderdale
Out of a total of 139 households in Lauderdale, 40 (28.8%) are family households, while 99 (71.2%) are nonfamily households. The most numerous type of family households are 4-person households, comprising 23, and the most common type of nonfamily households are 1-person households, comprising 99.
| Household Size | Family Households | Nonfamily Households |
| 1-Person Households | - | 99 (71.2%) |
| 2-Person Households | 17 (12.2%) | 0 (0.0%) |
| 3-Person Households | 0 (0.0%) | 0 (0.0%) |
| 4-Person Households | 23 (16.6%) | 0 (0.0%) |
| 5-Person Households | 0 (0.0%) | 0 (0.0%) |
| 6-Person Households | 0 (0.0%) | 0 (0.0%) |
| 7+ Person Households | 0 (0.0%) | 0 (0.0%) |
| Total | 40 (28.8%) | 99 (71.2%) |
Female Fertility in Lauderdale
Fertility by Age in Lauderdale
| Age Bracket | Women with Births | Births / 1,000 Women |
| 15 to 19 years | 0 (0.0%) | 0.0 |
| 20 to 34 years | 0 (0.0%) | 0.0 |
| 35 to 50 years | 0 (0.0%) | 0.0 |
| Total | 0 (0.0%) | 0.0 |
Fertility by Age by Marriage Status in Lauderdale
| Age Bracket | Married | Unmarried |
| 15 to 19 years | 0 (0.0%) | 0 (0.0%) |
| 20 to 34 years | 0 (0.0%) | 0 (0.0%) |
| 35 to 50 years | 0 (0.0%) | 0 (0.0%) |
| Total | 0 (0.0%) | 0 (0.0%) |
Fertility by Education in Lauderdale
| Educational Attainment | Women with Births | Births / 1,000 Women |
| Less than High School | 0 (0.0%) | 0.0 |
| High School Diploma | 0 (0.0%) | 0.0 |
| College or Associate's Degree | 0 (0.0%) | 0.0 |
| Bachelor's Degree | 0 (0.0%) | 0.0 |
| Graduate Degree | 0 (0.0%) | 0.0 |
| Total | 0 (0.0%) | 0.0 |
Fertility by Education by Marriage Status in Lauderdale
| Educational Attainment | Married | Unmarried |
| Less than High School | 0 (0.0%) | 0 (0.0%) |
| High School Diploma | 0 (0.0%) | 0 (0.0%) |
| College or Associate's Degree | 0 (0.0%) | 0 (0.0%) |
| Bachelor's Degree | 0 (0.0%) | 0 (0.0%) |
| Graduate Degree | 0 (0.0%) | 0 (0.0%) |
| Total | 0 (0.0%) | 0 (0.0%) |
Employment Characteristics in Lauderdale
Employment by Class of Employer in Lauderdale
Among the 95 employed individuals in Lauderdale, local government employees (34 | 35.8%), private company employees (31 | 32.6%), and unpaid family workers (21 | 22.1%) make up the most common classes of employment.
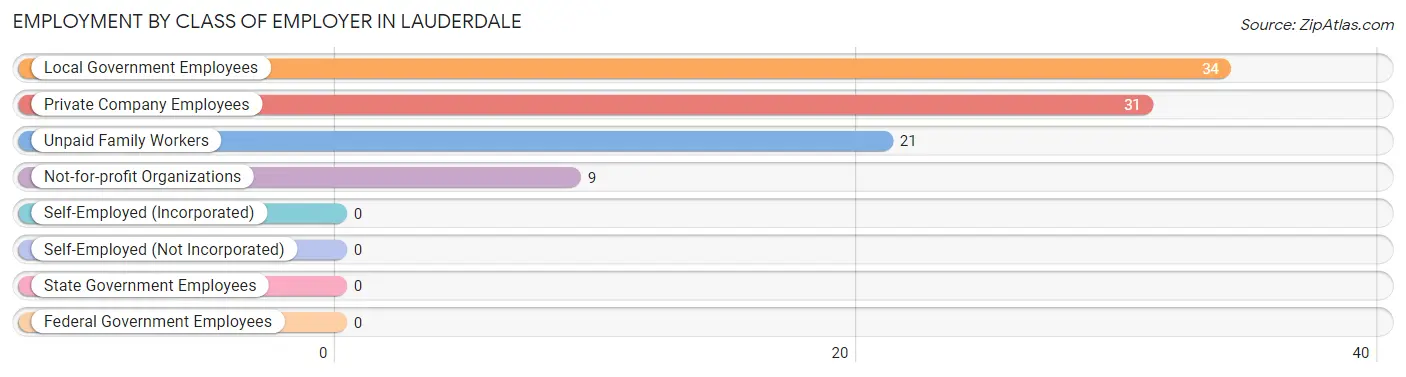
| Employer Class | # Employees | % Employees |
| Private Company Employees | 31 | 32.6% |
| Self-Employed (Incorporated) | 0 | 0.0% |
| Self-Employed (Not Incorporated) | 0 | 0.0% |
| Not-for-profit Organizations | 9 | 9.5% |
| Local Government Employees | 34 | 35.8% |
| State Government Employees | 0 | 0.0% |
| Federal Government Employees | 0 | 0.0% |
| Unpaid Family Workers | 21 | 22.1% |
| Total | 95 | 100.0% |
Employment Status by Age in Lauderdale
According to the labor force statistics for Lauderdale, out of the total population over 16 years of age (194), 53.6% or 104 individuals are in the labor force, with 8.7% or 9 of them unemployed. The age group with the highest labor force participation rate is 16 to 19 years, with 100.0% or 21 individuals in the labor force. Within the labor force, the 60 to 64 years age range has the highest percentage of unemployed individuals, with 52.9% or 9 of them being unemployed.
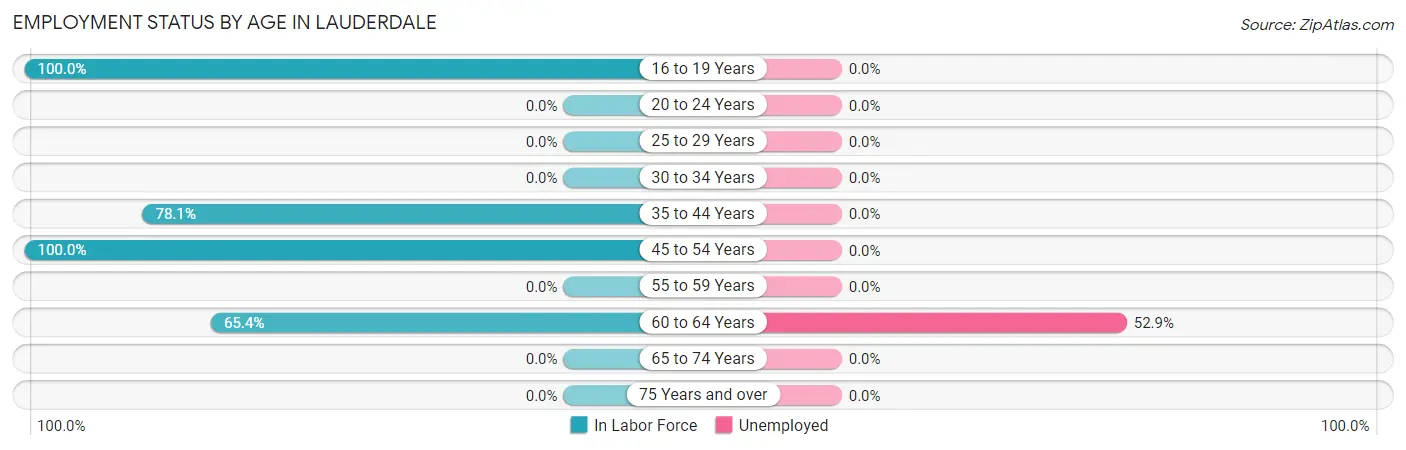
| Age Bracket | In Labor Force | Unemployed |
| 16 to 19 Years | 21 (100.0%) | 0 (0.0%) |
| 20 to 24 Years | 0 (0.0%) | 0 (0.0%) |
| 25 to 29 Years | 0 (0.0%) | 0 (0.0%) |
| 30 to 34 Years | 0 (0.0%) | 0 (0.0%) |
| 35 to 44 Years | 57 (78.1%) | 0 (0.0%) |
| 45 to 54 Years | 9 (100.0%) | 0 (0.0%) |
| 55 to 59 Years | 0 (0.0%) | 0 (0.0%) |
| 60 to 64 Years | 17 (65.4%) | 9 (52.9%) |
| 65 to 74 Years | 0 (0.0%) | 0 (0.0%) |
| 75 Years and over | 0 (0.0%) | 0 (0.0%) |
| Total | 104 (53.6%) | 9 (8.7%) |
Employment Status by Educational Attainment in Lauderdale
According to labor force statistics for Lauderdale, 64.3% of individuals (83) out of the total population between 25 and 64 years of age (129) are in the labor force, with 10.8% or 9 of them being unemployed. The group with the highest labor force participation rate are those with the educational attainment of high school diploma, with 70.8% or 51 individuals in the labor force. Within the labor force, individuals with college / associate degree education have the highest percentage of unemployment, with 28.1% or 9 of them being unemployed.
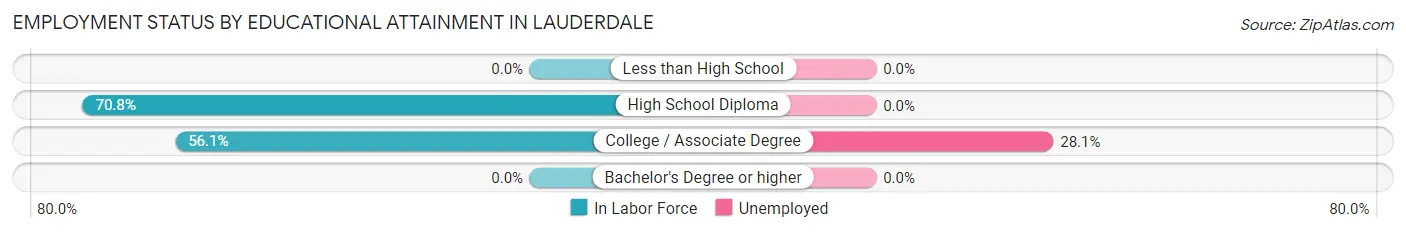
| Educational Attainment | In Labor Force | Unemployed |
| Less than High School | 0 (0.0%) | 0 (0.0%) |
| High School Diploma | 51 (70.8%) | 0 (0.0%) |
| College / Associate Degree | 32 (56.1%) | 16 (28.1%) |
| Bachelor's Degree or higher | 0 (0.0%) | 0 (0.0%) |
| Total | 83 (64.3%) | 14 (10.8%) |
Employment Occupations by Sex in Lauderdale
Management, Business, Science and Arts Occupations
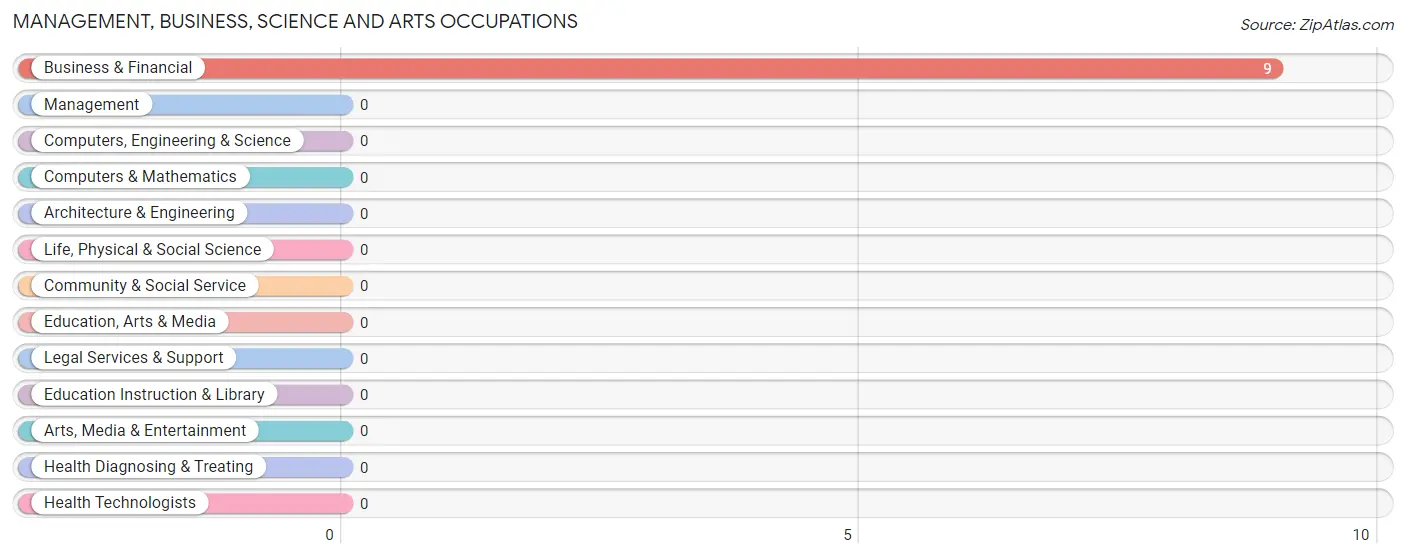
The most common Management, Business, Science and Arts occupations in Lauderdale are , and Business & Financial (9 | 9.5%).
Management, Business, Science and Arts Occupations by Sex
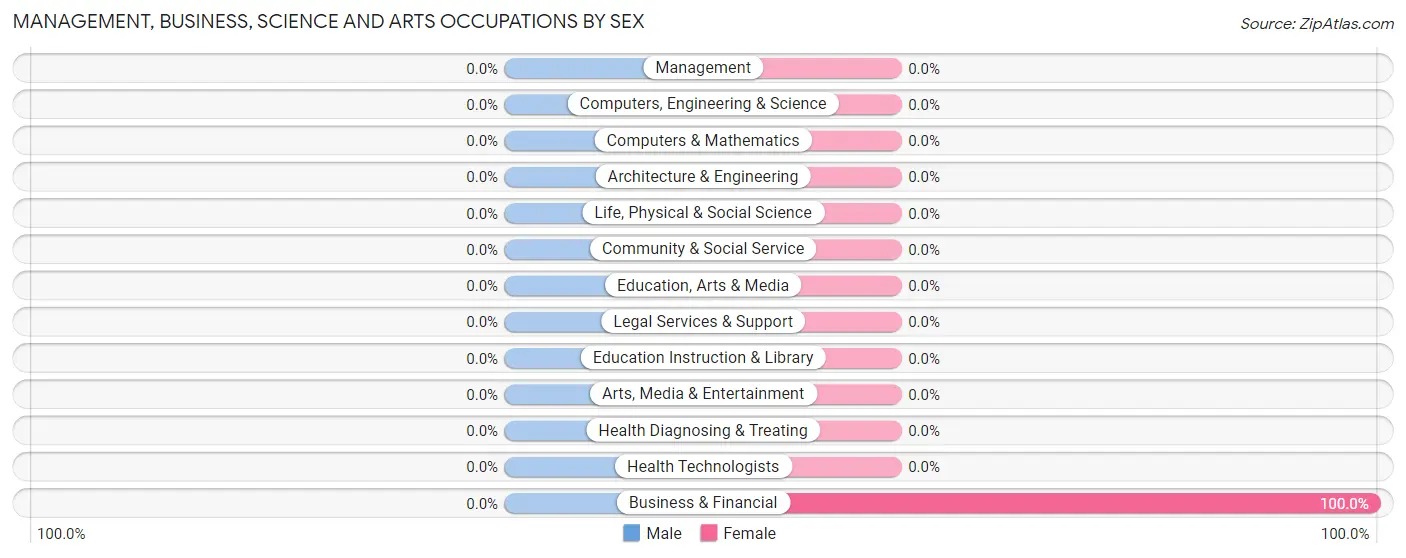
| Occupation | Male | Female |
| Management | 0 (0.0%) | 0 (0.0%) |
| Business & Financial | 0 (0.0%) | 9 (100.0%) |
| Computers, Engineering & Science | 0 (0.0%) | 0 (0.0%) |
| Computers & Mathematics | 0 (0.0%) | 0 (0.0%) |
| Architecture & Engineering | 0 (0.0%) | 0 (0.0%) |
| Life, Physical & Social Science | 0 (0.0%) | 0 (0.0%) |
| Community & Social Service | 0 (0.0%) | 0 (0.0%) |
| Education, Arts & Media | 0 (0.0%) | 0 (0.0%) |
| Legal Services & Support | 0 (0.0%) | 0 (0.0%) |
| Education Instruction & Library | 0 (0.0%) | 0 (0.0%) |
| Arts, Media & Entertainment | 0 (0.0%) | 0 (0.0%) |
| Health Diagnosing & Treating | 0 (0.0%) | 0 (0.0%) |
| Health Technologists | 0 (0.0%) | 0 (0.0%) |
| Total (Category) | 0 (0.0%) | 9 (100.0%) |
| Total (Overall) | 86 (90.5%) | 9 (9.5%) |
Services Occupations
Services Occupations by Sex
| Occupation | Male | Female |
| Healthcare Support | 0 (0.0%) | 0 (0.0%) |
| Security & Protection | 0 (0.0%) | 0 (0.0%) |
| Firefighting & Prevention | 0 (0.0%) | 0 (0.0%) |
| Law Enforcement | 0 (0.0%) | 0 (0.0%) |
| Food Preparation & Serving | 0 (0.0%) | 0 (0.0%) |
| Cleaning & Maintenance | 0 (0.0%) | 0 (0.0%) |
| Personal Care & Service | 0 (0.0%) | 0 (0.0%) |
| Total (Category) | 0 (0.0%) | 0 (0.0%) |
| Total (Overall) | 86 (90.5%) | 9 (9.5%) |
Sales and Office Occupations
The most common Sales and Office occupations in Lauderdale are , and Sales & Related (8 | 8.4%).
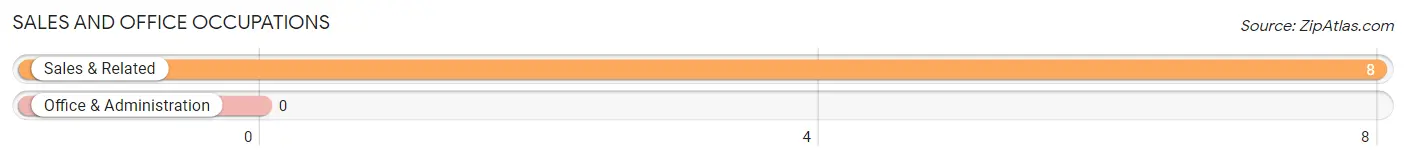
Sales and Office Occupations by Sex

| Occupation | Male | Female |
| Sales & Related | 8 (100.0%) | 0 (0.0%) |
| Office & Administration | 0 (0.0%) | 0 (0.0%) |
| Total (Category) | 8 (100.0%) | 0 (0.0%) |
| Total (Overall) | 86 (90.5%) | 9 (9.5%) |
Natural Resources, Construction and Maintenance Occupations
The most common Natural Resources, Construction and Maintenance occupations in Lauderdale are , and Farming, Fishing & Forestry (21 | 22.1%).

Natural Resources, Construction and Maintenance Occupations by Sex

| Occupation | Male | Female |
| Farming, Fishing & Forestry | 21 (100.0%) | 0 (0.0%) |
| Construction & Extraction | 0 (0.0%) | 0 (0.0%) |
| Installation, Maintenance & Repair | 0 (0.0%) | 0 (0.0%) |
| Total (Category) | 21 (100.0%) | 0 (0.0%) |
| Total (Overall) | 86 (90.5%) | 9 (9.5%) |
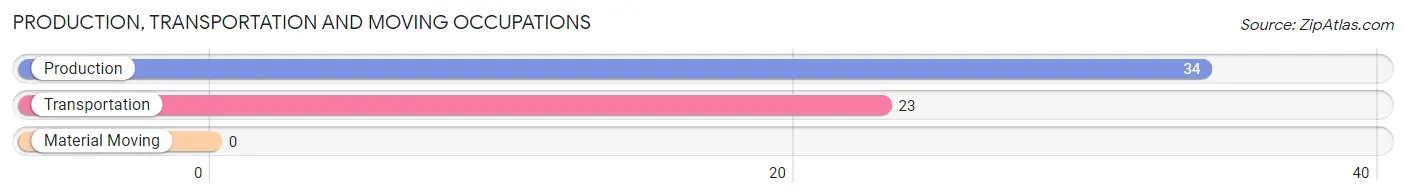
Production, Transportation and Moving Occupations
The most common Production, Transportation and Moving occupations in Lauderdale are Production (34 | 35.8%), and Transportation (23 | 24.2%).
Production, Transportation and Moving Occupations by Sex
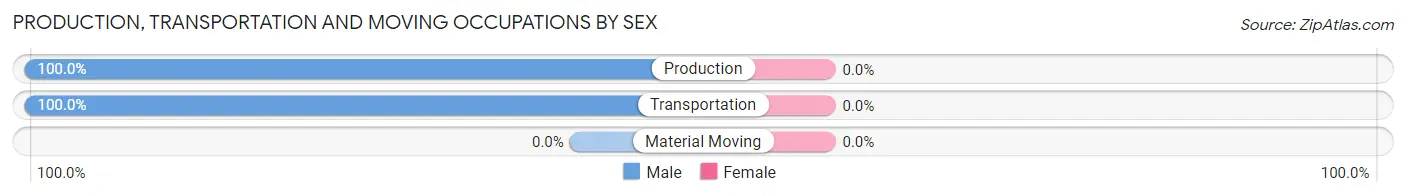
| Occupation | Male | Female |
| Production | 34 (100.0%) | 0 (0.0%) |
| Transportation | 23 (100.0%) | 0 (0.0%) |
| Material Moving | 0 (0.0%) | 0 (0.0%) |
| Total (Category) | 57 (100.0%) | 0 (0.0%) |
| Total (Overall) | 86 (90.5%) | 9 (9.5%) |
Employment Industries by Sex in Lauderdale
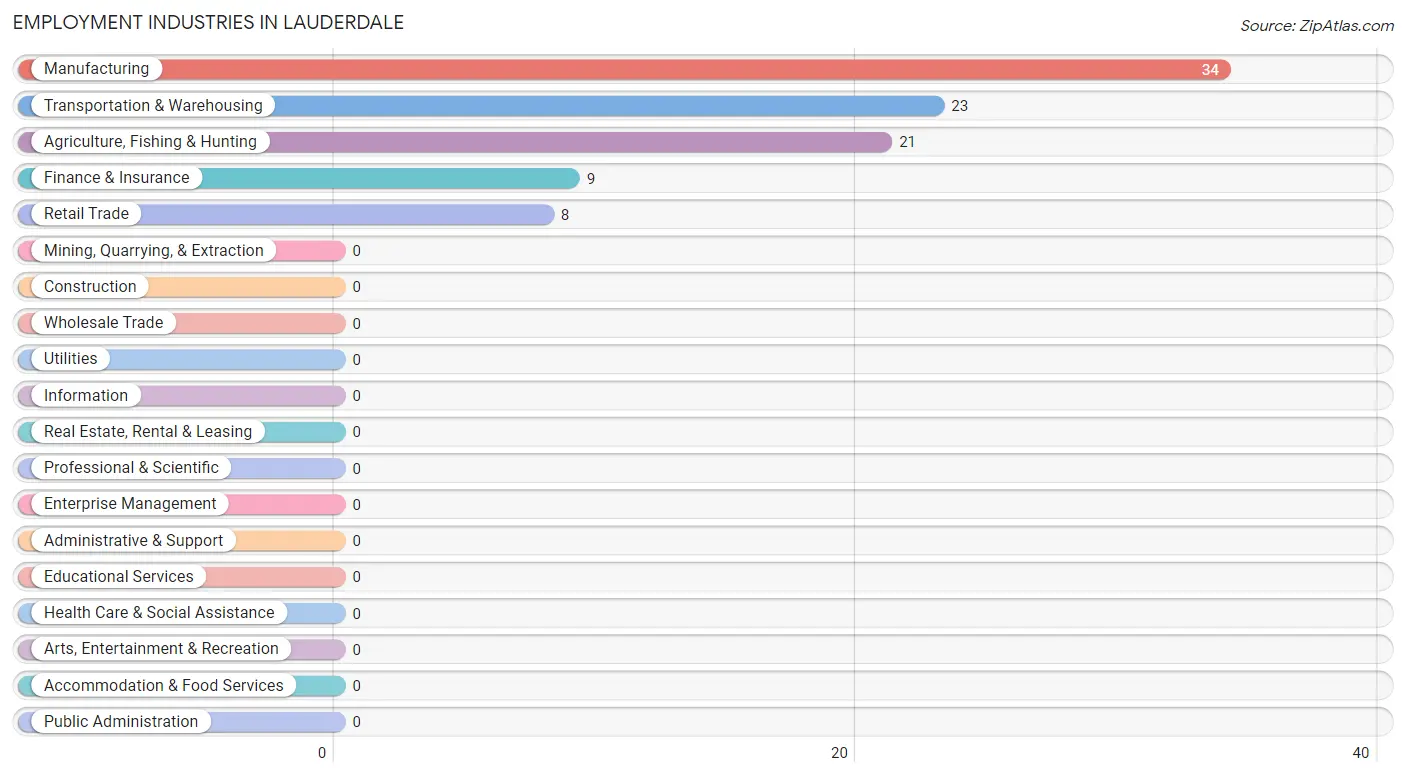
Employment Industries in Lauderdale
The major employment industries in Lauderdale include Manufacturing (34 | 35.8%), Transportation & Warehousing (23 | 24.2%), Agriculture, Fishing & Hunting (21 | 22.1%), Finance & Insurance (9 | 9.5%), and Retail Trade (8 | 8.4%).
Employment Industries by Sex in Lauderdale
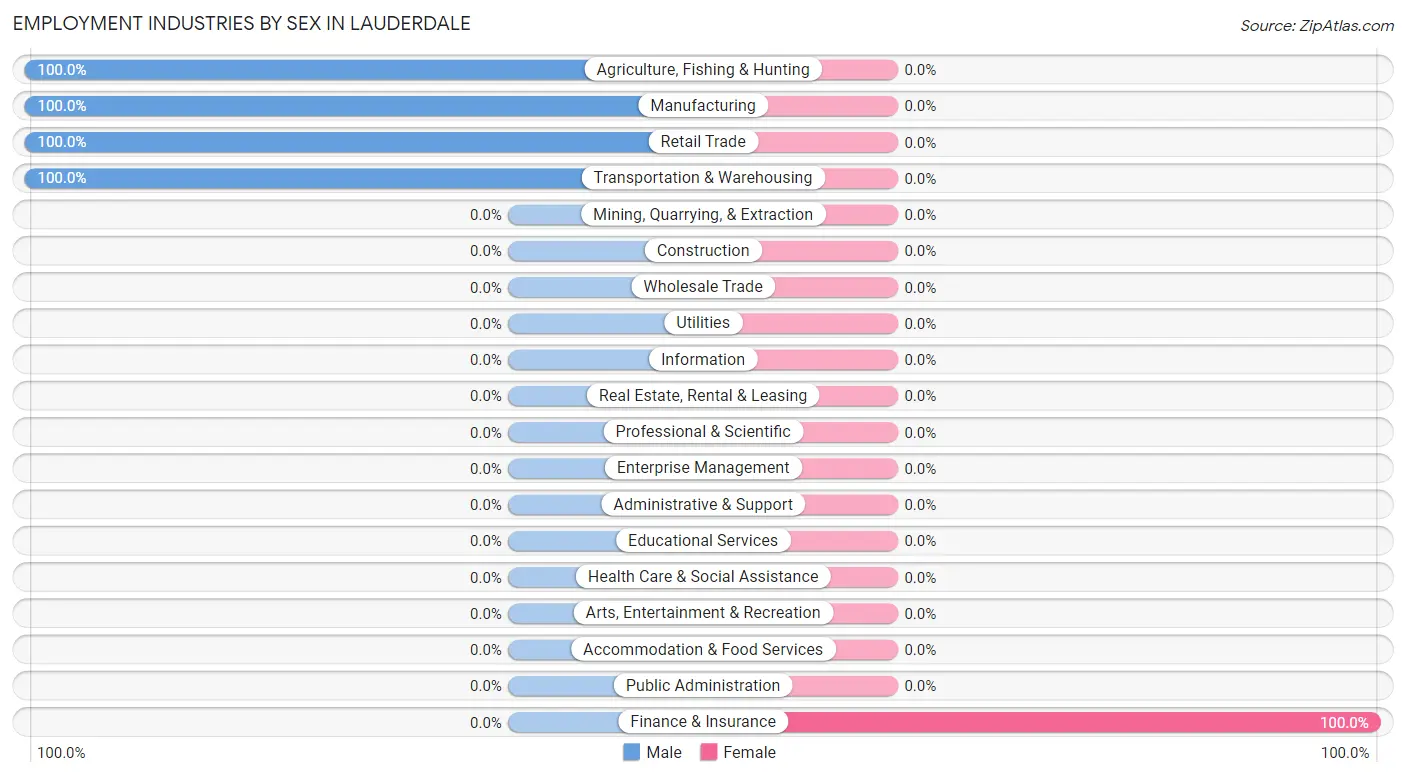
| Industry | Male | Female |
| Agriculture, Fishing & Hunting | 21 (100.0%) | 0 (0.0%) |
| Mining, Quarrying, & Extraction | 0 (0.0%) | 0 (0.0%) |
| Construction | 0 (0.0%) | 0 (0.0%) |
| Manufacturing | 34 (100.0%) | 0 (0.0%) |
| Wholesale Trade | 0 (0.0%) | 0 (0.0%) |
| Retail Trade | 8 (100.0%) | 0 (0.0%) |
| Transportation & Warehousing | 23 (100.0%) | 0 (0.0%) |
| Utilities | 0 (0.0%) | 0 (0.0%) |
| Information | 0 (0.0%) | 0 (0.0%) |
| Finance & Insurance | 0 (0.0%) | 9 (100.0%) |
| Real Estate, Rental & Leasing | 0 (0.0%) | 0 (0.0%) |
| Professional & Scientific | 0 (0.0%) | 0 (0.0%) |
| Enterprise Management | 0 (0.0%) | 0 (0.0%) |
| Administrative & Support | 0 (0.0%) | 0 (0.0%) |
| Educational Services | 0 (0.0%) | 0 (0.0%) |
| Health Care & Social Assistance | 0 (0.0%) | 0 (0.0%) |
| Arts, Entertainment & Recreation | 0 (0.0%) | 0 (0.0%) |
| Accommodation & Food Services | 0 (0.0%) | 0 (0.0%) |
| Public Administration | 0 (0.0%) | 0 (0.0%) |
| Total | 86 (90.5%) | 9 (9.5%) |
Education in Lauderdale
School Enrollment in Lauderdale
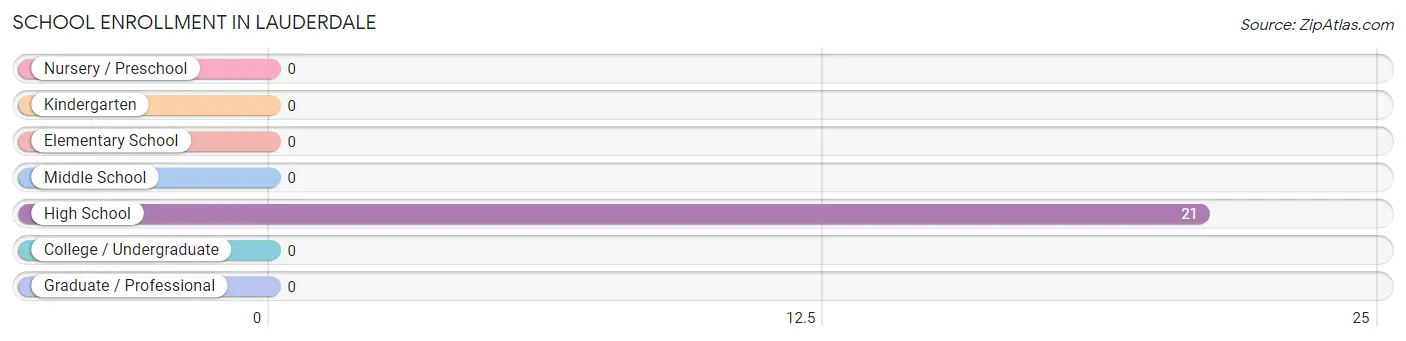
| School Level | # Students | % Students |
| Nursery / Preschool | 0 | 0.0% |
| Kindergarten | 0 | 0.0% |
| Elementary School | 0 | 0.0% |
| Middle School | 0 | 0.0% |
| High School | 21 | 100.0% |
| College / Undergraduate | 0 | 0.0% |
| Graduate / Professional | 0 | 0.0% |
| Total | 21 | 100.0% |
School Enrollment by Age by Funding Source in Lauderdale
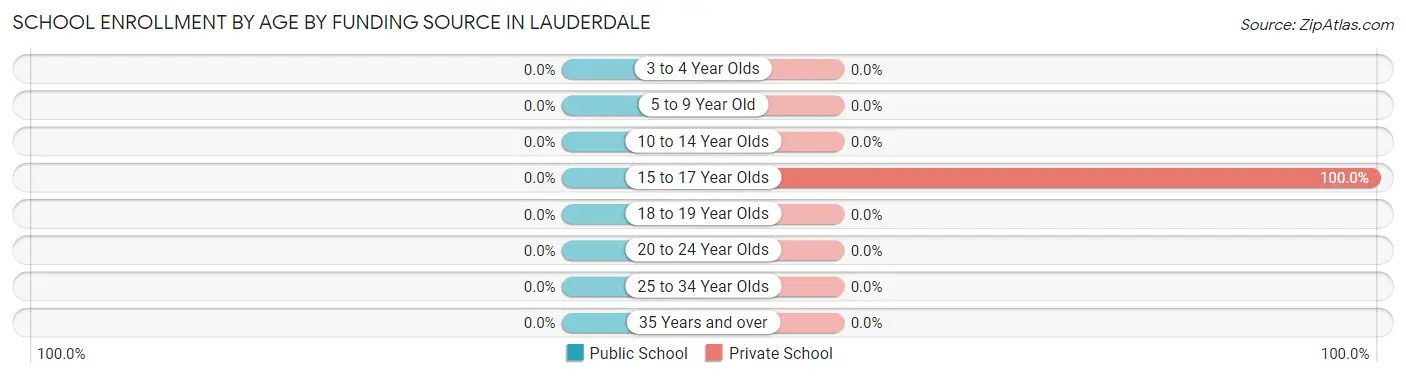
| Age Bracket | Public School | Private School |
| 3 to 4 Year Olds | 0 (0.0%) | 0 (0.0%) |
| 5 to 9 Year Old | 0 (0.0%) | 0 (0.0%) |
| 10 to 14 Year Olds | 0 (0.0%) | 0 (0.0%) |
| 15 to 17 Year Olds | 0 (0.0%) | 21 (100.0%) |
| 18 to 19 Year Olds | 0 (0.0%) | 0 (0.0%) |
| 20 to 24 Year Olds | 0 (0.0%) | 0 (0.0%) |
| 25 to 34 Year Olds | 0 (0.0%) | 0 (0.0%) |
| 35 Years and over | 0 (0.0%) | 0 (0.0%) |
| Total | 0 (0.0%) | 21 (100.0%) |
Educational Attainment by Field of Study in Lauderdale
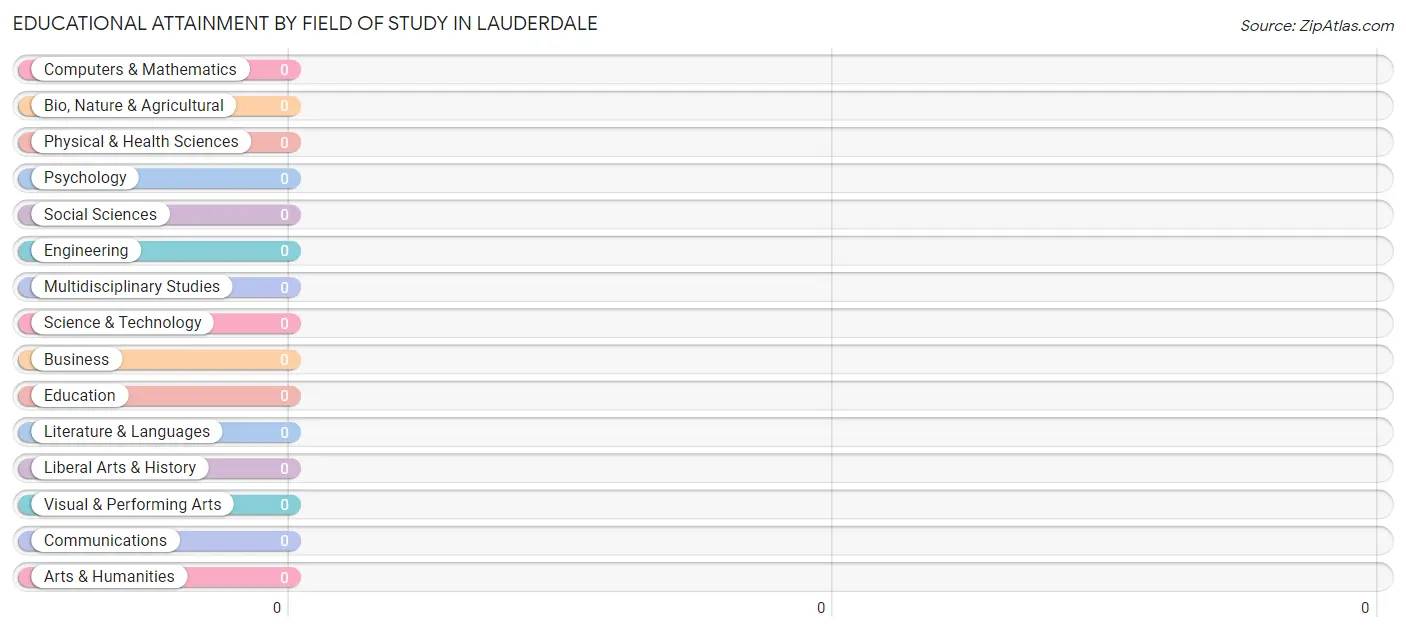
| Field of Study | # Graduates | % Graduates |
| Computers & Mathematics | 0 | 0.0% |
| Bio, Nature & Agricultural | 0 | 0.0% |
| Physical & Health Sciences | 0 | 0.0% |
| Psychology | 0 | 0.0% |
| Social Sciences | 0 | 0.0% |
| Engineering | 0 | 0.0% |
| Multidisciplinary Studies | 0 | 0.0% |
| Science & Technology | 0 | 0.0% |
| Business | 0 | 0.0% |
| Education | 0 | 0.0% |
| Literature & Languages | 0 | 0.0% |
| Liberal Arts & History | 0 | 0.0% |
| Visual & Performing Arts | 0 | 0.0% |
| Communications | 0 | 0.0% |
| Arts & Humanities | 0 | 0.0% |
| Total | 0 | 0.0% |
Transportation & Commute in Lauderdale
Vehicle Availability by Sex in Lauderdale
The most prevalent vehicle ownership categories in Lauderdale are males with 2 vehicles (44, accounting for 51.2%) and females with 2 vehicles (0, making up 488.9%).
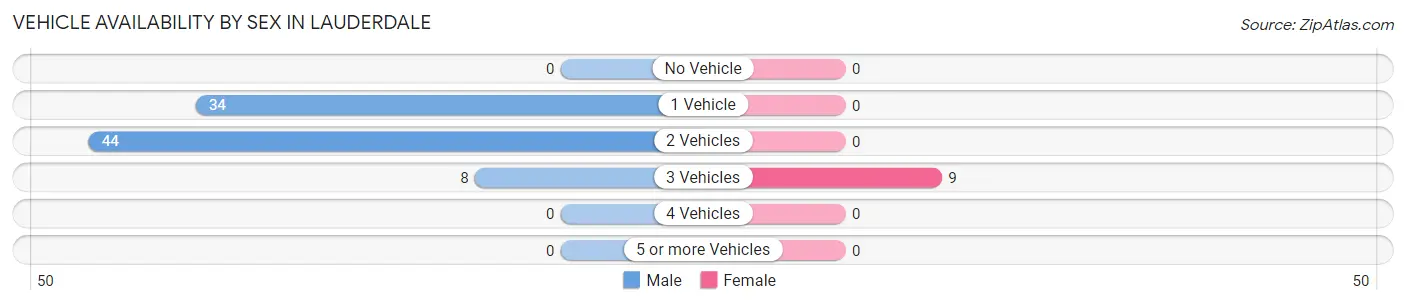
| Vehicles Available | Male | Female |
| No Vehicle | 0 (0.0%) | 0 (0.0%) |
| 1 Vehicle | 34 (39.5%) | 0 (0.0%) |
| 2 Vehicles | 44 (51.2%) | 0 (0.0%) |
| 3 Vehicles | 8 (9.3%) | 9 (100.0%) |
| 4 Vehicles | 0 (0.0%) | 0 (0.0%) |
| 5 or more Vehicles | 0 (0.0%) | 0 (0.0%) |
| Total | 86 (100.0%) | 9 (100.0%) |
Commute Time in Lauderdale
The most frequently occuring commute durations in Lauderdale are 20 to 24 minutes (51 commuters, 68.9%), 30 to 34 minutes (23 commuters, 31.1%), and less than 5 minutes (0 commuters, 0.0%).
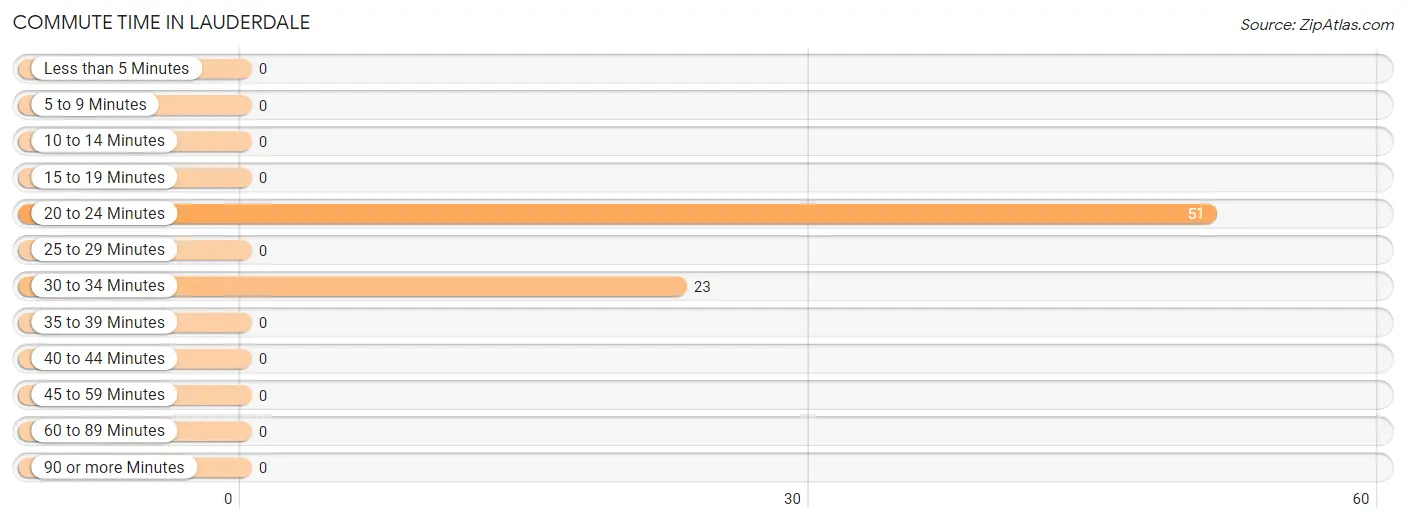
| Commute Time | # Commuters | % Commuters |
| Less than 5 Minutes | 0 | 0.0% |
| 5 to 9 Minutes | 0 | 0.0% |
| 10 to 14 Minutes | 0 | 0.0% |
| 15 to 19 Minutes | 0 | 0.0% |
| 20 to 24 Minutes | 51 | 68.9% |
| 25 to 29 Minutes | 0 | 0.0% |
| 30 to 34 Minutes | 23 | 31.1% |
| 35 to 39 Minutes | 0 | 0.0% |
| 40 to 44 Minutes | 0 | 0.0% |
| 45 to 59 Minutes | 0 | 0.0% |
| 60 to 89 Minutes | 0 | 0.0% |
| 90 or more Minutes | 0 | 0.0% |
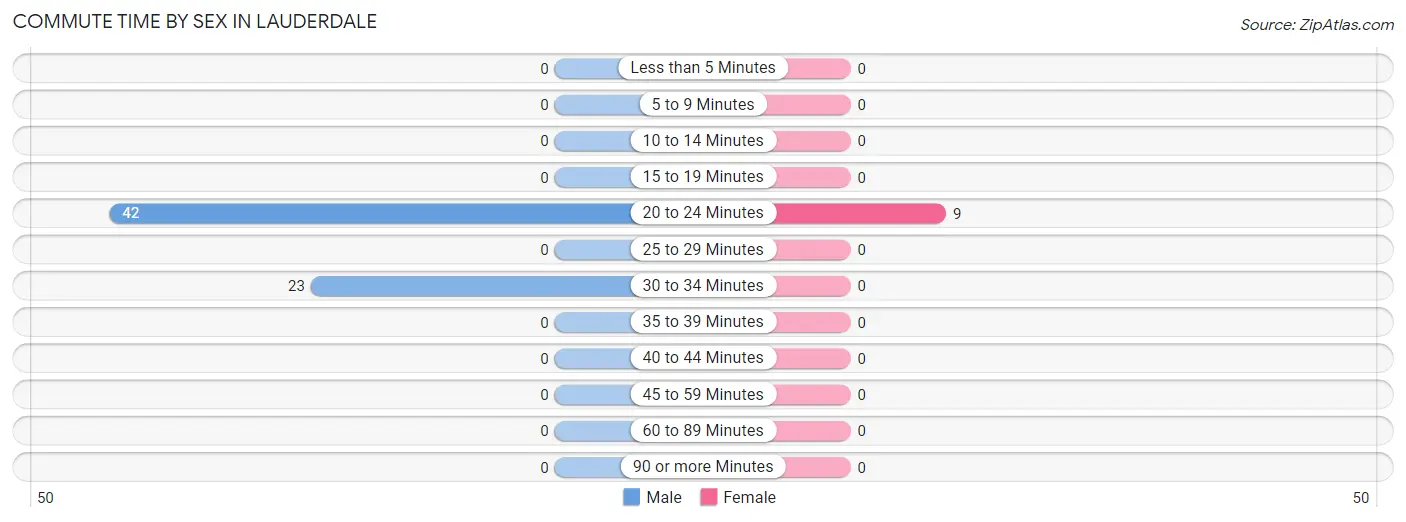
Commute Time by Sex in Lauderdale
The most common commute times in Lauderdale are 20 to 24 minutes (42 commuters, 64.6%) for males and 20 to 24 minutes (9 commuters, 100.0%) for females.
| Commute Time | Male | Female |
| Less than 5 Minutes | 0 (0.0%) | 0 (0.0%) |
| 5 to 9 Minutes | 0 (0.0%) | 0 (0.0%) |
| 10 to 14 Minutes | 0 (0.0%) | 0 (0.0%) |
| 15 to 19 Minutes | 0 (0.0%) | 0 (0.0%) |
| 20 to 24 Minutes | 42 (64.6%) | 9 (100.0%) |
| 25 to 29 Minutes | 0 (0.0%) | 0 (0.0%) |
| 30 to 34 Minutes | 23 (35.4%) | 0 (0.0%) |
| 35 to 39 Minutes | 0 (0.0%) | 0 (0.0%) |
| 40 to 44 Minutes | 0 (0.0%) | 0 (0.0%) |
| 45 to 59 Minutes | 0 (0.0%) | 0 (0.0%) |
| 60 to 89 Minutes | 0 (0.0%) | 0 (0.0%) |
| 90 or more Minutes | 0 (0.0%) | 0 (0.0%) |
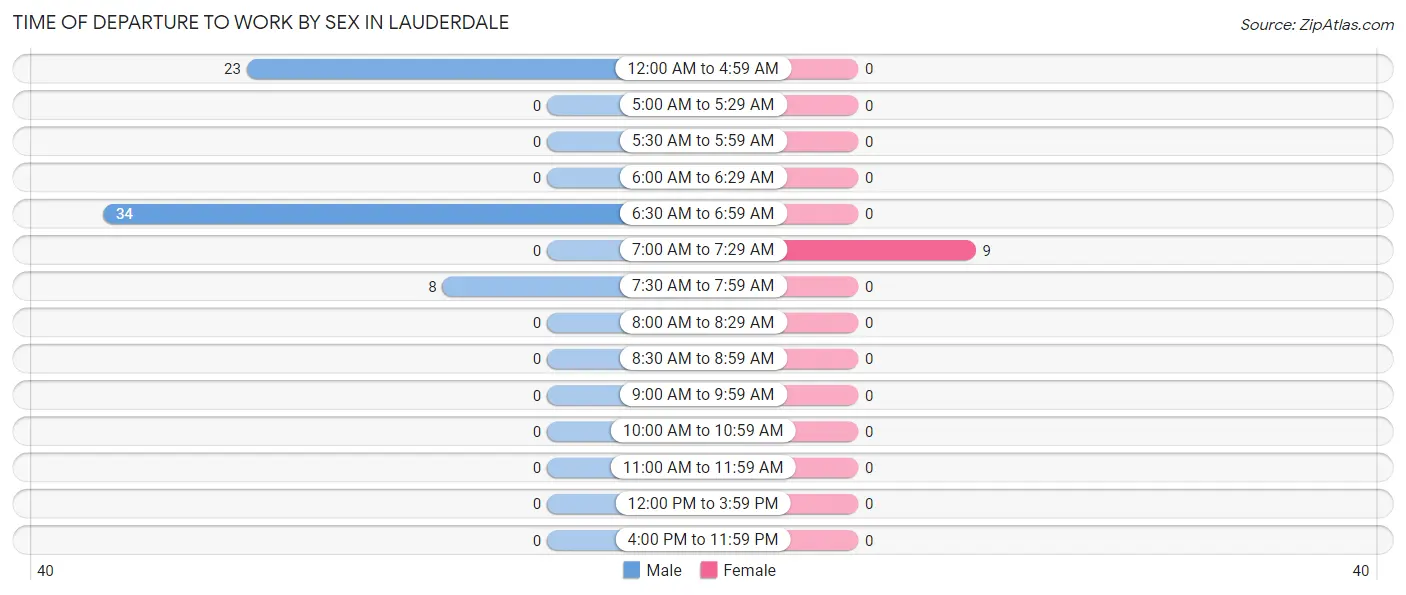
Time of Departure to Work by Sex in Lauderdale
The most frequent times of departure to work in Lauderdale are 6:30 AM to 6:59 AM (34, 52.3%) for males and 7:00 AM to 7:29 AM (9, 100.0%) for females.
| Time of Departure | Male | Female |
| 12:00 AM to 4:59 AM | 23 (35.4%) | 0 (0.0%) |
| 5:00 AM to 5:29 AM | 0 (0.0%) | 0 (0.0%) |
| 5:30 AM to 5:59 AM | 0 (0.0%) | 0 (0.0%) |
| 6:00 AM to 6:29 AM | 0 (0.0%) | 0 (0.0%) |
| 6:30 AM to 6:59 AM | 34 (52.3%) | 0 (0.0%) |
| 7:00 AM to 7:29 AM | 0 (0.0%) | 9 (100.0%) |
| 7:30 AM to 7:59 AM | 8 (12.3%) | 0 (0.0%) |
| 8:00 AM to 8:29 AM | 0 (0.0%) | 0 (0.0%) |
| 8:30 AM to 8:59 AM | 0 (0.0%) | 0 (0.0%) |
| 9:00 AM to 9:59 AM | 0 (0.0%) | 0 (0.0%) |
| 10:00 AM to 10:59 AM | 0 (0.0%) | 0 (0.0%) |
| 11:00 AM to 11:59 AM | 0 (0.0%) | 0 (0.0%) |
| 12:00 PM to 3:59 PM | 0 (0.0%) | 0 (0.0%) |
| 4:00 PM to 11:59 PM | 0 (0.0%) | 0 (0.0%) |
| Total | 65 (100.0%) | 9 (100.0%) |
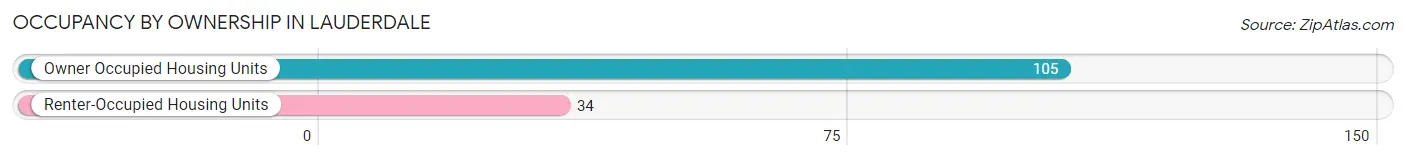
Housing Occupancy in Lauderdale
Occupancy by Ownership in Lauderdale
Of the total 139 dwellings in Lauderdale, owner-occupied units account for 105 (75.5%), while renter-occupied units make up 34 (24.5%).
| Occupancy | # Housing Units | % Housing Units |
| Owner Occupied Housing Units | 105 | 75.5% |
| Renter-Occupied Housing Units | 34 | 24.5% |
| Total Occupied Housing Units | 139 | 100.0% |
Occupancy by Household Size in Lauderdale
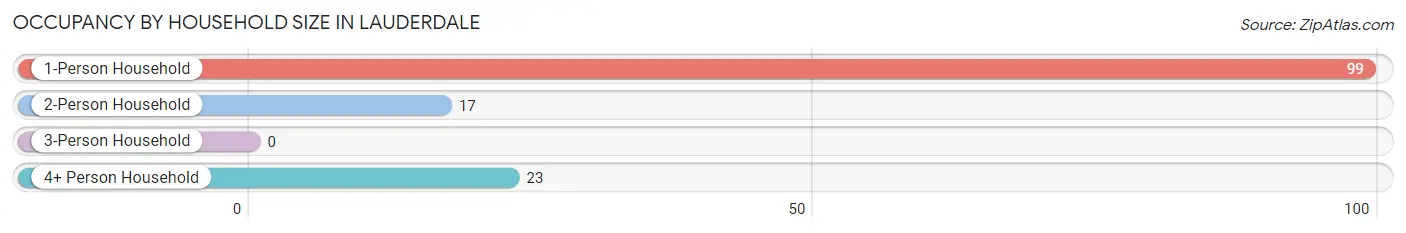
| Household Size | # Housing Units | % Housing Units |
| 1-Person Household | 99 | 71.2% |
| 2-Person Household | 17 | 12.2% |
| 3-Person Household | 0 | 0.0% |
| 4+ Person Household | 23 | 16.6% |
| Total Housing Units | 139 | 100.0% |
Occupancy by Ownership by Household Size in Lauderdale
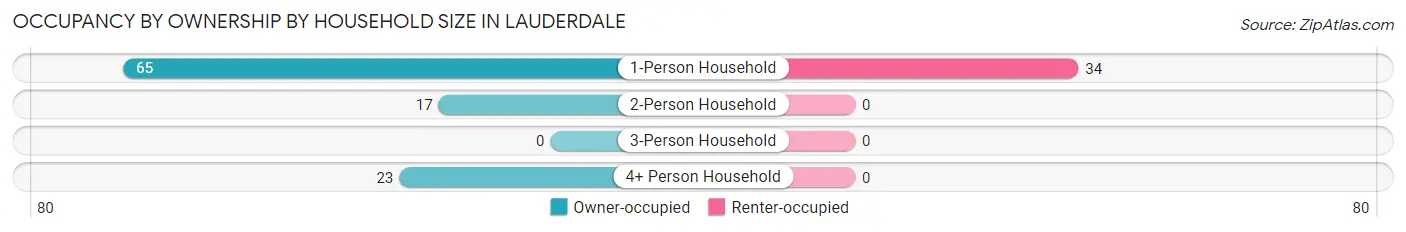
| Household Size | Owner-occupied | Renter-occupied |
| 1-Person Household | 65 (65.7%) | 34 (34.3%) |
| 2-Person Household | 17 (100.0%) | 0 (0.0%) |
| 3-Person Household | 0 (0.0%) | 0 (0.0%) |
| 4+ Person Household | 23 (100.0%) | 0 (0.0%) |
| Total Housing Units | 105 (75.5%) | 34 (24.5%) |
Occupancy by Educational Attainment in Lauderdale
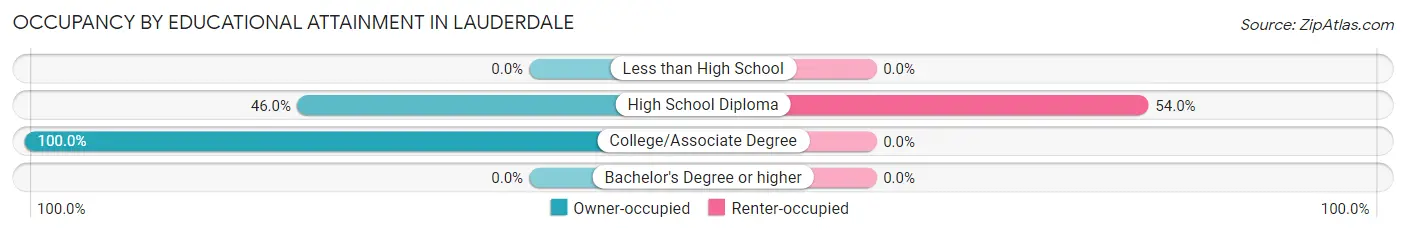
| Household Size | Owner-occupied | Renter-occupied |
| Less than High School | 0 (0.0%) | 0 (0.0%) |
| High School Diploma | 29 (46.0%) | 34 (54.0%) |
| College/Associate Degree | 76 (100.0%) | 0 (0.0%) |
| Bachelor's Degree or higher | 0 (0.0%) | 0 (0.0%) |
Occupancy by Age of Householder in Lauderdale
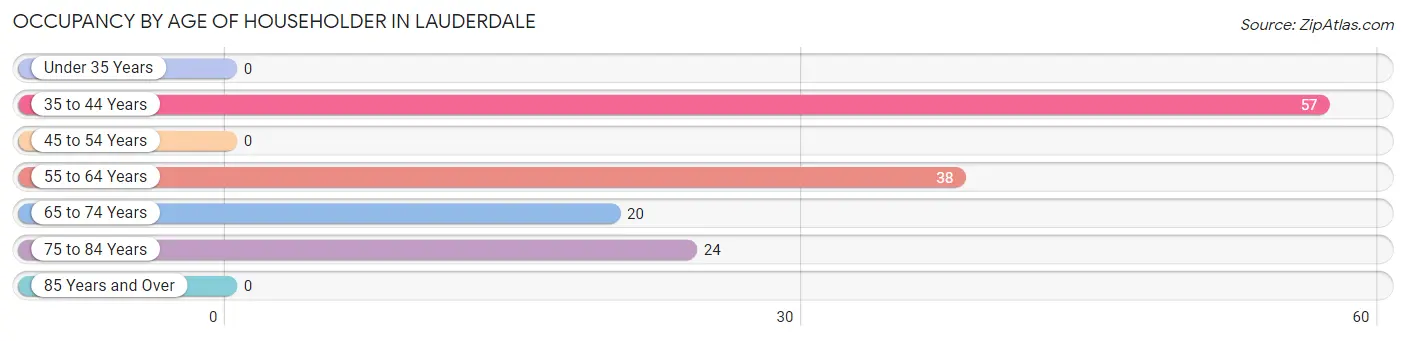
| Age Bracket | # Households | % Households |
| Under 35 Years | 0 | 0.0% |
| 35 to 44 Years | 57 | 41.0% |
| 45 to 54 Years | 0 | 0.0% |
| 55 to 64 Years | 38 | 27.3% |
| 65 to 74 Years | 20 | 14.4% |
| 75 to 84 Years | 24 | 17.3% |
| 85 Years and Over | 0 | 0.0% |
| Total | 139 | 100.0% |
Housing Finances in Lauderdale
Median Income by Occupancy in Lauderdale
| Occupancy Type | # Households | Median Income |
| Owner-Occupied | 105 (75.5%) | $0 |
| Renter-Occupied | 34 (24.5%) | $0 |
| Average | 139 (100.0%) | $0 |
Occupancy by Householder Income Bracket in Lauderdale
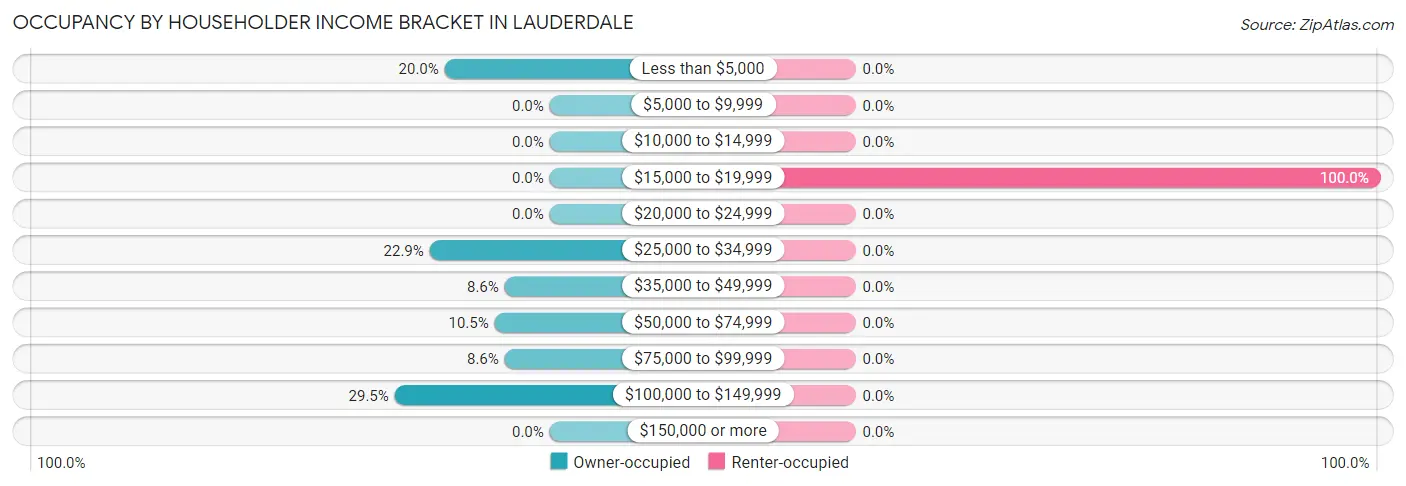
| Income Bracket | Owner-occupied | Renter-occupied |
| Less than $5,000 | 21 (20.0%) | 0 (0.0%) |
| $5,000 to $9,999 | 0 (0.0%) | 0 (0.0%) |
| $10,000 to $14,999 | 0 (0.0%) | 0 (0.0%) |
| $15,000 to $19,999 | 0 (0.0%) | 34 (100.0%) |
| $20,000 to $24,999 | 0 (0.0%) | 0 (0.0%) |
| $25,000 to $34,999 | 24 (22.9%) | 0 (0.0%) |
| $35,000 to $49,999 | 9 (8.6%) | 0 (0.0%) |
| $50,000 to $74,999 | 11 (10.5%) | 0 (0.0%) |
| $75,000 to $99,999 | 9 (8.6%) | 0 (0.0%) |
| $100,000 to $149,999 | 31 (29.5%) | 0 (0.0%) |
| $150,000 or more | 0 (0.0%) | 0 (0.0%) |
| Total | 105 (100.0%) | 34 (100.0%) |
Monthly Housing Cost Tiers in Lauderdale
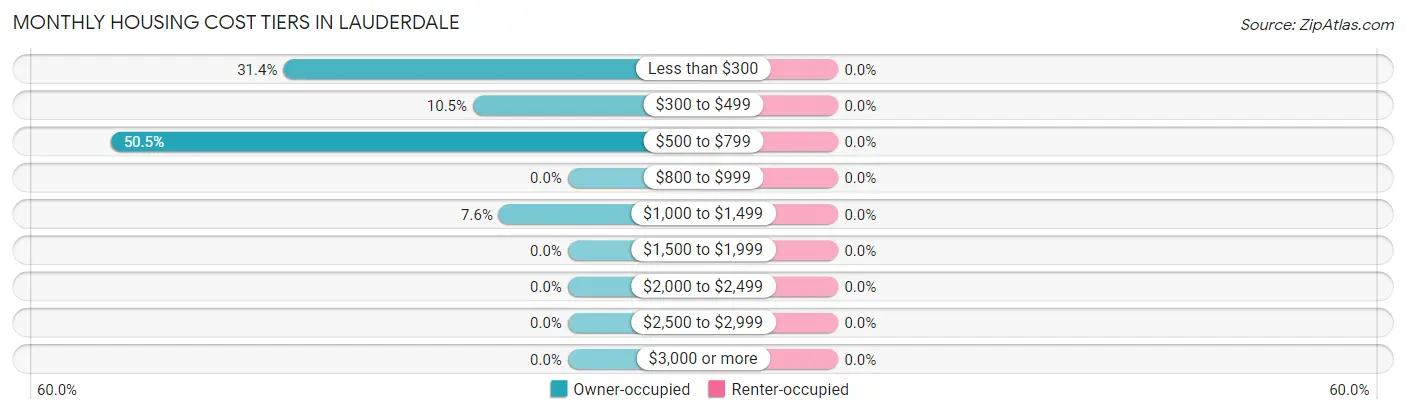
| Monthly Cost | Owner-occupied | Renter-occupied |
| Less than $300 | 33 (31.4%) | 0 (0.0%) |
| $300 to $499 | 11 (10.5%) | 0 (0.0%) |
| $500 to $799 | 53 (50.5%) | 0 (0.0%) |
| $800 to $999 | 0 (0.0%) | 0 (0.0%) |
| $1,000 to $1,499 | 8 (7.6%) | 0 (0.0%) |
| $1,500 to $1,999 | 0 (0.0%) | 0 (0.0%) |
| $2,000 to $2,499 | 0 (0.0%) | 0 (0.0%) |
| $2,500 to $2,999 | 0 (0.0%) | 0 (0.0%) |
| $3,000 or more | 0 (0.0%) | 0 (0.0%) |
| Total | 105 (100.0%) | 34 (100.0%) |
Physical Housing Characteristics in Lauderdale
Housing Structures in Lauderdale
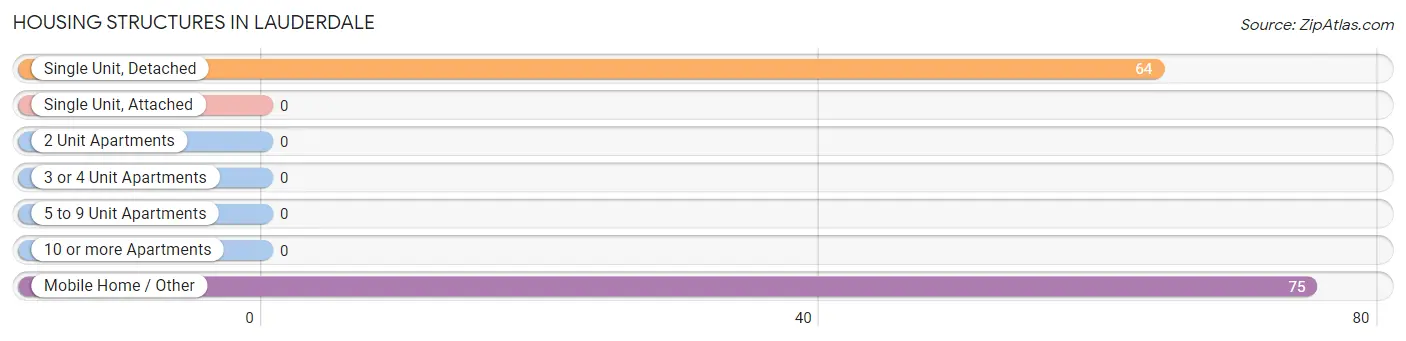
| Structure Type | # Housing Units | % Housing Units |
| Single Unit, Detached | 64 | 46.0% |
| Single Unit, Attached | 0 | 0.0% |
| 2 Unit Apartments | 0 | 0.0% |
| 3 or 4 Unit Apartments | 0 | 0.0% |
| 5 to 9 Unit Apartments | 0 | 0.0% |
| 10 or more Apartments | 0 | 0.0% |
| Mobile Home / Other | 75 | 54.0% |
| Total | 139 | 100.0% |
Housing Structures by Occupancy in Lauderdale
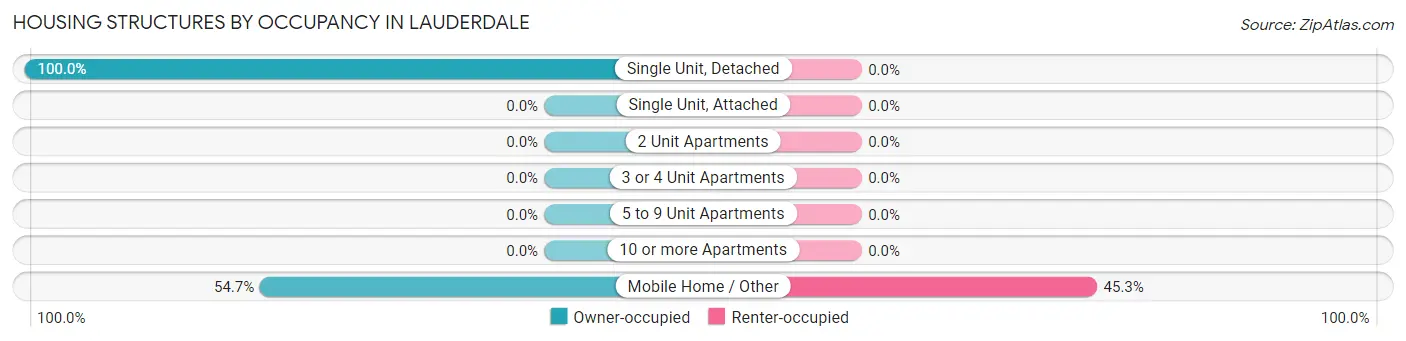
| Structure Type | Owner-occupied | Renter-occupied |
| Single Unit, Detached | 64 (100.0%) | 0 (0.0%) |
| Single Unit, Attached | 0 (0.0%) | 0 (0.0%) |
| 2 Unit Apartments | 0 (0.0%) | 0 (0.0%) |
| 3 or 4 Unit Apartments | 0 (0.0%) | 0 (0.0%) |
| 5 to 9 Unit Apartments | 0 (0.0%) | 0 (0.0%) |
| 10 or more Apartments | 0 (0.0%) | 0 (0.0%) |
| Mobile Home / Other | 41 (54.7%) | 34 (45.3%) |
| Total | 105 (75.5%) | 34 (24.5%) |
Housing Structures by Number of Rooms in Lauderdale
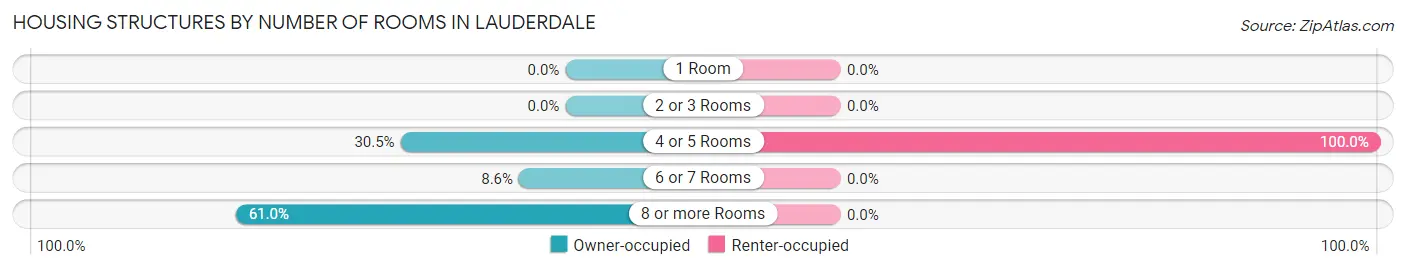
| Number of Rooms | Owner-occupied | Renter-occupied |
| 1 Room | 0 (0.0%) | 0 (0.0%) |
| 2 or 3 Rooms | 0 (0.0%) | 0 (0.0%) |
| 4 or 5 Rooms | 32 (30.5%) | 34 (100.0%) |
| 6 or 7 Rooms | 9 (8.6%) | 0 (0.0%) |
| 8 or more Rooms | 64 (61.0%) | 0 (0.0%) |
| Total | 105 (100.0%) | 34 (100.0%) |
Housing Structure by Heating Type in Lauderdale
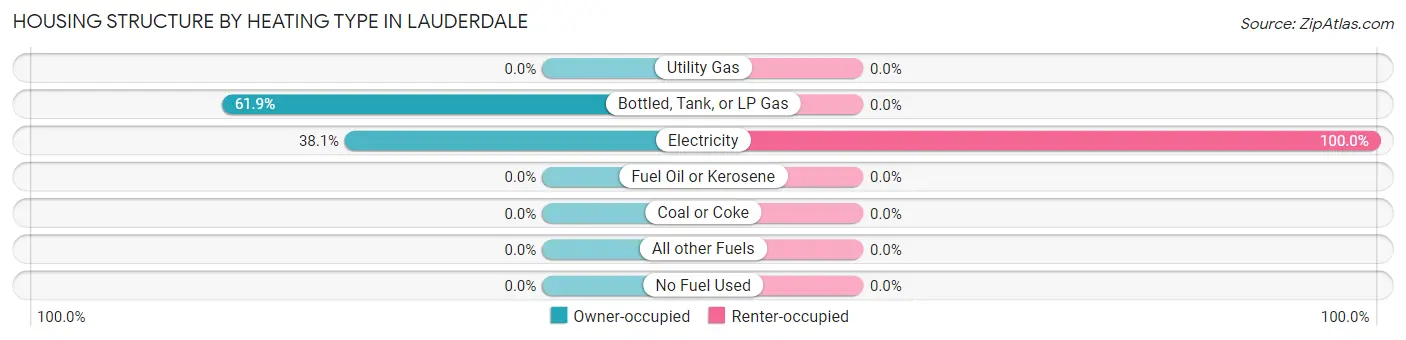
| Heating Type | Owner-occupied | Renter-occupied |
| Utility Gas | 0 (0.0%) | 0 (0.0%) |
| Bottled, Tank, or LP Gas | 65 (61.9%) | 0 (0.0%) |
| Electricity | 40 (38.1%) | 34 (100.0%) |
| Fuel Oil or Kerosene | 0 (0.0%) | 0 (0.0%) |
| Coal or Coke | 0 (0.0%) | 0 (0.0%) |
| All other Fuels | 0 (0.0%) | 0 (0.0%) |
| No Fuel Used | 0 (0.0%) | 0 (0.0%) |
| Total | 105 (100.0%) | 34 (100.0%) |
Household Vehicle Usage in Lauderdale
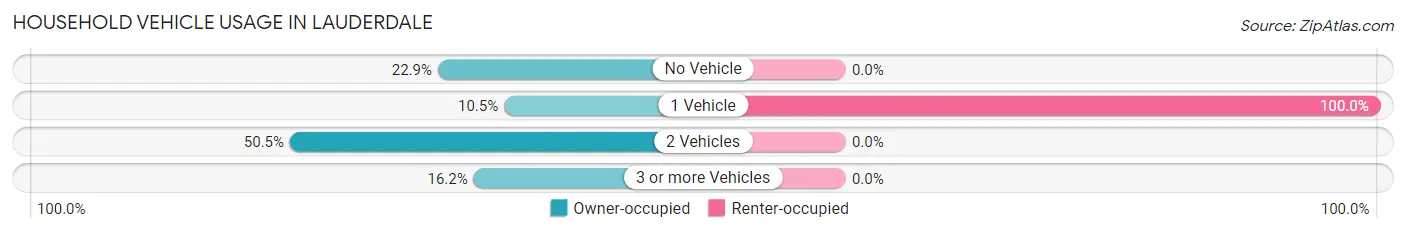
| Vehicles per Household | Owner-occupied | Renter-occupied |
| No Vehicle | 24 (22.9%) | 0 (0.0%) |
| 1 Vehicle | 11 (10.5%) | 34 (100.0%) |
| 2 Vehicles | 53 (50.5%) | 0 (0.0%) |
| 3 or more Vehicles | 17 (16.2%) | 0 (0.0%) |
| Total | 105 (100.0%) | 34 (100.0%) |
Real Estate & Mortgages in Lauderdale
Real Estate and Mortgage Overview in Lauderdale
| Characteristic | Without Mortgage | With Mortgage |
| Housing Units | 97 | 8 |
| Median Property Value | $43,900 | $0 |
| Median Household Income | - | - |
| Monthly Housing Costs | $650 | $0 |
| Real Estate Taxes | - | - |
Property Value by Mortgage Status in Lauderdale
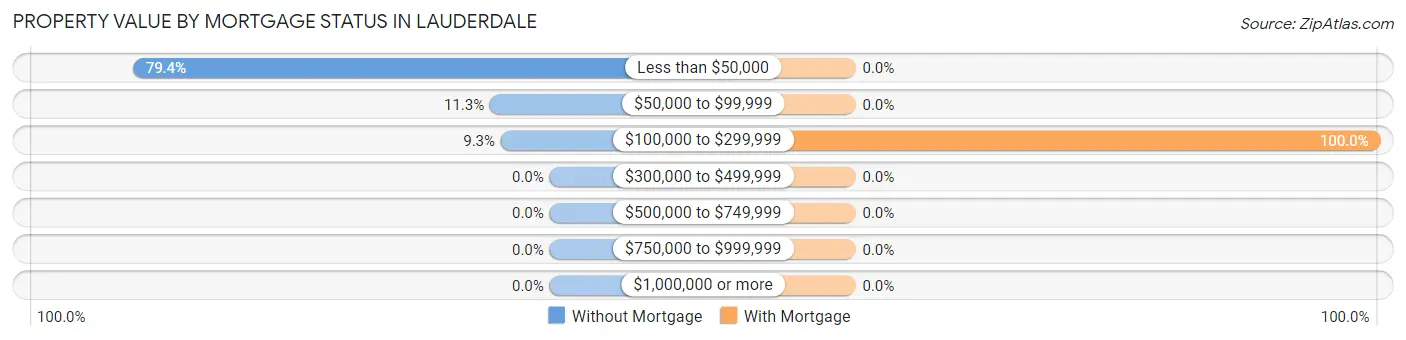
| Property Value | Without Mortgage | With Mortgage |
| Less than $50,000 | 77 (79.4%) | 0 (0.0%) |
| $50,000 to $99,999 | 11 (11.3%) | 0 (0.0%) |
| $100,000 to $299,999 | 9 (9.3%) | 8 (100.0%) |
| $300,000 to $499,999 | 0 (0.0%) | 0 (0.0%) |
| $500,000 to $749,999 | 0 (0.0%) | 0 (0.0%) |
| $750,000 to $999,999 | 0 (0.0%) | 0 (0.0%) |
| $1,000,000 or more | 0 (0.0%) | 0 (0.0%) |
| Total | 97 (100.0%) | 8 (100.0%) |
Household Income by Mortgage Status in Lauderdale
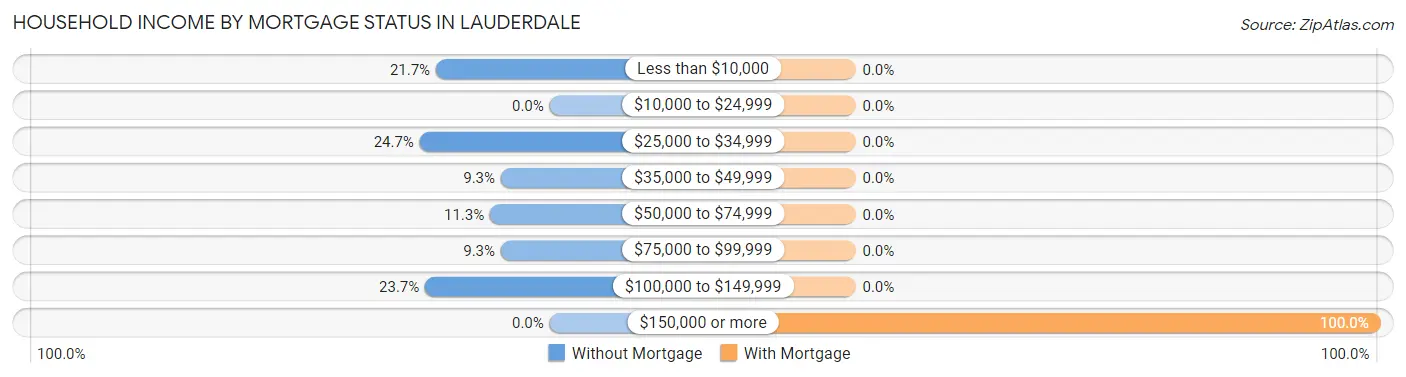
| Household Income | Without Mortgage | With Mortgage |
| Less than $10,000 | 21 (21.6%) | 0 (0.0%) |
| $10,000 to $24,999 | 0 (0.0%) | 0 (0.0%) |
| $25,000 to $34,999 | 24 (24.7%) | 0 (0.0%) |
| $35,000 to $49,999 | 9 (9.3%) | 0 (0.0%) |
| $50,000 to $74,999 | 11 (11.3%) | 0 (0.0%) |
| $75,000 to $99,999 | 9 (9.3%) | 0 (0.0%) |
| $100,000 to $149,999 | 23 (23.7%) | 0 (0.0%) |
| $150,000 or more | 0 (0.0%) | 8 (100.0%) |
| Total | 97 (100.0%) | 8 (100.0%) |
Property Value to Household Income Ratio in Lauderdale
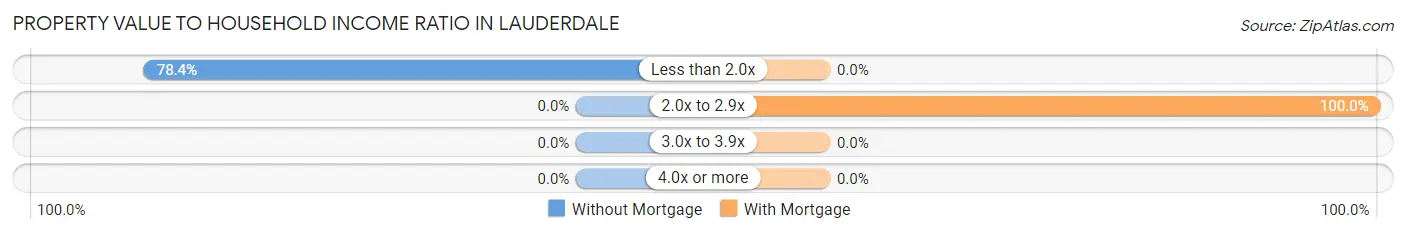
| Value-to-Income Ratio | Without Mortgage | With Mortgage |
| Less than 2.0x | 76 (78.3%) | 0 (0.0%) |
| 2.0x to 2.9x | 0 (0.0%) | 8 (100.0%) |
| 3.0x to 3.9x | 0 (0.0%) | 0 (0.0%) |
| 4.0x or more | 0 (0.0%) | 0 (0.0%) |
| Total | 97 (100.0%) | 8 (100.0%) |
Real Estate Taxes by Mortgage Status in Lauderdale
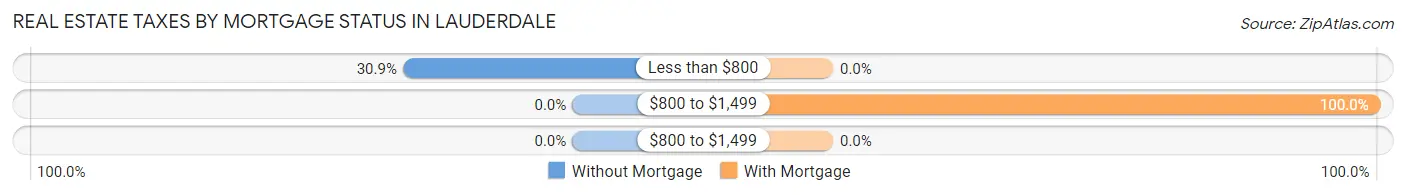
| Property Taxes | Without Mortgage | With Mortgage |
| Less than $800 | 30 (30.9%) | 0 (0.0%) |
| $800 to $1,499 | 0 (0.0%) | 8 (100.0%) |
| $800 to $1,499 | 0 (0.0%) | 0 (0.0%) |
| Total | 97 (100.0%) | 8 (100.0%) |
Health & Disability in Lauderdale
Health Insurance Coverage by Age in Lauderdale
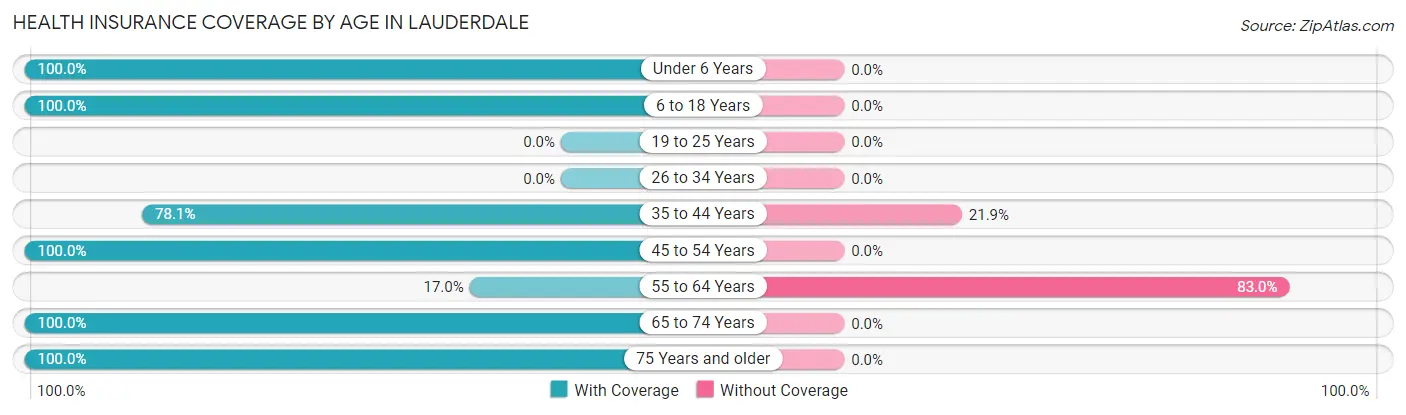
| Age Bracket | With Coverage | Without Coverage |
| Under 6 Years | 20 (100.0%) | 0 (0.0%) |
| 6 to 18 Years | 21 (100.0%) | 0 (0.0%) |
| 19 to 25 Years | 0 (0.0%) | 0 (0.0%) |
| 26 to 34 Years | 0 (0.0%) | 0 (0.0%) |
| 35 to 44 Years | 57 (78.1%) | 16 (21.9%) |
| 45 to 54 Years | 9 (100.0%) | 0 (0.0%) |
| 55 to 64 Years | 8 (17.0%) | 39 (83.0%) |
| 65 to 74 Years | 20 (100.0%) | 0 (0.0%) |
| 75 Years and older | 24 (100.0%) | 0 (0.0%) |
| Total | 159 (74.3%) | 55 (25.7%) |
Health Insurance Coverage by Citizenship Status in Lauderdale

| Citizenship Status | With Coverage | Without Coverage |
| Native Born | 20 (100.0%) | 0 (0.0%) |
| Foreign Born, Citizen | 21 (100.0%) | 0 (0.0%) |
| Foreign Born, not a Citizen | 0 (0.0%) | 0 (0.0%) |
Health Insurance Coverage by Household Income in Lauderdale
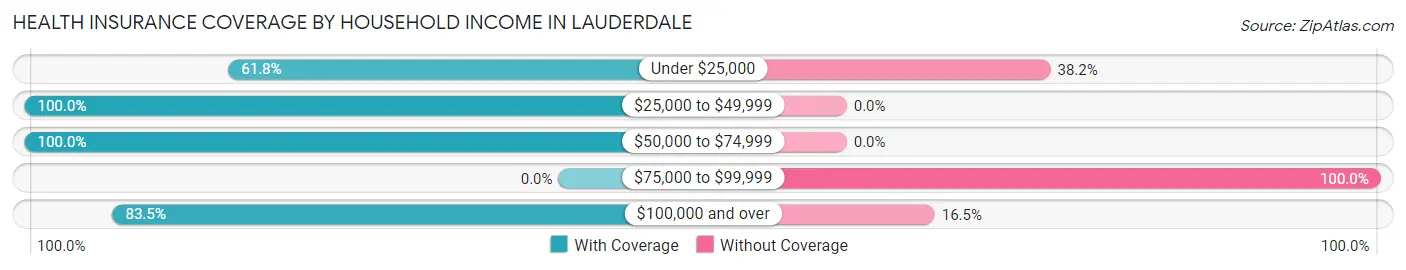
| Household Income | With Coverage | Without Coverage |
| Under $25,000 | 34 (61.8%) | 21 (38.2%) |
| $25,000 to $49,999 | 33 (100.0%) | 0 (0.0%) |
| $50,000 to $74,999 | 11 (100.0%) | 0 (0.0%) |
| $75,000 to $99,999 | 0 (0.0%) | 18 (100.0%) |
| $100,000 and over | 81 (83.5%) | 16 (16.5%) |
Public vs Private Health Insurance Coverage by Age in Lauderdale
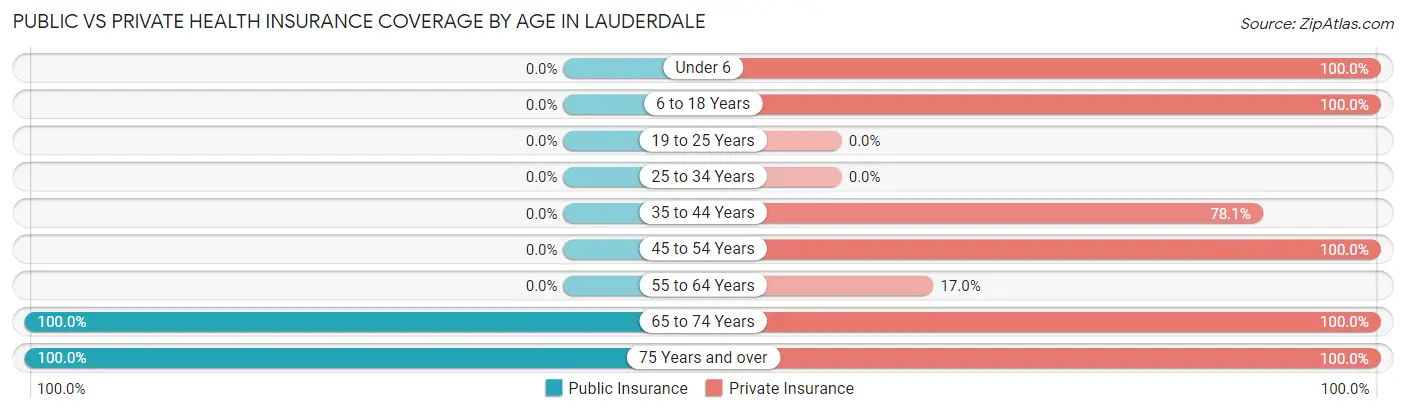
| Age Bracket | Public Insurance | Private Insurance |
| Under 6 | 0 (0.0%) | 20 (100.0%) |
| 6 to 18 Years | 0 (0.0%) | 21 (100.0%) |
| 19 to 25 Years | 0 (0.0%) | 0 (0.0%) |
| 25 to 34 Years | 0 (0.0%) | 0 (0.0%) |
| 35 to 44 Years | 0 (0.0%) | 57 (78.1%) |
| 45 to 54 Years | 0 (0.0%) | 9 (100.0%) |
| 55 to 64 Years | 0 (0.0%) | 8 (17.0%) |
| 65 to 74 Years | 20 (100.0%) | 20 (100.0%) |
| 75 Years and over | 24 (100.0%) | 24 (100.0%) |
| Total | 44 (20.6%) | 159 (74.3%) |
Disability Status by Sex by Age in Lauderdale
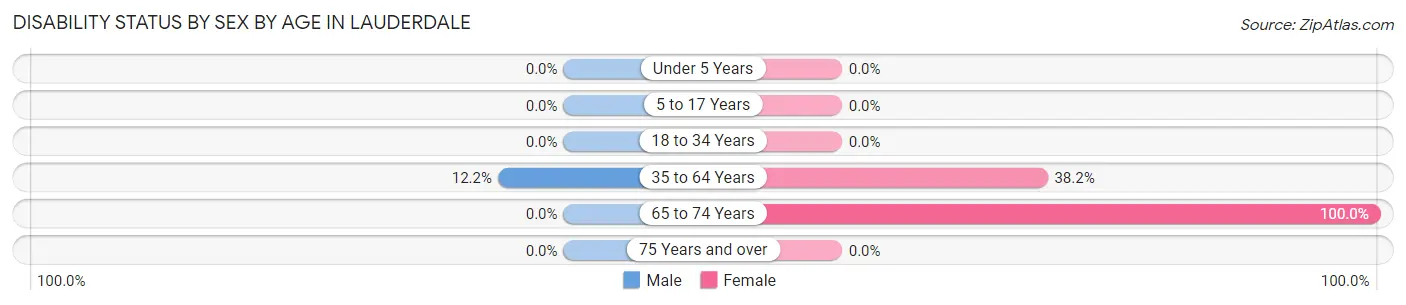
| Age Bracket | Male | Female |
| Under 5 Years | 0 (0.0%) | 0 (0.0%) |
| 5 to 17 Years | 0 (0.0%) | 0 (0.0%) |
| 18 to 34 Years | 0 (0.0%) | 0 (0.0%) |
| 35 to 64 Years | 9 (12.2%) | 21 (38.2%) |
| 65 to 74 Years | 0 (0.0%) | 9 (100.0%) |
| 75 Years and over | 0 (0.0%) | 0 (0.0%) |
Disability Class by Sex by Age in Lauderdale
Disability Class: Hearing Difficulty

| Age Bracket | Male | Female |
| Under 5 Years | 0 (0.0%) | 0 (0.0%) |
| 5 to 17 Years | 0 (0.0%) | 0 (0.0%) |
| 18 to 34 Years | 0 (0.0%) | 0 (0.0%) |
| 35 to 64 Years | 0 (0.0%) | 0 (0.0%) |
| 65 to 74 Years | 0 (0.0%) | 9 (100.0%) |
| 75 Years and over | 0 (0.0%) | 0 (0.0%) |
Disability Class: Vision Difficulty
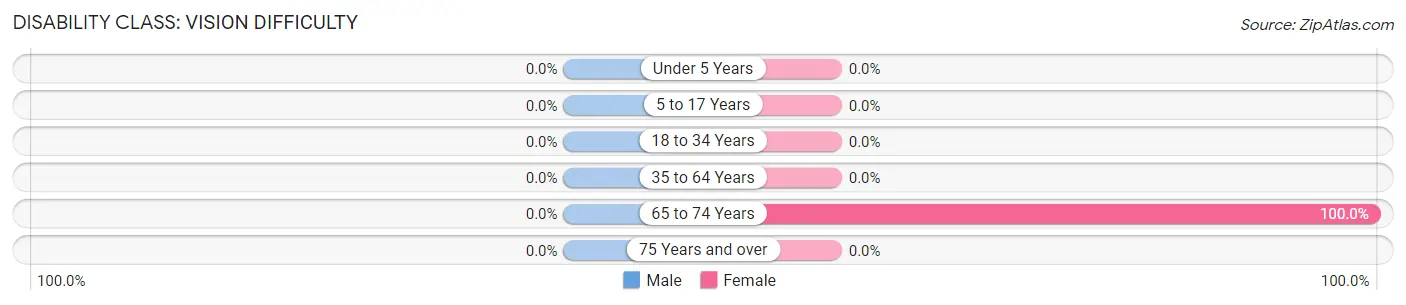
| Age Bracket | Male | Female |
| Under 5 Years | 0 (0.0%) | 0 (0.0%) |
| 5 to 17 Years | 0 (0.0%) | 0 (0.0%) |
| 18 to 34 Years | 0 (0.0%) | 0 (0.0%) |
| 35 to 64 Years | 0 (0.0%) | 0 (0.0%) |
| 65 to 74 Years | 0 (0.0%) | 9 (100.0%) |
| 75 Years and over | 0 (0.0%) | 0 (0.0%) |
Disability Class: Cognitive Difficulty
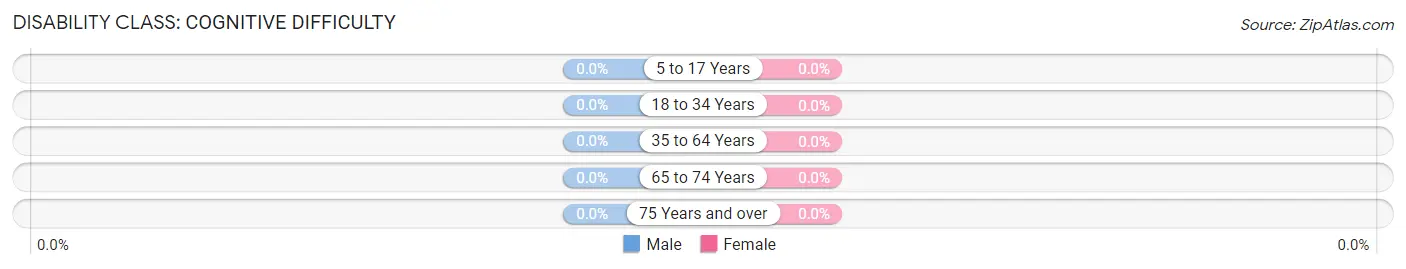
| Age Bracket | Male | Female |
| 5 to 17 Years | 0 (0.0%) | 0 (0.0%) |
| 18 to 34 Years | 0 (0.0%) | 0 (0.0%) |
| 35 to 64 Years | 0 (0.0%) | 0 (0.0%) |
| 65 to 74 Years | 0 (0.0%) | 0 (0.0%) |
| 75 Years and over | 0 (0.0%) | 0 (0.0%) |
Disability Class: Ambulatory Difficulty
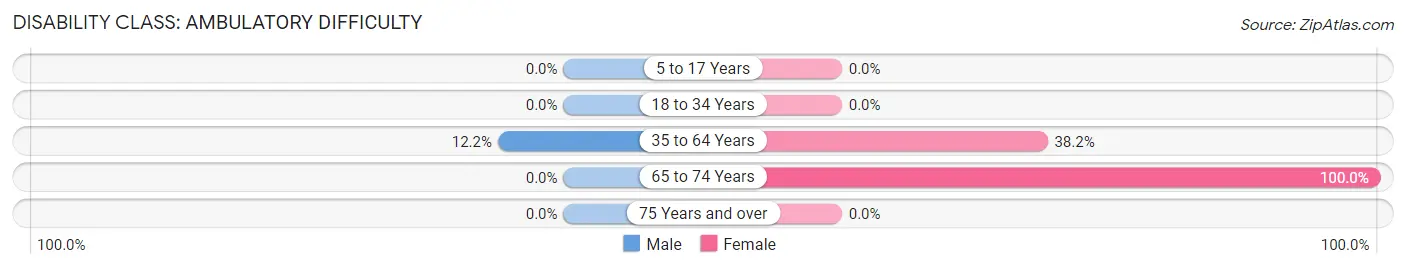
| Age Bracket | Male | Female |
| 5 to 17 Years | 0 (0.0%) | 0 (0.0%) |
| 18 to 34 Years | 0 (0.0%) | 0 (0.0%) |
| 35 to 64 Years | 9 (12.2%) | 21 (38.2%) |
| 65 to 74 Years | 0 (0.0%) | 9 (100.0%) |
| 75 Years and over | 0 (0.0%) | 0 (0.0%) |
Disability Class: Self-Care Difficulty
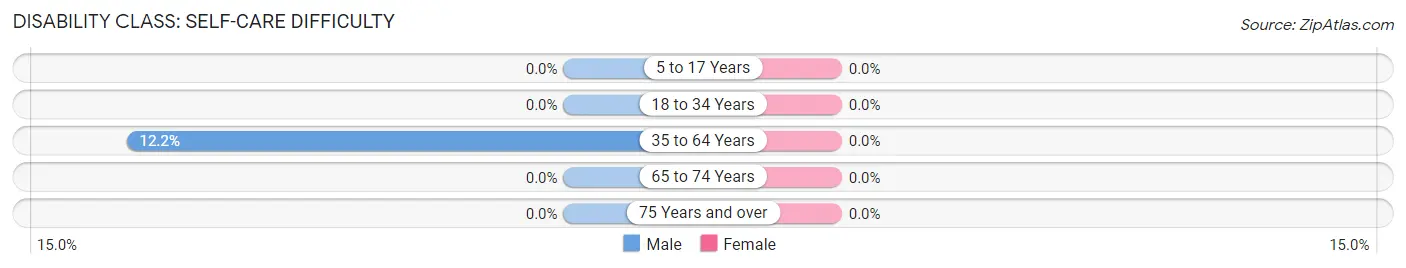
| Age Bracket | Male | Female |
| 5 to 17 Years | 0 (0.0%) | 0 (0.0%) |
| 18 to 34 Years | 0 (0.0%) | 0 (0.0%) |
| 35 to 64 Years | 9 (12.2%) | 0 (0.0%) |
| 65 to 74 Years | 0 (0.0%) | 0 (0.0%) |
| 75 Years and over | 0 (0.0%) | 0 (0.0%) |
Technology Access in Lauderdale
Computing Device Access in Lauderdale
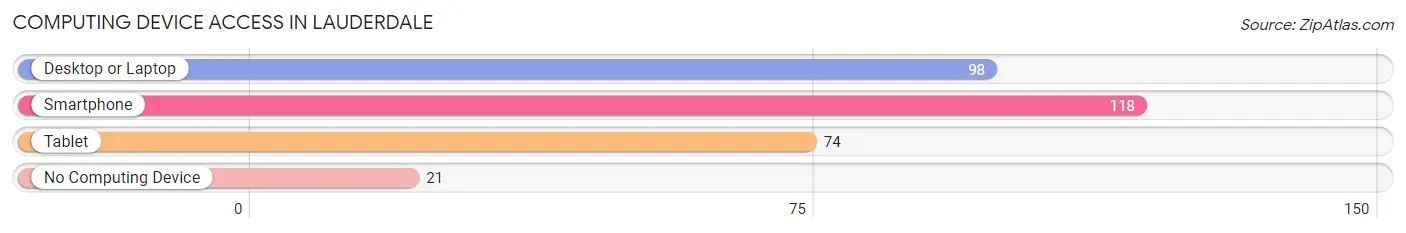
| Device Type | # Households | % Households |
| Desktop or Laptop | 98 | 70.5% |
| Smartphone | 118 | 84.9% |
| Tablet | 74 | 53.2% |
| No Computing Device | 21 | 15.1% |
| Total | 139 | 100.0% |
Internet Access in Lauderdale
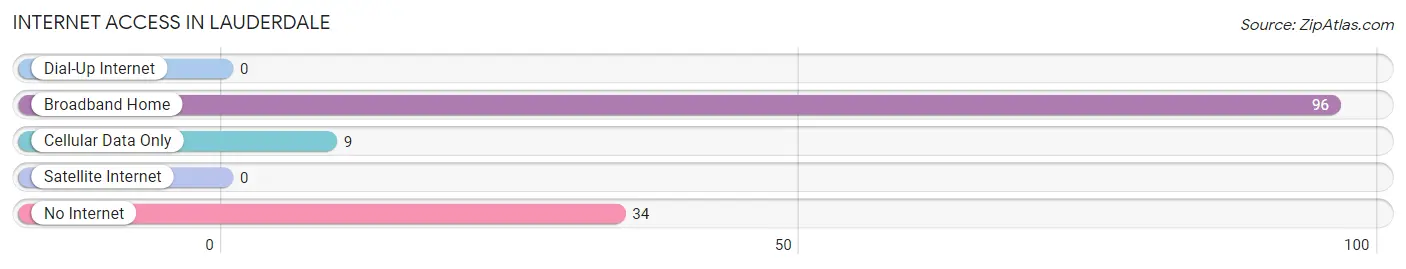
| Internet Type | # Households | % Households |
| Dial-Up Internet | 0 | 0.0% |
| Broadband Home | 96 | 69.1% |
| Cellular Data Only | 9 | 6.5% |
| Satellite Internet | 0 | 0.0% |
| No Internet | 34 | 24.5% |
| Total | 139 | 100.0% |
Lauderdale Summary
Lauderdale is a county located in the state of Mississippi, in the United States of America. It is part of the Mississippi Delta region and is bordered by the counties of Clarke, Kemper, Newton, Neshoba, and Rankin. The county seat is Meridian, and the county has a total area of 576 square miles. As of the 2010 census, the population was 80,261, making it the fourth most populous county in Mississippi.
Geography
Lauderdale County is located in the Mississippi Delta region of the state. It is bordered by the counties of Clarke, Kemper, Newton, Neshoba, and Rankin. The county has a total area of 576 square miles, of which 575 square miles is land and 1 square mile is water. The terrain is mostly flat, with some rolling hills in the northern part of the county. The county is drained by the Pearl River and its tributaries, including the Chunky River, Okatibbee Creek, and the Strong River.
The county is home to several state parks, including the Okatibbee Wildlife Management Area, the Chunky River State Park, and the Strong River State Park. The county also contains the city of Meridian, the county seat, which is the largest city in the county.
Demographics
As of the 2010 census, there were 80,261 people, 28,945 households, and 20,845 families residing in the county. The population density was 139.3 people per square mile. There were 32,845 housing units at an average density of 56.9 per square mile. The racial makeup of the county was 57.2% White, 40.2% Black or African American, 0.3% Native American, 0.5% Asian, 0.1% Pacific Islander, 0.7% from other races, and 1.0% from two or more races. 1.7% of the population were Hispanic or Latino of any race.
There were 28,945 households, out of which 33.2% had children under the age of 18 living with them, 47.2% were married couples living together, 19.2% had a female householder with no husband present, and 28.7% were non-families. 24.2% of all households were made up of individuals, and 9.7% had someone living alone who was 65 years of age or older. The average household size was 2.63 and the average family size was 3.12.
The median income for a household in the county was $31,945, and the median income for a family was $38,945. Males had a median income of $31,945 versus $22,945 for females. The per capita income for the county was $16,945. About 17.2% of families and 20.7% of the population were below the poverty line, including 28.7% of those under age 18 and 17.2% of those age 65 or over.
Economy
Lauderdale County is a largely agricultural county, with the majority of its land devoted to farming. The county is home to several large farms, including the Okatibbee Farms, the Chunky River Farms, and the Strong River Farms. The county is also home to several large manufacturing companies, including the Meridian Manufacturing Company, the Meridian Steel Company, and the Meridian Textile Company.
The county is also home to several large retail stores, including Walmart, Target, and Lowe's. The county is also home to several large hospitals, including the Anderson Regional Medical Center, the Rush Foundation Hospital, and the Riley Hospital.
The county is served by the Meridian Regional Airport, which provides air service to the county and the surrounding area. The county is also served by several major highways, including Interstate 20, U.S. Route 11, and U.S. Route 45.
Conclusion
Lauderdale County is a largely agricultural county located in the Mississippi Delta region of the state. It is bordered by the counties of Clarke, Kemper, Newton, Neshoba, and Rankin. The county has a total area of 576 square miles, and as of the 2010 census, the population was 80,261. The county is home to several large farms, manufacturing companies, and retail stores, and is served by the Meridian Regional Airport and several major highways. The county has a median household income of $31,945 and a per capita income of $16,945.
Common Questions
What is Per Capita Income in Lauderdale?
Per Capita income in Lauderdale is $31,446.
What is the Median Family Income in Lauderdale?
Median Family Income in Lauderdale is $115,887.
What is Inequality or Gini Index in Lauderdale?
Inequality or Gini Index in Lauderdale is 0.49.
What is the Total Population of Lauderdale?
Total Population of Lauderdale is 214.
What is the Total Male Population of Lauderdale?
Total Male Population of Lauderdale is 150.
What is the Total Female Population of Lauderdale?
Total Female Population of Lauderdale is 64.
What is the Ratio of Males per 100 Females in Lauderdale?
There are 234.38 Males per 100 Females in Lauderdale.
What is the Ratio of Females per 100 Males in Lauderdale?
There are 42.67 Females per 100 Males in Lauderdale.
What is the Median Population Age in Lauderdale?
Median Population Age in Lauderdale is 40.8 Years.
What is the Average Family Size in Lauderdale
Average Family Size in Lauderdale is 2.9 People.
What is the Average Household Size in Lauderdale
Average Household Size in Lauderdale is 1.5 People.
How Large is the Labor Force in Lauderdale?
There are 104 People in the Labor Forcein in Lauderdale.
What is the Percentage of People in the Labor Force in Lauderdale?
53.6% of People are in the Labor Force in Lauderdale.
What is the Unemployment Rate in Lauderdale?
Unemployment Rate in Lauderdale is 8.7%.