Carrollton, MS Map & Demographics
Carrollton Map
Carrollton Overview
$30,963
PER CAPITA INCOME
$81,500
AVG FAMILY INCOME
$80,977
AVG HOUSEHOLD INCOME
30.7%
WAGE / INCOME GAP [ % ]
69.3¢/ $1
WAGE / INCOME GAP [ $ ]
0.34
INEQUALITY / GINI INDEX
435
TOTAL POPULATION
249
MALE POPULATION
186
FEMALE POPULATION
133.87
MALES / 100 FEMALES
74.70
FEMALES / 100 MALES
42.3
MEDIAN AGE
3.0
AVG FAMILY SIZE
2.7
AVG HOUSEHOLD SIZE
160
LABOR FORCE [ PEOPLE ]
44.2%
PERCENT IN LABOR FORCE
Carrollton Zip Codes
Carrollton Area Codes
Income in Carrollton
Income Overview in Carrollton
Per Capita Income in Carrollton is $30,963, while median incomes of families and households are $81,500 and $80,977 respectively.
| Characteristic | Number | Measure |
| Per Capita Income | 435 | $30,963 |
| Median Family Income | 122 | $81,500 |
| Mean Family Income | 122 | $100,311 |
| Median Household Income | 145 | $80,977 |
| Mean Household Income | 145 | $89,726 |
| Income Deficit | 122 | $0 |
| Wage / Income Gap (%) | 435 | 30.66% |
| Wage / Income Gap ($) | 435 | 69.34¢ per $1 |
| Gini / Inequality Index | 435 | 0.34 |
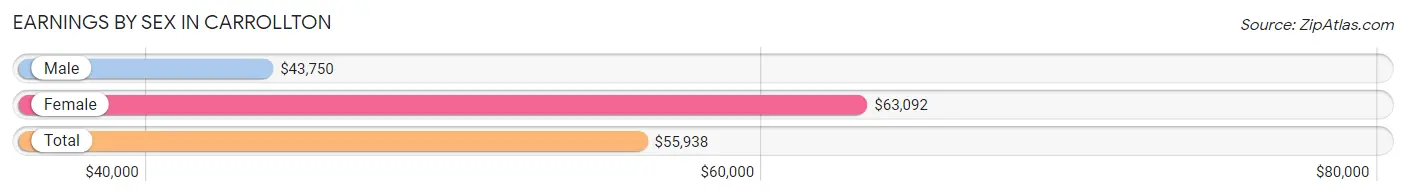
Earnings by Sex in Carrollton
Average Earnings in Carrollton are $55,938, $43,750 for men and $63,092 for women, a difference of 30.7%.
| Sex | Number | Average Earnings |
| Male | 76 (43.4%) | $43,750 |
| Female | 99 (56.6%) | $63,092 |
| Total | 175 (100.0%) | $55,938 |
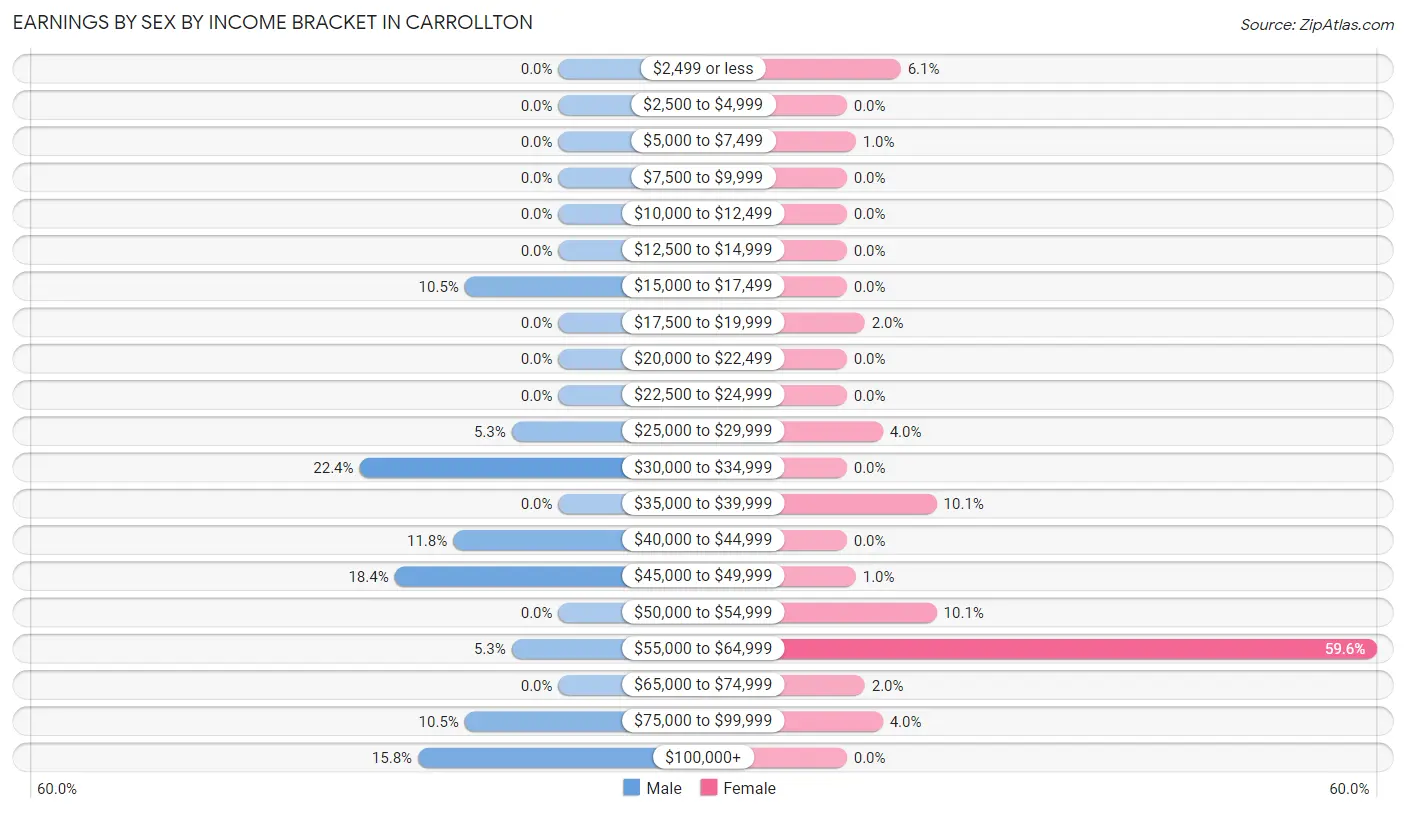
Earnings by Sex by Income Bracket in Carrollton
The most common earnings brackets in Carrollton are $30,000 to $34,999 for men (17 | 22.4%) and $55,000 to $64,999 for women (59 | 59.6%).
| Income | Male | Female |
| $2,499 or less | 0 (0.0%) | 6 (6.1%) |
| $2,500 to $4,999 | 0 (0.0%) | 0 (0.0%) |
| $5,000 to $7,499 | 0 (0.0%) | 1 (1.0%) |
| $7,500 to $9,999 | 0 (0.0%) | 0 (0.0%) |
| $10,000 to $12,499 | 0 (0.0%) | 0 (0.0%) |
| $12,500 to $14,999 | 0 (0.0%) | 0 (0.0%) |
| $15,000 to $17,499 | 8 (10.5%) | 0 (0.0%) |
| $17,500 to $19,999 | 0 (0.0%) | 2 (2.0%) |
| $20,000 to $22,499 | 0 (0.0%) | 0 (0.0%) |
| $22,500 to $24,999 | 0 (0.0%) | 0 (0.0%) |
| $25,000 to $29,999 | 4 (5.3%) | 4 (4.0%) |
| $30,000 to $34,999 | 17 (22.4%) | 0 (0.0%) |
| $35,000 to $39,999 | 0 (0.0%) | 10 (10.1%) |
| $40,000 to $44,999 | 9 (11.8%) | 0 (0.0%) |
| $45,000 to $49,999 | 14 (18.4%) | 1 (1.0%) |
| $50,000 to $54,999 | 0 (0.0%) | 10 (10.1%) |
| $55,000 to $64,999 | 4 (5.3%) | 59 (59.6%) |
| $65,000 to $74,999 | 0 (0.0%) | 2 (2.0%) |
| $75,000 to $99,999 | 8 (10.5%) | 4 (4.0%) |
| $100,000+ | 12 (15.8%) | 0 (0.0%) |
| Total | 76 (100.0%) | 99 (100.0%) |
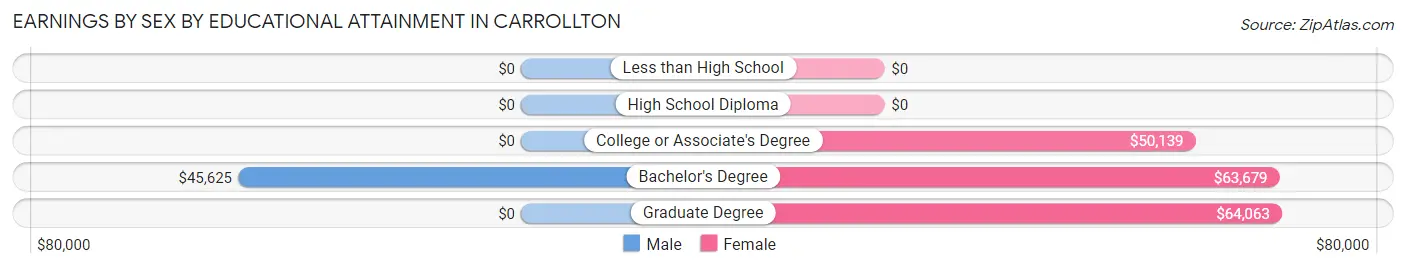
Earnings by Sex by Educational Attainment in Carrollton
Average earnings in Carrollton are $43,750 for men and $63,092 for women, a difference of 30.7%. Men with an educational attainment of bachelor's degree enjoy the highest average annual earnings of $45,625, while those with bachelor's degree education earn the least with $45,625. Women with an educational attainment of graduate degree earn the most with the average annual earnings of $64,063, while those with college or associate's degree education have the smallest earnings of $50,139.
| Educational Attainment | Male Income | Female Income |
| Less than High School | - | - |
| High School Diploma | - | - |
| College or Associate's Degree | - | - |
| Bachelor's Degree | $45,625 | $63,679 |
| Graduate Degree | - | - |
| Total | $43,750 | $63,092 |
Family Income in Carrollton
Family Income Brackets in Carrollton
According to the Carrollton family income data, there are 67 families falling into the $75,000 to $99,999 income range, which is the most common income bracket and makes up 54.9% of all families.
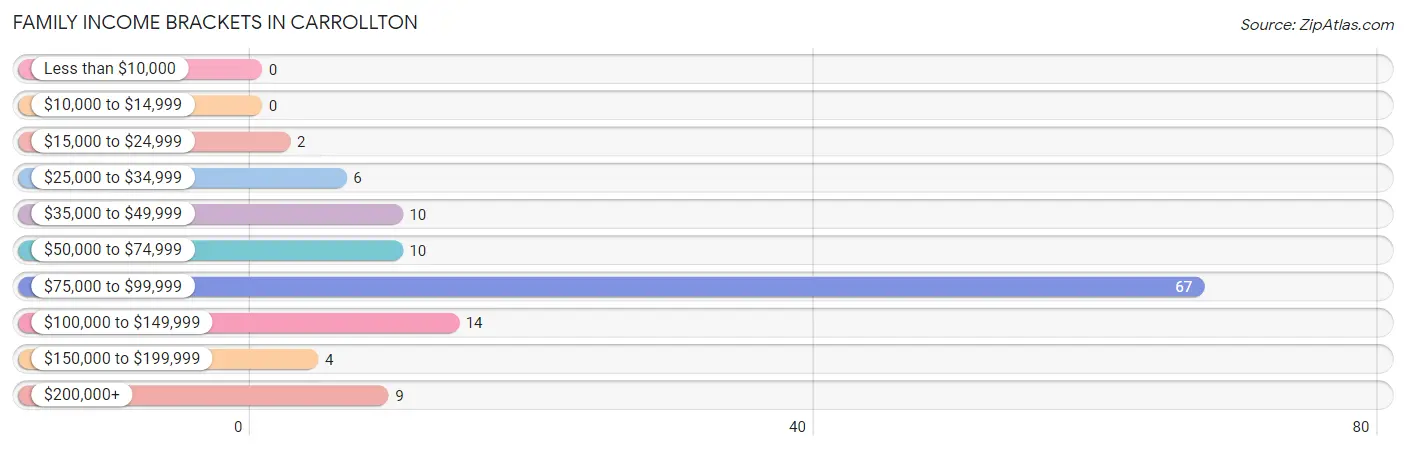
| Income Bracket | # Families | % Families |
| Less than $10,000 | 0 | 0.0% |
| $10,000 to $14,999 | 0 | 0.0% |
| $15,000 to $24,999 | 2 | 1.6% |
| $25,000 to $34,999 | 6 | 4.9% |
| $35,000 to $49,999 | 10 | 8.2% |
| $50,000 to $74,999 | 10 | 8.2% |
| $75,000 to $99,999 | 67 | 54.9% |
| $100,000 to $149,999 | 14 | 11.5% |
| $150,000 to $199,999 | 4 | 3.3% |
| $200,000+ | 9 | 7.4% |
Family Income by Famaliy Size in Carrollton
3-person families (78 | 63.9%) account for the highest median family income in Carrollton with $81,682 per family, while 3-person families (78 | 63.9%) have the highest median income of $27,227 per family member.
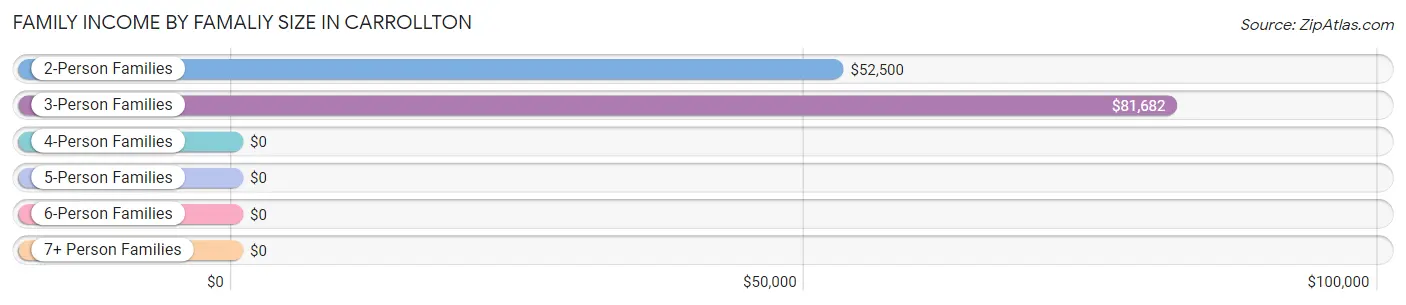
| Income Bracket | # Families | Median Income |
| 2-Person Families | 32 (26.2%) | $52,500 |
| 3-Person Families | 78 (63.9%) | $81,682 |
| 4-Person Families | 4 (3.3%) | $0 |
| 5-Person Families | 8 (6.6%) | $0 |
| 6-Person Families | 0 (0.0%) | $0 |
| 7+ Person Families | 0 (0.0%) | $0 |
| Total | 122 (100.0%) | $81,500 |
Family Income by Number of Earners in Carrollton
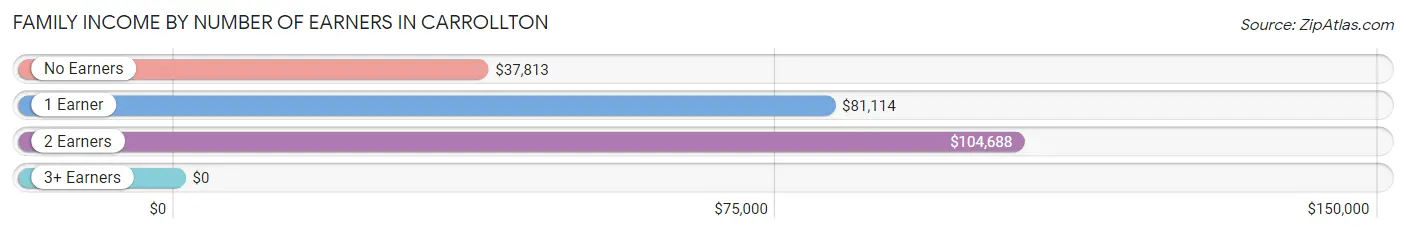
| Number of Earners | # Families | Median Income |
| No Earners | 16 (13.1%) | $37,813 |
| 1 Earner | 75 (61.5%) | $81,114 |
| 2 Earners | 17 (13.9%) | $104,688 |
| 3+ Earners | 14 (11.5%) | $0 |
| Total | 122 (100.0%) | $81,500 |
Household Income in Carrollton
Household Income Brackets in Carrollton
With 68 households falling in the category, the $75,000 to $99,999 income range is the most frequent in Carrollton, accounting for 46.9% of all households.
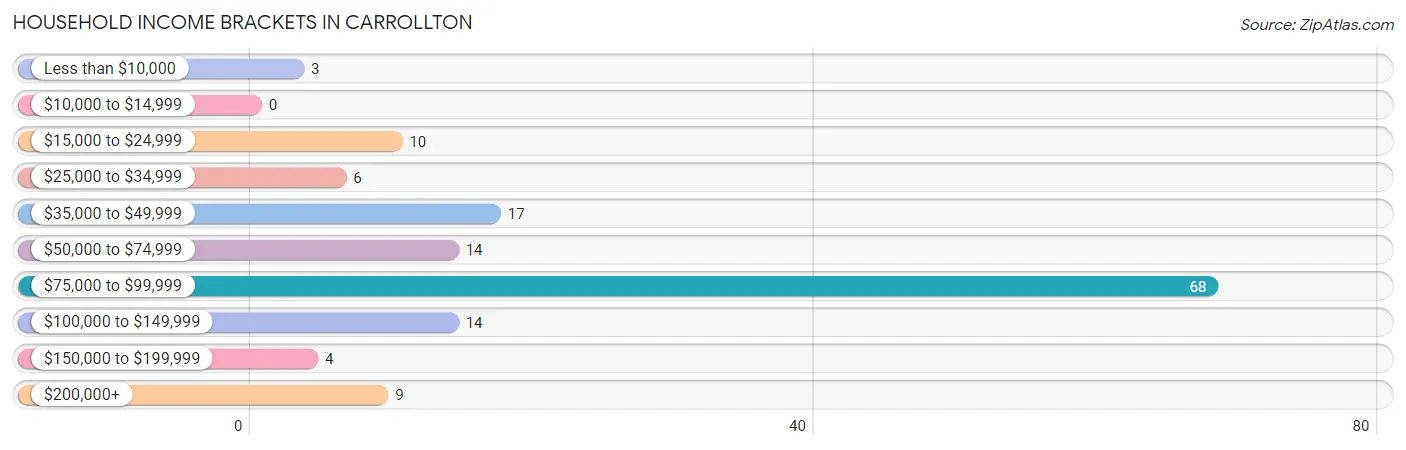
| Income Bracket | # Households | % Households |
| Less than $10,000 | 3 | 2.1% |
| $10,000 to $14,999 | 0 | 0.0% |
| $15,000 to $24,999 | 10 | 6.9% |
| $25,000 to $34,999 | 6 | 4.1% |
| $35,000 to $49,999 | 17 | 11.7% |
| $50,000 to $74,999 | 14 | 9.7% |
| $75,000 to $99,999 | 68 | 46.9% |
| $100,000 to $149,999 | 14 | 9.7% |
| $150,000 to $199,999 | 4 | 2.8% |
| $200,000+ | 9 | 6.2% |
Household Income by Householder Age in Carrollton
The median household income in Carrollton is $80,977, with the highest median household income of $81,651 found in the 45 to 64 years age bracket for the primary householder. A total of 76 households (52.4%) fall into this category.
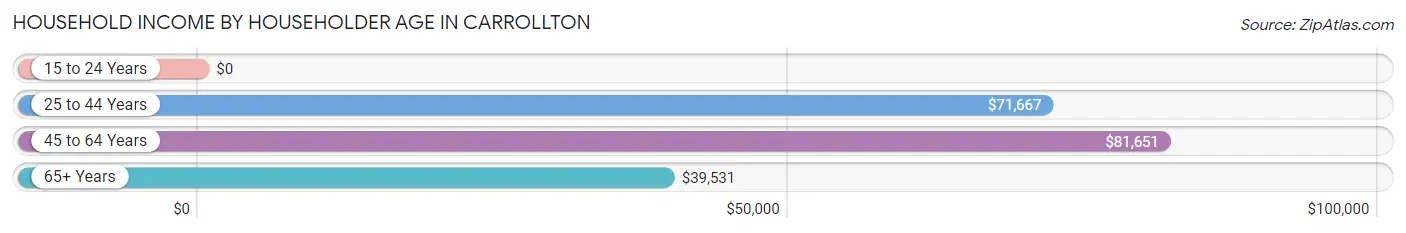
| Income Bracket | # Households | Median Income |
| 15 to 24 Years | 0 (0.0%) | $0 |
| 25 to 44 Years | 24 (16.6%) | $71,667 |
| 45 to 64 Years | 76 (52.4%) | $81,651 |
| 65+ Years | 45 (31.0%) | $39,531 |
| Total | 145 (100.0%) | $80,977 |
Poverty in Carrollton
Income Below Poverty by Sex and Age in Carrollton
With 0.5% poverty level for males and 2.3% for females among the residents of Carrollton, 65 to 74 year old males and 55 to 64 year old females are the most vulnerable to poverty, with 1 males (4.5%) and 3 females (33.3%) in their respective age groups living below the poverty level.
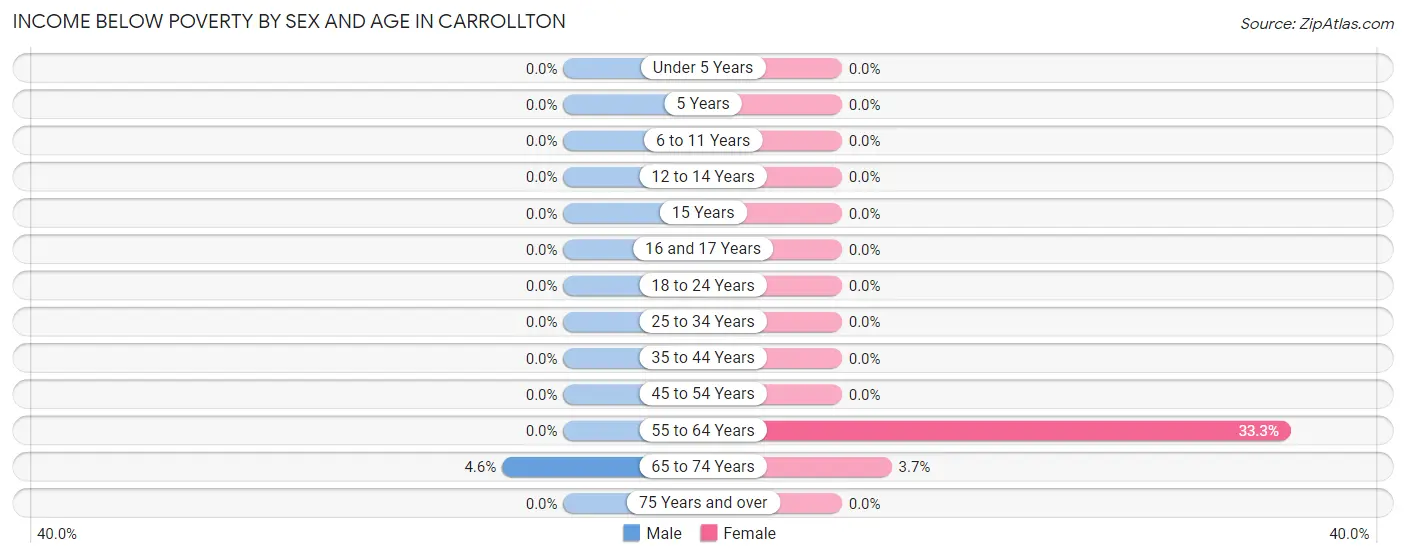
| Age Bracket | Male | Female |
| Under 5 Years | 0 (0.0%) | 0 (0.0%) |
| 5 Years | 0 (0.0%) | 0 (0.0%) |
| 6 to 11 Years | 0 (0.0%) | 0 (0.0%) |
| 12 to 14 Years | 0 (0.0%) | 0 (0.0%) |
| 15 Years | 0 (0.0%) | 0 (0.0%) |
| 16 and 17 Years | 0 (0.0%) | 0 (0.0%) |
| 18 to 24 Years | 0 (0.0%) | 0 (0.0%) |
| 25 to 34 Years | 0 (0.0%) | 0 (0.0%) |
| 35 to 44 Years | 0 (0.0%) | 0 (0.0%) |
| 45 to 54 Years | 0 (0.0%) | 0 (0.0%) |
| 55 to 64 Years | 0 (0.0%) | 3 (33.3%) |
| 65 to 74 Years | 1 (4.5%) | 1 (3.7%) |
| 75 Years and over | 0 (0.0%) | 0 (0.0%) |
| Total | 1 (0.5%) | 4 (2.3%) |
Income Above Poverty by Sex and Age in Carrollton
According to the poverty statistics in Carrollton, males aged 6 to 11 years and females aged under 5 years are the age groups that are most secure financially, with 100.0% of males and 100.0% of females in these age groups living above the poverty line.
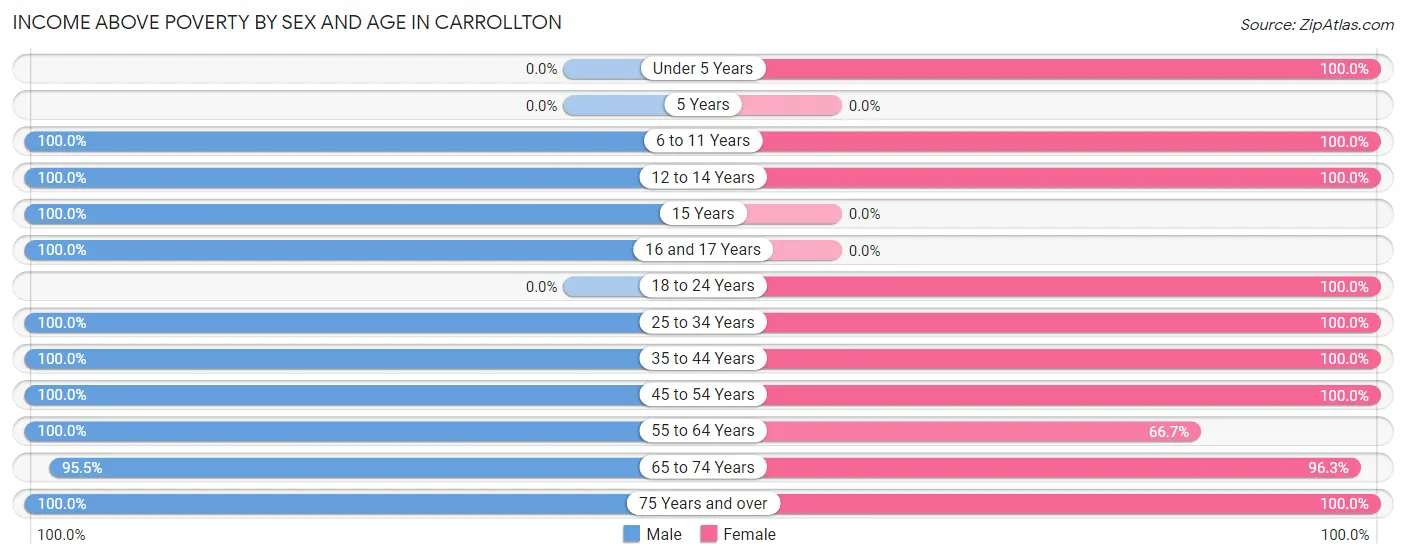
| Age Bracket | Male | Female |
| Under 5 Years | 0 (0.0%) | 4 (100.0%) |
| 5 Years | 0 (0.0%) | 0 (0.0%) |
| 6 to 11 Years | 9 (100.0%) | 13 (100.0%) |
| 12 to 14 Years | 34 (100.0%) | 10 (100.0%) |
| 15 Years | 3 (100.0%) | 0 (0.0%) |
| 16 and 17 Years | 83 (100.0%) | 0 (0.0%) |
| 18 to 24 Years | 0 (0.0%) | 1 (100.0%) |
| 25 to 34 Years | 22 (100.0%) | 9 (100.0%) |
| 35 to 44 Years | 11 (100.0%) | 27 (100.0%) |
| 45 to 54 Years | 14 (100.0%) | 60 (100.0%) |
| 55 to 64 Years | 7 (100.0%) | 6 (66.7%) |
| 65 to 74 Years | 21 (95.5%) | 26 (96.3%) |
| 75 Years and over | 9 (100.0%) | 17 (100.0%) |
| Total | 213 (99.5%) | 173 (97.7%) |
Income Below Poverty Among Married-Couple Families in Carrollton
The poverty statistics for married-couple families in Carrollton show that 1.9% or 1 of the total 52 families live below the poverty line. Families with no children have the highest poverty rate of 2.5%, comprising of 1 families. On the other hand, families with 1 or 2 children have the lowest poverty rate of 0.0%, which includes 0 families.
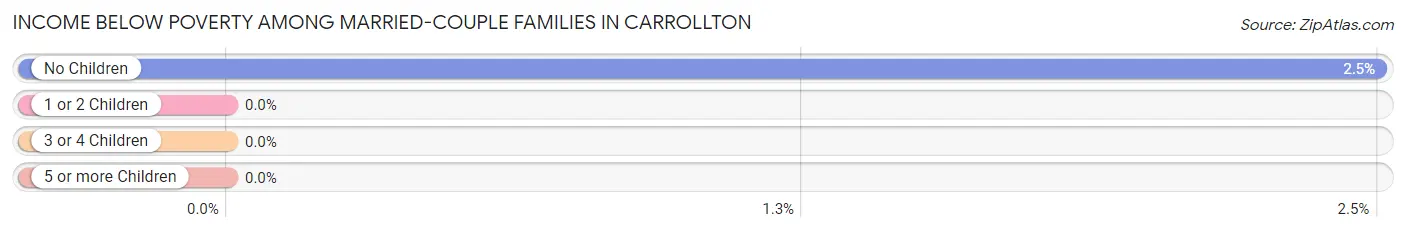
| Children | Above Poverty | Below Poverty |
| No Children | 39 (97.5%) | 1 (2.5%) |
| 1 or 2 Children | 12 (100.0%) | 0 (0.0%) |
| 3 or 4 Children | 0 (0.0%) | 0 (0.0%) |
| 5 or more Children | 0 (0.0%) | 0 (0.0%) |
| Total | 51 (98.1%) | 1 (1.9%) |
Income Below Poverty Among Single-Parent Households in Carrollton
| Children | Single Father | Single Mother |
| No Children | 0 (0.0%) | 0 (0.0%) |
| 1 or 2 Children | 0 (0.0%) | 0 (0.0%) |
| 3 or 4 Children | 0 (0.0%) | 0 (0.0%) |
| 5 or more Children | 0 (0.0%) | 0 (0.0%) |
| Total | 0 (0.0%) | 0 (0.0%) |
Income Below Poverty Among Married-Couple vs Single-Parent Households in Carrollton
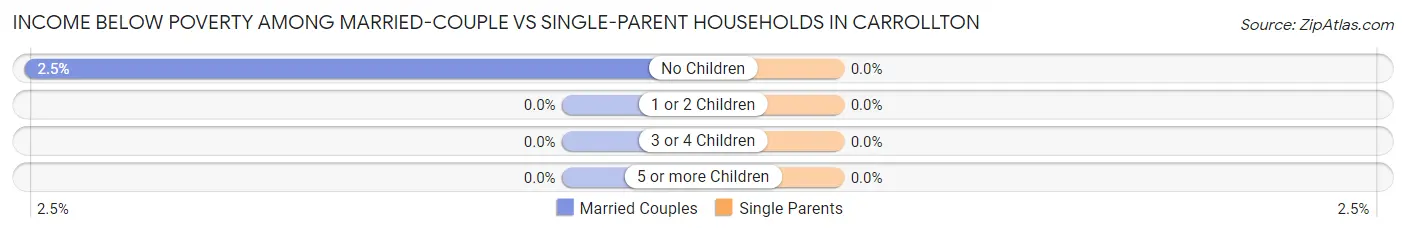
| Children | Married-Couple Families | Single-Parent Households |
| No Children | 1 (2.5%) | 0 (0.0%) |
| 1 or 2 Children | 0 (0.0%) | 0 (0.0%) |
| 3 or 4 Children | 0 (0.0%) | 0 (0.0%) |
| 5 or more Children | 0 (0.0%) | 0 (0.0%) |
| Total | 1 (1.9%) | 0 (0.0%) |
Race in Carrollton
The most populous races in Carrollton are White / Caucasian (375 | 86.2%), and Black / African American (60 | 13.8%).

| Race | # Population | % Population |
| Asian | 0 | 0.0% |
| Black / African American | 60 | 13.8% |
| Hawaiian / Pacific | 0 | 0.0% |
| Hispanic or Latino | 0 | 0.0% |
| Native / Alaskan | 0 | 0.0% |
| White / Caucasian | 375 | 86.2% |
| Two or more Races | 0 | 0.0% |
| Some other Race | 0 | 0.0% |
| Total | 435 | 100.0% |
Ancestry in Carrollton
The most populous ancestries reported in Carrollton are English (198 | 45.5%), American (79 | 18.2%), Irish (12 | 2.8%), French (2 | 0.5%), and German (2 | 0.5%), together accounting for 67.4% of all Carrollton residents.
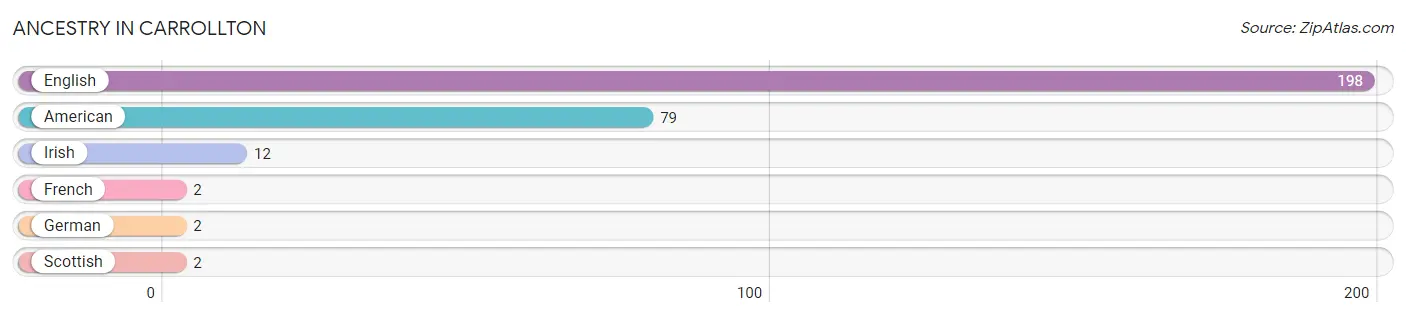
| Ancestry | # Population | % Population |
| American | 79 | 18.2% |
| English | 198 | 45.5% |
| French | 2 | 0.5% |
| German | 2 | 0.5% |
| Irish | 12 | 2.8% |
| Scottish | 2 | 0.5% | View All 6 Rows |
Immigrants in Carrollton

| Immigration Origin | # Population | % Population | View All 0 Rows |
Sex and Age in Carrollton
Sex and Age in Carrollton
The most populous age groups in Carrollton are 15 to 19 Years (86 | 34.5%) for men and 45 to 49 Years (54 | 29.0%) for women.
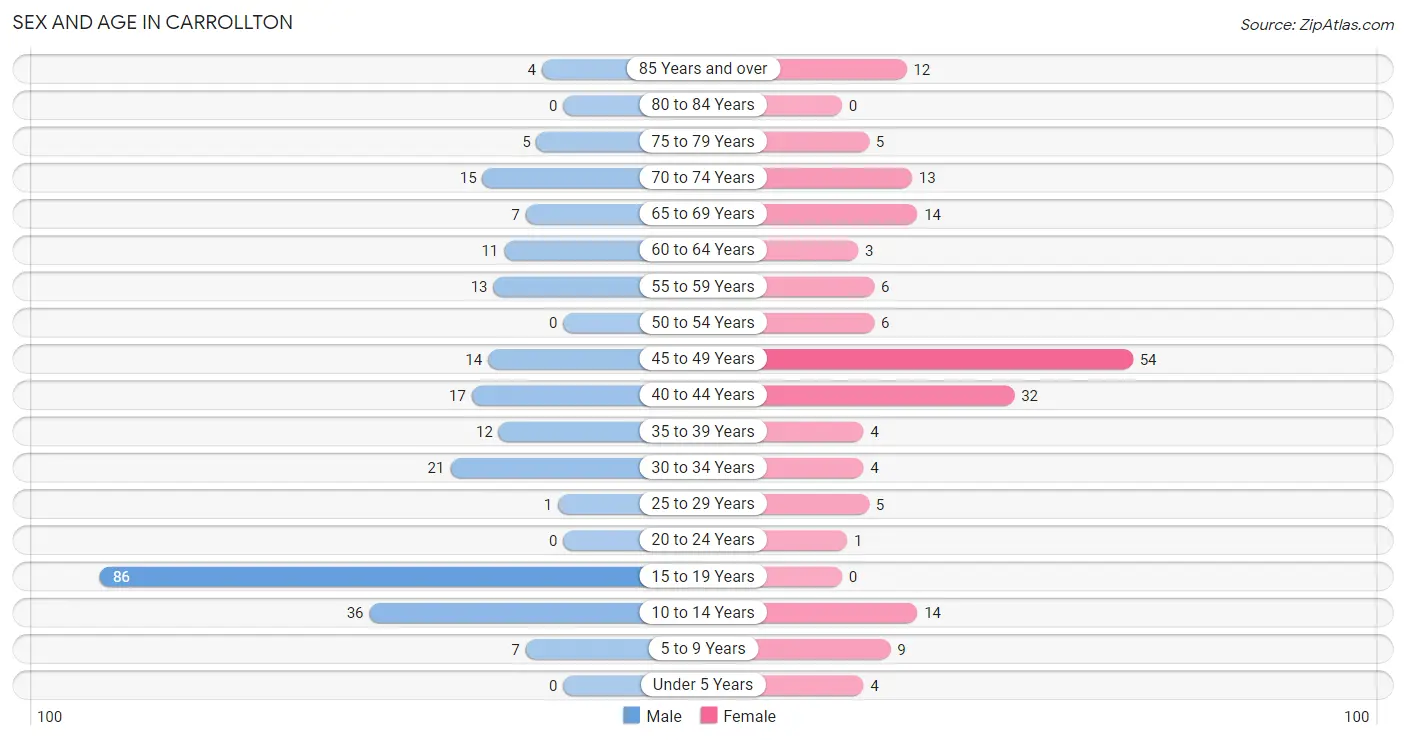
| Age Bracket | Male | Female |
| Under 5 Years | 0 (0.0%) | 4 (2.1%) |
| 5 to 9 Years | 7 (2.8%) | 9 (4.8%) |
| 10 to 14 Years | 36 (14.5%) | 14 (7.5%) |
| 15 to 19 Years | 86 (34.5%) | 0 (0.0%) |
| 20 to 24 Years | 0 (0.0%) | 1 (0.5%) |
| 25 to 29 Years | 1 (0.4%) | 5 (2.7%) |
| 30 to 34 Years | 21 (8.4%) | 4 (2.1%) |
| 35 to 39 Years | 12 (4.8%) | 4 (2.1%) |
| 40 to 44 Years | 17 (6.8%) | 32 (17.2%) |
| 45 to 49 Years | 14 (5.6%) | 54 (29.0%) |
| 50 to 54 Years | 0 (0.0%) | 6 (3.2%) |
| 55 to 59 Years | 13 (5.2%) | 6 (3.2%) |
| 60 to 64 Years | 11 (4.4%) | 3 (1.6%) |
| 65 to 69 Years | 7 (2.8%) | 14 (7.5%) |
| 70 to 74 Years | 15 (6.0%) | 13 (7.0%) |
| 75 to 79 Years | 5 (2.0%) | 5 (2.7%) |
| 80 to 84 Years | 0 (0.0%) | 0 (0.0%) |
| 85 Years and over | 4 (1.6%) | 12 (6.5%) |
| Total | 249 (100.0%) | 186 (100.0%) |
Families and Households in Carrollton
Median Family Size in Carrollton
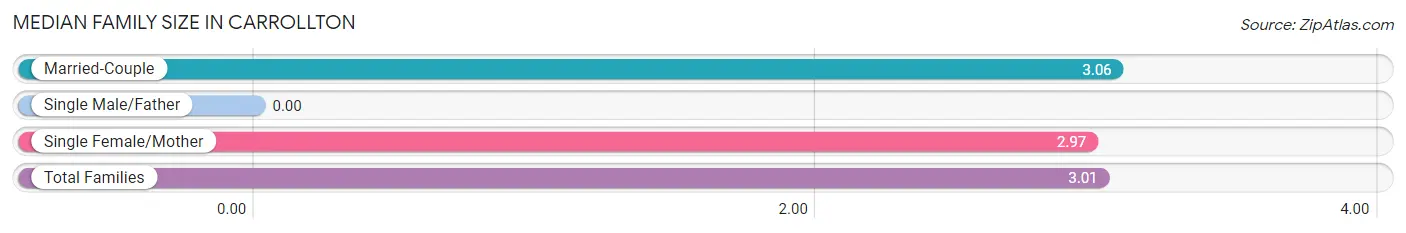
| Family Type | # Families | Family Size |
| Married-Couple | 52 (42.6%) | 3.06 |
| Single Male/Father | 0 (0.0%) | - |
| Single Female/Mother | 70 (57.4%) | 2.97 |
| Total Families | 122 (100.0%) | 3.01 |
Median Household Size in Carrollton
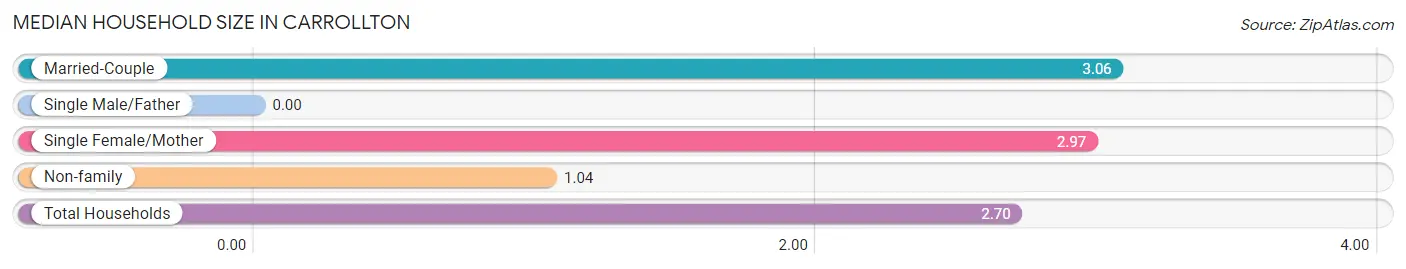
| Household Type | # Households | Household Size |
| Married-Couple | 52 (35.9%) | 3.06 |
| Single Male/Father | 0 (0.0%) | - |
| Single Female/Mother | 70 (48.3%) | 2.97 |
| Non-family | 23 (15.9%) | 1.04 |
| Total Households | 145 (100.0%) | 2.70 |
Household Size by Marriage Status in Carrollton
Out of a total of 145 households in Carrollton, 122 (84.1%) are family households, while 23 (15.9%) are nonfamily households. The most numerous type of family households are 3-person households, comprising 78, and the most common type of nonfamily households are 1-person households, comprising 22.
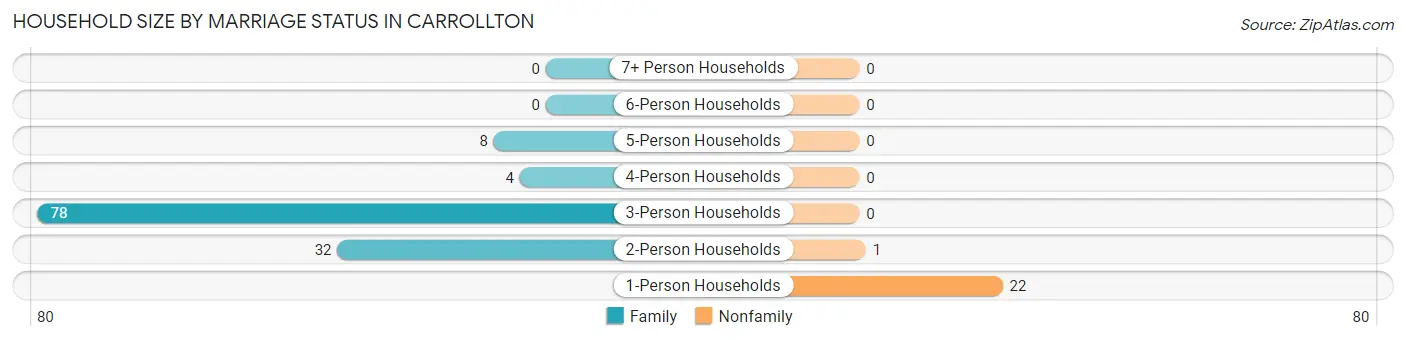
| Household Size | Family Households | Nonfamily Households |
| 1-Person Households | - | 22 (15.2%) |
| 2-Person Households | 32 (22.1%) | 1 (0.7%) |
| 3-Person Households | 78 (53.8%) | 0 (0.0%) |
| 4-Person Households | 4 (2.8%) | 0 (0.0%) |
| 5-Person Households | 8 (5.5%) | 0 (0.0%) |
| 6-Person Households | 0 (0.0%) | 0 (0.0%) |
| 7+ Person Households | 0 (0.0%) | 0 (0.0%) |
| Total | 122 (84.1%) | 23 (15.9%) |
Female Fertility in Carrollton
Fertility by Age in Carrollton
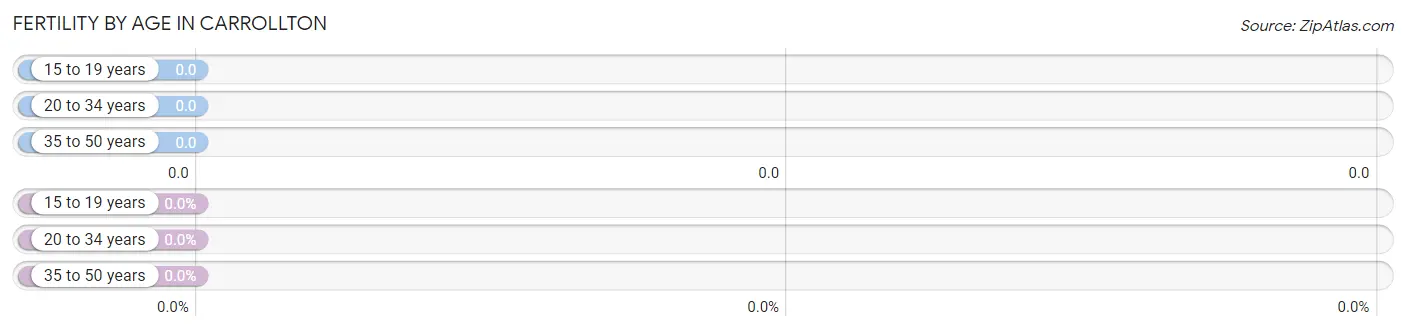
| Age Bracket | Women with Births | Births / 1,000 Women |
| 15 to 19 years | 0 (0.0%) | 0.0 |
| 20 to 34 years | 0 (0.0%) | 0.0 |
| 35 to 50 years | 0 (0.0%) | 0.0 |
| Total | 0 (0.0%) | 0.0 |
Fertility by Age by Marriage Status in Carrollton
| Age Bracket | Married | Unmarried |
| 15 to 19 years | 0 (0.0%) | 0 (0.0%) |
| 20 to 34 years | 0 (0.0%) | 0 (0.0%) |
| 35 to 50 years | 0 (0.0%) | 0 (0.0%) |
| Total | 0 (0.0%) | 0 (0.0%) |
Fertility by Education in Carrollton
| Educational Attainment | Women with Births | Births / 1,000 Women |
| Less than High School | 0 (0.0%) | 0.0 |
| High School Diploma | 0 (0.0%) | 0.0 |
| College or Associate's Degree | 0 (0.0%) | 0.0 |
| Bachelor's Degree | 0 (0.0%) | 0.0 |
| Graduate Degree | 0 (0.0%) | 0.0 |
| Total | 0 (0.0%) | 0.0 |
Fertility by Education by Marriage Status in Carrollton
| Educational Attainment | Married | Unmarried |
| Less than High School | 0 (0.0%) | 0 (0.0%) |
| High School Diploma | 0 (0.0%) | 0 (0.0%) |
| College or Associate's Degree | 0 (0.0%) | 0 (0.0%) |
| Bachelor's Degree | 0 (0.0%) | 0 (0.0%) |
| Graduate Degree | 0 (0.0%) | 0 (0.0%) |
| Total | 0 (0.0%) | 0 (0.0%) |
Employment Characteristics in Carrollton
Employment by Class of Employer in Carrollton
Among the 160 employed individuals in Carrollton, private company employees (64 | 40.0%), local government employees (57 | 35.6%), and state government employees (20 | 12.5%) make up the most common classes of employment.
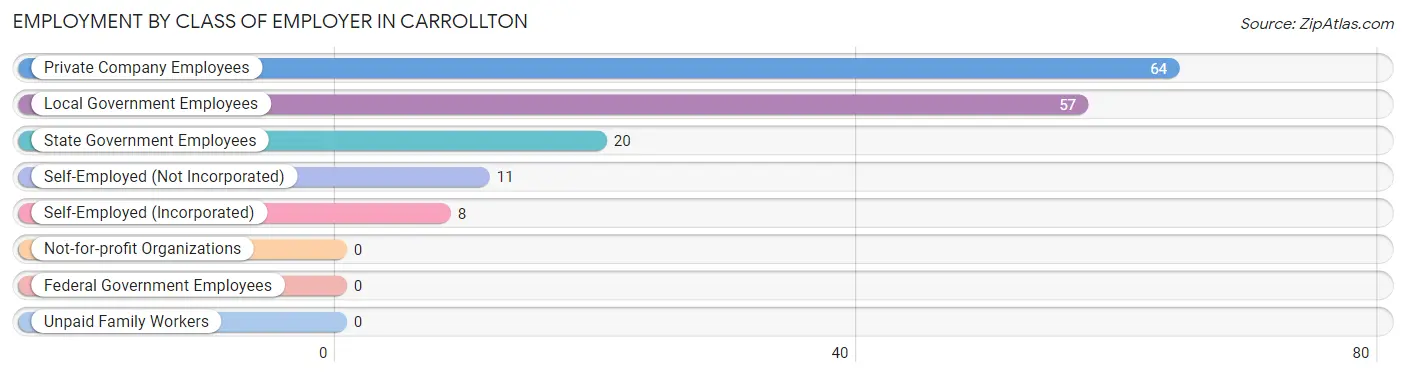
| Employer Class | # Employees | % Employees |
| Private Company Employees | 64 | 40.0% |
| Self-Employed (Incorporated) | 8 | 5.0% |
| Self-Employed (Not Incorporated) | 11 | 6.9% |
| Not-for-profit Organizations | 0 | 0.0% |
| Local Government Employees | 57 | 35.6% |
| State Government Employees | 20 | 12.5% |
| Federal Government Employees | 0 | 0.0% |
| Unpaid Family Workers | 0 | 0.0% |
| Total | 160 | 100.0% |
Employment Status by Age in Carrollton
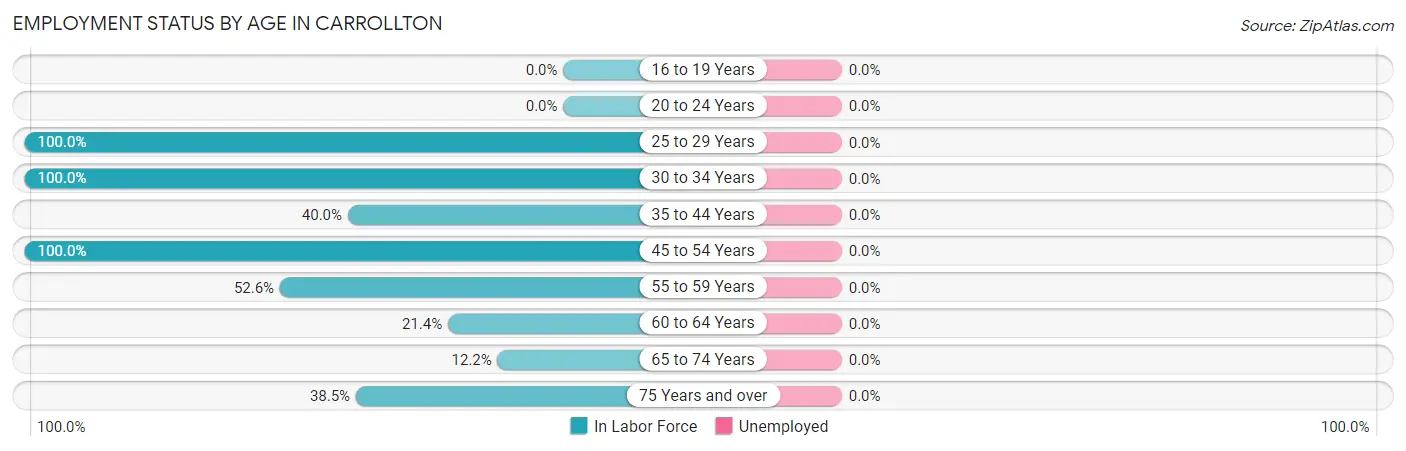
| Age Bracket | In Labor Force | Unemployed |
| 16 to 19 Years | 0 (0.0%) | 0 (0.0%) |
| 20 to 24 Years | 0 (0.0%) | 0 (0.0%) |
| 25 to 29 Years | 6 (100.0%) | 0 (0.0%) |
| 30 to 34 Years | 25 (100.0%) | 0 (0.0%) |
| 35 to 44 Years | 26 (40.0%) | 0 (0.0%) |
| 45 to 54 Years | 74 (100.0%) | 0 (0.0%) |
| 55 to 59 Years | 10 (52.6%) | 0 (0.0%) |
| 60 to 64 Years | 3 (21.4%) | 0 (0.0%) |
| 65 to 74 Years | 6 (12.2%) | 0 (0.0%) |
| 75 Years and over | 10 (38.5%) | 0 (0.0%) |
| Total | 160 (44.2%) | 0 (0.0%) |
Employment Status by Educational Attainment in Carrollton
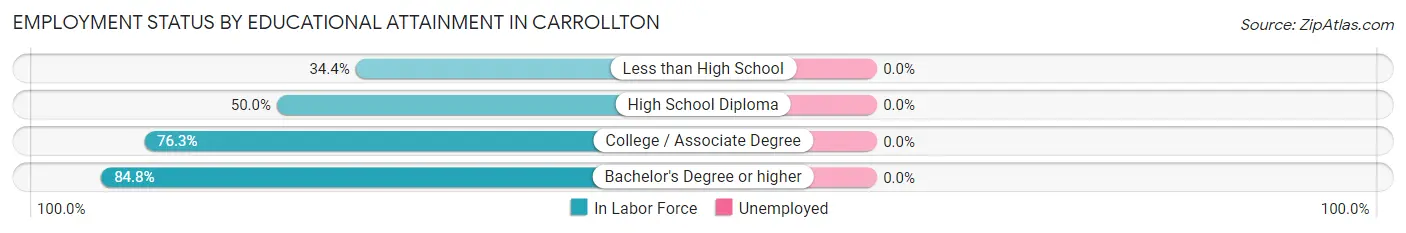
| Educational Attainment | In Labor Force | Unemployed |
| Less than High School | 11 (34.4%) | 0 (0.0%) |
| High School Diploma | 8 (50.0%) | 0 (0.0%) |
| College / Associate Degree | 58 (76.3%) | 0 (0.0%) |
| Bachelor's Degree or higher | 67 (84.8%) | 0 (0.0%) |
| Total | 144 (70.9%) | 0 (0.0%) |
Employment Occupations by Sex in Carrollton
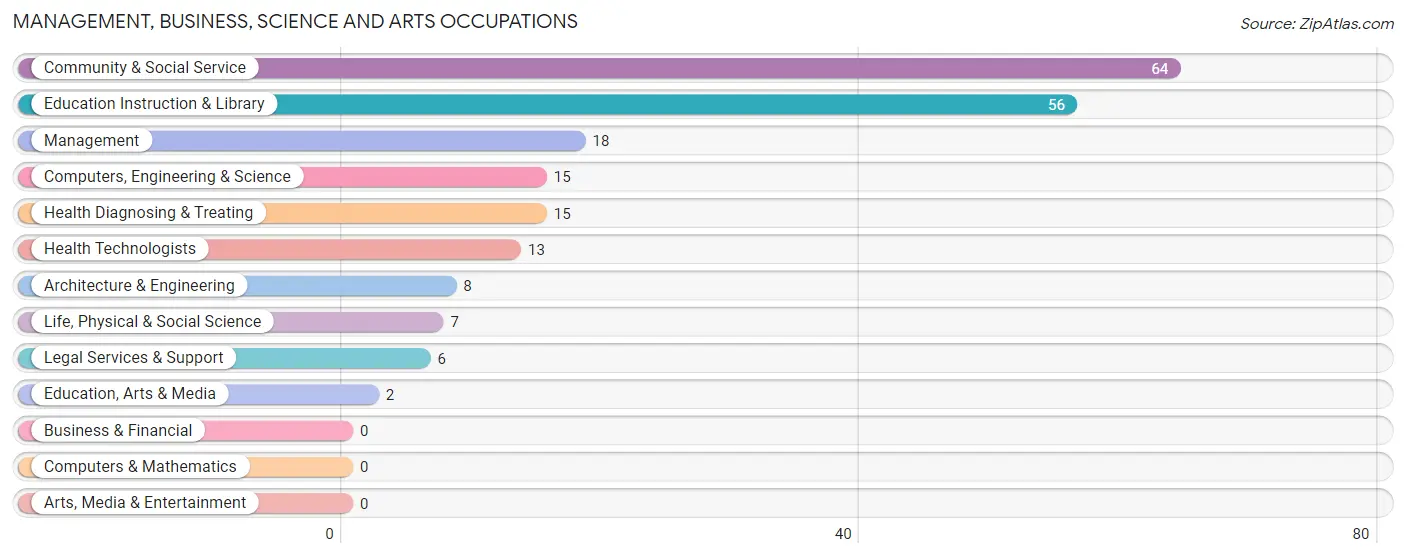
Management, Business, Science and Arts Occupations
The most common Management, Business, Science and Arts occupations in Carrollton are Community & Social Service (64 | 40.0%), Education Instruction & Library (56 | 35.0%), Management (18 | 11.3%), Computers, Engineering & Science (15 | 9.4%), and Health Diagnosing & Treating (15 | 9.4%).
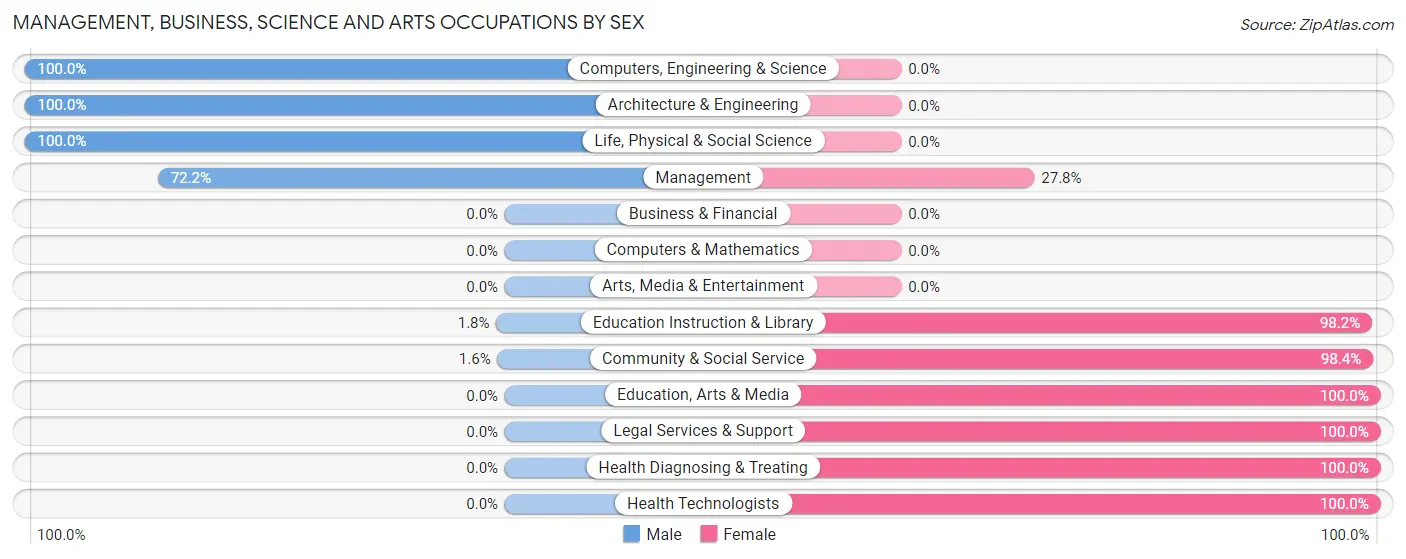
Management, Business, Science and Arts Occupations by Sex
Within the Management, Business, Science and Arts occupations in Carrollton, the most male-oriented occupations are Computers, Engineering & Science (100.0%), Architecture & Engineering (100.0%), and Life, Physical & Social Science (100.0%), while the most female-oriented occupations are Education, Arts & Media (100.0%), Legal Services & Support (100.0%), and Health Diagnosing & Treating (100.0%).
| Occupation | Male | Female |
| Management | 13 (72.2%) | 5 (27.8%) |
| Business & Financial | 0 (0.0%) | 0 (0.0%) |
| Computers, Engineering & Science | 15 (100.0%) | 0 (0.0%) |
| Computers & Mathematics | 0 (0.0%) | 0 (0.0%) |
| Architecture & Engineering | 8 (100.0%) | 0 (0.0%) |
| Life, Physical & Social Science | 7 (100.0%) | 0 (0.0%) |
| Community & Social Service | 1 (1.6%) | 63 (98.4%) |
| Education, Arts & Media | 0 (0.0%) | 2 (100.0%) |
| Legal Services & Support | 0 (0.0%) | 6 (100.0%) |
| Education Instruction & Library | 1 (1.8%) | 55 (98.2%) |
| Arts, Media & Entertainment | 0 (0.0%) | 0 (0.0%) |
| Health Diagnosing & Treating | 0 (0.0%) | 15 (100.0%) |
| Health Technologists | 0 (0.0%) | 13 (100.0%) |
| Total (Category) | 29 (25.9%) | 83 (74.1%) |
| Total (Overall) | 67 (41.9%) | 93 (58.1%) |
Services Occupations
The most common Services occupations in Carrollton are Healthcare Support (4 | 2.5%), and Personal Care & Service (4 | 2.5%).
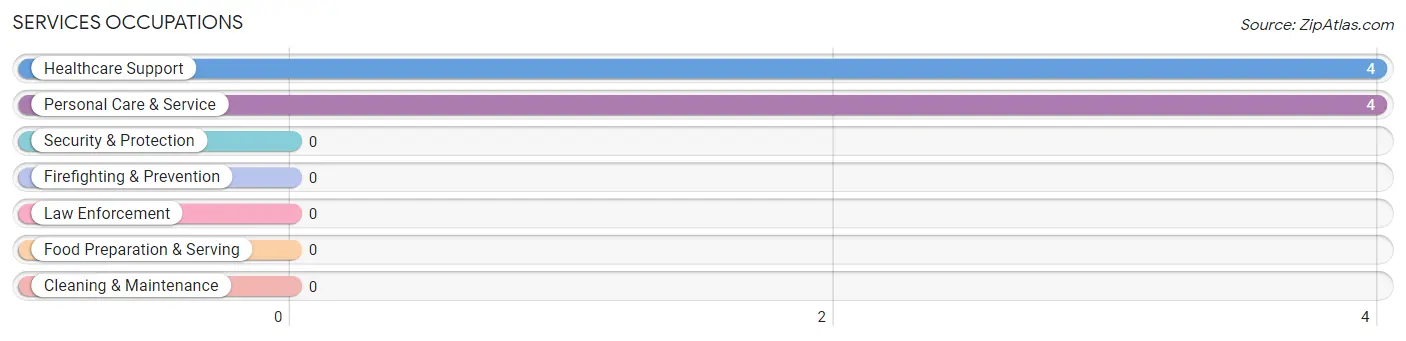
Services Occupations by Sex
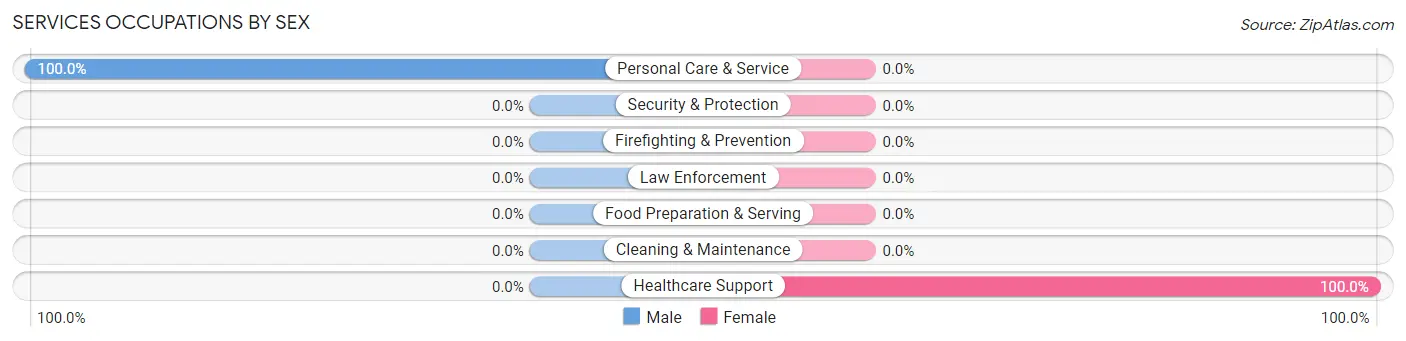
| Occupation | Male | Female |
| Healthcare Support | 0 (0.0%) | 4 (100.0%) |
| Security & Protection | 0 (0.0%) | 0 (0.0%) |
| Firefighting & Prevention | 0 (0.0%) | 0 (0.0%) |
| Law Enforcement | 0 (0.0%) | 0 (0.0%) |
| Food Preparation & Serving | 0 (0.0%) | 0 (0.0%) |
| Cleaning & Maintenance | 0 (0.0%) | 0 (0.0%) |
| Personal Care & Service | 4 (100.0%) | 0 (0.0%) |
| Total (Category) | 4 (50.0%) | 4 (50.0%) |
| Total (Overall) | 67 (41.9%) | 93 (58.1%) |
Sales and Office Occupations
The most common Sales and Office occupations in Carrollton are , and Office & Administration (8 | 5.0%).
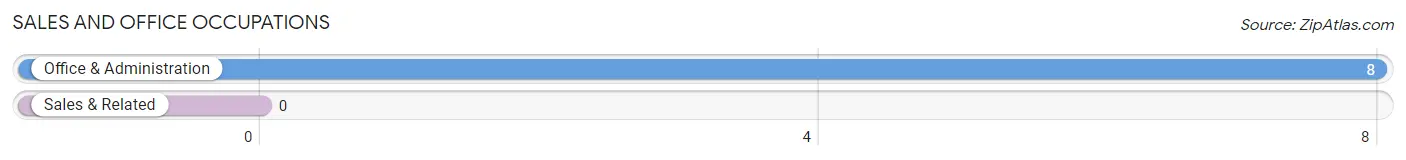
Sales and Office Occupations by Sex
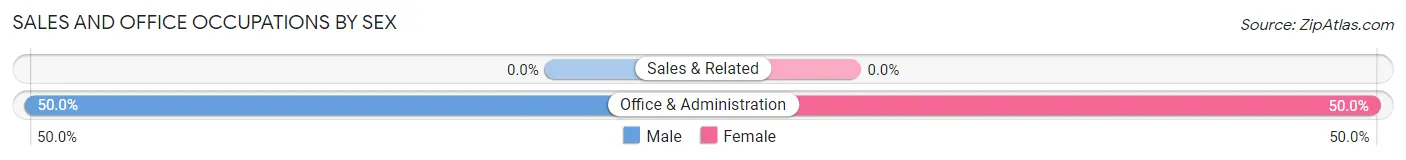
| Occupation | Male | Female |
| Sales & Related | 0 (0.0%) | 0 (0.0%) |
| Office & Administration | 4 (50.0%) | 4 (50.0%) |
| Total (Category) | 4 (50.0%) | 4 (50.0%) |
| Total (Overall) | 67 (41.9%) | 93 (58.1%) |
Natural Resources, Construction and Maintenance Occupations
The most common Natural Resources, Construction and Maintenance occupations in Carrollton are , and Installation, Maintenance & Repair (17 | 10.6%).
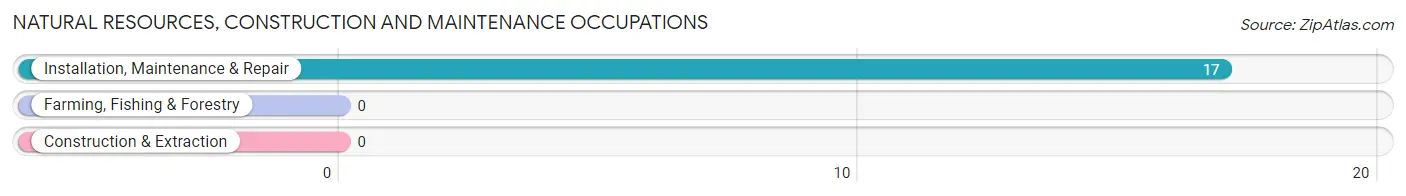
Natural Resources, Construction and Maintenance Occupations by Sex
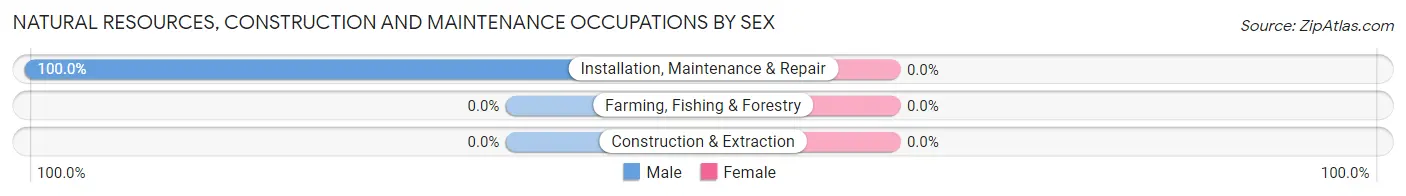
| Occupation | Male | Female |
| Farming, Fishing & Forestry | 0 (0.0%) | 0 (0.0%) |
| Construction & Extraction | 0 (0.0%) | 0 (0.0%) |
| Installation, Maintenance & Repair | 17 (100.0%) | 0 (0.0%) |
| Total (Category) | 17 (100.0%) | 0 (0.0%) |
| Total (Overall) | 67 (41.9%) | 93 (58.1%) |
Production, Transportation and Moving Occupations
The most common Production, Transportation and Moving occupations in Carrollton are Transportation (8 | 5.0%), and Production (7 | 4.4%).
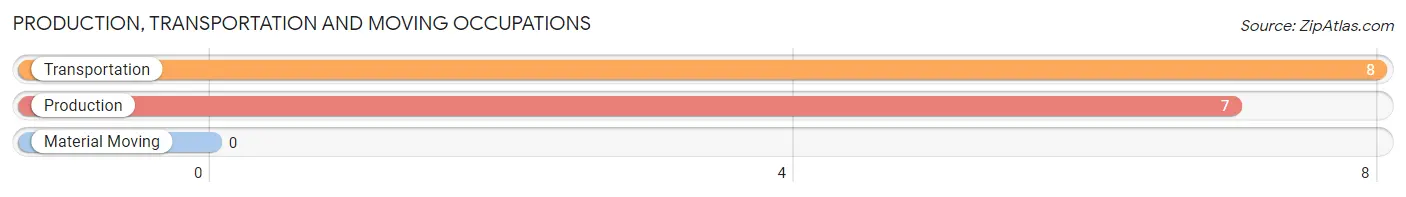
Production, Transportation and Moving Occupations by Sex
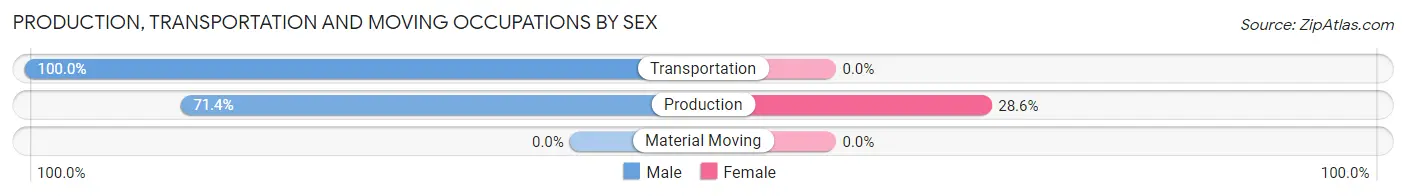
| Occupation | Male | Female |
| Production | 5 (71.4%) | 2 (28.6%) |
| Transportation | 8 (100.0%) | 0 (0.0%) |
| Material Moving | 0 (0.0%) | 0 (0.0%) |
| Total (Category) | 13 (86.7%) | 2 (13.3%) |
| Total (Overall) | 67 (41.9%) | 93 (58.1%) |
Employment Industries by Sex in Carrollton
Employment Industries in Carrollton
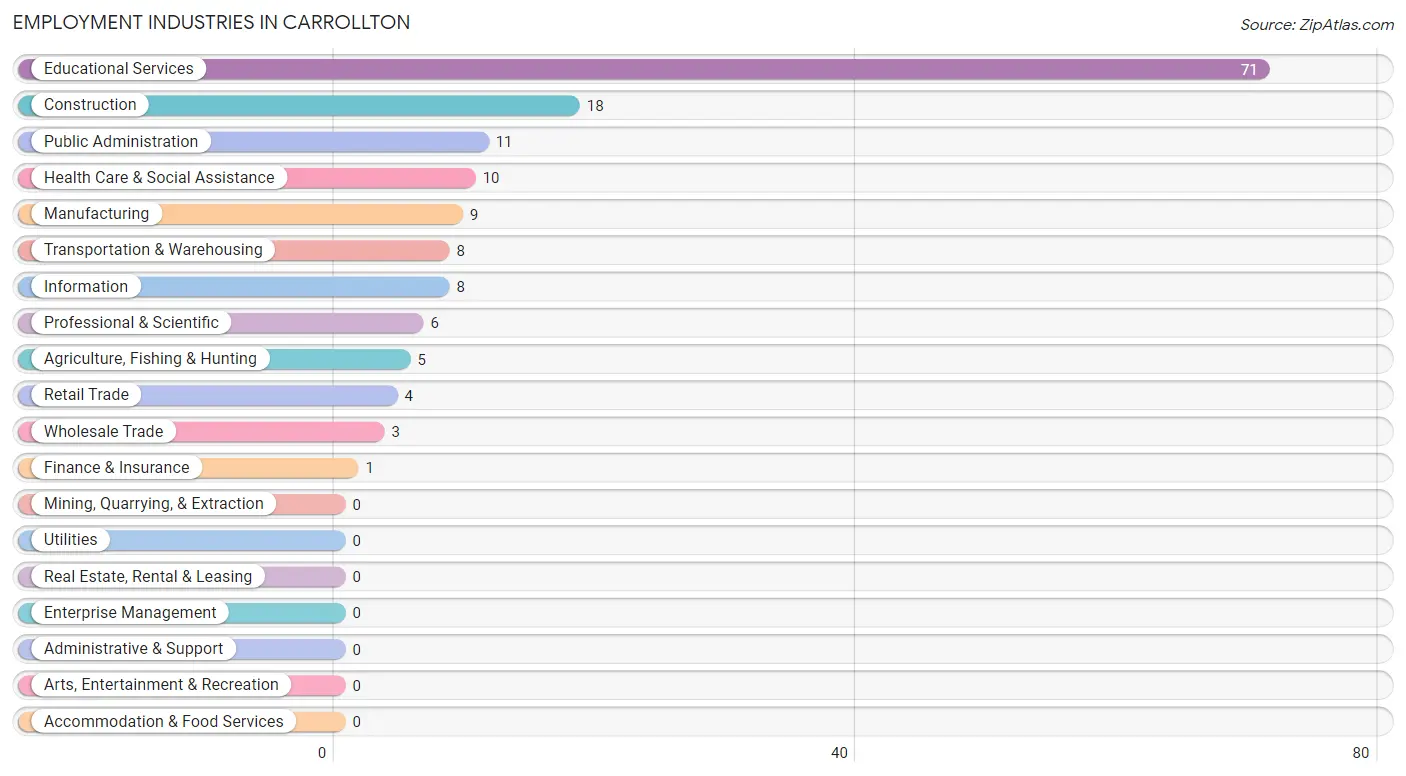
The major employment industries in Carrollton include Educational Services (71 | 44.4%), Construction (18 | 11.3%), Public Administration (11 | 6.9%), Health Care & Social Assistance (10 | 6.2%), and Manufacturing (9 | 5.6%).
Employment Industries by Sex in Carrollton
The Carrollton industries that see more men than women are Agriculture, Fishing & Hunting (100.0%), Construction (100.0%), and Wholesale Trade (100.0%), whereas the industries that tend to have a higher number of women are Finance & Insurance (100.0%), Professional & Scientific (100.0%), and Health Care & Social Assistance (100.0%).

| Industry | Male | Female |
| Agriculture, Fishing & Hunting | 5 (100.0%) | 0 (0.0%) |
| Mining, Quarrying, & Extraction | 0 (0.0%) | 0 (0.0%) |
| Construction | 18 (100.0%) | 0 (0.0%) |
| Manufacturing | 7 (77.8%) | 2 (22.2%) |
| Wholesale Trade | 3 (100.0%) | 0 (0.0%) |
| Retail Trade | 4 (100.0%) | 0 (0.0%) |
| Transportation & Warehousing | 8 (100.0%) | 0 (0.0%) |
| Utilities | 0 (0.0%) | 0 (0.0%) |
| Information | 8 (100.0%) | 0 (0.0%) |
| Finance & Insurance | 0 (0.0%) | 1 (100.0%) |
| Real Estate, Rental & Leasing | 0 (0.0%) | 0 (0.0%) |
| Professional & Scientific | 0 (0.0%) | 6 (100.0%) |
| Enterprise Management | 0 (0.0%) | 0 (0.0%) |
| Administrative & Support | 0 (0.0%) | 0 (0.0%) |
| Educational Services | 1 (1.4%) | 70 (98.6%) |
| Health Care & Social Assistance | 0 (0.0%) | 10 (100.0%) |
| Arts, Entertainment & Recreation | 0 (0.0%) | 0 (0.0%) |
| Accommodation & Food Services | 0 (0.0%) | 0 (0.0%) |
| Public Administration | 7 (63.6%) | 4 (36.4%) |
| Total | 67 (41.9%) | 93 (58.1%) |
Education in Carrollton
School Enrollment in Carrollton
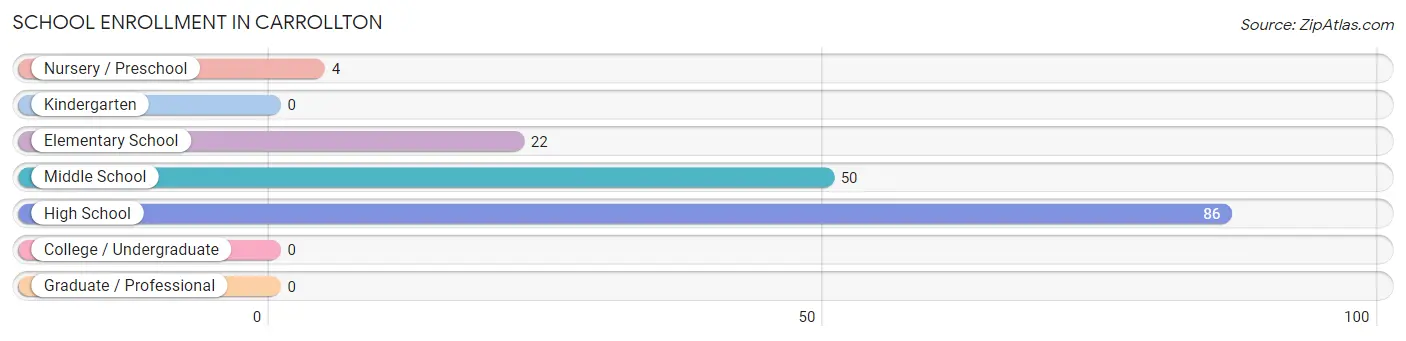
The most common levels of schooling among the 162 students in Carrollton are high school (86 | 53.1%), middle school (50 | 30.9%), and elementary school (22 | 13.6%).
| School Level | # Students | % Students |
| Nursery / Preschool | 4 | 2.5% |
| Kindergarten | 0 | 0.0% |
| Elementary School | 22 | 13.6% |
| Middle School | 50 | 30.9% |
| High School | 86 | 53.1% |
| College / Undergraduate | 0 | 0.0% |
| Graduate / Professional | 0 | 0.0% |
| Total | 162 | 100.0% |
School Enrollment by Age by Funding Source in Carrollton
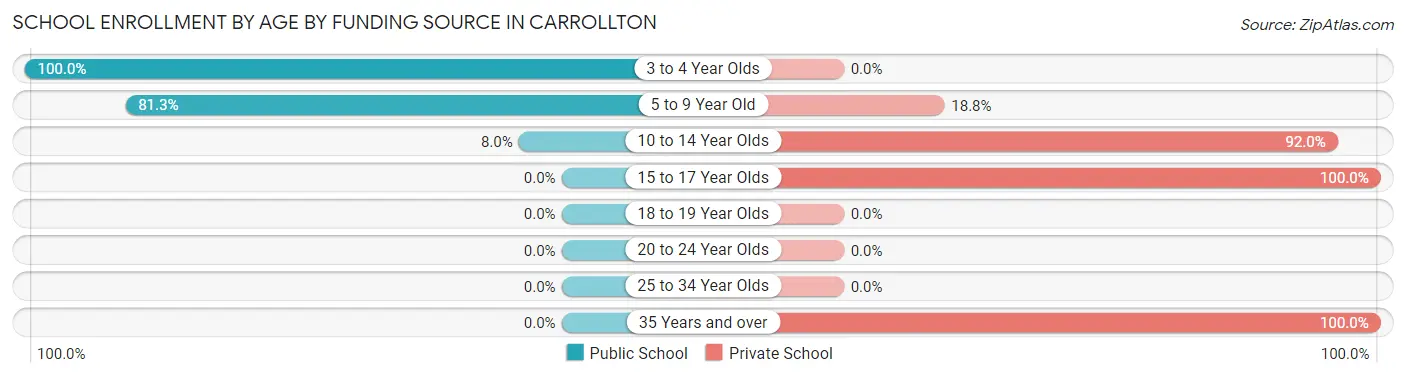
Out of a total of 162 students who are enrolled in schools in Carrollton, 141 (87.0%) attend a private institution, while the remaining 21 (13.0%) are enrolled in public schools. The age group of 15 to 17 year olds has the highest likelihood of being enrolled in private schools, with 86 (100.0% in the age bracket) enrolled. Conversely, the age group of 3 to 4 year olds has the lowest likelihood of being enrolled in a private school, with 4 (100.0% in the age bracket) attending a public institution.
| Age Bracket | Public School | Private School |
| 3 to 4 Year Olds | 4 (100.0%) | 0 (0.0%) |
| 5 to 9 Year Old | 13 (81.2%) | 3 (18.8%) |
| 10 to 14 Year Olds | 4 (8.0%) | 46 (92.0%) |
| 15 to 17 Year Olds | 0 (0.0%) | 86 (100.0%) |
| 18 to 19 Year Olds | 0 (0.0%) | 0 (0.0%) |
| 20 to 24 Year Olds | 0 (0.0%) | 0 (0.0%) |
| 25 to 34 Year Olds | 0 (0.0%) | 0 (0.0%) |
| 35 Years and over | 0 (0.0%) | 6 (100.0%) |
| Total | 21 (13.0%) | 141 (87.0%) |
Educational Attainment by Field of Study in Carrollton
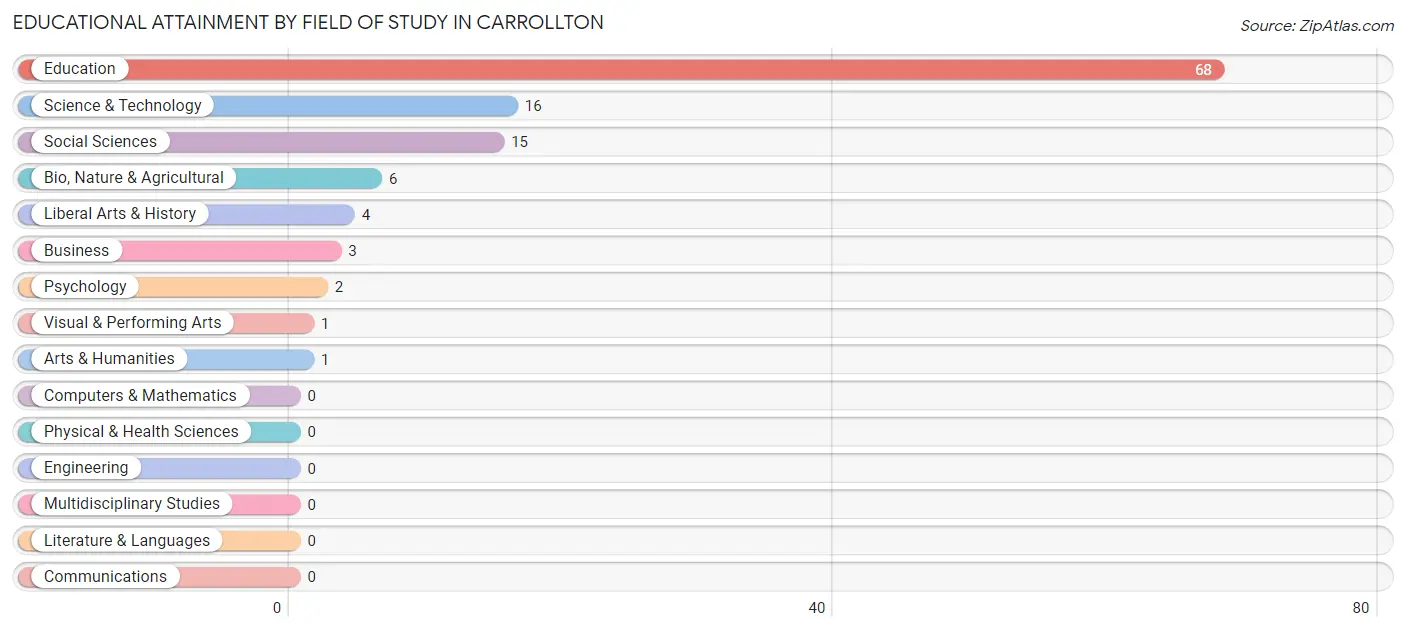
Education (68 | 58.6%), science & technology (16 | 13.8%), social sciences (15 | 12.9%), bio, nature & agricultural (6 | 5.2%), and liberal arts & history (4 | 3.5%) are the most common fields of study among 116 individuals in Carrollton who have obtained a bachelor's degree or higher.
| Field of Study | # Graduates | % Graduates |
| Computers & Mathematics | 0 | 0.0% |
| Bio, Nature & Agricultural | 6 | 5.2% |
| Physical & Health Sciences | 0 | 0.0% |
| Psychology | 2 | 1.7% |
| Social Sciences | 15 | 12.9% |
| Engineering | 0 | 0.0% |
| Multidisciplinary Studies | 0 | 0.0% |
| Science & Technology | 16 | 13.8% |
| Business | 3 | 2.6% |
| Education | 68 | 58.6% |
| Literature & Languages | 0 | 0.0% |
| Liberal Arts & History | 4 | 3.5% |
| Visual & Performing Arts | 1 | 0.9% |
| Communications | 0 | 0.0% |
| Arts & Humanities | 1 | 0.9% |
| Total | 116 | 100.0% |
Transportation & Commute in Carrollton
Vehicle Availability by Sex in Carrollton
The most prevalent vehicle ownership categories in Carrollton are males with 3 vehicles (26, accounting for 38.8%) and females with 3 vehicles (9, making up 28.0%).
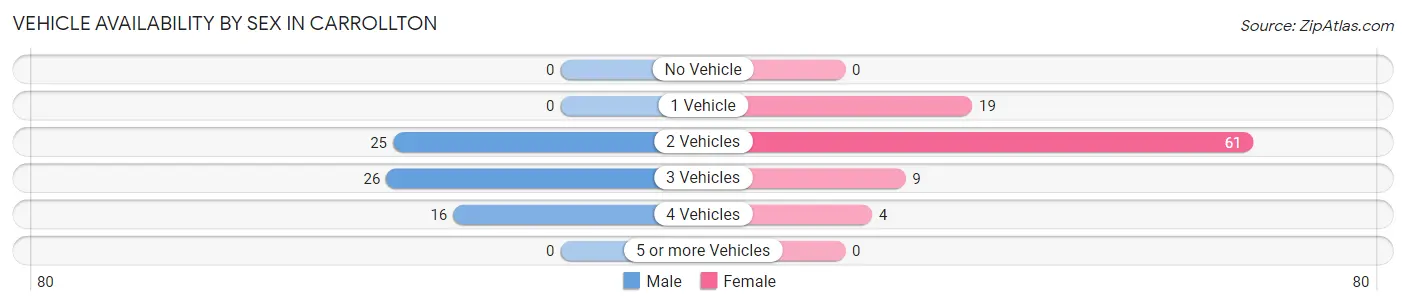
| Vehicles Available | Male | Female |
| No Vehicle | 0 (0.0%) | 0 (0.0%) |
| 1 Vehicle | 0 (0.0%) | 19 (20.4%) |
| 2 Vehicles | 25 (37.3%) | 61 (65.6%) |
| 3 Vehicles | 26 (38.8%) | 9 (9.7%) |
| 4 Vehicles | 16 (23.9%) | 4 (4.3%) |
| 5 or more Vehicles | 0 (0.0%) | 0 (0.0%) |
| Total | 67 (100.0%) | 93 (100.0%) |
Commute Time in Carrollton
The most frequently occuring commute durations in Carrollton are 35 to 39 minutes (53 commuters, 33.8%), 20 to 24 minutes (49 commuters, 31.2%), and less than 5 minutes (16 commuters, 10.2%).
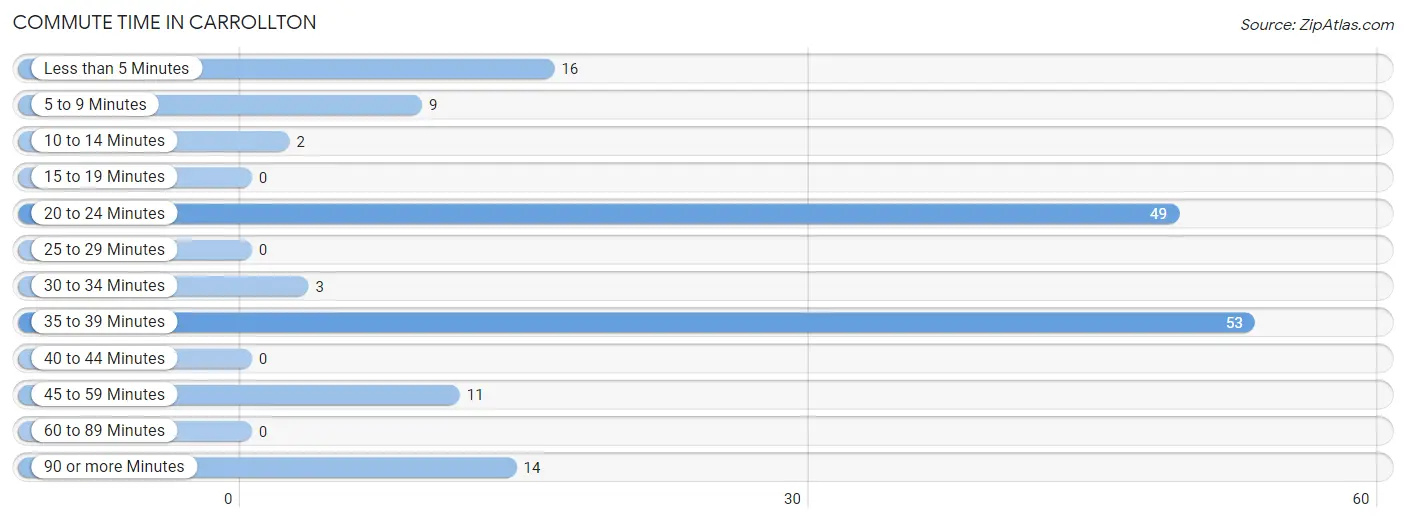
| Commute Time | # Commuters | % Commuters |
| Less than 5 Minutes | 16 | 10.2% |
| 5 to 9 Minutes | 9 | 5.7% |
| 10 to 14 Minutes | 2 | 1.3% |
| 15 to 19 Minutes | 0 | 0.0% |
| 20 to 24 Minutes | 49 | 31.2% |
| 25 to 29 Minutes | 0 | 0.0% |
| 30 to 34 Minutes | 3 | 1.9% |
| 35 to 39 Minutes | 53 | 33.8% |
| 40 to 44 Minutes | 0 | 0.0% |
| 45 to 59 Minutes | 11 | 7.0% |
| 60 to 89 Minutes | 0 | 0.0% |
| 90 or more Minutes | 14 | 8.9% |
Commute Time by Sex in Carrollton
The most common commute times in Carrollton are 20 to 24 minutes (43 commuters, 64.2%) for males and 35 to 39 minutes (53 commuters, 58.9%) for females.

| Commute Time | Male | Female |
| Less than 5 Minutes | 5 (7.5%) | 11 (12.2%) |
| 5 to 9 Minutes | 3 (4.5%) | 6 (6.7%) |
| 10 to 14 Minutes | 0 (0.0%) | 2 (2.2%) |
| 15 to 19 Minutes | 0 (0.0%) | 0 (0.0%) |
| 20 to 24 Minutes | 43 (64.2%) | 6 (6.7%) |
| 25 to 29 Minutes | 0 (0.0%) | 0 (0.0%) |
| 30 to 34 Minutes | 3 (4.5%) | 0 (0.0%) |
| 35 to 39 Minutes | 0 (0.0%) | 53 (58.9%) |
| 40 to 44 Minutes | 0 (0.0%) | 0 (0.0%) |
| 45 to 59 Minutes | 5 (7.5%) | 6 (6.7%) |
| 60 to 89 Minutes | 0 (0.0%) | 0 (0.0%) |
| 90 or more Minutes | 8 (11.9%) | 6 (6.7%) |
Time of Departure to Work by Sex in Carrollton
The most frequent times of departure to work in Carrollton are 8:00 AM to 8:29 AM (20, 29.8%) for males and 6:30 AM to 6:59 AM (57, 63.3%) for females.
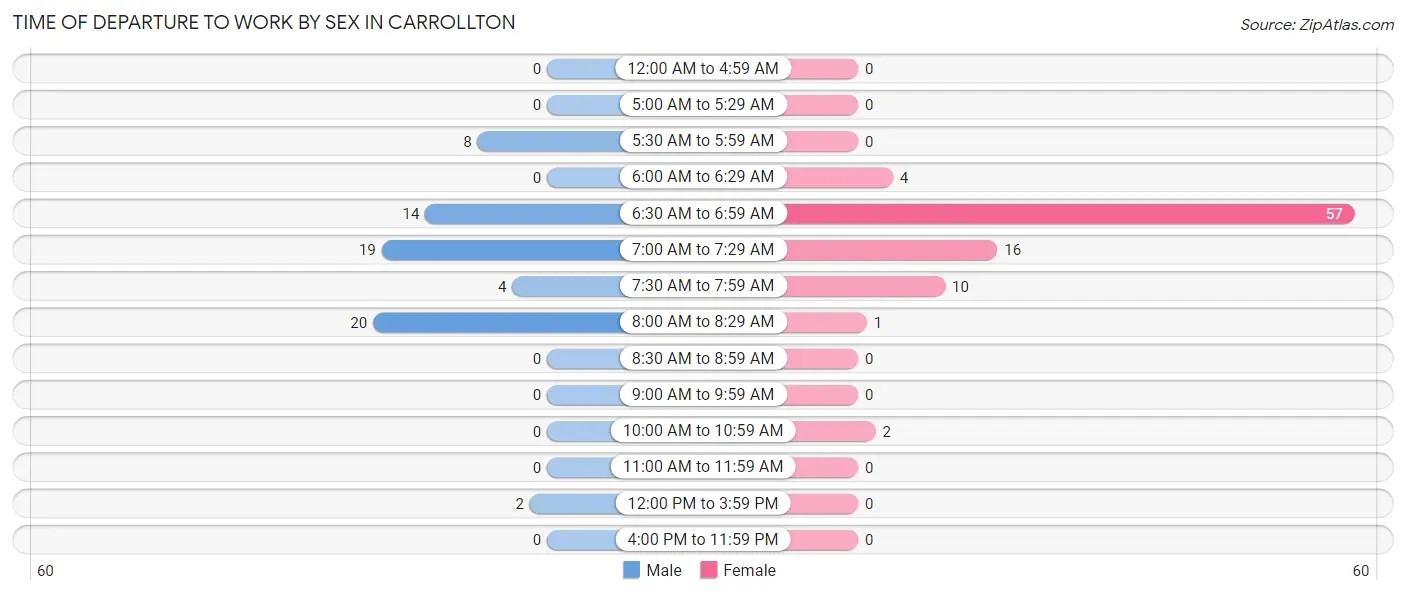
| Time of Departure | Male | Female |
| 12:00 AM to 4:59 AM | 0 (0.0%) | 0 (0.0%) |
| 5:00 AM to 5:29 AM | 0 (0.0%) | 0 (0.0%) |
| 5:30 AM to 5:59 AM | 8 (11.9%) | 0 (0.0%) |
| 6:00 AM to 6:29 AM | 0 (0.0%) | 4 (4.4%) |
| 6:30 AM to 6:59 AM | 14 (20.9%) | 57 (63.3%) |
| 7:00 AM to 7:29 AM | 19 (28.4%) | 16 (17.8%) |
| 7:30 AM to 7:59 AM | 4 (6.0%) | 10 (11.1%) |
| 8:00 AM to 8:29 AM | 20 (29.8%) | 1 (1.1%) |
| 8:30 AM to 8:59 AM | 0 (0.0%) | 0 (0.0%) |
| 9:00 AM to 9:59 AM | 0 (0.0%) | 0 (0.0%) |
| 10:00 AM to 10:59 AM | 0 (0.0%) | 2 (2.2%) |
| 11:00 AM to 11:59 AM | 0 (0.0%) | 0 (0.0%) |
| 12:00 PM to 3:59 PM | 2 (3.0%) | 0 (0.0%) |
| 4:00 PM to 11:59 PM | 0 (0.0%) | 0 (0.0%) |
| Total | 67 (100.0%) | 90 (100.0%) |
Housing Occupancy in Carrollton
Occupancy by Ownership in Carrollton
Of the total 145 dwellings in Carrollton, owner-occupied units account for 83 (57.2%), while renter-occupied units make up 62 (42.8%).
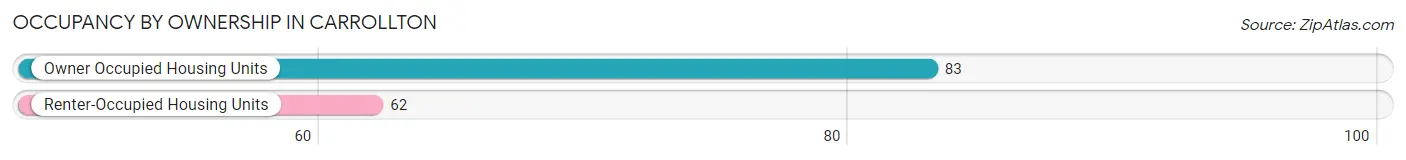
| Occupancy | # Housing Units | % Housing Units |
| Owner Occupied Housing Units | 83 | 57.2% |
| Renter-Occupied Housing Units | 62 | 42.8% |
| Total Occupied Housing Units | 145 | 100.0% |
Occupancy by Household Size in Carrollton
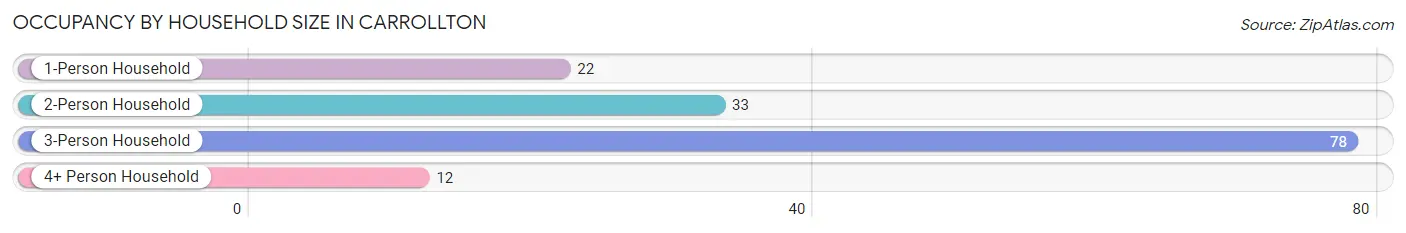
| Household Size | # Housing Units | % Housing Units |
| 1-Person Household | 22 | 15.2% |
| 2-Person Household | 33 | 22.8% |
| 3-Person Household | 78 | 53.8% |
| 4+ Person Household | 12 | 8.3% |
| Total Housing Units | 145 | 100.0% |
Occupancy by Ownership by Household Size in Carrollton
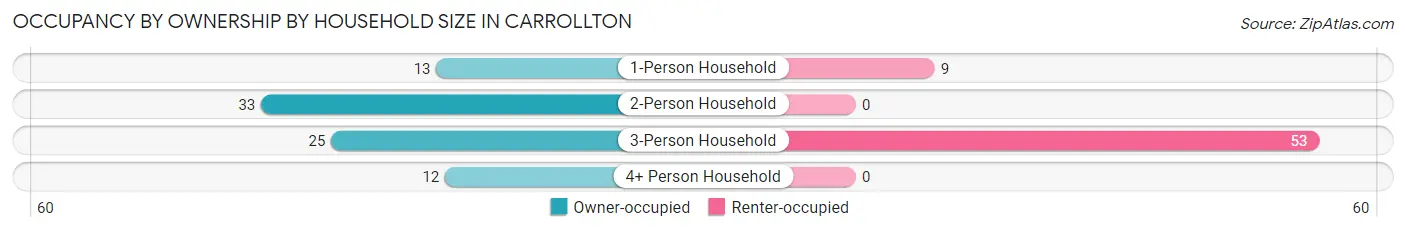
| Household Size | Owner-occupied | Renter-occupied |
| 1-Person Household | 13 (59.1%) | 9 (40.9%) |
| 2-Person Household | 33 (100.0%) | 0 (0.0%) |
| 3-Person Household | 25 (32.1%) | 53 (67.9%) |
| 4+ Person Household | 12 (100.0%) | 0 (0.0%) |
| Total Housing Units | 83 (57.2%) | 62 (42.8%) |
Occupancy by Educational Attainment in Carrollton
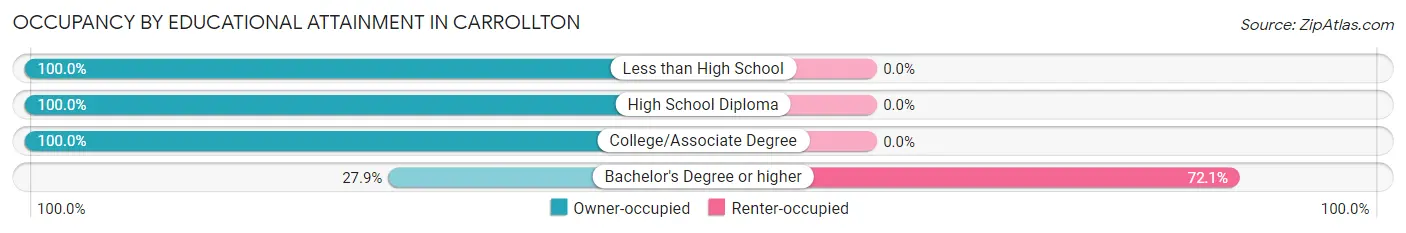
| Household Size | Owner-occupied | Renter-occupied |
| Less than High School | 3 (100.0%) | 0 (0.0%) |
| High School Diploma | 7 (100.0%) | 0 (0.0%) |
| College/Associate Degree | 49 (100.0%) | 0 (0.0%) |
| Bachelor's Degree or higher | 24 (27.9%) | 62 (72.1%) |
Occupancy by Age of Householder in Carrollton
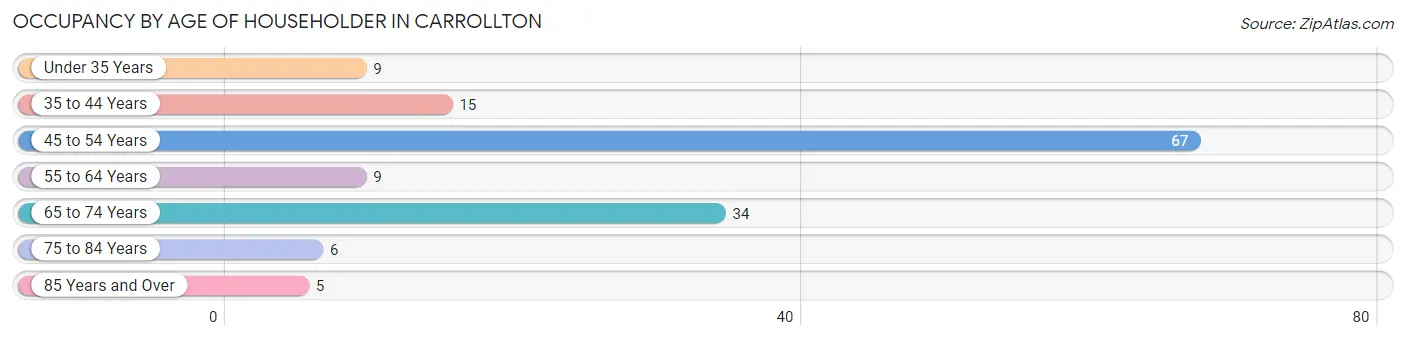
| Age Bracket | # Households | % Households |
| Under 35 Years | 9 | 6.2% |
| 35 to 44 Years | 15 | 10.3% |
| 45 to 54 Years | 67 | 46.2% |
| 55 to 64 Years | 9 | 6.2% |
| 65 to 74 Years | 34 | 23.4% |
| 75 to 84 Years | 6 | 4.1% |
| 85 Years and Over | 5 | 3.5% |
| Total | 145 | 100.0% |
Housing Finances in Carrollton
Median Income by Occupancy in Carrollton
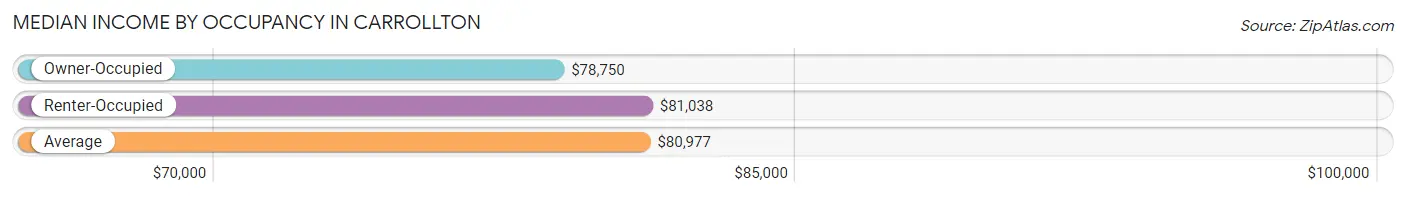
| Occupancy Type | # Households | Median Income |
| Owner-Occupied | 83 (57.2%) | $78,750 |
| Renter-Occupied | 62 (42.8%) | $81,038 |
| Average | 145 (100.0%) | $80,977 |
Occupancy by Householder Income Bracket in Carrollton
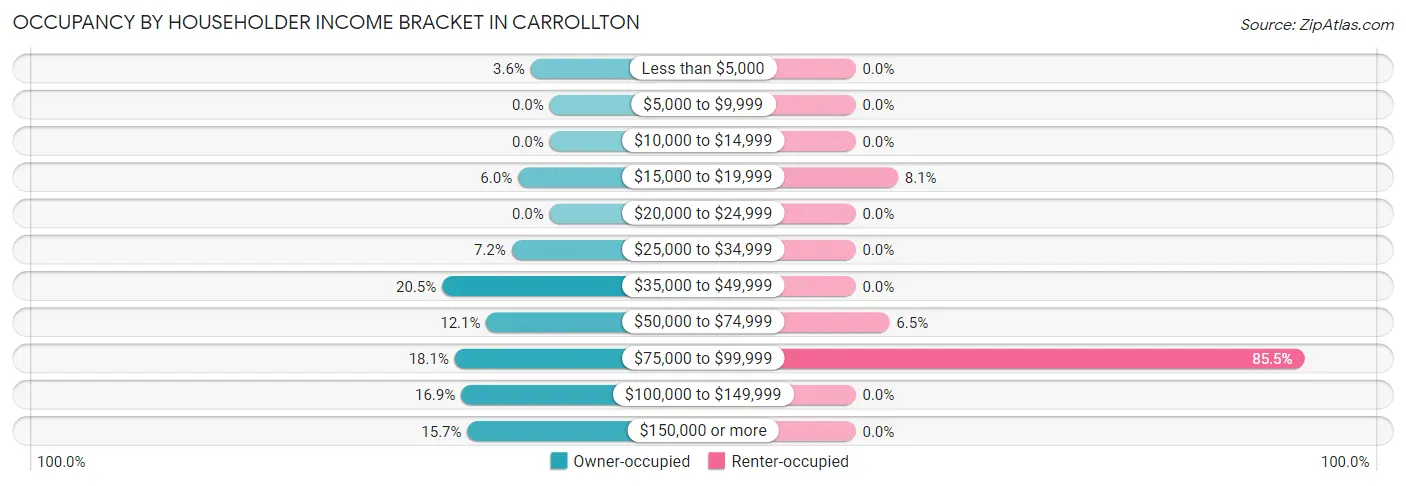
| Income Bracket | Owner-occupied | Renter-occupied |
| Less than $5,000 | 3 (3.6%) | 0 (0.0%) |
| $5,000 to $9,999 | 0 (0.0%) | 0 (0.0%) |
| $10,000 to $14,999 | 0 (0.0%) | 0 (0.0%) |
| $15,000 to $19,999 | 5 (6.0%) | 5 (8.1%) |
| $20,000 to $24,999 | 0 (0.0%) | 0 (0.0%) |
| $25,000 to $34,999 | 6 (7.2%) | 0 (0.0%) |
| $35,000 to $49,999 | 17 (20.5%) | 0 (0.0%) |
| $50,000 to $74,999 | 10 (12.0%) | 4 (6.5%) |
| $75,000 to $99,999 | 15 (18.1%) | 53 (85.5%) |
| $100,000 to $149,999 | 14 (16.9%) | 0 (0.0%) |
| $150,000 or more | 13 (15.7%) | 0 (0.0%) |
| Total | 83 (100.0%) | 62 (100.0%) |
Monthly Housing Cost Tiers in Carrollton
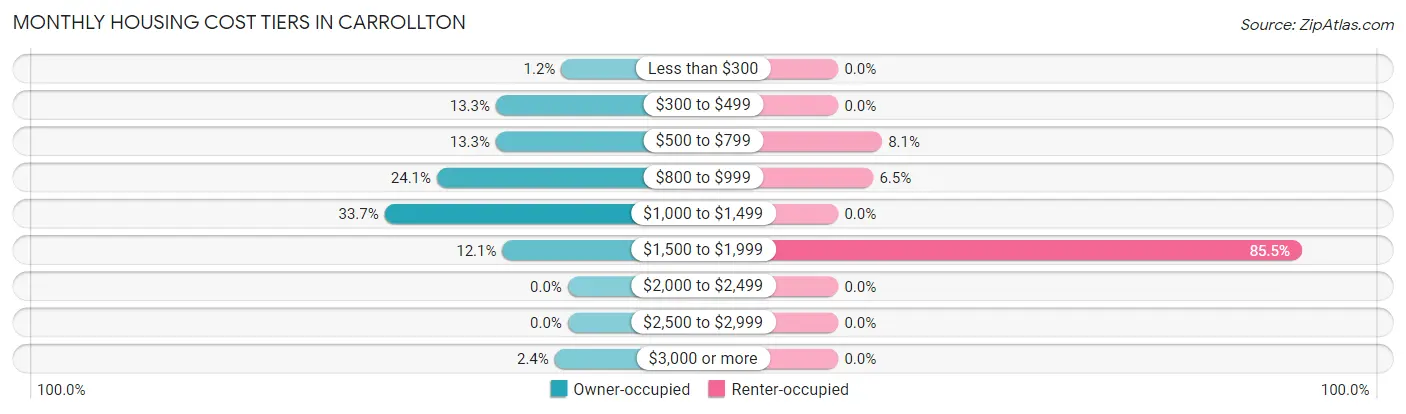
| Monthly Cost | Owner-occupied | Renter-occupied |
| Less than $300 | 1 (1.2%) | 0 (0.0%) |
| $300 to $499 | 11 (13.3%) | 0 (0.0%) |
| $500 to $799 | 11 (13.3%) | 5 (8.1%) |
| $800 to $999 | 20 (24.1%) | 4 (6.5%) |
| $1,000 to $1,499 | 28 (33.7%) | 0 (0.0%) |
| $1,500 to $1,999 | 10 (12.0%) | 53 (85.5%) |
| $2,000 to $2,499 | 0 (0.0%) | 0 (0.0%) |
| $2,500 to $2,999 | 0 (0.0%) | 0 (0.0%) |
| $3,000 or more | 2 (2.4%) | 0 (0.0%) |
| Total | 83 (100.0%) | 62 (100.0%) |
Physical Housing Characteristics in Carrollton
Housing Structures in Carrollton
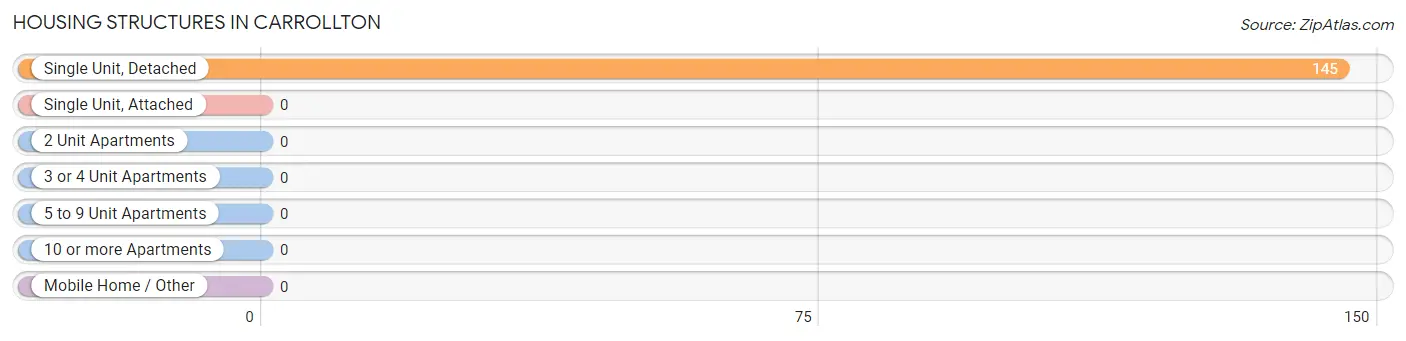
| Structure Type | # Housing Units | % Housing Units |
| Single Unit, Detached | 145 | 100.0% |
| Single Unit, Attached | 0 | 0.0% |
| 2 Unit Apartments | 0 | 0.0% |
| 3 or 4 Unit Apartments | 0 | 0.0% |
| 5 to 9 Unit Apartments | 0 | 0.0% |
| 10 or more Apartments | 0 | 0.0% |
| Mobile Home / Other | 0 | 0.0% |
| Total | 145 | 100.0% |
Housing Structures by Occupancy in Carrollton
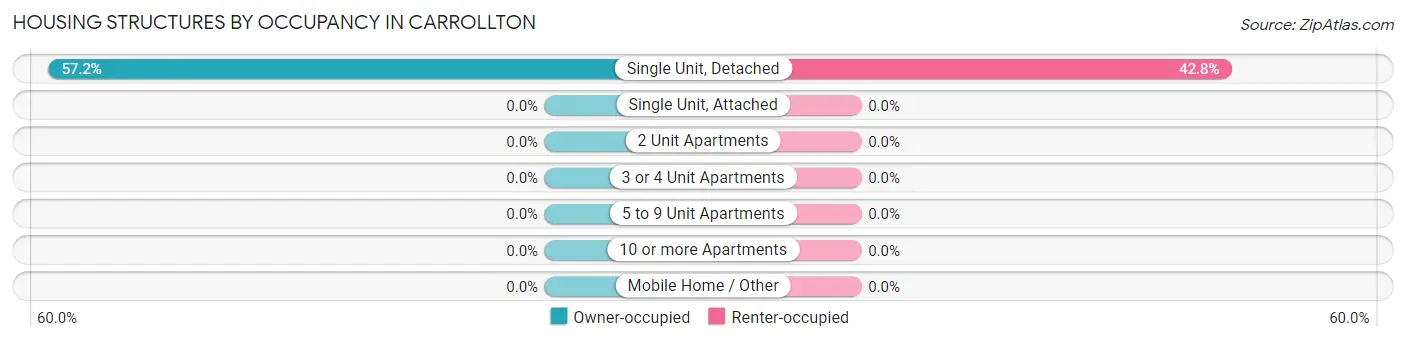
| Structure Type | Owner-occupied | Renter-occupied |
| Single Unit, Detached | 83 (57.2%) | 62 (42.8%) |
| Single Unit, Attached | 0 (0.0%) | 0 (0.0%) |
| 2 Unit Apartments | 0 (0.0%) | 0 (0.0%) |
| 3 or 4 Unit Apartments | 0 (0.0%) | 0 (0.0%) |
| 5 to 9 Unit Apartments | 0 (0.0%) | 0 (0.0%) |
| 10 or more Apartments | 0 (0.0%) | 0 (0.0%) |
| Mobile Home / Other | 0 (0.0%) | 0 (0.0%) |
| Total | 83 (57.2%) | 62 (42.8%) |
Housing Structures by Number of Rooms in Carrollton
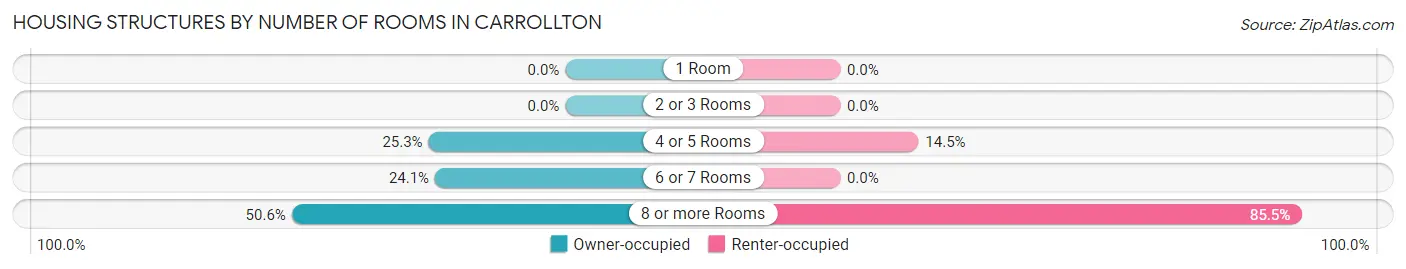
| Number of Rooms | Owner-occupied | Renter-occupied |
| 1 Room | 0 (0.0%) | 0 (0.0%) |
| 2 or 3 Rooms | 0 (0.0%) | 0 (0.0%) |
| 4 or 5 Rooms | 21 (25.3%) | 9 (14.5%) |
| 6 or 7 Rooms | 20 (24.1%) | 0 (0.0%) |
| 8 or more Rooms | 42 (50.6%) | 53 (85.5%) |
| Total | 83 (100.0%) | 62 (100.0%) |
Housing Structure by Heating Type in Carrollton
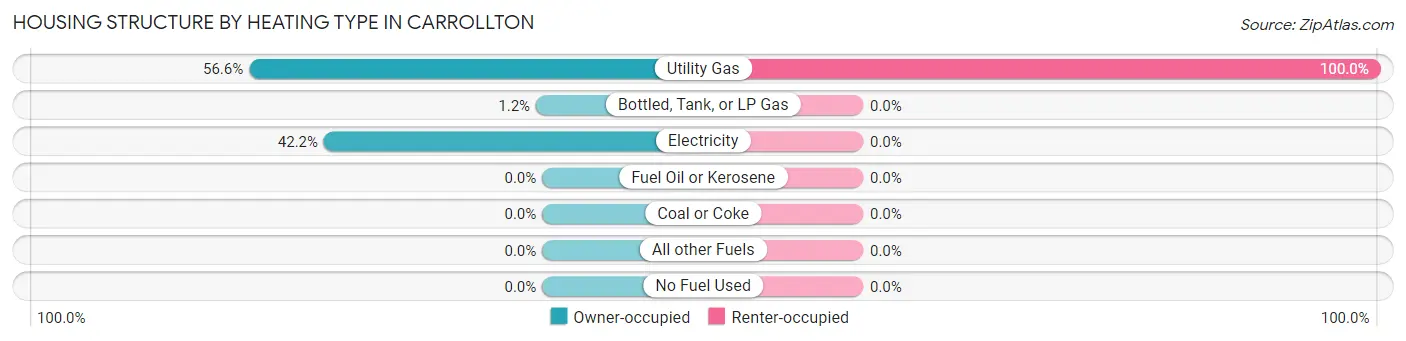
| Heating Type | Owner-occupied | Renter-occupied |
| Utility Gas | 47 (56.6%) | 62 (100.0%) |
| Bottled, Tank, or LP Gas | 1 (1.2%) | 0 (0.0%) |
| Electricity | 35 (42.2%) | 0 (0.0%) |
| Fuel Oil or Kerosene | 0 (0.0%) | 0 (0.0%) |
| Coal or Coke | 0 (0.0%) | 0 (0.0%) |
| All other Fuels | 0 (0.0%) | 0 (0.0%) |
| No Fuel Used | 0 (0.0%) | 0 (0.0%) |
| Total | 83 (100.0%) | 62 (100.0%) |
Household Vehicle Usage in Carrollton
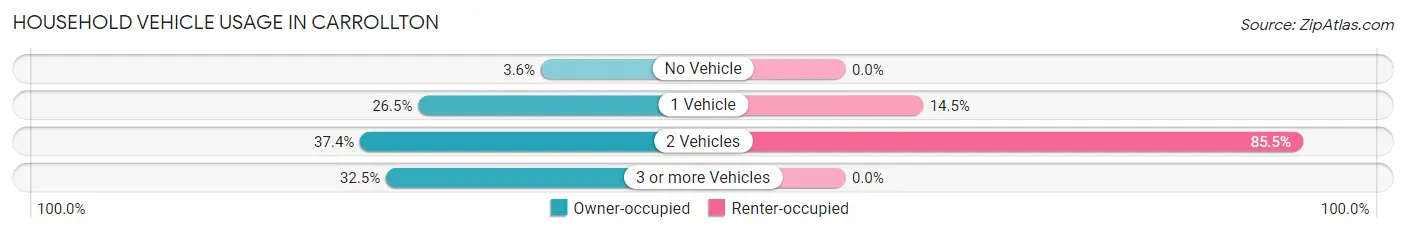
| Vehicles per Household | Owner-occupied | Renter-occupied |
| No Vehicle | 3 (3.6%) | 0 (0.0%) |
| 1 Vehicle | 22 (26.5%) | 9 (14.5%) |
| 2 Vehicles | 31 (37.3%) | 53 (85.5%) |
| 3 or more Vehicles | 27 (32.5%) | 0 (0.0%) |
| Total | 83 (100.0%) | 62 (100.0%) |
Real Estate & Mortgages in Carrollton
Real Estate and Mortgage Overview in Carrollton
| Characteristic | Without Mortgage | With Mortgage |
| Housing Units | 32 | 51 |
| Median Property Value | $69,200 | $164,100 |
| Median Household Income | $39,688 | $12 |
| Monthly Housing Costs | $725 | $2 |
| Real Estate Taxes | $1,125 | $0 |
Property Value by Mortgage Status in Carrollton
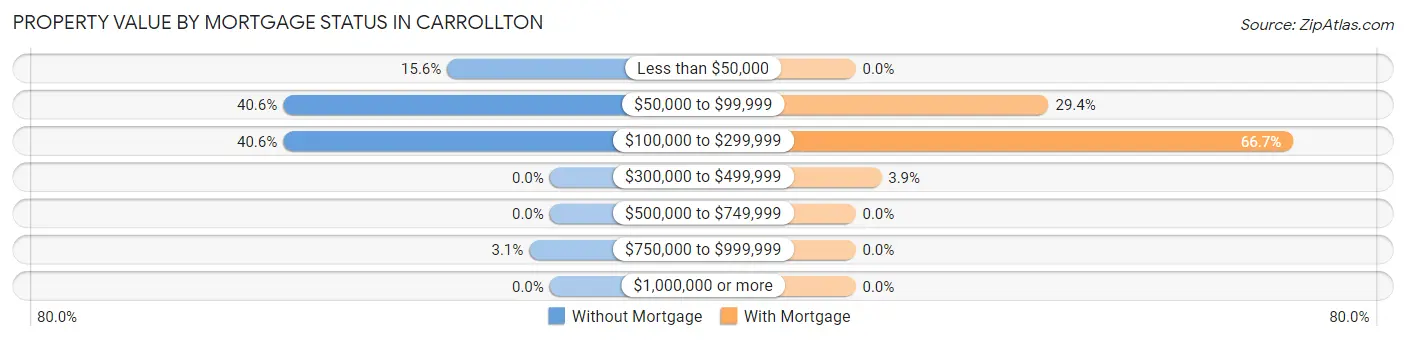
| Property Value | Without Mortgage | With Mortgage |
| Less than $50,000 | 5 (15.6%) | 0 (0.0%) |
| $50,000 to $99,999 | 13 (40.6%) | 15 (29.4%) |
| $100,000 to $299,999 | 13 (40.6%) | 34 (66.7%) |
| $300,000 to $499,999 | 0 (0.0%) | 2 (3.9%) |
| $500,000 to $749,999 | 0 (0.0%) | 0 (0.0%) |
| $750,000 to $999,999 | 1 (3.1%) | 0 (0.0%) |
| $1,000,000 or more | 0 (0.0%) | 0 (0.0%) |
| Total | 32 (100.0%) | 51 (100.0%) |
Household Income by Mortgage Status in Carrollton
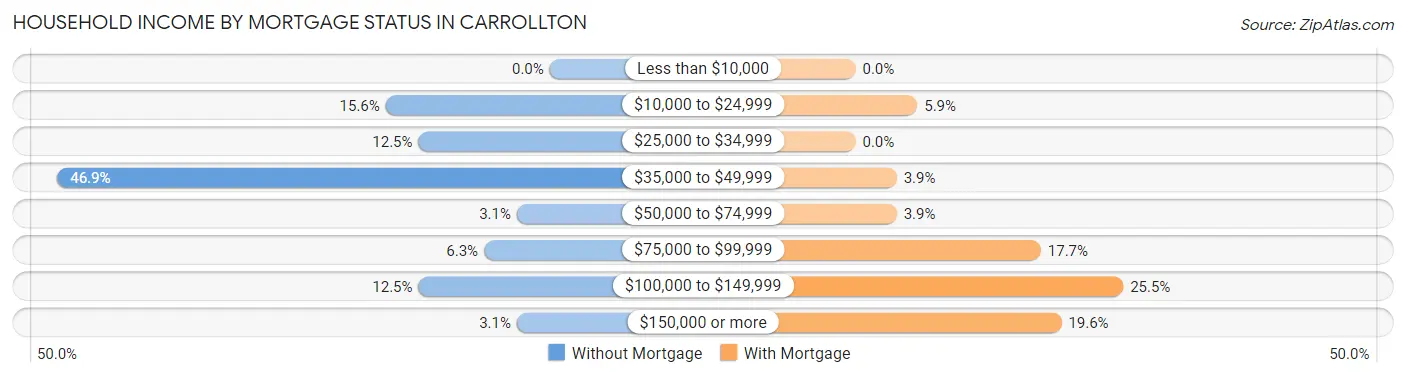
| Household Income | Without Mortgage | With Mortgage |
| Less than $10,000 | 0 (0.0%) | 0 (0.0%) |
| $10,000 to $24,999 | 5 (15.6%) | 3 (5.9%) |
| $25,000 to $34,999 | 4 (12.5%) | 0 (0.0%) |
| $35,000 to $49,999 | 15 (46.9%) | 2 (3.9%) |
| $50,000 to $74,999 | 1 (3.1%) | 2 (3.9%) |
| $75,000 to $99,999 | 2 (6.2%) | 9 (17.6%) |
| $100,000 to $149,999 | 4 (12.5%) | 13 (25.5%) |
| $150,000 or more | 1 (3.1%) | 10 (19.6%) |
| Total | 32 (100.0%) | 51 (100.0%) |
Property Value to Household Income Ratio in Carrollton
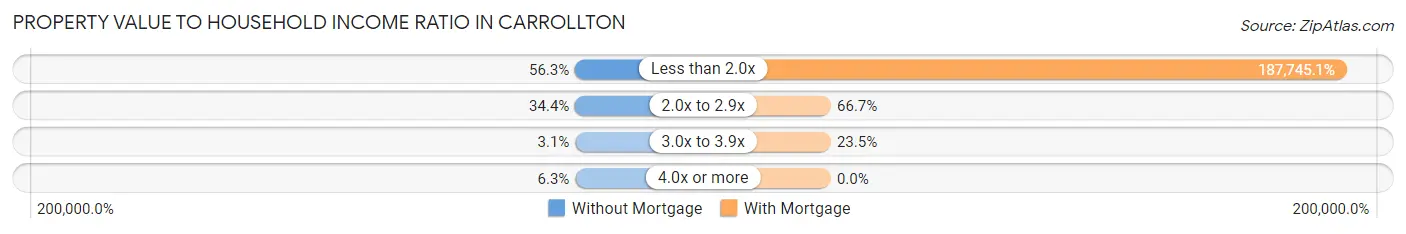
| Value-to-Income Ratio | Without Mortgage | With Mortgage |
| Less than 2.0x | 18 (56.2%) | 95,750 (187,745.1%) |
| 2.0x to 2.9x | 11 (34.4%) | 34 (66.7%) |
| 3.0x to 3.9x | 1 (3.1%) | 12 (23.5%) |
| 4.0x or more | 2 (6.2%) | 0 (0.0%) |
| Total | 32 (100.0%) | 51 (100.0%) |
Real Estate Taxes by Mortgage Status in Carrollton
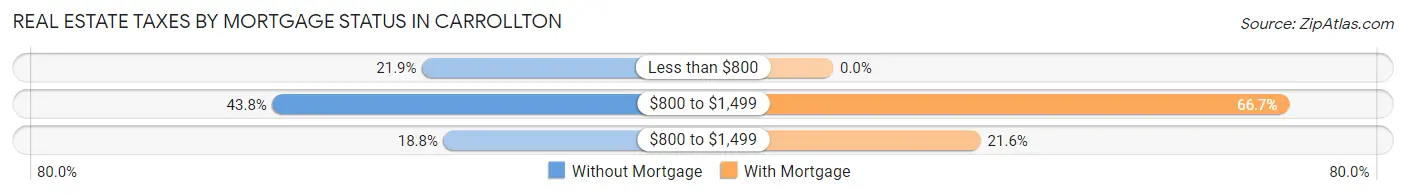
| Property Taxes | Without Mortgage | With Mortgage |
| Less than $800 | 7 (21.9%) | 0 (0.0%) |
| $800 to $1,499 | 14 (43.8%) | 34 (66.7%) |
| $800 to $1,499 | 6 (18.8%) | 11 (21.6%) |
| Total | 32 (100.0%) | 51 (100.0%) |
Health & Disability in Carrollton
Health Insurance Coverage by Age in Carrollton
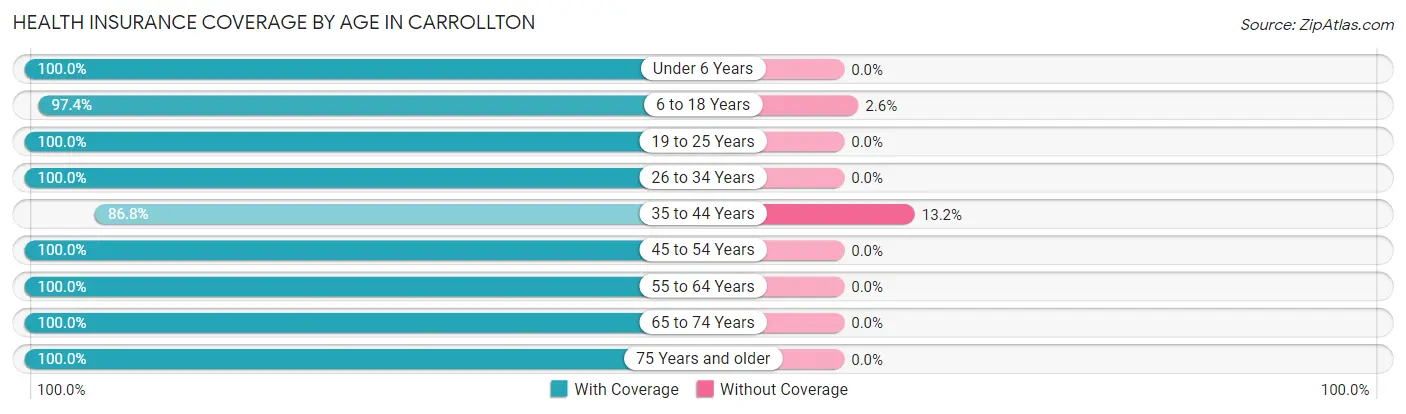
| Age Bracket | With Coverage | Without Coverage |
| Under 6 Years | 4 (100.0%) | 0 (0.0%) |
| 6 to 18 Years | 148 (97.4%) | 4 (2.6%) |
| 19 to 25 Years | 6 (100.0%) | 0 (0.0%) |
| 26 to 34 Years | 26 (100.0%) | 0 (0.0%) |
| 35 to 44 Years | 33 (86.8%) | 5 (13.2%) |
| 45 to 54 Years | 74 (100.0%) | 0 (0.0%) |
| 55 to 64 Years | 16 (100.0%) | 0 (0.0%) |
| 65 to 74 Years | 49 (100.0%) | 0 (0.0%) |
| 75 Years and older | 26 (100.0%) | 0 (0.0%) |
| Total | 382 (97.7%) | 9 (2.3%) |
Health Insurance Coverage by Citizenship Status in Carrollton
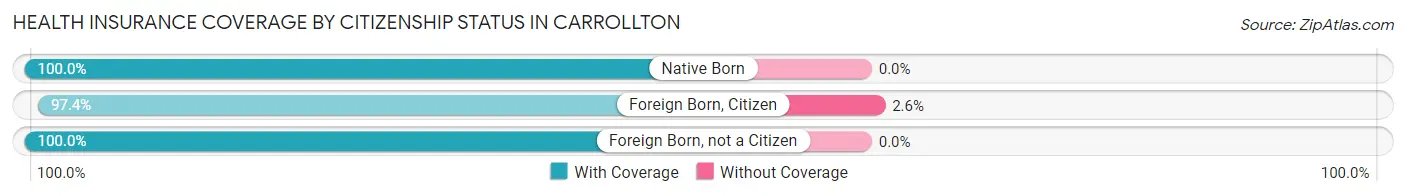
| Citizenship Status | With Coverage | Without Coverage |
| Native Born | 4 (100.0%) | 0 (0.0%) |
| Foreign Born, Citizen | 148 (97.4%) | 4 (2.6%) |
| Foreign Born, not a Citizen | 6 (100.0%) | 0 (0.0%) |
Health Insurance Coverage by Household Income in Carrollton
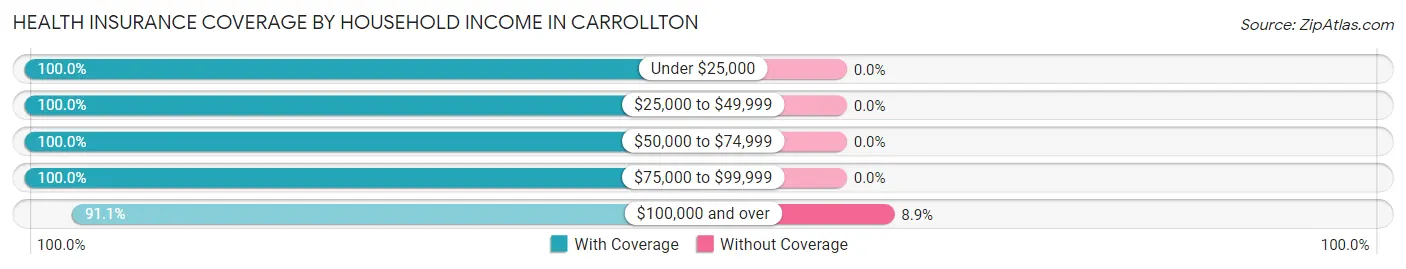
| Household Income | With Coverage | Without Coverage |
| Under $25,000 | 16 (100.0%) | 0 (0.0%) |
| $25,000 to $49,999 | 41 (100.0%) | 0 (0.0%) |
| $50,000 to $74,999 | 25 (100.0%) | 0 (0.0%) |
| $75,000 to $99,999 | 208 (100.0%) | 0 (0.0%) |
| $100,000 and over | 92 (91.1%) | 9 (8.9%) |
Public vs Private Health Insurance Coverage by Age in Carrollton
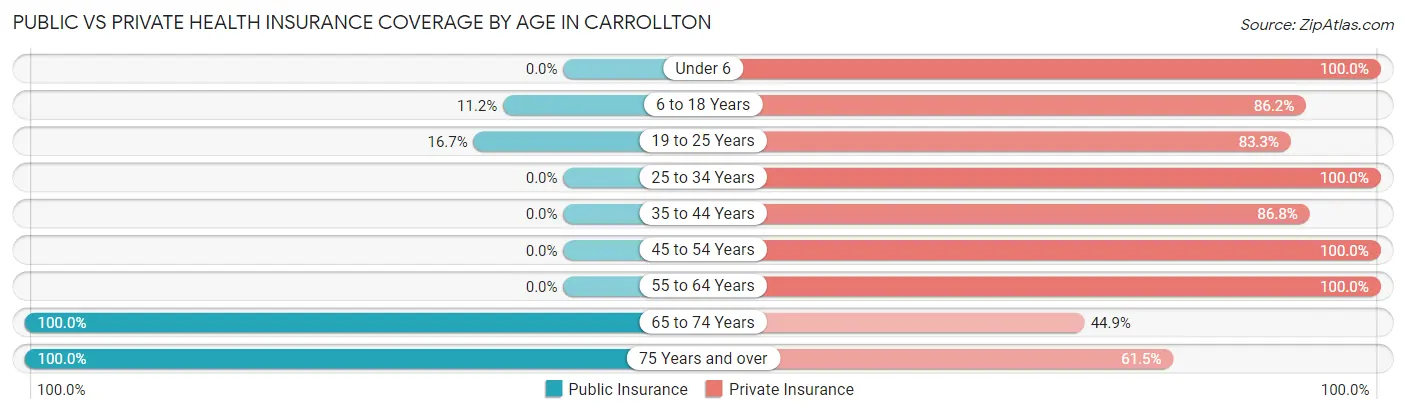
| Age Bracket | Public Insurance | Private Insurance |
| Under 6 | 0 (0.0%) | 4 (100.0%) |
| 6 to 18 Years | 17 (11.2%) | 131 (86.2%) |
| 19 to 25 Years | 1 (16.7%) | 5 (83.3%) |
| 25 to 34 Years | 0 (0.0%) | 26 (100.0%) |
| 35 to 44 Years | 0 (0.0%) | 33 (86.8%) |
| 45 to 54 Years | 0 (0.0%) | 74 (100.0%) |
| 55 to 64 Years | 0 (0.0%) | 16 (100.0%) |
| 65 to 74 Years | 49 (100.0%) | 22 (44.9%) |
| 75 Years and over | 26 (100.0%) | 16 (61.5%) |
| Total | 93 (23.8%) | 327 (83.6%) |
Disability Status by Sex by Age in Carrollton
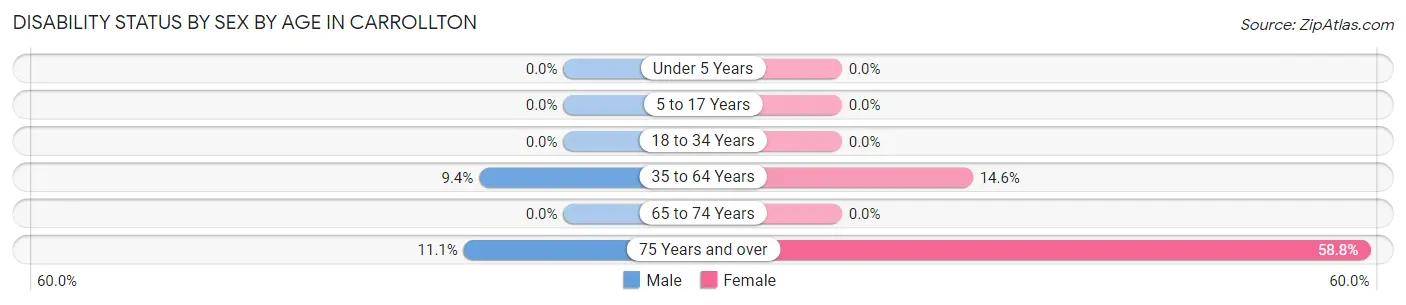
| Age Bracket | Male | Female |
| Under 5 Years | 0 (0.0%) | 0 (0.0%) |
| 5 to 17 Years | 0 (0.0%) | 0 (0.0%) |
| 18 to 34 Years | 0 (0.0%) | 0 (0.0%) |
| 35 to 64 Years | 3 (9.4%) | 14 (14.6%) |
| 65 to 74 Years | 0 (0.0%) | 0 (0.0%) |
| 75 Years and over | 1 (11.1%) | 10 (58.8%) |
Disability Class by Sex by Age in Carrollton
Disability Class: Hearing Difficulty
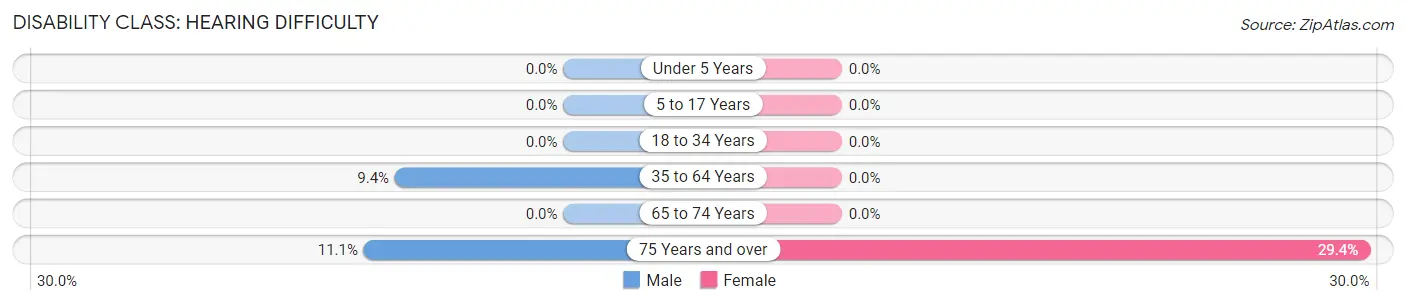
| Age Bracket | Male | Female |
| Under 5 Years | 0 (0.0%) | 0 (0.0%) |
| 5 to 17 Years | 0 (0.0%) | 0 (0.0%) |
| 18 to 34 Years | 0 (0.0%) | 0 (0.0%) |
| 35 to 64 Years | 3 (9.4%) | 0 (0.0%) |
| 65 to 74 Years | 0 (0.0%) | 0 (0.0%) |
| 75 Years and over | 1 (11.1%) | 5 (29.4%) |
Disability Class: Vision Difficulty
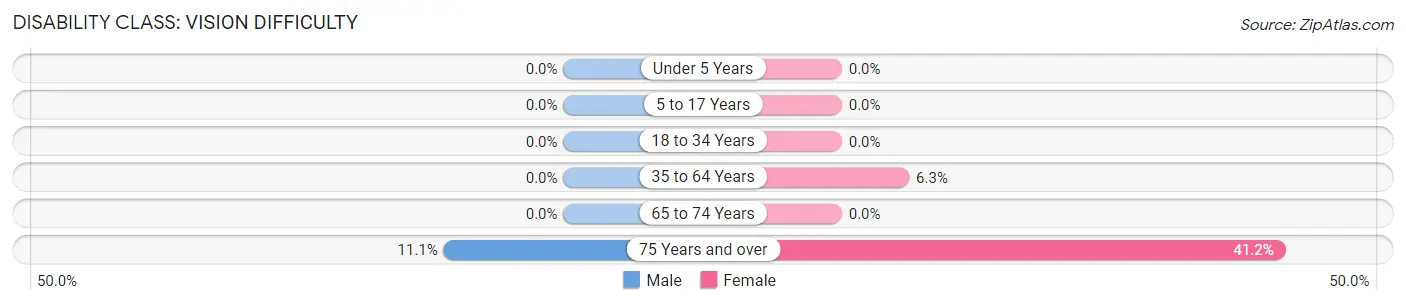
| Age Bracket | Male | Female |
| Under 5 Years | 0 (0.0%) | 0 (0.0%) |
| 5 to 17 Years | 0 (0.0%) | 0 (0.0%) |
| 18 to 34 Years | 0 (0.0%) | 0 (0.0%) |
| 35 to 64 Years | 0 (0.0%) | 6 (6.2%) |
| 65 to 74 Years | 0 (0.0%) | 0 (0.0%) |
| 75 Years and over | 1 (11.1%) | 7 (41.2%) |
Disability Class: Cognitive Difficulty
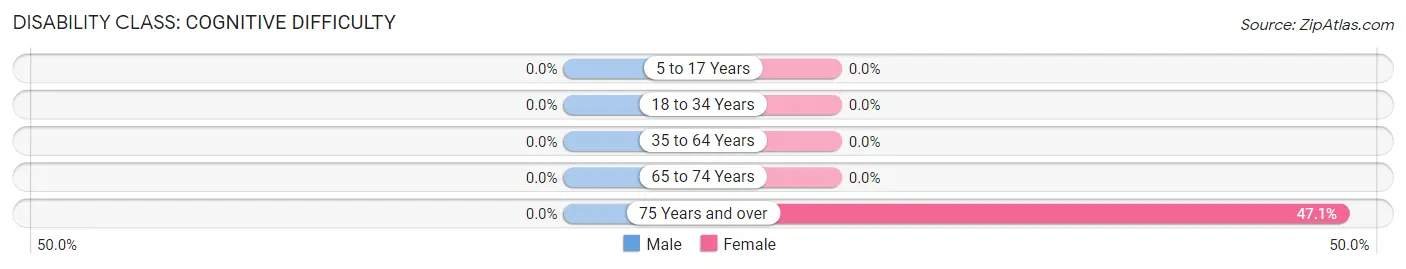
| Age Bracket | Male | Female |
| 5 to 17 Years | 0 (0.0%) | 0 (0.0%) |
| 18 to 34 Years | 0 (0.0%) | 0 (0.0%) |
| 35 to 64 Years | 0 (0.0%) | 0 (0.0%) |
| 65 to 74 Years | 0 (0.0%) | 0 (0.0%) |
| 75 Years and over | 0 (0.0%) | 8 (47.1%) |
Disability Class: Ambulatory Difficulty
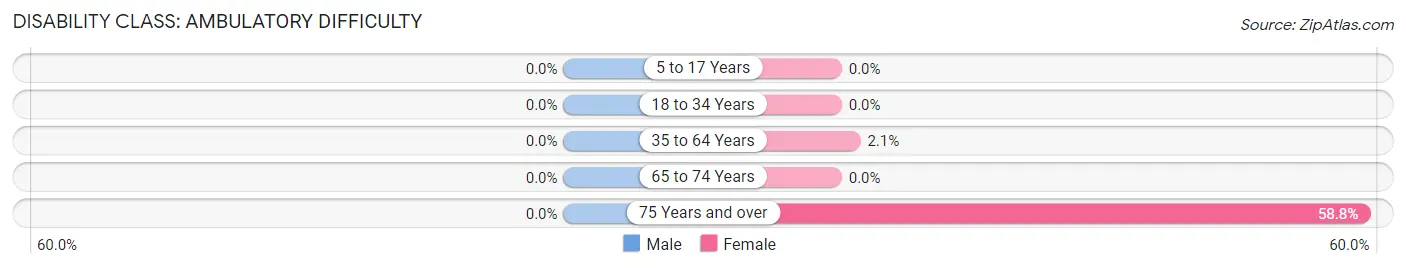
| Age Bracket | Male | Female |
| 5 to 17 Years | 0 (0.0%) | 0 (0.0%) |
| 18 to 34 Years | 0 (0.0%) | 0 (0.0%) |
| 35 to 64 Years | 0 (0.0%) | 2 (2.1%) |
| 65 to 74 Years | 0 (0.0%) | 0 (0.0%) |
| 75 Years and over | 0 (0.0%) | 10 (58.8%) |
Disability Class: Self-Care Difficulty
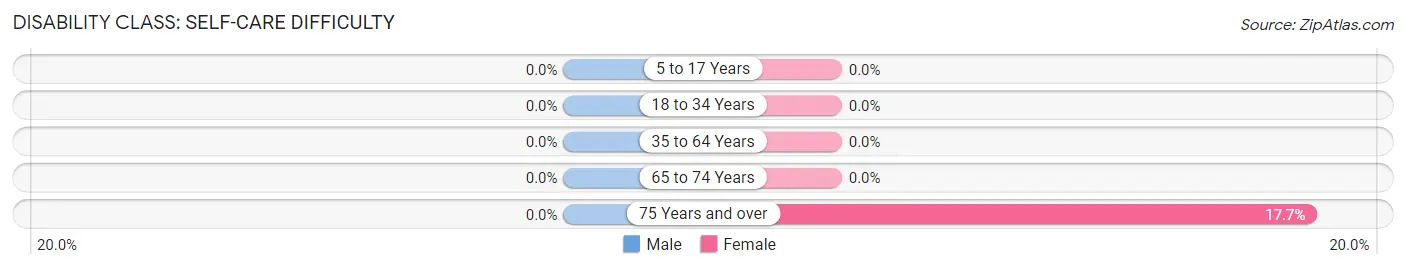
| Age Bracket | Male | Female |
| 5 to 17 Years | 0 (0.0%) | 0 (0.0%) |
| 18 to 34 Years | 0 (0.0%) | 0 (0.0%) |
| 35 to 64 Years | 0 (0.0%) | 0 (0.0%) |
| 65 to 74 Years | 0 (0.0%) | 0 (0.0%) |
| 75 Years and over | 0 (0.0%) | 3 (17.6%) |
Technology Access in Carrollton
Computing Device Access in Carrollton
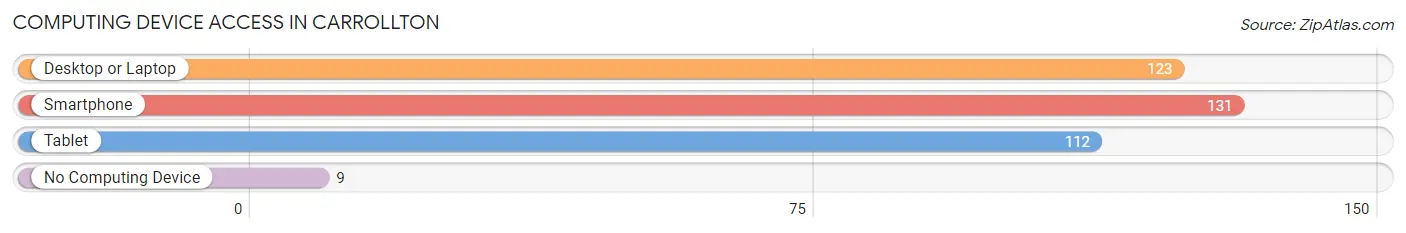
| Device Type | # Households | % Households |
| Desktop or Laptop | 123 | 84.8% |
| Smartphone | 131 | 90.3% |
| Tablet | 112 | 77.2% |
| No Computing Device | 9 | 6.2% |
| Total | 145 | 100.0% |
Internet Access in Carrollton
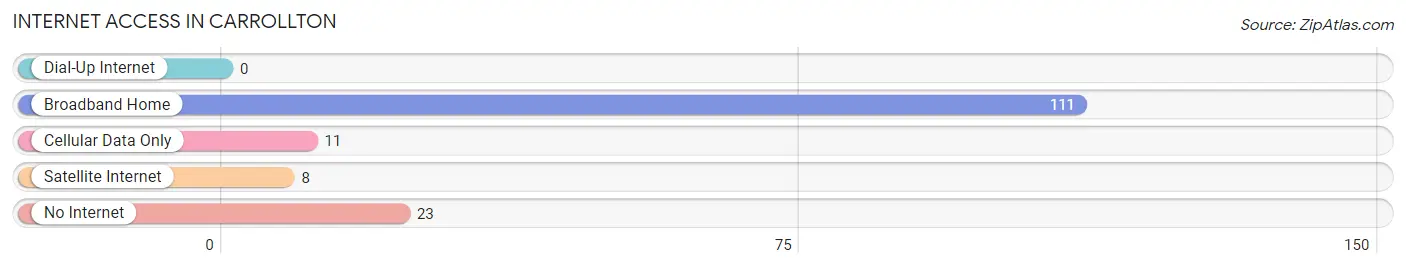
| Internet Type | # Households | % Households |
| Dial-Up Internet | 0 | 0.0% |
| Broadband Home | 111 | 76.5% |
| Cellular Data Only | 11 | 7.6% |
| Satellite Internet | 8 | 5.5% |
| No Internet | 23 | 15.9% |
| Total | 145 | 100.0% |
Carrollton Summary
Carrollton, Mississippi is a small town located in the northwest corner of the state, near the Mississippi River. It is part of Carroll County, which is located in the Delta region of the state. The town has a population of approximately 1,000 people and is the county seat of Carroll County.
History
Carrollton was founded in 1837 and named after Charles Carroll, a signer of the Declaration of Independence. The town was originally a trading post and was the first county seat of Carroll County. In 1845, the town was incorporated and the first courthouse was built. The town was a major trading center for the surrounding area and was a major stop on the Mississippi River.
During the Civil War, Carrollton was a major Confederate stronghold and was the site of several battles. After the war, the town was rebuilt and the economy began to recover. In the late 19th century, the town was a major cotton producer and was home to several cotton mills.
Geography
Carrollton is located in the northwest corner of the state, near the Mississippi River. The town is situated on the banks of the river and is surrounded by rolling hills and farmland. The town is located in the Delta region of the state and is part of the Yazoo-Mississippi Delta. The town is located approximately 50 miles south of Memphis, Tennessee and approximately 100 miles north of Jackson, Mississippi.
Economy
The economy of Carrollton is largely based on agriculture. The town is home to several farms and is a major producer of cotton, soybeans, corn, and other crops. The town is also home to several manufacturing companies, including a furniture factory and a paper mill. The town is also home to several small businesses, including restaurants, shops, and other services.
Demographics
As of the 2010 census, the population of Carrollton was 1,000 people. The town is predominantly white, with approximately 75% of the population being white. The remaining 25% of the population is African American. The median household income in the town is approximately $30,000, and the median age is 40 years old.
Conclusion
Carrollton, Mississippi is a small town located in the northwest corner of the state, near the Mississippi River. The town has a population of approximately 1,000 people and is the county seat of Carroll County. The town was founded in 1837 and was a major trading center for the surrounding area. The economy of Carrollton is largely based on agriculture and the town is home to several small businesses. The population of Carrollton is predominantly white, with approximately 75% of the population being white.
Common Questions
What is Per Capita Income in Carrollton?
Per Capita income in Carrollton is $30,963.
What is the Median Family Income in Carrollton?
Median Family Income in Carrollton is $81,500.
What is the Median Household income in Carrollton?
Median Household Income in Carrollton is $80,977.
What is Income or Wage Gap in Carrollton?
Income or Wage Gap in Carrollton is 30.7%.
Women in Carrollton earn 69.3 cents for every dollar earned by a man.
What is Inequality or Gini Index in Carrollton?
Inequality or Gini Index in Carrollton is 0.34.
What is the Total Population of Carrollton?
Total Population of Carrollton is 435.
What is the Total Male Population of Carrollton?
Total Male Population of Carrollton is 249.
What is the Total Female Population of Carrollton?
Total Female Population of Carrollton is 186.
What is the Ratio of Males per 100 Females in Carrollton?
There are 133.87 Males per 100 Females in Carrollton.
What is the Ratio of Females per 100 Males in Carrollton?
There are 74.70 Females per 100 Males in Carrollton.
What is the Median Population Age in Carrollton?
Median Population Age in Carrollton is 42.3 Years.
What is the Average Family Size in Carrollton
Average Family Size in Carrollton is 3.0 People.
What is the Average Household Size in Carrollton
Average Household Size in Carrollton is 2.7 People.
How Large is the Labor Force in Carrollton?
There are 160 People in the Labor Forcein in Carrollton.
What is the Percentage of People in the Labor Force in Carrollton?
44.2% of People are in the Labor Force in Carrollton.