Zip Codes with the Highest Percentage of Households with Income Below $10,000 in Kansas City, MO
RELATED REPORTS & OPTIONS
Household Income | $0-10k
Kansas City
Compare Zip Codes
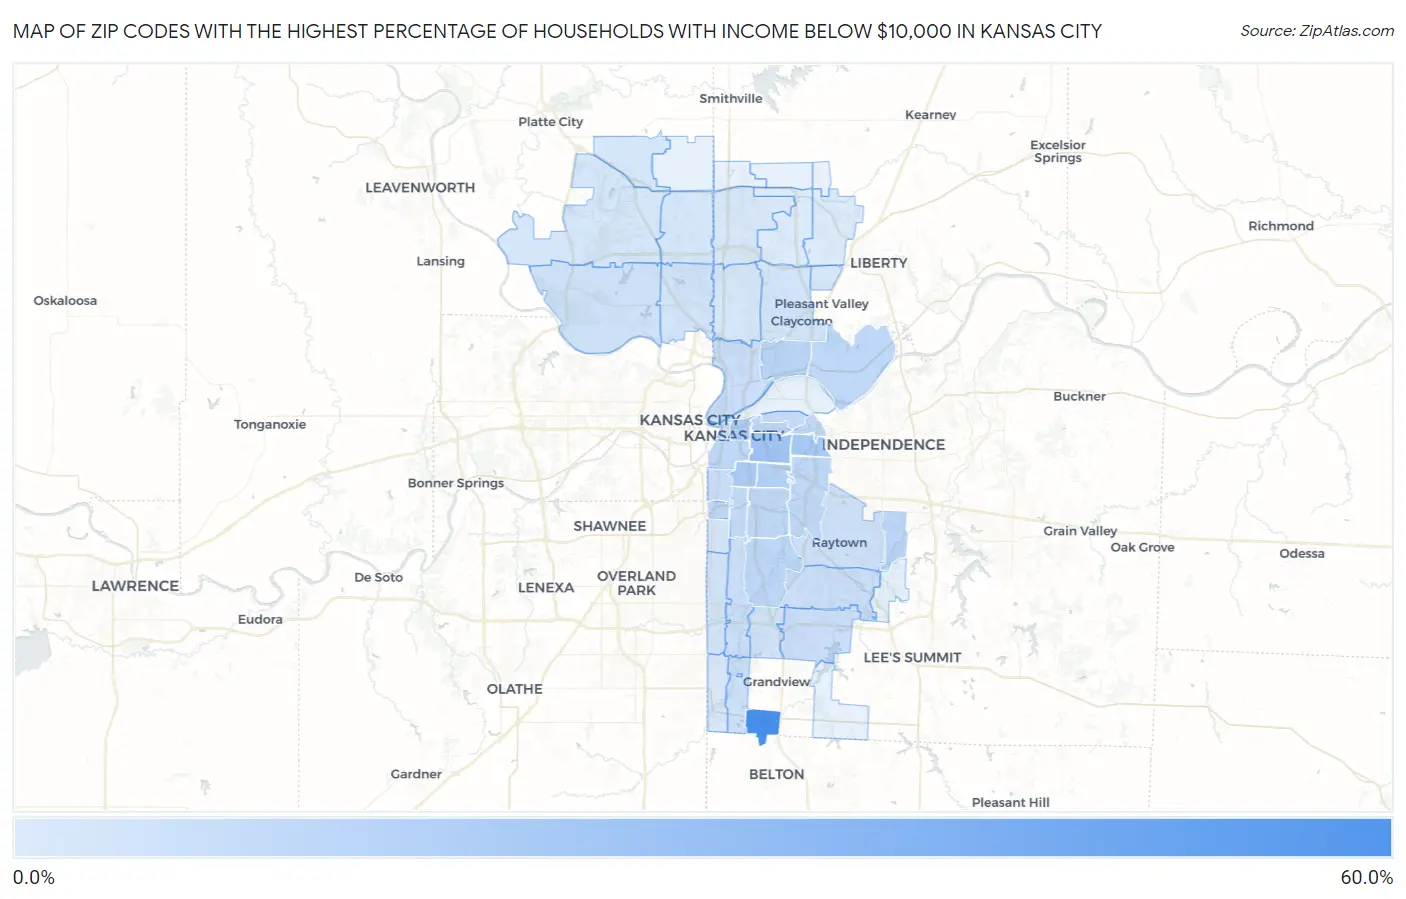
Map of Zip Codes with the Highest Percentage of Households with Income Below $10,000 in Kansas City
0.40%
53.3%
Zip Codes with the Highest Percentage of Households with Income Below $10,000 in Kansas City, MO
| Zip Code | Households with Income < $10k | vs State | vs National | |
| 1. | 64147 | 53.3% | 5.0%(+48.3)#3 | 4.9%(+48.4)#96 |
| 2. | 64127 | 18.9% | 5.0%(+13.9)#23 | 4.9%(+14.0)#905 |
| 3. | 64126 | 16.5% | 5.0%(+11.5)#33 | 4.9%(+11.6)#1,249 |
| 4. | 64109 | 14.9% | 5.0%(+9.90)#43 | 4.9%(+10.00)#1,543 |
| 5. | 64106 | 14.1% | 5.0%(+9.10)#55 | 4.9%(+9.20)#1,744 |
| 6. | 64128 | 12.3% | 5.0%(+7.30)#77 | 4.9%(+7.40)#2,332 |
| 7. | 64117 | 10.9% | 5.0%(+5.90)#93 | 4.9%(+6.00)#3,009 |
| 8. | 64136 | 10.0% | 5.0%(+5.00)#117 | 4.9%(+5.10)#3,606 |
| 9. | 64124 | 9.6% | 5.0%(+4.60)#130 | 4.9%(+4.70)#3,887 |
| 10. | 64161 | 9.4% | 5.0%(+4.40)#136 | 4.9%(+4.50)#4,079 |
| 11. | 64132 | 9.2% | 5.0%(+4.20)#140 | 4.9%(+4.30)#4,220 |
| 12. | 64112 | 9.2% | 5.0%(+4.20)#141 | 4.9%(+4.30)#4,227 |
| 13. | 64108 | 9.0% | 5.0%(+4.00)#150 | 4.9%(+4.10)#4,426 |
| 14. | 64130 | 8.7% | 5.0%(+3.70)#164 | 4.9%(+3.80)#4,732 |
| 15. | 64129 | 8.6% | 5.0%(+3.60)#169 | 4.9%(+3.70)#4,851 |
| 16. | 64125 | 8.3% | 5.0%(+3.30)#187 | 4.9%(+3.40)#5,224 |
| 17. | 64110 | 7.8% | 5.0%(+2.80)#208 | 4.9%(+2.90)#5,824 |
| 18. | 64123 | 6.4% | 5.0%(+1.40)#292 | 4.9%(+1.50)#8,160 |
| 19. | 64138 | 6.1% | 5.0%(+1.10)#309 | 4.9%(+1.20)#8,766 |
| 20. | 64134 | 6.0% | 5.0%(+1.000)#317 | 4.9%(+1.10)#9,012 |
| 21. | 64111 | 5.9% | 5.0%(+0.900)#321 | 4.9%(+1.00)#9,255 |
| 22. | 64105 | 5.7% | 5.0%(+0.700)#345 | 4.9%(+0.800)#9,799 |
| 23. | 64116 | 5.5% | 5.0%(+0.500)#358 | 4.9%(+0.600)#10,253 |
| 24. | 64131 | 5.0% | 5.0%(=0.000)#414 | 4.9%(+0.100)#11,711 |
| 25. | 64133 | 4.2% | 5.0%(-0.800)#501 | 4.9%(-0.700)#14,468 |
| 26. | 64152 | 4.2% | 5.0%(-0.800)#502 | 4.9%(-0.700)#14,483 |
| 27. | 64146 | 4.2% | 5.0%(-0.800)#512 | 4.9%(-0.700)#14,721 |
| 28. | 64151 | 3.9% | 5.0%(-1.10)#532 | 4.9%(-1.00)#15,640 |
| 29. | 64137 | 3.9% | 5.0%(-1.10)#533 | 4.9%(-1.00)#15,731 |
| 30. | 64114 | 3.2% | 5.0%(-1.80)#607 | 4.9%(-1.70)#18,534 |
| 31. | 64119 | 2.8% | 5.0%(-2.20)#660 | 4.9%(-2.10)#20,269 |
| 32. | 64118 | 2.7% | 5.0%(-2.30)#672 | 4.9%(-2.20)#20,665 |
| 33. | 64153 | 2.7% | 5.0%(-2.30)#676 | 4.9%(-2.20)#20,837 |
| 34. | 64158 | 2.6% | 5.0%(-2.40)#691 | 4.9%(-2.30)#21,266 |
| 35. | 64163 | 2.6% | 5.0%(-2.40)#695 | 4.9%(-2.30)#21,442 |
| 36. | 64154 | 2.3% | 5.0%(-2.70)#727 | 4.9%(-2.60)#22,519 |
| 37. | 64113 | 1.7% | 5.0%(-3.30)#792 | 4.9%(-3.20)#24,782 |
| 38. | 64155 | 1.6% | 5.0%(-3.40)#800 | 4.9%(-3.30)#25,096 |
| 39. | 64145 | 1.6% | 5.0%(-3.40)#804 | 4.9%(-3.30)#25,196 |
| 40. | 64157 | 0.70% | 5.0%(-4.30)#871 | 4.9%(-4.20)#27,459 |
| 41. | 64156 | 0.40% | 5.0%(-4.60)#888 | 4.9%(-4.50)#28,005 |
1
Common Questions
What are the Top 10 Zip Codes with the Highest Percentage of Households with Income Below $10,000 in Kansas City, MO?
Top 10 Zip Codes with the Highest Percentage of Households with Income Below $10,000 in Kansas City, MO are:
What zip code has the Highest Percentage of Households with Income Below $10,000 in Kansas City, MO?
64147 has the Highest Percentage of Households with Income Below $10,000 in Kansas City, MO with 53.3%.
What is the Percentage of Households with Income Below $10,000 in Kansas City, MO?
Percentage of Households with Income Below $10,000 in Kansas City is 6.2%.
What is the Percentage of Households with Income Below $10,000 in Missouri?
Percentage of Households with Income Below $10,000 in Missouri is 5.0%.
What is the Percentage of Households with Income Below $10,000 in the United States?
Percentage of Households with Income Below $10,000 in the United States is 4.9%.