Zip Codes with the Highest Percentage of Population Employed in Accommodation & Food Services in Kansas City, MO

RELATED REPORTS & OPTIONS

Accommodation & Food Services
Population
Families and Households
Female Fertility
Female Fertility (Unmarried)
Race (Community Size)
Race (Percentage)
Ancestry (Community Size)
AfghanAfricanAlaska NativeAlbanianAmericanApacheArabArgentineanArmenianAustralianAustrianBahamianBangladeshiBelgianBelizeanBhutaneseBlackfeetBolivianBrazilianBritishBulgarianBurmeseCanadianCelticCentral AmericanCentral American IndianCherokeeChickasawChileanChippewaChoctawColombianComancheCosta RicanCreeCreekCroatianCrowCubanCzechCzechoslovakianDanishDominicanDutchDutch West IndianEastern EuropeanEcuadorianEgyptianEnglishEthiopianEuropeanFijianFilipinoFinnishFrenchFrench American IndianFrench CanadianGermanGerman RussianGhanaianGreekGuamanian / ChamorroGuatemalanGuyaneseHaitianHonduranHungarianIcelanderIndian (Asian)IndonesianIranianIraqiIrishIroquoisIsraeliItalianJamaicanJapaneseJordanianKenyanKoreanLaotianLatvianLebaneseLiberianLithuanianLuxembourgerMalaysianMexicanMexican American IndianMongolianMoroccanNative HawaiianNavajoNew ZealanderNicaraguanNigerianNorthern EuropeanNorwegianOsageOttawaPakistaniPalestinianPanamanianPennsylvania GermanPeruvianPolishPortuguesePotawatomiPuebloPuerto RicanRomanianRussianSalvadoranSamoanScandinavianScotch-IrishScottishSeminoleSerbianShoshoneSierra LeoneanSiouxSlavicSlovakSloveneSomaliSouth AfricanSouth AmericanSouth American IndianSpaniardSpanishSri LankanSubsaharan AfricanSudaneseSwedishSwissSyrianThaiTrinidadian and TobagonianTurkishUgandanUkrainianUruguayanVenezuelanVietnameseWelshWest IndianYugoslavian
Ancestry (Percentage)
AfghanAfricanAlaska NativeAlbanianAmericanApacheArabArgentineanArmenianAustralianAustrianBahamianBangladeshiBelgianBelizeanBhutaneseBlackfeetBolivianBrazilianBritishBulgarianBurmeseCanadianCelticCentral AmericanCentral American IndianCherokeeChickasawChileanChippewaChoctawColombianComancheCosta RicanCreeCreekCroatianCrowCubanCzechCzechoslovakianDanishDominicanDutchDutch West IndianEastern EuropeanEcuadorianEgyptianEnglishEthiopianEuropeanFijianFilipinoFinnishFrenchFrench American IndianFrench CanadianGermanGerman RussianGhanaianGreekGuamanian / ChamorroGuatemalanGuyaneseHaitianHonduranHungarianIcelanderIndian (Asian)IndonesianIranianIraqiIrishIroquoisIsraeliItalianJamaicanJapaneseJordanianKenyanKoreanLaotianLatvianLebaneseLiberianLithuanianLuxembourgerMalaysianMexicanMexican American IndianMongolianMoroccanNative HawaiianNavajoNew ZealanderNicaraguanNigerianNorthern EuropeanNorwegianOsageOttawaPakistaniPalestinianPanamanianPennsylvania GermanPeruvianPolishPortuguesePotawatomiPuebloPuerto RicanRomanianRussianSalvadoranSamoanScandinavianScotch-IrishScottishSeminoleSerbianShoshoneSierra LeoneanSiouxSlavicSlovakSloveneSomaliSouth AfricanSouth AmericanSouth American IndianSpaniardSpanishSri LankanSubsaharan AfricanSudaneseSwedishSwissSyrianThaiTrinidadian and TobagonianTurkishUgandanUkrainianUruguayanVenezuelanVietnameseWelshWest IndianYugoslavian
Immigrant Origin (Total)
AfghanistanAfricaArgentinaAsiaAustraliaBahamasBangladeshBelarusBelgiumBelizeBoliviaBosnia and HerzegovinaBrazilBulgariaBurma / MyanmarCambodiaCameroonCanadaCaribbeanCentral AmericaChileChinaColombiaCongoCosta RicaCubaCzechoslovakiaDenmarkDominican RepublicEastern AfricaEastern AsiaEastern EuropeEcuadorEgyptEl SalvadorEnglandEritreaEthiopiaEuropeFijiFranceGermanyGhanaGreeceGuatemalaGuyanaHaitiHondurasHong KongHungaryIndiaIndonesiaIranIraqIrelandIsraelItalyJamaicaJapanJordanKazakhstanKenyaKoreaKuwaitLaosLatin AmericaLebanonLiberiaMalaysiaMexicoMicronesiaMiddle AfricaMoroccoNepalNetherlandsNicaraguaNigeriaNorthern AfricaNorthern EuropeOceaniaPakistanPeruPhilippinesPolandPortugalRomaniaRussiaSaudi ArabiaScotlandSierra LeoneSomaliaSouth AfricaSouth AmericaSouth Central AsiaSouth Eastern AsiaSouthern EuropeSpainSri LankaSudanSwedenSwitzerlandSyriaTaiwanThailandTrinidad and TobagoTurkeyUgandaUkraineUruguayVenezuelaVietnamWestern AfricaWestern AsiaWestern EuropeZaireZimbabwe
Immigrant Origin (Percentage)
AfghanistanAfricaArgentinaAsiaAustraliaBahamasBangladeshBelarusBelgiumBelizeBoliviaBosnia and HerzegovinaBrazilBulgariaBurma / MyanmarCambodiaCameroonCanadaCaribbeanCentral AmericaChileChinaColombiaCongoCosta RicaCubaCzechoslovakiaDenmarkDominican RepublicEastern AfricaEastern AsiaEastern EuropeEcuadorEgyptEl SalvadorEnglandEritreaEthiopiaEuropeFijiFranceGermanyGhanaGreeceGuatemalaGuyanaHaitiHondurasHong KongHungaryIndiaIndonesiaIranIraqIrelandIsraelItalyJamaicaJapanJordanKazakhstanKenyaKoreaKuwaitLaosLatin AmericaLebanonLiberiaMalaysiaMexicoMicronesiaMiddle AfricaMoroccoNepalNetherlandsNicaraguaNigeriaNorthern AfricaNorthern EuropeOceaniaPakistanPeruPhilippinesPolandPortugalRomaniaRussiaSaudi ArabiaScotlandSierra LeoneSomaliaSouth AfricaSouth AmericaSouth Central AsiaSouth Eastern AsiaSouthern EuropeSpainSri LankaSudanSwedenSwitzerlandSyriaTaiwanThailandTrinidad and TobagoTurkeyUgandaUkraineUruguayVenezuelaVietnamWestern AfricaWestern AsiaWestern EuropeZaireZimbabwe
Income
Income (Families)
Income (Households)
Poverty
Poverty (Families)
Unemployment
Employment Occupations
Employment Industries
Employer Class
Commute Time
Commute Means
School Enrollment
Education by Degree Field
Occupancy
Finances
Physical Characteristics
Kansas City
Compare Zip Codes
Comparison Subject

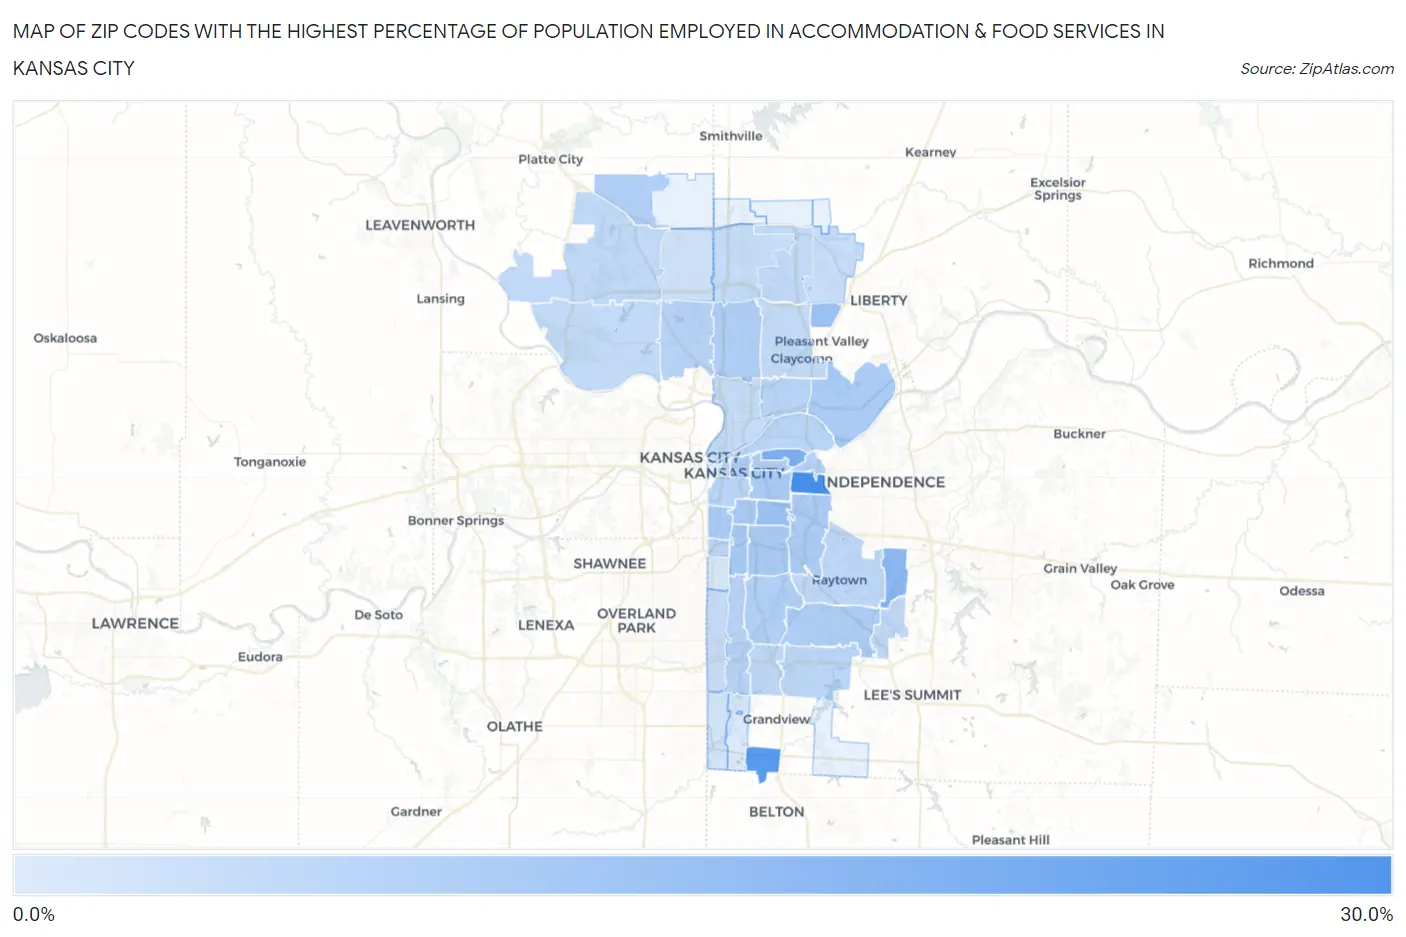
Map of Zip Codes with the Highest Percentage of Population Employed in Accommodation & Food Services in Kansas City

0.0%
30.0%
Zip Codes with the Highest Percentage of Population Employed in Accommodation & Food Services in Kansas City Map

Zip Codes with the Highest Percentage of Population Employed in Accommodation & Food Services in Kansas City, MO

Zip Code % Employed vs State vs National
1.6412625.1%6.6%(+18.5)#156.9%(+18.2)#501
2.6414722.4%6.6%(+15.8)#216.9%(+15.5)#654
3.6412316.1%6.6%(+9.57)#486.9%(+9.27)#1,418
4.6413613.8%6.6%(+7.21)#636.9%(+6.90)#2,030
5.6412811.4%6.6%(+4.87)#946.9%(+4.56)#3,201
6.6415811.3%6.6%(+4.75)#986.9%(+4.44)#3,298
7.641109.7%6.6%(+3.10)#1396.9%(+2.79)#4,963
8.641119.6%6.6%(+2.98)#1446.9%(+2.68)#5,138
9.641309.6%6.6%(+2.98)#1466.9%(+2.67)#5,147
10.641279.4%6.6%(+2.79)#1556.9%(+2.48)#5,402
11.641619.3%6.6%(+2.71)#1576.9%(+2.40)#5,524
12.641099.3%6.6%(+2.70)#1586.9%(+2.39)#5,548
13.641299.0%6.6%(+2.41)#1706.9%(+2.10)#5,982
14.641188.8%6.6%(+2.20)#1816.9%(+1.90)#6,321
15.641388.6%6.6%(+1.99)#1926.9%(+1.68)#6,709
16.641248.3%6.6%(+1.76)#2046.9%(+1.45)#7,130
17.641638.3%6.6%(+1.69)#2066.9%(+1.39)#7,287
18.641328.1%6.6%(+1.54)#2136.9%(+1.24)#7,594
19.641067.9%6.6%(+1.32)#2226.9%(+1.01)#8,049
20.641257.8%6.6%(+1.25)#2276.9%(+0.942)#8,207
21.641517.4%6.6%(+0.820)#2526.9%(+0.513)#9,272
22.641317.3%6.6%(+0.718)#2586.9%(+0.412)#9,553
23.641087.0%6.6%(+0.460)#2746.9%(+0.153)#10,215
24.641177.0%6.6%(+0.427)#2756.9%(+0.120)#10,300
25.641206.9%6.6%(+0.322)#2856.9%(+0.016)#10,606
26.641126.8%6.6%(+0.265)#2886.9%(-0.042)#10,752
27.641346.8%6.6%(+0.225)#2926.9%(-0.081)#10,889
28.641336.5%6.6%(-0.078)#3166.9%(-0.384)#11,862
29.641376.3%6.6%(-0.241)#3296.9%(-0.547)#12,369
30.641566.0%6.6%(-0.621)#3686.9%(-0.927)#13,597
31.641395.9%6.6%(-0.671)#3766.9%(-0.978)#13,762
32.641535.9%6.6%(-0.674)#3786.9%(-0.980)#13,769
33.641525.8%6.6%(-0.752)#3846.9%(-1.06)#14,020
34.641195.7%6.6%(-0.887)#3926.9%(-1.19)#14,437
35.641055.6%6.6%(-0.970)#3996.9%(-1.28)#14,688
36.641165.5%6.6%(-1.04)#4086.9%(-1.35)#14,944
37.641555.3%6.6%(-1.29)#4266.9%(-1.60)#15,836
38.641145.1%6.6%(-1.43)#4396.9%(-1.74)#16,302
39.641575.0%6.6%(-1.53)#4526.9%(-1.84)#16,691
40.641543.9%6.6%(-2.63)#5616.9%(-2.94)#20,336
41.641453.5%6.6%(-3.03)#6026.9%(-3.33)#21,620
42.641132.9%6.6%(-3.66)#6556.9%(-3.97)#23,447
43.641462.2%6.6%(-4.42)#7296.9%(-4.72)#25,236

Common Questions

What are the Top 10 Zip Codes with the Highest Percentage of Population Employed in Accommodation & Food Services in Kansas City, MO?
Top 10 Zip Codes with the Highest Percentage of Population Employed in Accommodation & Food Services in Kansas City, MO are:
#1
25.1%
#2
22.4%
#3
16.1%
#4
13.8%
#5
11.4%
#6
11.3%
#7
9.7%
#8
9.6%
#9
9.6%
#10
9.4%
What zip code has the Highest Percentage of Population Employed in Accommodation & Food Services in Kansas City, MO?
64126 has the Highest Percentage of Population Employed in Accommodation & Food Services in Kansas City, MO with 25.1%.
What is the Percentage of Population Employed in Accommodation & Food Services in Kansas City, MO?
Percentage of Population Employed in Accommodation & Food Services in Kansas City is 7.3%.
What is the Percentage of Population Employed in Accommodation & Food Services in Missouri?
Percentage of Population Employed in Accommodation & Food Services in Missouri is 6.6%.
What is the Percentage of Population Employed in Accommodation & Food Services in the United States?
Percentage of Population Employed in Accommodation & Food Services in the United States is 6.9%.