Zip Codes with the Highest Percentage of Families with Income Below $10,000 in Kansas City, MO

RELATED REPORTS & OPTIONS

Family Income | $0-10k
Population
Families and Households
Female Fertility
Female Fertility (Unmarried)
Race (Community Size)
Race (Percentage)
Ancestry (Community Size)
AfghanAfricanAlaska NativeAlbanianAmericanApacheArabArgentineanArmenianAustralianAustrianBahamianBangladeshiBelgianBelizeanBhutaneseBlackfeetBolivianBrazilianBritishBulgarianBurmeseCanadianCelticCentral AmericanCentral American IndianCherokeeChickasawChileanChippewaChoctawColombianComancheCosta RicanCreeCreekCroatianCrowCubanCzechCzechoslovakianDanishDominicanDutchDutch West IndianEastern EuropeanEcuadorianEgyptianEnglishEthiopianEuropeanFijianFilipinoFinnishFrenchFrench American IndianFrench CanadianGermanGerman RussianGhanaianGreekGuamanian / ChamorroGuatemalanGuyaneseHaitianHonduranHungarianIcelanderIndian (Asian)IndonesianIranianIraqiIrishIroquoisIsraeliItalianJamaicanJapaneseJordanianKenyanKoreanLaotianLatvianLebaneseLiberianLithuanianLuxembourgerMalaysianMexicanMexican American IndianMongolianMoroccanNative HawaiianNavajoNew ZealanderNicaraguanNigerianNorthern EuropeanNorwegianOsageOttawaPakistaniPalestinianPanamanianPennsylvania GermanPeruvianPolishPortuguesePotawatomiPuebloPuerto RicanRomanianRussianSalvadoranSamoanScandinavianScotch-IrishScottishSeminoleSerbianShoshoneSierra LeoneanSiouxSlavicSlovakSloveneSomaliSouth AfricanSouth AmericanSouth American IndianSpaniardSpanishSri LankanSubsaharan AfricanSudaneseSwedishSwissSyrianThaiTrinidadian and TobagonianTurkishUgandanUkrainianUruguayanVenezuelanVietnameseWelshWest IndianYugoslavian
Ancestry (Percentage)
AfghanAfricanAlaska NativeAlbanianAmericanApacheArabArgentineanArmenianAustralianAustrianBahamianBangladeshiBelgianBelizeanBhutaneseBlackfeetBolivianBrazilianBritishBulgarianBurmeseCanadianCelticCentral AmericanCentral American IndianCherokeeChickasawChileanChippewaChoctawColombianComancheCosta RicanCreeCreekCroatianCrowCubanCzechCzechoslovakianDanishDominicanDutchDutch West IndianEastern EuropeanEcuadorianEgyptianEnglishEthiopianEuropeanFijianFilipinoFinnishFrenchFrench American IndianFrench CanadianGermanGerman RussianGhanaianGreekGuamanian / ChamorroGuatemalanGuyaneseHaitianHonduranHungarianIcelanderIndian (Asian)IndonesianIranianIraqiIrishIroquoisIsraeliItalianJamaicanJapaneseJordanianKenyanKoreanLaotianLatvianLebaneseLiberianLithuanianLuxembourgerMalaysianMexicanMexican American IndianMongolianMoroccanNative HawaiianNavajoNew ZealanderNicaraguanNigerianNorthern EuropeanNorwegianOsageOttawaPakistaniPalestinianPanamanianPennsylvania GermanPeruvianPolishPortuguesePotawatomiPuebloPuerto RicanRomanianRussianSalvadoranSamoanScandinavianScotch-IrishScottishSeminoleSerbianShoshoneSierra LeoneanSiouxSlavicSlovakSloveneSomaliSouth AfricanSouth AmericanSouth American IndianSpaniardSpanishSri LankanSubsaharan AfricanSudaneseSwedishSwissSyrianThaiTrinidadian and TobagonianTurkishUgandanUkrainianUruguayanVenezuelanVietnameseWelshWest IndianYugoslavian
Immigrant Origin (Total)
AfghanistanAfricaArgentinaAsiaAustraliaBahamasBangladeshBelarusBelgiumBelizeBoliviaBosnia and HerzegovinaBrazilBulgariaBurma / MyanmarCambodiaCameroonCanadaCaribbeanCentral AmericaChileChinaColombiaCongoCosta RicaCubaCzechoslovakiaDenmarkDominican RepublicEastern AfricaEastern AsiaEastern EuropeEcuadorEgyptEl SalvadorEnglandEritreaEthiopiaEuropeFijiFranceGermanyGhanaGreeceGuatemalaGuyanaHaitiHondurasHong KongHungaryIndiaIndonesiaIranIraqIrelandIsraelItalyJamaicaJapanJordanKazakhstanKenyaKoreaKuwaitLaosLatin AmericaLebanonLiberiaMalaysiaMexicoMicronesiaMiddle AfricaMoroccoNepalNetherlandsNicaraguaNigeriaNorthern AfricaNorthern EuropeOceaniaPakistanPeruPhilippinesPolandPortugalRomaniaRussiaSaudi ArabiaScotlandSierra LeoneSomaliaSouth AfricaSouth AmericaSouth Central AsiaSouth Eastern AsiaSouthern EuropeSpainSri LankaSudanSwedenSwitzerlandSyriaTaiwanThailandTrinidad and TobagoTurkeyUgandaUkraineUruguayVenezuelaVietnamWestern AfricaWestern AsiaWestern EuropeZaireZimbabwe
Immigrant Origin (Percentage)
AfghanistanAfricaArgentinaAsiaAustraliaBahamasBangladeshBelarusBelgiumBelizeBoliviaBosnia and HerzegovinaBrazilBulgariaBurma / MyanmarCambodiaCameroonCanadaCaribbeanCentral AmericaChileChinaColombiaCongoCosta RicaCubaCzechoslovakiaDenmarkDominican RepublicEastern AfricaEastern AsiaEastern EuropeEcuadorEgyptEl SalvadorEnglandEritreaEthiopiaEuropeFijiFranceGermanyGhanaGreeceGuatemalaGuyanaHaitiHondurasHong KongHungaryIndiaIndonesiaIranIraqIrelandIsraelItalyJamaicaJapanJordanKazakhstanKenyaKoreaKuwaitLaosLatin AmericaLebanonLiberiaMalaysiaMexicoMicronesiaMiddle AfricaMoroccoNepalNetherlandsNicaraguaNigeriaNorthern AfricaNorthern EuropeOceaniaPakistanPeruPhilippinesPolandPortugalRomaniaRussiaSaudi ArabiaScotlandSierra LeoneSomaliaSouth AfricaSouth AmericaSouth Central AsiaSouth Eastern AsiaSouthern EuropeSpainSri LankaSudanSwedenSwitzerlandSyriaTaiwanThailandTrinidad and TobagoTurkeyUgandaUkraineUruguayVenezuelaVietnamWestern AfricaWestern AsiaWestern EuropeZaireZimbabwe
Income
Income (Families)
Income (Households)
Poverty
Poverty (Families)
Unemployment
Employment Occupations
Employment Industries
Employer Class
Commute Time
Commute Means
School Enrollment
Education by Degree Field
Occupancy
Finances
Physical Characteristics
Kansas City
Compare Zip Codes
Comparison Subject

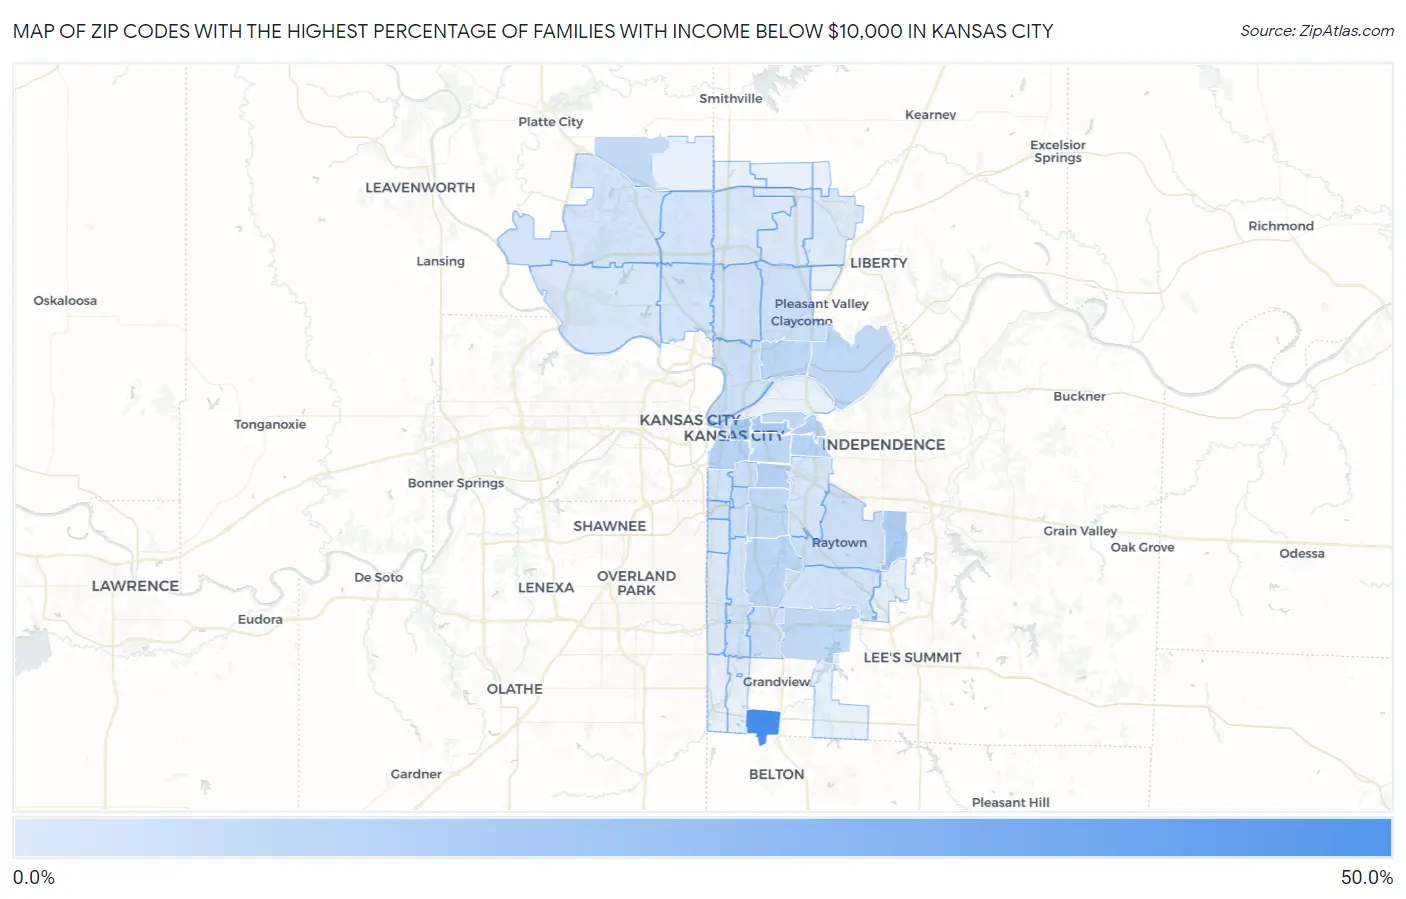
Map of Zip Codes with the Highest Percentage of Families with Income Below $10,000 in Kansas City

0.0%
50.0%
Zip Codes with the Highest Percentage of Families with Income Below $10,000 in Kansas City Map

Zip Codes with the Highest Percentage of Families with Income Below $10,000 in Kansas City, MO

Zip Code Families with Income < $10k vs State vs National
1.6414740.3%2.8%(+37.5)#33.1%(+37.2)#107
2.6410611.9%2.8%(+9.10)#403.1%(+8.80)#1,343
3.6413611.2%2.8%(+8.40)#433.1%(+8.10)#1,538
4.6412411.0%2.8%(+8.20)#463.1%(+7.90)#1,587
5.641289.1%2.8%(+6.30)#693.1%(+6.00)#2,301
6.641089.0%2.8%(+6.20)#713.1%(+5.90)#2,369
7.641258.6%2.8%(+5.80)#803.1%(+5.50)#2,590
8.641268.5%2.8%(+5.70)#833.1%(+5.40)#2,649
9.641177.3%2.8%(+4.50)#1113.1%(+4.20)#3,402
10.641327.0%2.8%(+4.20)#1233.1%(+3.90)#3,645
11.641276.9%2.8%(+4.10)#1293.1%(+3.80)#3,708
12.641616.4%2.8%(+3.60)#1433.1%(+3.30)#4,281
13.641346.1%2.8%(+3.30)#1463.1%(+3.00)#4,544
14.641305.9%2.8%(+3.10)#1543.1%(+2.80)#4,793
15.641235.8%2.8%(+3.00)#1663.1%(+2.70)#4,936
16.641635.8%2.8%(+3.00)#1703.1%(+2.70)#4,987
17.641094.0%2.8%(+1.20)#2693.1%(+0.900)#8,224
18.641103.7%2.8%(+0.900)#2933.1%(+0.600)#9,011
19.641333.5%2.8%(+0.700)#3053.1%(+0.400)#9,494
20.641193.3%2.8%(+0.500)#3273.1%(+0.200)#10,137
21.641163.2%2.8%(+0.400)#3343.1%(+0.100)#10,514
22.641373.2%2.8%(+0.400)#3363.1%(+0.100)#10,553
23.641183.0%2.8%(+0.200)#3583.1%(-0.100)#11,093
24.641122.7%2.8%(-0.100)#4013.1%(-0.400)#12,399
25.641542.5%2.8%(-0.300)#4213.1%(-0.600)#13,186
26.641512.4%2.8%(-0.400)#4313.1%(-0.700)#13,504
27.641382.4%2.8%(-0.400)#4323.1%(-0.700)#13,527
28.641312.4%2.8%(-0.400)#4333.1%(-0.700)#13,538
29.641112.4%2.8%(-0.400)#4343.1%(-0.700)#13,563
30.641532.3%2.8%(-0.500)#4523.1%(-0.800)#14,106
31.641051.6%2.8%(-1.20)#5483.1%(-1.50)#17,436
32.641521.5%2.8%(-1.30)#5603.1%(-1.60)#17,727
33.641291.1%2.8%(-1.70)#6243.1%(-2.00)#19,920
34.641550.80%2.8%(-2.00)#6653.1%(-2.30)#21,247
35.641560.50%2.8%(-2.30)#7123.1%(-2.60)#22,783
36.641570.40%2.8%(-2.40)#7183.1%(-2.70)#23,037
37.641130.30%2.8%(-2.50)#7243.1%(-2.80)#23,430
38.641140.20%2.8%(-2.60)#7333.1%(-2.90)#23,661

Common Questions

What are the Top 10 Zip Codes with the Highest Percentage of Families with Income Below $10,000 in Kansas City, MO?
Top 10 Zip Codes with the Highest Percentage of Families with Income Below $10,000 in Kansas City, MO are:
#1
40.3%
#2
11.9%
#3
11.2%
#4
11.0%
#5
9.1%
#6
9.0%
#7
8.6%
#8
8.5%
#9
7.3%
#10
7.0%
What zip code has the Highest Percentage of Families with Income Below $10,000 in Kansas City, MO?
64147 has the Highest Percentage of Families with Income Below $10,000 in Kansas City, MO with 40.3%.
What is the Percentage of Families with Income Below $10,000 in Kansas City, MO?
Percentage of Families with Income Below $10,000 in Kansas City is 3.6%.
What is the Percentage of Families with Income Below $10,000 in Missouri?
Percentage of Families with Income Below $10,000 in Missouri is 2.8%.
What is the Percentage of Families with Income Below $10,000 in the United States?
Percentage of Families with Income Below $10,000 in the United States is 3.1%.