Zip Codes with the Highest Percentage of Population Employed in Life, Physical & Social Science in Kansas City, MO
RELATED REPORTS & OPTIONS
Life, Physical & Social Science
Kansas City
Compare Zip Codes
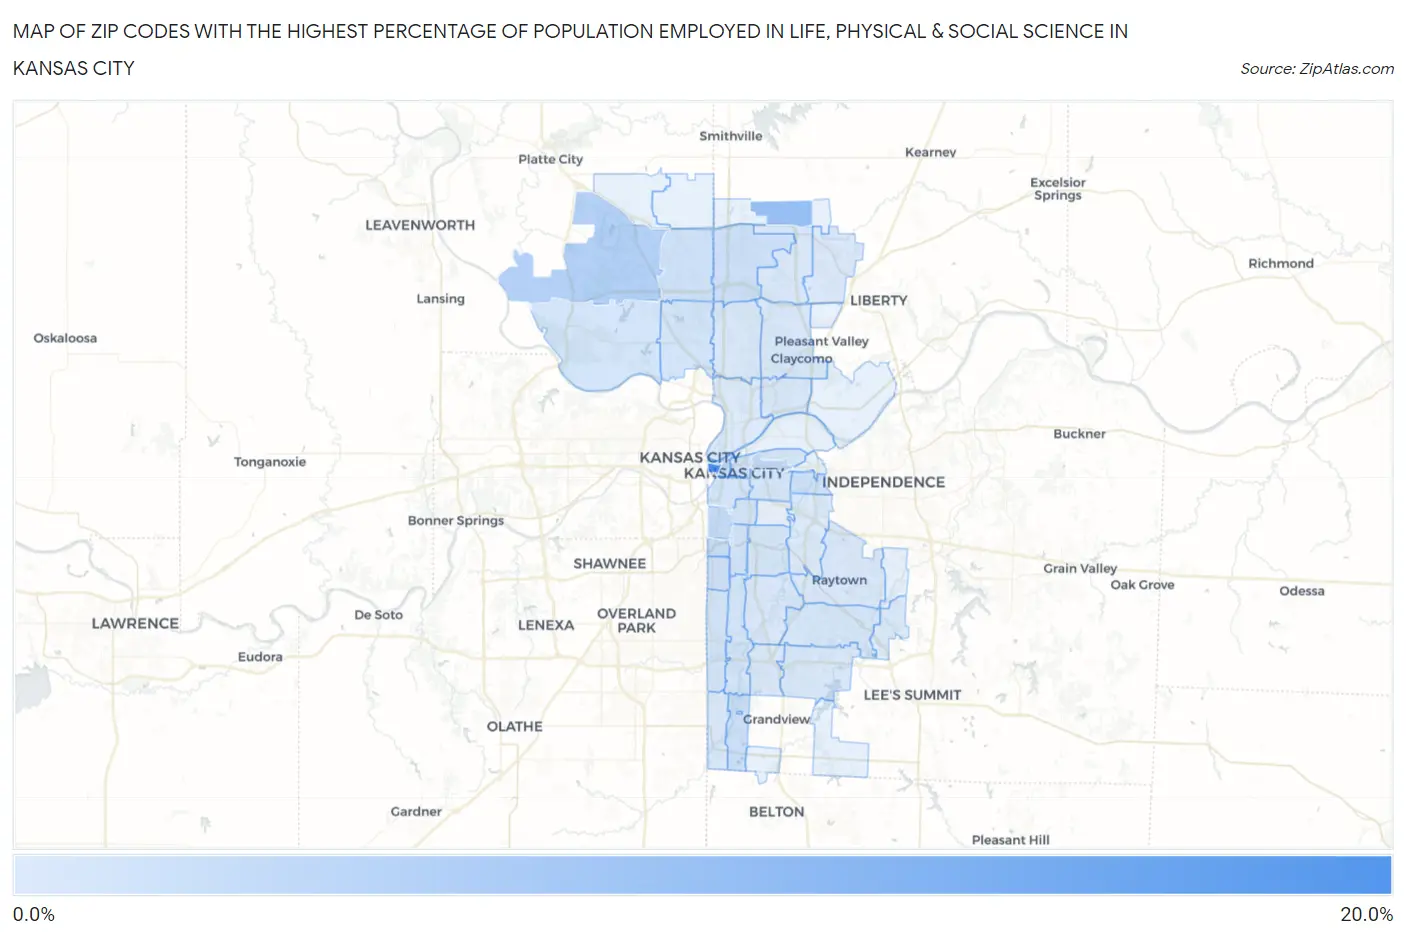
Map of Zip Codes with the Highest Percentage of Population Employed in Life, Physical & Social Science in Kansas City
0.21%
16.9%
Zip Codes with the Highest Percentage of Population Employed in Life, Physical & Social Science in Kansas City, MO
| Zip Code | % Employed | vs State | vs National | |
| 1. | 64101 | 16.9% | 0.98%(+15.9)#3 | 1.1%(+15.8)#86 |
| 2. | 64166 | 7.5% | 0.98%(+6.50)#10 | 1.1%(+6.39)#364 |
| 3. | 64153 | 4.6% | 0.98%(+3.62)#19 | 1.1%(+3.51)#886 |
| 4. | 64124 | 3.0% | 0.98%(+2.01)#35 | 1.1%(+1.90)#1,887 |
| 5. | 64111 | 2.8% | 0.98%(+1.80)#40 | 1.1%(+1.69)#2,139 |
| 6. | 64105 | 2.5% | 0.98%(+1.54)#49 | 1.1%(+1.43)#2,523 |
| 7. | 64112 | 2.3% | 0.98%(+1.30)#60 | 1.1%(+1.19)#2,986 |
| 8. | 64146 | 2.0% | 0.98%(+1.02)#84 | 1.1%(+0.912)#3,680 |
| 9. | 64155 | 1.9% | 0.98%(+0.886)#89 | 1.1%(+0.778)#4,078 |
| 10. | 64113 | 1.7% | 0.98%(+0.731)#98 | 1.1%(+0.622)#4,663 |
| 11. | 64126 | 1.6% | 0.98%(+0.667)#102 | 1.1%(+0.558)#4,952 |
| 12. | 64154 | 1.6% | 0.98%(+0.609)#107 | 1.1%(+0.500)#5,197 |
| 13. | 64106 | 1.4% | 0.98%(+0.397)#132 | 1.1%(+0.288)#6,315 |
| 14. | 64110 | 1.3% | 0.98%(+0.308)#142 | 1.1%(+0.199)#6,871 |
| 15. | 64152 | 1.3% | 0.98%(+0.304)#147 | 1.1%(+0.195)#6,895 |
| 16. | 64114 | 1.3% | 0.98%(+0.284)#153 | 1.1%(+0.175)#7,025 |
| 17. | 64151 | 1.3% | 0.98%(+0.274)#155 | 1.1%(+0.165)#7,088 |
| 18. | 64131 | 1.1% | 0.98%(+0.162)#177 | 1.1%(+0.054)#7,898 |
| 19. | 64109 | 1.1% | 0.98%(+0.154)#178 | 1.1%(+0.045)#7,971 |
| 20. | 64108 | 1.1% | 0.98%(+0.072)#193 | 1.1%(-0.037)#8,588 |
| 21. | 64127 | 1.0% | 0.98%(+0.046)#198 | 1.1%(-0.063)#8,817 |
| 22. | 64138 | 1.0% | 0.98%(+0.026)#202 | 1.1%(-0.083)#8,994 |
| 23. | 64123 | 0.89% | 0.98%(-0.088)#217 | 1.1%(-0.197)#10,020 |
| 24. | 64130 | 0.83% | 0.98%(-0.150)#227 | 1.1%(-0.259)#10,664 |
| 25. | 64156 | 0.81% | 0.98%(-0.176)#231 | 1.1%(-0.284)#10,927 |
| 26. | 64134 | 0.80% | 0.98%(-0.186)#235 | 1.1%(-0.295)#11,034 |
| 27. | 64119 | 0.79% | 0.98%(-0.193)#237 | 1.1%(-0.302)#11,108 |
| 28. | 64118 | 0.68% | 0.98%(-0.306)#265 | 1.1%(-0.415)#12,338 |
| 29. | 64117 | 0.59% | 0.98%(-0.393)#299 | 1.1%(-0.502)#13,428 |
| 30. | 64145 | 0.55% | 0.98%(-0.436)#310 | 1.1%(-0.545)#13,954 |
| 31. | 64132 | 0.51% | 0.98%(-0.472)#320 | 1.1%(-0.581)#14,381 |
| 32. | 64157 | 0.48% | 0.98%(-0.504)#331 | 1.1%(-0.613)#14,794 |
| 33. | 64137 | 0.45% | 0.98%(-0.536)#336 | 1.1%(-0.645)#15,190 |
| 34. | 64133 | 0.37% | 0.98%(-0.608)#365 | 1.1%(-0.717)#16,088 |
| 35. | 64139 | 0.26% | 0.98%(-0.718)#403 | 1.1%(-0.827)#17,481 |
| 36. | 64129 | 0.26% | 0.98%(-0.719)#405 | 1.1%(-0.828)#17,504 |
| 37. | 64116 | 0.21% | 0.98%(-0.770)#418 | 1.1%(-0.879)#18,052 |
1
Common Questions
What are the Top 10 Zip Codes with the Highest Percentage of Population Employed in Life, Physical & Social Science in Kansas City, MO?
Top 10 Zip Codes with the Highest Percentage of Population Employed in Life, Physical & Social Science in Kansas City, MO are:
What zip code has the Highest Percentage of Population Employed in Life, Physical & Social Science in Kansas City, MO?
64101 has the Highest Percentage of Population Employed in Life, Physical & Social Science in Kansas City, MO with 16.9%.
What is the Percentage of Population Employed in Life, Physical & Social Science in Kansas City, MO?
Percentage of Population Employed in Life, Physical & Social Science in Kansas City is 1.2%.
What is the Percentage of Population Employed in Life, Physical & Social Science in Missouri?
Percentage of Population Employed in Life, Physical & Social Science in Missouri is 0.98%.
What is the Percentage of Population Employed in Life, Physical & Social Science in the United States?
Percentage of Population Employed in Life, Physical & Social Science in the United States is 1.1%.