Zip Codes with the Highest Percentage of Population Employed in Firefighting & Prevention in Kansas City, MO

RELATED REPORTS & OPTIONS

Firefighting & Prevention
Population
Families and Households
Female Fertility
Female Fertility (Unmarried)
Race (Community Size)
Race (Percentage)
Ancestry (Community Size)
AfghanAfricanAlaska NativeAlbanianAmericanApacheArabArgentineanArmenianAustralianAustrianBahamianBangladeshiBelgianBelizeanBhutaneseBlackfeetBolivianBrazilianBritishBulgarianBurmeseCanadianCelticCentral AmericanCentral American IndianCherokeeChickasawChileanChippewaChoctawColombianComancheCosta RicanCreeCreekCroatianCrowCubanCzechCzechoslovakianDanishDominicanDutchDutch West IndianEastern EuropeanEcuadorianEgyptianEnglishEthiopianEuropeanFijianFilipinoFinnishFrenchFrench American IndianFrench CanadianGermanGerman RussianGhanaianGreekGuamanian / ChamorroGuatemalanGuyaneseHaitianHonduranHungarianIcelanderIndian (Asian)IndonesianIranianIraqiIrishIroquoisIsraeliItalianJamaicanJapaneseJordanianKenyanKoreanLaotianLatvianLebaneseLiberianLithuanianLuxembourgerMalaysianMexicanMexican American IndianMongolianMoroccanNative HawaiianNavajoNew ZealanderNicaraguanNigerianNorthern EuropeanNorwegianOsageOttawaPakistaniPalestinianPanamanianPennsylvania GermanPeruvianPolishPortuguesePotawatomiPuebloPuerto RicanRomanianRussianSalvadoranSamoanScandinavianScotch-IrishScottishSeminoleSerbianShoshoneSierra LeoneanSiouxSlavicSlovakSloveneSomaliSouth AfricanSouth AmericanSouth American IndianSpaniardSpanishSri LankanSubsaharan AfricanSudaneseSwedishSwissSyrianThaiTrinidadian and TobagonianTurkishUgandanUkrainianUruguayanVenezuelanVietnameseWelshWest IndianYugoslavian
Ancestry (Percentage)
AfghanAfricanAlaska NativeAlbanianAmericanApacheArabArgentineanArmenianAustralianAustrianBahamianBangladeshiBelgianBelizeanBhutaneseBlackfeetBolivianBrazilianBritishBulgarianBurmeseCanadianCelticCentral AmericanCentral American IndianCherokeeChickasawChileanChippewaChoctawColombianComancheCosta RicanCreeCreekCroatianCrowCubanCzechCzechoslovakianDanishDominicanDutchDutch West IndianEastern EuropeanEcuadorianEgyptianEnglishEthiopianEuropeanFijianFilipinoFinnishFrenchFrench American IndianFrench CanadianGermanGerman RussianGhanaianGreekGuamanian / ChamorroGuatemalanGuyaneseHaitianHonduranHungarianIcelanderIndian (Asian)IndonesianIranianIraqiIrishIroquoisIsraeliItalianJamaicanJapaneseJordanianKenyanKoreanLaotianLatvianLebaneseLiberianLithuanianLuxembourgerMalaysianMexicanMexican American IndianMongolianMoroccanNative HawaiianNavajoNew ZealanderNicaraguanNigerianNorthern EuropeanNorwegianOsageOttawaPakistaniPalestinianPanamanianPennsylvania GermanPeruvianPolishPortuguesePotawatomiPuebloPuerto RicanRomanianRussianSalvadoranSamoanScandinavianScotch-IrishScottishSeminoleSerbianShoshoneSierra LeoneanSiouxSlavicSlovakSloveneSomaliSouth AfricanSouth AmericanSouth American IndianSpaniardSpanishSri LankanSubsaharan AfricanSudaneseSwedishSwissSyrianThaiTrinidadian and TobagonianTurkishUgandanUkrainianUruguayanVenezuelanVietnameseWelshWest IndianYugoslavian
Immigrant Origin (Total)
AfghanistanAfricaArgentinaAsiaAustraliaBahamasBangladeshBelarusBelgiumBelizeBoliviaBosnia and HerzegovinaBrazilBulgariaBurma / MyanmarCambodiaCameroonCanadaCaribbeanCentral AmericaChileChinaColombiaCongoCosta RicaCubaCzechoslovakiaDenmarkDominican RepublicEastern AfricaEastern AsiaEastern EuropeEcuadorEgyptEl SalvadorEnglandEritreaEthiopiaEuropeFijiFranceGermanyGhanaGreeceGuatemalaGuyanaHaitiHondurasHong KongHungaryIndiaIndonesiaIranIraqIrelandIsraelItalyJamaicaJapanJordanKazakhstanKenyaKoreaKuwaitLaosLatin AmericaLebanonLiberiaMalaysiaMexicoMicronesiaMiddle AfricaMoroccoNepalNetherlandsNicaraguaNigeriaNorthern AfricaNorthern EuropeOceaniaPakistanPeruPhilippinesPolandPortugalRomaniaRussiaSaudi ArabiaScotlandSierra LeoneSomaliaSouth AfricaSouth AmericaSouth Central AsiaSouth Eastern AsiaSouthern EuropeSpainSri LankaSudanSwedenSwitzerlandSyriaTaiwanThailandTrinidad and TobagoTurkeyUgandaUkraineUruguayVenezuelaVietnamWestern AfricaWestern AsiaWestern EuropeZaireZimbabwe
Immigrant Origin (Percentage)
AfghanistanAfricaArgentinaAsiaAustraliaBahamasBangladeshBelarusBelgiumBelizeBoliviaBosnia and HerzegovinaBrazilBulgariaBurma / MyanmarCambodiaCameroonCanadaCaribbeanCentral AmericaChileChinaColombiaCongoCosta RicaCubaCzechoslovakiaDenmarkDominican RepublicEastern AfricaEastern AsiaEastern EuropeEcuadorEgyptEl SalvadorEnglandEritreaEthiopiaEuropeFijiFranceGermanyGhanaGreeceGuatemalaGuyanaHaitiHondurasHong KongHungaryIndiaIndonesiaIranIraqIrelandIsraelItalyJamaicaJapanJordanKazakhstanKenyaKoreaKuwaitLaosLatin AmericaLebanonLiberiaMalaysiaMexicoMicronesiaMiddle AfricaMoroccoNepalNetherlandsNicaraguaNigeriaNorthern AfricaNorthern EuropeOceaniaPakistanPeruPhilippinesPolandPortugalRomaniaRussiaSaudi ArabiaScotlandSierra LeoneSomaliaSouth AfricaSouth AmericaSouth Central AsiaSouth Eastern AsiaSouthern EuropeSpainSri LankaSudanSwedenSwitzerlandSyriaTaiwanThailandTrinidad and TobagoTurkeyUgandaUkraineUruguayVenezuelaVietnamWestern AfricaWestern AsiaWestern EuropeZaireZimbabwe
Income
Income (Families)
Income (Households)
Poverty
Poverty (Families)
Unemployment
Employment Occupations
Employment Industries
Employer Class
Commute Time
Commute Means
School Enrollment
Education by Degree Field
Occupancy
Finances
Physical Characteristics
Kansas City
Compare Zip Codes
Comparison Subject

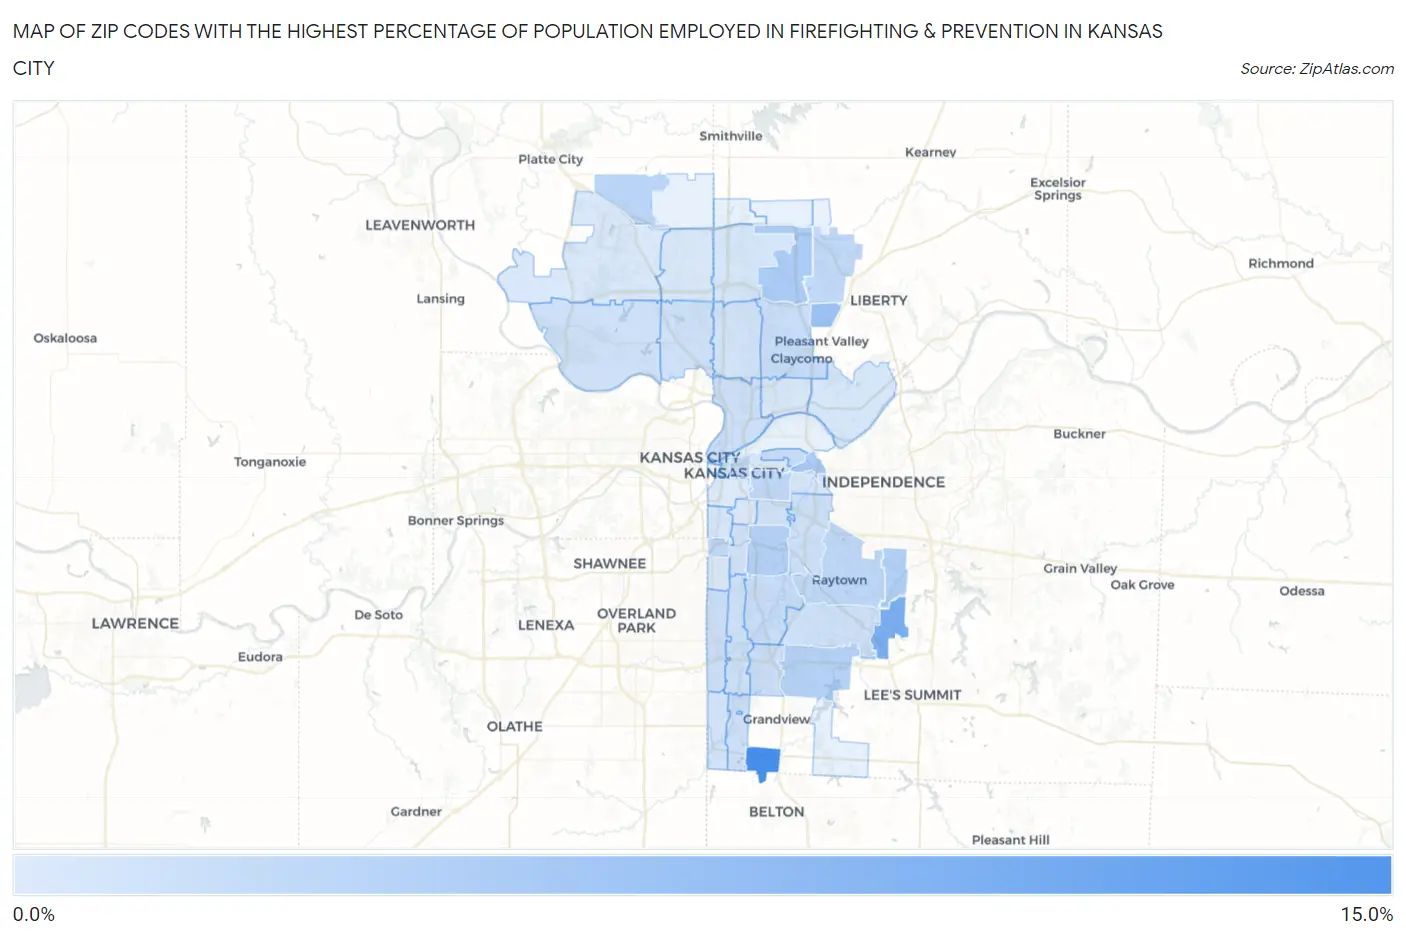
Map of Zip Codes with the Highest Percentage of Population Employed in Firefighting & Prevention in Kansas City

0.0%
15.0%
Zip Codes with the Highest Percentage of Population Employed in Firefighting & Prevention in Kansas City Map

Zip Codes with the Highest Percentage of Population Employed in Firefighting & Prevention in Kansas City, MO

Zip Code % Employed vs State vs National
1.6414710.6%0.95%(+9.64)#51.2%(+9.40)#275
2.641396.8%0.95%(+5.83)#101.2%(+5.60)#541
3.641584.5%0.95%(+3.56)#211.2%(+3.33)#1,096
4.641253.7%0.95%(+2.70)#311.2%(+2.46)#1,597
5.641563.5%0.95%(+2.51)#341.2%(+2.28)#1,752
6.641363.0%0.95%(+2.07)#481.2%(+1.83)#2,219
7.641342.8%0.95%(+1.89)#541.2%(+1.65)#2,486
8.641302.8%0.95%(+1.84)#571.2%(+1.61)#2,588
9.641632.6%0.95%(+1.67)#651.2%(+1.44)#2,851
10.641332.2%0.95%(+1.26)#811.2%(+1.03)#3,820
11.641572.1%0.95%(+1.16)#871.2%(+0.931)#4,111
12.641122.1%0.95%(+1.15)#891.2%(+0.921)#4,132
13.641272.1%0.95%(+1.12)#951.2%(+0.884)#4,249
14.641061.9%0.95%(+0.970)#1011.2%(+0.737)#4,820
15.641321.7%0.95%(+0.734)#1251.2%(+0.501)#5,913
16.641231.6%0.95%(+0.627)#1411.2%(+0.394)#6,492
17.641191.6%0.95%(+0.601)#1431.2%(+0.368)#6,632
18.641371.4%0.95%(+0.496)#1621.2%(+0.263)#7,321
19.641161.3%0.95%(+0.372)#1741.2%(+0.139)#8,155
20.641141.3%0.95%(+0.367)#1761.2%(+0.134)#8,203
21.641381.2%0.95%(+0.289)#1881.2%(+0.056)#8,804
22.641311.2%0.95%(+0.284)#1891.2%(+0.051)#8,841
23.641461.2%0.95%(+0.280)#1901.2%(+0.047)#8,872
24.641511.2%0.95%(+0.271)#1921.2%(+0.038)#8,952
25.641521.2%0.95%(+0.201)#2111.2%(-0.032)#9,579
26.641291.1%0.95%(+0.150)#2191.2%(-0.083)#10,080
27.641051.0%0.95%(+0.088)#2301.2%(-0.145)#10,674
28.641101.0%0.95%(+0.060)#2371.2%(-0.173)#10,946
29.641180.99%0.95%(+0.042)#2411.2%(-0.191)#11,145
30.641280.96%0.95%(+0.011)#2461.2%(-0.222)#11,484
31.641450.86%0.95%(-0.088)#2751.2%(-0.321)#12,532
32.641550.74%0.95%(-0.209)#3051.2%(-0.442)#13,839
33.641610.71%0.95%(-0.239)#3121.2%(-0.472)#14,171
34.641110.69%0.95%(-0.262)#3241.2%(-0.495)#14,441
35.641540.62%0.95%(-0.338)#3481.2%(-0.571)#15,253
36.641260.59%0.95%(-0.361)#3541.2%(-0.594)#15,507
37.641170.49%0.95%(-0.460)#3971.2%(-0.693)#16,624
38.641530.48%0.95%(-0.473)#4011.2%(-0.706)#16,777
39.641130.44%0.95%(-0.514)#4141.2%(-0.747)#17,220
40.641080.33%0.95%(-0.624)#4581.2%(-0.857)#18,474
41.641090.30%0.95%(-0.655)#4641.2%(-0.888)#18,786
42.641240.26%0.95%(-0.696)#4811.2%(-0.929)#19,176

Common Questions

What are the Top 10 Zip Codes with the Highest Percentage of Population Employed in Firefighting & Prevention in Kansas City, MO?
Top 10 Zip Codes with the Highest Percentage of Population Employed in Firefighting & Prevention in Kansas City, MO are:
#1
10.6%
#2
6.8%
#3
4.5%
#4
3.7%
#5
3.5%
#6
3.0%
#7
2.8%
#8
2.8%
#9
2.6%
#10
2.2%
What zip code has the Highest Percentage of Population Employed in Firefighting & Prevention in Kansas City, MO?
64147 has the Highest Percentage of Population Employed in Firefighting & Prevention in Kansas City, MO with 10.6%.
What is the Percentage of Population Employed in Firefighting & Prevention in Kansas City, MO?
Percentage of Population Employed in Firefighting & Prevention in Kansas City is 1.5%.
What is the Percentage of Population Employed in Firefighting & Prevention in Missouri?
Percentage of Population Employed in Firefighting & Prevention in Missouri is 0.95%.
What is the Percentage of Population Employed in Firefighting & Prevention in the United States?
Percentage of Population Employed in Firefighting & Prevention in the United States is 1.2%.