Zip Codes with the Highest Percentage of Households with Income Above $200,000 in Kansas City, MO
RELATED REPORTS & OPTIONS
Household Income | $200k+
Kansas City
Compare Zip Codes
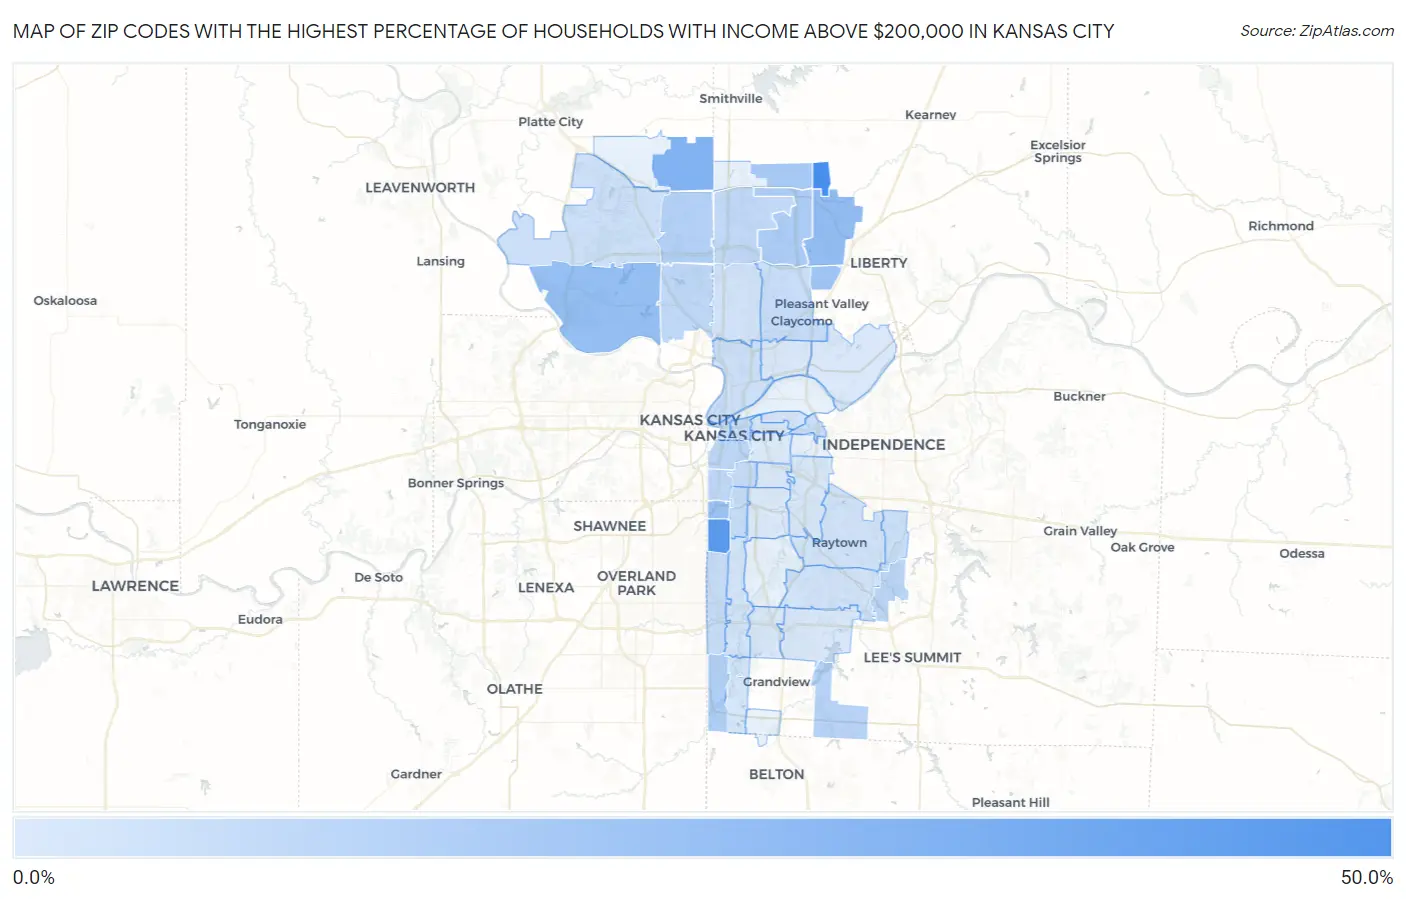
Map of Zip Codes with the Highest Percentage of Households with Income Above $200,000 in Kansas City
0.50%
48.5%
Zip Codes with the Highest Percentage of Households with Income Above $200,000 in Kansas City, MO
| Zip Code | Households with Income > $200k | vs State | vs National | |
| 1. | 64167 | 48.5% | 7.3%(+41.2)#4 | 11.4%(+37.1)#315 |
| 2. | 64113 | 41.0% | 7.3%(+33.7)#7 | 11.4%(+29.6)#601 |
| 3. | 64164 | 28.0% | 7.3%(+20.7)#19 | 11.4%(+16.6)#1,737 |
| 4. | 64157 | 22.0% | 7.3%(+14.7)#30 | 11.4%(+10.6)#2,778 |
| 5. | 64152 | 21.4% | 7.3%(+14.1)#33 | 11.4%(+10.00)#2,901 |
| 6. | 64112 | 19.2% | 7.3%(+11.9)#41 | 11.4%(+7.80)#3,517 |
| 7. | 64158 | 17.2% | 7.3%(+9.90)#49 | 11.4%(+5.80)#4,120 |
| 8. | 64166 | 15.4% | 7.3%(+8.10)#58 | 11.4%(+4.00)#4,831 |
| 9. | 64156 | 13.8% | 7.3%(+6.50)#68 | 11.4%(+2.40)#5,581 |
| 10. | 64145 | 12.4% | 7.3%(+5.10)#89 | 11.4%(+1.000)#6,428 |
| 11. | 64154 | 12.0% | 7.3%(+4.70)#93 | 11.4%(+0.600)#6,678 |
| 12. | 64149 | 10.4% | 7.3%(+3.10)#113 | 11.4%(-1.000)#7,930 |
| 13. | 64139 | 9.5% | 7.3%(+2.20)#132 | 11.4%(-1.90)#8,787 |
| 14. | 64108 | 9.3% | 7.3%(+2.00)#136 | 11.4%(-2.10)#8,951 |
| 15. | 64151 | 8.8% | 7.3%(+1.50)#146 | 11.4%(-2.60)#9,419 |
| 16. | 64111 | 8.7% | 7.3%(+1.40)#149 | 11.4%(-2.70)#9,542 |
| 17. | 64155 | 8.3% | 7.3%(+1.00)#157 | 11.4%(-3.10)#10,003 |
| 18. | 64109 | 7.0% | 7.3%(-0.300)#196 | 11.4%(-4.40)#11,792 |
| 19. | 64106 | 6.9% | 7.3%(-0.400)#201 | 11.4%(-4.50)#11,944 |
| 20. | 64110 | 6.7% | 7.3%(-0.600)#209 | 11.4%(-4.70)#12,242 |
| 21. | 64105 | 6.3% | 7.3%(-1.000)#227 | 11.4%(-5.10)#12,955 |
| 22. | 64114 | 6.1% | 7.3%(-1.20)#236 | 11.4%(-5.30)#13,269 |
| 23. | 64119 | 6.0% | 7.3%(-1.30)#243 | 11.4%(-5.40)#13,442 |
| 24. | 64125 | 6.0% | 7.3%(-1.30)#249 | 11.4%(-5.40)#13,543 |
| 25. | 64136 | 5.0% | 7.3%(-2.30)#309 | 11.4%(-6.40)#15,737 |
| 26. | 64116 | 4.6% | 7.3%(-2.70)#341 | 11.4%(-6.80)#16,550 |
| 27. | 64153 | 4.6% | 7.3%(-2.70)#343 | 11.4%(-6.80)#16,598 |
| 28. | 64118 | 3.8% | 7.3%(-3.50)#384 | 11.4%(-7.60)#18,584 |
| 29. | 64133 | 3.5% | 7.3%(-3.80)#415 | 11.4%(-7.90)#19,430 |
| 30. | 64138 | 3.5% | 7.3%(-3.80)#418 | 11.4%(-7.90)#19,453 |
| 31. | 64131 | 3.1% | 7.3%(-4.20)#456 | 11.4%(-8.30)#20,596 |
| 32. | 64123 | 2.6% | 7.3%(-4.70)#516 | 11.4%(-8.80)#22,067 |
| 33. | 64146 | 2.6% | 7.3%(-4.70)#524 | 11.4%(-8.80)#22,228 |
| 34. | 64134 | 1.8% | 7.3%(-5.50)#621 | 11.4%(-9.60)#24,306 |
| 35. | 64137 | 1.6% | 7.3%(-5.70)#650 | 11.4%(-9.80)#24,845 |
| 36. | 64129 | 1.6% | 7.3%(-5.70)#651 | 11.4%(-9.80)#24,850 |
| 37. | 64117 | 1.4% | 7.3%(-5.90)#673 | 11.4%(-10.00)#25,315 |
| 38. | 64161 | 1.4% | 7.3%(-5.90)#678 | 11.4%(-10.00)#25,499 |
| 39. | 64128 | 1.1% | 7.3%(-6.20)#702 | 11.4%(-10.3)#25,973 |
| 40. | 64124 | 1.0% | 7.3%(-6.30)#718 | 11.4%(-10.4)#26,197 |
| 41. | 64130 | 0.80% | 7.3%(-6.50)#740 | 11.4%(-10.6)#26,545 |
| 42. | 64127 | 0.50% | 7.3%(-6.80)#771 | 11.4%(-10.9)#27,086 |
1
Common Questions
What are the Top 10 Zip Codes with the Highest Percentage of Households with Income Above $200,000 in Kansas City, MO?
Top 10 Zip Codes with the Highest Percentage of Households with Income Above $200,000 in Kansas City, MO are:
What zip code has the Highest Percentage of Households with Income Above $200,000 in Kansas City, MO?
64167 has the Highest Percentage of Households with Income Above $200,000 in Kansas City, MO with 48.5%.
What is the Percentage of Households with Income Above $200,000 in Kansas City, MO?
Percentage of Households with Income Above $200,000 in Kansas City is 6.7%.
What is the Percentage of Households with Income Above $200,000 in Missouri?
Percentage of Households with Income Above $200,000 in Missouri is 7.3%.
What is the Percentage of Households with Income Above $200,000 in the United States?
Percentage of Households with Income Above $200,000 in the United States is 11.4%.